Embed Size (px)
Citation preview

Patterns of Attention: Traditional and New Media
By Bryan J. Dworak
A Thesis submitted to the faculty
of the University of North Carolina
in partial fulfillment of the
requirements of a degree with
Honors in Political Science.
2013
Approved by
_________________________________
Adviser
_________________________________
_________________________________
2
Table of Contents
Chapter 1: The Media in Flux
Chapter 2: The Media as a Changing Institution
Chapter 3: Data Collection and Processing Procedure
Chapter 4: Description of Datasets
Chapter 5: The Spread of Attention
Chapter 6: Changing Time, Changing Coverage
Chapter 7: A New Media or More of the Same?
References

3
Chapter 1: The Media in Flux
At the dawn of the Internet age, there was a great hope that the Internet would
provide a new cornucopia of information to the masses. It would be a perfect resource—
providing completely free and instant information to everyone. The traditional constraints
placed on journalists would be eliminated. There would be an unlimited and perfect
supply of information across a whole spectrum of topics. It would be a new,
democratizing force.
A decade and a half after the dawn of this age, there has certainly been progress.
There is a wealth of information available on the Internet spanning a wide array of topics.
To those that want to find information, something is almost certainly out there in
cyberspace to quench their thirst for knowledge. And, the Internet has been a great
political tool. Beginning in the spring of 2011, governments in several Arab states
including Egypt, Tunisia, and Libya were overthrown by protests that began on social
media. In some regards, Internet media, particularly social media like Facebook and
Twitter, has been used for revolutionary means.
In the past three presidential elections, the Internet has also played an
unprecedented role. Candidates have raised tens of millions of dollars on the Internet and
reached out to electoral bases they never would have imagined being able to reach in the
past. Candidate presence online is currently at an unprecedented level. These tendencies
show that the Internet does have a certain amount of democratizing capacity.
In this same vein, the media in general have often been held by political scientists
and scholars of public policy and journalism to be a sort of fourth branch of government.
In many ways, they do serve as another check and balance on governmental institutions,

4
provided they fulfill the watchdog responsibility that many citizens have assigned to
them. The media too has made their way online. But, the media are not the end all to be
all. Walter Lippmann (1922) wrote:
The press is no substitute for institutions. It is like the beam of a searchlight that
moves restlessly about, bringing one episode and then another out of darkness and
into vision. Men cannot do the work of the world by this light alone. They cannot
govern society by episodes, incidents, and eruptions. It is only when they work by
a steady light of their own, that the press, when it is turned upon them, reveals a
situation intelligible enough for a popular decision. (228)
When Lippmann wrote this in 1922, the press certainly filled this capacity. It highlighted
a few important issues that it deemed should be part of public opinion. Even today,
traditional news sources like newspapers and television news largely fulfill this role.
As this important institution, the media can help to define the national agenda.
The media shape the public agenda by providing information to citizens. Citizens use the
information provided by the media to gauge which issues are important at a given point
in time. Because of this connection between the media and public agendas, policymakers
look to the media to determine which issues their constituents will feel are important. In
this way, the media are not only a watchdog, but also an agenda-setter.
But, are the new media the same? Do they also only focus on a few important
issues day after day, serving much as a searchlight, only shifting its beam in response to
important events, crises, or situations? At the dawn of the Internet age, the hope was that
the Internet would be a panacea of information, representing the many issues that occupy
varying sized pieces of the national agenda. To extend Lippmann’s analogy, the Internet

5
media would be like the sun flooding the ocean with light. All of the issues in this ocean
of policy questions would be bathed in a warm light.
Similarly, the new media would not simply be a replication of the traditional
media online. They would be something more than the stories covered in The New York
Times. Newspapers were notorious for mimicking each other—the stories in one paper
would frequently be printed in other papers as well. The rise of institutions like the
Associated Press (AP) and the United Presswire (UPI) fueled these tendencies. If the new
media are to be judged as fulfilling their promise, they would still have these mimicked
stories, but they would also be filled with content, information, and ideas on topics not
found elsewhere, particularly in the traditional media.
There would be a cornucopia of information available online—people could
access information crucial to fulfilling their democratic responsibilities. This would be
true no matter what the information was or what topic an individual wanted to learn
about. It would be available in the endless ocean of information that the Internet was once
envisioned to provide. But it would not just mean that this information would be out
there, lost in cyberspace. Conversation about this wide variety of topics would be
sustained. With the low-costs of entry and lack of forces limiting coverage, there would
be sustained conversation about a variety of sources. In the traditional media, huge
swings in coverage are observed. For example, if there is a massive terrorist attack,
coverage goes from zero to a commanding proportion of the total coverage being
dominated by this single event. More often, certain stories surge onto the agenda for a
certain period of time and then fade away. This can be obviously seen with an event such
as the Olympics occurring every four years.

6
This is the utopian vision of the Internet as a perfect, original, and constant source
of information on the whole gamut of policy issues. But, the Internet we use each day
does not appear at first glance to completely reflect this vision laid out by many in the
mid to late 1990s. But to what extent this vision of the Internet as a new media force
capable of fulfilling what Lippmann believed the press truly needs to be is unknown. In
this thesis, I will examine both traditional and new media sources to attempt to answer
the question of to what extent the new media has realized this utopian vision for the
Internet, looking specifically at the diversity, volatility, and amount of friction in
coverage in the traditional and new media with a particular focus on American and
international newspapers and political blogs and Twitter.
To formally define these different types of media, I will rely on the definitions
provided by several scholarly publications that I used in formulating my own theory and
designing my study. Social media, or new media as I often refer to it, are “electronic
communication platforms that convey content generated and exchanged by users” (Auer
2011, 710). Twitter is a type of social media technology that allows for the rapid
transmission of 140 character fragments on a nearly endless range of topics. It is
frequently referred to as a form of microblogging (Hermida 2010, 297). Blogging is a
very broad term but refers to a new form of media without centralized organization and
written in a variety of styles on a variety of topics (Farrell and Drezner 2008, 16). Blogs
are generally written by one author and posts are displayed in reverse chronological
order. The traditional media, as I categorize it, refers to non-Internet forms of political
communication including newspapers, magazines, and television. New media, for my
purposes, are strictly online media including blogs and social media networks. These
7
assumptions carry forward into all discussions using these terms.
The media are typically considered an important part of the political world,
especially in the United States. Regardless of the comparison to a fourth branch of
government, the media have important effects in politics and can serve an agenda-setting
role (McCombs 2004). Frequently, the media agenda (that is, the set of issues being given
attention at a specific point of time by the media) mirrors the public agenda (the set of
issues deemed important by the public and which they believe should be acted upon by
the government). Boydstun (2013) writes, “Media attention matters, this much we know.
News coverage frequently shapes which issues people think about, how they think about
them, and often what actions government takes” (33).
McCarthy, Smith, and Zald (1996) make the subtle distinction between public and
media agendas clear. While there is a high degree of correlation between the two, the
most important issue in each is not always the same (295-296). They also define what
they refer to as the “media arena.” McCarthy et al. explain “The media arena is far more
centralized than the public arena, and access to it is more difficult for social movement
actors. Nevertheless, its gatekeepers – local and national reporters and editors – are
typically more accessible than the gatekeepers of the governmental or electoral agendas”
(296). They further explain that conquering the media arena is important in enacting
policy change.
Cook (1998) argues that the news media are an important political institution, but
puts them more on the level of parties or interest groups rather than one of the three
branches of government (110). On the other hand, Kingdon (2003) finds that, in reality,
the media have a fairly small effect on policymakers and that many of these individuals

8
actually express a disdain for the mass media in his study of national agenda-setting in
the United States. However, he recognizes several important roles for the media within
policy communities. Importantly, he says that insofar as the media affect public opinion
agendas, it is possible that they wield a larger agenda-setting influence than his research
directly suggests. In 57% of his interviews, public opinion was said to be an important
indicator in agenda-setting (65). In any case, the media are an important part of politics.
For that reason, this thesis and many other studies before it, are written about the media
from a political science perspective.
This is a relevant part of a blossoming research agenda. We are at a crossroads in
history. We stand somewhere in between the ideal Internet utopia once envisioned and a
complete (albeit hyperbolical) Internet dystopia—a replication of traditional journalism
and resources online, a reality that would be not so different than the traditional media.
This does not mean it is a bad place; it is just more similar to the media of the past. The
Internet presents a powerful resource for the creation and dissemination of information,
much of it by individuals who previously could not get their voices heard by the masses.
But, it is not perfect. Aspects of traditional journalism have made their way onto the
Internet in the form of online newspapers complete with the traditional gatekeepers and
not all information is free—much is shrouded behind pay walls and password protected
members only areas. I will pay particular attention to the way that it has changed and put
these changes in a greater context. It is important to be aware of these changing
characteristics and to ensure that research is up to date in light of the significant influence
that the media can exert on policymakers.
Matthew Hindman (2009) presents an analysis that seeks to reconcile the conflict

9
between this Internet utopia and dystopia. Although there were great hopes for the
Internet as a democratizing force in America politics, that reality has yet to come to
fruition. Instead, Hindman calls these sorts of conclusions premature. He sees the Internet
as a good force and while it has allowed more people to speak publicly, it has not been
much easier for the average person to be heard. He writes, “The Internet has served to
level some existing political inequalities, but it has also created new ones” (19). Others,
such as Coleman and Blumler (2009) and Margolis and Resnick (2000) reflect much
more optimistic initial views of the Internet’s potential. Many of these studies suggest
that the use of the Internet may lead to higher rates of political efficacy and greater civic
engagement, especially among certain groups, such as the young. Though my study does
not directly measure these variables, they too are reflective of some of the hopes for the
Internet and politics.
Based on this situation and the changes that have occurred, there are several
predictions that I make here, early in this thesis, of how coverage in the media might
manifest itself based on these competing realities between an Internet information utopia
and an Internet where we mostly see more of the same. Here, I will also provide some
general theoretical principles that might help to explain these possibilities. In the next
chapter, I will undertake a more thorough literature review to highlight some of the
studies that have been conducted that use similar methods to mine or analyze media
coverage in general.
If the Internet utopia were to be reality, there are several characteristics of the
media that I would expect to be true:

10
There is a greater diversity of attention in the new media than in the traditional
media.
Issues in the new media are represented in proportion to their actual importance to
a wide variety of users and news producers, and not filtered through the bias of
relatively few gatekeepers.
Attention shifts smoothly over time in proportion to shifts in the events of the
world in the new media rather than the highly volatile shifts observed in the
traditional media.
The new media are not governed by the status quo effect common to the
traditional media and attention is distributed independently.
The new media display less friction than the traditional media.
On the other hand, we are at a point where it can be said with fair certainty that
this information utopia is not reality. Those achievements have not been realized online.
However, that does not mean that the Internet media are completely the same as the
traditional media that they seek to supplant, or at the very least, complement. To best
understand that situation, it is useful to view it in contrast with what could be called a
complete Internet dystopia. Then, throughout this thesis, I will be able to discuss where in
between the media might fall. Some predictions that arise from this situation include:
There is a similar level of diversity of attention in the new media compared to the
traditional media.
Gatekeepers still play an important role in the new media as in the traditional
media.

11
Attention in the new media is similarly volatile to that in the traditional media. It
is still characterized by significant disruptions and swings in attention.
A similar number of conversations can be sustained in the new media compared
to the traditional media. The status quo effect is still observable.
The new media has a similar level of friction compared to the traditional media.
The effects of friction are observable.
In order to reconcile this situation—a media climate caught in between an idealized
vision for itself and an Internet dystopia that looks much like a replication of the
traditional media online—a strong theoretical base underlying these ideas is helpful. The
following paragraphs are a preliminary attempt to highlight some of the theory that
allowed me to hypothesize these statements in the way that I have. In the substantive
chapters in the remainder of this thesis, I will develop a more complete theoretical and
analytical explanation for my actual findings.
Over time, the public agenda as represented by media coverage has become more
diverse (McCombs and Zhu 1995). The new media could be the culmination of this
progression. Users tend to receive information from more media sources via Twitter for
example (An et al. 2011). If all of these sources pay attention to the same topics,
however, this may not be true. I expect that the greater representation of sources online
will manifest itself in the form of greater diversity of attention in the new media, even if
marginally. The idea of these competing worlds is to find out how much more, in order to
place the Internet as it exists on this continuum. McCombs (2004) argues that diversity in
the agenda “is significantly related to the number of newspaper, radio and television
voices in the community” (McCombs 2004, 51). With an even greater number of voices

12
present in the new media, I expect to observe an increased diversity in issues and
coverage. Inter-media agenda-setting effects may mitigate some of this diversity if it is
revealed the new media almost always copies the traditional media or vice versa.
Unique to the new media is the networked nature of blogs and Twitter. This
unique characteristic of the new media could account for a large increase in the diversity
of issues represented. Blogs, unlike the traditional media, frequently incorporate
hyperlinks to similar resources (although often from a different point of view) on other
blogs or in the old media (Farrell and Drezner 2008). Because of this linked nature, I
expect there to be a greater diversity in attention because of this plurality of sources.
Associated with this multitude of sources should be an increased diversity of stories as
different outlets strive to be original. This networked nature carries over to Twitter,
where users are able to engage in conversation with essentially anyone else on the
network, making the diversity of discussion on the network even broader (Lasora et al.
2012). This tendency, however, has never been demonstrated or confirmed by an actual
analysis of both blogs and Twitter.
Given the lower cost of publishing information in the new media, a greater
number of voices and sources present, and the lack of traditional limiting factors like
advertising needs or gatekeepers in the traditional media, I expect that in the Internet
utopia there is a greater diversity of attention to different topics in the new media than in
the traditional media. In discussing this phenomenon in the following chapters, I will
evaluate the diversity of the media agenda in both the traditional and new media. By
doing so, I will be able to assess whether the new media might actually be subject to
some of the same constraints as the traditional media despite the possible utopian vision.

13
As discussed, the new media, especially in the utopian vision, are not subject to as
many of the constraints that the traditional media are subject to. However, it is
unrealistic, but reflective of this vision, to predict that there could be a perfect
representation of all topics in the new media. On the other hand, I expect to observe that
unlike in the traditional media in which most literature suggests that most attention is
dedicated to relatively few topics, such as foreign policy, elections, or defense rather than
less popular topics like agriculture or homelessness, that the new media will distribute
attention more proportionately based on the actual importance (still through the frame of
the audience, or users in the case of new media) of the issues at hand. Overall, the new
media should be reflective of a reality that is not dominated by biased editors or
publishers driven by advertising budgets and corporate pressures.
In Chapter 5 when I discuss the way in which attention is distributed in these
media agendas, I will evaluate how similar or dissimilar the way in which attention is
distributed across different issues is. If the new media are actually more of a
reincarnation of the traditional media, then a significant amount of attention will again be
distributed to relatively few topics not based on importance, but rather based on other
factors I will further explore in my coming discussions.
In the traditional media, coverage over time is highly volatile and like with other
agendas is characterized by what Baumgartner and Jones ([1993] 2009) call punctuated
equilibrium. This is the idea that changes in agendas occur rapidly and dramatically in
response to events whether they are suddenly truly important or not.
In the new media, I expect these shifts to occur more gradually. Newspapers and
newscasts can generally only change once per day. That means that day-to-day, their

14
attention to certain issues might vary more than the new media. The Internet allows for
sustained conversation about small issues that would never make it into a newspaper or
onto a newscast even if they were important. Twitter lends itself particularly well to this
tendency. Users can instantly transmit information to other users as events unfold in front
of them (Hermida 2010). It is not like the front-page of The New York Times where there
is a quite finite amount of space. On the Internet, “space” is cheaper and thus
conversation can be more sustained and the shifts seen will appear less dramatic. If the
new media are more similar to the traditional media in this respect than the vision of the
Internet utopia would anticipate, then the shifts will be equally marked.
The status quo effect would dictate that the topics most likely to be covered in the
media tomorrow are those issues covered in the media today. Various studies have shown
this to be true in various traditional media outlets; however, in the Internet utopia, I
would envision that topics covered would be determined independently based on the
day’s events. Boydstun (2013) finds this to be particularly true in The New York Times,
where she observes a high friction environment. Again, I expect my findings to land
somewhere in the middle of this spectrum, between the utopian and dystopian views I
have laid out.
The idea of friction will be further explained in Chapter 6, but assuming the
traditional media exhibit high levels of friction, that is, it is hard for coverage to move
from one issue to another over time and when it does it is characterized by marked shifts
in attention, since attention changes more gradually in the new media, it would also have
less friction. In the perfect world, there would be no friction—any issue could receive a
lot of attention because there are no constraints such as space on a front page, time in a

15
newscast, or a publisher overly concerned with advertising revenues. This can be
measured in a variety of ways and I will test this prediction in Chapter 6. If the new
media have relatively lower friction that the traditional media, that means there is a
greater evolution towards the Internet utopia.
This rest of this thesis will take the following form. Next, in Chapter 2, I will
continue to provide a review of the current literature on media agenda-setting and how
coverage is determined in the traditional and new media. In Chapter 3, I will discuss how
I collected the data used for my analysis and operationalized it. In Chapter 4, I will
describe these datasets in general terms in order to provide important context to the
remaining chapters. Then, in Chapter 5, I will analyze and discuss the diversity of
coverage and attention in my data using the measure of entropy. In Chapter 6, I will
examine the volatility of coverage and determine which types of media exhibit the most
friction in coverage. Finally, in Chapter 7, I will bring all of these ideas together to
provide a cohesive assessment of to what extent the Internet has fulfilled the expectations
many placed upon it, evaluate the democratic potentials of the Internet media as it
currently stands, explain why all of this matters for current policymaking both in the
United States and around the globe, and provide suggestions for possible further research.

16
Chapter 2: The Media as a Changing Institution
The media have firmly planted themselves as an important institution in American
politics (and that of many other countries). Because of that, there have been many studies
not just on the impact of the media on politics, but which focus on the actual content in
the media like I am focusing on in this thesis. Given that this thesis primarily addresses
the spread of attention and the fluctuation of attention over time, this brief literature
review will discuss other studies and research projects that concerned themselves with the
content of different types of media. Political scientists began to pay considerable
attention to the media sometime in the mid-twentieth century as the mass media really
began to be consumed by the masses. Therefore, much of the literature focuses on the
traditional media, primarily newspapers and in more limited cases, television news.
However, in the last decade, there have been several, but not many exhaustive studies of
new media sources, particularly blogs, and their content and how those websites
influence politics.
Media Agenda-setting
Several important works on media agenda-setting have been written by Maxwell
McCombs. McCombs and Shaw (1972) conducted a seminal study on the influence of the
mass media on the national agenda by determining what issues the public (in this case
voters) sees as important. The researchers concluded that the media appear to have a
considerable influence on what the polity deems to be important. McCombs and Zhu
(1995) followed up on this initial research as the media climate expanded to include a
wider variety of sources. They examined the capacity, diversity, and volatility of the
agenda. McCombs and Zhu used public opinion polls and data similar to that in the first

17
study. The first finding is that there has been no monotonic increase in the issue-capacity
of the agenda, but that individual education does increase public issue-capacity. They
also observed an increased diversity in items on the agenda and lastly found that the
amount of time an issue spends on the national agenda has decreased over the years.
McCombs and Zhu’s focus on the capacity, diversity, and volatility of issues on the
public and media agenda parallel my research in many respects. Although the time and
arena of analysis is quite different given the new media climate, I will pay significant
attention to this study as an example of analysis as I move forward. Additionally,
McCombs’ career contributions of demonstrating the importance of media in politics
emphasize the importance of this type of research.
McCombs (2004) brings all of this research together in a book that discusses the
impact of mass media and public opinion on the national agenda. Like other authors, he
emphasizes the powerful media agenda-setting effects of The New York Times. In this
case, the media are able to exert significant mimicking effects thereby possibly
decreasing the overall spread of attention.
Like I am setting out to do, Strömbäck and Kiousis (2010) conduct a cross-media
analysis to determine which type of media has the most powerful agenda-setting effects,
and thus consequently which media agendas are most important in studying
policymaking. They focus on true issue salience rather than salience as determined by the
public unlike Kingdon (2003). They point out that institutions like The New York Times
are extremely important actors in agenda-setting. However, their study is unable to
confirm that one type of media is more important than all others in affecting change on
agendas. However, Strömbäck and Kiousis write, “The results show that the media are

18
influential in affecting perceived issue salience—that is, the extent to which people think
that the issue they find is the most important will affect their voting in the election”
(287). Thus, my study of media agendas reaching a wide array of people has significant
relevance even in the larger policymaking picture. More specifically, Strömbäck and
Kiousis show that multiple types of media are able to influence politics, transcending
much of the traditional literature focused solely on outlets such as newspapers.
Baumgartner and Jones ([1993] 2009) provide another, more recent look at
agenda-setting and present their theory of punctuated equilibrium. They study the overall
attention to various issues in both the media and within policy circles. Their theory of
punctuated equilibrium rests on the premise that there are short bursts of media and
policy activity surrounding events. The authors observed that the media’s shifting
attention is a major source of instability in American politics and public policy. They
attribute some of this to the fact that media outlets are a business and must make money.
They further state that neither the media, individuals, nor the political system ever focus
long on unique dimensions of the same issue. They also observed strong swings in
attitude towards issues—going from positive to negative coverage or from little coverage
to very intense coverage. Baumgartner and Jones write, “attention may rise and fall even
without important changes in how the issue is framed. In any case, attention often is
sporadic, not sustained” (125). Rather than specifying a correlation between policy and
media coverage, Baumgartner and Jones view this relationship as a two-way street, with
positive and negative reinforcement loops where the media are affected by the
government and vice versa where the government is affected by the media. These are
trends observed in multiple agendas, including congressional and media agendas. The

19
two authors clearly demonstrate that many agendas are highly volatile. While they have
shown that an agenda like the Times’ is volatile, this thesis will expand on that analysis
and seek to identify whether similar trends are observed in other media such as blogs.
In another book, Jones and Baumgartner (2005) discuss the way attention is
distributed in policy systems. Again, they argue that attention changes over time and that
the government and other actors prioritize problems in predictable ways. However, this
work makes clear that not all issues can receive the same amount of attention so that
actors are forced to respond to certain cues in prioritizing problems. I use some of their
methods of analysis in my study, especially in studying how attention changes over time
in Chapter 6. While the previously discussed book by Baumgartner and Jones ([1993]
2009) provides a greater theoretical base on which my discussion is pinned, Jones and
Baumgartner (2005) offer an analytical model that is similar in many ways to parts of my
own. They find that agendas, including the media’s, are typically very “sticky” and have
high levels of friction. Typically, these agendas are dominated by a status quo effect that
on a very basic level says, “if it’s on the front page today, it’s likely to be on the front
page tomorrow too.” Again, I will expand this analysis to new types of media agendas.
Many of the studies of media agenda-setting have been limited to one form of
media—either newspapers, television news, etc. Golan (2006) performs a study across
two different media—newspapers and television news to study what he calls inter-media
agenda setting. Golan performed a content analysis of one year’s worth of New York
Times front pages and the evening news casts of ABC, CBS, and NBC. Golan was
interested in the effect of the Times’ coverage of international news on the decisions of
the television news gatekeepers. He concluded that the Times’ international coverage did

20
affect the coverage of the networks’ broadcasts that evening. Golan’s study is an
important example of the type of cross-media study I plan to conduct. It also suggests that
a uniform level of diversity of attention across different types of media is possible.
Several papers have been written by participants of the Policy Agendas Project,
originally created by Frank Baumgartner and Bryan Jones, the authors of the previously
mentioned books, that have specific relevance to the analysis I will undertake in the
coming chapters. Aside from their findings and theoretical contributions, these papers
served as important inspirations for the analysis undertaken in this thesis. Boydstun,
Hardy, and Walgrave (N.d.) conceptualized the idea of media storms in an analysis of
The New York Times and Belgian newspaper De Standaard. Media storms are essentially
bursts in coverage that occur in the media in response to significant events and then fade
away slowly. These storms are also generally considered to surround issues important to
the public. However, they find that media storms do not follow the same tendencies as
apply to other media coverage despite being significant parts of media coverage. The
authors argue that the implications of their study “could also be instrumental in bringing
about these well-known surges in political and public attention, since media attention
both represents but also drives how people, both citizens and political elites, process
information. Thus, media storm dynamics may make us help to think about media effects
in a non-linear, conditional fashion” (N.p.). The three authors took an in-depth look at
two specific media agendas. However, the emergence of this idea of media storms might
explain lower diversity of attention given intense focus around one topic and why a
media outlet might appear to stick to covering one issue for some time.
Boydstun, Moody, and Thomas (2010) write what in many ways could be seen as

21
a precursor to this thesis—what they claim to be “the first empirical comparison of
newspaper, television, and internet news sources simultaneously” (6). My analysis
expands on this in a more comprehensive and standardized manner across all involved
media types. I chose points of my analysis from this article specifically around the ideas
of attention diversity and change over time. One of the authors’ central predictions is that
“although internet news and blogs still operate strongly under the goal of capturing
viewership, we expect these sources to focus less than these other sources on topics ‘that
sell’ like crime” (12). In the end, Boydstun, Moody, and Thomas find that although many
scholars have argued that there is a single media agenda, in today’s world, we actually
have several different media agendas at a time (24). I expect the same to be true in my
analysis. They further promote the idea that these media agendas do often mimic each
other, another characteristic I would expect to observe in my datasets.
Their colleagues and collaborators, Lovett and Baumgartner (2012) draw on
similar questions to find when there actually is a single media agenda using a factor
analysis based on keyword searches of many traditional media sources—both newspapers
and television. This paper also served as a critical inspiration to my own as my methods
evolved over the course of this project. They find that in some cases there is a single
media agenda across multiple media types at specific points in time for certain topics,
while in others there is not. Thus, there can be a single media agenda, but there is not
always and it depends on a variety of factors.
Since my analysis will also touch on international (traditional) media sources,
examining articles dealing with foreign media outlets is also relevant and important.
Baumgartner and Chaqués (2012) conducted a study of the front-page stories for

22
approximately ten years of two Spanish national newspapers of different partisan
leanings. They found that the media in Spain is highly partisan with each paper
mentioning certain political parties more and in different lights. However, their most
important finding for my own discussion is that characteristically, the two papers were
highly similar in terms of diversity and friction of their agendas. I also use the datasets
created and used by Baumgartner and Chaqués in my own analysis.
The final Policy Agendas paper’s contributions I wish to discuss compare the
stories on the front-page of The New York Times and those in the full paper (or, on the
inside pages). Wolfe, Boydstun, and Baumgartner (2009) did this analysis in the run-up
to Boydstun’s book length project that I will discuss next. They find full paper coverage
to be more diverse and to exhibit less friction than front-page coverage. They write,
“Full-paper agendas are able to capture high, medium and low salience issues and can
follow policies from their subsystems to their breakout on the macropolitical arena” (20).
As I will conduct data analysis on both the front-page and full-paper (index) datasets, I
will further discuss their comparisons in later chapters when relevant. Wolfe, Boydstun,
and Baumgartner used highly similar methods of analysis in their study of the diversity of
the two agendas as I will use in Chapter 5. They found that the overall newspaper was
slightly, but not markedly, more diverse than just the front-page.
Boydstun (2013) also has a forthcoming book that takes an in-depth look at the
Times dataset that I will use in my own analysis. That dataset forms the basis of the new
book. In this work, Boydstun analyzes the Times’ front page stories for both the spread of
attention and the change over time. She also conducts a simulation to measure the
explosiveness of the media agenda represented by the Times. She observes that the front

23
page of The New York Times has a highly finite amount of space and it is difficult to get
new issues onto the front page. She also finds that there is a high level of friction or
stickiness in the stories on the front of the paper. Relatively few topics are commonly
represented on the front page according to her analysis. Boydstun writes, “Today’s U.S.
media marketplace is highly concentrated (i.e., a few conglomerates own most of the
news outlets) and highly competitive—and becoming more so over time” (62). It is an
economically dominated sphere about producing the news that sells. This explanation is
indicative of the low diversity, high friction environment Boydstun observed in the Times
using the same methods I will use.
My own discussion in this thesis will be based on Boydstun’s analysis and I will
mention her findings numerous times. Her methodology forms the basis of the methods I
will use not only to analyze her data, but also the new media datasets. She also develops a
model for predicting the news coverage, which is mostly based on prior attention or what
is referred to as the status quo effect. My research will confirm and then expand the scope
of Boydstun’s findings. Depending on my results, Boydstun’s explanations for why space
is so difficult to come by on the front page of the Times might help to explain how
attention is distributed in other types of media.
Theories of Media Decision-making
Shoemaker and Vos (2009) present a study on gatekeeping, a specific theory of
the way that stories make it into the mass media. The theory of gatekeeping is especially
interesting when applied to many new media sources. Many studies and articles utilize
gatekeeping theory to analyze particular journalistic actions and decisions. The central
idea of gatekeeping is that there are various levels that a story must pass through in order

24
to make it into a newspaper or onto the news. Shoemaker and Vos readily admit that the
Internet has changed gatekeeping and that audience members have for the first time been
turned into gatekeepers. Previously, various writers, reporters, editors, and publishers
were the principal actors in the gatekeeping process and were governed by a variety of
institutional and personal factors. They decided which issues were important and what
should make it into the news, or through the lens of other authors, what makes it onto the
media agenda.
At the individual level, Shoemaker and Vos (2009) conclude there are few rules
for gatekeeping. At the end of their study, based largely on time series analyses,
Shoemaker and Vos discuss gatekeeping in the 21st century. The constantly changing
nature of the media has reshaped things. They write, “Not only is CNN present around
the globe, but so are other news organizations. Thus, organizational routines from one
social system are being exported to other social systems where different political,
economic, and extra-media influences operate” (133). Globalization has changed the way
the media make decisions as well. For the purposes of this thesis, Shoemaker and Vos
leave open some interesting questions about the new role of gatekeeping as traditional
constraints and processes are challenged. Their commentary offers a theoretical
explanation for certain tendencies I observe in my own analysis.
Though the theory of gatekeeping summarized by Shoemaker and Vos is truly
central to studies of media decision-making, other authors use a similar framework to
analyze the way what constitutes news is determined. Berkowitz (1990) looks at the
constraints of gates in decision-making in local television news. Similar to the analysis I
will conduct, Berkowitz based his study on topic categories of coverage. The most

25
important finding of this article is that gatekeeping is an incredibly complex process
despite the systematic way in which it is often broken down. Berkowitz found that
television used gates differently than newspapers or wire services might and that these
decisions were often made in groups rather than one individual controlling the decision-
making process (64). Given the finding that television and newspapers make decisions
differently from one another, it might be reasonably expected the bloggers or journalists
on Twitter would also make gatekeeping decisions differently than might be made in the
confines of a print newspaper. Thus, their coverage could also be expected to differ.
Herbert Gans ([1979] 2004) conducted an important study originally in the early
1970s of several traditional media outlets including TV news outlets and magazines. He
offers an assessment of how the media decides what makes the news. The book examines
the actors, values, and constraints placed on actors in the media. In many ways, it is a
precursor to later theories of gatekeeping rooted in studies of the media from the 1960s-
1970s. Gans points out many constraints placed on actors including corporate pressures
and advertising. He emphasizes the power given to editors and publishers of different
media outlets. The way in which he saw stories make the news was almost economic in
nature, focusing on what news sells since there were always more stories that could be
published than there is room to publish. He also found that there was significant division
of labor in media outlets and that the news media almost operated like an assembly line
made up of reporters, editors, and producers.
Gans ([1979] 2004) does find that some factors are more important than others in
determining what makes it into the news publication or show that the audience reads or
sees. He writes, “Some considerations turn out, in the end, to be subsidiary. For example,

26
organizational considerations are generally adaptions to the imperatives of story selection
and production…The journalists’ enduring values are also subsidiary” (281). At the end
of his book, Gans shares a vision for a more utopian media nearly reflective of the
Internet utopia that I have previously laid out. Gans predicts that “To be more utopian:
commercial considerations might disappear entirely if journalists owned their own news
organizations and ran them communally or with some form of worker control” (287).
This sounds quite a bit like the blogs and Twitter that make up the new media today and
are covered in my analysis.
Two previously mentioned works also provide substantial theoretical suggestions
on how the media, when seen as a policy actor, might make decisions in what to include
in their tight agendas. Baumgartner and Jones ([1993] 2009) and Jones and Baumgartner
(2005) both address the ways in which actors prioritize issues in policy systems. In both
works, the authors argue that policy systems respond in highly volatile manners in
response to real world events. Extrapolating this theory to the media, it is easy to say that
the media respond to real world events and other policy cues in distributing their attention
to different policy topics, and in deciding when to shift attention (especially in the case of
large, rapid shifts) from one topic to another.
Shoemaker and Vos (2009) make clear that there are certain economic factors that
go into the gatekeeping decisions made by media personnel. Hamilton (2004) takes this
analysis further and frames the news as an economic good. Fundamentally, the news can
be understood as a good as can the journalists producing the news. He argues that in the
Internet media, the economic understanding of the news is changing (190). Journalists,
particularly those in television news, are often viewed as economic goods. Thus, with the

27
changing dynamics in the modern media, these goods can easily be gotten rid of—that is,
they can be fired. This helps to explain what many call a decline in journalism as
newsrooms shed hundreds of jobs. This has been a problem that has not only plagued
small local newspapers and TV stations, but also major national newspapers such as The
New York Times and The Boston Globe. This trend is intrinsic in the current media
transition.
These studies on media decision-making processes are highly relevant to my own
research. The way that these decisions are made is crucial to fully understanding how
attention is distributed and changes over time. Without that understanding, it appears that
this attention is completely random. Since we know that the traditional media are strictly
governed by multiple levels of gatekeepers, we can use that fact to assess how the new
media, which is governed by fewer gatekeepers and pressures, might differ from the
traditional media. The previous studies all had to examine content in order to understand
the dynamics behind the decisions being made in the media. Based on my findings about
differences in coverage between the traditional and new media, I should be able to
discuss, as I predicted in Chapter 1, whether there are less gatekeepers in play in the new
media than the traditional media.
Studies of the New Media
The new media often appear to be a replication of ideas and stories found in other
sources. This is not so different than newspapers mimicking one another. There is a trend
of “cannibalization” of stories that has increased with many stories simply being slightly
different versions of stories written by other journalists. This is particularly true on blogs
(Phillips 2010, 96-97). Additionally, political bloggers rarely do original reporting, thus,

28
they are highly reliant on the traditional media to form the backbone of their posts
(Wallsten 2007a, 568). Therefore, these studies suggest that the new media agenda
represented by blogs might not live up to its potential as a diverse source. Bloggers may,
however, transform the meaning or tone or put a particular spin on an issue. That does not
diminish the echo-chamber effect though—they are still creating content based on cues
from the traditional media.
Other authors such as Meraz (2011) and Woodly (2008) argue that blogs actually
exert an influence over the traditional media. In that case, the new media are the leaders
and I would expect to observe less mimicking in the new media than the traditional
media. Where inter-media agenda-setting characteristics fall on that continuum between
the Internet utopia and dystopia remains to be pinpointed. I personally think it will be
closer to the Internet dystopia with a large amount of mimicking still present and thus a
similar level of diversity.
Other studies have also found a similar effect to what was observed in the
traditional media as early as the mid-twentieth century. Boczkowski (2009) observed a
large amount of imitation in the new media at large. He argues that technology has
facilitated this process to a large degree. News organizations appear to be less
autonomous than in the past. The author of this article writes, “The expansion of mimicry
was evident throughout the research. Whether a piece of information coming up on the
wires, seen on a television program, heard on the radio, or looked at on the Web was
selected for inclusion in a news story depended in part on whether other media also had
it” (Boczkowski 2009, 49). Thus, this continued evidence of mimicking in the new media
is suggestive that the traditional and new media might be more similar after all, especially
29
when it is merely concerned with inclusion of certain subjects or facts. This study again
suggests that diversity of attention might not be as high as expected. Though these studies
differ in their qualitative approach from my own, they are extremely relevant examples of
studies of the content present in the new media.
Klotz (2004) writes about how the Internet is altering journalism and takes a
relatively positive, but clearly cautious attitude towards these effects. In a way, Klotz
offers a counterfactual to the previous authors who take a more negative approach to a
highly partisan sphere or, in the other case, suggest that the new media might not be all
they are cracked up to be. Principally, he suggests that though the Internet will not
radically change the amount people care about some topics, it will provide a wide array
of opinions and niche topics that some people might be more interested in. Information
might be information. People will get the information they ultimately need to make their
decisions—at least that is the hope. Klotz takes an increased diversity of attention for
granted—something I will measure empirically—and spins it as a positive for democracy.
Many other works have studied blogs in specific. Pole (2010) writes, “Political
communication in the blogosphere is unlimited in scope and magnitude” (5). Based on
that, a greater diversity of information or a plurality of information is to be expected in
the blogosphere. Pole contends that information transmission has been fundamentally
altered and that the importance of traditional media institutions has been somewhat
diminished (5). Blogs also offer the potential to shape political discourse (129) and have
opened new avenues for participation (127). Pole makes the note that bloggers do not
normally have to answer to anyone in the way that most journalists do and that entry-
costs into blogging are extremely low (128). In concluding, Pole offers a very optimistic
30
and promising look at what the blogosphere can hold for American politics.
While many studies of blogs have used hyperlink analysis to gauge the
connections between both blogs and the traditional media, Meraz (2011) undertakes a
time series analysis using ordinary least squares regression and Granger causality to
analyze the inter-media effects of political blogs on both the traditional media and the
traditional media’s online blogs. The author concludes that her analysis has confirmed the
findings of hyperlink studies and finds that political blogs have been able to set the
traditional media’s online agenda. Further, blogs have begun to more closely resemble
traditional media sources. The Huffington Post is an example of this tendency.
Additionally, strongly leaning political blogs have also begun to exert moderate influence
over the traditional media, especially on specific issue agendas.
Wallsten (2007a) presents the theory that bloggers have been able to exert
considerable media agenda-setting powers. He finds that there is a bidirectional
relationship between the mainstream media-agenda and the blog-agenda and that both
forms of media feed on one another. Wallsten selected prominent political blogs in the
United States and analyzed their content to attempt to determine the relationship between
the traditional media and political blogs. He concedes that political bloggers still rely on
the traditional media for their content, but their interpretation and portrayal of such
content can have significant agenda-setting effects.
In another article, Wallsten (2007b) studies the way in which bloggers use their
political blogs. He measures blog use by coding 5,000 blog posts based on the intention
of the post (25). He found that A-list and other bloggers use their blogs in similar ways
(30). Wallsten concludes that “political blogs are complex forms of political participation

31
that contain a mix of opinion statements, mobilization attempts, requests for audience
feedback, and links to information produced by others” (33). In contrast with the
traditional media then, blogs are not just sources of political information, but are more
interactive political tools. This might be measured as a greater level of diversity of
attention. Other authors I have discussed, like Baumgartner and Jones ([1993] 2009)
show that the media respond to events. Wallsten also explains, “although political
bloggers use their blogs primarily as soapboxes, blog use changed significantly in
response to key political events” (33). Thus, coverage in blogs might change in ways
similar to the traditional media although they are clearly a new force in politics—one that
seems to have significant democratic potential given the interactive possibilities. In both
of these articles, Wallsten’s arguments point towards a volatile blog agenda. This thesis
will find whether that democratizing potential translates into any measurable change in
coverage that might have been envisioned.
It is also no surprise that information and trends can be highly viral on the
Internet. Nahon et al. (2011) studied viral information in political blogs during the 2008
presidential campaign. They demonstrate that the linked nature between blogs allows for
the spreading of viral information. Although the authors caution against using just elite
blogs as representatives of the entire blogosphere when studying it, they explain that elite
bloggers are generally the ones responsible for the creation of information and the initial
spread of it. Therefore, their discussion undermines this caution to an extent. They also
find that the information lifecycle in the blogosphere is highly volatile and short. Viral
information feeds into this tendency. This study of how coverage changes over time in
the blogosphere might be reflective of a media world with a new type of friction present

32
that allows viral trends to quickly take hold but also quickly fade away.
Although research has certainly been conducted on the political ramifications of
communication via Twitter, the majority of the research done on the new media has been
concerned with blogs like the literature I just finished describing. I was not able to locate
any studies that focus specifically on the content of Twitter as it relates to political
communication. However, other studies of Twitter were helpful in guiding my methods
as will become evident in upcoming chapters. All of the previously discussed literature
relates specifically to a content-based analysis of media agendas and how that relates to
politics. This thesis in many ways will be unifying. It will bring together studies of the
traditional media and multiple new media forms in order to offer a cohesive assessment
of the possible political impacts of the new media in contrast with the traditional media.
To accomplish this task, it employs a highly standardized analytical process across all
types of media.

33
Chapter 3: Data Collection and Processing Procedure
The analysis in this thesis relies on a large amount of data on both the traditional
and new media from both the United States and elsewhere. I collected some of the data
myself and other data was collected by other researchers or research teams and provided
to me. In this chapter, I will describe how all data used were obtained, either through
others, or, in the case of the new media dataset, how I collected and managed this data. In
Chapter 4, I will provide a description of the data in these datasets. Here, I am just
concerned with my data collection methods.
Professor Amber Boydstun, the project director, of the University of California-
Davis provided me The New York Times front-page dataset. That dataset is used in her
forthcoming book Politics, the Media, and Agenda-Setting (2013). It was coded using an
adapted version of the Policy Agendas codebook originally developed by Baumgartner
and Jones.1 The full codebook and coding instructions are available upon request from
Boydstun or the author. I also use and refer to the Policy Agendas Project New York
Times Index2 also originally created by Baumgartner and Jones.
For all international data on traditional media sources, I obtained the data directly
from the authors or lead researchers on the project. See individual country codebooks for
more information on the methods of data collection for each dataset.3 All were coded
according to that country’s agendas codebook, modeled after the US Policy Agendas
1 http://www.policyagendas.org/page/topic-codebook
2 This data were originally collected by Frank R. Baumgartner and Bryan D. Jones, with
the support of National Science Foundation grant numbers SBR 9320922 and 0111611,
and were distributed through the Department of Government at the University of Texas at
Austin. Neither NSF nor the original collectors of the data bear any responsibility for the
analysis reported here. 3 See www.comparativeagendas.info for links to individual country project sites for
researcher contact information and for individual country codebooks.

34
Codebook. These codebooks and data are also available upon request from the researcher
or myself.
I collected and coded all of the data comprising the new media dataset during the
period beginning in May 2012 and ending in August 2012. To select the blogs to be part
of my sample, I used a hybrid approach to randomly sample thirty blogs to be part of the
set. The approach was loosely modeled on Wallsten’s (2007a), particularly the idea of
randomly sampling a manageable number of blogs from a larger list of influential blogs.
The list I sampled from included the Top 100 US Political blogs (based on data current
May 10-13, 2012) from Technorati4, a blog aggregator and search engine that ranks and
indexes blogs on different topics, the top 50 Political Blogs according to the Blog
Authority Index5, also known as the BAI (Karpf 2012a). This data was also current as of
May 2012. Several blogs not found on either list but present on a running list kept by
Professor Justin Gross of the University of North Carolina at Chapel Hill were also
included. After combining these lists and eliminating duplicates, I had a list of 180
influential political blogs. In Stata, I took a random sample without replacement to yield a
list of thirty blogs that would comprise the blog dataset. 6
To see the full list of blogs used
in the sampling procedure, see Appendix 3.1. Although I pulled lists of influential blogs
4 www.technorati.com
5 http://www.blogosphereauthorityindex.com/
6 In one case, technical difficulties immediately prohibited the use of the blog The
Inquisitr as part of my dataset. That blog was removed from the dataset. With the
remaining 152 blogs not selected in the original sample, I randomly sampled without
replacement for one additional blog. As a result, the Daily Kos was added to the dataset.
During data collection, another blog, The Political and Financial Markets Commentator,
was eliminated from analysis due to technical difficulties. It was not replaced by another
blog because data collection had been ongoing for over a month and replacing it would
not have been feasible because its replacement would not have been adequately
represented in the full blog dataset.

35
from various sources, it is important to note that “All A-list blogs are not created equal”
(Karpf 2008, 41). My random sampling technique should help to compensate for these
possible differences.
With this list of blogs, I used the program Outwit Hub Pro7, a web scraping
software, to collect data from the blogs on a daily basis .8 I configured HTML scrapers to
select as many possible pieces of data as possible including, date of post, time of post,
post title, author, and post text or abstract. Not all data was available for all blogs. At a
minimum, date of post, post title, and post text or abstract was scraped for each blog. This
data was outputted to separate comma separated values (.csv) files for each blog, each
day. The goal of these scrapes was to represent a typical “front page” of a blog, akin to
that of a newspaper for the best possible comparison of traditional media data relying on
front-page coverage in newspapers. The way I configured my Outwit Hub scrapers called
for only scraping the first page of the blog as if a user went to that blog’s homepage since
it would represent the most they could see in a single visit. To make the data manageable,
I set a maximum of fifteen posts to be scraped each day. In some cases, a blog may have
only been displaying the six or ten most recent posts. In the case where there were fewer
than fifteen posts on the homepage, all posts were scraped. According to Karpf (2012b),
the front page of a blog can be “the most-trafficked real estate in the political
blogosphere” (64). This reinforces my decision to focus on the front page of blogs
especially when considering them as mass media.
7 http://www.outwit.com/
8 Some days were missed for various reasons, principally because I did not have
computer access or could not have my computer turned on and/or connected to the
Internet during the daily scheduled scrape.

36
This data was put into uniform format in Microsoft Excel and coded using the
Policy Agendas coding scheme as adapted by Boydstun (2013) for her study of the
Times’ front-page coverage. For the purposes of this study, I only used the two-digit
coding scheme, not the more detailed four or six digit codes possible using Boydstun’s
codebook. The two-digit scheme was used when analyzing all datasets even if a more
specific code had been assigned and was available. The full twenty-seven code scheme
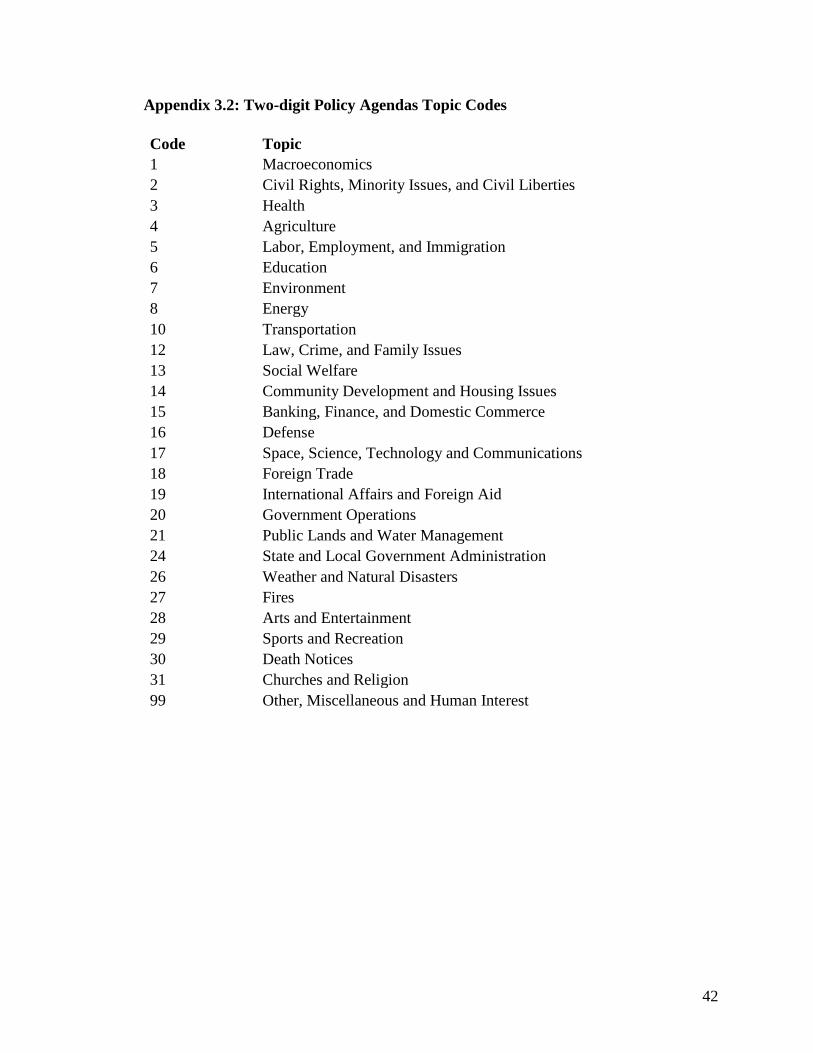
was used which includes non-policy topics such as sports and arts and entertainment. See
Appendix 3.2 for a full list of these two-digit topic codes.
For the data on Twitter, I similarly started with a larger list of influential Twitter
accounts. I relied on Daniel Romero et al.’s (2011) list of influential news Twitter
accounts. Romero et al. use a complex algorithm to calculate and rank influential users on
Twitter. Their methodology goes beyond followers and number of Tweets and utilizes
further data such as retweets and passivity on the network. It seeks to truly capture the
amount of forward influence an individual user has. I started with a list of one hundred
influential news Twitter accounts. Romero et al. justify their approach, writing, “for
information to propagate in a network, individuals need to forward it to the other
members, thus having to actively engage rather than passively read it and rarely act on it”
(15-16). Given my view of Twitter as a mass medium, this goal closely parallels my
agenda. According to Twitter (2011), 40% of users rarely post from their accounts, and
rather lurk on the network, not interacting with other users. This fact makes Romero et
al.’s approach even more appropriate. To see the full list of Twitter accounts, see
Appendix 3.3. As with the blogs, in Stata, I sampled without replacement for a set of
thirty influential news Twitter accounts.
37
With this list of thirty accounts, I wrote a script in twitteR, an R package, which
was designed to scrape the twenty most-recent Tweets from each account. Again, this
decision was made in order to best emulate what a Twitter user’s “front page” would look
like. If another user was to visit the timeline of any of these users’ accounts, they could
readily see the twenty most recently posted Tweets. I also chose a number larger than the
daily maximum on blogs due to the comparative ease of posting a Tweet over a blog post.
The script exported to a .csv file the content of each Tweet, the date and time of post, and
account from which it was sent.
The same formatting and coding technique was applied as in the case of blog
posts. All data was again coded using the Policy Agendas two-digit coding scheme.
Once all data was coded, Excel spreadsheets were converted to Stata dataset
format using StatTransfer. In Stata, I appended all daily, coded datasets into one large
dataset for each blog that spans the entirety of “front-page” coverage of that blog or
Twitter account during the collection period. Data analysis was conducted on those
source-specific datasets. Further, I appended all of the blog datasets to one another and all
of the Twitter datasets to one another to form a dataset representative of the blogosphere
and Twitter network, or Twitterverse, respectively. Further analysis was performed on
those combined datasets to capture the networked nature of the blogosphere and
Twitterverse.
One important decision made that applies to both blog and Twitter posts should
be mentioned here. In the event that a blog or Twitter user posts relatively infrequently,
and posts show up in scrapes over consecutive days, that data was not eliminated from
the dataset. In that case, a post may be present two, three, four, and so on times in the

38
dataset. This decision was based on the idea that if a user were to visit that blog or
Twitter timeline day after day, they would continually be exposed to that information.
Attention and space is continually granted to that issue or topic until it is displaced by
newer content. In a way, this is like an enhanced status quo effect. That is an important
characteristic of my dataset to note.

39
Appendix 3.1: Full List of Influential Political Blogs
Ace Of Spades HQ
Althouse
AMERICAblog Gay
AMERICAblog News
American Power
American Spectator
American Thinker
Andrew Sullivan
Ann Althouse
Atlas Shrugs
Atrios
Balkinization
Balloon Juice
Ballot Access News
Betsy's Page
Big Government
Bleeding Heart Libertarians
BLT Blog of Legal Times
Bookworm Room
Business Insider
BuzzFead
Campaign for America's Future
Cato @ Liberty
Challah Hu Akbar
CiF Watch
CNA Daily News
CNA Daily News-US
CNN Political Ticker
ConservativeHome's Platform
County Fair
Creeping Sharia
Crooked Timber
Crooks and Liars
Daily Kos
Daily Pundit
Danger Room
Daniel Drezner
Dean Esmay
Democratic Underground
Doug Ross @ Journal
Doug Wead The Blog
DownWithTyrrany!
EconLog
Economist's View
Elder of Ziyon
Empire Burlesque
Eschaton
Fire Dog Lake
FiveThirtyEight
Foolocracy
FP Passport
Gateway Pundit
GetReligion
Glenn Greenwald
Global Voices Online
GrEaT sAtAn"S gIrLfRiEnD
Hit & Run
Hot Air
Hotline On Call
Huffington Post
Hullabaloo
Informed Comment
Instapundit
J. Bradford DeLong's Grasping
Jawa Report
Jezebel
Jihad Watch
Joe. My. God.
John Redwood
Jonathan Turley
JOSHUAPUNDIT
Juan Cole
LA NOW
LabourList
Lawyers, Guns, and Money
Legal Insurrection
Little Green Footballs
Lynn Sweet
Marathon Pundit
MattYGlesias
Media Matters for America
Mediaite

40
Memeorandum
Metro Weekly
Michelle Malkin
Moneybox
Mother Talkers
My DD
naked capitalism
NationalJournal Hotline On Call
New Civil Rights Movement
Newsbusters
NewsOne
Nice Deb
No More Mister Nice Blog
NYT The Caucus
OpenMarket.org
OpenSecrets Blog
Our Future
Outside The Beltway
Pandagon
Pat Dollard
Patterico's Pontifications
PinkNews.co.uk
Pirate's Cove
Policy Beta Blog
PoliPundit
Political Commentator
PoliticalWire
PoliticMo
Politics, Power, and Preventative Action
Powerline Blog
Pressure Points
Red State
Rhymes with Right
Riehl World View
Right Wing News
Right Wing Watch
Rising Hegemon
Say Anything
Scared Monkeys
SCOTUSblog
Shadow Government
Shark Tank
Simply Jews
Stephen M. Walt
Street Prophets
Sultan Knish
Taegan Goddard's Political Wire
Talk Left
Talking Points Memo
Taylor Marsh
Tbogg
Techdirt
The Agonist
The American Prospect Articles
The Baseline Scenario
The Blaze
The Cable
The Classic Liberal
The Colossus of Rhodey
The Diplomat
The Diplomat-China
The Foundry
The Incidental Economist
The Inquisitr
The Lid
The Lonely Conservative
The Long War Journal
The Mental Recession
The Moderate Voice
The New Civil Rights Movement
The Political and Financial Markets
Commentator
the sad red earth
The Shark Tank
The Volokh Conspiracy
The YES! Weekly Blog
thetorydiary
Think Progress
Threat Level
Tom Tomorrow
Towleroad News
Townhall
TPMMuckraker
Truth on the Market
TruthDig
TruthHugger

41
Uppity Wisconsin
Via Meadia
Virginia Right
Volokh Conspiracy
Washington Monthly
Western Journalism
White House Dossier
White House.gov Blog
Winds of Change
Wizbang Blog
Wonkette
YID With LID
ZeroHedge
42
Appendix 3.2: Two-digit Policy Agendas Topic Codes
Code Topic
1 Macroeconomics
2 Civil Rights, Minority Issues, and Civil Liberties
3 Health
4 Agriculture
5 Labor, Employment, and Immigration
6 Education
7 Environment
8 Energy
10 Transportation
12 Law, Crime, and Family Issues
13 Social Welfare
14 Community Development and Housing Issues
15 Banking, Finance, and Domestic Commerce
16 Defense
17 Space, Science, Technology and Communications
18 Foreign Trade
19 International Affairs and Foreign Aid
20 Government Operations
21 Public Lands and Water Management
24 State and Local Government Administration
26 Weather and Natural Disasters
27 Fires
28 Arts and Entertainment
29 Sports and Recreation
30 Death Notices
31 Churches and Religion
99 Other, Miscellaneous and Human Interest

43
Appendix 3.3: Full List of Influential News Accounts on Twitter from Romero et al.
(2011)
@mashable
@cnnbrk
@big_picture
@theonion
@time
@breakingnews
@bbcbreaking
@espn
@harvardbiz
@gizmodo
@techcrunch
@wired
@wsj
@smashingmag
@pitchforkmedia
@rollingstone
@whitehouse
@cnn
@tweetmeme
@peoplemag
@natgeosociety
@nytimes
@lifehacker
@foxnews
@waitwait
@newsweek
@huffingtonpost
@newscientist
@mental_floss
@theeconomist
@emarketer
@engadget
@cracked
@slate
@bbcclick
@fastcompany
@reuters
@incmagazine
@eonline
@rww
@gdgt
@instyle
@mckquarterly
@enews
@nprnews
@usatoday
@mtv
@freakonomics
@boingboing
@billboarddotcom
@empiremagazine
@todayshow
@good
@gawker
@msnbc_breaking
@cbsnews
@guardiantech
@usweekly
@life
@sciam
@pastemagazine
@drudge_report
@parisreview
@latimes
@telegraphnews
@abc7
@arstechnica
@cnnmoney
@nprpolitics
@nytimesphoto
@nybooks
@nielsenwire
@io9
@sciencechannel
@usabreakingnews
@vanityfairmag
@cw_network
@bbcworld
@abc
@themoment
@socialmedia2day
@slashdot
@washingtonpost
@tpmmedia
@msnbc
@wnycradiolab
@cnnlive
@davos
@planetmoney
@cnetnews
@politico
@tvnewser
@guardiannews
@yahoonews
@seedmag
@tvguide
@travlandleisure
@newyorkpost
@discovermag
@sciencenewsorg

44
Chapter 4: Description of Datasets
In this chapter, I will provide a concise qualitative description of the various
media making up the datasets I use in my analysis. These include datasets on both the
traditional and new media. This qualitative assessment will form a base for later
discussions about my findings.
The blog and Twitter datasets form the basis of my new media analysis. Blog data
(in the form of blog posts) was collected between May 19, 2012 and August 14, 2012
from a total of twenty-nine different blogs.9 Twitter data (in the form of Tweets) was
collected from June 12, 2012 to August 16, 2012 from a total of twenty-eight Twitter
accounts.10
A total of 15,856 blog posts are included and coded in the set and a total of
18,903 Tweets are included and coded in the set.
Different blogs and different Twitter accounts display different characteristics.
Though these characteristics may seem subtle, they can offer important clues about the
differences in coverage. In this section, I will explain some of the pertinent characteristics
of the blogs and Twitter accounts that comprise those respective datasets and seek to put
the characteristics of these datasets into perspective in the larger blogosphere and
Twitterverse to analyze the representativeness and validity of my dataset.
In my blog dataset, there are sixteen conservative leaning blogs, ten liberal or
progressive leaning blogs, and three moderate or centric blogs. A blogroll is a list of links
9 The original blog dataset was to be comprised of thirty blogs. One was eliminated from
analysis because of technical difficulties in scraping its posts using Outwit Hub Pro. It is
The Political, Financial, and Markets Commentator. 10
The original Twitter dataset was to be comprised of thirty Twitter accounts. Two were
eliminated from analysis because they no longer regularly post or have a different owner
than they did when deemed influential by Romero et al. (2011). These are @seedmag
(Seed Magazine) and @themoment (The Moment).

45
to other blogs and websites curated by the author of a blog. This blogroll is particularly
important when thinking about the networked nature of the blogosphere. In my dataset,
all but seven of the blogs had a blogroll, emphasizing not only the importance, but also
the frequent presence of blogrolls on blogs. Conservatives tend to make greater use of
blogrolls and linking behavior (Karpf 2008, 41).
Ten of the twenty-nine blogs had only one author, with the other nineteen having
multiple authors. Some of the single author blogs occasionally feature guest posters or
other authors. Seven of the twenty-nine blogs are issue-based, meaning they focus on a
single, relatively narrow issue such as the current wars in the Middle East or the Israeli-
Palestinian conflict. The other twenty-two are general interest political blogs covering a
variety of topics much like a traditional media outlet such as a newspaper. Four of the
twenty-nine blogs are affiliated with traditional media outlets including Newsweek
magazine, Foreign Policy magazine, and The New York Times. See Table 4.1 for
characteristics of all blogs in the sample dataset.
(Insert Table 4.1 about here)
On average, each Twitter account had posted 24,198 tweets, was following 5,640
other Twitter accounts, and was followed by 1,239,771 other users.11
The Daily
Telegraph’s account (@telegraphnews) had Tweeted more than any other account with
74,794 Tweets and the Boston Globe’s photography blog’s account (@big_picture) had
tweeted less than any other account with only 926 Tweets. CNN (@CNN) had more
followers than other account with 5,824,718 users following it and io9 (@io9) had fewer
followers than any other account with 65,108 users. NPR’s account (@nprnews) followed
11
These averages are calculated using data gathered on September 3rd
, 2012

46
more users than any of the other accounts, following 76,306 other users and io9 followed
fewer users than other account, following only ten other users.
Sixteen of the Twitter accounts in the dataset are affiliated with a traditional
media outlet including magazines such as Rolling Stone, television stations such as
ESPN, and newspapers such as the New York Post. The other twelve are either
independent accounts, such as Social Media Today (@socialmedia2day) or affiliated with
new, or Internet-centric, media outlets such as Yahoo! News (@yahoonews). See Table
4.2 for a full presentation of the characteristics of all Twitter accounts in the sample
dataset including counts of Tweets, Following, Followers, and Romero et al.’s (2011)
influence rank (see Chapter 3 for an explanation of the methodology behind this rank).
The rank is out of all accounts on the Twitter platform at the time of calculation.
(Insert Table 4.2 about here)
It is not possible, nor particularly relevant to place this data into perspective with
all Twitter users given that few users comprise the majority of the traffic (Twitter 2011).
Rather, I will put them into the perspective of other news Twitter accounts quantitatively
based on Romero et al.’s (2011) list and by examining some of the relevant literature on
journalism and Twitter. There is no significant correlation observed between number of
followers, following, Tweets, or Romero et al.’s influence rank.
Using Stata, I ran an unpaired t-test with a 95% confidence interval and the
difference between the means of the full set (100 accounts) and my sample (28 accounts),
fall well within the 95% confidence interval. Additionally, see the scatter plots in Figure
4.1 for a comparison of the distributions between the full list and the sample
characteristics. Between the sample (on the left) and the full set (on the right), there is a

47
resemblance in the shape of the distributions. Therefore, I can say with 95% certainty that
my sample is representative of the larger, news environment on Twitter. In the last figure
in this section, you can also see that for most of the distribution, the number of accounts
followed by each account in the full set resembles a power law, except at the extremes of
the distribution. Other characteristics including number following and number of Tweets
do not resemble power laws.
(Insert Figure 4.1 about here)
On the other side of my analysis is the traditional media. I have obtained and
analyzed data from a variety of American and European news sources. The principle
dataset for comparison is Boydstun’s (2013) New York Times front-page dataset.12
I also
will utilize international datasets of El Pais and El Mundo, Spanish newspapers part of a
dataset created by Frank Baumgartner and Laura Chaqués13
, a dataset of The Times of
London, a newspaper in the United Kingdom created by Shaun Bevan14
, a dataset of Neue
Zürcher Zeitung, a newspaper in Switzerland created by Anke Tresch15
, and a dataset of
Danish Radio News created by Christoffer Green-Pederson16
. Codebooks are available
for each of these datasets from their respective country agendas projects and the
researchers.
I will rely heavily on Boydstun’s front-page dataset of the Times in my cross-
media analysis. For that reason, I will provide a more detailed description of that dataset
based on Boydstun’s forthcoming book, Politics, the Media, and Agenda-Setting: How
12
As previously explained, made available directly from Boydstun. 13
http://www.ub.edu/spanishpolicyagendas/datasetinstruments/ 14
http://www.policyagendas.org.uk/ 15
Not available on web; made available directly from Tresch. 16
http://www.agendasetting.dk/start/page.asp?page=4
48
Policy Issues Make the News (2012). The dataset includes every front-page story in The
New York Times Between January 1st, 1996 and December 31
st, 2006. It is comprised of
31,034 stories, all of which were coded by Boydstun and her research team.
Boydstun (2013), describes some of the major events that led to increased media
attention during this period including the terrorist attacks of September 11, 2001, the
beginning of the Iraq and Afghanistan wars, the wars in Kosovo, and the Terry Schiavo
right to die case. The dataset spans two presidencies, multiple international conflicts, and
varying domestic policies, making it representative of a wide variety of policy and non-
policy issues. See Chapter 4 of Boydstun’s forthcoming book for a more complete
description of the dataset.
As mentioned in Chapter 3, I will also make use of The New York Times index
developed by Baumgartner and Jones as part of the Policy Agendas Project.17
The coded
index is based on a sample of stories from the entire Times. I use it to compare coverage
on the front page to the newspaper overall. It contains 49,126 stories between January 1,
1946 and December 31, 2008. Over that time, it obviously contains a whole breadth of
stories from a significantly long period of American history.
The Spanish newspaper dataset includes all front-page stories from El Mundo and
El Pais from January 1996 to December 2009. There are 44,858 stories from El Mundo
and 50,770 stories from El Pais. The Danish radio news sets includes all the stories
mentioned in radio news from the 12:00 pm and 6:30 pm newscasts from January 1984 to
December 2003. There are a total of 191,564 stories in the dataset. The Times of London,
a newspaper in the United Kingdom, has a total of 21,844 stories in its data set and spans
17
http://www.policyagendas.org/page/datasets-codebooks

49
from January 1960 to December 2008. The last international dataset used for comparison
is Neue Zürcher Zeitung, a Swiss newspaper. There are a total of 8,558 stories in the
dataset spanning from January 1996 to December 2003. See Table 4.3 for consolidated
statistics on both domestic and international traditional media sources.
(Insert Table 4.3 about here)

50
Table 4.1: Blog Characteristics
18
From Karpf (2012b), pp. 73. This quadrant system categorizes blogs based on closed vs. open authorship mobility on the x-axis,
with blogs in Quadrants I and IV being more open than those in Quadrants II and III and the reputation on the y-axis with
organizational blogs lower on the y-axis and personal blogs higher on the y-axis. Some blogs in my sample were not categorized by
Karpf. I categorized those that were not categorized by Karpf using his criteria.
Blog URL Technorati Politics Authority
Index (as of May 10-13, 2012)
Blog
Authority
Index
Ranking
(if
available;
as of May
2012)
Political
Stance
(Progressive,
Moderate,
Conservative)
Authors
(Single/Multiple)
Blogroll?
(Y/N)
Affiliated with
Traditional
Media Source?
(Y/N, if Y,
which?)
Issue-based
or general
interest
Karpf
Quadra
nt18
Red State http://www.redstate.com 798 6 Conservative Multiple N N General Interest
I
Patterico’s Pontifications
http://patterico.com 663 13 Conservative Multiple Y N General Interest
II
Sultan Knish http://sultanknish.blogspot.c
om
611 Conservative Single Y N Issue-based II
The Mental
Recession
http://mentalrecession.blogs
pot.com
650 Conservative Single Y N General
Interest
II
The Long War
Journal
http://www.longwarjournal.
org
692 Moderate Multiple N N Issue-based III
Daily Kos http://dailykos.com 889 1 Progressive Multiple Y N General
Interest
I
Informed
Comment
http://www.juancole.com 711 8 Progressive Single Y N General
Interest
II
Digby/Hullabaloo http://digbysblog.blogspot.com
733 11 Progressive Multiple Y N General Interest
I
Talking Points
Memo/TPM
Muckraker
http://tpmmuckraker.talking
pointsmemo.com
681 2 Progressive Multiple N N General
Interest
IV
Daniel Drezner http://drezner.foreignpolicy.
com
589 Conservative Single Y Y, Foreign
Policy
General
Interest
III

51
Virginia Right http://www.varight.com 678 Conservative Multiple Y N General
Interest
III
New Civil Rights Movement
http://thenewcivilrightsmovement.com
723 Progressive Multiple Y N General Interest
I
American Thinker http://americanthinker.com 726 5 Conservative Multiple N N General
Interest
III
Hot Air http://hotair.com 751 1 Conservative Multiple Y N General
Interest
III/IV
Yid With the Lid http://yidwithlid.blogspot.com/
722 Conservative Single Y N Issue-based II
Newsbusters http://newsbusters.org/ 750 7 Conservative Multiple Y N General
Interest
IV
Elder of Ziyon http://elderofziyon.blogspot.com/
680 Conservative Single Y N Issue-based II
Blog of Legal
Times
http://legaltimes.typepad.co
m/blt/
606 Moderate Multiple Y N General
Interest
III
Lawyers, Guns,
and Money
http://www.lawyersgunsand
moneyblog.com/
134 23 Progressive Multiple N N General
Interest
III
TruthDig http://www.truthdig.com/ 555 Progressive Multiple Y N General
Interest
III
Uppity Wisconsin http://uppitywis.org/ 594 Progressive Multiple N N Issue-based III
Atlas Shrugs http://atlasshrugs2000.typepad.com/
670 Conservative Single Y N General Interest
II
Michelle Malkin http://michellemalkin.com/ 771 Conservative Multiple Y N General
Interest
II
The Cable http://thecable.foreignpolicy.com
788 Moderate Multiple N Y, Foreign Policy
General Interest
III
Ann Althouse http://althouse.blogspot.com
/
716 10 Conservative Single Y N General
Interest
II
The Political and
Financial Markets
Commentator*
http://politicsandfinance.blo
gspot.com/
638
Conservative Single Y N General
Interest
III

52
*Not included in further analysis due to technical difficulties in scraping a sufficient number of posts.
The Tory Diary http://conservativehome.blo
gs.com/thetorydiary
639 Conservative Multiple Y N Issue-based III
FiveThirtyEight http://fivethirtyeight.blogs.nytimes.com
Progressive Multiple N Y, The New York Times
Issue-based III
The Lonely
Conservative
http://lonelyconservative.co
m
714 Conservative Single Y N General
Interest
II
Andrew Sullivan http://andrewsullivan.thedail
ybeast.com/
140 Progressive Single Y Y,
Newsweek/The
Daily Beast
General
Interest
II

53
Table 4.2: Twitter Characteristics
@name Name Tweets* Following* Followers* Romero et al.
Influence Rank
Affiliated
with
traditional
media outlet?
(Y/N, if Y,
which?)
@socialmedia2day Social Media Today 20,919 420 125,430 3510 N
@nytimesphoto NYT Lens 3,148 258 264,983 2927 Y, The New
York Times
@seedmag** Seed Magazine 543 2,178 24,555 4696 Y, Seed
Magazine
@mental_floss Mental Floss 7,366 7,293 227,331 874 N
@breakingnews Breaking News 71,759 600 4,570,969 147 N
@newyorkpost New York Post 22,133 42,630 314,319 4790 N
@big_picture The Big Picture 926 183 92,843 92 Y, The
Boston
Globe
@usweekly Us Weekly 15,295 1,027 787,423 2233 Y, US
Weekly
@newscientist New Scientist 13,201 3,252 636,879 852 Y, New
Scientist
@life Life.com 6,592 215 1,520,794 2277 Y, Life
Magazine
@wired Wired 14,828 295 1,603,606 322 Y, Wired
@instyle InStyle 23,718 2,456 2,235,895 1330 Y, InStyle
@todayshow The Today Show 15,618 7,404 1,321,054 1927 Y, NBC’s
The Today
Show
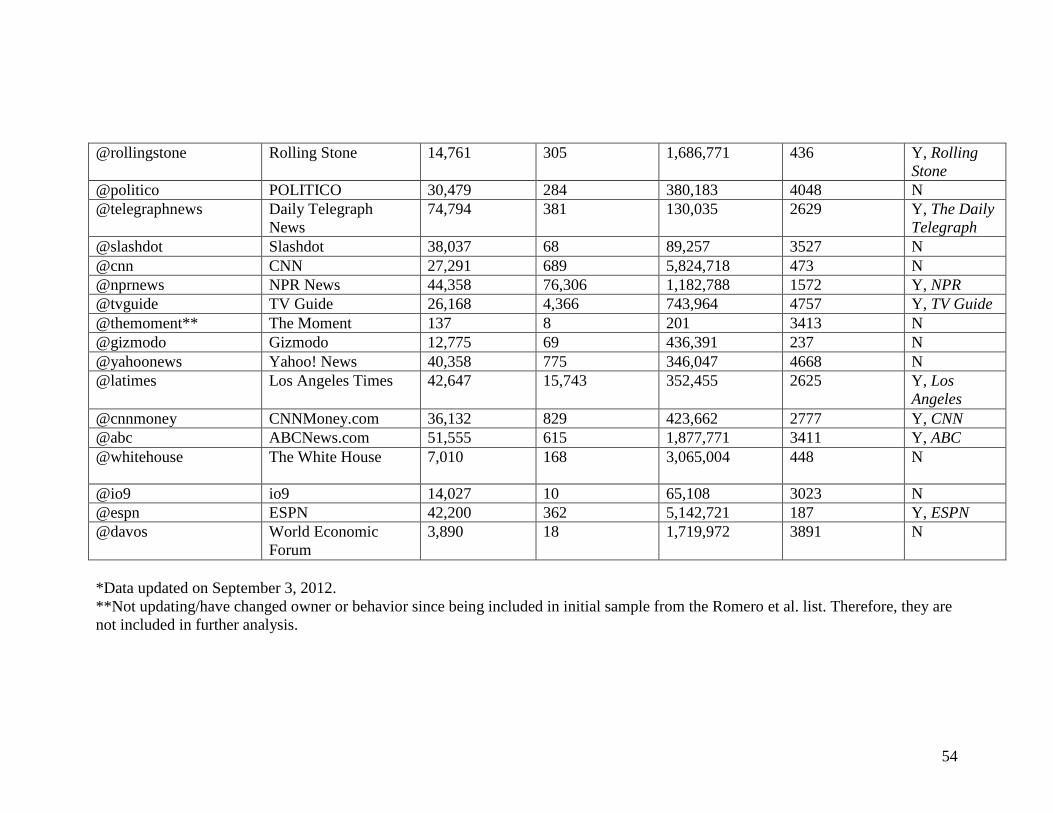
54
@rollingstone Rolling Stone 14,761 305 1,686,771 436 Y, Rolling
Stone
@politico POLITICO 30,479 284 380,183 4048 N
@telegraphnews Daily Telegraph
News
74,794 381 130,035 2629 Y, The Daily
Telegraph
@slashdot Slashdot 38,037 68 89,257 3527 N
@cnn CNN 27,291 689 5,824,718 473 N
@nprnews NPR News 44,358 76,306 1,182,788 1572 Y, NPR
@tvguide TV Guide 26,168 4,366 743,964 4757 Y, TV Guide
@themoment** The Moment 137 8 201 3413 N
@gizmodo Gizmodo 12,775 69 436,391 237 N
@yahoonews Yahoo! News 40,358 775 346,047 4668 N
@latimes Los Angeles Times 42,647 15,743 352,455 2625 Y, Los
Angeles
@cnnmoney CNNMoney.com 36,132 829 423,662 2777 Y, CNN
@abc ABCNews.com 51,555 615 1,877,771 3411 Y, ABC
@whitehouse The White House 7,010 168 3,065,004 448 N
@io9 io9 14,027 10 65,108 3023 N
@espn ESPN 42,200 362 5,142,721 187 Y, ESPN
@davos World Economic
Forum
3,890 18 1,719,972 3891 N
*Data updated on September 3, 2012.
**Not updating/have changed owner or behavior since being included in initial sample from the Romero et al. list. Therefore, they are
not included in further analysis.
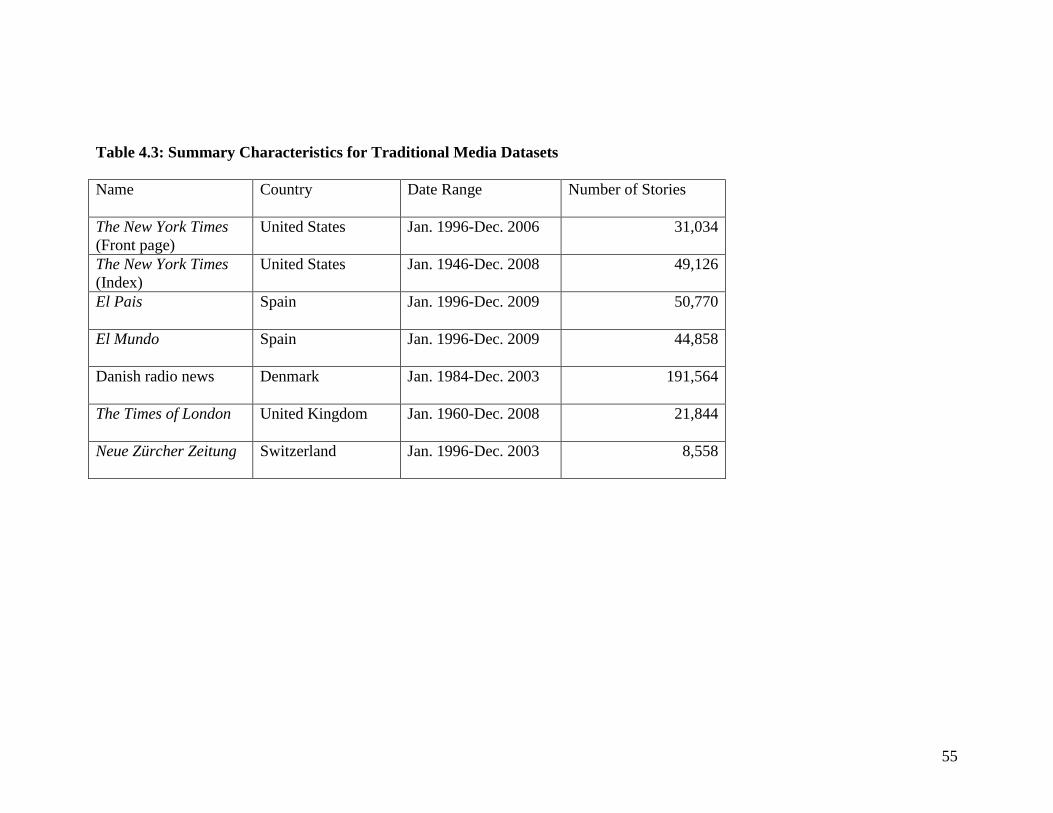
55
Table 4.3: Summary Characteristics for Traditional Media Datasets
Name Country Date Range Number of Stories
The New York Times
(Front page)
United States Jan. 1996-Dec. 2006 31,034
The New York Times
(Index)
United States Jan. 1946-Dec. 2008 49,126
El Pais Spain Jan. 1996-Dec. 2009 50,770
El Mundo Spain Jan. 1996-Dec. 2009 44,858
Danish radio news Denmark Jan. 1984-Dec. 2003 191,564
The Times of London United Kingdom Jan. 1960-Dec. 2008 21,844
Neue Zürcher Zeitung Switzerland Jan. 1996-Dec. 2003 8,558

56
Figure 4.1: Twitter Characteristic Scatter Plots
Number of Tweets
Number of Followers
Number of Following

57
Number of Following Resembles a Power Law

58
Chapter 5: The Spread of Attention
As defined, there is a finite amount of space on the media agenda—only so much
can make it onto the front page or into the news. The decisions as to what does make it
onto the front page are complex. This distribution of attention, or how much space one
story or topic is allowed to occupy, is important.
Major Issues in the News
In this chapter, I will first undertake a qualitative review of some of the major
issues that occupied significant attention in the blogosphere and Twitterverse during the
data collection period, May to August 2012. These are generally topics that stuck out to
me, the coder. To begin, one overwhelming topic was the 2012 presidential election
between President Barack Obama and former Massachusetts Governor Mitt Romney.
This occupied significant attention, particularly on certain blogs such as the Daily Kos.
Another issue that occupied significant space in this agenda at the beginning of the
collection period was the John Edwards’ corruption and campaign finance trial. Along
with these two large topics, a lot of attention remained dedicated to other presidential and
federal government actions. Notably, both of these topics were coded the same (Topic 20,
Federal Government Administration, which includes elections).
There were also several big crime and law enforcement stories. The shooting of
Trayvon Martin by George Zimmerman received considerable attention particularly on
left-leaning blogs and those that concern themselves with minority issues and civil rights.
As Zimmerman was arrested, left, and returned to jail multiple times, and new
accusations and facts surfaced, coverage surged. The Jerry Sandusky sex abuse trial out
of State College, Pennsylvania also received substantial attention particularly in the days
59
leading up to the end of his trial and the jury’s decision. Because of the significant public
interest in this case, coverage of the NCAA sanctions on Pennsylvania State University
also received attention. This sports angle is probably not something that ordinarily makes
it onto the top of a political blog, but public interest appears to have won out. Coverage
was substantial and sustained.
The Aurora movie theater shootings in July by James Holmes also occupied
significant space. This serves as an illustration of the difference between traditional and
new media. As the shooting happened after 2 a.m. Eastern Standard Time, most of the
major national newspapers had already sent the next day’s print edition to press. Bloggers
and Twitter users were able to pick up this issue immediately and report on it before most
people on the East Coast of the United States were awake. The newspapers had to wait
until the next day to publish print stories on the tragedy. These crime stories in particular
appear to transcend most of the traditional issue-based boundaries found in the
blogosphere. Even in the blogs and Twitter accounts that typically dedicate themselves to
a specific issue and definitely do not ordinarily cover crime gave attention to these crime
stories, especially the Aurora shooting. The scale of casualties is probably responsible for
that change in attention.
On the foreign policy front, the ongoing conflict and situation in Syria received a
lot of attention, particularly in the early part of the summer. However, as the summer
went on, coverage of the conflict in Syria seemed to decrease, but seemingly not in
response to any particularly event. The conflict is certainly ongoing. Public interest in the
United States may have waned on the issue and attention decreased. The ongoing war in
Afghanistan also received noticeable attention.

60
The 2012 London Olympics also occurred during this period in late July and early
August. Across blogs and Twitter accounts, and not just accounts like @ESPN where you
would expect to see a lot of coverage on the Olympics, attention was given to the
Olympics. Sports became a topic discussed in more than just sports focused sources and
outlets.
Two surges in science and space coverage occurred surrounding the successful
launch and return of the commercial SpaceX Dragon capsule to and from the
International Space Station at the end of May and the successful arrival of NASA’s
Curiosity Rover on Mars in August and consequent transmission of pictures from the Red
Planet. While some outlets like the magazine New Scientist’s Twitter account frequently
give attention to the topic of space exploration, most outlets do not. However, in response
to events like these they do.
Boydstun (2013) describes the contents of her dataset in qualitative terms as well,
discussing some of the major stories in the eleven years included in her dataset. Some
major stories include the Oklahoma City federal building bombing, major sporting
events, the wars in the Middle East, and elections (120). Other stories include the rolling
California blackouts in 2001, the Enron scandal in 2002, and the Catholic priest abuse
scandal that broke in 2002 (128). Seasonal, but recurring, events include the Olympic
games and presidential elections (135-136). Some events are enduring, including sports
and weather, and come up on the Times’ front page on a regular basis (134). Ultimately,
in an eleven-year period, a lot of big news happens. These represent some of the
highlighted events from this dataset. Altogether, her dataset represents the history of an
era. She also takes her analysis a step-further, looking at the diversity of perspectives

61
within coverage of issues, or how issues are framed differently. My analysis will not
extend that far.
Changes in attention as a result of specific events can be explained by the idea of
punctuated equilibrium, an idea conceptualized by Baumgartner and Jones ([1993] 2009).
At its most basic, this is the idea that equilibrium in agendas is disrupted, or punctuated,
by specific events that cause attention levels to change. As applied to the current topic at-
hand, “The fitful nature of media coverage of public policies is linked to the fitful
concerns of governmental institutions of decision making. As an issue surges onto the
media agenda, so does it lurch onto the agendas of federal and state agencies that had
previously not been concerned with it” (Baumgartner and Jones [1993] 2009, 125). This
concept will also be relevant in the next chapter when I analyze how coverage changes
over time. Other studies of media attention also focus on this idea (Baumgartner and
Chaqués 2012, Boydstun, Hardy, and Walgrave N.d., Wolfe, Boydstun, and Baumgartner
2009, Boydstun 2013, and McCombs 2004). All of these authors argue that media
coverage and the media agenda is highly linked to specific events and incidents that cause
changes in this coverage. Thus, specific events, particularly recurring ones, can explain
patterns of coverage.
Analyzing the Spread of Attention
Having seen some of the “big” stories, I now turn to a statistical analysis of this
data from a bird’s eye view to get an overall idea of the levels of attention distributed to
different topics. As I examine how much progress has been made toward achieving the
vision of the Internet utopia, this is an aggregated measure that allows for a standardized
comparison between media sources.

62
As I discussed in Chapter 2, attention diversity is important in the media in order
to provide a wide variety of information to citizens, who ultimately are making important
political decisions based on the information they consume in the media. In order to
analyze my data in this manner, I turn to the concept of entropy. Entropy is a measure of
disorder in a system that has its conceptual origins in chemical and physical
thermodynamics. Entropy is a measure used to study disorder within political and social
systems. Claude Shannon (1948) first applied entropy to communication. According to
Coleman (1975), “The entropy is a measure of how much uncertainty we have about a
random individual’s expected choice, or equivalently, of how the group will apportion its
choices among the alternatives” (33). Coleman continues, stating, “entropy might be
thought of as a measure of heterogeneity, nonconformity, or lack of consensus in a group
of people. The greater the heterogeneity or nonconformity in the group with respect to a
set of possible actions, the greater will be the uncertainty about any one person’s
behavior, and thus the greater the entropy” (34).
This concept is highly applicable to my topic. I isolate each media source as a
“system.” The choices in this case are defined—which of the policy topics describes each
story. That is, the author of a story or an editor in charge can choose which topic to write
a story about. If all media outlets make similar choices, this is a highly homogenous
system. If the distribution of coverage is markedly different, the opposite is true—the
system is very heterogeneous.
There are several measures of disorder in a system. Three of the most common
are the Herfhendal Index (HHI), the normalized version of the Herfhendal Index
(N_HHI), and Shannon’s H, in many circles the classical measure of entropy. Boydstun,

63
Bevan, and Thomas (N.d.) discuss measuring attention diversity. They argue that
Shannon’s H is well suited for measuring attention diversity based on past works and that
it is more accurate than the Herfhendal Index at the extremes of the range of
measurement. Shannon’s H as a measure for entropy is on a scale of zero to one. They
say that “Shannon’s H directly accounts for the number of issues at play; as the number
of issues increases, its maximum value also increases via the ln(N), where N is the
number of issues” (Boydstun, Bevan, and Thomas N.d., 15). The mathematical formula
for Shannon’s H is:
Formula 1: Shannon’s H Information Entropy
Shannon’s H = ∑
where:
xi represents an issue
p(xi) is the proportion of total attention the issue receives
ln(xi) is the natural log of the proportion of attention the
dimension receives19
These authors conclude that Shannon’s H Information Entropy is the best possible
measure of diversity. They argue that it is the most consistent and accurate measure at all
levels of entropy and is superior to other indexes such as the Herfhendal Index
(Boydstun, Bevan, and Thomas N.d., 29-30). According to Wolfe, Boydstun, and
Baumgartner (2009), many studies of media and institutional agendas have also turned to
entropy as their measure of choice for studying attention diversity. For these reasons, I
have selected Shannon’s H as my measure of entropy to analyze differences in levels of
attention across the Policy Agendas Topics for this thesis.
19
Formula from Boydstun, Bevan, Thomas N.d., 14-15

64
To confirm my selection of Shannon’s H as my measure for this project, I also
calculated the HHI and normalized HHI for all sources in question. Using Stata, I ran a
correlation between three variables, HHI, N_HHI, and Shannon’s H Entropy. All were
highly correlated. HHI and N_HHI are correlated at a perfect (1.0) level. Shannon’s H
and HHI are negatively correlated at the -0.96 level and Shannon’s H and normalized
HHI are likewise negatively correlated at the -0.96 level. The reason for the negative
correlation is that the scales for N_HHI and HHI are the inverse of Shannon’s H, but still
on a scale between zero and one (zero being the most heterogeneous system, one being
the most homogenous system). From this analysis, it is clear that no matter what the
selection of measurement, the high correlation between available measures indicates that
all would tell a similar story about attention diversity in the media.
Statistical Results
I will now discuss, at an aggregated level, the measure of diversity, using
Shannon’s H, for the media sources included in my analysis. First, I will look at each
blog and Twitter account individually. The mean entropy value for blogs was 0.59 and a
median value of 0.66. The least diverse blog using this measure was The Tory Diary with
an entropy of 0.05. This blog focused nearly expressly on British politics (coded under
Topic 19-International Affairs), despite being classified by Technorati as one of the top
100 influential political blogs in the United States. The most diverse individual blog was
Lawyers, Guns, and Money with an entropy value of 0.80. There were several others near
that range, while no other blog approached the extreme lack of diversity observed on The
Tory Diary. See Table 5.1 for a display of entropy values for all blogs in my dataset.
(Insert Table 5.1 about here)

65
On Twitter, the other side of my new media analysis, there are similar results. The
average entropy for individual Twitter accounts is 0.55 and the median entropy is 0.59.
The least diverse Twitter account included in my dataset is @tvguide, with an entropy of
0.09. This lack of diversity is explainable by the intense focus on arts and entertainment
(Topic 28), which I discuss in greater detail below. The most diverse Twitter account as
measured here is @nprnews, which has an entropy of 0.83. See Table 5.2 for a full
display of entropy values for Twitter accounts included in my dataset.
(Insert Table 5.2 about here)
Although Shannon’s H provides a highly precise measure of entropy, it can be
difficult to comprehend the difference between different sources in terms of diversity on
a purely mathematical level. The three pie graphs in Figures 5.1 and 5.2 each illustrate a
blog and Twitter account, respectively, of “low”, “moderate”, and “high” entropy. The
corresponding entropy value is included with each chart. The difference in overall
coverage as distributed between sources is graphically evident.
(Insert Figures 5.1 and 5.2 about here)
Thus far, my analysis has been confined to the diversity of individual new media
sources. The networked nature of the blogosphere and Twitterverse is important. Unlike
newspapers, where an ordinary individual would only read one newspaper per day, most
Twitter users are reading Tweets from multiple (if not tens or hundreds of) accounts each
day (and often multiple times per day) and the linked nature of the blogosphere and
features like blog rolls contribute to the idea that regular readers of blogs are often
reading posts on multiple blogs. This is simply the nature of the new media.

66
Due to this characteristic of both new media types in my datasets, I calculated
another important entropy value for each. As previously detailed, I used Stata to append
all Twitter and blog datasets into one, large dataset for each with 15,856 blog posts and
18,903 Tweets. I call these my “combined” datasets for each type of new media. These
values are also reflected in Tables 5.1 and 5.2, near the bottom of each table. Essentially,
this is a calculation of the total entropy for the blogosphere or Twitterverse based on my
samples. The combined entropy for the blogs is 0.77 and the combined entropy for
Twitter is also 0.77. Therefore, as networks, the blogosphere and Twitter are similarly
diverse. In Figures 5.3 and 5.4, this diversity in coverage is represented in pie graphs for
each media source. Although the diversity appears similar, the way it is distributed is
different and I will further discuss that later in this chapter.
(Insert Figures 5.3 and 5.4 about here)
As the point of this analysis is not merely to describe the new media in qualitative
and quantitative terms, but also to compare these new media sources to traditional media
sources and assess the implications of that, I have compared the diversity of my new
media sources to the mainstay traditional media source in the United States, The New
York Times. Using Boydstun’s (2013) front-page dataset, I calculated an entropy value of
0.83. Graphically, this level of diversity is represented in the pie graph of coverage
broken down by percent of coverage devoted to each topic in Figure 5.5. Therefore, the
traditional media, at least as represented by the Times, is just slightly more diverse than
new Internet media sources. This difference is not necessarily substantial. In actuality, the
diversity of the traditional and new media, at least measured numerically, is similar.
(Insert Figure 5.5 about here)

67
A possible criticism of my comparison here is that I am comparing a three-month
dataset on the new media to a ten-year dataset on the Times. This criticism is valid, and
ultimately a result of the constraints of my thesis timeline. To mitigate this criticism, I ran
separate entropy tests on all consecutive three-month (quarterly) periods in Boydstun’s
front-page dataset. Taking the average of all of these entropies, the result is an overall
value of 0.79. This entropy value is even closer to the values calculated for the new
media. Over time, the Times is slightly more diverse than the new media, but barely so
within three-month periods. This further supports my argument that the diversity of the
new and traditional media in the United States is not significantly different.
Boydstun (2013) and Lovett and Baumgartner (2012) conducted similar analyses
that revealed that within the traditional media, there is largely a single media agenda
within television news and newspapers in the United States. Using this data, I can
conclude that overall, the new and traditional media display about the same level of
attention diversity, at least statistically. The overall degree of attention is similar. That
last point is important to note because there is a difference between this mathematical
measure of diversity and the way that attention is actually distributed across different
issues. I will further discuss where that finite amount of attention in each medium falls
later in this chapter. I will discuss possible discrepancies by topic in the traditional and
new media.
As a further check on my analysis, I also ran entropy tests on the Policy Agendas
Project’s New York Times index of all stories between 1946 and 2008 originally created
by Baumgartner and Jones. Rather than coding every front-page story in the Times like
Boydstun, Baumgartner and Jones coded the first story on every odd-numbered page of
68
the Times index to get an overall idea of the type of coverage displayed throughout the
times. Although I did my best to replicate a “front page” in the blogs and on Twitter by
retrieving the most recent updates each day, that is not a perfect method. That technique
probably puts my datasets (by analogy) somewhere in between the front-page dataset and
the index. The entropy value for the Times index is a bit higher than the front-page score,
at 0.88. This demonstrates that fewer issues win the competition for the highly finite
amount of space on the front page of the Times each day whereas a greater number of
topics can be represented throughout the paper. However, this dataset spans a much
greater period of time than does Boydstun’s or mine. For the purposes of this analysis
however, these are all “high” entropy scores and graphically do not appear much
different. This source is also represented by a pie graph of percent of coverage of
different topics in Figure 5.6. Coverage is distributed differently inside of the paper than
on the front page. As seen in the charts, International Affairs is the most common topic
on the front page, while Banking and Domestic Commerce is the most common topic
overall as represented by the index.
(Insert Figure 5.6 about here)
In pursuit of making this analysis as accurate, relevant, and widely applicable as
possible, I have also compared my data to several international traditional media sources.
These sources from Spain, Denmark, Switzerland, and the United Kingdom have
previously been described. Whereas Twitter and blogs, due to their being on the Internet
are easily accessible around the world, the consumption of traditional media sources is
largely confined to a single country.
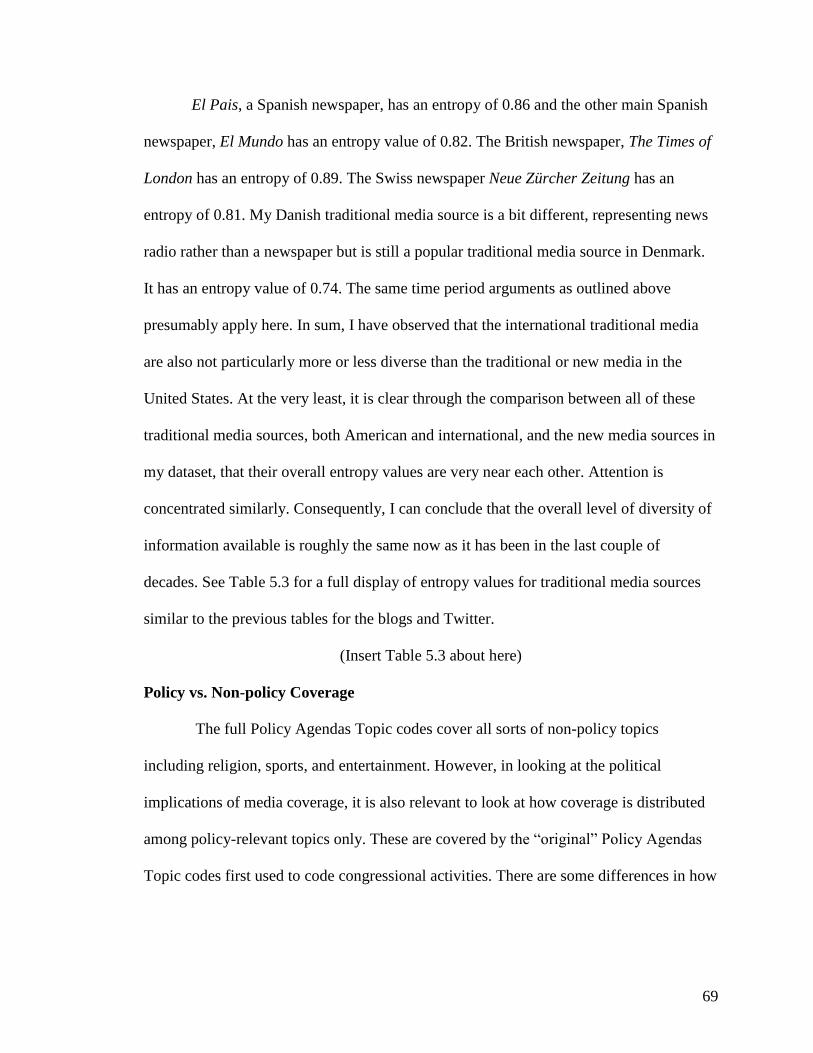
69
El Pais, a Spanish newspaper, has an entropy of 0.86 and the other main Spanish
newspaper, El Mundo has an entropy value of 0.82. The British newspaper, The Times of
London has an entropy of 0.89. The Swiss newspaper Neue Zürcher Zeitung has an
entropy of 0.81. My Danish traditional media source is a bit different, representing news
radio rather than a newspaper but is still a popular traditional media source in Denmark.
It has an entropy value of 0.74. The same time period arguments as outlined above
presumably apply here. In sum, I have observed that the international traditional media
are also not particularly more or less diverse than the traditional or new media in the
United States. At the very least, it is clear through the comparison between all of these
traditional media sources, both American and international, and the new media sources in
my dataset, that their overall entropy values are very near each other. Attention is
concentrated similarly. Consequently, I can conclude that the overall level of diversity of
information available is roughly the same now as it has been in the last couple of
decades. See Table 5.3 for a full display of entropy values for traditional media sources
similar to the previous tables for the blogs and Twitter.
(Insert Table 5.3 about here)
Policy vs. Non-policy Coverage
The full Policy Agendas Topic codes cover all sorts of non-policy topics
including religion, sports, and entertainment. However, in looking at the political
implications of media coverage, it is also relevant to look at how coverage is distributed
among policy-relevant topics only. These are covered by the “original” Policy Agendas
Topic codes first used to code congressional activities. There are some differences in how

70
coverage is distributed measuring entropy by only analyzing the coverage distributed
over policy-relevant topics.
To measure this, I used Stata to isolate only the policy-relevant topics (Topic
Code 1 through Topic Code 24). Then, I calculated the total number of policy-relevant
stories, blog posts, or Tweets. I used this value to calculate the overall percentage of
coverage devoted to policy-relevant or “hard” news coverage. The results of this analysis
are also in Tables 5.1, 5.2, and 5.3 for blogs, Twitter, and traditional media, respectively.
Overall, the traditional media exhibited higher levels of policy-relevant news
coverage than the new media. On the Times front page, 88.68% of coverage was devoted
to policy topics. In the blogosphere, this value was lower, with 82.78% of coverage being
distributed across policy relevant topics. The starkest difference, however, is on Twitter.
On Twitter, less than half of coverage was distributed to policy-relevant topic areas. Only
48.75% of coverage was policy-relevant. Figure 5.7 provides a graphical depiction of the
differences in policy versus non-policy attention in these three types of media. This
massive difference is possibly attributable to various reasons. I contend that the ease and
zero-cost nature of posting on Twitter and the large amount of information available on
the network promotes a considerable number of human-interest stories to be posted.
Individuals taking the time to write extended blog posts appear to be more dedicated to
substantive policy-relevant discussion. Where space is expensive and highly finite, like in
a newspaper, very high levels of coverage are devoted to policy-relevant topics, as it is
the information that the electorate most needs (but does not necessarily most desire). This
is especially true on the front page. On Twitter and blogs, there is less of a difference in
terms of cost, both monetary and spatial, that constrains the coverage in those areas. This

71
is revealed by the difference in policy-relevant coverage in the Times index versus the
front-page dataset. In the index, only 81.27% of coverage is on policy-relevant topics.
This is lower than the distribution in the blogs.
(Insert Figures 5.7 about here)
The international traditional media sources largely mirror this distribution in
policy versus non-policy coverage. On average, traditional media outlets devote 87.13%
of their coverage to policy-relevant topics. The international sources range from
approximately 82% to 99% of coverage devoted to policy-relevant topics. Therefore, I
conclude that the traditional media, especially on the front page, display high-levels of
policy only topic coverage.
This difference between policy and non-policy coverage is important. In
scholarship, it is often referred to as hard and soft news—hard news being policy relevant
news and soft news being human-interest, or non-policy relevant news. There is growing
evidence that the rise of soft news, especially to the extent we are seeing on the Internet
(and is demonstrated by the results I observed on Twitter) is having a detrimental effect
on democracy by decreasing the overall attention people are paying to news (Patterson
2000, 3). It is possible that so much soft-news in certain platforms is actually
discouraging people from reading the news (Patterson 2000, 8) and thus decreasing the
individual’s interest in politics (Patterson 2000, 10). Patterson makes several conclusions
in his study of the rise of soft news. He writes, “Soft news has a place in the news. Even
the most ardent hard news consumers like the diversion that an amusing or compelling
soft news story can provide. But soft news is a weak foundation for a news program or
newspaper. To build the news around something other than public affairs is to build it on

72
sand” (Patterson 2000, 9). Following this logic, Twitter is a substantially weaker news
platform than a newspaper or even the blogosphere, especially in terms of its political
benefit.
Aside from the percentage of coverage spent on policy and non-policy relevant
topics, I also calculated the entropy value across the coverage of policy-relevant topics
only. In the Times, the entropy is actually lower across the policy-relevant topics than
across all issues, though negligibly so. The entropy value is 0.83. The combined blog
value follows a similar trend with a slightly lower entropy value with a score of 0.75. The
same is true across the international sources as well. This trend changes on Twitter,
though. The combined entropy on Twitter actually increases when looking only at policy-
relevant topics. The combined entropy of Twitter is 0.80. This means that although a
smaller percentage of coverage on Twitter is devoted to policy-relevant areas, among that
coverage, a greater variety of policy topics are represented.
Different Distributions of Coverage
A particular phenomenon provides a caveat to the seeming implications of the
prior statistics in some respects. Though the different sources do not appear to differ
significantly in overall diversity as measured, there are differences in terms of how that
diversity of attention is distributed. This is particularly relevant as we enter an era filled
with soft news. As I articulated in Chapters 1 and 2, the media are an important tool to
inform the public about pressing policy topics. However, it is also important to note that
in many cases, the differences in attention distribution are negligible or not significant. In
this section, I will discuss the way that coverage is distributed rather than overall
statistics that describe the diversity of each type of media.

73
There are several topic areas in specific that show a great disparity in distribution
of attention between Twitter, blogs, and the Times. I will examine each of those areas
independently and offer an assessment as to the possible causes of the difference and the
possible effects of that difference. Topic 2, Civil Rights, Minority Issues, and Civil
Liberties shows a gap in attention, especially with respect to blogs. In the blogosphere,
6.09% of attention was devoted to this topic area while Twitter and the Times had 0.95%
and 2.95%, respectively. This appears to be due to the fact that the blog New Civil Rights
Movement devoted significant attention to this topic and was included in my dataset. At
the same time, many of these civil rights issues are very partisan or controversial. This
reflects some of the tendencies of the blogosphere as most of the blogs exhibit political
leanings in some direction—either right or left. Various studies have confirmed that the
new Internet media, and particularly political blogs are highly partisan and that this
shapes their coverage (Baum and Groeling 2008, Benkler and Shaw 2010, and Karpf
2012b). There was no analogue to this source on Twitter and the Times, as a newspaper
of record, cannot devote significant amounts of its agenda space arguing in favor of gay
marriage, for example. Blogs, on the other hand, can.
Topic 16, Defense, also exhibited a huge disparity, despite the United States
fighting a war in Afghanistan and conducting military operations in other areas of the
world for the totality of the data collection period for the blogs and Twitter. Of course,
parts of the Times data is also from war times, including the start of the war in Iraq, the
Balkan conflict, along with the war in Afghanistan. The Times gives a total of 14.43% of
its front-page space during the period to defense. In stark contrast, the Twitter sources
discussed defense only 1.61% of the time with blogs a bit higher at 5.16%. The blogs are

74
higher because of specialized defense and foreign policy blogs such as Daniel Drezner,
The Cable, and The Long War Journal. More broadly, as I discussed, the Times tends to
focus more on important policy issues, one of those being defense and devotes
significantly more attention to matters of defense—something everyone in the polity
should care deeply about.
Space, Science, Technology and Communications, Topic 17, are more highly
covered on Twitter than in either the blogs or the Times. I do not attribute this difference
to anything characteristic or systematic. Rather, I attribute this to several of the Twitter
accounts (@socialmedia2day, @slashdot, @wired, among others) focusing on consumer
technology and social media as well as the chatter previously mentioned regarding space
exploration including the Mars Curiosity rover and SpaceX Dragon capsule during the
data collection period. However, it is important to note that Twitter offers a platform for
the discussion of the role of social media in society and the economy as well as sustained
chatter about space exploration, a topic interesting to many that receives only 2.32% of
attention in the Times. It received 8.62% of attention on Twitter.
There was also a significant deficit in coverage of Topic 19, International Affairs
and Foreign Aid, on Twitter. Only 10.81% of coverage was devoted to international
affairs on Twitter, while both blogs and the Times devoted around 20% of coverage to
international affairs. Initially, I thought this could be due to few major international
events happening during the new media collection period and the Times covering many
more international stories and wars over time, but that isn’t the case. There were
significant events in the Middle East among plenty of other routine international
happenings during the data collection period and the discrepancy between blogs and

75
Twitter is unexplained by that. Therefore, it appears that there is just a categorical
difference in coverage of international affairs and events in other countries on Twitter
despite its global scope and reach.
State and local politics, Topic 24, do not receive substantial attention in any of the
media, especially on Twitter. To an extent, that is expected because the Twitter accounts
have a national, if not international audience. Although the Times does have a national
audience, it is ultimately also a local newspaper for New York City and New York State.
Two of the blogs, on the other hand, were largely state specific, Uppity Wisconsin and
Virginia Right, which focused on politics within Wisconsin and Virginia, respectively.
Despite that specificity, they were present on my aggregated list of influential US politics
blogs. Other blogs, like Ann Althouse, also gave considerable attention to state politics. In
the case of Ann Althouse, that was also largely dedicated to Wisconsin politics given the
dynamic situation there during the data collection period regarding the attempted but
unsuccessful recall of Governor Scott Walker. Many of the other stories in this topic were
about state elections rather than actual governmental administration at the state or local
level.
Moving to non-policy topics, there were also several disparities in coverage that
merit consideration. Topic 28, Arts & Entertainment encompasses a wide variety of
stories including celebrity news, music, movies, and less popular forms of art or
diversion. The Times and blogs largely mirror each other in amount of front-page
coverage devoted to the topic with just under 2.5% of their coverage being devoted to
such topics. Twitter, in extreme contrast, devotes nearly 18.34% of its coverage to these

76
subjects. That difference is largely explainable with several ideas. One is that blogs and
the Times devote considerably more attention to policy issues than Twitter.
The other explanation is based on the kinds of Twitter accounts included in the
aggregated data set. There were numerous that devoted almost all of their attention to this
type of content. These blogs include @usweekly, @todayshow, @instyle, @rollingstone,
and @tvguide. Their combined effect is substantial enough to create this disparity in
coverage. There was no analog to these sorts of accounts in the blog dataset. Celebrity
news sells in the American media and these accounts have hundreds of thousands of
followers hungry for the latest celebrity gossip or album review. That sort of coverage, on
the other hand, would probably not sell on the front page of The New York Times.
A similar, but not as extreme of a difference was observed with Topic 29, sports
and recreation. Blogs devoted hardly any of their coverage, only 1.89%, to sports and
recreation. This largely makes sense given their general focus on politics or some other
specific issue. The reason they displayed even that much coverage in the period for which
data collected was because the 2012 London Summer Olympic games occurred during
that time and coverage of an event of that spectacle was picked up by almost every media
outlet. Again, Twitter devoted more attention to sports, with 10.14% of coverage being
on Topic 29. Some of that is explainable by the @espn account, affiliated with the TV
sports news network, ESPN devoting nearly all of its coverage to sports. However, during
the Olympic games, other accounts displayed increased attention to sports including
@todayshow, @big_picture, and @nytimesphoto. While all outlets were covering the
Olympics to some degree, the Olympics are an event that captivates the world and was
highly present in the Twitterverse. The Times devotes 4.10% of its coverage to sports,

77
which makes sense. Though not an important political or international topic, any large
sports event is going to make the front page because people are interested in that. That
goes beyond the Olympics to playoff games in baseball, the Super Bowl, or even a big
regular season victory for a New York sports team.
The biggest, and perhaps most difficult to explain topic comes with Topic 99, the
catchall category, miscellaneous. Of all of the Times stories, only 0.55% can be
categorized as miscellaneous, or perhaps better phrased, uncodeable. These stories are not
uncodeable because they are not readable or legible, for example, but rather, because the
coder cannot determine a category in which the story belongs. In the Times, as I have
discussed, space on the front page is very finite and costly. Therefore, if a story makes it
onto the front page, it is going to be about a substantive topic.
In the new media, space is not so costly. An author can easily devote an entire
blog post or Tweet to something that would be considered meaningless in the traditional
media. For example, there were significant numbers of blog posts that were essentially
devoted to “internal” news. By internal news, I mean blog posts announcing the
appearance of one of the authors on a TV talk show, news about a site redesign, or a post
saying that the author would not be posting for a few days while travelling. There are also
roundup, or summary, posts that are not codeable. For example, some blogs have “link”
posts where they just provide links to other interesting articles. Other blogs also publish
roundup posts with several different stories, often in the morning or at the end of the
week. Because these posts contained several substantive topics, they are not codeable
under one topic.

78
The aforementioned summary posts are less common on Twitter given the 140
characters per post limit, but are not nonexistent. On Twitter, almost 20% of the Tweets
were coded as miscellaneous. On both the blogs and Twitter, there are a significant
number of human-interest stories that are not categorizable. According to the Boydstun
codebook, human-interest stories should be coded 99. Although some human-interest
stories might be coded under health or science and technology, for example, the majority
of these posts are coded under Topic 99. Because of the ease of posting a Tweet, there are
more posts like this on that platform. Additionally, there were certain accounts that
posted almost all uncategorizable posts such as @instyle, which posts fashion related
news—something that does not fall under any of the other topics. This is a characteristic
difference of the Twitter platform and the low-entry and use costs of Twitter—users can
post anything, no matter how seemingly meaningless it might be. Ultimately, the low-
costs of online media permit the “front-page” publication of human-interest stories.
A summary of the percentage of coverage devoted to each of the twenty-seven
topics in blogs, on Twitter, and in The New York Times is displayed in Table 5.4.
(Insert Table 5.4 about here)
This discussion should clarify how although attention appears to be similarly
concentrated in the different media sources from a purely statistical perspective, the way
that it is distributed can be different between the sources. In the pie graphs in Figures 5.3,
5.4, 5.5, and 5.6 that I previously discussed, coverage by topic is different in each media
source. A further graphical representation of the difference between blogs, Twitter, and
The New York Times front-page datasets, the stacked bar graph in Figure 5.8 shows how
the proportion of coverage given to different topics in each medium differs. In Figure 5.9,

79
there is a similar figure, but broken down by the percent of coverage towards only policy
issues. The differences in coverage continue to be present in the policy-only analysis,
however these differences are less marked, especially when eliminating categories like
Miscellaneous in Twitter. Therefore, among only policy issues, coverage is more evenly
distributed in all media than across all topics.
(Insert Figures 5.8 and 5.9 about here)
Conclusion
In the introduction to this thesis, I predicted that in an Internet information utopia,
there would be a greater level of diversity of attention in the new media compared to the
traditional media. However, across both blogs and Twitter, in most cases, I observed a
significantly lower level of diversity within a single source (individual blog or Twitter
account) and when combined, the blogosphere and Twitterverse both displayed a similar,
but marginally lower, spread of attention to traditional media sources both in the United
States and in Europe. Therefore, my data indicate an absence of discernable difference in
the spread of attention between the traditional and new media. Using this measure, it
appears that the new media is just more of the same. That is, it is a reflection of what the
traditional media are already covering.
However the way that this coverage is distributed is moderately different,
especially on Twitter where a high percentage of non-policy coverage was observed.
Overall though, the range of issues discussed is not observed to be statistically
significantly different. The way that is distributed is noticeably different. Still, the
Internet media has not lived up to its potential of distributing coverage to a wide variety
of traditionally little mentioned topics. Major topics covered transcend the type of media.

80
Boydstun (2013) might attribute this to “agenda congestion,” or the idea that it is hard to
get new issues onto the media agenda (59).
Gatekeepers, such as newspaper reporters, editors, and publishers, typically
dictate what is covered in the news (Shoemaker and Vos 2009, Gans [1979] 2004). Often,
these governance decisions are based on what “sells.” Thus, these behind-the-scenes
forces are typically considered to be responsible for the relatively low levels of diversity
of attention seen in the traditional media. Boydstun (2013) confirms this finding. She
writes, “First, the front-page agenda is small. The scarcity of attention and the issue
‘competition’ it creates exacerbates the already disproportionate nature of how news
outlets process information, contributing to the aggregate patterns in the news” (141).
The new media offered the potential to eliminate many of these gates and factors.
Baumgartner and Chaqués (2012) confirm a similarly low level of diversity in Spanish
newspapers. My own research confirms that.
Though my analysis cannot confirm exactly what causes a concentrated spread of
attention across policy topics, the influence of gatekeepers in the online media is one
possibility. However, some authors, including David Karpf (2012b), disagree. He writes,
“Media content is now spread through Twitter and the blogosphere, bypassing traditional
gatekeepers” (7). I partially disagree. It is clear that there is something impeding an
explosion in the spread of attention in the blogosphere and Twitterverse. It is possible
that in lower trafficked sources than those that I analyzed that this would be true.
However, the fact is not many people are reading those sources and thus their political
impact is limited. The sources in my dataset are likely to have a greater impact on politics
and political communication. Karpf does somewhat acknowledge this. He writes,

81
“Meanwhile, a variety of institutional blogs have served to augment the existing web
based offerings of longstanding media, social, and political institutions. In the process,
blogs have created new pathways into elite public discourse. Not all elite political blogs
are created equal” (64). I hold that the elite nature of these blogs that are just “more of the
same” is important. They are the blogs that are actually read and the ones that are likely
to form a new, online political institution much in the way that newspapers have in the
past. Further, it is obvious that given the links to traditional companies in the online
media, there is a certain level of gatekeeping occurring. The data lend support to this
possibility given the similarity in coverage to the traditional media. While Karpf may be
on to something, I think that my analysis contradicts his outright assertion. Shoemaker
and Vos (2009) confirm my suspicion and argue that while gatekeeping has certainly
changed in the transition to the new media, it is not going to completely disappear
anytime soon. The challenge they say is that it is more difficult to study and measure
these forces in a highly dynamic environment (58-59, 130-131).
Earlier, I also discussed mimicking behaviors in the media and between different
types of media. Since many online news sources included in my datasets do not have the
same number of reporters as a newspaper might, they are often forced to rely on others’
reporting and we see imitation in coverage (Boczkowski 2009, Phillips 2010). Therefore
similar topics are frequently covered. This is another possible explanation. Boydstun,
Hardy, and Walgrave’s (N.d.) media storms (explained in Chapter 2), could be another
possible explanation for this level of attention spread. Like other types of media, the new
media tends to concentrate itself around a few issues that are the most salient at any given
point in time. What I can confidently confirm though is that in my selected new media

82
sources, there is not a statistically significant difference in spread of attention across my
set of topics than the traditional media displays.

83
Table 5.1: Blog Entropy Values
ID Blog Total
Observations
HHI N_HHI Entropy Total Policy
Observations
Entropy-Policy
Only
Percent Policy
Coverage
1 American
Thinker
240 0.16 0.13 0.73 221 0.73 92.08%
2 Andrew Sullivan 614 0.14 0.10 0.74 310 0.76 50.49%
3 Ann Althouse 795 0.12 0.09 0.76 515 0.76 64.78%
4 Atlas Shrugs 798 0.25 0.22 0.59 583 0.47 73.06%
5 Blog of Legal
Times
765 0.18 0.15 0.64 687 0.63 89.80%
6 Daily Kos 564 0.31 0.28 0.56 493 0.53 87.41%
7 Digby/Hullabaloo 649 0.17 0.13 0.68 532 0.64 81.97%
8 Drezner 416 0.23 0.20 0.56 352 0.50 84.62%
9 Elder of Ziyon 790 0.67 0.66 0.23 654 0.05 82.78%
10 FiveThirtyEight 250 0.43 0.41 0.39 226 0.36 90.40%
11 Hot Air 572 0.21 0.18 0.66 477 0.66 83.39%
12 Informed
Comment
357 0.27 0.24 0.59 312 0.55 87.39%
13 Lawyers, Guns,
and Money
625 0.11 0.07 0.80 391 0.82 62.56%
14 Long War
Journal
765 0.49 0.47 0.24 758 0.24 99.08%
15 Mental Recession 524 0.12 0.09 0.71 456 0.70 87.02%
16 Michelle Malkin 752 0.18 0.14 0.71 666 0.71 88.56%
17 New Civil Rights
Movement
715 0.21 0.18 0.64 579 0.55 80.98%
18 Newsbusters 795 0.14 0.11 0.74 646 0.70 81.26%
19 Patterico's
Pontifications
330 0.20 0.17 0.63 285 0.59 86.36%
20 Redstate 624 0.17 0.14 0.70 494 0.72 79.17%
21 Sultan Knish 343 0.15 0.12 0.68 265 0.62 77.26%
22 Talking Points
Memo
520 0.19 0.16 0.61 485 0.60 93.27%
23 The Cable 416 0.48 0.46 0.35 405 0.34 97.36%
24 The Lonely 495 0.15 0.12 0.73 459 0.76 92.73%

84
Conservative
25 The Tory Diary 420 0.94 0.94 0.05 408 0.00 97.14%
26 TruthDig 781 0.11 0.07 0.77 622 0.78 79.64%
27 Uppity
Wisconsin
402 0.65 0.63 0.28 396 0.28 98.51%
28 Virginia Right 324 0.11 0.07 0.75 268 0.72 82.72%
29 Yid With the Lid 215 0.14 0.11 0.68 181 0.65 84.19%
Combined 15,856 0.11 0.08 0.77 13,126 0.75 82.78%
Mean 547 0.26 0.24 0.59 453 0.57 84.00%
Median 564 0.18 0.15 0.66 459 0.63 84.62%
Min 215 0.11 0.07 0.05 181 0.00 50.49%
Max 798 0.94 0.94 0.80 758 0.82 99.08%

85
Table 5.2: Twitter Entropy Values
ID Account (@) Total
Observations
HHI N_HHI Entropy Total Policy
Observations
Entropy-Policy
Only
Percent Policy
Coverage
1 ABC 740 0.11 0.08 0.77 495 0.73 66.89%
2 big_picture 427 0.23 0.20 0.52 138 0.26 32.32%
3 breakingnews 760 0.22 0.19 0.65 559 0.51 73.55%
4 CNN 715 0.11 0.08 0.77 502 0.67 70.21%
5 cnnmoney 708 0.11 0.08 0.76 635 0.77 89.69%
6 davos 193 0.13 0.09 0.68 149 0.64 77.20%
7 ESPN 674 0.86 0.85 0.10 2 0.23 0.30%
8 gizmodo 705 0.26 0.23 0.51 415 0.43 58.87%
9 instyle 723 0.64 0.63 0.20 8 0.25 1.11%
10 io9 685 0.30 0.27 0.46 167 0.49 24.38%
11 latimes 738 0.08 0.04 0.83 464 0.81 62.87%
12 life 622 0.23 0.20 0.56 167 0.66 26.85%
13 mental_floss 693 0.25 0.22 0.59 197 0.77 28.43%
14 newscientist 679 0.22 0.19 0.58 455 0.53 67.01%
15 newyorkpost 744 0.14 0.11 0.71 394 0.66 52.96%
16 nprnews 719 0.09 0.05 0.83 513 0.79 71.35%
17 nytimesphoto 620 0.23 0.20 0.58 325 0.51 52.42%
18 politico 713 0.34 0.32 0.55 325 0.51 45.58%
19 rollingstone 692 0.84 0.83 0.14 29 0.61 4.19%
20 slashdot 740 0.23 0.20 0.62 654 0.59 88.38%
21 socialmedia2day 726 0.53 0.51 0.34 184 0.57 25.34%
22 telegraphnews 740 0.43 0.41 0.47 623 0.34 84.19%
23 todayshow 694 0.19 0.16 0.61 138 0.67 19.88%
24 tvguide 711 0.90 0.89 0.09 9 0.42 1.27%
25 usweekly 684 0.79 0.78 0.16 19 0.30 2.78%
26 whitehouse 639 0.08 0.05 0.82 468 0.82 73.24%
27 wired 724 0.17 0.13 0.65 393 0.62 54.28%
28 yahoonews 695 0.11 0.07 0.78 465 0.70 66.91%
Combined 18,903 0.11 0.08 0.77 9216 0.80 48.75%
Mean 675 0.32 0.29 0.55 318 0.57 47.23%
Median 706.5 0.23 0.20 0.59 359 0.60 53.62%

86
Min 193 0.08 0.05 0.09 2 0.23 0.30%
Max 760 0.90 0.89 0.83 654 0.82 89.69%

87
Table 5.3: Traditional Media Source Entropy Values
ID Source Total Observations HHI N_HHI Entropy Total Policy
Observations
Entropy-
Policy Only
Percent
Policy
Coverage
1 NYT Front Page 31,034 0.10 0.06 0.83 27,521 0.83 88.68%
2 NYT Front Page Quarterly Averages 705.5 - - 0.79 - 0.79 -
3 NYT Index 49,126 0.07 0.04 0.88 39,927 0.88 81.27%
4 El Pais 50,770 0.09 0.05 0.86 41,610 0.85 81.96%
5 El Mundo 44,858 0.11 0.07 0.82 36,919 0.79 82.30%
6 Danish News Radio 191,564 0.19 0.16 0.74 180,706 0.73 94.33%
7 Times of London 21,844 0.07 0.03 0.89 17,856 0.88 81.74%
8 Neue Zürcher Zeitung 8,558 0.11 0.07 0.81 8,477 0.85 99.05%
Mean 49,807 0.10 0.07 0.83 50,431 0.82 87.05%
Median 37,946 0.10 0.06 0.82 36,919 0.84 82.30%
Min 706 0.07 0.03 0.74 8,477 0.73 81.27%
Max 191,564 0.19 0.16 0.89 180,706 0.88 99.05%

88
Table 5.4: Percentage of Coverage by Topic and Source
Topic NYT Blogs Twitter
Macroeconomics (1) 3.11% 2.90% 1.40%
Civil Rights (2) 2.95% 6.09% 0.95%
Health (3) 5.80% 3.05% 2.96%
Agriculture (4) 0.54% 0.20% 0.37%
Labor and Immigration (5) 2.41% 2.45% 1.44%
Education (6) 2.94% 1.02% 0.97%
Environment (7) 1.14% 0.78% 0.54%
Energy (8) 0.96% 0.78% 0.43%
Transportation (10) 1.91% 0.67% 1.18%
Law & Crime (12) 6.73% 8.37% 6.69%
Social Welfare (13) 0.88% 0.51% 0.08%
Housing (14) 1.32% 0.11% 0.65%
Banking & Domestic Commerce (15) 4.02% 2.69% 3.33%
Defense (16) 14.43% 5.16% 1.61%
Science & Technology (17) 2.32% 1.51% 8.62%
Foreign Trade (18) 0.82% 0.23% 0.31%
International Affairs (19) 20.47% 19.49% 10.81%
Government Operations (20) 12.75% 20.75% 5.48%
Public Lands (21) 0.87% 0.11% 0.07%
State and Local Government (24) 2.30% 5.92% 0.85%
Weather (26) 1.85% 0.11% 1.09%
Fires (27) 0.42% 0.18% 0.81%
Arts and Entertainment (28) 2.48% 2.36% 18.34%
Sports (29) 4.10% 1.89% 10.14%
Death Notices (30) 0.86% 0.42% 0.73%
Religion (31) 1.06% 2.09% 0.37%
Miscellaneous (99) 0.55% 10.16% 19.77%

89
Figure 5.1: Comparison of Low, Moderate, and High Entropy for Blogs
Example of Low Entropy: The Tory Diary (Blog)
H=0.05
Example of Moderate Entropy: Fivethirtyeight (Blog)
H=0.39
Example of High Entropy: Lawyers, Guns, and Money (Blog)
H=0.80
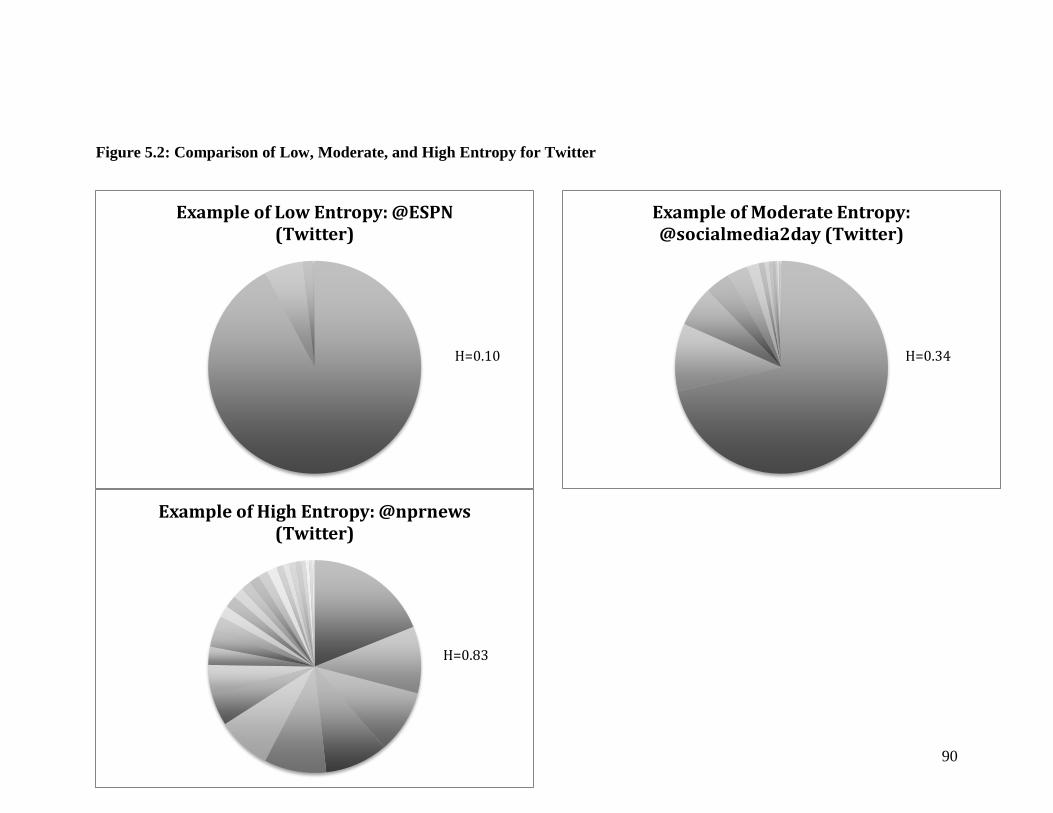
90
Figure 5.2: Comparison of Low, Moderate, and High Entropy for Twitter
Example of Low Entropy: @ESPN (Twitter)
H=0.10
Example of Moderate Entropy: @socialmedia2day (Twitter)
H=0.34
Example of High Entropy: @nprnews (Twitter)
H=0.83

91
Figure 5.3: Pie Graph of Blogosphere Diversity
Government Operations
International Affairs
Law & Crime
Civil Rights
State and Local Government Administration
Defense
Health
Macroeconomics
Banking & Domestic Commerce
Labor and Immigration
Arts and Entertainment
Religion
Sports Science & Technology
Education
Environment
Energy
Transportation Social Welfare
Death Notices
Foreign Trade
Agriculture
Fires Housing
Public Lands Weather
Other, miscellaneous, uncodeable, and human
interest
Coverage by Topic in Blogs

92
Figure 5.4: Pie Graph of Twitter Diversity
Arts and Entertainment
International Affairs
Sports
Science & Technology
Law & Crime Government Operations
Banking & Domestic Commerce
Health Defense Labor and Immigration
Macroeconomics
Transportation
Weather
Education Civil Rights
State and Local Government
Administration
Fires Death Notices
Housing
Environment Energy
Agriculture
Religion
Foreign Trade
Social Welfare
Public Lands
Other, miscellaneous, uncodeable, and human
interest
Coverage by Topic on Twitter

93
Figure 5.5: Pie Graph of New York Times Front-page Diversity
International Affairs
Defense
Government Operations
Law & Crime
Health
Sports Banking & Domestic
Commerce
Macroeconomics
Civil Rights
Education
Arts and Entertainment
Labor and Immigration
Science & Technology
State and Local Government Administration
Transportation Weather
Housing
Environment
Religion
Energy
Social Welfare Public Lands Death Notices
Foreign Trade Agriculture
Fires Other, miscellaneous,
uncodeable, and human interest
Coverage by Topic on The New York Times Front Page
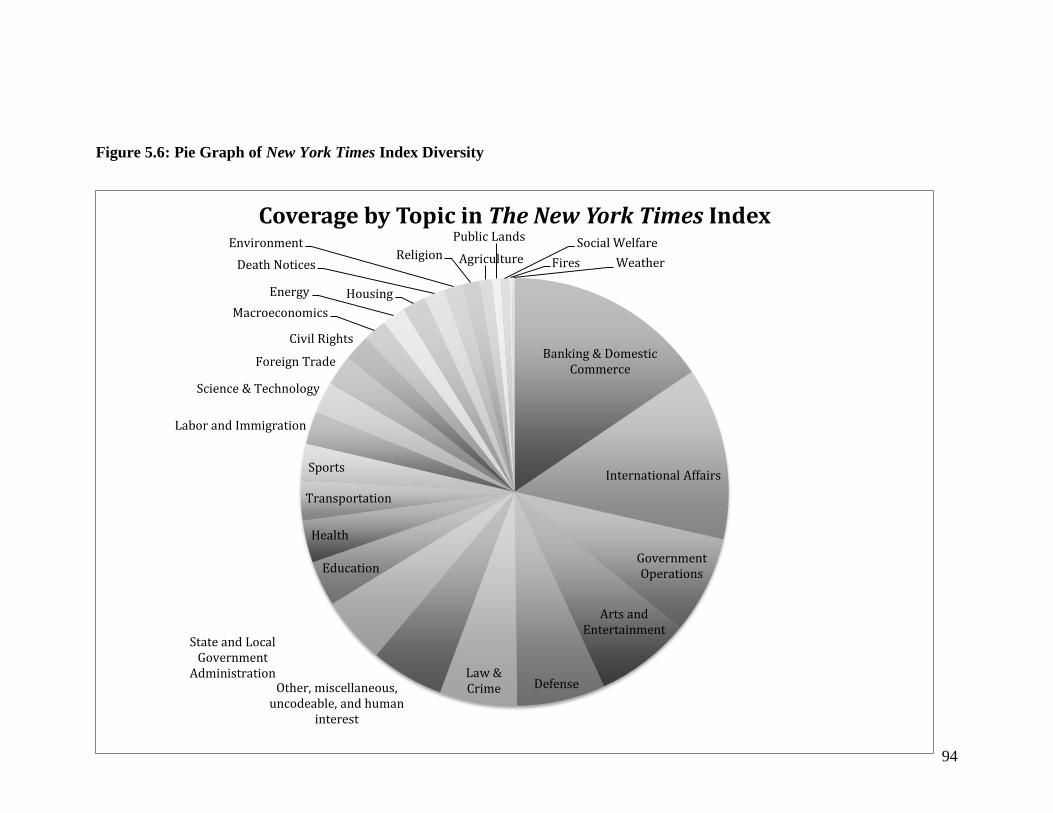
94
Figure 5.6: Pie Graph of New York Times Index Diversity
Banking & Domestic Commerce
International Affairs
Government Operations
Arts and Entertainment
Defense Law & Crime Other, miscellaneous,
uncodeable, and human interest
State and Local Government
Administration
Education
Health
Transportation
Sports
Labor and Immigration
Science & Technology
Foreign Trade
Civil Rights
Macroeconomics
Energy Housing
Death Notices
Environment Religion Agriculture
Public Lands Social Welfare
Fires Weather
Coverage by Topic in The New York Times Index

95
Figure 5.7: Policy versus Non-Policy Coverage in The New York Times, Blogs, and Twitter
Policy vs. Non-Policy Coverage in The New York Times
Policy
Non-Policy
Policy vs. Non-Policy Coverage on Twitter
Policy
Non-Policy
Policy vs. Non-Policy Coverage in Blogs
Policy
Non-Policy
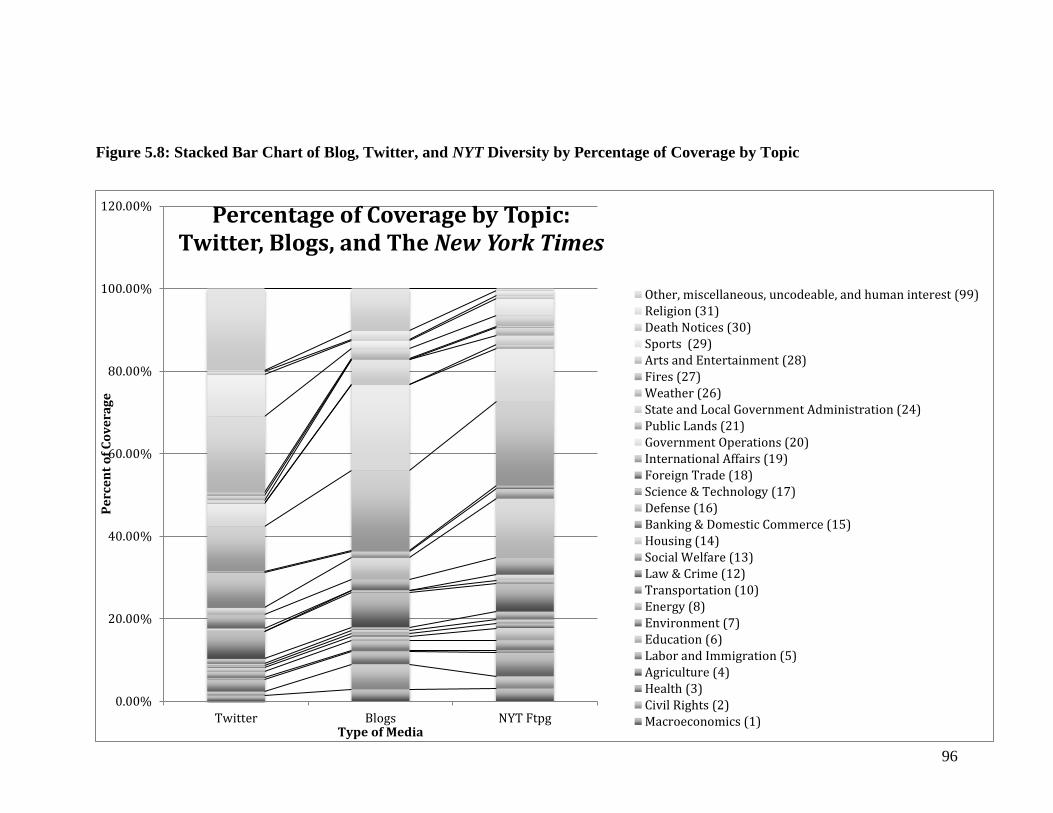
96
Figure 5.8: Stacked Bar Chart of Blog, Twitter, and NYT Diversity by Percentage of Coverage by Topic
0.00%
20.00%
40.00%
60.00%
80.00%
100.00%
120.00%
Twitter Blogs NYT Ftpg
Pe
rce
nt
of
Co
ve
rag
e
Type of Media
Percentage of Coverage by Topic: Twitter, Blogs, and The New York Times
Other, miscellaneous, uncodeable, and human interest (99)Religion (31)Death Notices (30)Sports (29)Arts and Entertainment (28)Fires (27)Weather (26)State and Local Government Administration (24)Public Lands (21)Government Operations (20)International Affairs (19)Foreign Trade (18)Science & Technology (17)Defense (16)Banking & Domestic Commerce (15)Housing (14)Social Welfare (13)Law & Crime (12)Transportation (10)Energy (8)Environment (7)Education (6)Labor and Immigration (5)Agriculture (4)Health (3)Civil Rights (2)Macroeconomics (1)

97
Figure 5.9: Stacked Bar Chart of Blog, Twitter, and NYT Diversity by Percentage of Coverage by Topic for Policy Relevant
Topics Only
0%
10%
20%
30%
40%
50%
60%
70%
80%
90%
100%
Twitter Blogs NYT Ftpg
Pe
rce
nt
of
Po
licy
Co
ve
rag
e
Type of Media
Percentage of Coverage by Topic (Policy Topics Only): Twitter, Blogs, and The New York Times State and Local Government Administration (24)
Public Lands (21)
Government Operations (20)
International Affairs (19)
Foreign Trade (18)
Science & Technology (17)
Defense (16)
Banking & Domestic Commerce (15)
Housing (14)
Social Welfare (13)
Law & Crime (12)
Transportation (10)
Energy (8)
Environment (7)
Education (6)
Labor and Immigration (5)
Agriculture (4)
Health (3)
Civil Rights (2)
Macroeconomics (1)
98
Chapter 6: Changing Time, Changing Coverage
The totality of information in a given source is certainly relevant to measure, as I
did in the previous chapter. However, media are consumed on a daily basis. Nobody
(except for researchers like myself) reads hundreds of day’s worth of Tweets or blog
posts in one sitting. Instead, they might read a few hundred tweets each day or a handful
of blog posts. Likewise, people read a daily newspaper, or at least its online version
comprised of the day’s stories, each day. Most people do not read a week’s worth of
newspapers all at once. Therefore, it is also important to analyze how coverage changes
over time.
In this chapter, I will analyze the amount of coverage given to different topics
throughout time and the way which that coverage changes over time in different media
sources and how attention given to individual topics within those sources changes over
time. I will also make suggestions as to why that may be or may not be different between
traditional and new media sources. Additionally, I will examine the percent changes in
coverage to different topics and within different sources and utilize the measure of
kurtosis to search for differences between the traditional and new media.
Friction in Media Agendas
Using this information, I will assess the amount of friction in different media
sources, that is, how easily coverage changes over time. A system with high friction
would exhibit little change in coverage over time, but when there is a change, that change
would be drastic. On the contrary, a system with low friction exhibits frequent changes of
variable size. According to Jones et al. (2009), this type of friction is present in almost all
institutions. Baumgartner et al. (2009) similarly argue that many institutions show this

99
type of “stick-slip dynamic.” Distributions like this are called leptokurtic distributions
(607). This friction can have powerful effects. They explain:
Friction means that decision makers underrespond to changes in the severity of
problems when these remain below some threshold of urgency, focusing attention
instead on those few areas where concerns are so great that they must be attended
to immediately. However, in politics, thresholds are context dependent, not fixed.
Further, the model is not balanced: increases in attention may be more subject to
extremes than decreases. (608)
This has been well documented in various institutions including Congress, the presidency
and the media. Baumgartner and Jones ([1993] 2009), call this punctuated equilibrium.
Institutions, including the media, respond to events and attention quickly shifts to a new
topic. Therefore, I expect the media in this study to behave no differently. However, if
the Internet utopia were realized, I would expect a low-friction environment without
these volatile shifts and the Internet media would rather be characterized by smooth shifts
in attention over time.
Analyzing Changes Over Time in Institutions
Many researchers use this approach to examine changes within systems, and
particularly on political agendas. Baumgartner et al. (2009) say that “We can assess these
dynamics easily by looking at the left- and right-hand tails of the distributions” (608). I
will use the same method. They also write that, “Virtually all distributions we have
observed have a positive skew” (608). Based on my data up to this point, I also expect
my distributions of changes in attention (coverage) over time to be positively skewed,
notably so in the traditional media. In this study, Baumgartner et al. look at a variety of

100
sources of data including legislative hearings, elections, executive orders, budgets, and
the media, as represented by The New York Times, in numerous countries. They find
support for their hypotheses that changes in attention to different policy topics is
positively skewed. They also turn to the measures of kurtosis and l-kurtosis that I will use
in this study. In Jones et al.’s (2009) study of budgets they also use the measure of
kurtosis.
In Jones and Baumgartner (2005), the authors examine changes in attention over
time to different policy topics in budgets and in Congress. Their analysis of changes in
attention over time will be used as a model for my own analysis in addition to the
aforementioned articles. The widespread use of this type of analysis indicates that it is a
strong way to study changes in attention, or in my case coverage, over time. This is
important because, “Institutions and political actors are not only affected by constraints
and resistance to change, but also to cascading and mimicking effects, processes which
have the same effects, but possibly for different reasons, as high decision-making costs”
(Baumgartner et al. 2009, 616). I expect to find similar mimicking effects in media
sources, including between the traditional and new media. Therefore, this type of analysis
will help to get at the possible sources of that mimicking behavior.
Boydstun (2013), in her study of The New York Times, uses many of the methods
initially used by Baumgartner and Jones in multiple studies. She also turns to kurtosis and
l-kurtosis to measure the change, and namely explosiveness of the media agenda in the
Times. She finds that, “the Times front-page is highly skewed, and highly explosive.
These patterns are not only stark in the abstract, but also when compared to other political
agendas” (221). I expect my own analysis of her data to produce confirmatory results.

101
She also provides thresholds for comparison that I will use when discussing the results of
my own analysis. She further confirms that l-kurtosis is the superior choice of statistic to
use when studying agendas based on its use in other similar studies (220). She verifies
her empirical analysis with the use of simulations that emphasize the importance of
positive-feedback in producing a highly explosive and skewed agenda like observed in
the Times. Her analysis suggests that this pattern is common across many types of media
(233). I will keep Boydstun’s experience in mind when conducting my own analysis, as it
is largely an extension of hers. My own will expand the scope to a directly comparable
study of international traditional media sources and new media sources.
Given the relatively short period of data collection for my new media datasets, I
have chosen to analyze this data on a weekly, rather than monthly basis. Since I analyze
the new media data on a weekly basis, I also analyze the traditional media on a weekly
basis to keep my analysis consistent.
Dynamic Coverage
First, I will discuss the overall number of stories in different sources to a given
topic over time. For this analysis, the data is broken down by topic and source. In this
analysis over time, punctuations are clear and generally occur in response to significant
policy events. In the blog and Twitter datasets, many of these punctuations occur at the
same time given the overlapping data collection periods. In the data on the Times, similar
punctuations can be seen in response to specific events.
The first example I will use is on the topic of health (Topic 3). In both the blog
and Twitter datasets, a large up shoot in coverage on health is seen in both types of media
in response to the US Supreme Court’s decision on the Affordable Care Act where five

102
justices voted to uphold the law and its individual mandate provision. This is an example
of the punctuated equilibrium seen in many different types of agendas. In Figure 6.1, line
graphs over time for all types of media on the topic of health can be seen. In both the
Twitter and blog graphs, the spike in late June and early July is in response to the
Supreme Court’s decision. The graph for the Times does not overlap with the same time
period, so no direct comparison can be made. However, it is important to note that there
is a certain level of sustained coverage and then spikes in response to specific policy
events in all cases.
(Insert Figure 6.1 about here)
This analysis also reveals the level of friction present in the different types of
media. All of the types of media here display relatively high levels of friction given that
they respond sharply to events. That is, coverage tends to stay relatively constant for a
certain period of time and then “slips” upwards or downwards in response to a specific
event. That is particularly obvious in both the Twitter and blog data over a short period of
time, where the response to the Supreme Court’s healthcare decision, for example, is seen
as a dramatic increase in coverage directed towards a specific topic.
Looking at the percent change in coverage to a specific topic in a certain type of
media over time is suggestive of that friction as well. When there are significant percent
changes in coverage to a topic over time, that media is displaying higher friction. In
Figure 6.2, I have presented three corresponding charts reflecting the percent change in
coverage to the topic of health in the same three media over the same period of time as in
Figure 6.1. The spikes in these graphs indicate where there was a substantial change in
the amount of coverage in a type of media from one week to the next. The larger the

103
spike, the higher the percent-change, and consequently the higher the friction in that type
of media.
(Insert Figure 6.2 about here)
Looking at these three graphs, we see data on one topic only. Note that the y-axis
scales are all slightly different given differences in the datasets. Overall, the Times
displays the highest level of friction of the three types of media. In one case, there was
over a 1000% change in coverage towards health on the front page, albeit in late 1997.
Twitter displays the lowest friction with only case where it was above a 100% change.
The blog data shows a level of friction somewhere in between the microblogging
platform on Twitter and the traditional media front page of The New York Times with
percent changes sometimes over 400%. In these three graphs, the Times appears to have
the most sustained discussion of the topic of health with very few significant drops.
Going back to Figure 6.1, it is clear that coverage is generally sustained on somewhere
between one and five stories per week on the topic of health on the front page.
To expand this analysis, I will now examine the same graphs for another policy
issue, Federal Government Administration (Topic 20). This topic includes all coverage of
the actual administration and running of the federal government and also federal
elections, including presidential and congressional elections. Given the data collection
period for my blog and Twitter data took place in both a presidential and congressional
election year, there was significant coverage devoted to this topic during the period. In
Figure 6.3, I have presented an analogous display of graphs on this topic as I presented
for health in Figure 6.1.
(Insert Figure 6.3 about here)

104
In all three panels, the graph displays a notable amount of coverage given to the
topic of the federal government over time. There is not a single large punctuation in
attention comparable to that in the health care graphs. However, there are several smaller
jumps in what is a larger sustained conversation. Given the encompassing nature in this
topic and diversity of events that might cause a jump in coverage, this is explainable.
Attention might jump if there were a presidential debate, a specific candidate said
something controversial, or if there was a large debate around the nomination of a
Cabinet member. Given this, the more frequently volatile nature of coverage is
understandable.
Again, in Figure 6.4, I have presented the percent change in coverage over time
for the federal government administration like I did for all three types of media for their
coverage of health in Figure 6.2. This data largely confirms what I observed about the
level of friction with respect to the health topic previously in this chapter. Overall,
Twitter has the least amount of friction and the smallest percent changes in coverage.
Across time, it actually appears that blogs and the Times display similar levels of friction,
however in certain cases the Times displays significantly higher percent changes in
coverage. My data do not, however, give me the ability to say that if my blog data was
extended to a longer time frame, that I would never see such an extreme change in blogs
like observed in the Times.
(Insert Figure 6.4 about here)
This trend is also explainable. On Twitter, it is easy to instantly respond to an
event with a large burst of coverage. There is virtually no additional cost or quite frankly,
much effort needed, to send another Tweet on a topic. In the Times, one story is very
105
“expensive” given the highly finite nature of space on the front page. Although blogs are
not governed by nearly the same level of constraints as a newspaper, it is still more
difficult to write a blog post and publish it than it is to post a Tweet. Also, some blogs
have some of the traditional gatekeeping forces that are typically associated with
traditional media outlets. Given this, blogs displaying a higher level of friction than
Twitter is not surprising. Further, the “cheapness” of Twitter also allows for a sustained
conversation whereas a blog poster must decide what they are going to post about among
many topics. Therefore, a sustained conversation is less likely and changes in topics
covered and in the attention given to a specific topic will be more significant.
I will now turn this analysis towards a non-policy topic, sports (Topic 29). In
Figure 6.5 there are again three graphs showing the attention over time to sports and in
Figure 6.6, there are three graphs showing the percent changes in attention over the same
time period in the same sources for the same topic. The spikes in August in the blog and
Twitter data are in response to the 2012 Summer Olympic Games in London. Thinking
back to Chapter 5, coverage is more sustained for sports on Twitter because the blogs are
overall more policy focused while the Twitter dataset includes accounts such as ESPN.
Again, this non-policy data supports my conclusion that blogs and newspapers are higher
friction environments than the hyper-new media, Twitter.
(Insert Figure 6.5 and 6.6 about here)
Although this analysis of change in attention over time has thus far been rather
basic and not overly complex mathematically, it has revealed much about the different
media environments in the traditional and new media. Twitter, overall, is capable of
sustaining a larger conversation on issues over time given its low cost and ease of

106
authorship. As a result, it is also the media that displays the lowest level of friction. Blogs
and the Times appear to be more similar over time than Twitter is to either of them. Both
are relatively high-friction environments that although capable of sustaining conversation
over time on different topics, these conversations are limited in overall size. My data
analysis is not capable of discussing the scope or diversity within these topic-level
conversations. Ultimately, space in these two types of media is more finite and costs of
authorship are higher.
Using the Measure of Kurtosis to Analyze Changes Over Time
I will now turn to a different type of analysis, bringing all of this data together
across topics. This goes back to the use of kurtosis and l-kurtosis to measure the way that
coverage changes week to week in different types of media. Graphically, this can be
displayed using a frequency-distribution histogram. First, I will analyze my blog data.
Using l-kurtosis, I can assess the level of explosiveness of the combined blog media
agenda. According to Boydstun (2013), a normal distribution has an l-kurtosis of 0.123
and anything higher is considered to be a leptokurtic distribution (220). In Table 6.1, the
number of weekly-topic observations (in essence, the number of observations that can
actually be used in the analysis and excluding zeroes), the kurtosis, and l-kurtosis value
are displayed for all blogs in the dataset as well as the combined value that my graphical
analysis is based on.
The combined blog data, based on 303 weekly-topic observations, has an l-
kurtosis value of 0.36, well above the 0.123 threshold value for a leptokurtic distribution.
Most agendas are leptokurtic, meaning they are highly skewed and explosive (Jones and
Baumgartner 2005, 110-112). All of the individual blogs are also above the threshold,

107
though one barely so, with an l-kurtosis value of 0.13. Uppity Wisconsin, an issue-based,
blog is the most leptokurtic with an l-kurtosis value of 0.70. Most, however, are around
the combined value for the entire blogosphere. Regardless, I can say that the blogosphere
is an explosive agenda.
(Insert Table 6.1 about here)
In Figure 6.7, there is a histogram that is a frequency distribution of all of the
weekly percent-changes in coverage in the combined blog dataset, truncated at 300. This
is a highly skewed distribution. A normal curve is overlaid on the distribution and it is
apparent that this is very far from a normal distribution. Therefore, just as Boydstun
(2013) observed for The New York Times at the monthly level, this media agenda is
highly explosive and highly skewed (217-221). In that respect, the blog agenda appears to
confirm what Boydstun concluded about media agendas in her analysis of The New York
Times.
(Insert Figure 6.7 about here)
Although I used Boydstun’s dataset in my own analysis, she did her analysis of
coverage over time at the monthly level. This is arguably a more appropriate level to
analyze at given the expanse of the period her data covers. However, in seeking to
provide a uniform analysis with my new media data, I have also analyzed her data at the
weekly level. In Figure 6.8, there is another weekly frequency distribution based on the
Times data. In this case, I truncated the distribution at 200. Although Boydstun’s monthly
data had a clear cluster around zero, this data is similarly suggestive though not as
explicit since it is at the weekly level. Still, it is indicative that the Times front page is a

108
skewed and explosive agenda. This is true at both the monthly and weekly level based on
both Boydstun’s and my analysis.
(Insert Figure 6.8 about here)
In Table 6.2, I have provided the number of weekly-topic observations, kurtosis
values, and l-kurtosis values for the Times dataset and the other international, traditional
media datasets I have analyzed in this thesis. At the weekly level, the Times front page
data, based on 6,430 observations, has an l-kurtosis value of 0.25. This value is slightly
lower than what Boydstun (2013) calculated at the monthly level. She calculated an l-
kurtosis value of 0.344 at the monthly level (220). Thus, at the weekly level, the Times
front page is a less explosive agenda. This makes sense, because from one week to the
next, it makes sense that topics might stay on the front page and the change will be less
than it would be from month to month. Conversations are more likely to be sustained in
consecutive weeks than they are in sequential months.
(Insert Table 6.2 about here)
The Times index of all stories that I have also previously analyzed in this thesis
has a slightly higher l-kurtosis value of 0.26. While this difference is inconsequential, I
expected to observe a greater different in explosiveness and skew between the front page
and the index given that conservations on more topics can be more easily sustained
elsewhere in the paper than on the highly competitive front page. Therefore, it appears
that the Times as a whole is a relatively uniformly explosive and skewed agenda.
With respect to the international media, l-kurtosis values on a large number of
observations for all media outlets range from 0.24 to 0.31. Therefore, none of the
international media outlets are particularly more or less skewed or explosive than one

109
another or than their American counterpart. However, it can be concluded that all of these
international media agendas are leptokurtic.
Going back to the new media, in Table 6.3 there is a similar table to that which I
presented for blogs that has the number of observations, kurtosis value, and l-kurtosis
value for all Twitter accounts in my dataset as well as a combined value for this
“Twitterverse.” Overall, the combined l-kurtosis value for all Twitter accounts across all
topics is 0.39, just slightly higher than the overall blogosphere value. Again, most
individual Twitter account l-kurtosis values are clustered around the combined value and
range from 0.14 to 0.58. ABC’s Twitter account with the minimum l-kurtosis value of
0.14 is just slightly leptokurtic and close to the value of a normal distribution, making it
not very explosive. However, again I have observed that Twitter is a highly skewed and
explosive media agenda just like the blogs and to a lesser extent, the Times.
(Insert Table 6.3 about here)
In Figure 6.9, I provide one final frequency distribution of all of the weekly
percent changes for the Twitterverse. For this histogram, I truncated the data at 400.
Again, this agenda is obviously highly skewed with respect to the weekly percent
changes. The frequency distribution here supports that it is the most skewed agenda of
the three presented.
For a basis of comparison, I created a simulated dataset representative of the
Internet utopia envisioned earlier. In this case, it would be a normal distribution across
time where events are discussed in uniformity based on their importance. That is, not all
events are discussed equally, but they are equally distributed across these topics. In order
to do this, I started with the Times front-page dataset that I have used throughout this
110
thesis and I created a new random variable based on a normal distribution with a mean of
3.44 and a standard deviation of 0.0417. These values came from the average number of
stories across all weeks for all topics. Then, using Stata, I created this random normal
variable with a value for each date already in the dataset. Then, I conducted the same type
of data analysis as I did for my real datasets. In Figure 6.10, there is a frequency
distribution based on this random normal variable.
(Insert Figure 6.10 about here)
In this analysis, the distribution had an l-kurtosis value of 0.13, close to the
defined l-kurtosis of a normal distribution of 0.123. In this case, the distribution of
weekly percent changes is highly normal and almost perfectly follows the overlaid
normal distribution curve. Also, most values are clustered around zero, showing that in
the Internet information utopia, there would be higher levels of sustained conversation
across all topics and changes would be smooth rather than the volatile changes in
coverage observed in the actual media datasets I have previously analyzed. This is not a
skewed or overly explosive agenda.
This simulation serves a simple purpose. By comparing not only the l-kurtosis
value of this information utopia to the realized l-kurtosis values of the datasets in my
analysis, but also by looking at the histogram in Figure 6.10 and those in Figures 6.7, 6.8,
and 6.9, it is clear that the actual media, both traditional and new, are not representative
of this Internet utopia. Instead, the new and old media largely mirror each other with
regard to this characteristic. Although certain gains have been realized including less
volatile changes on Twitter and the ability to have a more sustained conversation on a
wider variety of issues, Internet media as they currently stand, while providing a wealth

111
of valuable information, are far from achieving the information paradise that some
scholars once envisioned they might.
Conclusion
Although I analyze a much shorter period of data on the new media than I do on
the traditional media, the conclusions are clear. Again, as was true for the differences in
spread of attention, the new media is far from living up to its promise of an information
utopia with regards to the changes in coverage over time. The media agendas of
newspapers, blogs, and Twitter all are highly explosive and skewed. In contrast to my
predictions in the case of an Internet utopia in my introduction, these media are again
roughly the same. However, the traditional media are slightly more explosive and skewed
than the new media, though only marginally so.
Reflecting back on the predictions made in my introduction, attention in the new
media does not shift any more smoothly over time than attention in the traditional media
does. Rather, like others have observed in the traditional media and in other agendas,
changes over time are highly volatile (Boydstun 2013, Baumgartner and Jones [1993]
2009, Jones and Baumgartner 2005, Baumgartner and Chaqués 2012). These shifts are
indicative of a media environment high in friction. The view held by Nahon et al. (2011)
that coverage in the new media is highly volatile appears to hold true. Regardless of
subtle differences, it is still explosive. Graphically, it is evident that these shifts over time
are dramatic and marked. The Internet clearly moves in fitful bursts like many other
things in society. These effects are clearly observable in all types of media included in
my analysis. The fitful changes are also indicative of a media environment governed by a
status quo effect. What was in the news today is likely to be in the news tomorrow.

112
However, when an important event occurs, the media dramatically switch their coverage
to that. If the status quo effect were not present in the new media, it would be highly
unlikely for the media to change in such a volatile manner.
Despite the opportunities for sustained conversation on a wide variety of topics on
the Internet over time and the small improvements that have been made, like in other
media agendas, the Internet is affected by events in the real world. Media online and
offline change in response to events. Baumgartner and Jones’s (2009) punctuated
equilibrium is at work again. As should be clear, the media are highly dynamic and
constantly changing.

113
Table 6.1: Weekly Kurtosis Values for Blogs
Blog Observations Kurtosis L-Kurtosis
American Thinker 28 12.38 0.26
Andrew Sullivan 100 8.66 0.31
Ann Althouse 111 10.07 0.24
Atlas Shrugs 86 27.41 0.35
Blog of Legal Times 71 7.69 0.25
Daily Kos 80 21.09 0.43
Daniel Drezner 21 4.92 0.24
Elder of Ziyon 33 11.20 0.40
FiveThirtyEight 15 6.46 0.34
Hot Air 77 12.83 0.26
Digby/Hullabaloo 76 9.20 0.24
Informed Comment 41 4.37 0.13
Lawyers, Guns, and Money 114 55.44 0.51
Long War Journal 28 3.16 0.15
Mental Recession 35 9.14 0.31
Michelle Malkin 65 4.35 0.17
New Civil Rights Movement 66 5.09 0.18
Newsbusters 117 6.12 0.25
Patterico's Pontifications 40 4.57 0.23
Redstate 92 16.95 0.41
Sultan Knish 28 5.37 0.26
Talking Points Memo 54 8.23 0.20
The Cable 25 4.16 0.21
The Lonely Conservative 77 5.41 0.21
The Tory Diary 14 6.56 0.30
TruthDig 121 28.68 0.33
Uppity Wisconsin 20 16.82 0.70
Virginia Right 22 3.77 0.19
Yid With the Lid 34 4.57 0.16
Combined 303 44.14 0.36
Mean 58.31 11.19 0.28
Median 54 7.69 0.25
Min 14 3.16 0.13
Max 121 55.44 0.70

114
Table 6.2: Weekly Kurtosis Values for Traditional Media
Source Observations Kurtosis L-Kurtosis
New York Times Front Page 6,430 30.36 0.25
New York Times Index 15,081 10.12 0.26
El Mundo 2,302 26.49 0.26
El Pais 2,378 24.24 0.27
Neue Zürcher Zeitung 2,417 11.86 0.24
Times of London 6,365 13.20 0.31
Danish News Radio20
- - -
Mean 5,828.83 19.38 0.26
Median 4,391 18.72 0.26
Min 2,302 10.12 0.24
Max 15,081 30.36 0.31
20
Due to issues with the dates in the initial dataset, calculations over time were not
possible.

115
Table 6.3: Weekly Kurtosis Values for Twitter
Twitter Account (@) Observations Kurtosis L-Kurtosis
abc 104 4.44 0.14
big_picture 20 12.52 0.45
breakingnews 93 6.23 0.21
cnn 103 12.72 0.27
cnnmoney 99 6.14 0.23
davos 10 3.36 0.37
espn 10 3.25 0.27
gizmodo 58 9.35 0.29
instyle 22 10.00 0.33
io9 48 4.91 0.23
latimes 126 9.04 0.21
life 39 8.46 0.25
mental_floss 75 42.28 0.34
newscientist 59 13.67 0.39
newyorkpost 92 6.96 0.16
nprnews 124 24.55 0.29
nytimesphoto 24 8.68 0.43
politico 78 13.26 0.24
rollingstone 19 4.65 0.28
slashdot 90 11.07 0.22
socialmedia2day 33 12.82 0.41
telegraphnews 62 8.93 0.26
todayshow 51 38.67 0.58
tvguide 15 3.32 0.27
usweekly 25 6.29 0.29
whitehouse 51 4.35 0.14
wired 69 9.07 0.17
yahoonews 102 9.96 0.29
combined 228 78.34 0.39
Mean 60.75 11.03 0.29
Median 58.5 8.98 0.27
Min 10 3.25 0.14
Max 126 42.28 0.58

116
Figure 6.1: Attention Over Time to Health in Blogs, Twitter, and The New York
Times

117
Figure 6.2: Percent Change in Coverage to Health in Blogs, Twitter, and The New
York Times

118
Figure 6.3: Attention Over Time to Federal Government Administration in Blogs,
Twitter, and The New York Times

119
Figure 6.4: Percent Change in Coverage to Federal Government Administration in
Blogs, Twitter, and The New York Times

120
Figure 6.5: Attention Over Time to Sports in Blogs, Twitter, and The New York
Times

121
Figure 6.6: Percent Change in Coverage to Sports in Blogs, Twitter, and The New
York Times

122
Figure 6.7: Frequency Distribution of the Weekly Percent Change in Coverage in
Blogs
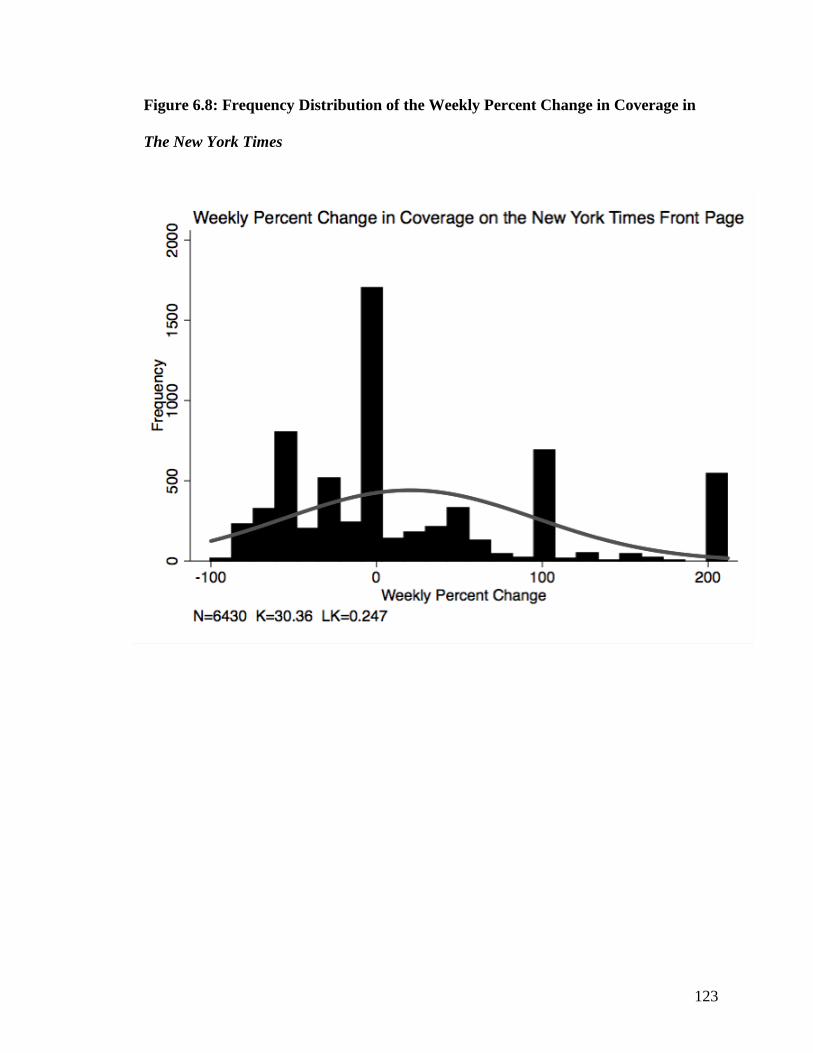
123
Figure 6.8: Frequency Distribution of the Weekly Percent Change in Coverage in
The New York Times

124
Figure 6.9: Frequency Distribution of the Weekly Percent Change in Coverage on

125
Figure 6.10: Frequency Distribution of Weekly Percent Changes for a Random
Normal Distribution Representative of the Internet Utopia

126
Chapter 7: A New Media or More of the Same?
The Internet might be a vast sea of information but when comparing the new
media, in the form of blogs and Twitter, to the mainstay of the traditional media,
newspapers, things functionally just are not so different. Though there are subtle
differences, sometimes showing the “superiority” of the traditional media and sometimes
of the new media, there is not a huge difference in how events, both policy and non-
policy are covered. In many ways, the media are the media. Most differences reveal
themselves at a micro level. The big, macro picture shows a traditional and new media
more similar than would have been predicted in the late 1990s when the Internet was
surging onto the scene.
Returning to my original research questions regarding how far society has come
in realizing the vision of the Internet utopia, from a media information perspective, I can
say with confidence that it has not come very far. This does not mean, however, that all
hope is lost. This thesis presents only one of many ways to measure this phenomenon.
Just as newspapers have long been valuable political tools both for policymakers and the
public, the Internet media can be a platform for change in many of the same ways. And
even though macro-level coverage is not so different, there is still much political potential
for the Internet to serve. In the remainder of this concluding chapter, I will put into
context what these changes mean for the Internet media at large and discuss some
scholars’ views on the democratic potentials of Internet communication. Then, I will
provide suggestions for further research on this topic and close with some parting
thoughts.

127
Summarizing my findings, I found in Chapter 5 that as measured by entropy, the
new media are actually slightly less diverse than the traditional media. However,
attention within these different media agendas is distributed slightly differently, most
notably on Twitter where a high level of non-policy coverage is observed. This coverage
also changes over time as I found in Chapter 6. Both the new and traditional media are
high friction environments. The traditional media are slightly more explosive than the
new media and the changes in attention are a bit more volatile. Despite those subtle
differences, though, coverage in the new media most certainly does not shift smoothly
over time. Changes are highly punctuated.
Remaining Hopes for the Internet
The Internet still offers significant potential to alter the political landscape around
us and it surely has up to this point. Great attention has been given to this topic. Though
the results of my study appear relatively static in their findings, there is still a dynamic
potential for the Internet that I will attempt to briefly share here.
Coleman and Blumler (2009) suggest that the Internet does offer great democratic
potentials and that people seek the diverse array of information available on the Internet.
They suggest that the Internet offers people all around the world the ability to form
groups, exchange ideas, and mobilize for change (117). They argue that “As media
abundance advances, politics intended to inform, reveal, or persuade must vie for the
attention of editors, reporters, and audiences in a far more competitive environment”
(53). In my own research, Twitter’s high percentage of non-policy coverage exemplifies
this competitive tendency. Coleman and Blumler also write, “Whichever period the

128
historians of Internet history might think we are in, it is quite clear that democratic effects
are being realised in ways that have little to do with institutional politics” (178).
Pole (2010) is also optimistic about the action-oriented potential of blogs in
specific and draws on specific examples of policy success and governmental change that
was driven by bloggers. This tendency might not be measured by entropy or kurtosis, but
it is very important in establishing context for thinking about the broader implications of
my results. Davis (2009) discusses the growth of political blogs. He sees the potential of
blogs to affect certain groups of people, at least to small degree (178, 186). However, he
also recognizes the very visible and prominent role that blogs have begun to occupy.
Davis also provides some broad points that shed light on my overall conclusions. He
writes, “Blog content, like traditional media content, is becoming what the audience
wants to read. Competition for audience size already shapes the nature of blog content”
(188). He also points out the commercial pressures that have begun to affect blogs just
like the traditional media (188). My analysis confirms this assertion, but Davis points out
that there are still other important political roles for the new media to occupy.
Writing in the early days of the rapid growth of the Internet, Delli Carpini and
Keeter (2003) posed a dual-choice view of the future of the Internet. They write,
“Whether the emerging information environment will be little more than ‘old wine in
new bottles,’ will further erode the already less than optimal state of civic life or will
usher in a new, more participatory citizenry and responsive government remains an open
question” (131). In the last decade, we have begun to close in on an answer to this
question. Statistically, the Internet media appears to be “old wine in a new bottle.”
However, this does not preclude other actions on the Internet that concern politics.

129
Indeed, even in 2003, Delli Carpini and Keeter saw a growth of information on the
Internet and observed that young people in particular were accessing this information.
They saw that ordinary citizens could play a real role in politics online.
The previous is not an isolated sentiment in the scholarly community. Redden and
Witschge (2010) agree. They write: “Our overwhelming conclusion is that there is an
abundance of news online, but the content of mainstream news outlets is largely the
same” (184). They call this “A startling outcome, in this so-called space of plenty” (184).
I too experienced that feeling of surprise when conducting my initial data analysis.
Redden and Witschge, like Davis, also see positive possibilities for what the Internet can
do especially with the new ways for citizens to respond to and interact with the news they
read.
While advances have been made, many of these changes have been inherently
unequal (Hindman 2009). Hindman argues that the Internet has given political voice and
agency to some, but in an unequal way, and like others, believes that this has resulted in
an elite state, especially for bloggers. There are millions of voices to be heard online, but
only a few are indeed heard. Those voices are from the elites—the types of bloggers
included in my sample. And these elites generally do not represent a diverse cross-section
of society. A majority are white males who are highly educated and live in urban areas.
As we have seen, this coverage is not all that new. Hindman offers a leveled review of
where the Internet lies in American politics. He writes, “the Internet seems to be both
good news and bad news for the political voice of the average citizen. The Internet has
made campaign financing more inclusive, and allowed broad, diffuse interests to organize
more easily. For motivated citizens, vast quantities of information are only a click away”

130
(142). There is something new in front of us; making this new thing something that all
have access to is the next step in making this information really matter and perhaps
finally revolutionizing the kind of information available online.
Also, the mere use of digital media sources has links to higher political efficacy
and levels of civic engagement. So, even if the information consumed is not different,
there may be positive political effects. Gil de Zúñiga, Veenstra, Vraga, and Shah (2010)
find that blog readers in particular exhibit high rates of political efficacy. They say that
they have located “the emergence of a hybrid participation that combines the virtual and
real world realms of political engagement and action—a new digital democracy” (45).
This echoes the arguments others have made. To me, this illustrates the idea that
regardless of the content, the consumption of online media is related to strong civic
engagement. Thus, the Internet, by its very definition, has partially fulfilled some hopes.
Jorba and Bimber (2012) agree, arguing, “After years of debate, there is an emerging
consensus in the literature that positive though small associations exist between digital
media use and certain kinds of civic engagement and political participation” (19). This
entire context suggests a world where positive advances have been made despite
relatively homogenous coverage. This discussion is not meant to make my results
something they are not. I observed significant congruence between coverage in the
traditional and new media. However, in placing my findings on the continuum between
the Internet utopia and the Internet dystopia presented in the introductory chapter, it’s
relevant to present alternative perspectives on the Internet media and its potential political
effects. Future studies might try to account for these other variables and outcomes.

131
Suggestions for Further Research
Though my analysis sought to extend other studies of the media performed under
the auspices of the Policy Agendas Project to the new media, there are numerous ways
that this analysis could be improved and expanded upon. Additionally, there is other
research that can and should be done on this topic to further our understanding of the
powers of the Internet media. To improve on the analysis in this thesis, data from a
greater period of time could be collected and more blogs and Twitter accounts could be
included in the datasets. It would be especially interesting to include more personal blogs
and Twitter accounts rather than solely the elite ones I focused on. This would allow for
conclusions to be drawn about the democratic potentials of the Internet at an individual
level. Personal blogs might have great success at sharing diverse opinions (Coleman and
Blumler 2009, 87-89). It would also be valuable to have traditional and new media
datasets that cover the same time period in order to draw stronger conclusions about
inter-media agenda-setting and to best gauge the extent to which the new media is
influenced by or influences the traditional media and professional journalists. Given the
difficulty in collecting this data using my methods, a keyword search method similar to
that used by Lovett and Baumgartner (2012) would be useful. Assuming appropriate
access to historical Twitter and blog data, this would be an extremely interesting and
valuable point of analysis.
The coding of the datasets I created could also be extended and each blog post or
Tweet could be coded with the more specific four-digit Policy Agendas Topic codes or
even Boydstun’s six-digit topic codes. This would allow for greater specificity in
analysis. There is also significant potential for an investigation into how issues are

132
framed on the Internet versus in the traditional media. Given the highly partisan and
ideological nature of many new media sources, interesting findings might arise out of a
qualitative analysis of how these different topics are discussed.
As others have done, this data could also be matched up with data on the actions
of political institutions like Congress or to public opinion. Again, this research would be
concerned with the agenda-setting capabilities of the new media. Similar research could
also be conducted on new media platforms in other countries besides the United States.
Other research has shown that media agendas (and agendas in general) tend to behave
similarly in other countries (particularly those in Europe). Given the spread of new media
around the world and the existence of datasets on traditional media sources in a variety of
countries, the inclusion of the new media would be powerful in confirming whether the
new media also behave similarly across international boundaries.
The Internet is still highly dynamic and rapidly changing. A lot of research on the
Internet thus far has concerned the democratic potentials of it and the possible digital
divide effects whereby the Internet would be another elite dominated institution where
certain people (particularly the poor or elderly) would not have access to information or
the ability to participate (see Coleman and Blumler 2009, 32-33). Therefore, it is
important to think about who is actually reading the information in the new media? Is it
just the wealthy? The highly educated? A representative sample of the population? Karpf
(2012b) argues, “Simply put, any benefits from the Internet disproportionately accrue to
the already well-off, exacerbating existing inequalities” (95). None of those are probably
complete answers, but that underscores my point. It is important to know who is reading
this information. Readership surveys for newspapers are highly valuable. Thus,

133
measuring the amount of consumption of the new media and identifying who is
consuming that information are logical next steps in this research agenda. Knowing these
things would help to put my, and much other, research on the Internet media in greater
context.
Throughout time, studies of political agendas have shown that while often
dynamic, agendas are highly predictable. My comparison of the media agendas in both
the traditional and new media extends this theory to one more place. Agendas appear to
be consistent. My analysis of the diversity and changes in attention of blogs, Twitter, and
traditional media sources has confirmed this in several types of media. However, it is
important to pay attention as agendas change over time. The agenda of The New York
Times is not exactly the same today as it was in 1900. The Internet is still a rapidly
changing technology. A year from now, much less ten or one hundred years in the future,
it will be a very different environment. Additionally, my suggestions for further research
stand testament to the possibility that according to other measures, the Internet utopia
might be closer to being realized than my analysis indicates. Moving into the future,
keeping a watchful eye on the Internet from a political perspective will be a wise choice
for scholars of political communication.

134
References
An, Jisun, Meeyoung Cha, Krishna Gummadi, and Jon Crowcroft. 2011. “Media
Landscape in Twitter: A World of New Conventions and Political Diversity.”
Presented at the Fifth International AAAI Conference on Weblogs and Social
Media.
Auer, Matthew R. 2011 “The Policy Sciences of Social Media.” Policy Studies Journal
39: 709-736.
Baum, Matthew A., and Tim Groeling. 2008. “New Media and the Polarization of
American Political Discourse.” Political Communication 25: 345-365.
Baumgartner, Frank R., and Bryan D. Jones. [1993] 2009. Agendas and Instability in
American Politics. Chicago: University of Chicago Press.
Baumgartner, Frank R., and Laura Chaqués Bonafont. 2012. “All News is Bad News:
Newspaper Coverage in Spain.” West European Politics. Forthcoming.
Baumgartner, Frank R., Christian Breunig, Christoffer Green-Pedersen, Bryan D. Jones,
Peter B. Mortensen, Michiel Nuytemans, and Stefaan Walgrave. 2009.
“Punctuated Equilibrium in Comparative Perspective.” American Journal of
Political Science 53(3): 603-620.
Benkler, Yochai, and Aaron Shaw. 2010. “A Tale of Two Blogospheres: Discursive
Practices on the Left and Right.” Berkman Center for Internet and Society,
Harvard University.
Berkowitz, Dan. 1990. “Refining the Gatekeeping Metaphor for Local Television News.”
Journal of Broadcasting & Electronic Media 34(1): 55-68.
Boczkowski, Pablo J. 2009. “Technology, Monitoring, and Imitation in Contemporary
News Work.” Communication, Culture & Critique 2: 39-59.
Boydstun, Amber E. 2013. Politics, the Media, and Agenda-Setting: How Policy Issues
Make the News. Chicago: University of Chicago Press. Forthcoming.
Boydstun, Amber E., Anne Hardy, and Stefaan Walgrave. N.d. “An Empirical Anatomy
of Media Storms.” Forthcoming.
Boydstun, Amber E., Jon Moody, and Herschel F. Thomas III. 2010. “Same Day,
Different Agenda? A Comparison of News Coverage Across print, Television,
and Online Media Outlets.” Forthcoming.
Boydstun, Amber E., Shaun Bevan, and H.F. Thomas III. N.d. “Measuring Attention
Diversity.” Forthcoming.
135
Coleman, Stephen. 1975. Measurement and Analysis of Political Systems: A Science of
Social Behavior. New York: John Wiley & Sons, Inc.
Coleman, Stephen, and Jay G. Blumler. 2009. The Internet and Democratic Citizenship:
Theory, Practice, and Policy. Cambridge: Cambridge University Press.
Cook, Timothy E. 1998. Governing With the News: The News Media as a Political
Institution. Chicago: The University of Chicago Press.
Davis, Richard. 2009. Typing Politics: The Role of Blogs in American Politics. Oxford:
Oxford University Press.
Delli Carpini, Michael X., and Scott Keeter. 2003. “The Internet and an Informed
Citizenry.” In The Civic Web: Online Politics and Democratic Values, eds. David
M. Anderson and Michael Cornfield. Lanham: Rowman & Littlefield Publishers,
Inc.
Farrell, Henry, and Daniel W. Drezner. 2008. “The Power and Politics of Blogs.” Public
Choice 134: 15-30.
Gans, Herbert J. [1979] 2004. Deciding What’s News: A Study of CBS Evening News,
NBC Nightly News, Newsweek, and Time. Evanston: Northwestern University
Press.
Gil de Zúñiga, Homero, Aaron Veenstra, Emily Vraga, and Dhavan Shah. 2010. “Digital
Democracy: Reimagining Pathways to Political Participation.” Journal of
Information Technology & Politics 7: 36-51.
Golan, Guy. 2006. “Inter-media Agenda Setting and Global news Coverage: Assessing
the Influence of the New York Times on Three Network Television Evening
News Programs.” Journalism Studies 7: 323-333.
Hamilton, James T. 2004. All the News That’s Fit to Sell. Princeton: Princeton University
Press.
Hermida, Alfred. 2010. “Twittering the News: The Emergence of Ambient Journalism.”
Journalism Practice 4: 297-308.
Hindman, Matthew. 2009. The Myth of Digital Democracy. Princeton: Princeton
University Press.
Jones, Bryan D. and Frank R. Baumgartner. 2005. The Politics of Attention: How
Government Prioritizes Problems. Chicago: University of Chicago Press.

136
Jones, Bryan D., Frank R. Baumgartner, Christian Breuning, Christopher Wlezien, Stuart
Soroka, Martial Foucault, Abel François, Christoffer Green-Pedersen, Chris
Koski, Peter John, Peter B. Mortensen, Frédéric Varone, and Stefaan Walgrave.
2009. “A General Empirical Law of Public Budgets: A Comparative Analysis.”
American Journal of Political Science 53(4): 855-873.
Jorba, Laia, and Bruce Bimber. 2012. “The Impact of Digital Media on Citizenship from
a Global Perspective.” In Digital Media and Political Engagement Worldwide: A
Comparative Study, eds. Eva Anduiza, Michael J. Jensen, and Laia Jorba.
Cambridge: Cambridge University Press.
Karpf, David. 2008. “Measuring Influence in the Political Blogosphere: Who’s Winning
and How Can We Tell?” Institute for Politics, Democracy & the Internet’ Politics
and Technology Review: 33-41.
Karpf, David. 2012a. “Blogosphere Authority Index.” Blogosphere Authority Index.
February 26. http://www.blogosphereauthorityindex.com/ (October 15, 2012).
Karpf, David. 2012b. The MoveOn Effect: The Unexpected Transformation of American
Political Advocacy. New York: Oxford University Press.
Kingdon, John W. 2003. Agendas, Alternatives, and Public Policies. New York:
Longman.
Klotz, Robert J. 2004. The Politics of Internet Communication. Lanham: Rowman &
Littlefield Publishers, Inc.
Lasora, Dominic L., Seth C. Lewis, and Avery E. Holton. 2012. “Normalizing Twitter:
Journalism Practice in an Emerging Communication Space.” Journalism Studies
13: 19-36.
Lippmann, Walter. 1922. Public Opinion. New York: Free Press Paperbacks.
Lovett, John and Frank R. Baumgartner. 2012. “When Is There a Single Media Agenda?”
presented at the annual meetings of the Midwest Political Science Association,
Chicago.
Margolis, Michael, and David Resnick. 2000. Politics as Usual: The Cyberspace
“Revolution.” Thousand Oaks: Sage Publications, Inc.
McCarthy, John D., Jackie Smith, and Mayer N. Zald. 1996. “Accessing Public, Media,
Electoral, and Governmental Agendas.” In Comparative Perspectives on Social
Movements, eds. Doug McAdam, John D. McCarthy, and Mayer N. Zald.
Cambridge: Cambridge University Press.

137
McCombs, Maxwell and Donald L. Shaw. 1972. “The Agenda-Setting Function of Mass
Media.” The Public Opinion Quarterly 36: 176-187.
McCombs, Maxwell and Jian-Hua Zhu. 1995. “Capacity, Diversity, and Volatility of the
Public Agenda: Trends from 1954 to 1994.” The Public Opinion Quarterly 59:
495-525.
McCombs, Maxwell. 2004. Setting the Agenda: The Mass Media and Public Opinion.
Cambridge: Polity Press.
Meraz, Sharon. 2011. “Using Time Series Analysis to Measure Intermedia Agenda-
setting Influence in Traditional Media and Political Blog Networks.” J&MC
Quarterly 88: 176-194.
Nahon, Karine, Jeff Hemsley, Shawn Walker, and Muzammil Hussain. 2011. “Fifteen
Minutes of Fame: The Power of Blogs in the Lifecycle of Viral Political
Information.” Policy & Internet 3(1): 2.
Patterson, Thomas E. 2000. “Doing Well and Doing Good: How Soft News and Critical
Journalism Are Shrinking the News Audience and Weakening Democracy—And
What News Outlets Can Do About It.” John F. Kennedy School of Government
Faculty Research Working Papers Series, Harvard University.
Phillips, Angela. 2010. “Old Sources: New Bottles.” In New Media, Old News:
Journalism & Democracy in the Digital Age, ed. Natalie Fenton. Los Angeles:
Sage.
Pole, Antoinette. 2010. Blogging the Political: Politics and Participation in a Networked
Society. New York: Routledge.
Redden, Joanna, and Tamara Witschge. 2010. “A New News Order? Online News
Content Examined.” In New Media, Old News: Journalism & Democracy in the
Digital Age, ed. Natalie Fenton. Los Angeles: Sage.
Romero, Daniel M., Wojciech Galuba, Sitaram Asur, and Bernardo A. Huberman. 2011.
“Influence and Passivity in Social Media.” Proc. European Conference on
Machine Learning and Knowledge Discovery in Databases.
Shannon, C.E. 1948. “A Mathematical Theory of Communication.” The Bell System
Technical Journal 27(3): 379-423.
Shoemaker, Pamela J., and Tim P. Vos. 2009. Gatekeeping Theory. New York:
Routledge.
Strömbäck, Jesper and Spiro Kiousis. 2010. “A New Look at Agenda-setting Effects—
Comparing the Predictive Power of Overall Political News Consumption and

138
Specific News Media Consumption Across Different Media Channels and Media
Types.” Journal of Communication 60: 271-292.
Twitter. 2011. “One hundred million voices.” Twitter Blog. September 8.
http://blog.twitter.com/2011/09/one-hundred-million-voices.html (October 15,
2012).
Wallsten, Kevin. 2007a. “Agenda Setting and the Blogosphere: An Analysis of the
Relationship Between [US] Mainstream Media and Political Blogs.” Review of
Policy Research 24(6): 567-587.
Wallsten, Kevin. 2007b. “Political Blogs: Transmission Belts, Soapboxes, Mobilizers, or
Conversation Starters?” Journal of Information Technology & Politics 4(3): 19-
40.
Wolfe, Michelle, Amber E. Boydstun, and Frank R. Baumgartner. 2009. “Comparing the
Topics of Front-page and Full-Paper Stories in the New York Times.” presented at
the annual meetings of the Midwest Political Science Association, Chicago.
Woodly, Deva. 2008. “New Competencies in Democratic Communication? Blogs,
Agenda Setting and Political Participation.” Public Choice 134: 109-123.