Embed Size (px)
Citation preview
Este artigo pode ser copiado, distribuído, exibido, transmitido ou adaptado desde que citados, de forma clara e explícita, o nome da revista, a edição, o ano e as páginas nas quais o artigo foi publicado originalmente, mas sem sugerir que a RAM endosse a reutilização do artigo. Esse termo de licenciamento deve ser explicitado para os casos de reutilização ou distribuição para terceiros. Não é permitido o uso para fins comerciais.
PATTERNS OF EFFICIENCY IN DISPERSED, DOMINANT AND CONCENTRATED OWNERSHIP STRUCTURES IN BRAZIL
IGOR BERNARDI SONZAPhD in Business Administration,Federal University of Rio Grande do Sul (UFRGS).Professor at the Department of Business Sciences,Federal University of Santa Maria (UFSM).Av. Roraima, 1.000, Camobi, Santa Maria – RS – Brasil – CEP 97105-900E-mail: [email protected]
Mackenzie Management Review (REV. ADM. MACKENZIE – RAM), 18(3) • SÃO PAULO, SP • MAY/JUN. 2017ISSN 1678-6971 (electronic version) • http://dx.doi.org/10.1590/1678-69712017/administracao.v18n3p232-259. Submission: September 15, 2016. Acceptance: March 3, 2017. Evaluation system: double blind review. UNIVERSIDADE PRESBITERIANA MACKENZIE. Silvio Popadiuk (Editor-in-Chief), Michele Nascimento Jucá (Associate Editor), p. 232-259.
Patterns of efficiency in dispersed, dominant and concentrated ownership structures in Brazil
Mackenzie Management Review (REV. ADM. MACKENZIE – RAM), 18(3), 232-259 • SÃO PAULO, SP • MAY/JUN. 2017ISSN 1678-6971 (electronic version) • http://dx.doi.org/10.1590/1678-69712017/administracao.v18n3p232-259
233
ABSTRACT
Purpose: The article aims to trace the behaviour of dispersed, dominant and concentrated ownership structures in Brazil and verify which of these structures is more efficient operationally and if there is a pattern to be followed.Originality/gap/relevance/implications: Static optimisation techniques are used by data envelopment analysis (DEA) to calculate the variable ‘efficiency’, a differential in relation to previous studies that consider only outcome variables as a performance indicator. The article is one of the first in the area that traces the pattern of efficiency of ownership structures in Brazil.Key methodological aspects: The sample consists of 8,298 company years in the period between 1995 to 2012. To calculate the efficiency (dependent variable), static optimisation techniques were used by data envelopment analysis (DEA). After, the unbalanced panel data by GMM-Sys (system generalised method of moments) is applied to iden-tify the influence of dispersed, dominant and concentrated ownership structures on efficiency. Summary of key results: The results showed that, although all the varia-bles are positively related to efficiency, the graphic presented an inver-ted “U” format, i.e. dispersed and concentrated structures, mostly, are less efficient than dominant. Key considerations/conclusions: The study identifies that both agency problems and the expropriation of minority shareholders by the majo-rity, stemming from weak legal protection in the country, significan-tly affect the efficiency of Brazilian companies, thus making dominant structures the most appropriated form of ownership structure in Brazil.
KEYWORDS
Governance. Efficiency. Ownership Structure. Pattern. Optimisation.
Mackenzie Management Review (REV. ADM. MACKENZIE – RAM), 18(3), 232-259 • SÃO PAULO, SP • MAY/JUN. 2017ISSN 1678-6971 (electronic version) • http://dx.doi.org/10.1590/1678-69712017/administracao.v18n3p232-259
234
Igor Bernardi Sonza
1. INTRODUCTION
The relation between ownership structure and corporate performance is a controversial subject widely explored by academia. Aldrighi and Mazzer (2007) argue that assessing the benefits and costs of a greater concentration of ownership can be rationalised in terms of the trade-off between incentives to monitor executives (which may result in the creation of value for the firm) and gains—liquidity and diversification of the risk to its wealth (the renun-ciation of which may incite the search for ‘private benefits of control’).
For Jensen and Meckling (1976), the concentrated ownership structure has the potential to limit agency problems due to more efficient monito-ring since the concentration in the hands of a single shareholder generates incentives and great power to better monitor the business at a lower cost. On the other hand, the conflicts of interest between majority and mino-rity shareholders have also consumed a lot of space in academic studies. This divergence induces the possibility of the expropriation of minority sha-reholders, and may generate inefficient investments. This fact suggests that a highly concentrated structure may not be optimal for shareholders (La Porta, Lopez-De-Silanes, & Shleifer, 1999). For this reason, Pedersen and Thomsen (1997) argue that ownership structure is highly dependent on regulation and the institutions prevailing in market economies.
In this context, La Porta et al. (1998) classified four different types of laws regarding the legal protection of shareholders which significan-tly influence the ownership structure. Countries with common laws (e.g. USA, UK, among others) have more protection for shareholders, lea-ding to fewer minority expropriations; countries with French civil law (e.g. Brazil, Belgium, France, among others), German civil law (e.g. Japan, Germany, Austria, among others) and Scandinavian civil law (e.g. Denmark, Finland, Switzerland, among others) have less protection, thus facilitating the expropriation of minority shareholders. As a result, these countries end up having smaller and less developed capital markets.
According to these assumptions, the present article aims to trace the behaviour of dispersed, dominant and concentrated ownership structures in Brazil to verify which of these structures is more efficient operationally and if there is a pattern to be followed.
This is a pertinent question from an academic point of view since the discovery of the way the property structure is designed can influence the company’s results, thereby helping in many ways to get an optimal point
Patterns of efficiency in dispersed, dominant and concentrated ownership structures in Brazil
Mackenzie Management Review (REV. ADM. MACKENZIE – RAM), 18(3), 232-259 • SÃO PAULO, SP • MAY/JUN. 2017ISSN 1678-6971 (electronic version) • http://dx.doi.org/10.1590/1678-69712017/administracao.v18n3p232-259
235
between these two variables. But the impasse concerns how to identify the company’s performance. Belkaoui and Pavlik (1992) used a as depen-dent variable representing the performance of the company, the logarithm of EBITDA and market capitalisation. In their study, Frydman et al. (1999) con-sidered profitability as an efficiency measure. However, these authors have neglected the fact that the strategic focus of an organisation is its opera-tional function, that is, the process of transforming inputs into outputs. Margaritis and Psillaki (2010) and Wang, Lu, and Lin (2012) also used the efficiency calculation through data envelopment analysis to identify the influence of governance on company performance.
2. OWNERSHIP STRUCTURE: CONCEPTIONS AND CATEGORIES
The ownership structure (the form in which company capital is distri-buted relative to votes and the degree of concentration of owners of capi-tal) is considered an important mechanism of corporate governance. This mechanism differs significantly between countries because of national dis-parities in the ownership structure and composition of the board, over which ownership has a major influence on the composition and, consequently, on the performance of the firm (Belkaoui & Pavlik, 1992).
Realising a study in Brazil which compares the country with the other BRIC countries (Russia, India and Korea), Black, Carvalho, and Gorga (2012) suggested that country characteristics strongly influence governance aspects of company performance. Better governance in emerging markets benefits companies with better access to finance, lower capital costs, better performance and better treatment for all shareholders (Claessens & Yurto-glu, 2013). Clemente et al. (2014) identified that companies that adhered to the governance practices presented a lower risk for the investor and a grea-ter share of valorisation in Brazil. This benefit is also identified in terms of corporate globalisation (Min & Smyth, 2014).
In contrast, testing whether companies listed in the corporate governan-ce segment would be more efficient than companies listed in the traditional Brazilian market, Ferreira (2012) found no evidence to support this claim. Macedo and Corrar (2012) only verified a superior performance of compa-nies in the electricity distribution sector in Brazil in 2005, did not show a superior performance for companies with greater corporate governance practices in subsequent years. Góis et al. (2015) identified that the share
Mackenzie Management Review (REV. ADM. MACKENZIE – RAM), 18(3), 232-259 • SÃO PAULO, SP • MAY/JUN. 2017ISSN 1678-6971 (electronic version) • http://dx.doi.org/10.1590/1678-69712017/administracao.v18n3p232-259
236
Igor Bernardi Sonza
concentration does not influence investment spending (R&D) of Brazilian companies.
Also, the ownership structure varies systematically according to the com-pany’s value maximisation. When shareholders decide to change the owner-ship structure of a company from concentrated to dispersed the consequences of losing control over management should be made clear. For this reason, finding the optimal point of an ownership structure is essential to add value to the firm (Chen, 2013).
According to the classification of Pedersen and Thomsen (1997), there are three main types of property structures: 1. dispersed – where the main shareholder has less than 20% of the ownership of the company; 2. domi-nant – where the main shareholder owns between 20% and 50% of the company’s property; and 3. concentrated – where the main shareholder owns more than 50% of the company’s ownership.
This section is divided into two parts to better explain the peculiar aspects of the property structure; they are: 1. property and efficiency in dispersed structures, and 2. ownership and efficiency in concentrated structures.
2.1. Ownership and efficiency in dispersed structures
There are some countries in which the ownership structure is very dis-persed, that is, the majority shareholders usually do not own more than 20% of the shares of the companies. La Porta, Lopez-de-Silanes, and Shleifer (1999) have argued that this type of structure is beneficial because it redu-ces the possibility of expropriation of minority shareholders by the majority. These issues can be mitigated depending upon the type of the shareholder´s legal protection prevailing in these countries. The following studies are favourable to dispersed ownership structures.
Bae et al. (2012) found that the expropriation of minority sharehol-ders by majorities affects the value of the company in countries with weak legal protection, especially when these countries are experiencing periods of financial crisis. This same result was identified by Hamadi (2010) in Belgium, by Samaha (2012) in Egypt and by Connelly, Limpaphayom and Nagarajan (2012) in Thailand in companies that had pyramidal structures. Lin et al. (2012), Lin, Ma, and Xuan (2011), Lin et al. (2013) and Paligorova and Xu (2012) showed that the divergence between control rules and cash flow rules negatively influences the financing capacity and, consequently, the financial performance of the company.
Patterns of efficiency in dispersed, dominant and concentrated ownership structures in Brazil
Mackenzie Management Review (REV. ADM. MACKENZIE – RAM), 18(3), 232-259 • SÃO PAULO, SP • MAY/JUN. 2017ISSN 1678-6971 (electronic version) • http://dx.doi.org/10.1590/1678-69712017/administracao.v18n3p232-259
237
Another pertinent question is the professionalisation of the ownership structure. Silveira (2004) identified that the ownership structure influences the quality of corporate governance in Brazil. Specifically, the results highli-ghted a significant negative relation between the excess of voting rights held by the controlling shareholder and the quality of governance, thus showing that more professional administrations, generally more pulverised, have better quality and that the concentration of the decision in the hands of one person, or one family, generates inefficiencies.
Aldrighi and Mazzer (2007) showed that families prevailed among the majority shareholders (54.7%), followed by foreign investors (18.4%), governments (7.5%) and funds of investment (5.2%). The results found by the authors showed the incipience of the capital market in Brazil, mainly due to the high concentration of ownership of the companies in the hands of a single shareholder (around 51% of the capital and almost 73% of the voting rights), and indications of the expropriation of minority sharehol-ders, thus evidencing the lack of professionalisation of Brazilian companies. Pinto and Leal (2013) have identified that companies with less concentrated structures better remunerate their managers.
2.2. Ownership and efficiency in concentrated structures
Contrary to what occurs in dispersed structures, ownership in concen-trated structures can, according to Jensen and Meckling (1976), diminish agency problems. The following studies are favourable to concentrated ownership structures.
Hotchkiss and Strickland (2003) have identified that the ownership structure is directly related to company performance, and Khorana, Servaes and Wedge (2007) showed that in US investment funds, company perfor-mance increases by three percentage points for each increase by one percen-tage point in the ownership structure. Coles, Lemmon and Meschke (2012) have shown that increases in productivity have a strong positive effect on the ownership structure of US firms. Through a natural experiment, Giannetti and Laeven (2009) also identified a positive relationship between owner-ship and efficiency in Sweden, using pension funds as an exogenous instru-ment. San Martin-Reyna and Duran-Encalada (2012) suggest that there is a better performance among companies with more concentrated ownership structures in the Mexican market. This result was also found by Kang and Kin (2012) in China. Morck, Shleifer and Vishny (1988) and Ng (2005)
Mackenzie Management Review (REV. ADM. MACKENZIE – RAM), 18(3), 232-259 • SÃO PAULO, SP • MAY/JUN. 2017ISSN 1678-6971 (electronic version) • http://dx.doi.org/10.1590/1678-69712017/administracao.v18n3p232-259
238
Igor Bernardi Sonza
have identified a non-monotonic relationship between ownership and per-formance in the USA and Asia.
In this context, according to Cornelli et al. (2013), concentrated struc-tures generate efficient monitoring of executives, thereby increasing the company’s performance.
3. METHODOLOGICAL ASPECTS
In order to trace the behaviour of dispersed, dominant and concentrated ownership structures in Brazil and to identify if there is an efficiency pattern in these structures, an exploratory-descriptive research based on quantitati-ve methods is applied. The secondary data related to the ownership structu-re, balance sheets and income statements, are drawn from the ECONOMA-TICA database. Those referring to the number of employees are taken from companies’ sites and the Exame portal.
The data collected are on an annual basis from 1995 to 2012 (18 years) and constitute a sample of 461 publicly traded companies on BM&FBovespa, totalising 8,298 companies per year. Only common shares are used since they are the ones that give voting rights which influence the decisions and the efficiency of the companies.
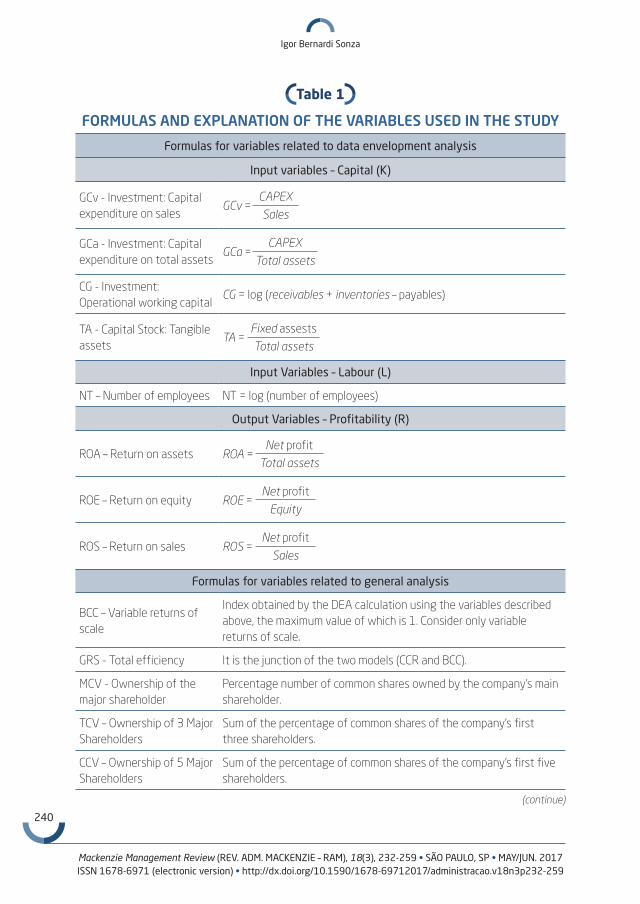
Data analysis is performed in two stages. The first stage is the calcula-tion of the relative efficiency of Brazilian public companies through DEA, during which two types of input variables are considered: 1. capital – capital stock (tangible assets), investment (two types of capital expenditures, one based on sales and the other on total assets) and operational working capi-tal; and 2. labour – logarithm of the number of employees. Only one type of output variable is considered: 1. profitability – ROA (return on asset); ROE (return on equity) and ROS (return on sales) (see Table 1). The model used in the study is the SBM (slack-based model) which takes into account variable returns of scale (BCC) and total efficiency (GRS) because it corrects the problems arising from the other models which may consider a DMU (decision making unit) efficient, despite presenting excesses of inputs and lack of outputs (TONE, 2001).
For the calculation of the DEA, three steps are necessary, as descri-bed below: 1. the variables are winsorised considering 5%; that is, a new variable is generated, similar to the previous one, except for the 5% lower and higher extreme values; 2. the correlation test is applied and, if there are highly related variables, one of them is withdrawn from the study; and
Patterns of efficiency in dispersed, dominant and concentrated ownership structures in Brazil
Mackenzie Management Review (REV. ADM. MACKENZIE – RAM), 18(3), 232-259 • SÃO PAULO, SP • MAY/JUN. 2017ISSN 1678-6971 (electronic version) • http://dx.doi.org/10.1590/1678-69712017/administracao.v18n3p232-259
239
3. the variables are separated by year and by industry, generating 234 analy-ses (18 years and 13 different types of industry).
This separation by year and by industry is made because as the DEA is a relative efficiency calculation (is efficient in relation to the other compa-nies that are in the sample), it cannot compare companies with themselves in the previous years nor companies that belong to different industries, in which measures, standards and conventions are totally different. The clas-sification of industries is obtained from the ECONOMATICA database and some are reclassified by similarity. The index generated constitutes the rela-tive efficiency of the companies and is used as a dependent variable in the regression.
In the second step, in order to verify the influence of dispersed, domi-nant and concentrated structures on the efficiency of the companies, the panel data method by GMM (generalised method of moments), a tool that considers a given sample of individuals over time and enables multiple observations of each individual in the sample, is applied. In this case, the dynamic model (which considers the lagged dependent variable as expla-natory) and systemic (GMM-Sys of Blundell and Bond, 1998) is applied. The instruments used are the lagged independent variables, as proposed by Almeida et al. (2010). To perform the analysis, the following tests are applied: 1. correlation test, 2. Arellano and Bond test (1991) that tests the existence of serial correlation, 3. overidentification test of Hansen (1982), and 4. chi-square test (χ²). As in the DEA analysis, the variables are win-sorised at 5%. Formula (1) presents the dependent variable, as well as the independent variables of the model:
Eit = ai + Zitγ + Witδ + ∑n
i EFindi + ∑n
t EFtempt + εit (1)
The variable E represents the efficiency of firms i in period t, a is the intercept of firms i, γ and δ are the coefficients of the variables, Zit are the variables referring to the ownership structure of firms i in period t, Wit are the control variables of the firms i in the period t, EFind represents the fixed industrial effects, EFtemp represents the fixed time effects and εit represents the error term of the companies i in period t. In some analyses the fixed industrial and temporal effects and the shareholders’ agreement were not considered, since the proposed model, in differences, does not include dummies.
Mackenzie Management Review (REV. ADM. MACKENZIE – RAM), 18(3), 232-259 • SÃO PAULO, SP • MAY/JUN. 2017ISSN 1678-6971 (electronic version) • http://dx.doi.org/10.1590/1678-69712017/administracao.v18n3p232-259
240
Igor Bernardi Sonza
Table 1
FORMULAS AND EXPLANATION OF THE VARIABLES USED IN THE STUDY
Formulas for variables related to data envelopment analysis
Input variables – Capital (K)
GCv - Investment: Capital expenditure on sales
GCv =CAPEX
Sales
GCa - Investment: Capital expenditure on total assets
GCa =CAPEX
Total assets
CG - Investment: Operational working capital
CG = log (receivables + inventories – payables)
TA - Capital Stock: Tangible assets
TA =Fixed assests
Total assets
Input Variables – Labour (L)
NT – Number of employees NT = log (number of employees)
Output Variables – Profitability (R)
ROA – Return on assets ROA =Net profit
Total assets
ROE – Return on equity ROE =Net profit
Equity
ROS – Return on sales ROS =Net profit
Sales
Formulas for variables related to general analysis
BCC – Variable returns of scale
Index obtained by the DEA calculation using the variables described above, the maximum value of which is 1. Consider only variable returns of scale.
GRS - Total efficiency It is the junction of the two models (CCR and BCC).
MCV - Ownership of the major shareholder
Percentage number of common shares owned by the company’s main shareholder.
TCV – Ownership of 3 Major Shareholders
Sum of the percentage of common shares of the company’s first three shareholders.
CCV – Ownership of 5 Major Shareholders
Sum of the percentage of common shares of the company’s first five shareholders.
(continue)
Patterns of efficiency in dispersed, dominant and concentrated ownership structures in Brazil
Mackenzie Management Review (REV. ADM. MACKENZIE – RAM), 18(3), 232-259 • SÃO PAULO, SP • MAY/JUN. 2017ISSN 1678-6971 (electronic version) • http://dx.doi.org/10.1590/1678-69712017/administracao.v18n3p232-259
241
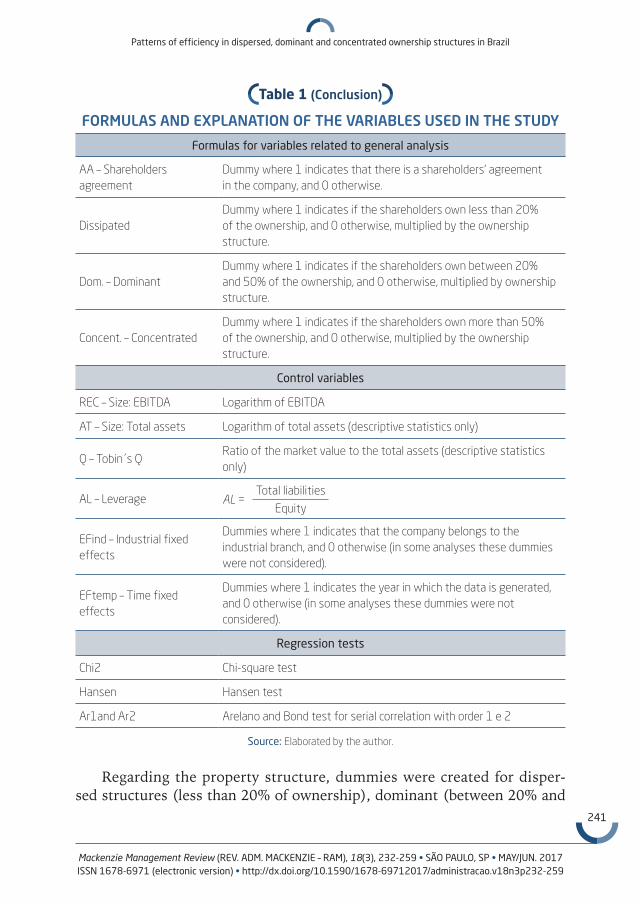
Formulas for variables related to general analysis
AA – Shareholders agreement
Dummy where 1 indicates that there is a shareholders’ agreement in the company, and 0 otherwise.
Dissipated Dummy where 1 indicates if the shareholders own less than 20% of the ownership, and 0 otherwise, multiplied by the ownership structure.
Dom. – DominantDummy where 1 indicates if the shareholders own between 20% and 50% of the ownership, and 0 otherwise, multiplied by ownership structure.
Concent. – ConcentratedDummy where 1 indicates if the shareholders own more than 50% of the ownership, and 0 otherwise, multiplied by the ownership structure.
Control variables
REC – Size: EBITDA Logarithm of EBITDA
AT – Size: Total assets Logarithm of total assets (descriptive statistics only)
Q – Tobin´s QRatio of the market value to the total assets (descriptive statistics only)
AL – Leverage AL =Total liabilities
Equity
EFind – Industrial fixed effects
Dummies where 1 indicates that the company belongs to the industrial branch, and 0 otherwise (in some analyses these dummies were not considered).
EFtemp – Time fixed effects
Dummies where 1 indicates the year in which the data is generated, and 0 otherwise (in some analyses these dummies were not considered).
Regression tests
Chi2 Chi-square test
Hansen Hansen test
Ar1and Ar2 Arelano and Bond test for serial correlation with order 1 e 2
Source: Elaborated by the author.
Regarding the property structure, dummies were created for disper-sed structures (less than 20% of ownership), dominant (between 20% and
Table 1 (Conclusion)
FORMULAS AND EXPLANATION OF THE VARIABLES USED IN THE STUDY
Mackenzie Management Review (REV. ADM. MACKENZIE – RAM), 18(3), 232-259 • SÃO PAULO, SP • MAY/JUN. 2017ISSN 1678-6971 (electronic version) • http://dx.doi.org/10.1590/1678-69712017/administracao.v18n3p232-259
242
Igor Bernardi Sonza
50% of ownership) and concentrated (more than 50% ownership), which were multiplied by the variables ‘concentration of ownership of the main shareholder’, ‘three major shareholders’ and the ‘five major shareholders’. For example, in the concentration of the main shareholder, for the variable of dispersed structures, the value was assigned 1 if the main shareholder had less than 20% of the ownership of the company and, otherwise, this dummy was multiplied by the concentration, only making the percentage in which the main shareholder had less than 20% ownership. This procedure was performed for all the analyses, thus generating 9 different variables, elaborated from the definition of Pedersen and Thomsen (1997) presented in the literature review. According to Laeven and Levine (2008), one third of European companies have multiple large shareholders, whose market value differs from companies that have a dispersion or concentration of shares. In Brazil, it is no different, thus illustrating the necessity to analyse not only the main shareholder, but also the other major shareholders. To chart the behaviour of these structures, graphs are drawn from the indices obtained in these regressions. With regard to control variables, the follo-wing measures are inserted in equation (1): 1. shareholders’ agreement, 2. size—revenue, 3. leverage, 4. industry fixed effects, and 5. time fixed effects (see Table 1).
4. ANALYSIS OF RESULTS
This subsection is divided into two parts to better explain the results achieved: 1. descriptive statistics and correlation, and 2. influence of disper-sed, dominant and concentrated structures on efficiency.
4.1. Descriptive statistics and correlation
Before performing the analysis of the results, it is necessary to verify the correlation between the variables and the descriptive statistics. As expected, some variables present a significant correlation (above 0.7). It is identified that the BCC (efficiency with variable scale returns) and the GRS (total effi-ciency) are correlated with each other. This pattern is also observed between the MCV (major shareholder with voting), TCV (three major voting sharehol-ders) and CCV (five voting shareholders) variables, and between EBITDA and total assets. None of these variables is used in the same regression to avoid multicollinearity problems.
Patterns of efficiency in dispersed, dominant and concentrated ownership structures in Brazil
Mackenzie Management Review (REV. ADM. MACKENZIE – RAM), 18(3), 232-259 • SÃO PAULO, SP • MAY/JUN. 2017ISSN 1678-6971 (electronic version) • http://dx.doi.org/10.1590/1678-69712017/administracao.v18n3p232-259
243
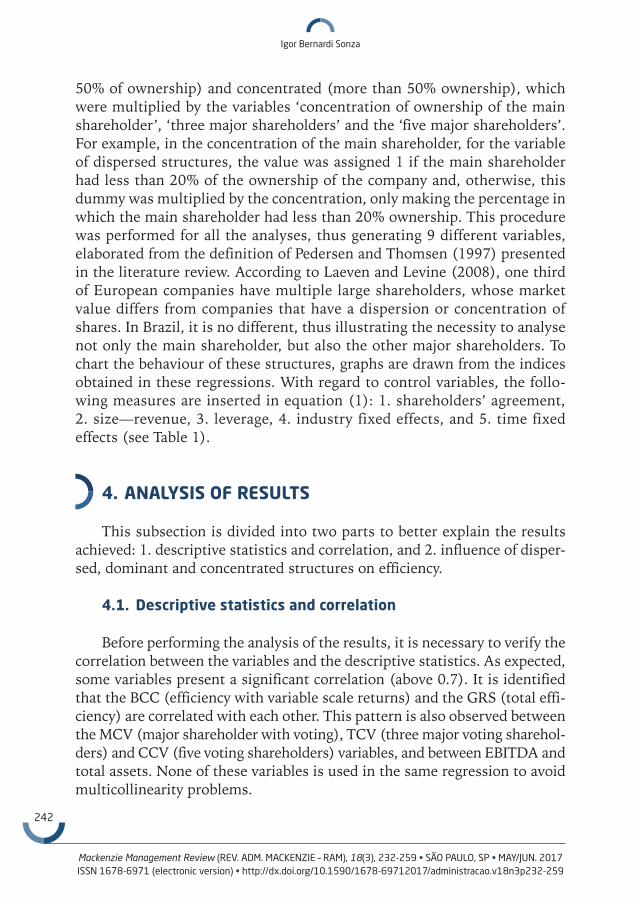
After verifying the correlation between the variables, an analysis of the descriptive statistics is made. As can be seen in Table 2, after applying the winsorisation, the variables related to efficiency and ownership structure have very close means and medians. On average, companies are efficient at 38.48% considering the total efficiency (GRS) model, but increase their performance to 56.25% considering variable returns of scale (BCC). In this case, the median for GRS is 19.63%, evidencing a large disparity between this variable and the mean. The indexes presented significant variance; for this reason, it was agreed to use a logarithm in these variables as well.
Table 2
DESCRIPTIVE STATISTICS
Est. BCC GRS MCV TCV CCV AL Q REC AT
Mean 56.25 38.48 58.74 80.41 84.37 2.85 1.51 11.93 12.72
Median 58.77 19.63 58.40 87.30 90.00 1.45 1.02 12.22 12.88
p10 0.60 0.27 19.00 51.00 57.20 0.35 0.27 9.34 9.88
p25 8.99 2.37 35.00 68.50 76.00 0.73 0.52 10.77 11.32
p75 100.00 100.00 86.20 97.30 97.90 3.18 1.99 13.41 14.12
p90 100.00 100.00 98.70 100.00 100.00 8.37 3.56 14.47 15.36
Var. 19.1x10² 16.6x10² 8.4x10² 3.9x10² 3x10² 12.13 1.97 4.51 3.75
Min 0.18 0.09 0.00 0.00 0.00 0.00 0.01 1.50 9.06
Max 100.00 100.00 100.00 100.00 100.00 13.17 5.48 15.05 16.08
Note: For the definition of the variables, see Table 1.
Source: Elaborated by the author.
The variables related to the ownership structure presented similar pat-terns, with means and medians quite close, thus representing little variabi-lity between them. In the companies analysed, the major voting shareholder (MCV) owns, on average, 58.74% of the company’s shares, showing highly concentrated structures with the three and five main shareholders having voting rights over an average of 80.41% and 84.37% of the company’s sha-res, thereby highlighting the importance of taking more shareholders into account in the analysis to avoid many distortions that could occur if only the first shareholder were considered. In this case, the variance is significant, thus evidencing the need to use a logarithm in these variables.
Mackenzie Management Review (REV. ADM. MACKENZIE – RAM), 18(3), 232-259 • SÃO PAULO, SP • MAY/JUN. 2017ISSN 1678-6971 (electronic version) • http://dx.doi.org/10.1590/1678-69712017/administracao.v18n3p232-259
244
Igor Bernardi Sonza
In leverage, a large disparity between the mean and the median is obser-ved, showing that, to this variable, a logarithm should also be applied. In the analysis, the companies are leveraged, on average, 2.85 times; that is, for each $1.00 of shareholders’ equity, these companies are indebted in the short and long term, around $2.85. In the case of Tobin’s Q, companies, on average, have a market value that exceeds the asset value by 50%. Finally, control variables related to size (EBITDA and total assets) show similar patterns and a large proximity between the mean and the median (after application of a logarithm). The variability is also small.
4.2. Influence of dispersed, dominant and concentrated structures on efficiency
As explained in the methodology, to identify the influence of ownership structures on business efficiency, two variables of efficiency (BCC and GRS) and three ownership variables (dummies for dispersed, dominant and concentrated structures), multiplied by three concentrations of ownership (major shareholder, three major shareholders and five major shareholders) are considered. To guarantee the robustness of the results, in all analyses three situations are considered, adding and removing control variables, thus totaling 18 regressions. This situation should not be interpreted as a data snooping bias (where the researcher changes the data purposely for best results); the objective of this robustness is to test the consistency of the analysis since the results are very close and all regressions are displayed. The control variables used are: size (EBITDA), shareholders’ agreement, leverage, and industrial and time fixed effects (binary variables are only con-sidered in some cases because the model, in principle, does not contain dummies). The results are presented in Tables 3 (considering BCC as the dependent variable) and 4 (considering GRS as the dependent variable).
In the lower part of the tables, the Hansen (1982) overidentification test is shown, which identifies that in all analyses the null hypothesis cannot be rejected. This indicates that the instruments are apparently not corre-lated with the regression error term. In the chi-square test (χ²), the null hypothesis is rejected, thereby indicating that the observed frequencies are not different from the expected frequencies; that is, there is an association between the groups of variables. To test the consistency of the results, the Arellano and Bond tests (1991) (ABond AR (1) and ABond AR (2)) are applied (see Tables 3 and 4). In most of the analyses (except the GRS model for the three and five major shareholders), the null hypothesis of absence of
Patterns of efficiency in dispersed, dominant and concentrated ownership structures in Brazil
Mackenzie Management Review (REV. ADM. MACKENZIE – RAM), 18(3), 232-259 • SÃO PAULO, SP • MAY/JUN. 2017ISSN 1678-6971 (electronic version) • http://dx.doi.org/10.1590/1678-69712017/administracao.v18n3p232-259
245
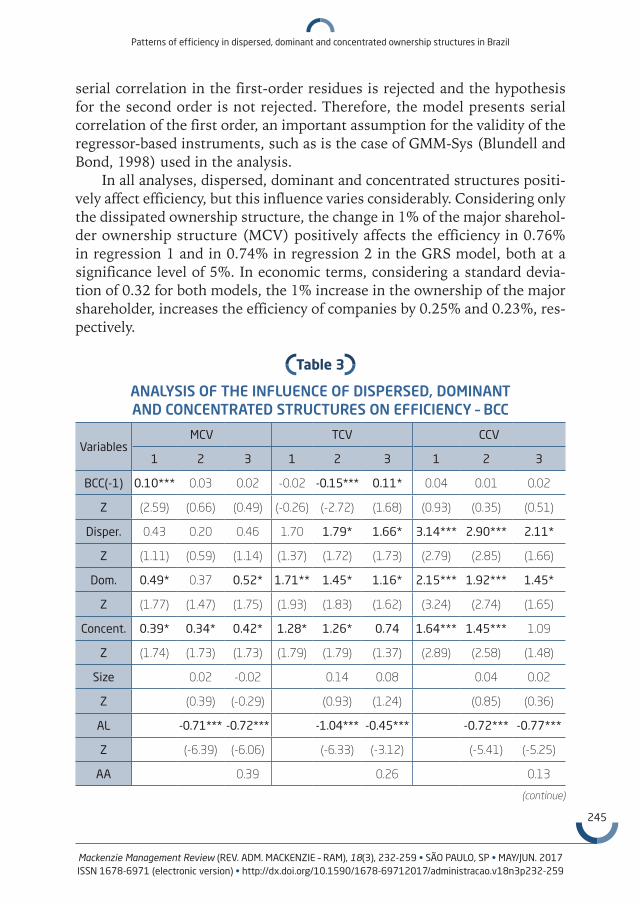
serial correlation in the first-order residues is rejected and the hypothesis for the second order is not rejected. Therefore, the model presents serial correlation of the first order, an important assumption for the validity of the regressor-based instruments, such as is the case of GMM-Sys (Blundell and Bond, 1998) used in the analysis.
In all analyses, dispersed, dominant and concentrated structures positi-vely affect efficiency, but this influence varies considerably. Considering only the dissipated ownership structure, the change in 1% of the major sharehol-der ownership structure (MCV) positively affects the efficiency in 0.76% in regression 1 and in 0.74% in regression 2 in the GRS model, both at a significance level of 5%. In economic terms, considering a standard devia-tion of 0.32 for both models, the 1% increase in the ownership of the major shareholder, increases the efficiency of companies by 0.25% and 0.23%, res-pectively.
Table 3
ANALYSIS OF THE INFLUENCE OF DISPERSED, DOMINANT AND CONCENTRATED STRUCTURES ON EFFICIENCY – BCC
VariablesMCV TCV CCV
1 2 3 1 2 3 1 2 3
BCC(-1) 0.10*** 0.03 0.02 -0.02 -0.15*** 0.11* 0.04 0.01 0.02
Z (2.59) (0.66) (0.49) (-0.26) (-2.72) (1.68) (0.93) (0.35) (0.51)
Disper. 0.43 0.20 0.46 1.70 1.79* 1.66* 3.14*** 2.90*** 2.11*
Z (1.11) (0.59) (1.14) (1.37) (1.72) (1.73) (2.79) (2.85) (1.66)
Dom. 0.49* 0.37 0.52* 1.71** 1.45* 1.16* 2.15*** 1.92*** 1.45*
Z (1.77) (1.47) (1.75) (1.93) (1.83) (1.62) (3.24) (2.74) (1.65)
Concent. 0.39* 0.34* 0.42* 1.28* 1.26* 0.74 1.64*** 1.45*** 1.09
Z (1.74) (1.73) (1.73) (1.79) (1.79) (1.37) (2.89) (2.58) (1.48)
Size 0.02 -0.02 0.14 0.08 0.04 0.02
Z (0.39) (-0.29) (0.93) (1.24) (0.85) (0.36)
AL -0.71*** -0.72*** -1.04*** -0.45*** -0.72*** -0.77***
Z (-6.39) (-6.06) (-6.33) (-3.12) (-5.41) (-5.25)
AA 0.39 0.26 0.13
(continue)
Mackenzie Management Review (REV. ADM. MACKENZIE – RAM), 18(3), 232-259 • SÃO PAULO, SP • MAY/JUN. 2017ISSN 1678-6971 (electronic version) • http://dx.doi.org/10.1590/1678-69712017/administracao.v18n3p232-259
246
Igor Bernardi Sonza
VariablesMCV TCV CCV
1 2 3 1 2 3 1 2 3
Z (1.29) (0.75) (0.32)
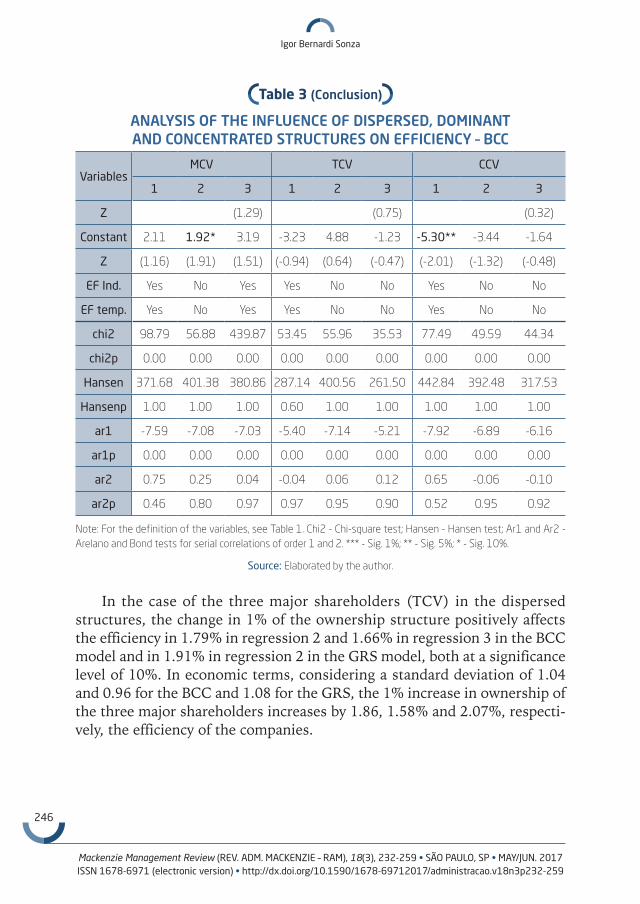
Constant 2.11 1.92* 3.19 -3.23 4.88 -1.23 -5.30** -3.44 -1.64
Z (1.16) (1.91) (1.51) (-0.94) (0.64) (-0.47) (-2.01) (-1.32) (-0.48)
EF Ind. Yes No Yes Yes No No Yes No No
EF temp. Yes No Yes Yes No No Yes No No
chi2 98.79 56.88 439.87 53.45 55.96 35.53 77.49 49.59 44.34
chi2p 0.00 0.00 0.00 0.00 0.00 0.00 0.00 0.00 0.00
Hansen 371.68 401.38 380.86 287.14 400.56 261.50 442.84 392.48 317.53
Hansenp 1.00 1.00 1.00 0.60 1.00 1.00 1.00 1.00 1.00
ar1 -7.59 -7.08 -7.03 -5.40 -7.14 -5.21 -7.92 -6.89 -6.16
ar1p 0.00 0.00 0.00 0.00 0.00 0.00 0.00 0.00 0.00
ar2 0.75 0.25 0.04 -0.04 0.06 0.12 0.65 -0.06 -0.10
ar2p 0.46 0.80 0.97 0.97 0.95 0.90 0.52 0.95 0.92
Note: For the definition of the variables, see Table 1. Chi2 - Chi-square test; Hansen - Hansen test; Ar1 and Ar2 - Arelano and Bond tests for serial correlations of order 1 and 2. *** - Sig. 1%; ** - Sig. 5%; * - Sig. 10%.
Source: Elaborated by the author.
In the case of the three major shareholders (TCV) in the dispersed structures, the change in 1% of the ownership structure positively affects the efficiency in 1.79% in regression 2 and 1.66% in regression 3 in the BCC model and in 1.91% in regression 2 in the GRS model, both at a significance level of 10%. In economic terms, considering a standard deviation of 1.04 and 0.96 for the BCC and 1.08 for the GRS, the 1% increase in ownership of the three major shareholders increases by 1.86, 1.58% and 2.07%, respecti-vely, the efficiency of the companies.
Table 3 (Conclusion)
ANALYSIS OF THE INFLUENCE OF DISPERSED, DOMINANT AND CONCENTRATED STRUCTURES ON EFFICIENCY – BCC
Patterns of efficiency in dispersed, dominant and concentrated ownership structures in Brazil
Mackenzie Management Review (REV. ADM. MACKENZIE – RAM), 18(3), 232-259 • SÃO PAULO, SP • MAY/JUN. 2017ISSN 1678-6971 (electronic version) • http://dx.doi.org/10.1590/1678-69712017/administracao.v18n3p232-259
247
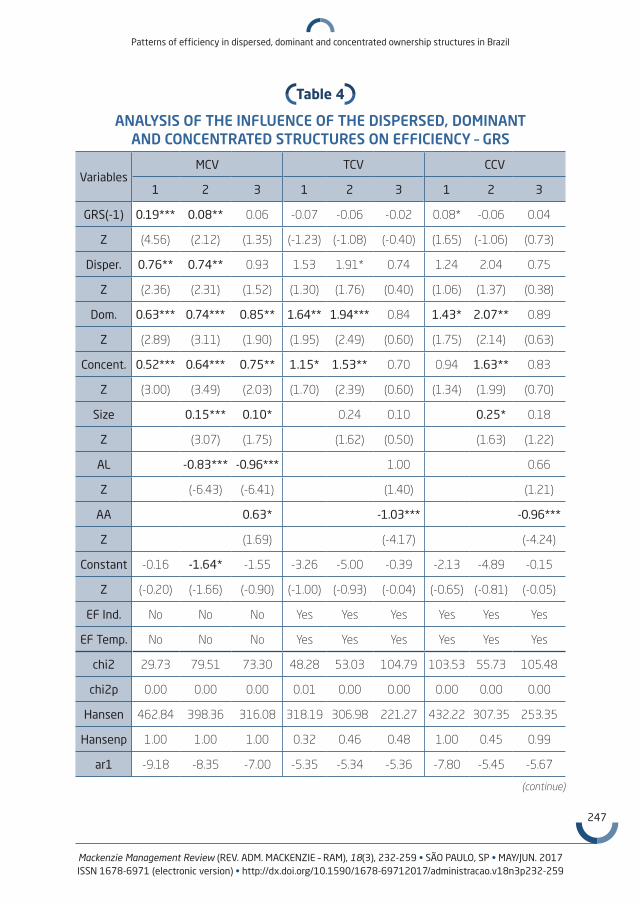
Table 4
ANALYSIS OF THE INFLUENCE OF THE DISPERSED, DOMINANT AND CONCENTRATED STRUCTURES ON EFFICIENCY – GRS
VariablesMCV TCV CCV
1 2 3 1 2 3 1 2 3
GRS(-1) 0.19*** 0.08** 0.06 -0.07 -0.06 -0.02 0.08* -0.06 0.04
Z (4.56) (2.12) (1.35) (-1.23) (-1.08) (-0.40) (1.65) (-1.06) (0.73)
Disper. 0.76** 0.74** 0.93 1.53 1.91* 0.74 1.24 2.04 0.75
Z (2.36) (2.31) (1.52) (1.30) (1.76) (0.40) (1.06) (1.37) (0.38)
Dom. 0.63*** 0.74*** 0.85** 1.64** 1.94*** 0.84 1.43* 2.07** 0.89
Z (2.89) (3.11) (1.90) (1.95) (2.49) (0.60) (1.75) (2.14) (0.63)
Concent. 0.52*** 0.64*** 0.75** 1.15* 1.53** 0.70 0.94 1.63** 0.83
Z (3.00) (3.49) (2.03) (1.70) (2.39) (0.60) (1.34) (1.99) (0.70)
Size 0.15*** 0.10* 0.24 0.10 0.25* 0.18
Z (3.07) (1.75) (1.62) (0.50) (1.63) (1.22)
AL -0.83*** -0.96*** 1.00 0.66
Z (-6.43) (-6.41) (1.40) (1.21)
AA 0.63* -1.03*** -0.96***
Z (1.69) (-4.17) (-4.24)
Constant -0.16 -1.64* -1.55 -3.26 -5.00 -0.39 -2.13 -4.89 -0.15
Z (-0.20) (-1.66) (-0.90) (-1.00) (-0.93) (-0.04) (-0.65) (-0.81) (-0.05)
EF Ind. No No No Yes Yes Yes Yes Yes Yes
EF Temp. No No No Yes Yes Yes Yes Yes Yes
chi2 29.73 79.51 73.30 48.28 53.03 104.79 103.53 55.73 105.48
chi2p 0.00 0.00 0.00 0.01 0.00 0.00 0.00 0.00 0.00
Hansen 462.84 398.36 316.08 318.19 306.98 221.27 432.22 307.35 253.35
Hansenp 1.00 1.00 1.00 0.32 0.46 0.48 1.00 0.45 0.99
ar1 -9.18 -8.35 -7.00 -5.35 -5.34 -5.36 -7.80 -5.45 -5.67
(continue)
Mackenzie Management Review (REV. ADM. MACKENZIE – RAM), 18(3), 232-259 • SÃO PAULO, SP • MAY/JUN. 2017ISSN 1678-6971 (electronic version) • http://dx.doi.org/10.1590/1678-69712017/administracao.v18n3p232-259
248
Igor Bernardi Sonza
VariablesMCV TCV CCV
1 2 3 1 2 3 1 2 3
ar1p 0.00 0.00 0.00 0.00 0.00 0.00 0.00 0.00 0.00
ar2 -0.01 -2.25 -1.90 -1.25 -2.26 -2.45 -0.61 -2.21 -2.19
ar2p 1.00 0.02 0.06 0.21 0.02 0.01 0.54 0.03 0.03
Note: For the definition of the variables, see Table 1. Chi2 - Chi-square test; Hansen - Hansen test; Ar1 and Ar2 - Arelano and Bond tests for serial correlations of order 1 and 2 (see Table 1). *** - Sig. 1%; ** - Sig. 5%; * - Sig. 10%.
Source: Elaborated by the author.
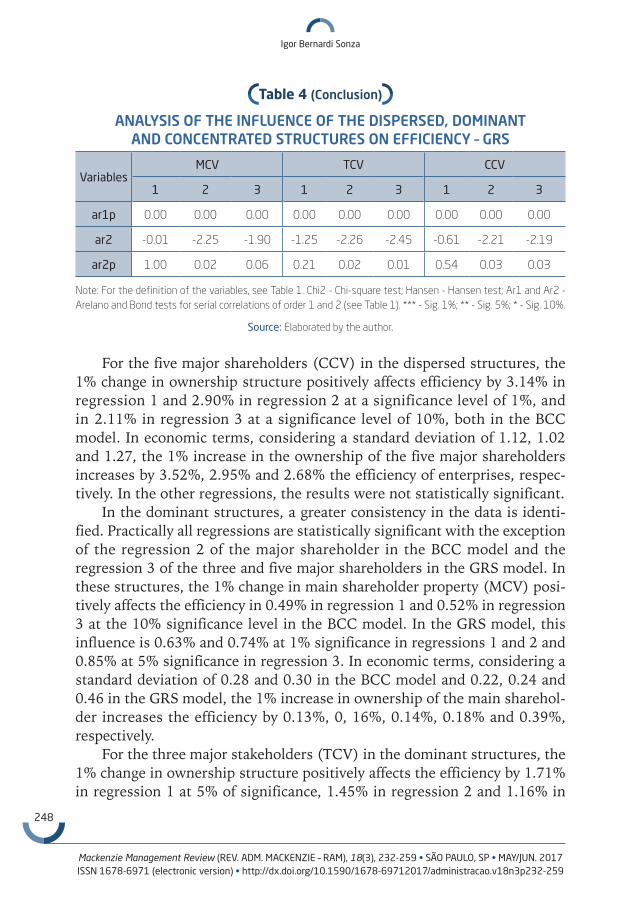
For the five major shareholders (CCV) in the dispersed structures, the 1% change in ownership structure positively affects efficiency by 3.14% in regression 1 and 2.90% in regression 2 at a significance level of 1%, and in 2.11% in regression 3 at a significance level of 10%, both in the BCC model. In economic terms, considering a standard deviation of 1.12, 1.02 and 1.27, the 1% increase in the ownership of the five major shareholders increases by 3.52%, 2.95% and 2.68% the efficiency of enterprises, respec-tively. In the other regressions, the results were not statistically significant.
In the dominant structures, a greater consistency in the data is identi-fied. Practically all regressions are statistically significant with the exception of the regression 2 of the major shareholder in the BCC model and the regression 3 of the three and five major shareholders in the GRS model. In these structures, the 1% change in main shareholder property (MCV) posi-tively affects the efficiency in 0.49% in regression 1 and 0.52% in regression 3 at the 10% significance level in the BCC model. In the GRS model, this influence is 0.63% and 0.74% at 1% significance in regressions 1 and 2 and 0.85% at 5% significance in regression 3. In economic terms, considering a standard deviation of 0.28 and 0.30 in the BCC model and 0.22, 0.24 and 0.46 in the GRS model, the 1% increase in ownership of the main sharehol-der increases the efficiency by 0.13%, 0, 16%, 0.14%, 0.18% and 0.39%, respectively.
For the three major stakeholders (TCV) in the dominant structures, the 1% change in ownership structure positively affects the efficiency by 1.71% in regression 1 at 5% of significance, 1.45% in regression 2 and 1.16% in
Table 4 (Conclusion)
ANALYSIS OF THE INFLUENCE OF THE DISPERSED, DOMINANT AND CONCENTRATED STRUCTURES ON EFFICIENCY – GRS
Patterns of efficiency in dispersed, dominant and concentrated ownership structures in Brazil
Mackenzie Management Review (REV. ADM. MACKENZIE – RAM), 18(3), 232-259 • SÃO PAULO, SP • MAY/JUN. 2017ISSN 1678-6971 (electronic version) • http://dx.doi.org/10.1590/1678-69712017/administracao.v18n3p232-259
249
regression 3, both at 10% significance in the BCC model. In the GRS model, this influence is 1.64% in regression 1 at 5% significance and 1.94% in regression 2 at 1% significance. In economic terms, considering a standard deviation of 0.89, 0.79 and 0.72 in the regressions with BCC and 0.84 and 0.78 in the regressions with GRS, the 1% increase in ownership of the three major shareholders increases by 1.51%, 1.15%, 0.83%, 1.37% and 1.51% the efficiency of companies, respectively.
For the five major shareholders (CCV) in the dominant structures, the 1% change in ownership structure positively affects the efficiency at 2.15% in regression 1, 1.92% in regression 2 at 1% significance, and 1.45% at 10% significance in regression 3 of the BCC model. In the GRS model, this influence is 1.43% at 10% significance, and 2.07% at 5% significance in regressions 1 and 2. In economic terms, considering a standard deviation of 0.66, 0.70 and 0.90 in the BCC model and 0.81 and 0.97 in the GRS model, the 1% increase in the ownership of the five major shareholders increases, respectively, by 1.43%, 1.34%, 1.30%, 1.16% and 2.00% the efficiency of the companies.
In the concentrated structures, the change in 1% in the main shareholder’s ownership (MCV) positively affects the efficiency in 0.39% in regression 1, 0.34% in regression 2 and 0.42% in regression 3 at 10% significance in the BCC model. In the GRS model, this influence is 0.52% in regression 1 and 0.64% in regression 2, both at 1% significance, and 0.75% in regression 3 at 5% significance. In economic terms, considering a standard deviation of 0.23, 0.20 and 0.24 in the BCC model and 0.17, 0.18 and 0.37 in the GRS model, the 1% increase in ownership of the main shareholder, increases, respectively, by 0.09%, 0.07%, 0.10%, 0.09%, 0.12% and 0.28% the effi-ciency of the companies.
Considering the three main shareholders (TCV), the 1% change in ownership structure positively affects the efficiency in 1.28% in regression 1 and 1.26% in regression 2, both at 10% significance in the BCC model. In the GRS model, this influence is 1.15% at 10% significance in regression 1 and 1.53% at 5% significance in regression 2. In economic terms, conside-ring a standard deviation of 0.71 and 0.70 in the BCC model and 0.67 and 0.64 in the GRS model, the 1% increase in the ownership of the three major shareholders increases by 0.91%, 0.88%, 0.77% and 0.98% the efficiency of enterprises.
Finally, for the five major shareholders (CCV) in the concentrated struc-tures, the 1% change in ownership structure positively affects the efficiency in 1.64% and 1.45% in regressions 1 and 2, both at 1% significance in the
Mackenzie Management Review (REV. ADM. MACKENZIE – RAM), 18(3), 232-259 • SÃO PAULO, SP • MAY/JUN. 2017ISSN 1678-6971 (electronic version) • http://dx.doi.org/10.1590/1678-69712017/administracao.v18n3p232-259
250
Igor Bernardi Sonza
BCC model and in 1.63% at 5% significance in regression 2 of the GRS model. In economic terms, considering a standard deviation of 0.57 and 0.56 in the BCC model and 0.82 in the GRS model, the 1% increase in ownership of the five major shareholders increases, respectively, the efficiency of the companies by 0.93%, 0.81% and 1.33%.
In terms of control variables, the one related to size (EBITDA) presen-ted statistical significance only in the GRS model, with varying influence from 0.10% to 0.25% on the company efficiency, thus corroborating the findings of Pedersen and Thomsen (1997) who identified that the bigger the size of the company, the greater the search for efficiency.
The leverage variable was negatively and significantly related to efficiency at a significance level of 1% in most of the analyses, with varying influence from -1.04% to -0.45%, according with Boubakri and Cosset (1998) who affirm that there is a tendency for a decrease in leverage as efficiency increa-ses because an increase in indebtedness may hinder the efficient allocation of resources. Finally, temporal and industrial dummies were used in some regressions, taking into consideration the sectorial particularities and condi-tions of each year covered in the analysis. The lagged dependent variable is positive in almost all the analyses that are statistically significant (except in regression 2 of the BCC model for the three major shareholders), showing that the efficiency in a previous period positively affects the same variable in a future period.
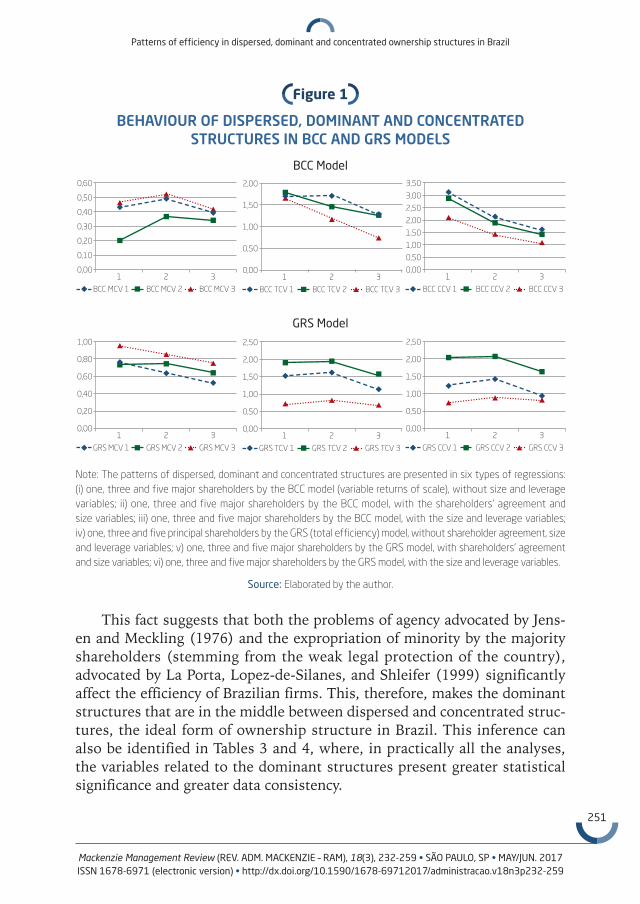
To plot the behaviour of dispersed, dominant and concentrated structu-res, from the indexes obtained in Tables 3 and 4 six graphs are generated, each of which contain three regressions (MCV, TCV and CCV), as shown in Figure 1. It is perceived that, although all variables present a positive relationship with efficiency, the graphs, in most of the analyses, present a non-monotonic relationship with an inverted ‘U’ format; that is, dispersed and concentrated structures are mostly less efficient than dominant struc-tures. The result is more evident in regressions related to the GRS (total efficiency) model. In the analysis of the BCC model, when considering only the main shareholder, this inverted ‘U’ format is identified, but in the other analyses, a decreasing monotonic relation is found starting from the disper-sed structures, thereby showing that these structures are more beneficial for these specific cases.
Patterns of efficiency in dispersed, dominant and concentrated ownership structures in Brazil
Mackenzie Management Review (REV. ADM. MACKENZIE – RAM), 18(3), 232-259 • SÃO PAULO, SP • MAY/JUN. 2017ISSN 1678-6971 (electronic version) • http://dx.doi.org/10.1590/1678-69712017/administracao.v18n3p232-259
251
Figure 1
BEHAVIOUR OF DISPERSED, DOMINANT AND CONCENTRATED STRUCTURES IN BCC AND GRS MODELS
BCC Model
GRS Model
Note: The patterns of dispersed, dominant and concentrated structures are presented in six types of regressions: (i) one, three and five major shareholders by the BCC model (variable returns of scale), without size and leverage variables; ii) one, three and five major shareholders by the BCC model, with the shareholders’ agreement and size variables; iii) one, three and five major shareholders by the BCC model, with the size and leverage variables; iv) one, three and five principal shareholders by the GRS (total efficiency) model, without shareholder agreement, size and leverage variables; v) one, three and five major shareholders by the GRS model, with shareholders’ agreement and size variables; vi) one, three and five major shareholders by the GRS model, with the size and leverage variables.
Source: Elaborated by the author.
This fact suggests that both the problems of agency advocated by Jens-en and Meckling (1976) and the expropriation of minority by the majority shareholders (stemming from the weak legal protection of the country), advocated by La Porta, Lopez-de-Silanes, and Shleifer (1999) significantly affect the efficiency of Brazilian firms. This, therefore, makes the dominant structures that are in the middle between dispersed and concentrated struc-tures, the ideal form of ownership structure in Brazil. This inference can also be identified in Tables 3 and 4, where, in practically all the analyses, the variables related to the dominant structures present greater statistical significance and greater data consistency.
BCC MCV 1
1 2 3
0,10
0,30
0,40
0,50
0,60
0,20
0,00
BCC MCV 2 BCC MCV 3 BCC TCV 1
1 2 3
0,50
1,00
1,50
2,00
0,00
BCC TCV 2 BCC TCV 3 BCC CCV 1
1 2 3
1,00
2,00
2,50
3,00
3,50
1,50
0,00
BCC CCV 2 BCC CCV 3
0,50
GRS MCV 1
1 2 3
0,20
0,60
0,80
1,00
0,40
0,00
GRS MCV 2 GRS MCV 3 GRS TCV 1
1 2 3
0,50
1,50
2,00
2,50
0,00
GRS TCV 2 GRS TCV 3 GRS CCV 1
1 2 3
1,00
2,00
2,50
1,50
0,00
GRS CCV 2 GRS CCV 3
0,50
1,00
Mackenzie Management Review (REV. ADM. MACKENZIE – RAM), 18(3), 232-259 • SÃO PAULO, SP • MAY/JUN. 2017ISSN 1678-6971 (electronic version) • http://dx.doi.org/10.1590/1678-69712017/administracao.v18n3p232-259
252
Igor Bernardi Sonza
5. CONCLUSIONS, CONTRIBUTIONS AND LIMITATIONS OF THE STUDY
There is a great controversy over how ownership structure affects effi-ciency. Seminal articles, such as that of Jensen and Meckling (1976), say that the dispersed structures are detrimental to a company because they increase the costs of agency problems. La Porta, Lopez-de-Silanes and Shleifer (1999) argue that this type of structure is beneficial because it reduces the possibility of expropriation of minority shareholders by majority ones in countries where legal protection is weak, as in the case of Brazil, where civil laws predominate.
As can be seen, in all the analyses presented, dispersed, dominant and concentrated structures positively affect efficiency, but this influence varies from one level to another. Only this isolated fact leads us to believe that all ownership structures are beneficial to Brazilian companies, with an empha-sis on dominant structures, which show statistical significance and consis-tency in data in practically all analyses.
From the regressions, graphs are traced to identify the pattern of beha-viour of these structures, evidencing a non-monotonic relationship in an inverted ‘U’ format; i.e. the extremities (dispersed and concentrated struc-tures) have a lower influence on efficiency than the dominant structures do. This fact corroborates the arguments about the relationship between ownership structure and efficiency. Non-monotonic relationships among these variables were also found by Morck, Shleifer and Vishny (1988) and Ng (2005), but the results were opposite as in the US, the dominant struc-ture is the least efficient.
The present study is in line with the paper of Jensen and Meckling (1976) who consider dispersed structures as more harmful to efficiency because they can exacerbate agency problems, thereby hampering more effi-cient monitoring and increasing the possibility of private benefits of control. It also corroborates La Porta, Lopez-de-Silanes and Shleifer’s (1999) argu-ments, which show that Brazil, as well as a large number of underdevelo-ped countries, has weak legal protection against expropriation of minority shareholders, due to historical factors stemming from the legal formation in the country, which allows the more concentrated structures to favour such expropriation. The study by Silveira (2004) also identifies an explanation for the argument that concentrated structures are detrimental to Brazilian companies. The study shows that more professional administrations, gene-rally more pulverised, are of better quality and that concentration of the
Patterns of efficiency in dispersed, dominant and concentrated ownership structures in Brazil
Mackenzie Management Review (REV. ADM. MACKENZIE – RAM), 18(3), 232-259 • SÃO PAULO, SP • MAY/JUN. 2017ISSN 1678-6971 (electronic version) • http://dx.doi.org/10.1590/1678-69712017/administracao.v18n3p232-259
253
decision in the hands of a single person, or a single family, generates ine-fficiencies in Brazilian companies. In this case, dominant structures, which remain in the middle between dispersed and concentrated structures, are the most adequate form of ownership structure in Brazil for the companies analysed during the period investigated.
Otherwise, the paper has some limitations which are mentioned below. Because DEA is used to calculate the model-dependent variable, the study suffers from the same criticisms related to this method since it is a measure of relative efficiency. Another constraint of the study is that the relationship between efficiency and ownership structure may be endogenous. Finally, when the dependent variable is a proportion, it can cause distortions in the analysis due to the fact that it constitutes a truncated variable, limited to values ranging from 0 to 1. Then, in this case, the Tobit method should be applied. This method was applied to the model, but the results were quali-tatively similar.
PADRÕES DE EFICIÊNCIA EM ESTRUTURAS DE PROPRIEDADE DISPERSAS, DOMINANTES E CONCENTRADAS NO BRASIL
RESUMO
Objetivo: O artigo em questão visa traçar o comportamento das estru-turas de propriedade dispersas, dominantes e concentradas no Brasil e verificar qual destas estruturas é mais eficiente em termos operacionais e se existe um padrão a ser seguido.Originalidade/lacuna/relevância/implicações: São utilizadas técnicas de otimização estática por meio de Análise Envoltória de Dados (DEA) para o cálculo da variável de eficiência, sendo um diferencial com relação aos estudos anteriores, que consideram somente variáveis de resultado como indicadores de desempenho. O artigo é um dos primeiros da área que traça o padrão de eficiência das estruturas de propriedade no Brasil.Principais aspectos metodológicos: A amostra é constituída por 8.298 empresas-ano entre os períodos de 1995 a 2012. Para calcular a eficiên-cia (variável dependente), são utilizadas técnicas de otimização estáti-ca através de Análise Envoltória de Dados (DEA). Após, é aplicado o método de dados em painel não balanceado por GMM-Sys (Método dos Momentos Generalizado Sistêmico).
Mackenzie Management Review (REV. ADM. MACKENZIE – RAM), 18(3), 232-259 • SÃO PAULO, SP • MAY/JUN. 2017ISSN 1678-6971 (electronic version) • http://dx.doi.org/10.1590/1678-69712017/administracao.v18n3p232-259
254
Igor Bernardi Sonza
Síntese dos principais resultados: Os resultados obtidos mostram que, apesar de todas as variáveis serem positivamente relacionadas com a eficiência, o padrão traçado apresentou-se em formato de “U” invertido, ou seja, estruturas dispersas e concentradas, em sua maioria, são menos eficientes que as dominantes. Principais considerações/conclusões: O estudo identifica que tanto os problemas de agência, quanto a expropriação de minoritários pelos majoritários, decorrente da fraca proteção legal do país, afetam signi-ficativamente a eficiência das empresas brasileiras, fazendo com que as estruturas dominantes sejam a forma mais apropriada de estrutura de propriedade no Brasil.
PALAVRAS-CHAVE
Governança. Eficiência. Estrutura de Propriedade. Padrão. Otimização.
PATRONES DE EFICIENCIA EN LAS ESTRUCTURAS DE PROPIEDAD DISPERSAS, DOMINANTES Y CONCENTRADAS EN BRASIL
RESUMEN
Objetivo: El artículo en cuestión tiene como objetivo rastrear el compor-tamiento de las estructuras de propiedad dispersas, dominantes y con-centradas en Brasil y verificar cuál de estas estructuras es más eficiente operacionalmente y si hay un patrón a seguir.Originalidad/laguna/relevancia/implicaciones: Para calcular la eficiencia de la variable dependiente, técnicas de optimización estática son uti-lizadas por el Análisis Envolvente de Datos (DEA), un diferencial con respecto a estudios previos que sólo tienen en cuenta rendimiento como indicador de resultado. El artículo es uno de los primeros en el área que traza el nivel de eficiencia de las estructuras de propiedad en Brasil.Principales aspectos metodológicos: La muestra se compone de 8.298 empresas-año entre 1995 y 2012. Para el cálculo de la eficiencia (varia-ble dependiente) se utilizan técnicas de optimización estática a través del Análisis Envolvente de Datos (DEA). Después, es aplicado el método
Patterns of efficiency in dispersed, dominant and concentrated ownership structures in Brazil
Mackenzie Management Review (REV. ADM. MACKENZIE – RAM), 18(3), 232-259 • SÃO PAULO, SP • MAY/JUN. 2017ISSN 1678-6971 (electronic version) • http://dx.doi.org/10.1590/1678-69712017/administracao.v18n3p232-259
255
de datos de panel no equilibrado por GMM-Sys (Método Generalizado de Momentos Sistémico).Síntesis de los principales resultados: Los resultados muestran que, a pesar de todas las variables ser positivamente relacionadas con la eficien-cia, el padrón se presenta en forma de “U” invertido, es decir, estructu-ras dispersas y concentradas son menos eficientes que las dominantes.Principales consideraciones/conclusiones: El estudio identifica que tanto los problemas de agencia, como la expropiación de los accionistas mino-ritarios por mayoritarios, debido a la escasa protección jurídica del país, afectan significativamente la eficiencia de las empresas brasileñas, haciendo con que las estructuras dominantes sean la forma más adecuada de estructura de propiedad en Brasil.
PALABRAS CLAVE
Gobernanza. Eficiencia. Estructura de la propiedad. Patrón. Optimización.
REFERENCES
Aldrighi, D. M., & Mazzer, R. (2007, April/June). Evidências sobre as Estru-turas de Propriedade de Capital e de Voto das Empresas de Capital Aberto no Brasil. [Evidence on capital ownership structure and voting in publicly traded companies in Brazil.] Revista Brasileira de Economia, 61(2), 129-152. DOI: 10.1590/S0034-71402007000200001.Almeida, H., Campello, M., & Galvão, A. F. (2010). Measurement Errors in Investment Equations. Review of Financial Studies, 23(9), 3279-3328. DOI: 10.1093/rfs/hhq058.Arellano, M., Bond, S. (1991, April). Some tests of specification for panel data: Monte Carlo evidence and an application to employment equations. Review of Economic Studies, 58(2), 277-297. DOI: 10.2307/2297968.Bae, K. H., Baek, J. S., Kang, J. K., & Liu, W. L. (2012). Do controlling sha-reholders’ expropriation incentives imply a link between corporate gover-nance and firm value? Theory and evidence. Journal of Financial Economics, 105(2), 412-435. DOI: 10.1016/j.jfineco.2012.02.007.Belkaoui, A., & Pavlik, E. (1992, August). The Effects of Ownership Struc-ture and Diversification Strategy on Performance. Managerial and Decision Economics, 13(4), 343-352. DOI: 0.1002/mde.4090130409.
Mackenzie Management Review (REV. ADM. MACKENZIE – RAM), 18(3), 232-259 • SÃO PAULO, SP • MAY/JUN. 2017ISSN 1678-6971 (electronic version) • http://dx.doi.org/10.1590/1678-69712017/administracao.v18n3p232-259
256
Igor Bernardi Sonza
Black, B. S., Carvalho, A. G. De, & Gorga, E. (2012, September). What matters and for which firms for corporate governance in emerging markets? Evidence from Brazil (and other BRIK countries). Journal of Corporate Finance, 18(4), 934-952. DOI: 10.1016/j.jcorpfin.2011.10.001.Blundell, R., & Bond, S. (1998). Initial conditions and moment restrictions in dynamic panel data models. Journal of Econometrics, 87, 115-143. DOI: 10.1016/S0304-4076(98)00009-8.Boubakri, N., Cosset, J. C. (1998, June). The Financial and Operating Per-formance of Newly Privatized Firms: Evidence from Developing Countries. Journal of Finance, 53(3), 1081-1110. DOI: 0.1111/0022-1082.00044.Chen, M. (2013, January). Adjustments in managerial ownership and chan-ges in firm value. International Review of Economics and Finance, 25(1), 1-12. DOI: 10.1016/j.iref.2012.04.008.Claessens, S., & Yurtoglu, B. B. (2013, June). Corporate governance in emerging markets: A survey. Emerging Markets Review, 15(1), 1-33. DOI: 10.1016/j.ememar.2012.03.002.Clemente, A., Antonelli, R. A., Scherer, L. M., & Cherobim, A. P. M. S. (2014, April/June). O mercado brasileiro precifica a adesão e a migração aos níveis diferenciados de governança corporativa? [Does the Brazilian market price the adhesion and migration to differentiated levels of corporate governan-ce?] BASE – Revista de Administração e Contabilidade da Unisinos. 11(2), 140-152. DOI: 10.4013/base.2014.112.04.Coles, J. L., Lemmon, M. L., & Meschke, J. F. (2012, January). Structural models and endogeneity in corporate finance: The link between managerial ownership and corporate performance. Journal of Financial Economics, 103(1), 149-168. DOI: 10.1016/j.jfineco.2011.04.002.Cornelli, F., Kominek, Z., & Ljungqvist, A. (2013, April). Monitoring Mana-gers: Does It Matter? Journal of Finance, 68(2), 431-481. DOI: 10.1111/jofi.12004.Connelly, J. T., Limpaphayom, P., & Nagarajan, N. J. (2012, June). Form ver-sus substance: The effect of ownership structure and corporate governance on firm value in Thailand. Journal of Banking & Finance, 36(6), 1722-1743. DOI: 10.1016/j.jbankfin.2012.01.017.Ferreira, R. do N. (2012). Governança corporativa e desempenho: uma análise em empresas brasileiras de capital aberto. [Corporate governance and performance: an analysis of publicly traded Brazilian companies.] PhD Thesis, Federal University of Lavras, Lavras, Minas Gerais, Brazil, 275 p.
Patterns of efficiency in dispersed, dominant and concentrated ownership structures in Brazil
Mackenzie Management Review (REV. ADM. MACKENZIE – RAM), 18(3), 232-259 • SÃO PAULO, SP • MAY/JUN. 2017ISSN 1678-6971 (electronic version) • http://dx.doi.org/10.1590/1678-69712017/administracao.v18n3p232-259
257
Frydman, R., Gray, C., Hessel, M., & Rapaczynski, A. (1999, November). When Does Privatization Work? The Impact of Private Ownership on Cor-porate Performance in the Transition Economies. Quarterly Journal of Econo-mics, 114(4), 1153-1191. DOI: 10.1162/003355399556241.Giannetti, M., & Laeven, L. (2009). Pension Reform, Ownership Structure, and Corporate Governance. The Review of Financial Studies, 22(10), 4091-4127. DOI: 10.1093/rfs/hhn091.Góis, A. D., Parente, P. H. N., & Ponte, V. M. R. (2015, January/March). Estrutura de propriedade e investimentos em P&D: uma análise nas compa-nhias abertas do Brasil. [Ownership structure and investments in R&D: an analysis of publicly traded companies in Brazil.] BASE – Revista de Administra-ção e Contabilidade da Unisinos, 12(1), 2-14. DOI: 10.4013/base.2015.121.0.Hamadi, M. (2010, May). Ownership concentration, family control and performance of firms. European Management Review, 7(2), 116-131. DOI: 10.1057/emr.2010.9.Hansen, L. P. (1982). Large Sample Properties of Generalized Method of Moments Estimators. Econometrica, 50(4), 1029-1054. DOI: 10.2307/ 1912775.Hotchkiss, E. S., & Strickland, D. (2003, August). Does Shareholder Com-position Matter? Evidence from the Market Reaction to Corporate Earnings Announcements. Journal of finance, 58(4):1469-1498. DOI: 10.1111/1540-6261.00574.Jensen, M., & Meckling, W. (1976). Theory of the Firm: Managerial Beha-vior, Agency Costs and Ownership Structure. Journal of Financial Economics, 3(4), 305-360. DOI: 10.1016/0304-405X(76)90026-X.Kang, Y. S., & Kim, B. Y. (2012, June). Ownership structure and firm perfor-mance: Evidence from the Chinese corporate reform. China Economic Review, 23(2), 471-481.Khorana, A., Servaes, H., & Wedge, L. (2007). Portfolio manager ownership and fund performance. Journal of Financial Economics, 85(1), 179-204. DOI: 10.1016/j.jfineco.2006.08.001.La Porta, R., Lopez-De-Silanes, F., & Shleifer, A. (1999, April). Corpora-te Ownership Around the World. Journal of finance, 54(2), 471-517. DOI: 10.1111/0022-1082.00115.La Porta, R., Lopez-De-Silanes, F., Shleifer, A., & Vishny, R. (1998). Law and Finance. Journal of Political Economy, 160(6), 1113-1155. DOI: 10.1086/250042.
Mackenzie Management Review (REV. ADM. MACKENZIE – RAM), 18(3), 232-259 • SÃO PAULO, SP • MAY/JUN. 2017ISSN 1678-6971 (electronic version) • http://dx.doi.org/10.1590/1678-69712017/administracao.v18n3p232-259
258
Igor Bernardi Sonza
Laeven, L., & Levine, R. (2008). Complex Ownership Structures and Cor-porate Valuations. Review of Financial Studies, 21(2), 579-604. DOI: 10.1093/rfs/hhm068.
Lin, C., Ma, Y., Malatesta, P., & Xuan, Y. (2012, April). Corporate ownership structure and bank loan syndicate structure. Journal of Financial Economics, 104(1), 1-22. DOI: 10.1016/j.jfineco.2011.10.006.
Lin, C., Ma, Y., Malatesta, P., & Xuan, Y. (2013, August). Corporate owner-ship structure and the choice between bank debt and public debt. Journal of Financial Economics, 109(2), 517-534. DOI: 10.1016/j.jfineco.2013.03.006.
Lin, C., Ma, Y., & Xuan, Y. (2011, November). Ownership structure and financial constraints: Evidence from a structural estimation. Journal of Finan-cial Economics, 102(2), 416-431. DOI: 10.1016/j.jfineco.2011.06.001.
Macedo, M. A. D. S., & Corrar, L. J. (2012 January/April). Análise compa-rativa do desempenho contábil-financeiro de empresas com boas práticas de governança corporativa no Brasil. [Comparative analysis of financial-accounting performance of companies with good corporate governance prac-tices in Brazil.] Revista Contabilidade e Controladoria – RC&C, 4(1), 42-61. DOI: http://dx.doi.org/10.5380/rcc.v4i1.25258.
Margaritis, D., & Psillaki, M. (2010, March). Capital structure, equity own-ership and firm performance. Journal of Banking & Finance, 34(3), 621-632. DOI: 10.1016/j.jbankfin.2009.08.023.
Min, B. S., & Smyth, R. (2014, July). Corporate governance, globaliza-tion and firm productivity. Journal of World Business, 49(3), 372-385. DOI: 10.1016/j.jwb.2013.07.004.
Morck, R. K., Shleifer, A., & Vishny, R. W. 1988. Management ownership and market valuation: an empirical analysis. Journal of Financial Economics, 20(1), 293-315. DOI: 10.1016/0304-405X(88)90048-7.
Ng, C. Y. M. (2005). An Empirical Study on the Relationship Between Owner-ship and Performance in a Family-Based Corporate Environment. Journal of accounting, auditing & finance, 20(2), 121-146.
Paligorova, T., & Xu, Z. (2012, setembro). Complex ownership and capital structure. Journal of Corporate Finance, 18(4), 701-716. DOI: 10.1016/j.jcor-pfin.2012.05.001.
Pedersen, T., & Thomsen, S. (1997, October-December). European patterns of corporate ownership: a twelve-country study. Journal of International Busi-ness Studies, 28(4), 759-778. DOI: 10.1057/palgrave.jibs.8490118.
Patterns of efficiency in dispersed, dominant and concentrated ownership structures in Brazil
Mackenzie Management Review (REV. ADM. MACKENZIE – RAM), 18(3), 232-259 • SÃO PAULO, SP • MAY/JUN. 2017ISSN 1678-6971 (electronic version) • http://dx.doi.org/10.1590/1678-69712017/administracao.v18n3p232-259
259
Pinto, M. B., & Leal, R. B. C. (2013, Maio-Junho). Ownership concentra-tion, top management and board compensation. Revista de Administração Con-temporânea – RAC, 17(3), 304-324.Samaha, K., Dahawy, K., Hussainey, K., & Stapleton, P. (2012, June). The extent of corporate governance disclosure and its determinants in a develo-ping market: The case of Egypt. Advances in Accounting, 28(1), 168-178.San Martin-Reyna, J. M., & Duran-Encalada, J. A. (2012, June). The relation-ship among family business, corporate governance and firm performance: Evidence from the Mexican stock exchange. Journal of Family Business Strategy, 3(2), 106-117. DOI: 10.1016/j.jfbs.2012.03.001.Silveira, A. D. (2004). Governança corporativa e estrutura de propriedade: deter-minantes e relação com o desempenho das empresas no Brasil. [Corporate governance and ownership structure: determinants and relation with the performance of companies in Brazil.] PhD Thesis, University of São Paulo – USP, São Paulo, São Paulo, Brazil, 250 p.Tone, K. (2001, May). A slacks-based measure of efficiency in data envelop-ment analysis. European Journal of Operational Research, 130(3), 498-509. DOI: 10.1016/S0377-2217(99)00407-5.Villalonga, B., & Amit, R. (2009). How Are U.S. Family Firms Controlled? Review of Financial Studies, 22(8), 3047-3091. DOI: 10.1093/rfs/hhn080.Wang, W. K., Lu, W. M., & Lin, Y. L. (2012, May). Does corporate gover-nance play an important role in BHC performance? Evidence from the U.S. Economic Modelling, 29(3), 751-760. DOI: 10.1016/j.econmod.2012.01.021.