Embed Size (px)
Citation preview
Patterns of ProPeller scarring
of seagrass in florida Bay
ResouRce evaluation RepoRt
sFnRc technical series2008:1
associations with physical and visitor use Factors and implications for natural Resource Management
National Park ServiceU.S. Department of the Interior
South Florida Natural Resources CenterEverglades National Park


Patterns of ProPeller scarring of seagrass in florida Bay
Associations with Physical and Visitor Use Factors and
Implications for Natural Resource Management
ResouRce evaluation RepoRtsFnRc technical series 2008:1
south Florida natural Resources center
everglades national park
Homestead, Florida
national park service
u.s. Department of the interior
cover photograph of north end of lower arsnicker Key by lori oberhofer, enp

ii south Florida natural Resources center technical series (2008:1)

iiipatterns of propeller scarring of seagrass in Florida Bay
Patterns of Propeller Scarring of Seagrass in Florida Bay:Associations with Physical and Visitor Use Factors and Implications for Natural Resource ManagementResouRce evaluation RepoRtsFnRc technical series 2008:1
ExEcUtIVE SUMMARy
Everglades National Park (ENP) encompasses over 200,000 hectares of marine environments, including most of Florida Bay. The ENP portion of Florida Bay was federally designated as submerged wilderness in 1978. Much of Florida Bay sup-ports submerged aquatic vegetation comprised of seagrass that provides vast areas of habitat for recreationally and com-mercially important fish and invertebrates. Florida Bay is a premier shallow-water recreational fishing destination and it is heavily used by recreational boaters for access to produc-tive fishing areas. While the primary stressors in Florida Bay are related to watershed management, recreational boat use has also resulted in damage to benthic resources. Identifica-tion of propeller scarred seagrass beds has been a critical data need by park managers and the public in the development of the park’s General Management Plan (GMP) and for natural resource management projects.
To integrate information on propeller scarred seagrass in the development of the GMP and to assist with developing a park-wide seagrass restoration strategy, we analyzed aerial imagery of Florida Bay. We used resulting data to provide information on the pattern and relative density of seagrass scarring and to determine if scarring damage is getting better or worse. We also used high resolution imagery, available for only a small portion of the bay, to estimate our level of scar de-tection. Finally, we used geospatial analyses to help determine if scarring density was related to water depth and proximity to shorelines, boat ramps, marked and unmarked navigational channels, and boating activity.
Key Findings
General Results
We detected approximately 12,000 seagrass scars.
Scar lengths ranged from approximately 2 to 1600 meters.
The total length of scars was approximately 525,000 me-ters (325 miles).
Scars are present throughout the shallow areas of Florida Bay.
High resolution imagery suggests that our primary imag-ery may underestimate total scarring distance by a factor
of approximately 10, i.e., there may be as many as 3250 miles of scars in Florida Bay.
Substantially more scarring was identified in this study than in a previous study conducted in 1995.
Patterns and Associations
The majority of scarring was identified in depths below 3.0 ft and scarring density tends to increase with decreasing depth.
Dense scarring is more likely in close proximity to marked and unmarked channels and shorelines.
The density of scarring around marked and unmarked channels is similar.
Scarring density is higher in areas that are most heavily used by recreational boats.
Scarring density was not related to proximity to boat ramps in the Florida Keys or Flamingo.
Scarring is increasing in specific sites in Florida Bay.
A propeller dredged channel, identified in 1995, has been steadily increasing in area.
Summary and Recommendations
Seagrass scarring in Florida Bay is widespread with dense scarring found in shallow depths, near all navigational channels, and around areas most heavily used by boats.
Although seagrass damage assessments using aerial imag-ery often underestimate scarring, they provide useful in-formation on pattern and relative density.
Because scarring is not improving with time, new manage-ment strategies are warranted to protect submerged wil-derness resources and reduce stressors as part of an over-all approach to ecosystem management in Florida Bay.
An adaptive approach, initially focusing on the most heav-ily scarred areas, should consider monitoring data from specific indicator sites with a variety of management op-tions including education, improved signage, new en-forcement efforts, and boating restrictions, such as pole and troll zones.

iv south Florida natural Resources center technical series (2008:1)

vpatterns of propeller scarring of seagrass in Florida Bay
tABlE oF coNtENtS
executive summaRy . . . . . . . . . . . . . . . . . . . . . . . . . . . . . . . . . . . . . . . . . . . . . . . . . . . . . . . . . . . . . . . . . . . . . . . . . . . . iii
contRiButing autHoRs . . . . . . . . . . . . . . . . . . . . . . . . . . . . . . . . . . . . . . . . . . . . . . . . . . . . . . . . . . . . . . . . . . . . . . . . . vi
acKnowleDgements . . . . . . . . . . . . . . . . . . . . . . . . . . . . . . . . . . . . . . . . . . . . . . . . . . . . . . . . . . . . . . . . . . . . . . . . . . . vi
FoRewoRD . . . . . . . . . . . . . . . . . . . . . . . . . . . . . . . . . . . . . . . . . . . . . . . . . . . . . . . . . . . . . . . . . . . . . . . . . . . . . . . . . . . . . vii
intRoDuction . . . . . . . . . . . . . . . . . . . . . . . . . . . . . . . . . . . . . . . . . . . . . . . . . . . . . . . . . . . . . . . . . . . . . . . . . . . . . . . . . . 1
metHoDs . . . . . . . . . . . . . . . . . . . . . . . . . . . . . . . . . . . . . . . . . . . . . . . . . . . . . . . . . . . . . . . . . . . . . . . . . . . . . . . . . . . . . . . . 5
scar mapping . . . . . . . . . . . . . . . . . . . . . . . . . . . . . . . . . . . . . . . . . . . . . . . . . . . . . . . . . . . . . . . . . . . . . . . . . . . . . . . . . . . . 5prop scar change analysis . . . . . . . . . . . . . . . . . . . . . . . . . . . . . . . . . . . . . . . . . . . . . . . . . . . . . . . . . . . . . . . . . . . . . . . . . . 5geospatial analysis . . . . . . . . . . . . . . . . . . . . . . . . . . . . . . . . . . . . . . . . . . . . . . . . . . . . . . . . . . . . . . . . . . . . . . . . . . . . . . . . 6
Results . . . . . . . . . . . . . . . . . . . . . . . . . . . . . . . . . . . . . . . . . . . . . . . . . . . . . . . . . . . . . . . . . . . . . . . . . . . . . . . . . . . . . . . . 11
scar mapping . . . . . . . . . . . . . . . . . . . . . . . . . . . . . . . . . . . . . . . . . . . . . . . . . . . . . . . . . . . . . . . . . . . . . . . . . . . . . . . . . . . 11change analysis . . . . . . . . . . . . . . . . . . . . . . . . . . . . . . . . . . . . . . . . . . . . . . . . . . . . . . . . . . . . . . . . . . . . . . . . . . . . . . . . . 11geospatial analysis . . . . . . . . . . . . . . . . . . . . . . . . . . . . . . . . . . . . . . . . . . . . . . . . . . . . . . . . . . . . . . . . . . . . . . . . . . . . . . . 12
Discussion . . . . . . . . . . . . . . . . . . . . . . . . . . . . . . . . . . . . . . . . . . . . . . . . . . . . . . . . . . . . . . . . . . . . . . . . . . . . . . . . . . . . 20
secondary impacts . . . . . . . . . . . . . . . . . . . . . . . . . . . . . . . . . . . . . . . . . . . . . . . . . . . . . . . . . . . . . . . . . . . . . . . . . . . . . . . . 22management implications . . . . . . . . . . . . . . . . . . . . . . . . . . . . . . . . . . . . . . . . . . . . . . . . . . . . . . . . . . . . . . . . . . . . . . . . . . 23
liteRatuRe citeD . . . . . . . . . . . . . . . . . . . . . . . . . . . . . . . . . . . . . . . . . . . . . . . . . . . . . . . . . . . . . . . . . . . . . . . . . . . . . . . 26
vi south Florida natural Resources center technical series (2008:1)
Please reference this report as follows: SFNRC. 2008. Patterns of Propeller Scarred Seagrass in Florida Bay: Associations with Physical and Visitor Use Factors and Implications for
Natural Resource Management. South Florida Natural Resources Center, Everglades National Park, Homestead, FL. Resource Evaluation Report. SFNRC Technical Series 2008:1. 27 pp.
coNtRIBUtINg AUthoRS
David E. Hallac1, Jimi Sadle1, Leonard Pearlstine1, and Fred Herling2
1South Florida Natural Resources Center, Everglades National Park, 950 N. Krome Avenue, Homestead, FL 33030-44432Planning and Compliance Division, Everglades National Park, 40001 State Road 9336, Homestead, FL 33034-6733
comments and Questions: [email protected]
AcKNowlEdgMENtS
We would like to thank Judson Kenworthy and Mark Fonseca for their review and thoughtful suggestions, as well as Carol Mitch-ell for coordinating the review. We are grateful for the editing and document production perfomed by Alice Clarke, Joy Brunk, and Caryl Alarcon. This project would not have been possible without data collected and maintained by Florida Fish and Wildlife Conservation Commission - Fish and Wildlife Research Institute (FWC-FWRI). The NPS South Florida and Caribbean Network greatly contributed to this project by supplying imagery. Discussions and resources provided by Curtis Kruer and Coastal Re-sources Group greatly enhanced this study. Our discussions with Bob Showler, Bonnie Foist, Cara Cooper, Dave Fowler, Craig Smith, Dave King, Douglas Morrison, William Perry, and Tony Terry helped in the development of this report. We would also like to thank Tad Burke, Sandy Moret, and Mike Ehlers of the Florida Keys Fishing Guides Association, Lain Goodwin of the Key Largo Fishing Guides Association, Bob Stearns, and Lloyd Wruble for their insights and recommendations. We thank the National Parks Conservation Association and their Coalition of Park Users group, based out of the Florida Keys, and the South Florida National Parks Trust for their recognition of these important issues and support of this project.

viipatterns of propeller scarring of seagrass in Florida Bay
FoREwoRd
This report, “Patterns of Propeller Scarring of Seagrass in Florida Bay,” represents our continuing advancement in Everglades National Park’s ability to perform science-based assessments of the natural resources in Florida Bay. Florida Bay’s submerged aquatic vegetation and bottom communities were defined as federally designated wilderness in 1978, to protect this internationally significant resource. The health of these benthic communities is directly tied to commercially and recreationally important fisheries and the health of the adjacent Florida Keys reef tract. For decades, propeller scarring has been identified as a stressor affecting the park’s vast seagrass resources, but we have been unable to quantify the impacts.
While the primary stressors in Florida Bay are related to the impacts of upstream water management, increasing recreational boat use in the shallow waters of the bay has resulted in damage to important seagrass communities. For the first time, this report provides an assessment of the spatial and temporal patterns of propeller scarring of the seagrass communities of Florida Bay. In addition, the report specifically incorporates geospatial statistics to augment our understanding of the factors affecting propeller scarring, ultimately providing applied results that will assist in the development and evaluation of natural resource management plans.
As our efforts to update the park’s General Management Plan progress, more in-depth monitoring will be required to establish a baseline for a number of indicator locations. Monitoring will be used to determine if management strategies are effective in reducing the propeller scarring problem and to implement new strategies, if warranted. While the analytical approach reported here works well within Florida Bay, new methods need to be developed in the future for quantifying seagrass cover and damage along the park’s western coastline, where turbidity often masks scarring.
Everglades National Park managers and staff will use the results of this study to develop a new, bay-wide restoration strategy that identifies areas most in need of improvement, and determines optimal assessment methods and management actions, while making recreational users full partners in our protection and restoration efforts. Everglades National Park looks forward to our continuing efforts to work with our partner agencies and the public in the development of sustainable management actions to protect these important resources for future generations.
Robert JohnsonDirectorSouth Florida Natural Resources CenterEverglades National Park
November, 2008

viii south Florida natural Resources center technical series (2008:1)
�patterns of propeller scarring of seagrass in Florida Bay
INtRodUctIoN
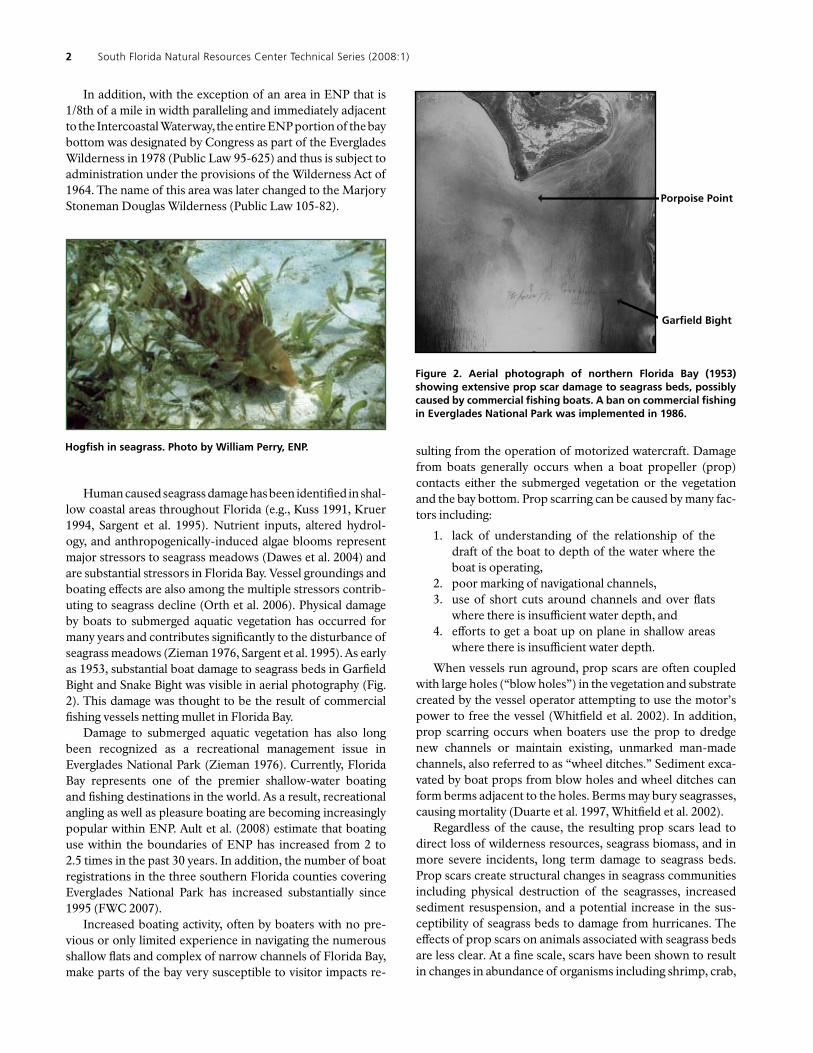
Everglades National Park (ENP) encompasses approximately 607,000 hectares (ha) at the southern tip of peninsular Flor-ida. The park comprises the largest subtropical wilderness in North America, and is the only area in the United States des-ignated as an International Biosphere Reserve, a World Heri-tage Site, and a Wetland of International Importance. Legisla-tion establishing ENP in 1934 emphasized that “…areas shall be permanently reserved as a wilderness, and no develop-ment of the project or plan for the entertainment of visitors shall be undertaken which will interfere with the preservation intact of the unique flora and fauna and the essential primi-tive natural conditions now prevailing in this area.” Included within the park boundary are over 200,000 ha (500,000 acres) of marine environments, including portions of Florida Bay (ca. 162,000 ha) (Fig. 1).
Florida Bay is characterized by extensive areas of shal-low water, punctuated by deeper natural basins separated by
banks with natural and man-made channels connecting them. Much of the bay bottom supports submerged aquatic veg-etation made up of seagrasses (e.g., Thallasia testudinum and Halodule wrightii) and marine algae of various species. These vegetated areas serve as nursery habitat for commercially im-portant fisheries, such as spiny lobster (Panulirus argus), stone crab (Menippe mercenaria), pink shrimp (Farfantepenaeus duorarum), and a variety of reef fish species. The bay and its submerged vegetation also provide habitat and feeding grounds for state and federally listed species such as manatees (Trichechus manatus), the smalltooth sawfish (Pristis pecti-nata), and sea turtles including loggerhead (Caretta caretta), green (Chelonia mydas), Kemp’s ridley (Lepidochelys kempi), and hawksbill (Eretmochelys imbricata). Recreationally im-portant fish species including bonefish (Albula vulpes), spot-ted seatrout (Cynoscion nebulosus), gray snapper (Lutjanus griseus), snook (Centropomus undecimalis), redfish (Sciaenops ocellatus), and tarpon (Magalops atlanticus) also utilize Florida Bay.
Figure �. the Florida Bay portion of Everglades National Park (ENP), Florida, and designated wilderness areas.
� south Florida natural Resources center technical series (2008:1)
In addition, with the exception of an area in ENP that is 1/8th of a mile in width paralleling and immediately adjacent to the Intercoastal Waterway, the entire ENP portion of the bay bottom was designated by Congress as part of the Everglades Wilderness in 1978 (Public Law 95-625) and thus is subject to administration under the provisions of the Wilderness Act of 1964. The name of this area was later changed to the Marjory Stoneman Douglas Wilderness (Public Law 105-82).
Human caused seagrass damage has been identified in shal-low coastal areas throughout Florida (e.g., Kuss 1991, Kruer 1994, Sargent et al. 1995). Nutrient inputs, altered hydrol-ogy, and anthropogenically-induced algae blooms represent major stressors to seagrass meadows (Dawes et al. 2004) and are substantial stressors in Florida Bay. Vessel groundings and boating effects are also among the multiple stressors contrib-uting to seagrass decline (Orth et al. 2006). Physical damage by boats to submerged aquatic vegetation has occurred for many years and contributes significantly to the disturbance of seagrass meadows (Zieman 1976, Sargent et al. 1995). As early as 1953, substantial boat damage to seagrass beds in Garfield Bight and Snake Bight was visible in aerial photography (Fig. 2). This damage was thought to be the result of commercial fishing vessels netting mullet in Florida Bay.
Damage to submerged aquatic vegetation has also long been recognized as a recreational management issue in Everglades National Park (Zieman 1976). Currently, Florida Bay represents one of the premier shallow-water boating and fishing destinations in the world. As a result, recreational angling as well as pleasure boating are becoming increasingly popular within ENP. Ault et al. (2008) estimate that boating use within the boundaries of ENP has increased from 2 to 2.5 times in the past 30 years. In addition, the number of boat registrations in the three southern Florida counties covering Everglades National Park has increased substantially since 1995 (FWC 2007).
Increased boating activity, often by boaters with no pre-vious or only limited experience in navigating the numerous shallow flats and complex of narrow channels of Florida Bay, make parts of the bay very susceptible to visitor impacts re-
sulting from the operation of motorized watercraft. Damage from boats generally occurs when a boat propeller (prop) contacts either the submerged vegetation or the vegetation and the bay bottom. Prop scarring can be caused by many fac-tors including:
1. lack of understanding of the relationship of the draft of the boat to depth of the water where the boat is operating,
2. poor marking of navigational channels, 3. use of short cuts around channels and over flats
where there is insufficient water depth, and 4. efforts to get a boat up on plane in shallow areas
where there is insufficient water depth.
When vessels run aground, prop scars are often coupled with large holes (“blow holes”) in the vegetation and substrate created by the vessel operator attempting to use the motor’s power to free the vessel (Whitfield et al. 2002). In addition, prop scarring occurs when boaters use the prop to dredge new channels or maintain existing, unmarked man-made channels, also referred to as “wheel ditches.” Sediment exca-vated by boat props from blow holes and wheel ditches can form berms adjacent to the holes. Berms may bury seagrasses, causing mortality (Duarte et al. 1997, Whitfield et al. 2002).
Regardless of the cause, the resulting prop scars lead to direct loss of wilderness resources, seagrass biomass, and in more severe incidents, long term damage to seagrass beds. Prop scars create structural changes in seagrass communities including physical destruction of the seagrasses, increased sediment resuspension, and a potential increase in the sus-ceptibility of seagrass beds to damage from hurricanes. The effects of prop scars on animals associated with seagrass beds are less clear. At a fine scale, scars have been shown to result in changes in abundance of organisms including shrimp, crab,
Figure �. Aerial photograph of northern Florida Bay (�953) showing extensive prop scar damage to seagrass beds, possibly caused by commercial fishing boats. A ban on commercial fishing in Everglades National Park was implemented in �986.
Porpoise Point
garfield Bight
hogfish in seagrass. Photo by william Perry, ENP.

3patterns of propeller scarring of seagrass in Florida Bay
and molluscs (Uhrin and Holmquist 2003). However, on larg-er scales, no relationship between scarring density and abun-dance of similar organisms has been detected (e.g., Bell et al. 2002, Burfeind and Stunz 2006). Burfeind and Stunz (2007) did detect reductions in the growth rates of both pinfish and white shrimp in heavily scarred areas, indicating a potential impact on habitat quality at some scarring levels. Fonseca and Bell (1998) observed rapid loss in structural complexity of seagrass habitat when fragmentation exceeded 50% cov-erage. Further studies are needed to clarify the relationship between small and large scale effects of prop scarring and the overall impacts of prop scars on organisms that depend on submerged aquatic vegetation.
Estimates of recovery time for prop scars vary depend-ing on the severity of the scar and the seagrass species that is damaged. Estimates range from as little as 0.9 years (Sargent et al. 1995) to 7.6 years (Andorfer and Dawes 2002). Recent model-derived estimates of scarring recovery in T. testudinum beds suggest that some areas in the Florida Keys may require 60 years for recovery (Fonseca et al. 2004). Recovery rates are much slower when scarring is deep. Excavations between 10 and 20 cm may destroy the connection of seagrass blades to belowground seagrass rhizome biomass (Hammerstrom et al. 2007). The rhizome architecture of T. testudinum, for exam-ple, is not flexible enough to grow down into the remaining sediment (Marba et al. 1994), and deep excavations are more susceptible to secondary continued erosion and expansion of scars from currents, winds, waves, and storms (Zieman 1976, Kuss 1991, Durako et al. 1992, Rodriguez et al. 1994, Hastings et al. 1995, Dawes et al. 1997, Kenworthy et al. 2002, Whitfield et al. 2002). In addition, drift algae filling scars may also slow recruitment or recovery of seagrass species (Hammerstrom et al. 2007). Halodule wrightii and Syringodium filiforme recover 5 to 7 times faster than T. testudinum in experimental excava-tions and propeller scars observed by Kenworthy et al. (2002) in the Florida Keys. As a result, boat propeller scarring may alter the community composition and abundance of different seagrass species (Kenworthy et al. 2002). Heavily used areas that are continually scarred will probably never recover under current boating pressure. Active restoration of damaged sea-grass communities is technically possible, but expensive and time consuming.
Prop scarring has been observed throughout Florida Bay in shallow flats, bights, bays, and banks and in other high use areas (Fig. 3). A large number of historical photographs show evidence of prop scarring over the years; however, to date, no detailed study has quantified the extent of seagrass damage in Florida Bay. Previous systematic efforts to map prop scars in ENP have been limited. Sargent et al. (1995) included Florida Bay in their statewide assessment of Florida’s seagrass beds and identified 814 ha (2013 acres) of scarred seagrass beds within ENP. However, lack of sufficiently detailed aerial pho-tography made it unlikely that their assessment accurately reflected the state of seagrass beds in Florida Bay at the time of the study. The park’s General Management Plan (GMP)
process that began in 2003 identified the need to better un-derstand seagrass conditions and trends (ENP 2008).
In order to implement effective marine management strat-egies that conserve and recover damaged seagrass, manag-ers must understand existing prop scarring conditions and potential associations with physical factors, such as water depth and presence/absence of aids to navigation, along with public use factors that explain how, where, and to what extent Florida Bay is visited. Little information on the locations, pat-terns, and relative density of prop scarring has been available for Florida Bay. The objectives of this study are to:
1. characterize seagrass scarring throughout Florida Bay,
2. determine if prop scarring is getting better or worse at specific locations,
3. assess potential relationships between density and location of seagrass scarring when analyzed against water depth, proximity to shorelines, proximity to marine facilities, and patterns of fishing and boat use in Florida Bay,
4. assess potential relationships between density and location of seagrass scarring and proximity to navigational channels (marked and unmarked), and
5. develop a statistical model to aid in prevention of scarring in undamaged areas.
In this report, we discuss our findings, including implica-tions for management.
Propeller scar from boat. Photo by Brett Seymour, NPS.

� south Florida natural Resources center technical series (2008:1)
Figure 3. Examples of propeller scarring in Everglades National Park photographed in �006 and �007: �) Upper cross Bank adjacent to the Intracoastal waterway; �) channel entrance at twin Key Bank; 3) Shallow passage at the Boggies; and �) Mouth of Alligator creek at garfield Bight.
1 2
3 4
5patterns of propeller scarring of seagrass in Florida Bay
MEthodS
Scar Mapping
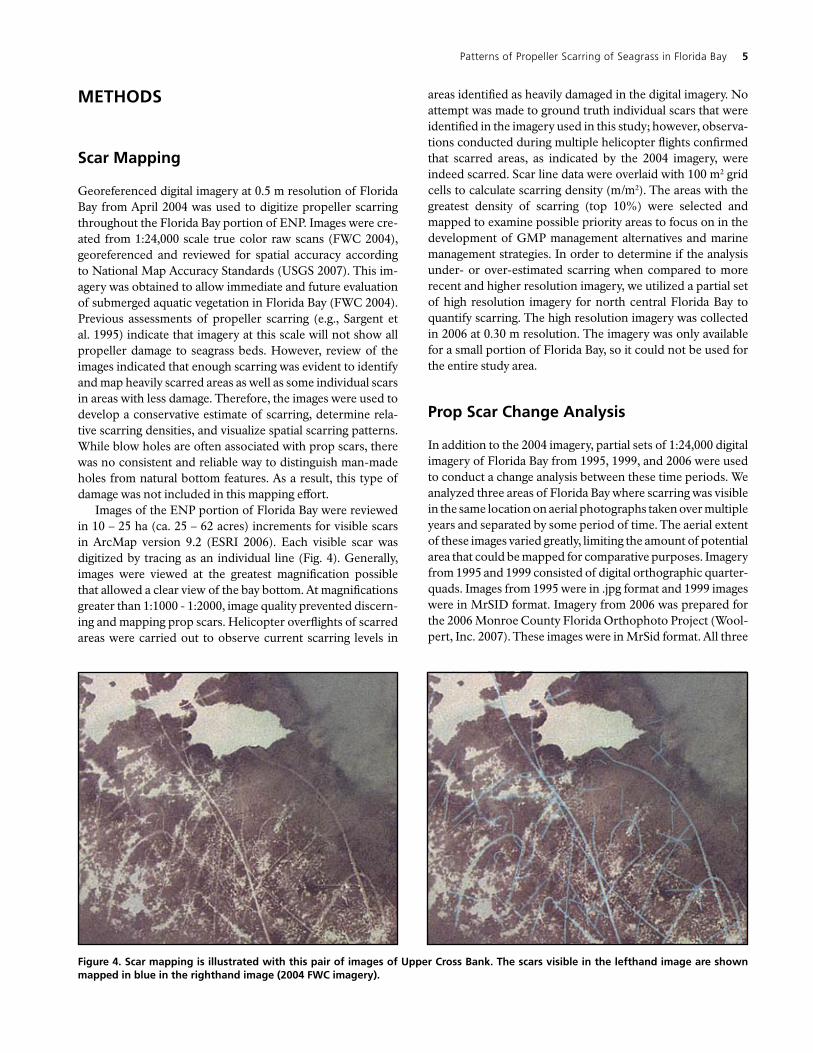
Georeferenced digital imagery at 0.5 m resolution of Florida Bay from April 2004 was used to digitize propeller scarring throughout the Florida Bay portion of ENP. Images were cre-ated from 1:24,000 scale true color raw scans (FWC 2004), georeferenced and reviewed for spatial accuracy according to National Map Accuracy Standards (USGS 2007). This im-agery was obtained to allow immediate and future evaluation of submerged aquatic vegetation in Florida Bay (FWC 2004). Previous assessments of propeller scarring (e.g., Sargent et al. 1995) indicate that imagery at this scale will not show all propeller damage to seagrass beds. However, review of the images indicated that enough scarring was evident to identify and map heavily scarred areas as well as some individual scars in areas with less damage. Therefore, the images were used to develop a conservative estimate of scarring, determine rela-tive scarring densities, and visualize spatial scarring patterns. While blow holes are often associated with prop scars, there was no consistent and reliable way to distinguish man-made holes from natural bottom features. As a result, this type of damage was not included in this mapping effort.
Images of the ENP portion of Florida Bay were reviewed in 10 – 25 ha (ca. 25 – 62 acres) increments for visible scars in ArcMap version 9.2 (ESRI 2006). Each visible scar was digitized by tracing as an individual line (Fig. 4). Generally, images were viewed at the greatest magnification possible that allowed a clear view of the bay bottom. At magnifications greater than 1:1000 - 1:2000, image quality prevented discern-ing and mapping prop scars. Helicopter overflights of scarred areas were carried out to observe current scarring levels in
areas identified as heavily damaged in the digital imagery. No attempt was made to ground truth individual scars that were identified in the imagery used in this study; however, observa-tions conducted during multiple helicopter flights confirmed that scarred areas, as indicated by the 2004 imagery, were indeed scarred. Scar line data were overlaid with 100 m2 grid cells to calculate scarring density (m/m2). The areas with the greatest density of scarring (top 10%) were selected and mapped to examine possible priority areas to focus on in the development of GMP management alternatives and marine management strategies. In order to determine if the analysis under- or over-estimated scarring when compared to more recent and higher resolution imagery, we utilized a partial set of high resolution imagery for north central Florida Bay to quantify scarring. The high resolution imagery was collected in 2006 at 0.30 m resolution. The imagery was only available for a small portion of Florida Bay, so it could not be used for the entire study area.
Prop Scar change Analysis
In addition to the 2004 imagery, partial sets of 1:24,000 digital imagery of Florida Bay from 1995, 1999, and 2006 were used to conduct a change analysis between these time periods. We analyzed three areas of Florida Bay where scarring was visible in the same location on aerial photographs taken over multiple years and separated by some period of time. The aerial extent of these images varied greatly, limiting the amount of potential area that could be mapped for comparative purposes. Imagery from 1995 and 1999 consisted of digital orthographic quarter-quads. Images from 1995 were in .jpg format and 1999 images were in MrSID format. Imagery from 2006 was prepared for the 2006 Monroe County Florida Orthophoto Project (Wool-pert, Inc. 2007). These images were in MrSid format. All three
Figure �. Scar mapping is illustrated with this pair of images of Upper cross Bank. the scars visible in the lefthand image are shown mapped in blue in the righthand image (�00� Fwc imagery).
6 south Florida natural Resources center technical series (2008:1)
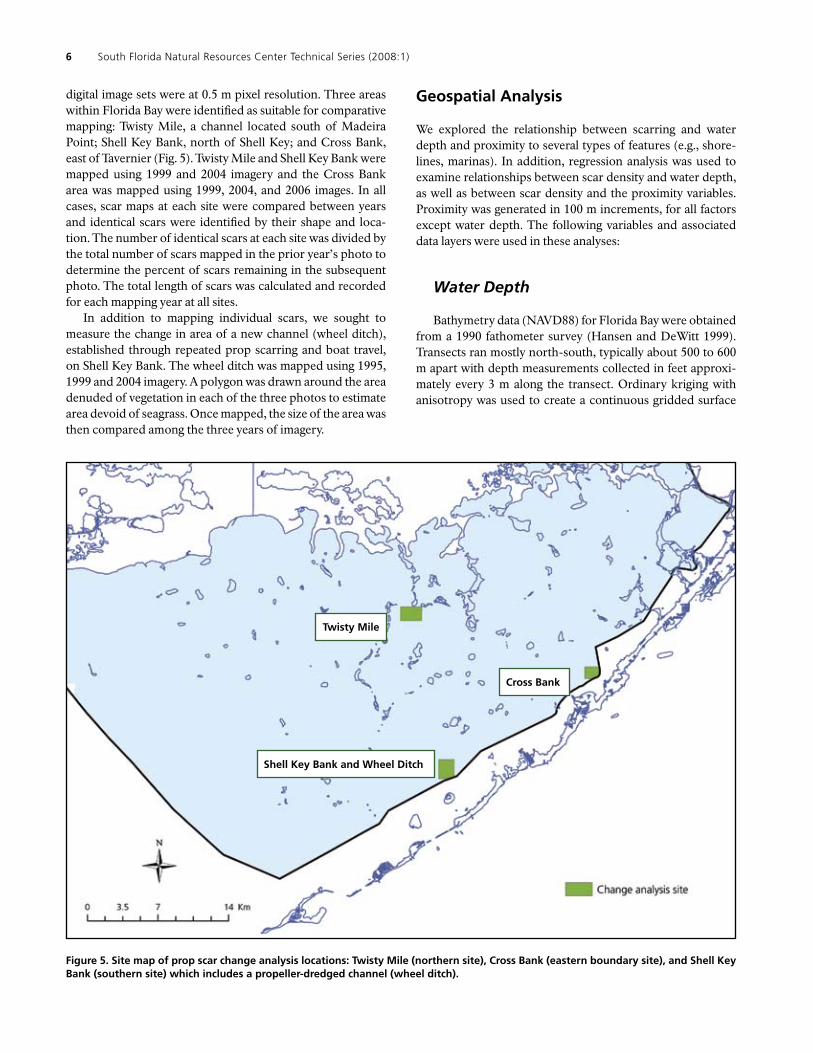
digital image sets were at 0.5 m pixel resolution. Three areas within Florida Bay were identified as suitable for comparative mapping: Twisty Mile, a channel located south of Madeira Point; Shell Key Bank, north of Shell Key; and Cross Bank, east of Tavernier (Fig. 5). Twisty Mile and Shell Key Bank were mapped using 1999 and 2004 imagery and the Cross Bank area was mapped using 1999, 2004, and 2006 images. In all cases, scar maps at each site were compared between years and identical scars were identified by their shape and loca-tion. The number of identical scars at each site was divided by the total number of scars mapped in the prior year’s photo to determine the percent of scars remaining in the subsequent photo. The total length of scars was calculated and recorded for each mapping year at all sites.
In addition to mapping individual scars, we sought to measure the change in area of a new channel (wheel ditch), established through repeated prop scarring and boat travel, on Shell Key Bank. The wheel ditch was mapped using 1995, 1999 and 2004 imagery. A polygon was drawn around the area denuded of vegetation in each of the three photos to estimate area devoid of seagrass. Once mapped, the size of the area was then compared among the three years of imagery.
geospatial Analysis
We explored the relationship between scarring and water depth and proximity to several types of features (e.g., shore-lines, marinas). In addition, regression analysis was used to examine relationships between scar density and water depth, as well as between scar density and the proximity variables. Proximity was generated in 100 m increments, for all factors except water depth. The following variables and associated data layers were used in these analyses:
Water Depth
Bathymetry data (NAVD88) for Florida Bay were obtained from a 1990 fathometer survey (Hansen and DeWitt 1999). Transects ran mostly north-south, typically about 500 to 600 m apart with depth measurements collected in feet approxi-mately every 3 m along the transect. Ordinary kriging with anisotropy was used to create a continuous gridded surface
Figure 5. Site map of prop scar change analysis locations: twisty Mile (northern site), cross Bank (eastern boundary site), and Shell Key Bank (southern site) which includes a propeller-dredged channel (wheel ditch).
twisty Mile
Shell Key Bank and wheel ditch
cross Bank

7patterns of propeller scarring of seagrass in Florida Bay
of interpolated bathymetry for the bay (RMS = 0.22 ft, average SE = 0.55 ft) at 100 m resolution.
NAVD88 vertical datum is approximately 1.345 ft (0.41 m) above mean low water (MLW) in the Florida Bay area (Hansen and DeWitt 1999). Water depths were calculated as bathymetry at each grid cell converted to feet plus 1.345 and multiplied by -1 to represent depth as a positive value.
Channels
Centerlines of all channels in Florida Bay were traced us-ing the Florida Bay Map and Guide (NPS 2006a). Unmarked channels were identified through digital imagery acquired for previous and ongoing seagrass restoration projects being car-ried out in ENP. The characterization of marked versus un-marked channels was obtained through close communication with ENP law enforcement rangers and resource managers. Distance of scarring to marked channels and distance of scar-ring to all channels was mapped in 100 m increments.
Marine Facilities
Data for marine facilities included docks, boat ramps, marinas, and other areas at which boats may congregate or launch (FWC 2006). Attributes of the point data include lo-cation and characteristics of the facility as follows: A = boat ramp, B = bank or bridge, F = fish camp, J = jetty, M = marina, O = other (e.g., hotel, resort), P = park, and S = pier. Because the marine facilities were well distributed along the Florida Keys, they generally represent the distance of scarring from the Keys and Flamingo in ENP.
Boat Use
Boat use data were collected for all marine waters in ENP between fall of 2006 and fall of 2007 using aerial methods (Ault et al. 2008). We used motorized watercraft data based on the following categories: fishing versus transit. Because ENP fish-ing reports over many years demonstrate that more than 90% of boating activity in the park is associated with recreational fishing (NPS 2006b), it is presumed that most transit activity is associated with a boat going to or from a fishing-related activ-ity, or as a recreational or commercial (guided) trip (Fig. 6).
Shorelines
Shoreline data were obtained from the National Park Service official map of ENP. These data include shorelines for all keys in Florida Bay and the entire northern coastline of ENP, from Cape Sable to Long, Little Blackwater, and Blackwater Sounds.
Analyses
Areas in which seagrasses cannot be damaged because submerged rooted vascular (SRV) cover was not present were excluded from the analysis by screening the imagery with benthic cover type data. Benthic cover type data included 47 descriptive classes for sea bottom and an upland class. These classes were aggregated into two classes relevant to this study: areas of continuous or discontinuous SRV plants and areas without SRV cover including: hard bottom, turbid plume, unconsolidated sediments, attached macroalgae, upland, and others (Fig. 7, FWC 2005). Areas with water depth greater than 6.5 ft MLW were also excluded because 99% percent of prop scarring occurs in water depths shallower than 6.5 ft MLW (Fig. 8).
Nine explanatory variables were evaluated using regres-sion analysis:
1. Water depth (Depth) 2. Proximity to all channels (ChanPx) 3. Proximity to marked channels (MChanPx) 4. Proximity to marine facilities (DockPx) 5. Proximity to shorelines (ShorePx) 6. Proximity to boats engaged in fishing (FishPx) 7. Proximity to boats cruising transiting between
locations (TransitPx) 8. Proximity to recreational boats (RecPx) 9. Proximity to commercial boats (ComPx).
Due to the widespread nature of prop scarring in Florida Bay and the likelihood that park management strategies would focus on the most heavily scarred areas, we estimated the maximum scarring that may occur at a location. A scatter plot of scarring density versus proximity to boats engaged in fishing demonstrates that scarring tends to increase as dis-Flamingo marina. ENP photo.

8 south Florida natural Resources center technical series (2008:1)
tance to boats engaged in fishing decreases (Fig. 9). At any given distance, however, all scarring densities from zero to the maximum at that distance are also present; thus, causing poor correlation in regression models. This difficulty was resolved by refocusing the analysis on most heavily scarred areas; a rea-sonable approach given that management effort should also concentration on most intensely damaged areas. Regression models tracking maximum scarring with distance often ap-pear to have a strong trend as illustrated in the example (Fig. 9). Areas with heavy scarring may also be more likely to have a maximum density of deep scarring. Deep scarring is of particular management concern because recovery rates may be much slower at these sites. Maximum scarring data were selected as the top 10% of scar density values within each 100 m interval over the range of proximity data (see example in Fig. 9). For depth data, the top 10% of scar density values was selected within each 0.03 m (0.1 ft) interval over the range of depths.
To develop a statistical model of maximum scarring, mean maximum scarring was calculated from the variables with significant regressions. Pearson’s product-moment correla-tions were performed for each unique pair of the nine vari-
ables to eliminate redundant variables. Where variables were highly correlated, only one of the variables was retained in the model.
Multiple regression techniques were not used because data values selected as a running maximum will, in the majority of cases, be selected from different locations for one explanatory variable than they will for another variable. The difficultly cre-ated is that any attempt at multiple regression analysis will have values at a location for one variable and most likely not have values at that location for the other variables. Rather than attempt complex “missing value” data manipulations, an overall estimate of maximum likely scar densities was cre-ated by calculating the mean of the most influential mapped data layers into a composite index model. That is, we used data layers that explained the greatest amount of variability as measured by their r2 values. Linear regressions were run in the R statistical software package (R Development Core Team 2007) for maximum scarring versus each of the variables. A linear model was used as the best description of each variable. Maximum estimated scar density was mapped in ESRI ArcGIS for each spatial data layer based on the regression coefficients for that variable.
Figure 6. distribution of boat use activities and boat use type in Florida Bay from �006 and �007 (Ault et al. �008).

9patterns of propeller scarring of seagrass in Florida Bay
Figure 7. Mapped occurrence of submerged rooted vascular (SRV) plants in Florida Bay (Fwc �005).
Sediment plume emanating from a prop scar made during a �00� redfish tournament around Murray Key. Photo by lori oberhofer, ENP.
Benthic cover type
SRV
No SRV

�0 south Florida natural Resources center technical series (2008:1)
Mapped Scarring by Depth
0
0.05
0.10
0.15
0.20
0.25
0.30
0.350
to
<2
.5
2.5
to
<2
.75
2.7
5 t
o <
3
3 t
o <
3.2
5
3.2
5 t
o <
3.5
3.5
to
<3
.75
3.7
5 t
o <
4
4 t
o <
4.2
5
4.2
5 t
o <
4.5
4.5
to
<4
.75
4.7
5 t
o <
5
5 t
o <
5.2
5
5.2
5 t
o <
5.5
5.5
to
<5
.75
5.7
5 t
o <
6
6 t
o <
6.2
5
6.2
5 t
o <
6.5
6.5
to
<6
.75
6.7
5 t
o <
7
7 t
o <
7.2
5
7.2
5 t
o <
7.5
7.5
to
<7
.75
7.7
5 t
o <
8
8 t
o <
8.2
5
8.2
5 t
o <
8.5
8.5
to
<8
.75
8.7
5 t
o <
9
9 t
o <
9.2
5
9.2
5 t
o <
9.5
Depth (ft MLW)
Perc
ent
of
Tota
l Sca
rrin
g
0
0.2
0.4
0.6
0.8
1.0
1.2
Cum
ula
tive
Per
cen
t Sc
arri
ng
Figure 8. Frequency and cumulative frequency of scars by water depth (ft Mlw) in Florida Bay.
Figure 9. Scarring density (m/m�) in relationship to distance from boats engaged in fishing. Blue circles are all observations. Red triangles represent the most densely scarred cells (top �0% of observations at each distance in �00 m increments). the r� for all observations is 0.005 and the r� for the top �0% of oberserva-tions is 0.8�.
Propeller scars off garfield Bight. Photo by lori oberhofer, ENP.
��patterns of propeller scarring of seagrass in Florida Bay
RESUltS
Scar Mapping
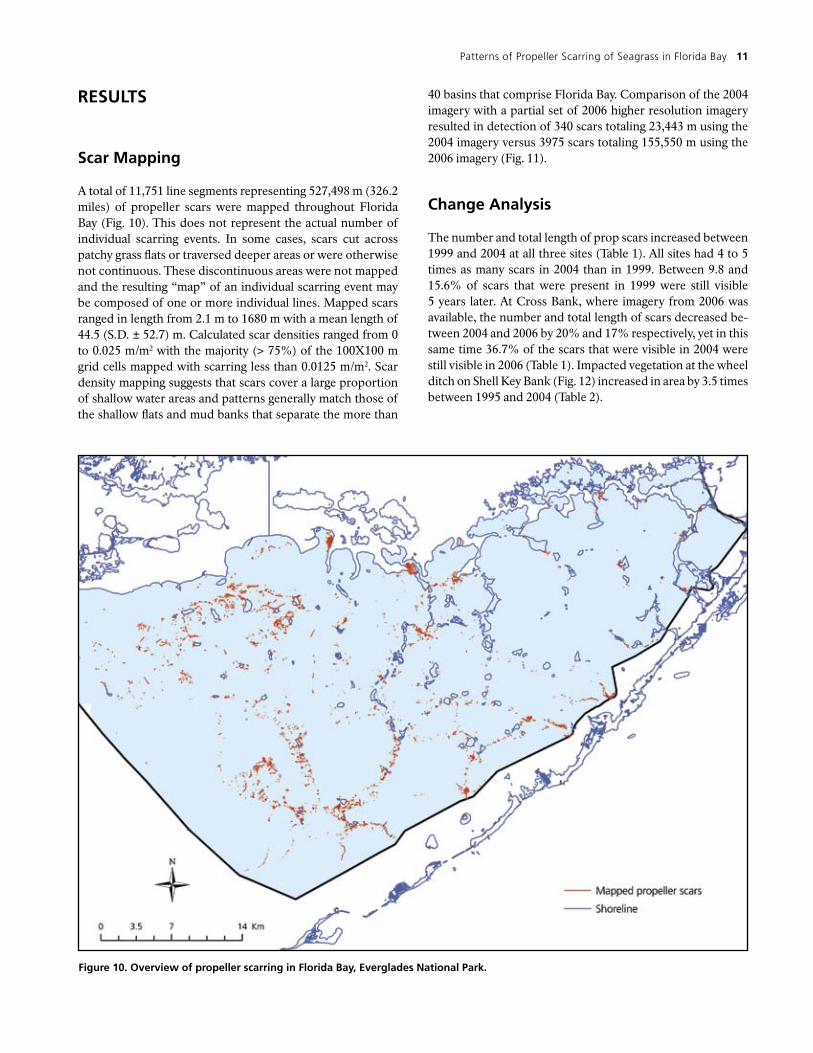
A total of 11,751 line segments representing 527,498 m (326.2 miles) of propeller scars were mapped throughout Florida Bay (Fig. 10). This does not represent the actual number of individual scarring events. In some cases, scars cut across patchy grass flats or traversed deeper areas or were otherwise not continuous. These discontinuous areas were not mapped and the resulting “map” of an individual scarring event may be composed of one or more individual lines. Mapped scars ranged in length from 2.1 m to 1680 m with a mean length of 44.5 (S.D. ± 52.7) m. Calculated scar densities ranged from 0 to 0.025 m/m2 with the majority (> 75%) of the 100X100 m grid cells mapped with scarring less than 0.0125 m/m2. Scar density mapping suggests that scars cover a large proportion of shallow water areas and patterns generally match those of the shallow flats and mud banks that separate the more than
40 basins that comprise Florida Bay. Comparison of the 2004 imagery with a partial set of 2006 higher resolution imagery resulted in detection of 340 scars totaling 23,443 m using the 2004 imagery versus 3975 scars totaling 155,550 m using the 2006 imagery (Fig. 11).
change Analysis
The number and total length of prop scars increased between 1999 and 2004 at all three sites (Table 1). All sites had 4 to 5 times as many scars in 2004 than in 1999. Between 9.8 and 15.6% of scars that were present in 1999 were still visible 5 years later. At Cross Bank, where imagery from 2006 was available, the number and total length of scars decreased be-tween 2004 and 2006 by 20% and 17% respectively, yet in this same time 36.7% of the scars that were visible in 2004 were still visible in 2006 (Table 1). Impacted vegetation at the wheel ditch on Shell Key Bank (Fig. 12) increased in area by 3.5 times between 1995 and 2004 (Table 2).
Figure �0. overview of propeller scarring in Florida Bay, Everglades National Park.

�� south Florida natural Resources center technical series (2008:1)
Figure ��. comparison of propeller scars mapped using �00� digital imagery (yellow) with �006 higher resolution imagery (red).
location year Number of Scars
length (m)
Percent of scars
remaining
Cross BankCross BankCross Bank
199920042006
83387311
43421439511959
n/a15.636.7
Shell Key BankShell Key Bank
19992004
52225
34759986
n/a15.4
Twisty MileTwisty Mile
19992004
61300
293612360
n/a9.8
table �. Number of scars, total length of scars, and percent of scars remaining from one mapping period to the next at three locations in Florida Bay, Everglades National Park.
geospatial Analysis
A wide range of scar densities occur at all distances for the proximity variables and at all depths for the water depth vari-able (Fig. 13). A larger number of cells have prop scars when they are in shallow water depths and in close proximity to: channels; shorelines; and locations where boating activities include fishing or transit for both recreational and guided trips. For all variables, regressions were significant (P≤0.001) toward higher densities of scarring as distance decreased or with decreasing water depth (Table 3 and Figs. 14 and 15). The exception was marine facilities (DockPx), which has a very low r2 and, although significant, the relationship with scar-
Scars mapped from �00� imagery
Scars mapped from �006 imagery
Shoreline

�3patterns of propeller scarring of seagrass in Florida Bay
Figure ��. time sequence of digital imagery (�995-�00�) showing continual expansion of propeller dredged wheel ditch on Shell Key Bank.
table �. Area of damaged submerged aquatic vegetation associated with a propeller dredged channel through Shell Key Bank.
location year Area of wheel ditch (ha)
Shell Key Wheel DitchShell Key Wheel DitchShell Key Wheel Ditch
199519992004
0.150.330.52
Propeller scar and associated turbidity in Florida Bay, freshly created by a fishing boat in January �008 (left and above). Photos by william Perry, ENP.
ring density suggests a very slight increase in scarring density as distance from marine facilities increases. Proximity to all channels (ChanPx) and marked channels (MChan Px) pro-duced similar r2 values and the regression analysis suggests that adding unmarked channels into the regression analy-sis does not result in an increase in scarring near channels. Regressions on boating use showed the highest r2 value for proximity to fishing boats (FishPx), followed by proximity to
1995 Wheel Ditch
1999 Wheel Ditch
2004 Wheel Ditch

�� south Florida natural Resources center technical series (2008:1)
transiting boats (TransitPx), recreational boats (RecPx), and commercial boats (ComPx).
Similar trends were observed with increased presence, regardless of density, of scarring in the grid cells as the fea-ture proximity or water depth decreased (Fig. 8). The lack of observations in areas shallower than 2.0 ft in the depth variable is partly an artifact of the methods used for data col-lection. Access to shallow areas was limited because bathy-metric data were collected with a fathometer mounted to a boat. Consequently, depths of 2.0 ft represent depths ≤ 2.0 ft.
Improved bathymetric data are required to better understand conditions in these most shallow areas of the bay.
In most cases, maximum scar densities are strongly related to the explanatory variable. Most notable are the relationships between proximity to most boating activities and maximum likely scar density. Proximity to channels and water depth both display a moderate relationship, while there is weak, yet significant inverse relationship with close proximity to marine facilities. Proximity to commercial boat activity has the weak-est relationship.
All Channel Proximity
0
0.02
0.04
0.06
0.08
0.1
0.12
500 2500 4500 6500 8500
Distance, m
% C
ells
wit
h S
carr
ing
Commercial Boat Proximity
0
0.01
0.02
0.03
0.04
0.05
0.06
1000 3000 5000 7000 9000 >10000
Distance, m
% C
ells
wit
h S
carr
ing
Transit Boat Proximity
0
0.01
0.02
0.03
0.04
0.05
0.06
1000 3000 5000 7000 9000 >10000
Distance, m
% C
ells
wit
h S
carr
ing
Water Depth
0
0.01
0.02
0.03
0.04
0.05
0.06
0.07
0.08
0.09
< 2.5 2.5 - 3 3 - 3.5 3.5 - 4
Water Depth, ft
% C
ells
wit
h S
carr
ing
Dock Proximity
0
0.01
0.02
0.03
0.04
0.05
0.06
0.07
0.08
0.09
0.1
1000 7000 13000 19000
Distance, m
% C
ells
wit
h S
carr
ing
Fishing Boat Proximity
0
0.01
0.02
0.03
0.04
0.05
0.06
0.07
0.08
0.09
1000 3000 5000 7000 9000 >10000
Distance, m
% C
ells
wit
h S
carr
ing
Marked Channel Proximity
0
0.02
0.04
0.06
0.08
0.1
0.12
500 2500 4500 6500 8500
Distance, m
% C
ells
wit
h S
carr
ing
Recreational Boat Proximity
0
0.01
0.02
0.03
0.04
0.05
0.06
0.07
200 600 1000 1400 1800 > 2000
Distance, m
% C
ells
wit
h S
carr
ing
Shore Proximity
0
0.01
0.02
0.03
0.04
0.05
0.06
1000 3000 5000 7000 9000 11000 13000
Distance, m
% C
ells
wit
h S
carr
ing
Figure �3. Proportion of scar presence for all nine explanatory variables. Scar presence is the count of �00x�00 m cells which overlap with mapped scars.

�5patterns of propeller scarring of seagrass in Florida Bay
Proximity to boat use for recreation, fishing, and transit, along with proximity to shore, had the strongest influence on estimates of maximum likely scarring (Table 3). Most recreational boat use is related to fishing activity, so only one variable, fishing proximity (with the higher r2 of the two) was selected for the composite index model. Distance from chan-
nels and distance from commercial boats have less influence on the composite model. Dock proximity turns out to be an important influence on the model near shore. This variable separates out shoreline proximity so that distances from the small keys within the ENP portion of Florida Bay, where scar-ring is often present, is distinct from the distances associated
N Estimate r�
ChanPx 147 -9.702e-06 0.49***
MChanPx 147 -1.096e-05 0.49***
DockPx 3297 7.292e-07 0.09***
ShorePx 137 -1.358e-05 0.73***
FishPx 37 -5.454e-05 0.82***
TransitPx 58 -3.667e-05 0.75***
RecPx 37 -5.015e-05 0.70***
ComPx 297 -3.515e-06 0.43***
Depth 81 -0.022526 0.61***
table 3. linear regression results for the nine explanatory vari-ables versus maximum likely scar density (*** P≤0.00�).
Figure ��. Scar density and water depths in Florida Bay (zoom below).
high
low
high : 9.8
low : �.8

�6 south Florida natural Resources center technical series (2008:1)
0 2000 4000 6000
0.00
0.10
ChanPx (m)
Scar
Den
sity
, m/m
2
0 2000 4000 6000
0.00
0.10
MChanPx (m)
Scar
Den
sity
, m/m
2
0 5000 15000
0.00
0.10
DockPx (m)
Scar
Den
sity
, m/m
2
0 2000 4000 6000
0.00
0.10
ShorePx (m)
Scar
Den
sity
, m/m
2
500 1000 2000
0.00
0.10
FishPx (m)
Scar
Den
sity
, m/m
2
0 1000 2000 3000
0.00
0.10
TransitPx (m)
Scar
Den
sity
, m/m
2
500 1000 2000
0.00
0.10
RecPx (m)
Scar
Den
sity
, m/m
2
0 5000 10000
0.00
0.10
ComPx (m)
Scar
Den
sity
, m/m
2
2 3 4 5 6
0.00
0.10
Depth (m)
Scar
Den
sity
, m/m
2
Figure �5. top �0% of scar densities in relationship to proximity to all channels (chanPx), proximity to marked channels (MchanPx), proximity to marine facilities (dockPx), proximity to shorelines (ShorePx), proximity to fishing boats (FishPx), proximity to transiting boats (transitPx), proximity to recreational boats (RecPx), proximity to commercial boats (comPx), and water depth (depth). Regres-sions of data points are shown as a solid line. dashed lines indicate 95% confidence limits.
with the main keys (Key Largo to Long Key) that are outside of ENP (often 1 to 3 miles from the park boundary) where most of the marine facilities are located and where scarring was limited. Pearson’s product-moment correlation scores for each unique pair of variables are presented in Table 4. FishPx and RecPx are highly correlated, as are RecPx and TransitPx. FishPx and TransitPx have moderately high cor-relations. ChanPx and MChanPx are also moderately highly correlated.
The variables used in spatially-explicit data layers for statistical modeling of maximum expected scarring densities were selected based on r2 values (Table 3) and correlation
scores (Table 4). FishPx has the strongest linear relationship to scarring density. RecPx and TransitPx also had a significant relationship to scarring, however their high correlation with FishPx allowed these two variables to be removed from the composite index model. ShorePx and Depth also have good relationships with scar density and were included. Channel proximity was only modestly associated with scar density, but was retained because it appears to influence the final score of some shallow areas and because of the potential to explore channel management options in order to reduce prop scarring. ChanPx and MChanPx are highly correlated, so only ChanPx was selected. ComPx and DockPx were not retained because
�7patterns of propeller scarring of seagrass in Florida Bay
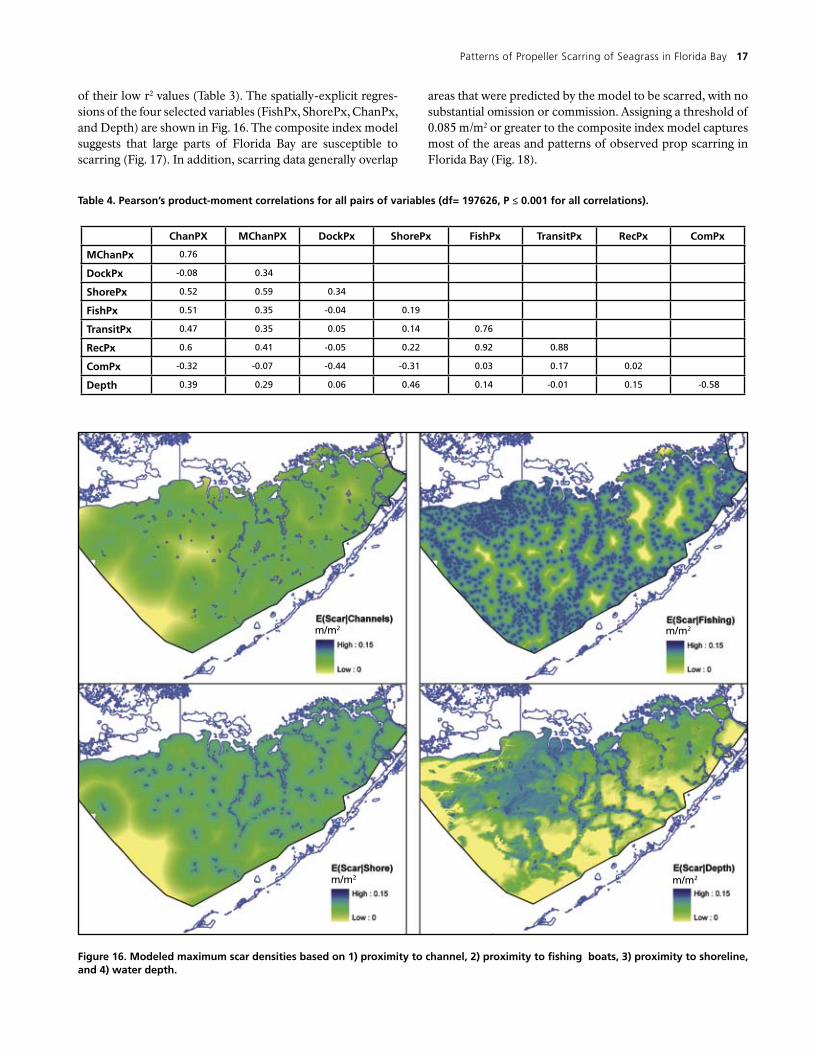
Figure �6. Modeled maximum scar densities based on �) proximity to channel, �) proximity to fishing boats, 3) proximity to shoreline, and �) water depth.
of their low r2 values (Table 3). The spatially-explicit regres-sions of the four selected variables (FishPx, ShorePx, ChanPx, and Depth) are shown in Fig. 16. The composite index model suggests that large parts of Florida Bay are susceptible to scarring (Fig. 17). In addition, scarring data generally overlap
areas that were predicted by the model to be scarred, with no substantial omission or commission. Assigning a threshold of 0.085 m/m2 or greater to the composite index model captures most of the areas and patterns of observed prop scarring in Florida Bay (Fig. 18).
chanPx MchanPx dockPx ShorePx FishPx transitPx RecPx comPx
MchanPx 0.76
dockPx -0.08 0.34
ShorePx 0.52 0.59 0.34
FishPx 0.51 0.35 -0.04 0.19
transitPx 0.47 0.35 0.05 0.14 0.76
RecPx 0.6 0.41 -0.05 0.22 0.92 0.88
comPx -0.32 -0.07 -0.44 -0.31 0.03 0.17 0.02
depth 0.39 0.29 0.06 0.46 0.14 -0.01 0.15 -0.58
table �. Pearson’s product-moment correlations for all pairs of variables (df= �976�6, P ≤ 0.00� for all correlations).
m/m2
m/m2
m/m2
m/m2

�8 south Florida natural Resources center technical series (2008:1)
Figure �7. Modeled maximum-likely boat-prop scarring using shoreline proximity, fishing proximity, channel proximity, and water depth. observed scars are overlain in orange.
channel between the western-most of the Bob Allen Keys and the small unnamed key to the southwest of west Bob Allen Key. Photo by lori oberhofer, ENP.

�9patterns of propeller scarring of seagrass in Florida Bay
Panhandle Key looking south toward gopher keys. Photo by lori oberhofer, ENP.
Figure �8. Modeled maximum boat scar densities are shown in green and observed scars are shown in orange.
modelled scarring density ≥ 0.85 m/m2
scars mapped from 2004 aerial imagery
�0 south Florida natural Resources center technical series (2008:1)
dIScUSSIoN
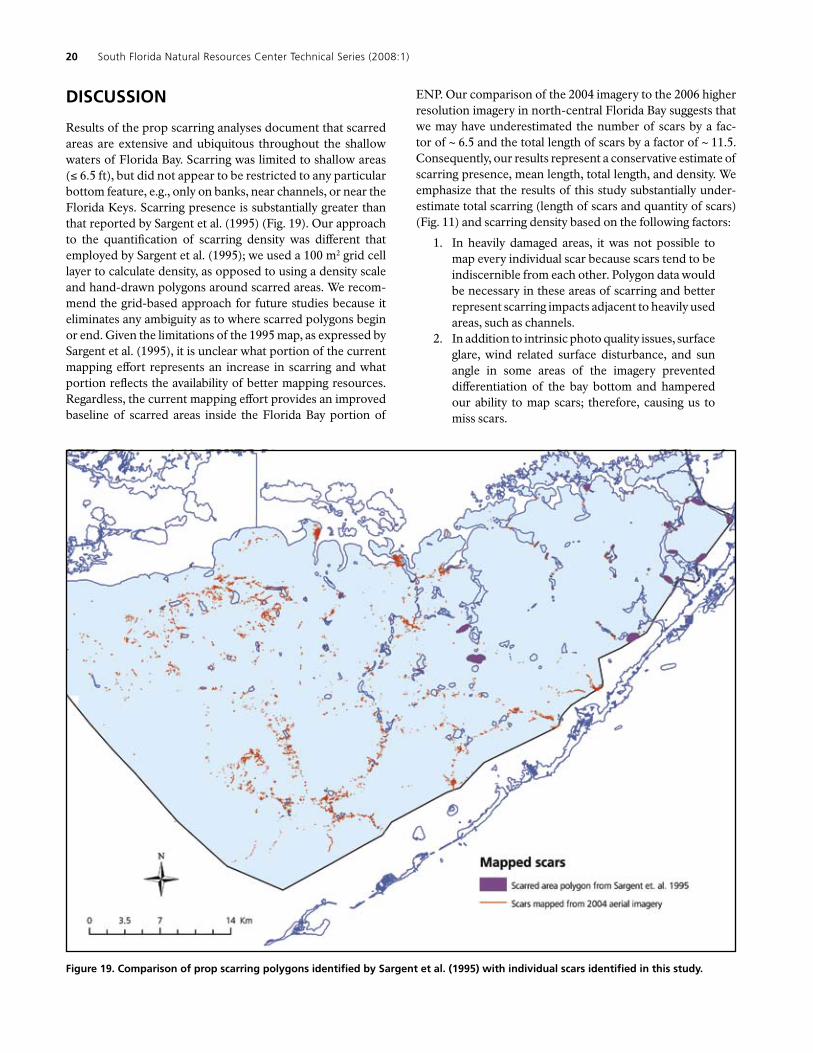
Results of the prop scarring analyses document that scarred areas are extensive and ubiquitous throughout the shallow waters of Florida Bay. Scarring was limited to shallow areas (≤ 6.5 ft), but did not appear to be restricted to any particular bottom feature, e.g., only on banks, near channels, or near the Florida Keys. Scarring presence is substantially greater than that reported by Sargent et al. (1995) (Fig. 19). Our approach to the quantification of scarring density was different that employed by Sargent et al. (1995); we used a 100 m2 grid cell layer to calculate density, as opposed to using a density scale and hand-drawn polygons around scarred areas. We recom-mend the grid-based approach for future studies because it eliminates any ambiguity as to where scarred polygons begin or end. Given the limitations of the 1995 map, as expressed by Sargent et al. (1995), it is unclear what portion of the current mapping effort represents an increase in scarring and what portion reflects the availability of better mapping resources. Regardless, the current mapping effort provides an improved baseline of scarred areas inside the Florida Bay portion of
ENP. Our comparison of the 2004 imagery to the 2006 higher resolution imagery in north-central Florida Bay suggests that we may have underestimated the number of scars by a fac-tor of ~ 6.5 and the total length of scars by a factor of ~ 11.5. Consequently, our results represent a conservative estimate of scarring presence, mean length, total length, and density. We emphasize that the results of this study substantially under-estimate total scarring (length of scars and quantity of scars) (Fig. 11) and scarring density based on the following factors:
1. In heavily damaged areas, it was not possible to map every individual scar because scars tend to be indiscernible from each other. Polygon data would be necessary in these areas of scarring and better represent scarring impacts adjacent to heavily used areas, such as channels.
2. In addition to intrinsic photo quality issues, surface glare, wind related surface disturbance, and sun angle in some areas of the imagery prevented differentiation of the bay bottom and hampered our ability to map scars; therefore, causing us to miss scars.
Figure �9. comparison of prop scarring polygons identified by Sargent et al. (�995) with individual scars identified in this study.

��patterns of propeller scarring of seagrass in Florida Bay
3. Water transparency, limited by turbidity and possibly by algal blooms at the time of acquisition, also inhibited our ability to map scars in some areas. This factor made it infeasible to map prop scars in ENP’s western coastal seagrass beds, i.e., from the Ten Thousand Islands to Cape Sable; hence, alternative methods are being pursued.
4. Field observations suggest that, in some cases, scars fill in with drift algae; rendering scars in these areas indiscernible in aerial photographic interpretation.
Given these limiting factors, we stress the fact that our re-sults neither represent a full accounting of scarring by quan-tity or by length, nor accurate estimates of scarring density. Rather, the results are useful to describe relative scar density, patterns of scarring density as they relate to measurable visi-tor use factors, and areas where management strategies can be focused to achieve improved resource and visitor use con-ditions, including restoration of prop scarred seagrass beds. Further, these analyses do not assess the depth that individual prop scars extend into the bay bottom, which can influence the ability of seagrass beds to recover.
Our scarring change analysis documents that some prop scarred areas are, at best, maintaining the same number and length of scars (i.e., there is no net recovery); while the data also suggest that in some locations the quantity of prop scars and their length are increasing over time. Many factors, including the four factors listed above, contribute to uncertainty related to interpretation of the imagery used for the change analysis. These sources of error make it difficult to develop definitive conclusions related to trends in prop scarring at specific loca-tions, but it is reasonable to conclude that scarring levels are not improving and are probably increasing. The substantial in-creases in mapped scars between 1995 and 2004 at individual sites, the persistence of scars at all change analysis sites, the increase in the south Florida population, and the increase in motor boat registrations, suggest that prop scarring is likely to remain a prominent resource concern in ENP. In addition, re-cent upward trends in gasoline prices may make operation of large powerboats, those that typically fish and recreate farther offshore, less financially practical and therefore an increase in the number of boaters using smaller flats and bay boats is likely to occur. Moreover, prop scarring represents a problem unlikely to improve without new strategies employed through natural resource management initiatives.
Prop scarring is directly related to water depth. While it is not surprising that prop scarring is greatest in shallow areas, our analysis suggests that the bulk of scarring occurs at depths of 3.5 ft or less. This finding is important because management plans may consider the use of depth thresholds to manage access of motorized watercraft to areas that are most suscep-tible to prop scarring. The lack of high resolution bathymetry makes it difficult to estimate scarring density at the shallowest levels (i.e., 0.5, 1.0, and 1.5 ft depths); however, the density of scarred areas in depths of 2.5 ft and < 2.0 ft clearly suggests
that shallower depths are likely to experience even more scar-ring. Our analysis also suggests that scarring is denser near shorelines within ENP portions of Florida Bay.
The strong relationship between scarring and proxim-ity to navigational channels suggests that resource managers should, among other factors, focus on strategies that manage navigation in and around Florida Bay. The channels are a con-duit from which boaters venture out into the bay, so it is not surprising that areas near channels will suffer greater scarring. Channels may also be impacting adjacent areas. For example, shallow areas relatively near channels may be more likely to have heavier scarring than shallow areas farther away from channels. The composite index (Fig. 18) reveals this indirect effect.
Interestingly, there was no clear difference in this rela-tionship when examining marked and unmarked channels although we initially hypothesized that marked channels may have a lower density of scarring around them than unmarked channels. The lack of difference when comparing scarring between marked versus unmarked channels may be a result of more intensive use of marked channels versus unmarked channels. Florida Bay is difficult to navigate; therefore, new and inexperienced users are likely to choose to use those channels that are clearly marked. In addition, inexperienced anglers may subsequently focus exploratory trips, i.e., trips away from channels to explore new areas for fishing, in and around marked channels. In contrast, unmarked channels are likely to be used less intensely and most often by boaters that have substantial experience. While it is desirable to mark more clearly navigational channels that assist with navigation throughout Florida Bay, improving these aids to navigation will probably only help reduce scarring in areas that are very close to the channel, a clear area where navigational mishaps occur. Therefore, it is not likely that these markings will result in a large scale decrease in scarring across Florida Bay. Moreover, in some areas it is possible that scarring could become more intense adjacent to newly marked channels because they may attract more users and increase the frequency of exploratory trips emanating from the channels. In other areas, such as southeastern Florida Bay, there is extensive scarring of mud banks, presumably because motorboat operators are trying to
Boat driver causing benthic damages and associated turbidity at the east end of crocodile dragover. Photo by lori oberhofer, ENP.

�� south Florida natural Resources center technical series (2008:1)
traverse these banks. Navigational markings in these areas, if used appropriately, should reduce scarring.
Scar density is also related to the presence of boats that are in the park on fishing trips. Because scarring is caused by motorboats, these results suggest that managing the intensity of motorboat activity in specific, high-impact areas should result in a decrease in scar density. We did not explore rela-tionships between scarring and scar density by boat type or by boating practices. Additional studies on the size of boats us-ing ENP may lead to more specific management recommen-dations based on a range of ideas that have been suggested by the public during public involvement phases of the GMP. Managers should also consider successful strategies that have been implemented by other federal, state, and local marine re-source management agencies, including lessons learned from the many other marine natural areas in Florida. These strate-gies have taken into consideration factors such as boat size, potential draft, hull shape, horsepower, and use of adjustable outboard motor mounts, e.g., jack plates. We are not aware of analyses that support the hypothesis that a particular horse-power rating or boat size would result in more or less prop scarring. In Lignumvitae Key Submerged Lands Management Area, boat size was not related to an increase in the area of benthic damage, but it was related to damage severity (Engeman et al. 2008). Generally, managers should consider the notion that larger horsepower motors, larger propellers, longer outboard motor shaft lengths, and deeper running draft depths could result in more scarring and greater dam-age in shallow waters. For example, managers could consider restricting access of large, twin outboard boats from the shal-lowest waters in Florida Bay. It is worth noting that the large majority of mapped scars appear to be caused by single engine boats. Twin engine prop scars in ENP were concentrated near the Intercoastal Waterway along the park boundary near the Florida Keys. More detailed analyses are necessary to under-stand further the relative contribution of boat and outboard motor type to scarring density and pattern.
Secondary Impacts
The literature on secondary impacts of prop scarring on higher trophic level organisms is mixed. Even pristine seagrass beds comprise heterogeneous landscapes that include areas without seagrass. These zones and edges arguably provide transitional areas where important ecological interactions occur, e.g., ambush points affecting predator-prey dynamics. However, negative impacts of prop scars have been observed. For example, Uhrin and Holmquist (2003) observed lower abundances of crabs and molluscs in and around scars, and Burfeind and Stunz (2007) observed a decrease in shrimp growth in scarred areas. In contrast, several studies indicate no impact to fish in scarred areas (Bell et al. 2002, Uhrin and Holmquist 2003, Burnfield and Stunz 2007) and no impact to overall nekton communities (Burnfield and Stunz 2006).
Concern is warranted related to impacts of sediment sus-pension and wave activity that is caused by motorboats and the wakes they create. These secondary impacts could impact intact seagrass beds by reducing overall light transparency and reduce the potential for seagrass recovery in scarred areas. However, boat wakes have been found to have small impacts on sediment suspension and water quality relative to natural wave action (Koch 2002). It is not clear if the chronic effects of multiple boats traveling through concentrated transit areas, such as boat channels, may negatively impact seagrass recov-ery in adjacent areas.
Prop scarring may also impact visitor use experiences in ENP. As a premier sportfishing destination, Florida Bay is ex-tremely important to the recreational fishing community, in-cluding professional fishing guides in the Miami, Homestead, and Florida Keys area. These stakeholders have a vested inter-est in providing visitors from all over the world with a quality experience in the park. Visitor use satisfaction during recre-ational fishing trips is likely to be affected by aesthetics and fishing success. Park aesthetic values are clearly affected by prop scarring. Florida Bay tends to have relatively high water transparency and flats fishermen typically employ sight-fish-ing techniques. As such, visitor experiences may be negatively influenced by the aesthetic impacts caused by prop scarring. Further study would be needed to evaluate the effect of prop scarring on visitor experience.
At the same time, since ENP is also the largest desig-nated wilderness area east of the Rocky Mountains, it is a premier destination for visitors seeking backcountry experi-ences. Some of these experiences are sought in Florida Bay. Wilderness values that are provided include opportunities for solitude, wildlife viewing, paddling, fishing, interpretive and education programs, and camping. Because some of these op-portunities can be adversely impacted by prop scarring, and the activities and behaviors that cause prop scarring, the pub-lic has indicated that future management of Florida Bay and other marine areas should enhance wilderness experiences.
Visitors to Everglades National Park kayaking in Florida Bay. Photo by Rodney cammauf, ENP.

�3patterns of propeller scarring of seagrass in Florida Bay
Management Implications
The issues and challenges presented in this report will be ad-dressed as ENP continues development of its GMP in 2008 and 2009. The GMP will identify objectives and desired con-ditions to be sought by park managers in cooperation with the public related to natural and cultural resource conditions and visitor use experiences that should be provided. The GMP will be accompanied by an Environmental Impact Statement, which requires public involvement at several key steps in its development. Specific to managing Florida Bay, a variety of preventative management options including mandatory edu-cation programs and boat permits for all boaters in ENP, im-proved aids to navigation, pole and troll zones, idle and speed zones, limiting motorized watercraft access by watercraft characteristics, and area-specific seasonal access limits or clo-sures, should be considered to minimize damages caused by prop scarring.
Education is an important first step in the prevention of prop scar damage. Implementing a comprehensive and wide-reaching education program will be challenging considering the number of entry points to Florida Bay, the geographically diverse group of users, and the fact that education is not a substitute for on-the-water experience and local knowledge. Given that Duarte et al. (2008) report seagrass ecosystems receive the lowest level of coverage in the media when com-pared to mangroves and coral reefs, it is not surprising that public awareness is limited. They recommend improved communication of scientific information through formal and informal efforts. Regulatory requirements, paired with educa-tion, such as those that require users to have mandatory safe boating courses may be more effective. However, Florida Bay is complex; perhaps the largest and most complex shallow water body to be examined for marine management options. All potential management options will be challenging and re-quire substantial cooperation with the public. Application of our findings to the GMP process and review of management
efforts in other coastal areas will help to ensure that the best approaches are being considered.
Slow speed and idle zones may be used to slow motor-ized watercraft and reduce the potential for seagrass damage. These zones are widely used in Florida in an attempt to re-duce collisions between boaters and wildlife. However, boats generally draft more water when idling. Therefore, idling or slow speed transit may also result in some level of scarring and associated turbidity.
Implementation of pole and troll zones appear to be on the rise in coastal areas of Florida recently. These zones greatly reduce or eliminate the possibility of prop scarring by only allowing human-powered transit via push poles and very low horsepower electric motors for boat locomotion. Impacts from poling activities and trolling motors are possible, but likely to be much less intense compared to prop scarring. Pole and troll zones are likely to present solutions that have a high probability of reducing prop scar impacts while still allowing access. However, managing motorboat access does not guar-antee that scarred areas will recover or that the area of dam-age will decline. For example, Engeman et al. (2008) report a continual increase in benthic damages despite the establish-ment of a no-motor-zone area in Lignumvitae Key, Florida. A full review of the existing pole and troll zones is warranted prior to implementation in ENP. Many challenges are associ-ated with implementing pole and troll zones. Maintaining a reasonable level of access to traditional use areas that become pole and troll zones can be difficult if the areas are very large and require miles of human or electric-motor transit to desir-able fishing grounds. In addition, marking and communicat-ing the boundaries of pole and troll zones and enforcement of such zones would require creative solutions given the size of Florida Bay and the large extent of scar cover.
Limiting access to an area completely, or to all motorized watercraft, is likely to be the most effective option to reduce seagrass scarring and would be relatively easy to enforce, but these regulations would cause the most impact to exist-
South end of largest whipray key looking south toward small whipray. Photo by lori oberhofer. ENP.
�� south Florida natural Resources center technical series (2008:1)
ing users of Florida Bay. Complete closures should only be implemented if less restrictive strategies prove unsuccessful or are limited to areas that have extremely high scar density. Closing areas to motorized watercraft may have other values, such as maintaining pristine reference sites for scientific study, improving submerged wilderness character, and allowing sea-grass restoration programs to be successful without the threat of further impacts. Signage should be used to mark closed or limited access areas, however it should be noted that large sign implementation projects have largely failed to eliminate scarring in Pinellas County (Stowers et al. 2002); while the rate of scarring increase was reduced, an increase in scarring still occurred.
Management options that are preventative in nature should be coupled with options that directly mitigate boat related injuries to seagrass beds. Methods of assessment and restoration of damaged seagrass beds should be formalized in ENP. Kirsch et al. (2005) outline the Mini-312 program cur-rently being used to quantify damage efficiently in Florida Keys National Marine Sanctuary. This program enables managers to prepare defensible resource damage claims and provides the baseline information needed for restoration efforts. The Mini-312 program, developed by National Oceanographic and Atmospheric Administration, has three components: a rapid, standardized assessment of seagrass boat-grounding damages with GIS products, a model of damage recovery rates, and a court-accepted calculation of compensation (the party responsible for the damage is responsible for compen-sation of loss of habitat value) (Kirsch et al. 2005). Kirsch et al. (2005) report the program has proven to be cost-effective and significantly increased the number of sites that can be assessed and restored. Implementing the program’s standard-ized documentation and mapping within ENP would provide a number of opportunities including a proven and cost-effec-tive method of estimating restoration needs and costs, partic-ularly at larger blowholes, wheel ditches, and berms. Sharing of information, systematic trends analyses, and other seagrass protection experiences in common formats with other man-agement agencies will be invaluable. For example, Whitfield et al. (2002) has reported that without physical regrading, deeply scarred blowholes are unstable and vulnerable to continued degradation.
In addition, increased public awareness of the financial penalties associated with damaging natural resources in ENP may also serve as a deterrent to careless boating. An in-crease in law enforcement officers patrolling ENP may also be effective in curbing seagrass damage. Costs associated with augmenting protection of seagrass beds are warranted, especially when considering the annual value of ecosystem services provided by seagrass beds (Costanza et al. 1997). A recent benefit-cost analysis suggests that the overall cost of additional law enforcement is far outweighed by the benefit of protecting seagrass beds, which were valued at $140,752/ha (Engeman et al. 2008).
Appropriate management strategies depend largely on the objectives for managing benthic resources. Managers should
consider how well management strategies are likely to meet the following objectives:
1. reducing the likelihood of new scars in scarred areas,
2. allowing for recovery of seagrass in scarred areas, and
3. reducing the likelihood of scarring in pristine or relatively unscarred areas.
Objective 3 is desirable because the cost of restoring sea-grass is high; hence, preservation of existing seagrass bed in-tegrity is most efficient (Milano and Deis 2003) and often far more cost effective than restoring seagrass damage. Existing, heavily scarred areas should also be considered and our anal-ysis of the most impacted areas, the upper 10% of intensely scarred areas, suggests that these defined areas (~20) could be the basis for implementing on-the-water management mea-sures and monitoring (Fig. 20).
Applying effective management measures to existing scarred areas is likely to result in meeting the first two ob-jectives, but consideration of relatively unscarred areas is necessary to achieve objective 3. Meeting all three of these objectives would be consistent with the Wilderness Act which states that a wilderness area should be “protected and man-aged so as to preserve its natural conditions. “
It is even possible that limiting access to some currently scarred areas could displace existing visitor use and reallocate impacts to areas that are currently not scarred. Reallocation of benthic impacts during seasonal area closures has been observed in marine commercial fisheries (e.g., Dinmore et al. 2003). Many options are available to assist with meeting these objectives. To meet objective 3, consideration could be given to management measures in areas identified using a model-based approach (Fig. 19 and 20). This would allow managers to identify for protection pristine areas that have a high likeli-hood of scarring based on physical and visitor use factors. In addition, this approach may assist in protecting areas that are heavily scarred, but could not be mapped due to poor image quality. The logistical challenges, e.g., signage, education, and enforcement, associated with implementing boating restric-tions in all areas indicated in Fig. 17, would require substantial park resources. In contrast, implementing restrictions in the model-identified areas indicated in Fig. 18 would provide an option to manage a subset of areas that are most likely to have high levels of scarring, though practical challenges will still exist. Managers will need to consider a suite of strategies to address these areas.
Balancing seagrass conservation with recreational boating may be accomplished most effectively by combining multiple strategies (Cole 1993). We recommend that a multi-faceted and adaptive approach be considered to manage and mitigate prop scarring in Florida Bay (Table 5). Examples of experi-ment-driven management actions include tests of channel markings with different spacing and sizes, restoration trials in scars with relatively faster-growing H. wrightii supplemented with bird roosting stakes to facilitate nutrient enrichment from

�5patterns of propeller scarring of seagrass in Florida Bay
bird defecation (Kenworthy et al. 2000), and assessment of scar injury response to wave and storm disturbance at differ-ent scar depths. Future monitoring of the benefits associated with management strategies will require continued efforts to provide aerial interpretation of seagrass scars, combined with more detailed, in-water analyses of prop-scar recovery at a number of indicator sites.
Restoration trials and annual monitoring of scarring dis-tribution and density would allow park managers to assess the effectiveness of various management strategies and tech-niques in order to protect park resources and visitor experi-ences and take future action as warranted by implementing new approaches and by increasing or relaxing restrictions as needed to mitigate seagrass scarring.
table 5. Adaptive steps for using management tools to reduce seagrass prop scar impacts. Management tools are hypothesized to have higher potential efficacy from left to right.
Figure �0. clusters of the most densely scarred areas, as outlined above, are possible sites for implementation of management mea-sures, such as a pole and troll zone. Areas are approximate and only drawn as examples.
g g g g g g g g g g g Protective gradient g g g g g g g g g g g
Tools Education Channel Marking Boat Characteristics Pole+Troll No Access
Steps
1 X
2 X X
3 X X X
4 X X X
5 X X X X
6 X X X X X

�6 south Florida natural Resources center technical series (2008:1)
lItERAtURE cItEd
Andorfer, J. and C.J. Dawes. 2002. Production of rhizome meristems by the tropical seagrass Thalassia testudinum: the basis for slow recovery into propeller scars. Journal of Coastal Research. 37: 130-142.
Ault, J.S., S.G. Smith, D. McClellan, N. Zurcher, A. McCrea, N.R. Vaughan and J.A. Bohnsack. 2008. Final Report: Aerial survey of boater use in Everglades National Park marine waters – Florida Bay and Ten Thousand Islands. University of Miami, Miami, Florida. 97 pages.
Bell, S.S., M.O. Hall, S. Soffian and K. Madley. 2002. Assessing the im-pacts of boat propeller scars on fish and shrimp utilizing seagrass beds. Ecological Applications. 12(1): 206-217.
Burfeind, D.D. and G.W. Stunz. 2006. The effects of boat propeller scarring intensity on nekton abundance in subtropical seagrass meadows. Marine Biology. 148: 953-962.
Burfeind, D.D. and G.W. Stunz. 2007. The effects of boat propeller scarring on nekton growth in subtropical seagrass meadows. Transactions of the American Fisheries Society. 136: 1546-1551.
Cole, D.N. 1993. Minimizing conflict between recreation and nature conservation. In D.S. Smith and P.C. Hellmund, eds., Ecology of Greenways: Design and Function of Linear Conservation Areas. University of Minnesota Press, Minneapolis, MN. pp. 105-122.
Costanza, R., R. d’Àrge, R.D. Groot, S. Farber, M. Grasso, B. Hannon, K. Limburg, S. Naeem, R.V. O’Neill, J. Paruelo, R.G. Raskin, P. Sutton and M. van der Belt. 1997. The value of the world’s eco-system services and natural capital. Nature. 387: 253–260.
Dawes, C.J., J. Andorfer, C. Rose, C. Uranowski and N. Ehringer. 1997. Regrowth of the seagrass, Thallasia testudinum, into pro-peller scars. Aquatic Botany. 59: 139-155.
Dawes, C.J., R.C. Phillips and C. Morrison. 2004. Seagrass commu-nities of the Gulf Coast of Florida: Status and Ecology. Florida Fish and Wildlife Conservation Commission Fish and Wildlife Research Institute and the Tampa Bay Estuary Program. St. Petersburg, FL. iv+ 74 pages.
Dinmore, T.A., D.E. Duplisea, B.D. Rackham, D.L. Maxwell and S. Jennings. 2003. ICES Journal of Marine Science. 60: 371-380.
Duarte, C.M., J. Terrados, N.S.R. Agawin, M.D. Fortes, S. Bach and W.J. Kenworthy. 1997. Response of a mixed Philippine seagrass meadow to experimental burial. Marine Ecology Progress Series. 147: 285-294.
Duarte, C.M., W.C. Dennison, R.J.W. Orth and T.J.B. Carruthers. 2008. The charisma of coastal ecosystems: addressing the imbal-ance. Estuaries and Coasts. 31: 233-238.
Durako, M.J., M.O. Hall, F. Sargent and S. Peck. 1992. Propeller scars in seagrass beds: an assessment and experimental study of recol-onization in Weedon Island State Preserve, Florida. In: Webb F.J., Jr. (ed) Proc 19th Annual Conference Wetlands Restoration and Creation. Hillsborough Community College, FL, pp. 42–53.
Engeman, R.M., J.A. Duquesnel, E.M. Cowan, H.T. Smith and S.A. Shwiff. 2008. Assessing boat damage to seagrass bed habitat in a Florida park from a bioeconomics perspective. Journal of Coastal Research. 24(2): 527-532.
ESRI 2006. ESRI® ArcMAP™ 9.2. Copyright 1999-2006 ESRI Inc. All Rights Reserved. URL: http://www.esri.com.
Everglades National Park. 2008. General Management Plan. 40001 State Road 9336, Homestead, Florida. http://parkplanning.nps.gov/documentsList.cfm?parkId=374&projectId=11170.
Florida Fish and Wildlife Conservation Commission - Fish and Wildlife Research Institute (FWC-FWRI). 2004. Metadata for ISM_CSA_Florida_Bay_2004_imagery. Unpublished.
Florida Fish and Wildlife Conservation Commission, Fish and Wildlife Research Institute (FWC-FWRI). 2005. Dataset for Florida Bay Benthic Communities prepared by Avineon, Inc for FWC-FWRI. Available online at http://ocean.floridamarine.org.
Florida Fish and Wildlife Conservation Commission, Fish and Wildlife Research Institute (FWC-FWRI). 2006. Dataset for Florida ma-rine facilities. Available online at http://ocean.floridamarine.org; metadata available online at http://www.fgdl.org/metadata/fgdc_html/marfac.fgdc.htm.
Florida Fish and Wildlife Conservation Commission. 2007. Florida boating safety education program. Available online at: http://my-fwc.com/Boating/Docs/BoatingSafetyEdExSummOct07.pdf.
Fonseca, M.S. and S.S. Bell. 1998. Influence of physical setting on seagrass landscapes near Beaufort, North Carolina, USA. Marine Ecology Progress Series. 171: 109-121.
Fonseca, M.S., P.E. Whitfield, W.J. Kenworthy, D.R. Colby and B.E. Julius. 2004. Use of two spatially explicit models to determine the effect of injury geometry on natural resource recovery. Aquatic Conservation: Marine and Freshwater Ecosystems. 14(3): 281-298.
Hammerstrom, K.K., W. J. Kenworthy, P. E. Whitfield and M. F. Merello. 2007. Response and recovery dynamics of seagrasses Thalassia testudinum and Syringodium filiforme and macroal-gae in experimental motor vessel disturbances. Marine Ecology Progress Series. 345: 83–92.
Hansen, M. and N.T. DeWitt. 1999. 1890 and 1990 Bathymetry of Florida Bay. South Florida Place Based Studies Open-File Report 00-347. USGS Center For Coastal and Regional Marine Geology, St. Petersburg Field Office, United States Geological Survey, St. Petersburg, Florida. URL http://sofia.usgs.gov/publictions/ofr/00-347/.
Hastings, K., P. Hesp and G.A. Kendrick. 1995. Seagrass loss associ-ated with boat moorings at Rottnest Island, Western Australia. Ocean Coastal Management. 26: 225–246.
Kenworthy, W.J., M.S. Fonseca, P.E. Whitfield, K.K. Hammerstrom and A.C. Schwartzschild. 2000. A comparison of two methods for enhancing the recovery of seagrasses into propeller scars: Mechanical injection of a nutrient and growth hormone solution vs. defecation by roosting seabird. Final report submitted to the Florida Keys Environmental Restoration Trust Fund, 40 pages.
Kenworthy, W.J., M.S. Fonseca, P.E. Whitfield and K.K. Hammerstrom. 2002. Analysis of seagrass recovery in experimental excavations and propeller-scar disturbances in the Florida Keys National Marine Sanctuary. Journal of Coastal Research. SI 37: 75-85.
Kirsch, K.D., K.A. Barry, M.S. Fonseca, P.E. Whitfield, S.R. Meehan, W.J. Kenworthy and B.E. Julius. 2005. The Mini-312 Program - An expedited damage assessment and restoration process for sea-grasses in the Florida Keys National Marine Sanctuary. Journal of Coastal Research. SI 40: 109-119.

�7patterns of propeller scarring of seagrass in Florida Bay
Koch, E.W. 2002. Impact of boat-generated waves on a seagrass habi-tat. Journal of Coastal Research. 37: 66-74.
Kruer, C.R. 1994. Mapping assessment of vessel damage to shallow seagrasses in the Florida Keys. Report to the Florida Department of Natural Resources and the University of South Florida/Florida Institute of Oceanography, St. Petersburg, Florida. 23 pages.
Kuss, K.M. 1991. Lignumvitae Key Aquatic Preserve Survey of Boating Impacts/ Propeller Scarring in Shallow Seagrass Beds within LVKP. Report to State of Florida, Department of Natural Resources, Division of State Lands. 31 pages.
Marba, N., M.E. Gallegos, M. Merino and C.M. Duarte. 1994. Vertical growth of Thalassia testudinum: seasonal and interannual vari-ability. Aquatic Botany. 47: 1–11.
Milano, G.R. and D. R. Deis. 2003. Biscayne Bay seagrasses and re-cent restoration efforts. In Seagrass restoration: success, failure, and the costs of both. Eds S. F. Treat and R.R. Lewis III. Lewis Environmental Services Inc. Valrico, FL. 115-129.
National Park Service (NPS) and Florida Keys Fishing Guides Association (FKFGA). 2006a. Florida Bay Map and Guide. Published online by the National Park Service at http://www.nps.gov/ever/planyourvisit/upload/FloridaBayMap&GuideSmall.pdf.
National Park Service (NPS). 2006b. Year 2005 annual marine fish-eries report Everglades National Park. South Florida Natural Resources Center, Everglades National Park. Homestead, FL. 56 pages.
Orth, R.J, T.J.B. Carruthers, W.C. Dennison, C.M. Duarte, J.W. Fourqurean, K.L. Heck, Jr., A. R. Hughes, G.A. Hendrick, W.J. Kenworthy, S. Olyarnki, F.T. Short, M. Waycott and S.L. Williams. 2006. A global crisis for seagrass ecosystems. BioScience. 56 (12): 987-996.
R Development Core Team. 2007. R: A language and environment for statistical computing. R Foundation for Statistical Computing, Vienna, Austria. ISBN 3-900051-07-0, URL http://www.R-proj-ect.org.
Rodriguez, R.W., R.M.T. Webb and D.M. Bush. 1994. Another look at the impact of Hurricane Hugo on the shelf and coastal resources of Puerto Rico, USA. Journal of Coastal Research. 10: 278–296.
Sargent, F.J., T.J. Leary, D.W. Crewz and C.R. Cruer. 1995. Scarring of Florida’s Seagrasses: Assessment and Management Options. Florida Marine Research Institute Technical Report TR-1. Florida Department of Environmental Protection. St. Petersburg, FL. 66 pages.
Stowers, J. F., E. Fehrmann, A. Squires. 2002. Seagrass scarring in Tampa Bay: impact analysis and management options. Pages 47-54 in H.S. Greening, ed. Seagrass Management: It’s Not Just Nutrients! 2000 Aug 22-24; St. Petersburg, FL. Tampa Bay Estuary Program. 246 pages.
Uhrin, A.V. and J.G. Holmquist. 2003. Effects of propeller scarring on macrofaunal use of the seagrass Thalassia testudinum. Marine Ecology Progress Series. 250: 61-70.
USGS. 2007. National Map Accuracy Standards. Published online at http://rockyweb.cr.usgs.gov/nmpstds/nmas.html.
Whitfield, P.E., Kenworthy, W.J., Fonseca, M.S. and K. Hammerstrom. 2002. The role of a hurricane in expansion of disturbances initi-
ated by motor vessels on subtropical seagrass banks. Journal of Coastal Research. 37: 86-99.
Woolpert, Inc. 2007. Report of Topographic Survey Minimum Technical Standards. Monroe County, Florida 2006 Orthophoto Project. Report to Florida Department of Transportation, District VI. 41 pages.
Zieman, J.C. 1976. The ecological effects of physical damage from motor boats on turtle grass beds in southern Florida. Aquatic Botany. 2: 127-139.


South Florida Natural Resources CenterEverglades National Park
950 N. Krome Ave, 3rd Floor Homestead, FL 33030-4443
www.nps.gov/ever/naturescience/sfnrc.htm