Embed Size (px)
Citation preview

---~"T
Vl82-31 6-25-82
PATTERNS OF;CITIZEN DEMANDS FOR POLICE SERVICE . -..
by "
Stepheu L. Per('.y
ai1.d
.. ,,-Eric ,1. Scott ..
Workshop in "olitical 'Ih:eory and P;ollc.; Al1clysi,!!' .' lndiaila U'l".i·,,~·~ si ty . .
Blooming tcm ~ Xnd{t~~Ja
U,S. Department of Justice National Institute of Justice
114333
This document has been reproduced exactly as received from the person or organization originating it. Points of view or opinions stated in this document are those of the authors and do not necessarily represent the official position or poliCies of the National Institute of Justice.
Permission 10 reproduce this iIiLi&!ii&,llaterial has been granted by Public Domain/NIJ u.s. Dept. of Justi;e----
to th~ National Criminal Justice Reference Service (NCJRS).
Further reproduction outside of the NCJRS system requires permis· sion of the_owner.
- .
........ flared under Grant Number 80~U~CX-0014 hom th~! Ne.tiollJ'lI.ilBtitute of Justice, U.S. Department of ,.rusti'te. Po:i.x"!ts of V:U,::'t!' ()1; OP:!l!iOHS s ta ted in this d~cument are those of tht; auU.in,I.~' -gmt df!nat necessarily represent the offimial position or policiee of the U.S. Department of ,JuBtice.
WORKSHOP
IN
POLITICAL THEORY
AND POLICY ANALYSIS
Indiana UniverSity 814 East Third Bloomington, IN 47405
If you have issues viewing or accessing this file contact us at NCJRS.gov.

TABLE OF CONTENTS
Page
LIST OF TABLES • . . • _ • • G • • v
LIST OF FIGURES •• • • vii
ACKNOWLEDGEMENTS • • • • III • .viii
CHAPTER 1: WHY STUDY CITIZEN DEMANDS FOR POLICE SERVICE: A RATIONALE AND REVIEW. • • • • • • • • • • 1
Five Reasons for Studying Citizen Demand Patterns . . 1
Citizen Demand Shapes Police Practice. 2
Citizen Demand as a Determinant of the Police Role • 4
Citizen Demand Studies as a Tool for Police Management and Pla.nning. • • • • • • • 5
Citizen Demand Studies and Call Processing • . . . 6
Citizen Demand Studies and the Development of Alternative Police Responses ••••••
Alternative Methodologies for Studying Demand: Strengths
7
and Weaknesses • • • • • • • • • 9
Officer Activity Studies 9
Calls for Service Studies •• .11
Other Sources of Demand Information •• .13
Empirical Results of Analyses of Citizen Demand Patterns ••• 14
Where Do We Go From Here? • • • • 16
Content of This V~lume •• • 18
CHAPTER 2: OVERVIEW OF THE POLICE COMMUNICATIONS STUDY •••••• 20
Selection of Research Site •• . . . • • 20
Research Methods ••• • 23
Monitoring and Coding Information on Calls for Service. 23
Police Records of Calls for Service. . . . • 27
Interviews with Persons Calling the Police. . . • 28

ii
Page
Police Officer Interview • . . ., . • 29
Conclusion. · . . . . . . . 30
CHAPTER 3: FORT WORTH AND ITS POLICE DEPARTMENT • · . . • 32
A Brief History -- Cowtown to Boomtown. • • 32
Crime Rates in Fort Worth • • • • 33
The Fort Worth Police Department •• · . • 34
FWPD Organization for Call Processing •• • 36
FWPD Computer-Aided Dispatch System •• • • 38
FWPD Call Taker and Dispatcher Training. · 41
Call Processing Supervision •• • • 42
CHAPTER 4: CITIZEN DEMANDS FOR POLICE SERVICE IN FORT WOR'lR • • • 46
Ways to Examine Citizen Demand Patterns • • • 46
Citizen Demands for Police Service: The Perspective from Monitoring Incoming Calls for Service. • • • • • • • 48
Overview of Demand Patterns. • • • • • 48
More Detailed Picture of Demand Patterns • • · . . • 52
Requests for Specific Police Service • • . . . • 57
Citizen Demands for Police Service: The Perspective from Police Agency Records ••••••• · . . . . . • 60
Overview of Service Requests .. .,. .. .. .. • 62
Detailed View of Service Requests •• • 65
Comparison of Perspectives •• · . • 68
CRAPTER 5: VARIATION IN CITIZEN DEMANDS BY TIME PERIODS • · . . .71
Demand Pat terns by Day of Week. · · · · · · 71
Demand Patterns by Time of Day. • . · • · · · . . · . · · 76
Demand Patterns by Month. . • • · · · · · · 81
Conclusion. . . . . . . . . . . · · · · . · . · · 86
iii
Page
CHAPTER 6: VARIATION IN CITIZEN DEMANDS BY CALLER CHARACTERISTICS. • • •• •• • • • • • • • • • 88
Caller Position and Role in the Incident •• • 88
Caller Sex and Race • 91
Emotional State of the Caller • • • • 94
CHAPTER 7: VARIATIONS IN CITIZEN DEMAND BY NEIGHBORHOOD CONTEXT. 96
Selection of Neighborhood Areas • • • • • • 0. • • • • • 96
Demographic and Land Use Characteristics of Neighborhoods •• 98
Distribution of Problems Across Fort Worth Neighborhoods ••• 102
Clustering of Problems in Neighborhoods • • • • • • .110
Variations 1n Problems by Neighborhood Race/Ethnic Background, Income, and Population Densi ty • •••• .112
Variations in Problems by Neighborhood Land Use and Facilities. • •• • • • • •• •• • • • • • .11S
Neighborhood Profiles by Problem Type .120
Conclusion •• . . . .124
CHAPTER 8: POLICE RESPONSE TO CALLS FOR SERVICE • . . . . • .127
Alternative Means of Police Response ••• . . . . . · .127
Eligibility Screening and Referral . . .129
Call Prioritization and Response Delays •• . . . • .130
The Report Writing Alternative • . . . . . . . . . . • .130
Disposition of Calls for Service in Fort Worth •• .131
Assessing Eligibility for Police Services •• • .132
Activating Initial Police Response • • • • .l35
Call Disposition by Nature of Problem Reported to Police ••• 139
Conclusion. • • • • . . . . . . " . . .141
CHAPTER 9: CITIZEN EVALUATIONS OF POLICE RESPONSE. • • .142
Call Taker Treatment of Callers •••••••• . . .142

iv
Page
Evaluation of Operator Responses •••• .144
Citizen Evaluation of Report Writing. .146
Conclusion. • • a • • • • • • • • • • • • • • • • • • .147
CHAPTER 10: SUMMARY AND IMPLICATIONS FOR PUBLIC POLICY. • .148
Overview of Major Findings •• . . . .148
Types of Citizen Demands • . .. . . .148
Variations in Demand Patterns •• • .149
Police Response to Service Demands .153
Citizen Evaluations of Police Response · . • .155
Implications for Public Policy •••••• . . .156
Citizen Demand and the Police Role • .157
The Effect of Citizen Demand on Police Management and Planning. • • • • • • • • · . . .159
Call Processing and Police Response •• .162
Citizen Demand and Alternative Police Response .166
Directions for Future Research. . . ., . . .168
Development of Comparative Data. • .169
Costs and Benefits of Police Response Alternatives ••• 171
Police Operator and Dispatcher Performance • • • . . . .172
The Need for Neighborhood Contextual Analysis. • .174
Conclusion . . . .175
BIBLIOGRAPHY . . . . . . . . · . .178
APPENDICES

LIST OF TABLES
Page
4.1 Distribution of Monitored Calls for Service by General Problem Categories •••••••••••••••••••• 49
4.2 Distribution of Monitored Calls for Service by Detailed Problem Categories. • • • • • • • • • • • • • • 53
4.3 Frequency of Specific Service Requests Made to the FWPD. • • 58
4.4 Signal Codes Used by the Fort Worth Police Department •••• 61
4.5 Distribution of Service Requests from Perspective of Police Records • .. • • • • • • • • • • • • • 0 • • • • • • • • • 63
4.6 Detailed Distributions of Service Requests from Police Records Data, Fort Worth, Texas • • • • • • • • • • 66
4.7 Comparison of Citizen Demand from Monitored Calls and Police Records Perspectives ••••••••••••••••••• 70
5.1 Calls for Service from Fort Worth Police Department Records, February-April 1981, by Day of Week ••••••••••• 73
5.2 Calls for Service from Fort Worth Police Department Records, February-April 1981, by Day of Week and Type of Problem. 75
5.3 Calls for Service Received by Fort Worth Police Department and Monitored by PCS, by Day of Week and Type of Problem. 76
5.4 Calls for Service from Fort Worth Police Department Records, February-April 1981, by Time of Day Call Received •••• 77
5.5 Calls for Service from Fort Worth Police Department Re~ords, February-April 1981, by Time of Day and Type of Problem. 80
5.6 Calls for Service from Fort Worth Police Department Records, 1980, by Month •••••••••••••••••••••• 82
5.7 Calls for Service from Fort Worth Police Department Recortis, 1980, by Month and Type of Problem. • ••• • •• 84
6.1 Variations in Demands by Caller Position . . . . . • • • 89
6.2 Variations in Demands by Caller Role in Incident/Problem •• 90
6.3 Variations in Dema~ds by Caller Race. . . . . 92
6.4 Variations in Demands by Caller Sex. 93
6.5 Variation in Citizen Demands by Caller Emotional State ••• 95

-----------------------~--- ----
vi
Page
7.1 Population, Income, and Land Area Data for Fort Worth Neighborhoods • • • • • • • • • • • • • • • • 99
7.2 Land Use in Fort Worth Neighborhoods by Type .101
7.3 Extent of Facilities by Type in Fort Worth Neighborhoods •• 102
7.4 Distribution of Problems Across Fort Worth Neighborhoods •• 104
7.5 Correlations of Variables Measuring the Proportion of Neighborhood Calls by Problem Types • • • • •• •• .111
7.6 Correlation of Neighborhood Calls by Race/Ethnic Background, Income, and Population Density. • • • • • • • •• • .113
7.7 Variations in Problems by Neighborhood Land Use. . 7.8 Variations in Problems by Neighborhood Facilities.
7.9 Summary of Correlations Between Problem Type and Neighborhood Level Variables. . . . . • .
8.1 Reasons Why Service Not Provided by Fort Worth Police Department to Some Calls for Service ••••
.
8.2 The Distribution of FWPD Operator Responses to Calls for Service • • • II • • • • • • • 0 ., eo ..
· .116
· .119
· .121
• .133
• .136
8.3 Crosstabulation of Operator Responses by Nature of Pzoblem Reported to Fort Worth Police Department. • • .140
9.1 Emotional State of Callers at Start and End of Interview •• 143
9.2 Citizen Ratings of Police Operator Responses • • .144
9.3 Reasons for Citizen Dissatisfaction with Police Operator Responses • • • • • • 0 • • • • • • • • • • .145
10.1 Mean Time Officers Spend On-Scene, by Type of Call • .161

LIST OF FIGURES
Page
3.1 Police Districts in Fort Worth, Texas • • • • • • 0 41 " • 35
4.1 Distribution of Monitored Calls for Service by General. Problem Categories • • • • • • • • • • • ~ • • • 50
4.2 Distribution of Service Requests from Police Records by General Problem Categories • • ••• • • • • 64
5.1 Calls for Service from Fort Worth Police Department Records, February-April 1981, by Day of Week. · · · · · · · · · · · 74
5.2 Calls for Service from Fort Worth Police Department Records, February-April 1981, by Time of Day. · · · · · · · · · · · 78
5.3 Calls for Service from Fort Worth Police Department Records, 1980, by Month • • • • • • • • • • • 83
5.4 Selected Types of Calls for Service from Fort Worth Police Department Records, 1980, by Month. • • • • • 85
7.1 Racial/Ethnic Composition of Fort Worth Neighborhoods · .100
7.2 Family Income Composition of Fort Worth Neighborhoods · · · .100
7.3 Distribution of Serious Problems with Persons Across Fort Worth Neighborhoods. . . . . . . . . · · · · · · · · · · .105
7.4 Distribution of Less Serious Problems with Persons Across Fort Worth Neighborhoods • • • • • • • • • • • • • .105
7.5 Distribution of Serious Problems with Property Across Fort Worth Neighborhoods. • • • • • • • • • • • • • • • .107
7.6 Distribution of Less Serious Problems with Property Across Fort Worth Neighborhoods • • • • • • • • • • • • • .107
7.7 Distribution of Suspicious Persons or Property Across Fort Worth Neighborhoods •••••••••••••••••••• 109
7.8 Distribution of Traffic Problems Across Fort Worth Neighborhoods. • • • • • • • • • • • • • • • • • • • • • .109

----------------------------------------------------.-----~~---
ACKNOWLEDGEMENTS
The authors would like to thank several individuals and
organizations without whose assistance and support this project could
not have been designed and implemented. From its nascent stages
through the grant award by the National Institute of Justice
(80-IJ-CX-0014) to the eventual completion of this report, William E.
Saulsbury of the Office of Research Programs at NIJ provided important
substantive and administrative assistance; he was the ideal program
monitor.
Our hosts at the Fort Worth Police Department could not have made
our tasks any easier nor our work there more enjoyable. We owe a
great debt to the many officers and civilians who willingly provided
technical assistance and information. We wish to thank Chief H. F.
Hopkins for allowing us to conduct the study in his department and for
providing us with office space convenient to the communications
center. Lieutenant David Dees and Officer David Garrett offered
useful technical assistance, especially in initiating the project.
Deputy Chief B. M. Kennedy of the Technical Services Bureau and Lt.
Ben Dumas of the Communications Division made it easy for us to
monitor call processing procedures and to obtain necessary voice and
da ta tapes. Sergeants J. R. Brizendine and M. M. Gresham and Officer
Chris Drake were parti cularly gracious in explaining complicated
telephone and dispatching procedures and in helping us understand the
computer-aided dispatch system. Deputy Chief Romer Clark facilitated
the distribution of the officer survey. To the FWPD call takers and
dispatchers go our sincere appreciation for their assistance
throughout the project. Thanks also to the citizens of Fort Worth who
agreed to be interviewed regarding their contact with the police and
to the FWPD officers who completed and returned our questionnaire.

ix
Our Fort Worth field staff was a most efficient and personable
unit, carrying out their assigned tasks with a great deal of ability
and good humor. Asha Swarup filled the role of citizen interview
coordinator and general resource person with much skill and vitality.
She was instrumental in all phases of the project, from survey design
through data collection and report preparation. Our coders and
interviewers were as capable a group to work with as we have ever
known. All of them deserve our gratitude: Chris Bradford, Terry
Colgren, Suzanne Craig, Dorris Elam, Ken Hanson, Pam Horoda, Chris
Laing, Rob Moran, Mike Newman, Tim Stack, John Watts, and Robert Utz.
A number of people at the Workshop in Political Theory and Policy
analysis at Indiana University contributed to the success of our
efforts. Elinor Ostrom and Roger B. Parks assisted in the development
of our ideas and our research design. John P. McIver commented on an
earl ier version of this report. Rida Young not only helped in
instrument design, but supervised data-entry staff and created a data
base management procedure that smoothly and efficiently transformed
raw data into analyzeable format in record time. Carol Lambert also
provided helpful computer expertise. Kate Jackson assisted with data
cleaning and preparation, while Darryl Crockett helped with the maps
and gr aphics •
The Workshop support staff has done their usual expert job ~n
preparing the manuscript. Patty Smith was primarily responsible for
worn processing and editing the volume; she deserves special thanks
for putting up with innumerable last-minute changes and impossible
requests. She has been ably assisted by Teresa Therrien, who also
helped in editing and proofing. Marsha Ellis has been an ideal
secretary; she has our particular gratitude.

x.
Without the assistance of all of these people the project would
not have been possible; we want to thank them all for a job well done.
All responsibility for the contents of the report, however, rests with
the authors.

PREFACE
A large number of research studies have examined elements of
police service delivery in American communi ties during the past
quarter century. Among the most prominent elements of these studies
have been pa tro 1 deployment, response time, equity in service
delivery, officer trea tment of minorities, and citizen sa tisfaction
with police services. Relatively less attention has been focused on
citizen demands for police service and their processing by police
personnel. Recently, however, there has been an upswing 1n interest
in and research on patterns of citizen demands as articulated through
calls for service. Citizen demands for police services have been
growing in both scope and volume a t the same time that departmental
resources have been constrained by budgetary belt-tightening. Faced
with handling a burgeoning demand level with fe~ler patrol personnel,
police agencies have been forced to seek al terna tive means to the
traditional patrol unit response to calls for service.
Unfortunately, in the rush to develop response alternatives, the
pa tterns of demands on police and the manner in which they are
processed from receipt through dispatch have received little
attention. 'Most analyses of citizen demands continue to ignore the
full range of calls received and, perhaps more Importantly, fail to
explore the variety of response options provided by police call
takers. Police telephone operators have considerable discretion in
determining which calls are judged eligible for police service, the
nature of the service provided, the extent to which information is
relayed to callers, and the complaint code and response priority
assigned to dispa tched calls. Similarly, police dispa tchers are
largely autonomous in their decisions on queuing calls for dispatch.

xii
This volume is a comprehensive exploration of the issues of
citizen demand and initial police response in the context of one
medium-sized American city. The research underlying this report was
initiated as part of the Police Communications Study (PCS) conducted
by the Workshop in Political Theory and Policy Analysis at Indiana
University. The Workshop has long been interested in issues of police
organization and performance, especially as they affect the well-being
of commun1ty residents. Specific interest in citizen demand patterns
and police call processing originated as an outgrowth of two companion
studies conducted in the mid-l970s. One study, "Evalua ting the
Organization of Service Delivery: The Police, It was sponsored by the
National Science Foundation. It was a two-stage effort aimed at
describing and evalua ting patterns of po lice service delivery in
several metropolitan areas. The study described and assessed police
organization for providing patrol services, officer activities during
police-citizen encounters, and citi~en evaluation of those activites.
Another Workshop project related to citizen demand was the Law
Enforcement Assistance Administration-sponsored study, "Police
Referral Systens in Metropolitan America." This project examined the
referral behavior of both police officers on pa tro 1 and police call
takers (Scott and Moore, 1981). From this study energed a
comprehensive picture of the service demapds of citizens in
jurisdictions of varying size and popula tion composi tion (Sco tt,
1981). Also, call taker referral was examined as only one of several
response al terna tives open to opera tors a t the initial stage of call
processing.

xiii
As part of these companion studies, Workshop researchers
monitored citizen calls for service in 21 police departments in three
metropolitan areas. Although their primary focus was on the patrol
function, it became clear that most patrol officer activity stemmed
directly from calls for service. During the process of gathering
demand data, it also became apparent that initial call processing was
an important determinant of subsequent dispatcher and patrol officer
activities as well as of citizen evalua tions of police response to
service requests. Police call takers were able to hand le a
substantial proportion of calls by means other than dispatch,
including reterral of callers to other agencies and direct provision
of requested information. Realization of the potential importance of
citizen demands and their initial processing by police operators
genera ted inter~st in undertaking a follow-up study that focused
solely on citizen calls for service and their initial handling by
police.
A grant from the National Institute of Justice enabled the
Workshop to conduct such an investigation, the Police Communications
Study. Citizen demand and initial police response data were collected
during a 3-month period in early 1981; the Fort Worth (TX) Police
Department served as the research site. The principal data collection
stra tegy of the project involved listening to and coding informa tion
about calls for service that had been tape recorded by the department.
Our primary research objective has been to study police processing of
citizen demands for service, with specific attenclon given to two
major topics. The first concerns an effort to assess patterns of
citizen demands in terms of bo th demographic and geographic varia clons

xiv
in the commun~ty. We hope to provide a comprehensive description of
citizen demand patterns and to analyze the characteristics of
individuals and areas of the community that stimulate different types
of demands. The second research topic focuses on the roles and
problems associated with the flow of demand related information from
call receipt to dispatch.
The data analysis in this volume relates primarily to the first
topic. It assesses demand pa tterns for police services, although
reterence is also made to the role of police demand information
processing and flow. This report presents a detailed description of
citizen demands for police service in Fort Worth based on monitored
calls for service. Chapters will explore variations in citizen demand
patterns associated with selected time periods, caller attributes, and
neighborhood characteristics. The disposition of calls for service
and citizen evaluations of their exchange with call takers will also
be considered. The final chapter examines implications for police
policy and management that arise from analysis of citizen demands and
their processing.
The overall purpo se of this 'Volume is to supplement the
literature on citizen demand and initial call disposition as well as
to address policy questions related to personnel deployment and
al terna tive modes of police response. It is possible that police
managers have moved too fast from concentration solely on officer
activities to development of alternatives to traditional patrol unit
response. Instead of searching for new a1 terna tives, there currently
may exist several strategies involving police call takers and
dispatchers which, if implemented, can help remove the burden of call

xv
answering from field officers so that citizen requests will still be
answered efficiently, but wtthout hopelessly strapping police
department budgets.

CHAPTER 1
WRY STUDY CITIZEN DEMANDS FOR POLICE SERVICE: A RATIONALE UD REVIEW
Government agencies established for the provision of human
services have a pervasive impact in American society. Such agencies
warn us of health hazards, educate Our children, treat our illnesses
and injuries, provide low-cost housing, and support our unemployed.
Many of these agencies are established to provide services upon
receipt of direct demands from citizens who consume the services they
provide. A service demand is simply a request for an agency to take
some action about a specified problem.
The present volume represents a comprehensive analysis of citizen
--demands for police service. This chapter discusses the impetus behind
the study of demand for police service, drawing on the broad spectrum
of research in the area. It then reviews the methodology and findings
of various studies of citizen servicle demands on police, identifying
some lessons that have (hopefully) been learned from this analysis,
and pointing out areas that have not been,.fully researched. The
chapter concludes with an overview of topics to be addressed in the
remainder of the volume.
Five Reasons for Studying Citizen Deaand Patterns
Among all government service agencies, municipal police
departments receive perhaps the highest volume of service demands.
There have been numerous studies of the form and content of citizen
demands for police service. In fact, several have suggested that the
'j

2
content of citizen demand is a major influence on the organization and
activities of police agencies. Others have disagreed, suggesting that
police response to demand is shaped by the delivery system itself.
They argue that incoming inputs are hopelessly vague and ambiguous and
must of necessity be transformed so that they may be recognized and
acted upon by service delivery agents, notably officers on the street.
While the reasons for studying citizen demand for police service
are varied, they can be subsumed under five general justifications, as
discussed below. The following discussion, and indeed this volume, is
limited to demand as manifested through citizen calls for service.
There are, of course, other forms of demand for police services
including walk-in complaints and flagging down passing officers.
Citizen Deaand Shapes Police Practice
Several analysts have suggested, either implicitly or explicitly,
that citizen demand is the principal factor shaping both police
organization and activities. They consider the police as a reactive
agency, one that responds to demands placed upon it. This view
"posi ts tight coupling between the organization and the environment
such that a given level of I inputs I of citizen cooperation,
information, equipment, personnel, and money will produce a given
level of I outputs I such as arrests" (Manning, 1980: 99-100). This was
the impetus behind Reiss' (1971) pioneering study of police officer
activities while on patrol. Reiss argued that since the patrol
division of any police department must organize to react to citizen
service requests, the form and content of those requests def me what
is considered a "police matter." Citizens frequently request police

3
intervention in situations which they think require mediation, perhaps
because they view themselves as victims, because they perceive a
breach of moral order, or because they want assistance or information.
The police may determine that these matters involve no crime, yet
because the public considers it police duty to handle them, the police
often respond. Since the earliest studies of demand patterns,
researchers have been struck by the volume and diversity of
noncriminal demands placed on the police. In fact, this is one of the
few consi stent findings to emerge from these studies. Police
departments have had to structure themselves to respond to this
diversity. Thus, not only do many departments maintain a large patrol
force, but they have established sources of information and referral,
special units to take reports by telephone or at the scene, crisis
intervention units, juvenile officers J and mb!':, other specialized
bureaus or offices.
While numerous studies have suggested the link between demand
patterns and police structure and activity, none have determined the
extent to which demand has shaped police practice. One reason this
determination is difficult is the discretion maintained by lower level
police personnel, including officers, dispatchers, and complaint
operators (Li{lsky, 1980; Manning, 1980; Percy and Scott, 1982a).
Another is because most studies making the demand-police activity link
have not had data on the full range of citizen calls for service.
Many studies have examined police records, which include only
dispatched calls, and have ignored the frequent information requests
police receive.

4
Citizen·DeaaDd as a Deterainant of the Police Role
Trying to define the present and proper role of the police has
been a popular topic since the turmoil of the 1960s brought the police
into focus as an issue of national concern. Studies of citizen demand
have been used to address this issue. Although the police role is
incredibly complex and has been a topic of major concern to a number
of analysts (see the discussions of the police role in Goldstein,
1977; Manning, 1977; Reiss, 1971; Reiss and Bordua, 1967; Rumbaut and
Bittner, 1979; Silberman, 1978; Wilson, 1968; and American Bar
Association, 1972), simply stated it involves two divergent
perceptions: one of the police as crime fighters, the other of the
police as service providers (with many noncriminal services included).
Studies of citizen demand patterns, following the reactive view
of policing discussed above, have helped to clarify the police role as
one of multiple service provider. These studies have attempted to
answer the question of precisely what it is that the police are being
asked to do, assuming that what they are requested to do correlates
strongly with what they actually do. Demand studies have argued that
calls for service initiate the majority of encounters between the
police and the public. Reiss (1971) and Bercal (1970) were among the
first to make the link between citizen demand and police role; the
latter, in fact, argued that his study of demand would illuminate "the
roles played by the police as defined by the public's requests for
assistance" (Bercal, 1970: 690). Previous research by Cumming,
Cumming, and Edell (1965) also linked demand patterns to the "latent
side" of the police role, i. e., noncriminal service provision.

5
These early studies gave rise in the 1970s to several analyses of
the service role of the police, a role that for many years the police
generally refused to acknowledge. Meyer (1976) focused solely on
citizen demands for service (noncrimmal requests). Lilly (1978)
established that police are now expected to perform more than law
enforcement tasks. Partly due to differences in methodology,
discussed later in this chapter, findings about the extent to which
police perform noncrimmal services vary. Suffice to say that the
police do maintain a significant role as provider of information,
assistance, and noncriminal services in addition to their
traditionally recognized functions of law enforcement, order
maintenance, and crime prevention. Studies of citizen demand have
helped give the police service role proper recognition.
Citizen Deaand Studies as a Tool for Police Manageaent and Planning
Police departments also use citizen demand data as the basis for
resource allocation decisions. Departments first determine
geographically distributed patterns of call volume. They then develop
administrative artifacts, such as patrol districts and beat areas,
that attempt to distribute patrol manpower across the jurisdiction on
the basis of call volume; areas generating large numbers of calls may
be assigned more officers, or beat sizes in high volume areas may be
made smaller to equalize workload. Periodic review allows districts
and beats to be adjusted for factors that might alter call volume,
such as population change, or construction of new commercial or
industrial property.

6
Some departments have used demand data as the basis of management
planning; others have preferred to use measures such as the number of
crimes committed. With the continuing spread of computer-aided
dispatching (CAD), more departments will have easier access to data on
demand patterns and volume~ Many CADs have features that allow
relatively simple calculation of demand patterns and volume by area or
type of call. CADs may stimulate the preparation of even more studies
of citizen demand than have thus far appeared.
Citizen Demand Studies and Call Processing
Despite the considerable interest in citizen demand patterns, few
would argue that more attention has been given to patterns of calls
for service than to officer behavior during police-citizen encounters.
In fact, even some well-known studies of calls for service have had as
their principal goal the description and analysis of interaction
patterns between citizens and police officers during on-scene
encounters (Reiss, 1971; Cumming, Cumming, and Edell, 1965). How the
police receive, process, and dispatch calls was ignored in favor of
officer activities. As Shearing noted,
While considerable attention has been given to the highly visible question of police/citizen encounters and while there has been some interest in the question of why citizens call the police the crucial questioD, of the processing of these calls has been more or less ignored (1974: 78-79).
Recently, however, there have been signs of a growing awareness of the
importance of examining the manner in which police receive and process
calls for service. Indeed, call processing may affect the manner and
speed of field unit response and, ultimately, officer decisions and
actions at the scene. In this sense, studies that identify the types
of demand on police are closely linked to call handling.

7
Call processing involves three major functions: call receipt by
police telephone operators, message transfer from operators to
dispatchers, and unit dispatch. Each stage of police call processing
can affect the content and meaning of demand messages; at each stage
there are decision points at which the level of information can change
considerably (Manning, 1980). Concern about pattems of citizen
demand has led to increasing awarenes s of this fact, and to the
importance of discretionary actions of police call processors, namely
call takers and dispatchers (Percy and Scott, 1982b). In a separate
volume produced by the authors as part of the Police Communications
Study (Percy and Scott, forthcoming), the roles of call takers and
dispatchers are discus$ed at length. Call takers act as gatekeepers,
determining which calls are eligible for police response, the initial
nature of that response, and, if the call is to be dispatched, what
the complaint and priority codes of the call will be. This
information is then forwarded to dispatchers, who determine precisely
when a call will be dispatched, who will handle the call, and how many
units will be sent. Decisions of police call processors can influence
police response and officer activities at the scene; they can
significantly influence overall police performance. This fact is only
beginning to be recognized, and initial police call processing,
including handling service demands, should be an area of increasing
interest in the future.
Citixen Demand Studies and the Development of Alternative Police Responses
A major impetus behind several recent analyses of citizen demand
patterns has been the growing realization among police observers and

8
administrators that constrained budgets and tight manpower situations
no longer permit most departments to dispatch a police unit to handle
every citizen sel~ice request. For years, unit dispatch has been the
expected response for both the police and the public. Now alternative
response methods must be developed that are less costly, yet which
maintain service quality and citizen satisfaction with the police. To
identify and evaluate various alternative modes of response, it is
first necessary to determine precisely what the police are being asked
to do. "What is needed is a completely new approach -- a system for
classifying various types of calls and rationally matching police
response al terna tives to the parti cular needs generated by those
calls" (Sumrall, et a1., 1981). An evaluation of various police
response alternatives has been conducted in Wilmington, Delaware (Cahn
and Tien, 1981). Alternatives include formally prioritizing calls and
delaying patrol unit response, telephone report-taking, walk-in report
taking, and scheduling an appointment with a specialized patrol unit
to meet the complainant. Results were generally positive in that
citizens did not seem to mind if they received a. nonpetrol unit
response and were told how the police were going to handle the call.
An ongoing study sponsored by the National Institute of Justice (1980)
is in the process of devising a call classification scheme based on
information critical to subsequent response assignment decisions. All
of these attempts to devise appropriate response alternatives are
based on first determining precisely what the patterns of citizen
demand on police are, and then developing acceptable, and effective,
means of nontraditional police response.
9
Our reasons for undertaking this study of citizen demand patterns
stem from a combination of all of the factors discussed above.
Despite the growing interest in demand processing, most of the work
that has appeared has been piecemeal. Few, if any, studies have
considered the full range of issues that can be raised by a
comprehensive analysis of citizen demand patterns, internal call
processing, police response, and their cumulative effects OIl police
performance. We hope to fill the gap with this volume and our
companion work on initial police call processing.
Alternative Methodologiea for StUdying Deaand: Strengths and Weaknesses
Although studies of citizen demand have adopted SIElveral different
specific methodologies, they can generally be classified as studies of
patrol officer activities or studies of calls for service distribu-
tion. Research adopting the officer activities approach takes the
position that citizen demands are manifested in the 'i(ork tasks of
patrol officers, that activities are indicative of the police role.
Studies following the calls for service approach take the traditional
position that the pattern of demands generally reflects what the
police do. Both approaches are thus ultimately interested in demand
as reflecting activities; both have strengths and wlaaknesses as
indicators of demand.
Officer Activity Studies
Most studies of officer activities discuss what police are asked
to do at a very general level. Wilson's (1968) analysis of dispatched

10
calls divided activities into four general categories, but included a
relatively small number of cases. Bercal's (1980) examination of
complaint operator responses to calls for service included a large
number of cases, but provided a description of content only for
dispatched calls. Again, the categories were quite general and
provided little detail.
Other studies have adopted methods closely relat~l to dispatch
analysis. Meyer (1976), for example, examined entries in one
department I S daily report log to determine officer activities.
Apparently not all calls for service were entered i.nto this log,
making it impossible to determ:ine the link between demand and
activity. Another approach is that taken by Webster (1970) who
analyzed police records to determine the length of time officers on
patrol spent handling different types of assignments; similar efforts
were conducted by Misner (1967) a.nd Reiss (1971). None of the
activity studies provides a comprehensive picture of what the police
do in relation to what citizens ask them to do. Yet, they are
frequently, and mistakenly, interpreted as indicators of citizen
dE!mand and police response in prepared departmental reports. Often
data on dispatched calls are gathered from summary data in prepared
departmental reports rather than from the "raw" dispatch tapes or
records maintained by many departments. Coding procedures are rarely
explained in publiShed reports ~ rendering comparison across studies
difficult. Manning (1980) suggests several reasons why "calls
dispatched" is not a uniform category:
1. Some studies have taken data from activity logs completed after an incident has been handled; this data mayor may not reflect dispatch content.

11
2. Record keeping in some departments requires gathering data from dispatch records, officer activity logs, and call records in order to determine the way calls were dispatched and disposed of.
3. Not all calls dispatched are answered by units.
4. Not all dispositions are recorded officially.
Calls for Service Studies
Studies that have examined calls for service are also frought
with methodological difficulties. First, many of them do not
precisely explain the source of their data. Cumming, Cumming, and
Edell's (1965) early study used direct observation of calls for
service. That is, they used observers to listen to and record
information about calls for service as they were received by the
department. Another form of direct observation is listening to tape
recordings of citizen calls; many departments record all call taker
conversations with callers. Later studies apparently relied on police
records of calls for their data (Reiss, 1971; Bercal, 1970; Sumrall,
et al., 1981; Cahn and Tien, 1981). Still others have used direct
observation and recording of demand information (Shearing, 1974;
Lilly, 1978; Antunes and Scott, 19B1; Levens and Dutton, 1980).
Methods used in data collection can obviously influence the tenor of
the results.
Second, the period of observation varies greatly from study to
study. Some rely on calls from a single day, others have assigned
observers to monitor calls over a period of weeks or months, and some
have used police records of calls for an entire year. Not all shifts
are represented in the data, or that various peak periods (Christmas,
July 4) do not bias the results. There are likely to be many more

12
calls about criminal incidents during the evening hours; similarly,
calls for information are likely to be more frequent during the
daytime. No study has attempted to control for situational factors
influencing demand, such as major holidays or significant events
(sporting events, disasters), that might result in an atypical pattern
of citizen calls.
Third, studies that have examined patterns of citizen calls for
service have varied in their approach to analyzing demand, with most
of the variety concentrated in the degree of specificity of the call
categories. Much of the literature has focused on whether citizen
calls concerned criminal or noncriminal incidents. As a result,
categorization of calls has been rather general, seeking to make only
macro distinctions. Although it has shown that police do handle a
large volume of noncriminal incidents, this approach has not been very
productive in determining the precise nature of citizen demand. From
the yearly two-category generalization developed by Cumming, Cumming,
and Edell (1965), which discussed calls about "things" (property) and
calls for "support," studies have moved to much more detailed
breakdowns. Scott (1981) listed calls received in 12 major categories
with 75 subcategories. While the more specific breakdowns provide
considerable insight into the demand received by a single department
(al though Scott's analysis included data from 21 departments),
comparison across studies is impossible. This is the result of
classification systems that are dissimilar except for the crime
noncrime distinction. Additionally, the categories are infrequently
defined, ~/en by examples of the types of calls included.

13
One can only conclude from the diversity of classification
schemes involved that they are based on different orderings of
demands. Some classification schemes reflect department incident
coding in that they tend to follow a legalistic, crime-based
orientation while clustering service calls into a small number of
categories. Others are merely observers' groupings based on common
sense approaches. Recently, call classifications appearing in the
literature have been criticized for their unsuitability for use by
departments in dispatching calls. There is currently an attempt being
sponsored by the National Institute of Justice (NIJ, 1980) to create a
call classification scheme that not only describes the nature of the
demand, but also the proper response priority.
Other Sources of DeRand Inforaation
Indicators of citizen demand levels as described in the
literature, and as portrayed in this study, provide only one view of
environmental influences on the police. We are examining calls for
service data as indicators of direct citizen demands. Other measures
of demand might include crime report data, victimization levels as
de termined through survey research, or officer (both patrol and
nonpatrol) time allocations. These data have occasionally been used
as demand surrogates. There are still other demand indicators that
are not considered in this report:
It would be useful to have full data on the nature of the demand that police receive, including citizen calls, planned demand that the police respond to as a result of anticipated needs in the community such as scheduled events, and the demand that is created in a sense by police definition of problems in the community that need their attention. Under this category are such things as a series of burglaries or robberies in an area, citizen concern about rape or drug use

14
which police attanpt to control by special task forces, concentration of personnel or the like. However, these data are not presently available for social science researchers (Manning, 1980: 101).
Our data, like those of many other researchers, represent one of the
clearest and most accessible indicators of citizen demand. Readers
should keep in mind, however, that the police must do more than
respond to calls for service.
Empirical Results of Analyses of Citizen Demand Patterns
Because of the problems stated earlier, namely that call classi-
fication schemes are not comparable across studies nor do they usually
provide details about how they were constructed, making sense of the
results of the empirical analyses of citizen demand patterns is
difficult. Some studies have found that calls related to criminal
incidents are more frequent than calls related to service, assistance,
or information provision (Cahn and Tien, 1981; Reiss, 1971; Levens and
Dutton, 1980). Other studies have determined that service calls are
more frequent than crime-t'elated calls (Antunes and Scott, 1981;
Sumrall, et al., 1981; Lilly, 1978). Studies of dispatched runs have
generally found that a high proportion, although not necessarily the
majority, of dispatches are crime related (Wilson, 1968; Bereal, 1970;
Webster, 1970); others note that smaller proportions of dispat.ches are
crime related (Reiss, 1971; Shearing, 1974). The disparity among
findings may be due in part to methodological decisions such as
assignment of different categories of calls or dispatches to the crime
category, or relying on entirely different data sources.

15
From these demand studies, two general findings can be
identified. First, regardless of whether they represent the majority
of demands, noncriminal calls for service constitute a significant
segment of citizen demand on the police. If information calls are
included (and often they are not because few departments keep records
of their frequency), then noncriminal calls represent an even larger
segment of total calls (Lilly, 1978; Antunes and Scott, 1981). Also
frequently considered noncriminal are calls for assistance or for the
police to provide general services. The definition of a service call
has never been standardized.
A second general finding from demand studies is that although
many calls, and sometimes the majority of calls, are dispatched, a
considerable proportion of calls for service received by police are
not dispatched. Many calls are handled by call takers alone, or
referred or transferred elsewhere. This becomes significant in light
of current interest in alternative responses to citizen demand that
involve savings in time and money, mainly by developing alternatives
to patrol car response. Cahn and Tien (1981) estimated that about 20
percent of calls in Wilmington were not dispatched. Shearing's (1974)
and Meyar's (1976) results were similar. Other estimates place the
proportion of nondispatched calls at about 50-70 percent of all calls
received (Scott, 1981; Lilly, 1978). The latter two studies included
a large number of information calls that were normally handled without
dispatching a unit, thereby increasing the percentage of nondispatched
calls. Al though the actual proportion of dispa tches is again
influenced by methodological considerations, it is clear that while
patrol unit dispatch remains the most common police response to
citizen demand, other responses are often invoked.

16
Where Do We Go 'rOIl Here?
The future of analysis of citizen demand patterns rests on the
continuing belief that calls for service exert significant influence
on police activities. If one accepts that examination of citizen
demand patterns is useful as one means of measuring demand on the
police, then there are several areas not yet considered by most
empirical studies that may prove insightful. For example, there has
been no careful analysis of calling patterns by neighborhood
characteristics. What are the differences in patterns of service
requests in primarily residential versus commercial or industrial
areas? What implications do these differences have for police
. resource allocation? Do residents of areas inhabited primarily by
minority groups call about different problems than white residents;
are there variations by income as well as race? Significant,
patterned variation may reflect a deliberate bias on the part of the
police in delivering services.
Variation in patterns of demand by neighborhood characteristics
may also help police departments structure their response capacity.
Programs of directed response might be established to handle
particular problems. For example, repeated complaints from residents
about speeding cars in the neighborhood might be handled by assigning
an extra patrol or traffic car to the area to watch for violators.
Most departments currently engaged in directed response programs have
relied on crime data as an indicator of problems; calls for service
data may also be useful in this regard.

17
Other topics of potential utility to police departments involve
demand patterns over periods such as time of day, day of week, or
month. Minimal research has focused on this topic. Demand
information by time period might be useful in allocating patrol
resources such that the highest concentration of personnel are on the
street during periods of peak demand. Another area of interest
related to demand that has not been systematically addressed is the
characteristics of callers who request police service. Can the police
expect different demand patterns from black than from white callers?
What about callers' emotional states? Are most people who call the
police upset or frightened? If so, this may indicate a need for
special call taker training programs to calm callers and extract
relpvant information so that the proper response may be determined.
Another area of inquiry related to citizen demand is the nature
of call taker response. This topic has received increased attention
~n the literature, but, much like call classifications, response
ca tegories vary tremendously across studies. A standard set of
categories is needed to be able to assess initial police response to
demand. Current NIJ-supported research is in part concerned with this
issue (National Institute of Justice, 1980). In addition to examining
police call response patterns, it is necessary to determine citizen
evaluations of the response they receive to their calls for service.
In light of current conc.ern with developing alternatives to patrol car
response, evaluation becomes even more critical. If callers are
willing to accept a response other than patrol unit dispatch,
departments may want to investigate various less costly alternatives.
18
Of course, effective analysis of citizen demand patterns depends
largely upon the development of a consistent means of call classifi
cat~on. At present there is no widely accepted standard set of call
classifications; each observer creates his own, much the same way as
each pol ice department establishes its own se t of complaint codes.
This is not likely to change on a large-scale basis in the near
future. What then becomes critical is for observers to clearly state
the manner in which their classification scheme was created, to be as
detailed as feasible in their explanation, and to give examples of the
types of calls subsumed within each category. In this way at least
some degree of comparability across studies should be achieved, and a
more accurate picture of demand patterns obtained.
Content of This Volume
In this volume we hope to address many of the issues raised
above. Our primary goal is to provide a comprehensive examination of
patterns of citizen demand on the police, including aspects heretofore
discussed only in a cursory fashion or not at all. Chapters 2 and 3
provide an overview of the methodology of the study and a description
of the research site: the city of Fort Worth, Texas, and its police
department. Chapter 4 offers a detailed discussion of demand patterns
in Fort Worth, comparing data from our observation with that gathered
by the Fort Worth Police Department. To our knowledge, this is the
first time this comparison has been systemati cally attempted; it
should shed some light on Manning's assertion regarding the
relationship between citizen demand and police activity.

19
Chapters 5 and 6 examine variations in citizen demands by time
periods and caller characteristics, respectively. Demand variations
by neighborhood characteristics such as racial composition, median
family in~ome, and land use patterns are discussed in Chapter 7. Here
we identify several factors that influence the proportion of calls of
a particular type emanating from various neighborhoods in Fort Worth.
Chapters 8 and 9 address police responses to calls for service and
citizen evalua tions of those responses J respectively. The final
chapter sums up our results, discussing their implications for future
research and especially for police policy making.

CHAPtER 2
OVERVIEW OF THE POLICE COMMUNICATIONS STUDY
This chapter provides an overview of the research methodology and
data collection strategies employed in the Police Communications Study
(PCS). The PCS was conducted by the Workshop in Political Theory and
Policy Analysis at Indiana University and was designed to determine
patterns of citizen demands on the police and strategies for
processing those demands. This discussion of research methodology
which includes descriptions of site selection, research instruments,
and data collection activities introduces a background for
understanding and evaluating the data analysis presented in subsequent
chapters.
Selection of Research Site
Since the PCS was attenpting a comprehensive description of
patterns of citizen demands for police service, requiring detailed
knowledge of and familiarity with communications technology, we
decided that gathering data in a single police agency would be an
appropriate research strategy. Since the communications systems and
equipment utilized by American police agencies are so varied, it would
have been very difficult and costly to conduct a study requiring
in-depth knowledge of communications technology in mUltiple research
sites. Focusing on one department also permitted researchers to
investigate and comprehend one system in detail. Unless a large
number of sites were included, which was impossible due to cost
constraints, it was felt that no significant gain in the

21
generalizabi1ity of findings would be achieved by studying more than
one site.
Another reason for limiting the study to one research site was
the difficulty and cost of obtaining equipment to monitor calls for
service. The project's research strategy required acquisition of
equipment with which to monitor police department tape recordings of
calls for service and radio dispatches. While most departments
maintain such tapes, several different types of taping equipment are
used. In order to conduct the study it was necessary for the project
to obtain playback equipment compatible with the study department.
Obtaining this equipment is difficult because there is no rental
market for it and purchase costs are prohibitive. Since acquiring
compatible equipment was both difficult and expensive, the project had
further incentive to limit its scope to comprehensive research in a
single site.
In selecting a police agency to serve as a research site, several
criteria were used. For mUltiple reasons the project desired to study
a department with a computer-aided dispatch (CAD) system. Since an
increasing number of medium- and large-size departments either
currently use or plan to install some form of CAD system in the near
future, it seemed appropriate to focus the study in an agency using
modern technology to process and dispatch calls for service. Also,
computerized systems can efficiently provide researchers with data
from police records. A second site selection guide concerned
department size. We did not consider the larger departments since
they have been more extensively studied than other police agencies.
At the same time, we were interested in locating a department serving
22
a sufficiently large population to generate a sizeable volume and
variety of calls for service, including violent crimas. A third
selection criterion required heterogeneity in demographic
characteristics of the jurisdiction population, such as income and
race. This socioeconomic variety would allow the project to determine
whether demographic factors significantly influence patterns of
citizen demands for police services.
After reviewing several possible sites, the Fort Worth, Texas,
Police Department (FWPD) was selected as the research site for the
PCS. The department presented a good fit with most site selection
criteria. First, FWPD uses a computer-aided dispatching system with
an attendant ability to generate useful data on police calls for
service records. This CAD system could also assist in triangulating
different elements of the demand processing function, which was
important to our research methodology. Second, the popUlation of Fort
Worth provides a social and economic diversity well suited to a
comprehensive study of demand patterns. Third, crime patterns in Fort
Worth are sufficiently varied to allow for examination of many types
of service demands, including those related to violent crimes,
property crimes, and general. assistance. Another reason why Fort
Worth seemed an appropriate research site was its location in the
Sunbelt, a region of the country less often studied, but which is
currently experiencing dramatic popUlation and economic growth, and a
concomitant increase in demands on local police agencies.

23
Research Methods
To study the research issues of demand processing and information
flow, data were gathered through a variety of methods. The principal
research effort of the PCS was to trace individual calls for service
through the stages of initial police response: call receipt, call
handlings and unit dispatch. Other data gathering strategies included
interviewing citizens who had recently contacted the police, and
questioning patrol officers who regularly receive demand information
after it has been channeled through police communications. The
project also obtained computerized copies of FWPD calls for service
records for the calendar year preceding fielduork (1980) aa well as
for the 3-month research period (February-April 1981). The following
sections explain each of these research methods.
Monitoring and Coding Inforaation on Calls for Service
In order to comprehensively assess demand processing in police
agencies, the PCS followed individual demands, or calls for service,
through the steps in initial police response. The main effort of the
study focused on monitoring the communications between citizen callers
and police telephone operators, between police operators and
dispatchers, and between dispatchers and officers in the field. A
three-step data collection strategy was designed to obtain information
on each of the three communication linkages associated with processing
calls for service.
Step 1: The Caller-Police Operator Exclymge
Data were gathered on citizen-police operator interactions by
listening to and coding their tape-recorded conversations. Most

m
24
police agencies, including the FWPD, tape all incoming calls for
service, both to serve as a back up if information is garbled or
confused and as evidence for cases of citizen complaints about police
response. Using specialized equipment, the FWPD continually tape
records all incoming calls for service and all dispatch tranmnissions
on 24-hour, reel-to-reel tapes. These tapes are kept by the
department for about 3 months, after which they are recycled. In
order to moni tor tapes, the study rented three tape play-back machines
that were compatible with the FWPD equipment. During the course of
fieldwork, tapes were regularly borrowed from the department,
monitored, and returned within a few days.
The calls monitored in fieldwork were selected to be as
representative as possible of calls for service received by the FWPD.
The project began monitoring calls originally received by the FWPD in
early February 1981. Tapes for each successive day were monitored,
meaning that calls received during all days of the week were included,
with some biasing toward weekend periods when call volume is at its
peak. For a given day, calls were chosen first by randomly selecting
one of the three daily 8-hour dispatch shifts and then by randomly
monitoring different tape channels during that shift. Each channel
corresponded to a separate call taker position; for each shift we knew
which positions were operative and listened only to those channels.
By listening to one channel for an hour and then moving to another,
the project maximized the number of different call takers monitored.
Through this strategy, the pes monitored a large number of calls that
should be representative of the full set of calls received by the
department during the period of fieldwork.
r. . .'.

25
While listening to individual calls for service, researchers took
notes on the following information items exchanged during the phone
conversation:
e Caller name, address, phone number, and current location;
1& Street address and other description of the problem/crime loc.ation;
& Nature of the problem or crime reported to police;
8 Description of participants, weapons, or vehicles involved in the incident;
• Perceived caller characteristics (age, race, sex, emotional sta tus); and
.. Police operator response to the call.
All of these items were recorded on the first part of a detailed
coding instrument, the Calls for Service Coding Form (see Appendix 1).
Not only did coders note individual information items, but also the
context in which information was exchanged, that is, whether the
caller volunteered or refused information and whether the operator
asked for information. A set of acquisition codes was used to
describe the context through which information was exchanged: (1)
information neither given by the caller nor received by the operat~,
(2) information given at caller initiative, (3) information given by
caller when requested by the operator, (4) information given through
both caller initiative and operator request, (5) information requested
by the operator and overtly refused or otherwise not given by the
caller.
Step 2: Gathering Data frOB CAD Recorda
The next step in tracing the flow of calls for service was to
match monitored calls for service with police records of these calls.

--- -----------------------------
26
That: is, monitored calls were matched with those that police call
takers entered into the CAD system. (The CAD system used by FWPD will
be described in more detail in the next chapter.) Matching was done
on the basis of date, time of call, and address. Since police
operators only enter information into the CAD system for calls they
feel require dispatch of a police unit, we were unable to match a
significant portion of monitored calls with police records. Calls
that concerned requests for assistance or information where the
operator decided police response was not appropriate thus could not be
matched with CAD records.
For those ca.lls for service that were matched, researchers
examined departmental records and coded information about the service
request. These records were daily computer printouts of calls for
service information recorded in the CAD system. Again, they noted
whether any of the set of information items previously described were
included. They recorded the beat location of the call, the police
units that were assigned, key times related to call proc.assing, and
other information included in the record. Also, they noted verbatim
any explanatory remarks that the operator entered into the record in
addition to the complaint (signal) code describing the problem.
Step 3: Monitoring Dispatch Transaissions
The third research step involved listening to and coding
information on dispatch transmissions relevant to calls monitored in
step 1 and traced through police records in step 2. Once again
matching was required, this time on the basis of time of day and units
assigned to the call, information gathered from CAD records in step 2.

---- ----------
27
Researchers again reviewed the FWPD voice tapes and monitored the
channels on which dispatch tranmnissions were recorded. Based on the
beat location of the call, researchers could determine on which
channel of the tape they were likely to find the matching dispatch.
When the appropriate dispatch was found, researchers took
verbatim notes on the exchange between the dispatcher and the
responding officer. Unlike citizen-police telephone conversations,
dispatch transmissions tended to be relatively brief, usually lasting
less than 30 seconds. After transcribing the dispatch, researchers
noted on the coding form which information items were exchanged, and
once again, used acquisition codes to describe the context in which
information was exchanged. Practically all information contained in
dispatches was provided at the initiative of the dispatcher, although
on occasion, the responding officer asked for additional or clarifying
information.
Fieldwork research was conducted in the Fort Worth Police
Department from February through April 1981. During the course of
research, more than 1,000 hours of taped calla for service were
monitored. Data were collected on more than 5,700 calls received by
the FWPD. Of these calls, about 2,300 or 40 percent were matched with
CAD records and taped dispatches. ~Iost of the remaining calls did not.
involve a police dispatch, and as such, were never entered into police
records.
Police Records of Calls for Service
In addition to monitoring voice tapes of calls for service, the
project obtained copies of the computerized records of calls for
28
service maintained by the FWPD. These were the same records used in
step 2 above to obtain relevant data on monitored calls. Included in
these records were complainant name, address, and phone number; signal
(complaint) and priority codes; beat location, units assigned,
relevant times (e.g. J time dispatched, time back in service), and
explanatory remarks. The PCS obtained computerized records of all
calls for service received by the FWPD during the 1980 calendar year,
yielding data on slightly less than 200,000 calls. Also, the project
gathered the same records for the 3-month period of fieldwork.
Examination of the 1980 calls for service records provides a
description of the annual pattern of demands to which a unit was
dispatched by the FWPD and allows for analysis of seasonal
demand/dispatch patterns. Analysis of police records for the period
of fieldwork allows the project to test for research bias and to
compare the total set of calls for service received by the department
with the smaller set that was entered into police records and
eventually dispatched.
Interviews with Persons Calligg the Police
Since a major research question of the study focused on demand
processing, the project was interested in how citizens rated their
interaction with police operators during their initial call for
service. To assess citizen perceptions and evaluations of operator
treatment and response, a citizen interview form was developed. The
interview, included as Appendix 2 to this volume, contained questions
concerning the following items:

29
• The plcoblem or crime reported by the respondent;
., Respo,ndent's relationship to the incident (e.g., victim, witness);
G Location of the incident;
e Information provided by the call taker about police response (e.g., was a unit promised, was response time information given, was other relevant information provided);
• Responcientevaluation of the response provided by the operator and assessment of treatment by the operator; and
o Evaluation of police response time to the call for service.
The pool of interviews was drawn from those individuals whose
calls were monitored by the PCS staff and who provided a phone number
or sufficient information so that a phone number could be found. This
set of individuals was then screened so that persons who called the
police on a regular basis (e.g., alarm company representatives) ~ who
reported very sensitive incidents (e.g., rape, family arguments), who
were police or city personnel, or who had already been interviewed by
the project were eliminated from the pool. For those persons
selected, project members attempted to verify address information
through local directories. Where sufficient information was found,
potential interviewees were sent a letter describing the project and
informing them that they would be contacted by telephone for the
interview. All interviews were conducted over the phone, and most
persons contacted consented to be interviewed. During the course of
fieldwork, more than 1,200 interviews were conducted.
Police Officer Interview
In order to 8ssess patrol officer perceptions and evaluations of
the information they receive from dispatchers about calls for service,
the PCS developed a Police Officer Interview Form (Appendix 3). This

.30
interview contained questions on the following topics related to
police communications:
• Officer asseS8ment of their own knowledge of police communi ca tiona;
• Adequacy of information received about problems and incident location;
• Radio congestion and discipline;
• Utility of different types of information in responding to calls for service of different urgency;
• Officer evaluation of the computer-aided dispatch system; and
4\9 Officer characteristics (e.g., years on the force, age, sex, race) •
The interviews were distributed to all patrol officers and
supervisors through mail boxes in the FWPD patrol deployment
headquarters. Included with the survey was a letter from the project
director describing the PCS research effort and assuring confiden-
tiality, a letter from the chief of the FWPD verifying the study and
urging participation, and a stamped, self-addressed envelope. The
surveys were distributed near the end of the study; a brief reminder
to complete and return the questionnaire was distributed to improve
the response rate. Approximately 40 percent were returned to the
project via the mail.
Conclusion
The purpose of this chapter has been to outline the research
design and data collection efforts of the Police Communications Study.
While subsequent chapters will explain particular aspects of the
project in more de tail, it is hoped that this chapter provides a
general overview of the research strategy of the project. Readers

31
interested in a more detailed description of project methodology,
research instruments, and fieldwork procedures may wish to consult the
PCS Report on Data Collection and Research Instruments (Scott, Percy,
and Swarup, 1981).
CHAPTER 3
FORT WORm AliD ITS POLICE DEPARTMENT
The city of Fort Worth and its police department were considered
ideal locales for conducting the Police Communications Study. This
chapter briefly describes the character of the city and discusses the
Fort Worth Police Department's organization for receiving and
processing citizen calls for service. The chapter also discusses the
computer-aided dispatch system which generated some of the data used
by the study.
A Brief History -- Covtown to Boa.town
Fort Worth was established as a frontier army post in 1849. It
quickly became a stopping place along the Chisholm Trail and a
shipping center for the tremendous herds of longhorn cattle being sent
to northern markets. The stockyards still exist and continue to lend
a distinctive character to modern Fort Worth, supporting its claim as
the most typically Texan of all Texas cities. Fort Worth is much more
than a cattle processing center, however. It has grown rapidly and
has become a major center of oil finance, manufacturing, and aerospace
development. The total civilian labor force in the Fort Worth
metropolitan area increased more than 22 percent between 1975 and
1979.
Fort Worth's population has grown steadily throughout the
twentieth century, although some leveling is now occurring within the
city limits. From a population of slightly more than 25,000 in 1900,
Fort Worth I s current population is 385,141, a decrease of about 2
33
percent since 1970. Like many other major cities, Fort Worth has seen
some residential movement to suburban areas. At the same time,
minority population has grown considerably. In 1980, whites
represented about two thirds of total city population (68.9 percent).
Blacks are the largest minority group, comprising 22.8 percent of Fort
Worth citizens. American Indians, Asians, and other minorities
represent about 8.3 percent of Fort Worth residents. There is also a
large Spanish-speaking population, comprising about 12.6 percent of
all residents.l
Fort Worth I s population is spread over a land area of
approximately 245 square miles; more than 2,000 miles of streets
traverse the city. Contained within this area are pockets of dense
residential land use, large industrial parks, a major Air Force base,
a considerable downtown business district, and many areas of strip
development representing both residential and commercial use.
Residential land use represents approximately 12 percent of total city
land area.
Criae Rates in Fort Worth
The rapid growth of the work force, an influx of lower income
residents, and the large area of commercial and industrial development
are all possible influences on Fort Worth I s considerable crime rate.
Crime in Fort Worth has risen sharply in recent years; the percentage
increase in crime since 1978 was among the highest of any American
city. In this regard, Fort Worth is representative of trends
occurring throughout one of the largest areas of population growth in

34
the United States, the Sunbelt of the south and southwest. Crime in
Fort Worth, as measured by the traditional indicator of Part I crimes
reported to the FBI, increased 33 percent in 1980 over rates reported
in 1978. Robberies and aggravated assaults increased more than 75
percent from 1978 to 1980, burglaries 37 percent, larcenies 28
percent, rape and murder more than 25 percent. These increases rank
among the highest in the country for the past few years.
The Fort Worth Police DeparbRent
The Fort Worth Police Department served as the host agency for
the Police Communications Study. It was selected on the basis of
several criteria, including department size, present and projected
city crime rates, and use of computeriz ed call handling technology.
During the study period, the FWPD employed 689 sworn officers and 215
civilians who were assigned to one of five general functional bureaus:
police administration, administrative services, uniform services,
investigative services, and technical services. The PCS was primarily
concerned with the technical and uniform services bureaus. Technical
services, which employed 60 sworn officers and 111 civilians, is
responsible for receiving and processing citizen calls for service.
Uniform services contains the patrol function. Patrol officers were
assigned to one of eight districts, as shown ~n Figure 3-1. The city
was also subdivided into 90 patrol beats.
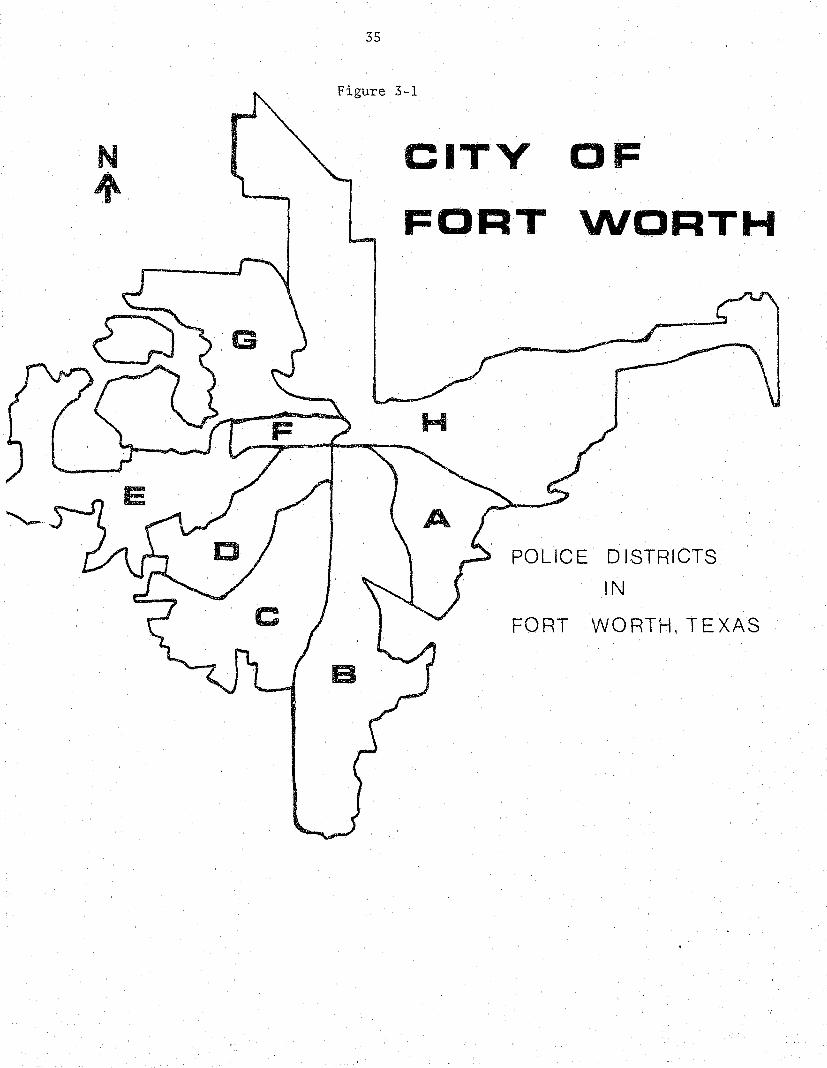
N
•
35
Figure 3-1
CITY OF
FORT WORTH
POLICE DISTRICTS
IN
FORT WORTH, TEXAS

36
FWPD Organisation for Call Froce.sing
Processing of citizen calls for service ~n Fort Worth is handled
by the communications division, a unit within the technical services
bureau. Headed by a lieutenant, this division contains both sworn and
civilian call takers and dispatchers, plus civilians who work in a
telephone report writing section which takes crime reports directly
from citizens (Direct Entry Computerized Offense Reporting, or DECOR).
This division is also responsible for processing all data generated by
the department's computer-aided dispatch (CAD) system.
When a citizen calls the FWPD, the call is routed through the
automatic call director (a switching mechanism that automatically
distributes incoming calls randomly) to 1 of 12 call taking positions.
If no position is available, the call is automatically placed on hold.
Depending on the particular shift, between 6 and 12 call taking
positions will be operative. Each of the 12 call taker positions
contains a computer terminal (CRT) and a keyboard. One position
contains direct line emergency assistance phones connected to alarm
companies and ambulance firms.
FWPD call taker positions are located in a single room; work
stations are arranged such that two or three positions are clustered
together. This arrangement facilitates access to sources of vital
information, including lists of departmental and other often-called
telephone numbers, telephone directories, city directories, maps,
departmental procedures manuals, directories of social service
agencies, and copies of state penal codes and local ordinances. It
also facilitates communication among call takers, a necessity in times
of high demand volume or when questions about a particular call arise
and consultation is required. Call takers wear headsets that free

37
their hands for writing or referring to sources of information. When
they are busy handling a call, the automatic call director will assign
another incoming call to an open position. When call takers complete
handling a request, they must flip a switch on their 'headset before
they can receive the next call.
Calls are automatically routed to dispatchers when a call taker
depresses a relay key on the CRT keyboard. FWPD has five dispatch
stations, four of which are operative at any given time. Each station
is responsible for a particular quadrant of the city. Each contains a
printer on which is generated a dispatch ticket containing demand
information forwarded from call takers, a CRT for monitoring unit
status, and e radio console for broadcasting dispatch information to
officers. Maps, directories, and other information sources are also
present at each dispatch station.
Dispatchers are located in a room apart from call takers,
separated by a glass partition. At the center of the dispatch room is
a desk manned by the dispatch coordinator. This individual is
responsible for coordinating all requests from officers. He maintains
daily reports and logs necessary to communications division functions,
including personnel work logs, computer and/or radio problem logs, and
lists of available wreckers, ambulances, and funeral homes. All
officer requests for tow trucks or paramedics are dispatched by phone
by the dispatch coordinator. The coordinator also assists dispatchers
~n verifying complainant address information, and notifies supervisors
of any situation developing in the field that requires their
attention.

38
Of course, not all calls to the police are dispatched. Callers
reporting mi."'lor thefts, stolen cars, criminal mischief, or other
incidents not obviously requiring an officer's presence may be
transferred to the department's direct entry crime reporting function,
DECOR~ and a report made by phone. DECOR operators are located in a
facility apart from other call handling personnel. They sit at
stations equipped with CRTs. They receive calls from citizens that
are transferred to them by departmental complaint operators. When a
call comes in, DECOR operators determine its nature (stolen car,
burglary, etc.), depress a function key to call up the computer
recording for.mat corresponding to that type of call, and enter
pertinent inforruation. Once s report is complete, it can be sent via
computer to various locales, according to which office will handle the
report. Many go directly to the investigative services bureau for
handling by detectives. DECOR also takes reports directly from field
of ficers. Once an officer has completed gathering all relevant
information at an incident scene, he proceeds to a nearby telephone
afid relays the information to the DECOR operat~. The direct entry
procedure ia designed to speed the process by which reports are
channeled and acted upon.
FWPD Computer-Aided Dispatch Systea
Computer-aided dispatch systems involve the computer in
processing calls for service, determining vhich patrol units should be
dispatched, and making adjustments in unit status. CAD systems do not
completely automate call receipt and handling, but instead utilize the
computer's ability to enhance call processing by police operators and
39
dispatchers. When a call is received and a call taker determines that
a unit should be sent in response, a function, or format for
informa~ion entry, is displayed on the CRT. This function is similar
to the dispatch card used in more conventional police departments in
that it has space for the call takers to enter certain information.
To initiate call response in Fort Worth, operators must enter caller
name, location, and a numerical code representing the nature of the
problem. They can also enter such information as complainant phone
number, address, call response priority, and descriptive or
explanatory remarks concerning the nature of the problem. Usually
these remarks are meant to supplement the nature of the problem as
designated by the complaint code.
Once operators are satisfied that all pertinent information has
been gathered from the caller, they depress a key that relays the
information to the proper dispatcher. Calls are routed on the basis
of beat location, which is automatically assigned by the computer. If
the address information entered is incorrect (a street number out of
range or a street name misspelled), the CAD system will refuse to
route the information until either the error is corrected or the call
taker hits an override key; the latter is used when a street name is
new and has not yet been entered into the computer. Information as
entered by the call taker appears on dispatch tickets printed at each
dispatcher station.
When a call is routed to a dispatcher, not only is demand
information printed in ticket form, but it appears on the dispatcher's
CRT screen. Each dispatcher has several functions available on the
CRT. One indicates a list of all pending, or unassigned, calls for a

40
particular sector. Another lists the status and availability of all
patrol units under the dispatcher's control. Dispatchers check the
information on the dispatch ticket, review the lists of pending calls
and uni t sta tus, and de termine when a call will be as signed and which
patrol unit will be dispatched. Usually units are selected on the
basis of their proximity to the scene. Calls are normally dispatched
in order of priority, with emergency calls dispatched before routine
calls. When several calls of equal priority are waiting in the
dispatch queue, dispatchers use discretion in sequencing responses.
The CAD system in Fort Worth automatically determines certain
information for every call and prints it on the dispatch ticket. For
example, the CAD adds the beat in which a call is located and a unit
or units that are available to handle the call. It also prints the
time the call was entered into the system by the call taker and
assigns each call a unique serial number. Some of this information is
useful to dispatchers, while some is more relevant as a source for
later performance review by departm~nt management. There are several
different philosophies regarding CAD functions. Some departments view
CADs as a tactical tool for patrol unit dispatch, some as a source of
management data, and some only as one component of an integrated,
computerized information system. Fort Worth has adopted some aspects
of all three philosophies.
The FWPD CAD system can also assist call processing in ways
indirectly related to unit dispatch. It can access several sources of
computerized information. For example, call takers can refer.ence
local car registration and drivers license files, lists of stolen
vehicles, previously reported criminal incidents, lists of outstanding

41
warrants, and other information that can assist call takers 1n
answering citizen requests. Each list is accessed by a separate
function code. Instead of telling a caller that the requested
information must be obtained from another office, or that it requires
a time consuming record check, operators can provide quick answers to
many questions by accessing various information sources and displaying
them on their CRTs.
FWPD Call Taker and Dispatcher Training
In Fort Worth, call taker and dispatcher training normally
consists of a period of peer or supervisor instruction, a stint
handling the phones or radio console in the presence of a veteran, and
a period of on-the-job training. Two levels of call processing
personnel are employed. Newly hired personnel enter with the rank of
Public Safety Dispatcher I and work their way up to Public Safety
Dispatcher II. Persons of the lower rank are limited to call taking
duties only; persons with the higher rank can either answer phones or
dispatch, and in fact do both depending on need during any given
shift. Each newly hired call taker is assigned a training officer,
placed at a call taking station, and instructed in proper equipment
handling techniques. Unlike many departments, FWPD has developed a
training manual for use by new employees. It contains a listing of
duties performed by various departmental personnel, a listing of the
component parts of the department, a section on the philosophy of the
communications division, and a brief section on the philosophy of law
enforcement. Discussion of proper call handling technique is covered
only briefly in a section containing miscellaneous tips.

42
Most basic training for FWPD dispatchers is also conducted by
peers in on-the-job situations. It concentrates on the technical
aspects of operating complex radio and CAD equipment, on departmental
policies governing call priority and radio traffic, and on the
mechanics of monitoring unit status. Because most dispatchers work
their way up by starting as call takers, or in fact still answer calls
depending on the personnel needs for any given shift, they have been
exposed to some techniques of interpersonal communication. Their
training is essentially that given to call takers with additional
concentration on handling dispatch equipment.
To augment the training manual J the FWPD developed a very
detailed procedures manual containing instructions on using the CAD
system. FWPD also periodically issues training bulletins dealing with
specific topics. This series of bulletins is a major source of
departmental instruction in telephone procedures. It gives examples
of correct and incorrect call handling styles, encourages operators to
obtain all relevant information as expeditiously as possible, and
points out the value of correct information to responding officers.
Still, the emphasis in training is on proficiency in the use of demand
processing equipment rather than on techniques for effective
interpersonal communication. This trend has probably increased with
the technical sophistication required by the recent proliferation of
CAD systems nationwide.
Call Processing Supervision
Police complaint operators and dispatchers act in a largely
autonomous fashion, guided primarily by the constraints of prevailing

43
technology and their own common sense. They maintain a substantial
degree of discretion in performing their job tasks despite the
presence of communications supervisors. In the FWPD there is at least
one sergeant assigned to communications supervision on each shift,
more during the day shift. The majority of their time is taken up
with administrative duties such as scheduling personnel, maintaining
attendance records and statistical reports, or talking with other
police officials or the public. Daily supervision is usually limited
to a cursory check on current activities such as determining which
call takers are busy with callers, which are waiting for a call, or
which are "unplugged" and therefore unavailable to receive a call.
Supervisors can also review the unassigned call list, but do so more
as an indicator of departmental workload than as a check on dispatcher
activities.
FWPD supervisors do, however, make a concentrated effort to
conduct periodic performance reviews. These may consist of a
supervisor or senior officer sitting with call takers or dispatchers
and monitoring their activities and performance directly. Another
form of performance review occurs when supervisors monitor
departmental tape recordings of operator and dispatcher conversations.
Many departments have this capability, but do not make much use of it
unless they are reviewing a citizen complaint. In Fort Worth,
supervisors spend considerable time reviewing tapes in an effort to
identify problems that recur and to highlight areas in which
indivldual performance could be improved. These review sessions have
resulted in the preparation of several training bulletins designed to
correct common mistakes and improve call handling procedures.

44
Even with constant supervision, however, it is difficult to
standardize call taker or dispatcher response. While procedures may
be established and utilized in given situations, the situation must
first be. identified before a standard response can be invoked. Calls
to the police at times seem very similar, yet no two are exactly
alike. Call takers must use their judgment in determining the nature
of the caller's problem and the correct police response. Dispatchers
must assign calls of equal priority according to their own assessment
of the importance of placing an officer at the scene quickly.
Supervision must of necessity be loose. The best that can be hoped
for is that call processors will act within "acceptable standards," as
defined by the department and the community, most of the time. Rapid
reaction and choice is the nature of call taker and dispatcher tasks;
no amount of technological improvement will change that fact.

45
Footnotes
1Tbe 1980 Census did not include Spanish-speaking people as a separate race or ethnic group. Rather, respondents were asked to give their race and were then asked a separate question about the language spoken in their home. Thus, the 12.6 percent of Fort Worth residents that speak Spanish is comprised of persons who are white, American Indian, Asian, or "other."

CHAPTER 4
CITIZEN DEMANDS FOR POLICE SERVICE IN FORT WORTH
Patterns of problems and crimes reported to the Fort Worth Police
Department are examined in this chapter. Different data sets are used
to portray demand patterns from two perspectives. First, demands are
analyzed using data collected by the Police Communications Study
through monitoring departmental tape recordings of calls for service.
Second, citizen demands are examined from the perspective of police
records maintained by the FWPD's computer-aided dispatch system; the
nature of the demand is determined by police call takers in their
assignment of official complaint codes. These data sources present
two related yet different perspectives on what citizens ask the police
to do. We compare them in the following section.
Ways to Examine Citizen Deaand Patterns
Previous studies of calls for service 'have used varied
methodologies to analyze and gather data on citizen demands. Some
studies have used police records to study calls for service (e.g.,
Wilson, 1968; Meyer, 1976; Webster, 1970; Bercal, 1970). Generally
these studies have collected and examined data from complaint cards or
records maintained and used by police agencies. Most departments use
complaint cards to record data on only those calls for service that
require some form of direct police assistance, such as unit dispatch.
Therefore, these records do not describe the full set of calls for
service received by a police department. Instead, they describe
citizen requests that have been judged eligible to activate police
dispa tch.

47
Other studies of demands for police service have analyzed
incoming calls for service as reported to call takers (Antunes and
Scott, 1981; Scott, 1981; Levens and Dutton, 1980; Lilly, 1978; Cahn
and Tien, 1981). Monitoring is done by listening to either live
conversations or to tape recordings of incoming calls. By monitoring
these calls, information is gathered on the types of problems
initially being reported to police. This set of calls is broader than
that found in police records, although there ~s substantial overlap.
Analysis of incoming calls for service provides data on the number and
types of citizen demands that generally do not result in police
dispatch, including requests for general and police-related
information, as well as data on requests that ~ dispatched. These
data also document the extent of referral of callers to other police
and social service agencies and call transfer to police units such as
report writing stations, supervisors, detectives, and the chief IS
of fice.
Both data sources provide useful information on patterns of
citizen demands for police service, even though the patterns they
reflect are different. In this chapter, we begin by analyzing data
collected by the PCS through monitoring incoming calls for service.
Then, we will examine data from FWPD records on the calls that
initially were judged eligible for police dispatch. The chapter
concludes with a synthesis of these analyses and consideration of
their cumulative findings on patterns of demand for police service.
48
Citizen Deaands for Police Service: The Perspective froa Monitoring Incoaing Calls for Service
As described in the previous chapter, PCS researchers who
monitored tapes of calls for service received by the FWPD noted the
nature of the problem or crime reported by the caller. This written
description was noted in an open-ended field on the Calls for Service
Coding Form (Appendix 1). Subsequently, field supervisors translated
this description into one or two "problem codes" developed by the PCS.
The problem code list used by the study contained over 200 separate
codes covering a wide range of possible service requests related to
crimes, traffic problems, assistance, and information. These problem
code's provide a description of the service request arti culated to the
police in the call for service.
Overview of Demand Patterns
This extensive set of codes has subsequently been grouped into 10
general problem categories developed to cluster similar types of
service requests. Table 4-1 lists these 10 categories along with the
frequency distribution for each within the calls monitored by the
study. The pie diagram in Figure 4-1 compares the frequencie.s in each
category.
Problems with persons and problems with property are types of
demands that people most often associate with police. Problems with
persons include crimes and other situations inVOlving danger, injury,
or harm to individuals. Serious problems with persons include
assault, rape, robbery, and fights, while less serious problems with
persons include disturbances, arguments, and other social problems.

49
Together these two categories represent about one fifth of all
monitored calls for service, with ser.ious problems accounting for 6
percent and less serious problems for 14 percent.
Table 4-1
Distribution of Monitored Calls for Service by General Problem Catego~ies
(N = 5,092)
Problem Category:
1. Serious Problems with Persons 2. Less Serious Problems with Persons 3. Serious Problems with Property 4. Less Serious Problems with Property 5. General Assistance 6. Emergency Assistance 7. Suspicious Person or Property 8. Traffic Problems 9. Citizen Wants Information
10. Citizen Wants to Give Information
Total
Number of Calls
295 721 477 838 272 133 404 838 886 218
5,092
Percent of Calls
5.8% 14.2
9.4 16.5
5.3 2.6 7.9
16.5 17.4 4.3
100.0%
Problems with property represent instances of damage to or loss
of property through crime or other circumstances. Serious problems
with property include burglary, theft, break-in, and arson; together
these account for 9 percent of monitored calls. Less serious problems
with property, which include vandalism, attempted break-in, lost or
missing property, and trespassing, account for over 16 percent of
monitored calls for service.
In addition to problems and crimes involving property and
persons, the FWPD also received several types of requests for police
assistance. Requests for emergency assistance such as traffic

50
Figure 4-1
Distribution of Monitored Calls for Service by Gener.l Probl" Categorie!
9.4% Serious Problems
\<Ii th Property
5. 8~i5 Serious Problems
\vi th Persons
14.2% Less Serious
Problems \<Ii th Persons
17.49,;
Citizen Wants Information
2.6% Emergency Assistance 5.3% General Assistance
16.5% Traffic Problems
16.5%
7.9% Suspicious
Person/Property
Less Serious Problems
\<lith Property
4.3% Citizen Wants to Give Information ----~--------------------------------~

51
accidents with personal injury, medical assistance, and fires
represent about 3 percent of calls. Requests for general,
nonemergency services such as missing persons, animal problems,
requests for surveillance, and others account for 5 percent of calls
to the police.
Another frequent service request received by the FWPD relates to
suspicious persons or circumstances. Usually no crime is being
reported in these calls, yet callers perceive that some crime might be
committed. In the calls monitored in Fort Worth, approximately 8
percent concerned suspicious persons or circumstances that callers
felt deserved police attention, including open windows or doors and
strangers in the neigborhood.
Police in most communities, including Fort Worth, are charged
with a traffic function that includes monitoring and controlling
traffic flow, investigating traffic accidents, and overseeing parking
regula tions. In Fort Worth, calls for service related to traffic
problems represent a significant proportion of monitored calls for
service, more than 16 percent of the total.
Still other types of demands made upon the police, ones which
have been often ignored in studies of police demands, relate to the
exchange and provision of information. In 17 percent of the calls
moni tored by the study, the caller I s primary service request was for
some form of information, often concerning laws, police policins, or
parti cular cases. Another 4 percent of calls for service involved
situations where callers wanted to give the operator information to
pass on to other police offices or personnel, including tips, requests
to cancel service, and complaints.
52
More Detailed Picture of De.and Patterns
A more detailed description of citizen demands for police service
can be presented if we look at problem subcategories within the 10
general categories; Table 4-2 preseuts this distribution, created by
pes researchers. Readers are encouraged to study this table for it
provides a comprehensive picture of the citizen demands received by
the Fort Worth Police Department. The diversity portrayed in the
table is similar to that received by other American police agencies.
The first general category, serious problems. with persons,
represents about 6 percent of monitored calls for service. This
percentage may seem low, given the widespread perception that the
principal role of police is to handle serious crimes. The most
frequent problem,S within this category are fights (39 perceu.t of the
category), assaults (26 percent), and robberies (16 percent). Less
serious problems with persons include a variety of problems, some of
which are noncrim:inal in nature, including drunk and disorderly
persons (13 percent), obscene activity (11 percent), family trouble (8
percent), keeping the peace (5 percent), and juvenile problems (5
percent) . Although some of these problems may later escalate into
crimes, at their initial report, many of them are social problems or
disagreements that police are called upon to mediate.
About 10 percent of all citizen demands concerned serious
problems with property, including "thefts, burglary, break-ins,
shoplifting, and arson. Thefts and burglaries were the most
frequently reported problems of this type, each representing about one
fourth of the calls in the category. Less serious problems with
property were reported more often than serious ones ~nd involved

53
Table 4-2
Distribution of Monitored Calls for Service by Detailed Problem Categories
(N = 5,092)
Percent of Number of Problem Category: All Calls Calls
Serious Problems with Persons (5.8%) (295)
Fight 2.2 114 Simple Assault 1.5 77 Robbery 0.9 47 Aggravated Assault 0.5 24 Child Abuse 0.3 14 Sexual Attack-Rape 0.1 7 Suicide-Attempted Suicide 0.1 6 Kidnapping 0.1 6
Less Serious Problems with Persons (14.2) (721)
Drunk/Disorderly 1.9 97 Obscene Activity 1.6 82 Family Trouble 1.2 59 Argument 1.1 55 Keeping the Peace 0.7 38 Juvenile Problem 0.7 37 Subject of Police Concern 0.7 34 HarasBIllent 3.1 159 Neighbor Trouble 0.4 21 Gambling, Prostitution 0.2 8 Vagrancy 0.1 4 Other 2.5 127
Serious Problems with Property (9.4) (477)
Theft 2.5 126 Burglary 2.3 118 Break-In 2.0 104 Motor Vehicle Theft 1.4 72 Shoplifting 0.7 34 Purse Snatched 0.4 20 Arson 0.1 3
Percent of Calls in Category
(100.0%)
38.6 26.1 15.9 8.1 4.7 2.4 2.0 2.0
(100.0)
13.5 11.4
8.2 7.6 5.3 5.1 4.7
22.1 2.9 1.1
.6 17 .6
(100.0)
26.4 24.7 21.8 15.1
7.1 4.2
.6

54
Table 4-2 (Continued)
Percent of Problem Category: All Calls
Less Serious Problems with Property (16.5)
Attempted Break-In 7.1 Vandalism 2.8 Attempted Theft 2.5 Missing/Lost Property 1.2 Refuse to Pay 0.9 Trespassing 0.8 Dangerous Property/
Substance 0.1 Other 1.1
General Assistance (5.3)
Missing Person 1.4 Animal Problem 0.7 Request Surveillance 0.7 Request Transport 0 .• 6 Request Assistance 0.5 Man Down 0.4 Other 1.0
Emergency Assistance (2.6)
Traffic Accident with Injury 1.2
Medical Assistance 0.8 Mental Disorder 0.3 Fire 0.1 Other 0.2
Suspicious Person or Property (7.9)
Suspicious Person 3.7 Suspicious Property
Condition 1.9 Suspected Violator 0.8 Prowler 0.8 Gunshot 0.8
Number of Calls
(838)
362 142 128
61 44 40
7 54
(272)
71 36 34 30 25 23 53
(133)
62 41 13
5 12
(404)
188
95 41 40 40
Percent of Calls in Category
(l00.0)
43.2 16.9 15.3
7.3 5.3 4.8
.8 6.4
(l00.0)
26.1 13.2 12.5 11.0
9.2 8.5
19.5
(100.0)
46 .6 30.8
9.8 3.8 9.0
(100.0)
46.5
23.5 10.1
9.9 9.9
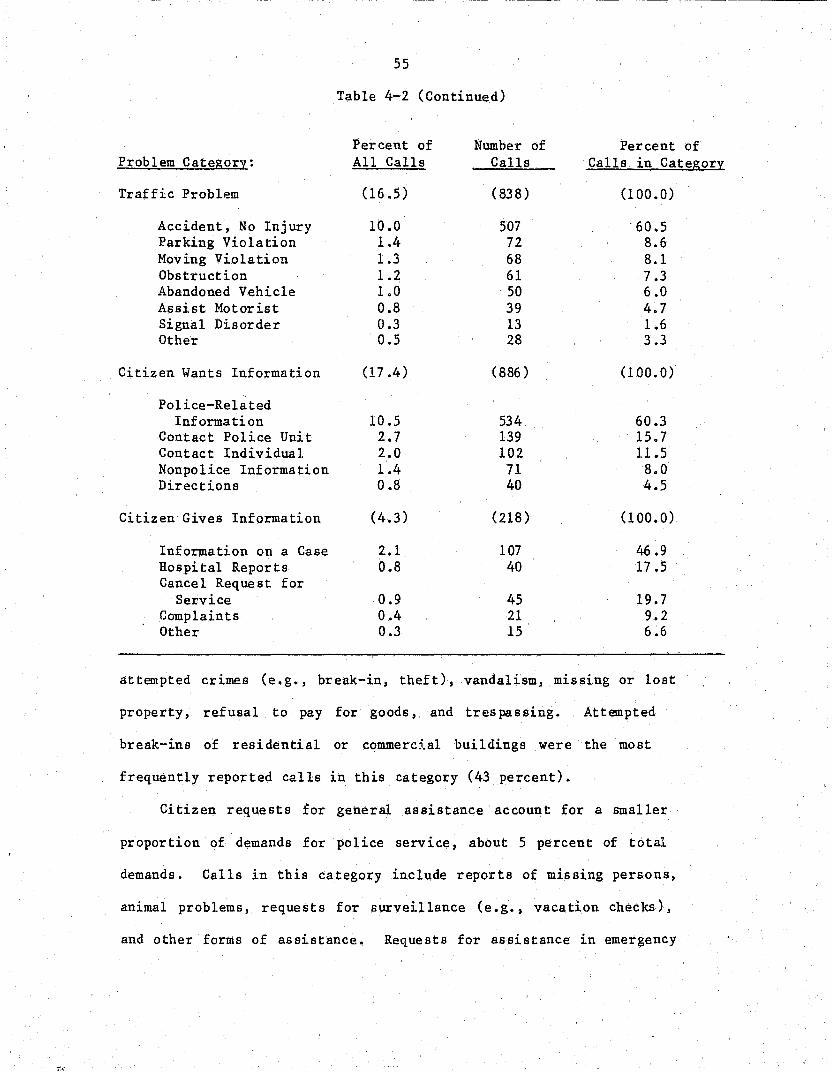
Problem Category:
Traffic Problem
Accident, No Injury Parking Violation Moving Violation Obstruction Abandoned Vehicle Assist Motorist Signal Disorder Other
Citizen Wants Information
Police-Related Information
Contact Police Unit Contact Individual Nonpo1ice Information Directions
Citizen Gives Information
Information on a Case Hospital Reports Cancel Request for
Service Complaints Other
55
Table 4-2 (Continued)
Percent of Number of All Calls Calls
(16.5 ) (838)
10.0 507 1.4 72 1.3 68 1.2 61 1.0 50 0.8 39 0.3 13 0.5 28
(17.4) (886 )
10.5 534 2.7 139 2.0 102 1.4 71 0.8 40
(4.3 ) (218)
2.1 107 0.8 40
0.9 45 0.4 21 0.3 15
Percent of Calls in Category
(100.0)
60.5 8.6 8.1 7.3 6.0 4.7 1.6 3.3
(l00.0)
60.3 15.7 11.5 8.0 4.5
(100.0)
46 .9 17.5
19.7 9.2 6.6
attempted crimes (e.g., break-in, theft), vandalism, missing or lost
property, refusal to pay for goods, and trespassing. Attempted
break-ins of residential or commercial buildings were the most
frequently reported calls in this category (43 percent).
Citizen requests for general assistance account for a smaller
proportion of demands for police service, about 5 percent of total
demands. Calls in this category include reports of missing persons,
animal problems, requests for surveillance (e.g., vacation checks),
and other forms of assistance. Requests for assistance in emergency

56
situations include traffic accidents with injuries, medical
assistance, and fires.
Of the monitored calls reporting suspicious circumstances, about
half involved suspicious persons whom callers perceived represented a
danger to themselves, others, or property. Other calls in this
category concerned reports of suspicious property conditions (e.g., a
door or window is unexpectedly open), persons suspected of being
wanted by the police, prowlers, and gunshots.
Traffic problems represent a substantial set of demands received
by the FWPD. The most frequent problems in this category were reports
of traffic accidents involving only property damage (61 percent of
category); police are expected to investigate these and reestablish
traffic flow where it has been interrupted. Other service requests
related to traffic were parking violations (9 percent), moving
violations (8 percent), road obstructions (7 percent), abandoned
vehicles (6 percent), requests to assist motorists (5 percent), and
reports of signal disorders (2 percent).
The last two general problem categories in Table 4-2 list service
demands related to information. Some were made by persons requesting
• information while others came from individuals wanting to give some
type of information to the police. Of the calls involving requests
for information, about 60 percent were made by persons wanting police
related information on such matters as the status of persons taken
into police custody, parking regulations, and police policies and
procedures. Other information calls concerned requests to speak to or
be connected with specific individuals or offices, for general
information (e.g. J what time is the parade today), and for street
directions.

---~ ----~----~-
57
The last general problem category concerns calls where
individuals want to provide the police with some sort of information.
In about half of these calls, citizens wanted to provide additional
information about a case previously reported to police. For example,
callers might report more information on stolen property or that a
missing child has returned home. Other cases involved citizens
requesting that a previous service request be cancelled (20 percent of
category), hospitals reporting crime-related injuries (18 percent),
and individuals relaying complaints or other information to the
police.
Requests for Specific Police Service
When contacting the police, callers most often report a problem
or crime situation to the call taker. They mayor may not request
that specific police actions be taken in response; often they expect
the operator to decide what actions police should take. In addition
to noting the general problem or crime reported by callers, PCS coders
aLso listed information on any specific actions that callers requested
regarding police response. The frequency distribution of these
specific service requests are listed in Table 4-3. In 23 percent of
the calls monitored by the pes, the individuals contacting the police
not only reported a problem situation, but also asked that some
specific action be taken by police.

58
Table 4-3
Frequency of Specific Service Requests Made to the FWPD
(N = 1,164)
Type of Specific Service Request:
Send the "Police" or "Patrol Unit II Send "Someone" Send Other Police Unit Send Ambulance Speak to "Police," Police Unit, Named
Number of Calls
705 191
4 40
Individual 10 Report be Taken on Scene 18 Report be Taken on Phone 17 Investigate an Incident 10 Remove a Person from the Scene 24 Arrest a Person 21 Warn or Question a Person 12 Cancel Service Request/Pass on Message 15 Request that Police Hurry to Scene 19 Request How Long Until Police Arrive 8 Other Specific Request 68
Total 1,164
Percent of All Calls
13.8% 3.7 0.1 0.8
0.2 0.4 0.3 0.2 0.5 0.4 0.2 0.3 0.4 0.2 1.3
22.8%
Percent of Requests
60.6% 16.4
0.0 3.4
0.9 1.5 1.5 0.9 2.1 1.8 1.0 1.3 1.6 0.7 5.8
100.0%
By far the most frequent specific service requests made of the
police were to send "someone," "the police," or a "patrol unit." In
about 18 percent of monitored calls, those individuals contacting the
police reported some problem or crime, but also clearly asked that
police personnel be sent to the scene. Examination of these requests
for police presence in terms of general problem categories indicates
that callers making those requests were often reporting problems with
persons, problems with property, suspicious persons, and traffic
problems. Not only did callers ask that police be dispatched, but
they also on occasion asked that a specific police unit (e.g.,
detectives), ambulance, or other agency/company representative (e.g.,
tow truck) be sent to the problem scene. Not surprisingly, ambulances
were most often requested in cases involving emergency assistance.
59
In a few cases callers made other types of specific service
requests, a1 though none of these requests were very frequent. Some
callers asked that a report be taken eithe~ at the scene or over the
phone, while others asked for an investigation. A limited number of
callers requested police to take actions against specific persons,
including removing them from the scene, making an arrest, and
warning/questioning persons. Also, some callers asked police to hurry
to the scene or asked for an estimate of response time.
Thus, while some callers asked that police take specified actions
in response to their report of a problem or crime, they seldom asked
more than that police personnel be sent to the scene. This suggests
that the demands received by police are often more general than those
of other urban service agencies. A key task of police operators is
thus not only to ascertain the nature of the problem or crime involved
in the call, but also to determine the appropriate police response.
It seems likely that most callers requesting police action expect that
a unit will be sent to the scene, whether they specifically request
one or not. This assumption is undoubtedly bolstered by the fact that
the pol ice do answer most eligible requests with the dispatch of a
patrol unit (Cahn and Tien, 1981). If police agencies wish to develop
viable and less costly alternatives to unit dispatch, they are also
likely faced with the task of educating the public to the point where
expectations of receiving a car are no longer automatic. The data in
Table 4-3 suggest that at least in Fort Worth, individuals contacting
the police are not likely to request specific actions other than that
the police send someone to the problem location.
, I

60
Citizen Deaands for Police Service: The Perspective frOB Police Agency Records
Given this view of monitored calls for service, we now examine
citizen demands from the perspective of police agency records. Most
police agencies, including the Fort Worth Police Department, maintain
calls for service records for only those calls that operators decide
merit police dispatch. Calls that are referred to internal units or
other agencies, transferred internally, or disposed of by operators
are not included in these records. Therefore, requests for
information or other calls judged ineligible for police dispatch are
not entered in police records by call takers. Other calls excluded
from this analysis are those transferred to the department I s report
writing section, DECOR. These calls, comprising less than 8 percent
of all calls received, often involve reports of problems or crimes
that would have been dispatched had no alternative response existed.
Most of the calls judged appropriate for police action are dispatched,
although a limited set will be screened out by dispatchers as
inappropriate or because of subsequent calls asking that service
requests be cancelled.
As part of the Police Communications Study, copies of
computerized records of police calls for service were obtained for the
3-month period of field research, February through April 1981. During
this time, 46,662 calls were received by the department and recorded
in police records. These call records include all of the information
originally ente'ced into the CAD system by call takers, data added by
the dispatcher) and data automatically generated by the system itself.
As explained in the last chapter, one type of information entered by

61
call takers is a complaint or signal code that describes the nature of
the problem or crime being reported in the call. The FWPD uses a list
of approximately 60 signal codes to classify calls for service judged
appropriate for police response. This set of signal codes is listed
in Table 4~4. The signal codes obtained from police records provide a
description of the problem or crime involved in the service request.
Table 4-4
Signal Codes Used by the Fort Worth Police Department
1 Accident - m1Uor 2 Accident - major 3 Accident - hit & run 4 Assault 5 Assault - criminal rape 6 Abandonned bicycle 7 Burglar alarm - silent 8 Burglar alarm - at scene or
audible 9 Burglar in a building
10 Burglar investigation 11 Cutting 12 Deceased person 13 Demented person 14 Disturbance 15 Disturbance - domestic 16 Dog bite victim 17 Mad dog 18 Dog ordinance violation 19 Drunk 20 Drunk - down 21 Drunk - in a car 22 Drunk - driving (DWI) 23 Fight 24 Fight - gang 25 Fire call 26 Hospital call 27 Injured person 28 (Meet) ambulance 29 Meet complainant 30 Parked car or parking violation
31 Officer-initiated traffic stop
32 Person with a gun 33 Prisoner pick up 34 Prowler 35 Prowler in yard 36 Robbery 37 Shooting 38 Suspicious person 39 Suspicious person
in car 40 Theft investigation 41 Abandoned car 42 Abandoned property 45 Cancelled call 47 Escort 50 Information 51 Investigation 52 Loose stock (cattle) 53 Malicious mischief 54 Meet 55 Missing person 56 Open door 57 Open window 60 Stolen car 61 Others 63 Assist (back-up) 64 Serve subpoena 65 Vacation check 66 Business house check 67 Possible burglar in
building
62
Overview of Service Requests
The se t of 60 signal codes can be clustered into general problem
categories similar to those used to describe monitored calls for
service. The set of problem categories is somewhat different,
however, for two reasons. First, the two information categories used
in Table 4-1 to describe incoming calls are not appropriate in this
analysis of police records since these calls are not entered into the
CAD system (Le., they do not necessitate police dispatch). Second,
the set of signal codes used by the FWPD include some quite general
descriptions that cannot be easily included in one of the PCS general
problem categories. For example, signal code categories for "meet
complainant" and "investigation" are not specific enough for inclusion
in other general problem categories. Thus, in this analysis of police
records, information categories have been eliminated and a general
response category added.
The frequency distribution of police records of calls for service
is arrayed in Table 4-5 according to the revised general problem
categories. Further comparison of categories is provided by Figure
4-2. Problems with persons, both serious and less serious, together
account for about 23 percent of service requests included in police
records. Serious and less serious problems with property
represent about one fourth of service requests, both types being
reported about equally_ As with monitored calls, requests for general
and emergency assistance were less frequent than other types ,of
reque sts, with general assistance accounting for 6 percent and
emergency assistance for 3 percent. Six percent of the calls for
service judged eligible for police response concerned suspicious

63
persons or property conditions, while 15 percent involved sane form of
traffic problem.
Table 4-5
Distribution of Service Requests from Perspective of Police Records
(Based on Calls for Service Received by the FWPD During February-April 1981)
(N = 46,662)
Ntnnber of Problem Category: Reguests
L Serious Problems with Persons 1,870 2. Less Serious Problems with Persons 8,627 3. Serious Problems with Property 5,458 4. Less Serious Problems with Property 6,320 5. General Assistance 2,956 6. Emergency Assistance 1,199 7 • Suspicious Person or Property 2,970 8. Traffic Problems 6,791 9. General Req~st/Other 10,377
Total 46 ,662
Percent of Reguests
4.0% 18.5 11.7 13.5 6.3 2.6 6.4
14.6 22.2
100.0%
An interesting category in Table 4-5 is that which includes
general or unspecified service requests (category 9). Of all the
service requests included in police records, 22 percent were
classified with one of the gene.::al or nonspecific signal codes (i. e.,
coded as investigation, meet complainant, broadcast information,
"meet ," or others). These codes are used to classify service requests
that do not fit into any of the other signal codes. Most police
agencies use one or more of these nonspecific complaint codes in
processing calls for service. No matter how comprehensive the set of
complaint codes developed by police agencies, there are always some
demands that defy neat and easy classification. Unfortuna tely, for

64
Figure 4-2
Distribution of Service Requests from Police Records by General Problem CategorieR
22.2g"
General Request/ Other
18.5% Less Serious
Problems with Persons
11. 7% Serious Problems with Property
13,590
Less Serious Problems
with Property
14.6% Traffic Problems
6.3% General Assistance
6.4% Suspicious
Person/Property
2.690 Emergency Assistance _______ ...J
4.0% Serious Problems with Persons

65
the efficient processing of service requsts, human beings and their
problems are of practically infinite variety and complexity, factors
that often preclude easy categorization. These nonspecific categories
are often used to classify service requests that are vague or
unclearly articulated by individuals seeking services.
There is likely some tradeoff between the extensiveness of the
complaint codes used by police to categorize calls for service and the
ease and efficiency in which they can be used. The more comprehensive
the set of codes, the more difficult it is to memorize and correctly
apply codes as rapidly as required in high demand situations. Yet the
shorter the set, the more difficult to apply codes that concisely
describe service requests. The categorization of calls can have
important consequences, given the fact that subsequent actions taken
by dispatchers and responding officers are heavily influenced by
complaint code descriptions. What most police agencies have sought ~s
a set of codes that balances the efficiency and clear description
dimensions. The fact that American police agencies use so many coding
systems, varying significantly in extensi venes s, suggests that an
ideal set of codes has yet to be developed.
Detailed View of Service Requests
A more detailed picture of calls for serv~ce entered into police
records is provided in Table 4-6, which lists subcategories of the
nine general problem categories included in Table 4-5. Some calls
identif ied by infrequently occurring signal codes are clustered
together to simplify the table. The most frequent serious problems
with persons received by FWPD and which activated police response
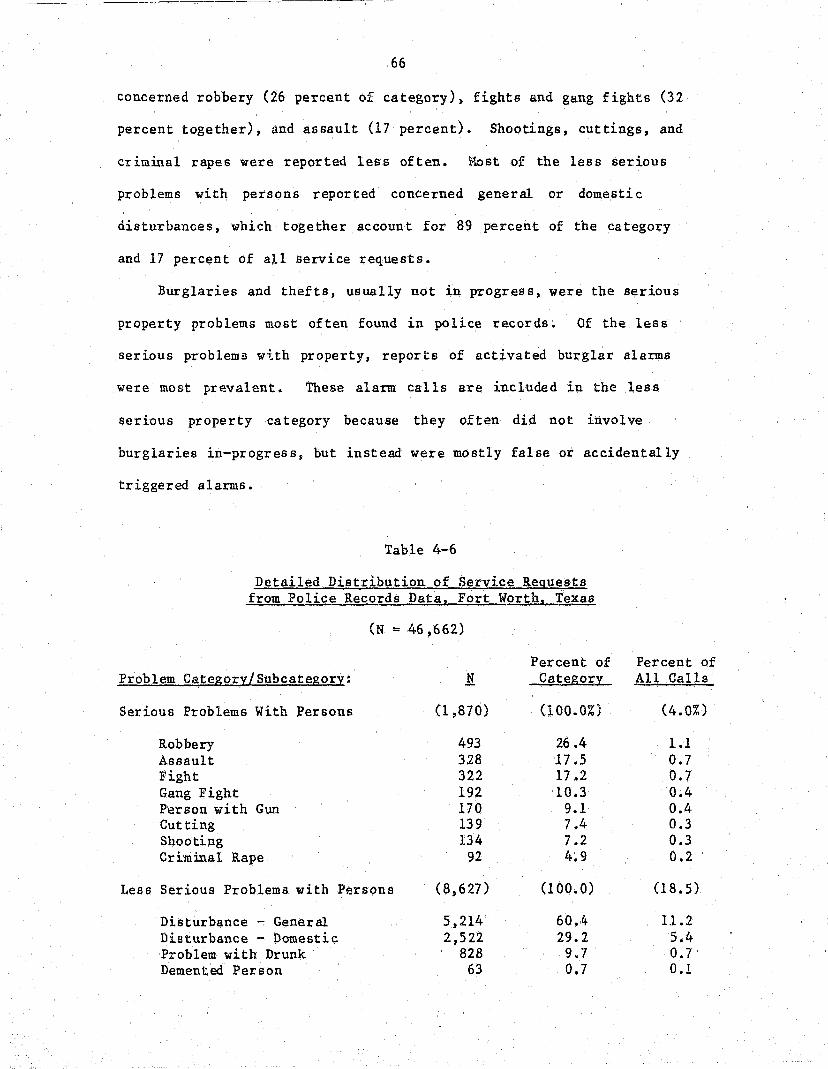
66
concerned robbery (26 percent of category), fights and gang fights (32
percent together), and assault (17 percent). Shootings, cuttings, and
criminal rapes were reported less often. i>lost of the less serious
problems with persons reported concerned general or domesti c
disturbances, which together account for 89 percent of the category
and 17 percent of all service requests.
Burglaries and thefts, usually not in progress, were the serious
property problems most often found in police records. Of the less
serious problems wi.th property, reports of activated burglar alarms
were most prevalent. These alarm calls are included in the less
serious property category because they often did not involve
burglaries in-progress, but instead were mostly false or accidentally
triggered alarms.
Table 4-6
Detailed Distribution of Service Requests from Police Records Data. Fort Worth. Texa!
(N = 46,662)
Percent of Problem Category/Subcategory: !! Category'
Serious Problems With Persons (1,870) (100.0%;
Robbery 493 26.4 Assault 328 17 .5 Fight 322 17.2 Gang Fight 192 10.3 Person with Gun 170 9.1 Cutting 139 7.4 Shooting 134 7.2 Criminal Rape 92 4.9
Less Serious Problema with Persons (8,627) (l00.0)
Disturbance - General 5,214 60.,4 Disturbance - Domestic 2,522 29.2 Problem with Drunk 828 9.7 Demented Person 63 0.7
Percent of .All Calls
(4.0%)
1.1 0.7 0.7 0.4 0.4 0.3 0.3 0.2
(18.5)
ll.2 5 .l~ 0.7 O.!

67
Table 4-6 (Continued)
Percent of Percent of Problem Category/Subcategory: N Category All Calls
Serious Problems with Property (5,458) (100.0) (11.7)
Burglary Investigation 3,673 67.3 7.9 Theft Investigation 916 16.8 2.0 Stolen Car 605 11.1 1.3 Burglar in Building 264 4.8 0.6
Less Serious Problems with Property (6,320) (100.0) (13.5)
Burglar Alarm . 5,141 81.3 11.0 Abandoned/Lost Property 633 9.9 1.4 Malicious Mischief 546 8.6 1.2
General Assistance (3,050) (l00.0) (6.5)
Prisoner Pick-Up 1,387 45.5 3.0 Hospital Report 1,152 37.8 2.5 Missing Person 358 11.7 0.8 Deceased Person 94 3.1 0.2 Animal Problem 41 1.6 0.1 Other 8 0.2 0.0
Emergency Assistance (1,199) (100.0) (2.6)
Traffic Accident with Injuries 865 62.1 1.8 Meet Ambulance 262 21.9 0.6 Fire Call 59 4.9 0.1 Injured Person 13 1.1 0.0
Suspicious Person or Property (2,970) (100.0) (6.4)
Suspicious Person 1,746 58.8 3.7 Prowler 1,113 37.5 2.4 Open Door or Window III 3.7 0.2
Traffic Problems (6,791) (100.0) (14.5)
Traffic Accident -Property Damage 5,020 73.9 10.8
Traffic Accident - Hit and Run 1,245 18.3 2.7 Parking Problem Violation 526 7.7 1.1
General Request/Other 00,377) (100.0) (22.2)
Investiga tion 4,997 48.2 10.7 Others 2,924 28.2 6.3 .. Meet Complainant 1,609 15.5 3.4 Broadcast Information 586 5.5 1.3 Meet 261 2.5 0.6

68
Of the general assistance calls, about half concerned requests
for prisoner pick-up and transport; often these requests originated
from other law enforcement agencies in the Dallas-Fort Worth area.
Reports from hospitals of inflicted injuries requiring police
investigation and missing persons were also called in to the FWPD. Of
all the general categories, calls involving emergency assistance were
least frequent, accounting for only 2 percent of calls in police
records. Most of these concerned reports of traf fic accidents
involving personal injuries.
Traffic problems represent 14 percent of all calls. Most of the
requests in this category concarned property-damage traffic accidents,
while a few involved parking violations or complaints. Suspicious
persons and/or property conditions also activated police response. Of
these, most involved reports of suspicious persons or prowlers. As
noted above, 22 percent of service requests included in police records
were classified a.s general or nonspecific problems.
Coaparison of Perspectives
The views of citizen demands for police service from monitored
calls and from agency records together provide interesting
perspectives. The data gathered through monitoring incoming calls for
service testify to the diversi'c.y of problems and crimes reported to
the police on a daily basis. These data also document the extent of
calls that police receive that are not dispatched, and as such, have
often been ignored in studies of citizen demand. Almost one fourth of
all monitored calls were requests for information or requests that
69
information be forwarded internally. Practically none of these calls
results in the dispatch of a police unit. The data from monitored
calls for service regarding specific service requests indicate that
callers often do not request police to take any specific actions, and
when they do, they generally only ask that the police send someone.
The data obtained through police records of calls origina11y
judged by call takers as appropriate for police dispatch provide a
somewhat different perspective of citizen demand. Here we see no
indication of information calls, which means that the FWPD, like most
other police agencies, has no record of those incoming calls for
service that are handled without dispatch of a police unit. These
data provide a picture of the problems snd crimes that activated
police dispatch; most frequent among these were general/unspecified
problems, problems with property and persons, and traffic.
We can compare these perspectives by examining the proportionate
frequency of general problem categories in the two data sets; this is
done in Table 4-7. In many ways the two data sets are similar, except
that the data from monitored calls include service requests about
information that the police record data exclude. The latter include a
general/unspecified categol'y, however. The rank order for the first
eight problem categories is similar when the information and
general/unspecified categories are ignored. Of course, there is no
easy way to determine whether any of the ca11s that received an
unspecified complaint code could have been included in one of the
other eight general categories. One could conceivably examine officer
case reports, but these indicate the nature of the problem as
determined by the officer at the conclusion of the encounter, not its
ns ture as reported by callers;.
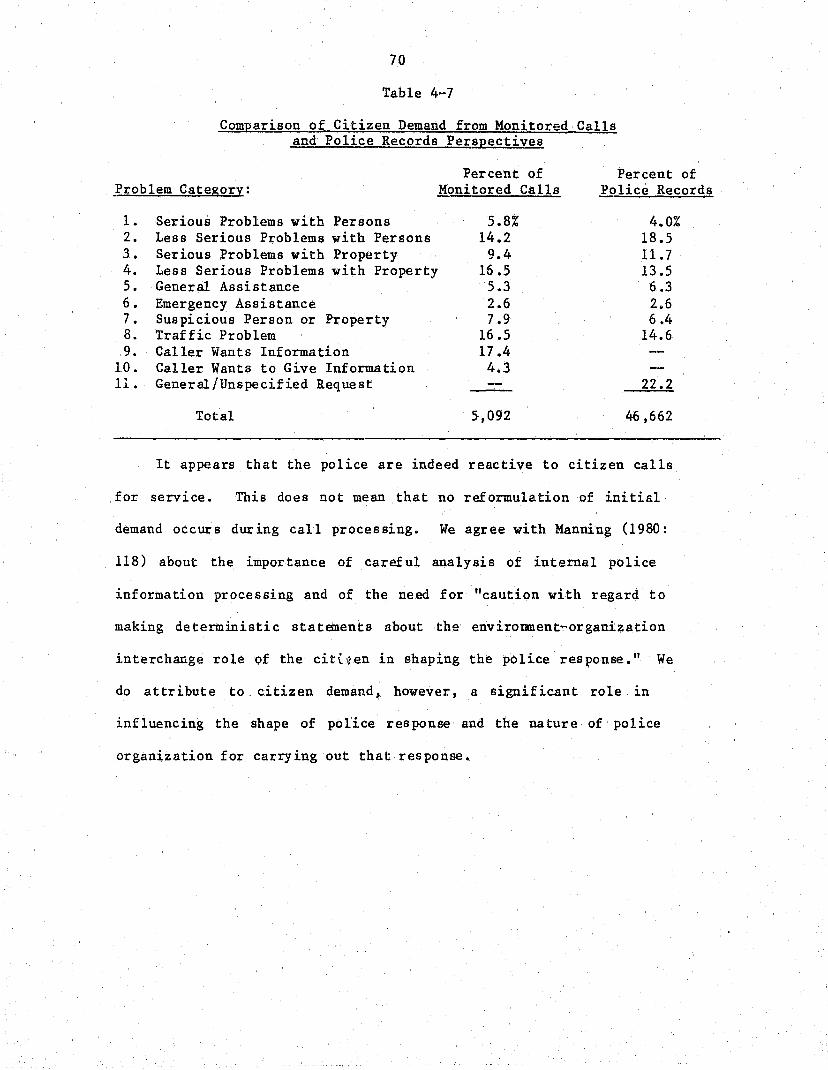
70
Table 4-7
Comparison of Citizen Demand from Monitored Calls and Police Records Perspectives
Problem Category:
1. Serious Problems with Persons 2. Less Serious Problems with Persons 3. Serious Problems with Property 4. Less Serious Problems with Property 5. General Assistance 6. Emergency Assistance 7. Suspicious Person or Property 8. Traffic Problem 9. Caller Wants Information
10. Caller Wants to Give Information 11. General/Unspecified Request
Total
Percent of Monitored Calls
5.8% 14.2
9.4 16.5 5.3 2.6 7.9
16.5 17.4 4.3
5,092
Percent of Police Records
4.0% 18.5 11.7 13 .5 6.3 2.6 6.4
14.6
22.2
46 ,662
It appears that the police are indeed reactive to citizen calls
for service. This does not mean that no reformulation of initial
demand occurs during call processing. We agree with Manning 0980:
118) about the importance of careful analysis of internal police
information processing and of the need for "caution with regard to
making deterministic statements about the environnent-organization
interchange role of the cit{~en in shaping the police response." We
do attribute to citizen demand, however, a significant role in
influencing the shape of police response and the nature of police
organization for carrying out that response.

CHAPTER 5
VARIATION IN CITIZEN DEMANDS BY TIME PERIODS
Despite interest in patterns of citizen demand on the police,
only scant attention has been paid to variation in demands across
different time periods, including day of week, time of day, or month.
Certain "accepted truths" seem to have developed among police
officials and interested observers, however. Among them are that the
highest volume of demand on police occurs during weekends,
particularly on Friday and Saturday evenings; that daily volume is
highest between 6 pm and midnight; that more serious crimes are
reported during the evening than during the daytime; and that crime
patterns vary considerably by time of year (i.e., vandalism and
interpersonal disputes are usually higher during the summer months).
One source of these "truths" is undoubtedly analyses of crime incident
data such as that produced from the National Crime Survey (U.S.
Department of Justice, 1980). These data indicate that crimes such as
larceny, burglary, and motor vehicle theft peak during the summer and
reach their lowest levels during the winter. These assumptions remain
largely untested by empirical examination of call records, however,
perhaps because of the difficulty in obtaining sufficient demand data
to permit time comparisons. Data collected du.lC ing the Police
Communications Study are well-suited to analyzing demand by various
time dimensions.
Demand Patterns by. Day of Week
One of the first empirical analyses of citizen demand for police
service examined the distribution of demands across days of the week.

72
Cumming, Cumming, and Edell (1965: 278) found that call volume was
greater in the latter part of the week than in the early part. They
suggested that:
In general, the high rate of calls in the evening and on weekends suggests that problems arise when the social pulse is beating fast -- when people are coming and going, regrouping, and, of course, engaging in informal rather than formal activities.
Unfortunately, this analysis was based on limited observation and did
not include all days or time periods.
Table 5-1 shows the distribution of all calls. judged eligible for
dispatch by the Fort Worth Police Department during the 3 months of
PCS observation. Readers should keep in mind that these data are
taken from police records and reflect only calls selected by operators
as eligible for police dispatch. Excluded are calls for information,
referred or transferred calls, and all other calls handled without
unit dispatch. As explained in Chapter 4, most but not all calls
judged appropriate for dispatch are actually dispatched; some are
screened out of the queue by dispatchers, sometimes because subsequent
calls ask that the dispatch be cancelled. Table 5-1 indicates that
there is an increase in calls received during weekends, especially on
Saturday, the busiest day of the week. Call volume is relatively
steady from Monday through Thursday, but increases by as much as 3.5
percent on Saturday. Changes in call volume over the course of the
week can be easily cletermined by reviewing Figure 5-1.
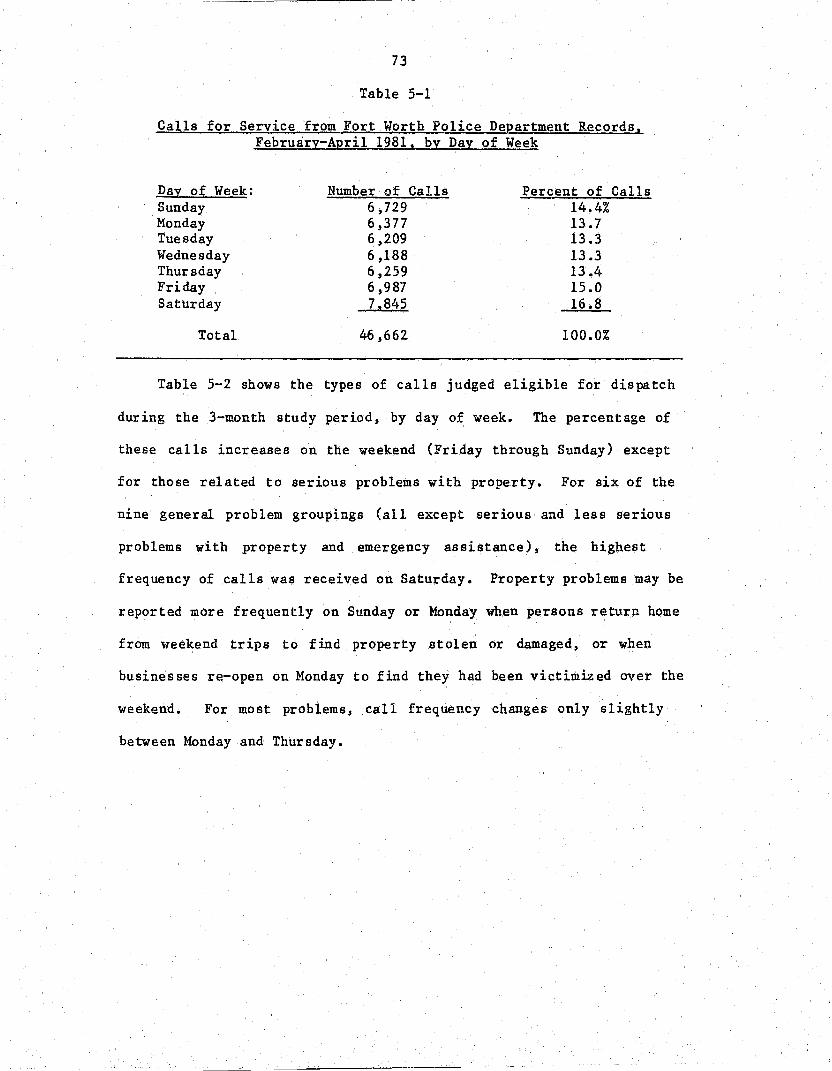
73
Table 5-1
Calls for Service from Fort Worth Police Department Records. February-April 1981, by Day of Week
Day of Week: Sunday Monday Tuesday Wednesday Thursday Friday Saturday
Total
Number of Calls 6,729 6,377 6,209 6,188 6,259 6,987 7,845
46,662
Percent of Calls 14.4% 13.7 13.3 13.3 13.4 15.0 16.8
100.0%
Table 5-2 shows the types of calls judged eligible for dispatch
during the 3-month study period, by day of week. The percentage of
these calls increases on the weekend (Friday through Sunday) except
for those related to serious problems with property. For six of the
nine general problem groupings {all except serious and less serious
problems with property and emergency assistance}, the highest
frequency of calls was received on Saturday. Property problems may be
reported more frequently on Sunday or Monday when persons return home
from weekend trips to find property stolen or damaged, or when
businesses re-open on Monday to find they had been victimized over the
weekend. For most problems, call frequency changes only slightly
between Monday and Thursday.

Vl ...... ...... ce
c...: 4-C
H <l)
.n ~ ;J 7-
74
Figure 5-1
Calls for Service from Fort Worth Police Department Records, February-April 1981, by Day of Week
8000
7800
7600
7400
7200
7000
6800
6600
6400
6200
GOOt) '----+---t-I-----il----t----t-I--t----t----Sun ~1on Tue Wed Thu Fri Sat
Day of Week

---------------------- ~----
75
Table 5-2
Calls for Service from Fort Worth Police Department Records. February-April 1981. by Day of Week aDd Type of Problem
Type of Problem: Sun Mon Tue Wed Thu Fri ~ Total
Serious Problems with Persons 16.7% 11.4% 9.7% 13.0% 12.0% 17.0% 20.0% 1,870
Less Serious Problems with Persons 15.3 12.4 12.4 11.9 13.1 15.5 19.2 8,627
Serious Problems with Property 13 .1 17.0 14.6 14.5 14.5 14.2 12.1 5,458
Less Serious Problems with Property 16.6 12.4 14.6 14.4 13.1 12.6 16.3 6,320
General Assistance 15.2 13.1 12.2 12.7 13.0 16.1 17.6 3,050 Emergency Assistance 13.7 12.8 12.1 11.5 13 .3 19.3 17.3 1,199 Suspicious Person
or Property 13 .5 14.2 14.1 13.2 14.8 13.4 16.3 2,970 Traffic Problems 11.0 13.7 1301 13.7 13.6 16.2 18.7 6,791 General Request/Other 15.0 14.2 13.6 13.2 13.2 14.9 15.6 10.,377
Total 46 ,662
Thus far, we have considered only data from police records of
calls deemed eligible for dispatch. Table 5-3 presents a breakdown of
types of calls received by FWPD, by day I as monitored by PCS
researchers. These data represent both dispatched and nondispatched
calls, unlike data from police records. The patterns displayed are
similar to those of Tables 5-1 and 5-2 in that for all but serious
property problems, more calls were received on Friday, Saturday, and
Sunday than on other days. Table 5-3 includes calls in which persons
request or offer information. These calls, too, generally increased
on the weekend. One reason for this increase may be that many
nonpolice information sources, including government offices, are
usually closed on weekends, leaving the police as the sole source of
information for many questions.1 This finding is similar to that of
Cumming, Cumming, and Edell (1965)~

76
Table 5-3
Calls for Service Received bI Fort Worth Police De2~~t~ent and Monitored by PCS. by Day of Week and Type of Problem
Type of Problem: Sun Mon Tue Wed Thu Fri Sat Total
Serious Problems with Persons J r __ • 7% 9.2% 12.S% 10.2% 11.2% 20.0% 17.3% 295
Less Serious Problems with Persons LS.8 9.7 11.S 11.4 10.7 20.1 20.8 721
Serious Problems with Property 13 .4 11.9 16.6 13 .2 14.7 13.8 16.4 477
Less Serious Problems with Property 17.9 9.1 12.6 11.8 12.5 16.0 20.0 838
General Assistance 22.1 10.7 lS.4 9.6 12.1 15.4 14.7 272 Emergency Assistance 13 .5 7.5 10.5 12.0 11.3 21.8 23.3 133 Suspicious Person
or Property 15.8 10.9 15.1 9.2 15.6 20.5 12.9 404 Traffic Problem 13 .6 10.1 14.2 13.5 10.3 18.5 19.8 838 Caller Wants
Information 17.3 10.8 10.6 13.9 16.6 16.4- 14.4 886 Caller Offers
Information 17.1 6.1 14.5 14.0 11.8 16.7 19.7 228
Total 831~ 508 668 621 656 8% 900 5,092 Percent by Day 16.4 10.0 13.1 12.2 12.9 17.6 17.9
Deaand Patterns by TiMe of Day
As with day of week, analysis of demand patterns by time of day
has been Bcant. Cumming, Cumming, and Edell (1965) found that nearly
half of the calls they observed occurred between 6 pm and midnight,
about 30 percent between noon and 6 pm, about 14 percent between
midnight and 5 BIn, and about 8 percent between 5 am and noon. Again,
their findings may reflect their methodology as much as any true
pattern. Meyer (1976) examined variation by patrol shifts in service
calls handled by one department for a month. His source was the daily
report log completed by a desk sergeant from a combination of calls
for service and officer activity reports. Meyer found that the
majority (79 percent) of service-related calls to the police were

77
generally handled by the 4 pm to midnight and 8 am to 4 pm shifts. He
suggested that his results simply reflected the pattern of everyday
life.
The Police Communications Study attempted a more systematic
analysis of demand patterns, by time of day, as reported in Table 5-4.
We considered a day as eight 3-hour periods. FWPD call records from
February through April 1981 indicate that the largest number of calls
were received between 9 pm and midnight, closely followed by the 6 pm
to 9 pm and 3 pm to 6 pm periods. The fewest calls were received
between 3 am and 6 am. Figure 5-2 clearly shows how the number of
calls generally increases from 6 am to midnight before falling off.
These data generally confirm widespread beliefs about demand patterns.
Table 5-4
Calls for Service from Fort Worth Police Department Records. February-April 1981. by Time of Day Call Received
Time of Day:
Midnight - 3 am 3 am - 6 am 6 am - 9 am 9 am - 12 noon 12 noon - 3 pm 3pm-6pm 6pm-9pm 9 pm - Midnight
Total
Number of
5,798 2~757 3,557 4,470 5,504 7,891 8,186 BJ499
46 ,662
Cal1s Percent of Calls
12.4% 5.9 7.6 9.6
11.8 16.9 17.5 18.2
100.0%
Table 5-5 shows the distribution of calls deemed eligible for
dispatch, by type, across the eight designated time periods. Two
thirds of all calls about problems with persons, both serious and less
serious, occur between 6 pm and 3 am. Calls about property problems
are received rather steadily from 6 am until midnight and even into

78
Figure 5-2
Calls for Service from Fort Worth Police Department Records. February-April 1981. by Time of Day
8500
8000
7500
7000
6500
Vl rl rl 6000 cO r....;
4-< 0
~ 5500
<L) \
.0 E ;:J
Z SOOO
4S00
4000
3500
3000
2500 I I I I I I I 12-3 3-6 6-9 9-12 12-3 3-6 6-9 9-12
am am am am pm pm pm pm
Time of Day

79
the early morning hours. Again, many calls about property problems
come from businesses that are open throughout the daytime hours.
Calls for both general and emergency assistance begin to increase
around noon, peaking between 6 pm and 9 pm and dropping off
considerably during the predawn hours. Calls about suspicious persons
are more common beginning during the early darkness hours, increasing
considerably toward midnight, then decreasing gradually toward dawn.
Calls in this category are usually about prowlers or suspicious
property conditions, such as open doors or windows. Traffic problem
calls begin to increase from noon on, peaking during the evening rush
hours (3 pm to 6 pm), then dropping off to a very low volume during
the early morning hours. Even general or unspecified requests follow
the pattern of increasing from noon through about midnight, then
decreasing toward dawn before picking up slightly during the morning
business hours. Table 5-5 provides few surprising findings, but
confirms general beliefs and common sense notions of patterns of
citizen demand and police response.
In looking at the data on calls monitored by PCS researchers
(table not shown), patterns similar to those in Table 5-5 emerge.
Isolating information calls, that are not included in FWPD records, we
find that calls requesting both police and nonpolice-related
information are heavy from about 9 am to 9 pm, when they drop off
considerably. Calls from citizens volunteering information begin to
increase even earlier, about 6 am, and continue quite steadily until
aroun.d midnight, when they decrease. Information calls tend to follow
the normal pattern of everyday living, beginning when people arise in
the morning and ending when they retire at night.
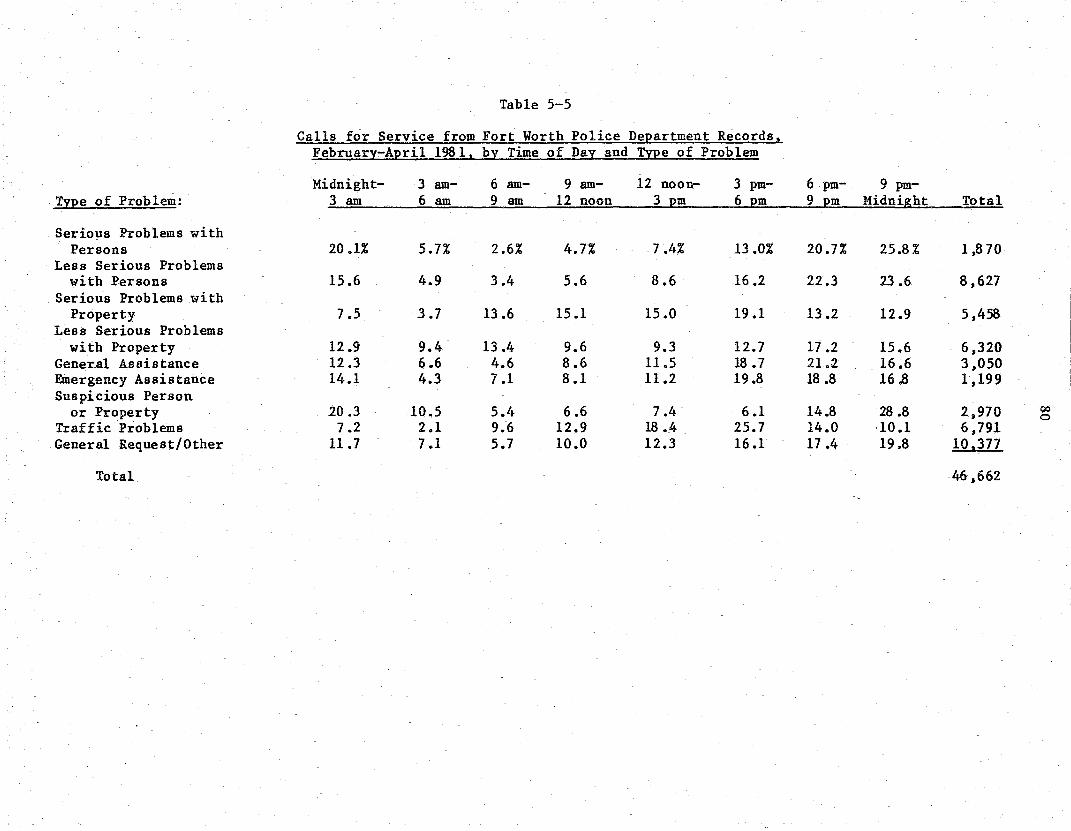
Table 5-5
Calls for Service from Fort Worth Police De~artment Records a February-A~ril 1981. by Time of Day and Type of Problem
Midnight- 3 am- 6 am- 9 am- 12 noon- 3 pm- 6 pm- 9 pm-Ty~e of Problem: 3am 6am 9am 12 noon _ :i pm_ 6_pm_ .. 9. pm _ Midnight Total
Serious Problems with Persons 20.1% 5.7% 2.6% 4.7% 7.4% 13 .0% 20.7% 25.8% 1,870
Less Serious Problems with Persons 15.6 4.9 3.4 5.6 8.6 16.2 22.3 23.6 8,627
Serious Problems with Property 7.5 3.7 13 .6 15.1 15.0 19.1 13 .2 12.9 5,458
Less Serious Problems with Property 12.9 9.4 13 .4 9.6 9.3 12.7 17 .2 15.6 6,320
General Assistance 12.3 6.6 4.6 8.6 1L5 18.7 2L2 16.6 3,050 Emergency Assistance 14.1 4.3 7.1 S.l 1L2 19.5 IS .S 16.8 1,199 Suspicious Person
or Property 20.3 10.5 5.4 6.6 7.4 6.1 14.S 28 .8 2,970 00 0
Traffic Problems 7.2 2.1 9.6 12.9 18.4 25.7 14.0 10.1 6,791 General Request/Other 11.7 7.1 5.7 10.0 12.3 16.1 17 .4 19.5 10.377
Total 46 ,662
81
Deaand Patterns by Montq
Monthly demand patterns, when calculated, have normally been
prepared by police agencies with access to year-long data; we know of
no research study that has looked systanatically at monthly variation
in citizen demand patterns. Lilly (1978) did review changes in call
volume for a 4-month period in Newport (Kentucky), finding very little
variation (less than 7 percent from the busiest to the slowest month).
In addition, he found only minor changes from month to month in the
relative frequency of types of calls to which the police were asked to
respond.
In order to examine variation in monthly call volume, pes
researchers examined department computer-aided dispatch (CAD) records
for the entire year 1980, nearly 200,000 calls for service. We found
only minimal monthly variation (Table 5-6). January was the lowest
month in call volume, August the highest, but the variation was less
than 1.5 percent. Figure 5-3 charts the month-by-month volume of
calls judged eligible for dispatch by the FWPD in 1980.
Table 5-7 presents the variation in types of requests received by
month. The monthly variation within problem types is extremely small,
with no significant trends evident. General belief holds that during
the oppressive summer heat, interpersonal conflicts and violent crimes
against persons increase as tempers flare. This appears to hold true
in Fort Worth, as the percent of calls about problems with persons is
higher during the May-August period.

82
Table 5-6
Calls for Service from Fort Worth Police Department Records. 1980. by Month
Month: Number of Calls Percent of Calls
January 14,894 7.6% February 15,049 7.7 March 16,236 8.3 April 16,224 8.3 Hay 17 ,128 8.8 June 17,387 8.9 July 17 ,484 8.9 August 17,589 9.0 September 16,435 8.4 October 16,038 8.2 November 15,090 7.7 December 15.999 8.2
Total 195,553 100.0%
The 3.6 percent variation in serious problems with persons
between February and August is the largest single percentage
difference between any 2 months for any of the problem categories
examined. The small variation may be a function of Fort Worth's
relatively moderate climate throughout the year. It is subject to
fewer temmperature or weather extremes than many northern cities
where, for example, a crime such as malicious mischief may increase
during warm weather, then drop dramatically as vandals avoid the cold
by staying inside. In fact, in Fort Worth calls related to malicious
mischief are higb in January, then gradually decrease throughout the
year. Reports of criminal assaults, on the other hand, gradually
increase between January and August, then decrease slightly for the
remainder of the year. Disturbances, however, are reported more
frequently between May and August than at any other time of the year.
Figure 5-4 charts the monthly variation in selected calls for 1980.

83
Figure 5-3
Calls for Service from Fort Worth Police Department Records, 1980. by Month
18,noo
17,500
17,000
16,500
16,000
15,500
15,000
14,500
14,000 I I -+---~I----+---~Ir---~I----rl--~I---.Jan Feb ~Iar Apr ~fay .Tun .Tul Aug Sep Oct Nov Dec
Month

Table 5-7
Calls for Service from Fort Worth Police DeEartment Records! 1980. by Month and TyPe of Problem
TyPJ~~()f Pr~blem: Jan Feb Mar AEr May Jun Jul Aug Sep Oct Nov Dec Total
Serious Problems with Persons 1.6% 6.1% 1.4% 7.3% 8.3% 8.9% 9.2% 10.3% 8.9% 8.5% 8.6% 8.5% 1,105
Less Serious Problems with Persons 1.5 1.0 8.1 8.6 9.8 9.4 9.1 9.9 8.6 7.5 7.1 7.4 36,801
Serious Problems with Property 8.8 9.2 9.4 8.2 7.7 8.3 B.9 8.6 8.0 7.6 7.2 8.2 26,414
Less Serious Problems with Property 7.8 7.2 8.2 7.9 8.2 8.9 8.5 8.6 8.7 9.0 8.5 9.2 25,259
General Assistance 7.0 7.8 8.7 8.3 8.7 8.7 8.5 8.3 8.2 8.4 8.7 8.6 11 ,889 Emergency Assistance 7.2 6.9 6.6 8.6 9.0 9.3 8.7 8.6 9.1 8.3 8.4 9.4 4,942 Suspicious Person
or Property 8.2 8.1 8.5 8.2 8.3 8.5 8.1 8.7 8.7 8.8 7.8 8.1 11 ,709 Traffic Problems 8.6 8.2 8.0 8.7 9.0 8.4 7.7 8.3 8.9 8.1 7.9 8.1 27 ,870 00
General Request/Other 6.9 7.5 8.2 8.2 8.8 9.3 10.2 9.2 1.9 8.4 7.5 7.9 42~964 ~
Total 195,553
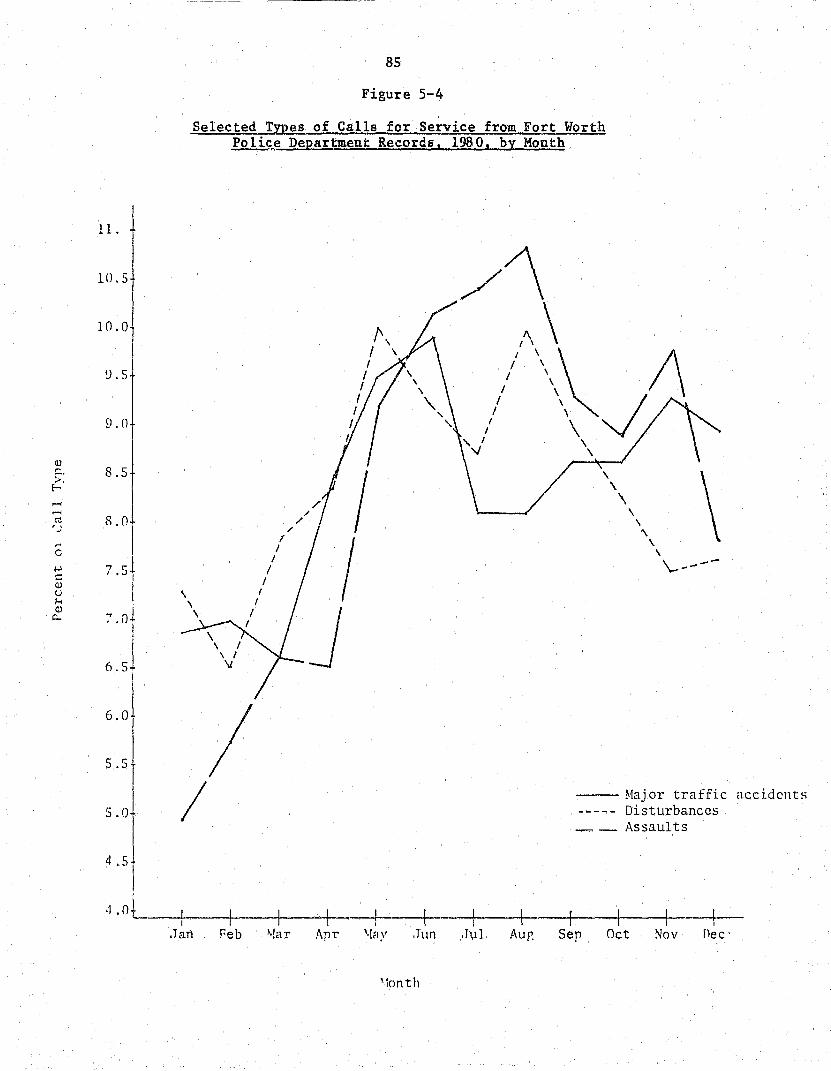
11.
10.5
10.0
D.S
9.0
<l.l c. S.S >. E-
~
~
ro R.O , , ~
-c ~ "7 sl s::
f. I <l.l U H <l.l
7.0+ c... I
6.51 I
6.0\
5.5
5.0
4.5
.:1 .0
85
Figure 5-4
Selected TYQes of Calls for Service from Fort Worth PoliS~ Department Records. 1980. by Month
I /
I
/
/ I
I
I
f I
,/ ;'
!\ I I
I I I
I I
/ ;' I I
J
I , I
" I
/ I
/
I
I /
\ \ \
\ \
\ \
\ \ -\.---
/ --- Maj or traffic ace idcnts Disturbances
__ Assaults
I I
.Jan Feb ""ar Apr \Iay ,Tun .luI Au? Sep Oct Nov nee'
\lonth

86
Conclusion
Analysis of citizen demand patterns by various time periods shows
no surprising results. Call volume, measured by both FWPD records and
PCS call monitoring, increased during the weekend for most types of
calls; serious problems with property were the exception, largely
because of the delay in reporting these types of crimes. Call volume
generally began to increase around 6 am, and continued to increase for
most types of calls until around midnight, then dropped off during the
early morning hours. Monthly call variation was very small,
regardless of call type. Whether these patterns represent general
trends nationwide or are symptomatic of Fort Worth is uncertain. It
seems likely that observed patterns by day of week and time of day are
universal, while monthly variation may be subject to climate
conditions and other factors. The dearth of reported research in this
area may indicate the lack of significant findings as much as any
oversight on the part of observers.

87
Footnotes
lAnother reason that call volume increases on the weekend is the sampling design of the Police Communications Study. To reduce staff time spent monitoring "dead air" on the police tapes, weekend shifts were oversampled in comparison to weekday shifts. Of the 125 shifts monitored, 40 (32 percent) were from 11 pm Friday through 11 pm Sunday.

CHAPTER 6
VARIATION IN CITIZEN DEMANDS BY CALLER CHARACTERISTICS
Another way of analyzing patterns of citizen demands for police
service is to consider the characteristics of those individuals who
call the pol ice. In this chapter monitored calls for service are
examined in terms of the following caller characteristics: position
as private citizen or business representative, role in the incident as
parti cipant or third party, race, sex, and emotional state. Pes
observers recorded perceived caller attributes in combination with
information either volunteered by the caller or elicited by the
operator. Coding of race and emotional state was conservative in
order to minimize errors in perception. Aside from a study by Antunes
and Scott (1981), this is one of the first attenpts at assessing
demand patterns in terms of caller characteristics.
Caller Position and Role in the Incident
Based on the exchange between callers and police operators,
researchers determined and coded the position of the caller. That is,
they identified whether callers were contacting the police on their
own behalf or as representatives of a business or other agency. About
thr.ee fourths of moni tored callers contacted the police as private
citizens while the remainder called on the behalf of businesses or
other agencies. Table 6-1 shows the distribution of general problem
types by caller position.

89
Table 6-1
Variations in Demands by Caller Position
(N = 5,075)
Percent of Calls by Position:
Problem Type:
Serious Problems with Persons Less Serious Problems with Persons Serious Problems with Property Less Serious Problems with Property General Assistance Emergency Assistance Suspicious Person/Property Traffic Problems Caller Wants Information Caller Wants to Give Information
Total Number of Cases
Private Citizen
6.2% 15.0
9.4 12.1
5.1 2.8 8.4
17.9 19.8 3.5
100.0% (3,853 )
Business/Agency Representative
4.5% 11.6
9.4 30.1
5.6 2.2 6.7
12.1 10.1
7.5
100.0% (1,222)
The findings in Table 6-1 show that private citizens were more
likely (in percentage terms) to report problems with persons,
suspicious persons or property, and traffic problems. They were also
more likely to request information from the police. On the other
hand, business or agency representatives were more likely than private
citizens to report less serious problems with property and to provide
police with information. Business callers frequently reported that an
alarm had been triggered; many of these alarm calls were counted as
less serious problems with property since they often turned out to be
false alarms. This finding parallels that of Antunes and Scott
(1981), who determined that business callers were more than twice as
likely as private citizens to report nonviolent crimes that usually
involved property problems.

90
At the same time that coders noted position, they also determined
whether the caller's role in the reported incident was as an involved
party or a third party/witness. Callers were classified as involved
parties if they were crime victims or persons needing assistance or
information. Callers were categorized as third parties or witnesses
if they were aware of but not directly involved in the incident being
reported. Someone who saw a traffic accident take place but who was
not directly involved would be an example of a third party/witness.
Of all the persons who called the police and were monitored by the
study, 81 percent were involved parties, while 19 percent were third
parties or witnesses. Table 6-2 presents a breakdown of callers on
the basis of their role in the incident or problem being reported to
the police.
Table 6-2
Variations in Demands by Caller Role in Incident/Problem
(N = 5,075)
Problem Type:
Serious Problem with Persons Less Serious Problems with Persons Serious Problems with Property Less Serious Problems with Property General Aseistance Emergency Assistance Suspicious Person/Property Traffic Problems Caller Wants Information Caller Wants to Give Information
Total Number of Cases
Percent of Callers by Role:
Involved Party
4.2% 15.0 10.4 17.0
5.6 1.9 6.9
12.8 21.2 5.2
100.0% (4,135)
Third Party/ Witness
13.0% 10.5 4.9
13.7 3.6 6.0
12.8 33.0 1.2 1.4
100.0% (940)

....
91
The data reported in this table indicate that persons directly
involved in incidents called the police most often about less serious
problems with persons, problems with property (both serious and less
serious), general assistance, and requests for or provision of
information. Individuals who were third parties or witnes sea to
incidents most often reported dangerous or harmful situations, such as
serious problems with persons and emergency assistance, where those
directly involved may be unable to report the incident themselves
because of its seriousness. Third parties were also more likely than
those directly involved to report minor traffic accidents, which are
easily witnessed by passersby.
Caller Sex and Race
While listening to the taped calls for service, researchers noted
the sex and the race of the caller. This determination was based on
listening to callers' voices, speech patterns, and accents. It was
generally quite easy to determine caller sex on the basis of voices.
However, it was more difficult to assess caller race or ethnic
background. Researchers were instructed to code persons as ''white'' if
no identif iable accents or dialects were present in the caller's
speech. Where accents were identifiable, researchers were instructed
to code the caller as "black," "Mexican/Spanish" (Hispanic), or
·'other. "
About 78 percent of monitored callers were coded as white, 16
percent as black, and 6 percent as Hispanic. This compares with a
race distribution in the general population of 69 percent white, 23

92
percent black, and 13 percent Spanish-speaking residents. The
percentage distributions are roughly congruent when one considers that
the method of coding caller race in this study was fairly conservative
and likely undercounts minority callers. The distribution of caller
race by problem type is reported in Table 6-3.
Table 6-3
Variations in Demands by Caller Race
(N = 5,020)
Percent of Callers by Race:
Problem Type: White Black Hispanic
Serious Problems with Persons 4.2% 11.1% 11.9% Less Serious Problems with Persons 12.0 20.6 24.8 Serious Problems with Property 8.7 12.8 9.2 Less Serious Problems with Property 18.1 10.1 9.9 General Assistance 5.3 5.4 5.1 Emergency Assistance 2.7 2.3 2.4 Suspicious Person/Property 8.2 7.4 7.1 Traffic Problems 18.3 9.2 11.6 Citizen Wants Information 17.6 17.4 14.3 Citizen Wants to Give Information 4.8 3.7 3.7
Total 100.0% 100.0% 100.0% Nwnber of Cases (3,934) (792) (294)
The da ta dis played in Table 6-3 indica te tha t there is some
variation in the types of problems reported by whites, blacks, and
Hispanics. Blacks and Hispanics were more likely to report serious
and less serious problems with persons and serious problems with
property. This finding may reflect the higher crime neighborhoods in
which many blacks and Hispanics reside. It coincides with findings
reported by Antunes and Scott (1981). As we shall see in Chapter 7,
neighborhoods witb the highest proportion of nonwhite resident$
reported the highest level of serious person- and property-rE'lated

93
crimes to the Fort Worth police. White callers were more likely than
other citizens to report less serious problems with property (e.g.,
vandalism and attempted break-ins) and traffic problems. The other
problem categories show little variation by racial groups.
The breakdown of callers by sex demonstrates almost an even
split: 52 percent of callers were female and 48 pecent were male.
The distribution of problems reported to the police by caller sex is
reported in Table 6-4. There are few dramatic differences between
males and females in reporting problems to police. Females were
slightly more likely to report problems with persons and to request
general assistance. Males, on the other hand, more often reported
problems with property and traffic problems. Both males and females
were about equally likely to call the police to provide or request
information.
Table 6-4
Variations in Demands by Caller Sex
(N = 5,085)
Problem Type:
Serious Problems with Persons Less Serious Problems with Persons Serious Problems with Property Less Serious Problems with Property General Assistance Emergency Assistance Suspicious Person/Property Traffic Problems Citizen Wants Information Citizen Wants to Give Information
Total Ntmlber of Cases
Percent of Callers by Sex:
4.5% 12.1 11.1 17.3 4.7 2.3 7.3
18.5 17.9 4.2
100.0% (2,448)
Female
7.1% 16.0 7.8
15.5 6.0 2.9 8.6
14.6 16.9 4.7
100.0% (2,637)

94
Emotional State of the Caller
Still another way of studying variations in patterns of citizen
demands for police service is to consider the emotional state of those
who contac t the police. As with other caller characteristics,
determination of emotional state is sometimes difficult from listening
to calls for service. Researchers were required to classify each
caller according to one of the following emotional states: calm,
excited, frightened, angry, upset, or confused. Again, a conservative
coding plan was used. Callers were classified as "calm" unless their
voice and speech patterns indicated that they were excited, angry,
upset, frightened, or confused. Given the generally conservative
coding scheme, it is not stn."prising that 91 percent of monitored
callers were considered calm. Of the remaining 9 percent, 3 percent
were excited, 2 percent were upse t or angry, and 1 percent were
confused or frightened. Table 6-5 shows the distribution of problem
types by the designated emotional state of the caller.
The results in Table 6-5 suggest that emotional state reflects
the nature of the problem. Calm callers were proportionately more
likely to report less serious problems with property, traffic
problems, and requests for information. Compared to calm callers,
excited, frightened, and angry callers were far more likely to report
problems with persons. Confused persons were more likely to request
general assistance and frightened persons were more likely than other
callers to report suspicious persons or property conditions. As with
most of the variables considered in this chapter, there is little
significant variation in demand patterns by the caller's emotional
state.

---------------~---
95
Table 6-5
Variation in Citizen Demands by Caller Emotional State
(N = 5,075)
Percent of Callers by Emotional State:
Problem Type: Calm Excited Frightened Jmgry Upset Confused
Serious Problems with Persons 4.8% 15.6% 23 .0% 11.2% 22.6% 6.9%
Less Serious Problems with Persons 12.9 24.4 42.6 32.5 27.0 10.3
Serious Problems with Property 9.4 9.6 0.0 8.8 10.4 15.5
Less Serious Problems with Property 17.3 11.9 3.3 7.5 5.2 6.9
General Assistance 5.0 7.4 4.9 5.0 6.1 25.9 Emergency Assistance 2.5 7.4 3.3 1.2 0.9 1.7 Suspicious Person/Property 8.1 6.7 16.4 2.5 4.3 3.4 Traffic Problems 17.2 13.3 1.6 12.5 7.0 5.2 Caller Wants Information 18.2 3.0 4.9 7.5 12.2 19.0 Caller Gives Information 4.5 0.7 0.0 11.2 4.3 5.::!
Total 100.0% 100.0% 100.0% 100.0% 100.0% 100.0% Number of Cases (4,632) (135) (61) (80) (ll5) (58)

CHAPTER 7
VARIATIONS IN CITIZEN DEMAND BY NEIGHBORHOOD CONTEXT
Little prev~ous research on calls for service has examined
citizen demands in terms of the community areas from which they
originate. The area of origination can be considered a contextual
influence on both the volume and types of demands for police service.
Previous research on the distribution of crime, based primarily on
police crime report data, has shown that different community areas
generally experience different types and amounts of crime. Many
serious crimes such as assault, rape, and homicide occur more often in
inner-city neighborhoods while burglaries and vandalism are often
associated with more affluent residential areas.
The purpose of this chapter is to examine variations in calls for
service across areas in Fort Worth. We will determine whether factors
such as land area, population density, racial composition, and land
usage affect the types of service demands made upon the Fort Worth
Police Department. Information on neighborhood contextual influences
is important in that it might be used to inform the structuring of
police beats and the deployment of police personnel.
Selection of Neighborhood Areas
One ser.ious problem with undertaking a study of contextual
influences is designating community areas for study. A second and
related problem is acquiring demog~aphic and land use data for
selected study areas. Urban researchers have often used areas
designa ted by the U. S. Census Bureau for andy sis since popUlation and
----------------------~-------

97
other relevant data are available for these areas. When studying
police services, however, census areas such as tracts or blocks are
not easily employed. Departments generally develop their own
geographic designations for the purposes of patrol deployment and
planning, and these areas are rarely coterminous with census areas.
Most large departments divide their jurisdiction into a small number
of districts, then subdivide these into a larger number of beats.
Districts and beats are as signed numeric codes that are generally
included on calls for service records and crime reports. Although
researchers can determine the geographic location of calls and
incidents from these records, there is little demograhic or land use
data gathered for these police designated areas. The police
researcher, therefore, must either choose census areas and attempt to
match police records with them or use police records and estima te
demographic and land use data.
In order to study the distribution of calls for service acrOSS
the city of Fort Worth, the project selected police beat areas as the
geographic unit for analysis. The Fort Worth Police Department has
divided its jurisdiction into 8 districts (see Figure 3-1) and 90
police beats. The department has endeavored through previous
realignments to structure beats so as to roughly equalize the volume
of calls for service originating from each. This beat designation
strategy, used in many American police agencies, represents an effort
to match patrol resources with citizen demands. Throughout this
report, the terms "beat" and "neighborhood" will be used inter
changeably.

98
Once the decision was made to designate beat areas as the
primary unit of analysis, the next task was to gather population, land
ares, and land use data for beats. This proved to be very difficult
since beats are not used by other agencies for aggregating demographic
or land use data. The project gathered such information from mUltiple
sources and translated data from other aggregating units (e.g., census
blocks and tracts) to police beats. For this reason, much of the
neighborhood-level data on popUlation and land use are estimates
rather than precise measurements. The sources and estimation of the
neigborhood-level background data are described in Appendix 7-1 to
this chapter.
Demographic and Land Use Characteristics of Neighborhoods
There is substantial demographic and land use variation among
Fort Worth neighborhoods. Table 7-1 presents data on neighborhood
popUlation and size. Population varies from less than 100 residents
in two downtown area beats to over 13 ,000 persons in some densely
settled residential areas. Police beats in Fort Worth also vary in
racial and ethnic composition. The proportion of black residents
ranges from 1 to 99 percent and the proportion of Hispanic residents
from 1 to 88 percent.l Neighborhoods with heavy concentrations of
black and Hispanic residents tend to cluster together, as shown in
Figure 7-1. The neighborhoods that are composed primarily of blacks
cluster together in an area just south and east of the city center
known as Polytechnic. Most of the beats where' Spanish-speaking
residents predominate cluster in an area northwest of the central
downtown ares, near the city's historic stockyard area.

99
Table 7-1
Population, Income, and Land Area Data for Fort Worth Neighborhoods
Total Population
Percent Black
Percent Spanish-Speaking
Median Family Income
Land Area
Population Density
(N ,.. 90 Beats)
Range
32 - 13,452
1 - 99%
1 - 88%
$5,930 - $28,281
0.2 - 76 sq. mile
12 - 1,811/sq. mile
Median
3,813
7.9%
6.6%
$12,411
7.5 sq. mile
56 5i sq. mile
Median family income also manifests significant variation within
the community. The poorest neighborhoods had a median family income
of less than $6,000 while the most affluent ones had median incomes in
excess of $28,000. Figure 7-2 shQYS the distribution of median family
income across city neighborhoods. The figure depicts a pattern
roughly similar to many other American cities. The poorest areas are
those surrounding the central busines s district, the weal thiest
neighborhoods are situated at the city outskirts, and the middle-
income areas exist within the two extremes.
The land area of beats ranges widely from less than 1 square mile
to more than 50 square miles for sane outlying areas. The smallest
beats, by police design) are those in a district which covers the
downtown area. Al though there are few residents here, the beats are
small due to the heavy concentration of people who work and shop there
during the daytime hours. The largest beats are located at the cHy
outskirts. Population density in the neighborhoods ranges from 12 to

Racial/Ethnic and Family Income Composition of Fort Worth Neighborhoods
Figure 7-1
Race
o Predominantly l\11ite
II Mixed • Predominantly Black
o Predominantly Spanish
Figure 7-2
Median Family Income
~ Low (Less Than $10,000)
o Medium ($10,001 to $15,()
IIlligh (Greater Than $b,uuO)
I-' o o
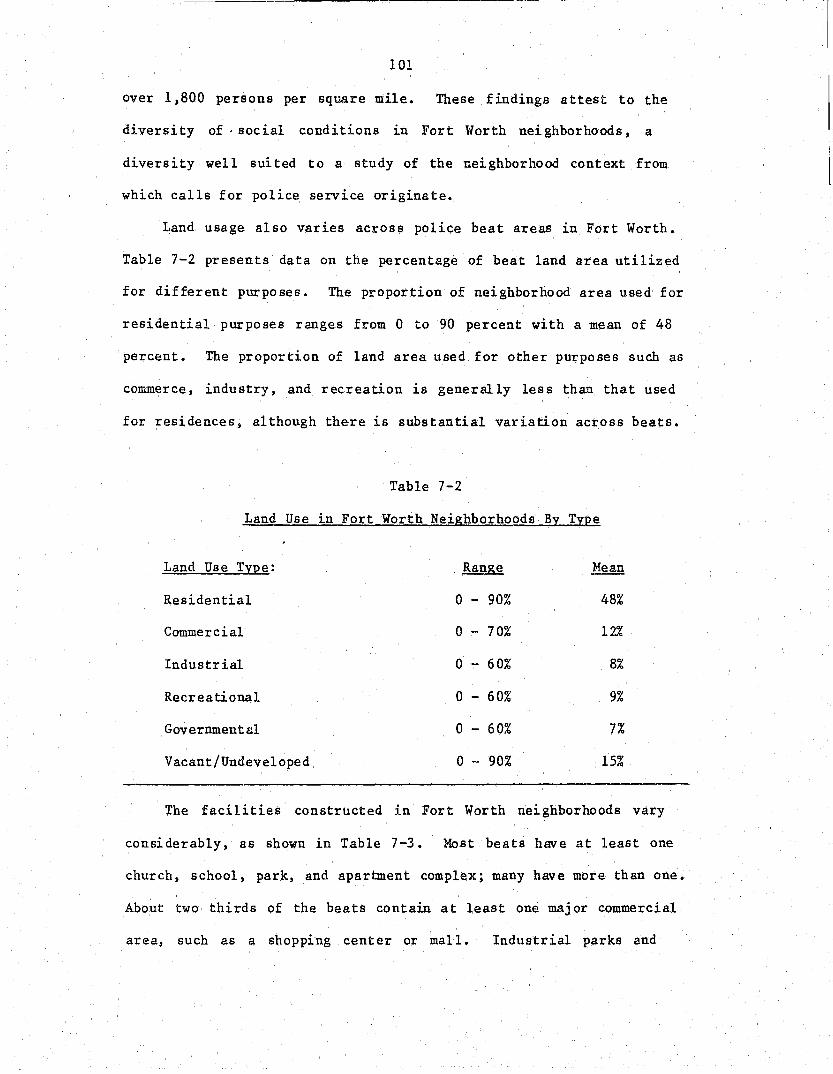
101
over 1,800 persons per square mile. These findings attest to the
diversity of· social conditions in Fort Worth neighborhoods, a
diversity well suited to a study of the neighborhood context from
which calls for police service originate.
Land usage also varies across police beat areas in Fort Worth.
Table 7-2 presents data on the percentage of beat land area utilized
for different purposes. The proportion of neighborhood area used for
residential purposes ranges from 0 to 90 percent with a mean of 48
percent. The proportion of land area used for other purposes such as
commerce, industry, and recreation is generally less than that used
for residences, although there is substantial variation across beats.
Table 7-2
Land Use in Fort Worth Neighborhoods By Type
Land Use Type: Ran.&e J1ean
Residential o - 90% 48%
Commercial o - 70% 12%
Industrial 0 - 60% 8%
Recreational 0 - 60% 9%
Governmental 0 - 60% 7%
Vacant/Undeveloped o - 90% 15%
The facilities constructed in Fort Worth neighborhoods vary
considerably, as shown in Table 7-3. Most beats have a.t least one
church, school, park, and apartment complex; many have more than one.
About two thirds of the beats contain at least one major commercial
area, such as a shopping center or mall. Industrial parks and

102
hospitals are fewer and are distributed across a smaller number of
beats. These factors, when related to demographic characteristics,
might be expected to influence the volume and types of demands
originating from different neighborhoods.
Table 7-3
Extent of Facilities by Type in Fort Worth Neighborhoods
Number of Beats with Facility Type: Range Mean One or More Facility
Private Apartment Complex o - 18 2.9 68
Church/Religious Facility 0 - 13 3.5 79
School 0 - 7 1.8 71
Park/Recreational Area 0 - 6 1.6 72
Hajor Thoroughfare o - 5 1.9 85
Major Commercial Area o - 4 1.1 59
Industrial Park o - 6 0.8 33
Hospital 0 - 4 0.2 11
Distribution of Problems Across Fort Worth Neighborhoods
Calls for service records of the Fort Worth Police Department
will be used to consider the distribution of service requests acrOss
neighborhoods. Although use of Police Communications Study data on
monitored calls would allow consideration of the full range of
problems reported to police, there is an insufficient number of calls
with specified beat location to permit this. Of the more than 5,600
calls moni tored by the project, about 67 percent had sufficient

103
location information to ascertain beat 10cation. 2 Distributing this
smaller set of calls with beat designation across 90 neighborhoods and
several problem categories results in an insufficient number of cases
for reliable analysis.
Calls for service included in police records, on the other hand,
provide an ample number of calls for analysis. Data from police
records for the period correspolXling to field research include more
than 46,000 service requests. It is important to note, however, that
the demands included in police records are not completely congruent
with those registered in monitored calls, since police records contain
only those calls which operators initially judged as appropriate for
dispatch. Thus, calls for service involving provision of or requests
for information are excluded, as are requests for assistance that do
not require that a police unit be sent. Also excluded are calls
judged ineligible for police service (e.g., those originating from
outside the jurisdiction), calls referred to internal units or other
agencies, and calls transferred to the department's report writing
sta tion. The picture of demand from police records, then, is more
accurately interpreted as demand judged appropriate for immediate
police response by dispatched units. For analyzing beat structure and
deployment, however, this picture is relevant.
In order to study the distribution of demands for police service
in Fort Worth, calls for service were identif ied by beat area and the
proportions of neighborhood calls were calr.ulated by eight problem
types: serious and less serious problems with persons, serious and
less serious problems with property, emergency and general assistance,
suspi cious persons or property, and traffic problems. Readers may

104
review the composition of these categories by referring to Table 4-5
in Chapter 4. Table 7-4 lists data on the number and types of
neighborhood service requests included in police records.
Table 7-4
Distribution of Problems Acroas Fort Worth Neighborhoods
Number of Calls Percent of Calls
Problem Type: Range Mean Range Mean
Serious Problems with Persons 1 - 65 19.1 1 - 10% 4.0%
Less Serious Problems with Persons 6 - 223 88.0 2 - 36% 18.5%
Serious Problems with Property 5 - 124 58.9 3 - 21% 12.5%
Less Serious ProbJ.ems with Property 4 - 178 60.9 2 - 42% 13 .6%
General Assistance o - 524 30.6 1 - 56% 6.3%
Emergency Assistance 1 - 26 11.8 1 - 8% 2.7%
Suspicious Person/Property 3 - 86 30.5 1 - 14% 2.9%
Traffic Problems 13 - 161 65.5 3 - 25% 14.4%
The proportion of neighborhood calls concerned with serious
problems with persons ranged from 1 to 10 percent with a mean of 4
percent. The distribution of these serious problems with persons
across Fort Worth neighborhoods is depicted in Figure 7-3. Areas with
the largest percentage of calls of this type tend to cluster in the
northwest and southeast quadrants of the city, overlapping many
neighborhoods with high proportions of black and Hispanic residents.

Distribution of Problems \\lith Pl'I':;ons 1\C1'OSS Fort \'iorth Neighborhoods
Figure 7-3 Figure 7-4
Serious Problems \\lith Persons Less Serious Problems \\lith Persons
Lo\\ (Less Than 3% of Calb) U 0 La., (Less than 15', of Call'J
o ~ledium (3 D" to 5% of Calls) . 0 ~leJiu,n (15% to 22'~ of Calb)
IIHigh (Greater Than 5~D of I High (Greater lil,tn 22" of Ca lIs) Calls)
, .... o CJ:I

106
The proportion of neighborhood calls concerning less serious problems
with persons ranged from 2 to 36 percent across Fort Worth
neighborhoods with a mean of 18 percent. The distribution of these
calls, arrayed in Figure 7-4, is very similar to that for serious
problems with persons (Figure 7-3).
Serious problems with property -- which include stolen vehicles,
other thefts, and burglaries -- ranged from 3 to 21 percent of the
calls in Fort Worth neighborhoods. Less serious property problems
such as vandalism, lost property, and burglar alarms ranged from 2 to
42 percent of calls. The distribution of property problems are shown
in Figures 7-5 and 7-6. Neighborhoods with the highest proportion of
serious property calls are located in the southeast quandrant, an area
tha t also experienced high levels of person-related problems. The
pattern for less serious problems with property is quite different
from that of serious property problems. Neighborhoods which reported
a high proportion of less serious problems with property were
scattered across the city, but generally were not those neighborhoods
with high levels of serious problems with persons or property.
Together these four maps suggest some clustering of problems w·ith
persons and serious property problems in lower-income areas, while
les s serious property problems tend to be reported proportiona tely
more often in more affluent neighborhoods.

Distribution of Problcms with Property Across Fort \\'orth :\eighborhoods
Figure 7-5 figure 7-6
Serious ?roblems with Property Lcss Serious Problems with Property
10~" of Call~;! 'Low (Less Than 10"0 of Calls)
D~leJium (100~ to 15% of Call :;j LJ DMedium (lO~o to 20 Qo of Calls)
IHigh (Grenter 'I1Wll 15°~ of IIlligh lGreater Than :::O~" of Calls)
Calls)
..... o -...J

108
Across most neighborhoods, the percentage of calls concerning
general assistance was greater than that for emergency assistance.
The proportion of calls about general assistance ranged from 1 to 56
percent of calls per neighborhood, although most had less than 10
percent of calls conc~rned with general assistance. Since hospital
calls (i.e., reports to police of inflicted injuries) were counted as
general. assistances, neighborhoods containing hospital s reported an
unusually high level of calls of this type. The percentage of calls
concerning emergency assistance, most often traffic accidents with
personal injuries, ranged from 1 to8 percent of reported calls.
These emergency assistance requests were scattere:i across many areas
of the city.
Calls about suspicious persons or property represented on the
average about 6 percent of calls to police per neighborhood. Those
with the highest percentage of calls about supicious persons or
property were located in more affluent areas away from the city's
center (Figure 7-7). Traffic problems ranged from 3 to 25 percent of
a neighborhood's calls to police with a mean of 14 percent. Areas
with the greatest proportion of traffic problem calls, most involving
property damage accidents, were located in a band that runs east to
west across the city's center (Figure 7-8). Contained within this
hand is interstate highway 1-30 and U.S. Highway 80. Much of the
east-west traffic flows through this corridor, which is highly
travelled, especially during rush hour periods.

Distribution of Suspicious Persons or Property and Traffic Problems Across port \~orth Neighborhoods
figure 7-7 Figure 7-8
Suspicious Persons or Property Traffic Problems
LolV (Less Than -1 90 of Cal i ; I L...-I
12% of Calls) L-...I
Dr-tedium (4~6 to 9% of Call:; o ~Iedium (12 go to 20% of Cal!:»
IIHigh (Greater Than 9°, of Calls)
IIlligh lGrcater Than 20g" of
Calls)
.... o ~
110
Clustering of Problems in Neighborhoods
Comparison of the figures displaying the distribution of problems
across neighborhoods suggests that certain problems -- namely serious
and less serious problems with persons and serious problems with
property -- tend to cluster in the same neighborhoods. Another means
of analyzing the clustering of neighborhood service requests is to
examine the correlation matrix of the variables measuring the
proportion of neighborhood calls by types. This matrix is presented
~n Table 7-5.
The correlation of serious and less serious problems with persons
(SERPERS and LSERPERS) is relatively strong and posi tive (0.61)
indicating that both types of problems with persons tend to cluster in
the same neighborhoods. In addition, less serious problems with
persons and serious problems with property (SERPROP) are positively
correlated. These findings confirm preliminary findings from Figures
7-3 through 7-5.

SERPERS
LSERPERS
SERPROP
LSERPROP
GENASST
EMASST
SUSPP
III
Table 7-5
Correlations of Variables Measuring the Proportion of Neighborhood Calls by Problem Types*
(N = 90 Beats)
SERPERS LSERPERS SERPROP LSERPROP GENASST EMASST
.61 NS -.39 -.26 NS
.34 -.49 -.23 -.43
-.36 -.29 -.42
NS NS
NS
SUSPP TRAFF
-.42 -.24
-.46 NS
-.51 .56
.43 NS
-.42 NS
NS .34
NS
*The correlations in this table are Pearson Product-Moment Correlations; they are significant at the 0.05 confidence level unless marked with an NS. The variable abbreviations in the table are defined as follows:
SERPERS == Serious Problems with Persons LSERPERS = Less Serious Problems with Persons SERPROP = Serious Problems with Property LSERPROP = Less Serious Problems with Property GENASST = General Assistance EMASST = Emergency Assistance suspp = Suspicious Person or Property TRAFF = Traffic Problem
In contrast, less serious problems with property (LSERPROP), such
as reports of vandalism or burglar alarms, are negatively correlated
with problems with persons and serious problems with property. Figure
7-6 indicates that less serious property problems were reported
proportionately most often in neighborhoods near city boundaries,
which are generally more affluent them the inner city areas reporting
the most serious problems. It is interesting to note that reports of
suspicious persons and property (SUSPP) are also negatively rela~ed to

112
calls about problems with persons and serious problems with property,
but at the same time are positively related to less serious property
problems. This suggests that neighborhoods that report proportion-
ate1y more minor property problems, such as vandalism, are also more
likely to report suspicious persons, such as prowlers.
The proportion of neighborhood requests for general assistance
(GENASST) ruled eligible for police dispatch -- including hoapi tal
reports of inflicted injuries and requests for priso~er pickup -- is
nega tively related to serious problems with persons and property.
Traffic problems (TRAFF), on the other hand, are positively related to
serious problems with property and emergency assistance (EMASST).
Variations in Probleas by Neighborhood Race/Ethnic Background. Incoae. and Population Density
Given the distribution of problems reported to the Fort Worth
Police across neighborhoods, this section considers possible
neighborhood influences on these distributions.3 Table 7-6 presents
correlations between variables measuring the proportion of
neighborhood calls by type with measures of racial/ethnic composition,
median family income, and population density. Correlations in this
table indicate that the proportion of black residents in the
neighborhood (PBLACK) is positively related to the proportion of
problems with persons originating in the neighborhood. That is,
predominantly black areas were more likely than other neighborhoods to
report serious and less serious problems with persons. These areas
were a1 so more likely to report serious problems with property
including burglary and thef to Converse ly J the proportion of black

113 .
residents is negatively related to the percentage of neighborhood
calls involving less serious problems with property, suspicious
persons and circumstances, and traffic problems.
Table 7-6
Correlation of Neighborhood Calls by Race/Ethnic Background, Income. and Population Density*
(N = 90 Beats)
Problem Type: PBLACK PSPAN MEDINC DENSITY
Serious Problems with Persons .55 NS -.51 .33
Less Serious Problems with Persons .54 .23 -.56 .39
Serious Problems with Property .31 -.19 NS .31
Less Serious Problems with Property -.30 NS .48 -.24
General Assistance NS NS NS NS
Emergency Assistance NS -.23 .24 -.46
Suspicious Person/Property -.26 NS .42 NS
Traffic Problems -.33 NS .26 -.31
*The correlations in this table are Pearson Product-Moment Correlations; they are significant at the 0.05 confidence level unless marked with an NS. The variable abbreviations in the table are defined as follows:
PBLACK PSPAN MEDINC DENSITY
= proportion of neighborhood residents who are black = proportion of neighborhood residents vho are hispanic = estimated median family income = population density per square mile
The Hispanic composition of neighborhoods (PSPAN) shows little
statistically significant relationship to the proportion of different
problems reported to the police. The percentage of Hispanic residents
was positively related to the proportion of less serious problems with
'114
persons' calls and negatively related to serious property problems and
emergency assistance calls.
The relationship of median family income (MEDINC) to the
proportion of calls by type shows some interesting relationships.
Citizens in neighborhoods with higher median family incomes tend,
according to the correl ations listed in Table 7-6, to report
substantially fewer problems with persons, both serious and less
serious. Thus, individuals residing in wealthier neighborhoods are
proportionately les s likely to call the police about relatively
serious problems such as as sault, rape, and robbery. On the other
hand, persons in these more affluent areas are proportionately more
likely to report less serious problems with property, such as
vandalism and burglar alarms. It may well be that persons in poorer,
higher crime neighborhoods, would not bother to report vandalism or
suspicious persons to police since these problems may be relatively
common here; they may not seem worthy of reporting. In these areas,
citizens seem more likely to contact the police for more serious
problems, especially those involving harm or injury to individuals.
Some analysts have speCUlated that population density may
increase serious crimes by concentrating large groups of people, often
poor, in relatively small areas. The correlations reported in the
last column of Table 7-6 indicate that popUlation density (DENSITY) in
Fort Worth neighborhoods is moderately and postively related to both
serious and less serious problems with persons and serious problems
with property. Residents in areas with higher population density are
more likely to report these more serious types of problems.
------------_._------------------ ----------~---~-
115
Conversely, density is negatively related to the proportion of less
serious property problems, emergency assistance, and traffic problems
reported.
To summarize the data in Table 7-6, many serious problems
originate proportionately more often in neighborhoods that have lower
family incomes, high population density, and high concentration of
black residents. A different pattern is evident for less serious
property problems; they are reported more often from areas with higher
~ncomes and lower population density. Similar to the pattern of less
serious property problems, both suspicious person and traffic problem
calls originate more often from higher income, white neighborhoods.
Variations in Problems by Neighborhood Land Use and Facilities
Citizen service requests included in police records can also be
examined in terms of land use and facilities, other contextual factors
that might influence patterns of neighborhood demands. Table 7-7
presents correlations between problem type variables and estimates of
the percentage of land use in Fort Worth neighborhoods.

116
Table 7-7
Variations in Problems by Neighborhood Land Use*
(N = 90 Beats)
Percentage of Land Use by Type:
Problem Type: RESEST COMEST INDEST RECEST PUBEST VACEST
Serious Problems with Persons .32 NS NS -.27 NS - .32
Less Serious Problems with Persons .42 NS NS -.24 NS -.39
Serious Problems with Property .52 -.24 -.22 NS -.26 -.26
Less Serious Problems with Property NS NS .17 NS -.23 .19
General Assistance -.27 NS NS .17 NS NS
Emergency Assistance -.40 -.25 NS NS NS .52
Suspicious Person/ Property .34 -.38 -.18 NS -.19 NS
Traffic Problems -.37 .22 NS .17 .18 NS
*The correlations listed in this table are Pearson Product-Moment Correlations and are significant at the 0.01 confidence level unless marked NS. The variable abbreviations in the table are as follows:
RESEST = estimated proportion of land used for residential purposes cm-mST = estimated proportion of land used for commercial purposes INDEST = estimated proportion of land used for industrial purposes RECEST = estimated proportion of land used for parks, recreational
areas , and cemeteries PUBEST = estimated proportion of land used for public facilities such
as schools, city government, and military facilities VACEST = estimated proportion of land that is vacant and undeveloped
The extent of land used for residential purposes is positively
related to both types of problems with persons and serious problems
with property, indicating that many serious types of problems reported
to police originated in predominantly residential neighborhoods. The

117
proportion of calls concerned with suspicious persons is also
positively associated with the extent of residential land use in the
neighborhood. On the other hand, residential land usage is negatively
related to requests for general and emergency assistance and reports
of traffic problems.
The influence of commercial land use manifests a different
pa ttern compared to residential land use. The percentage of
neighborhood land used for commercial purposes j,s negatively related
to serious problems with property such as burglary and theft. It is
also negatively associated with the reporting of suspicious persons or
property~ but positively related to traffic problems. Thus it appears
while problems with persons and serious problems with property are
reported proportionately more often in more residential neighborhoods,
traffic problems are reported proportionately more often in commercial
areas.
Other land use variables have less significant influence on the
problems reported to the Fort Worth Police Department. The proportion
of problems with persons is negatively related to the percentage of
neighborhood land area used for recreational purposes. Problems with
property have a negative correlation with the percentage of land used
for public facilities such as schools, universities, roads, and
military facilities. The percentage of vacant and underdeveloped land
is inversely related to the proportion of neighborhood problems
concerning problems with persons and serious problems with property.
At the same time, the extent of vacant land, often found in beats at
the city's periphery, is positively related to requests for emergency
assistance. Many of these requests concern personal injury traffic
accidents on major highways that circle the city near its boundaries.

---------
118
The proportionate distribution of problems reported to the police
and initially accepted for unit dispatch may also vary in terms of
facilities in the neighborhoods. Table 7-8 lists correlations between
problem types and the number of different kinds of facilities located
in the neighborhood. The proportion of neighborhood calls concerning
serious problems with persons is negatively related to the number of
parks, through-streets, and industrial areas in neighborhoods, further
indication that problems, such as assaults, originate proportionately
more often in heavily residential areas. Less serious problems with
property calls have few statistically significant correlations with
facility types; these problems are positively related to the number of
churches and negatively related to number of industrial parks and
areas.
Serious problems with property including burglary and theft are
positively related to the number of churches, schools, and parks while
inversely related to the number of major highways traversing the
neighborhood. Less serious problems with property are positively
related to the number of aparbnent complexes in the area and the
number of major thoroughfares.
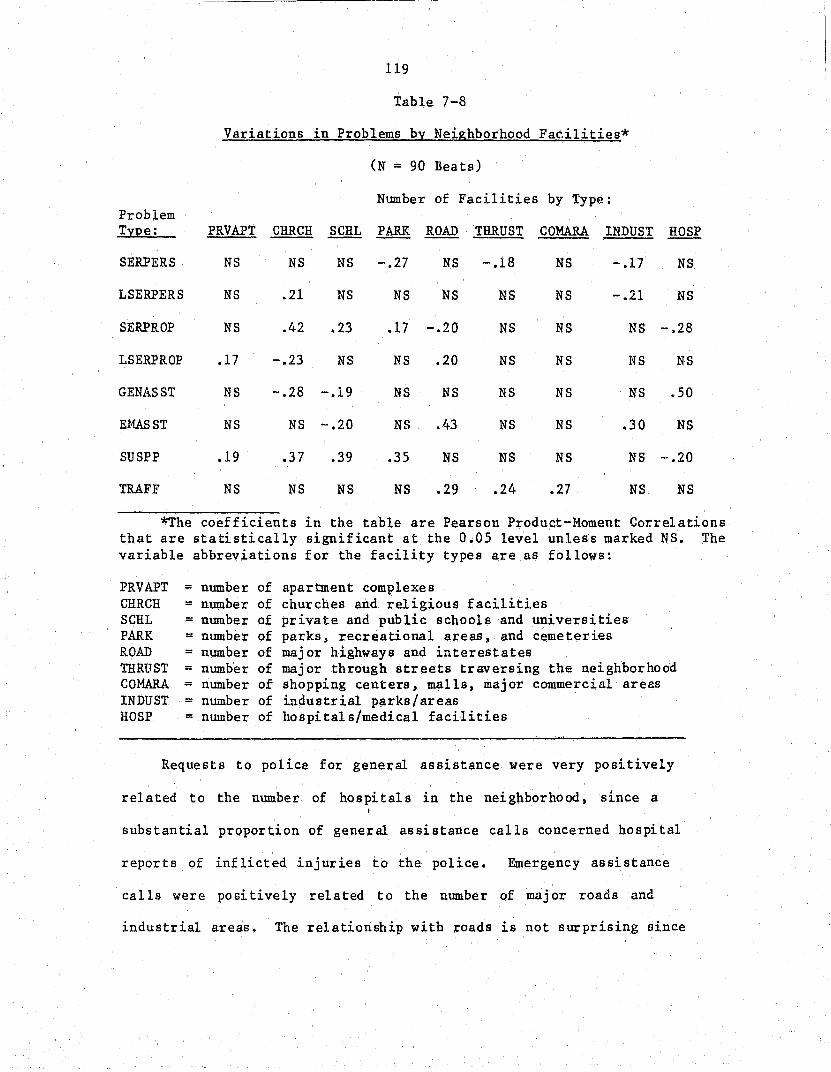
119
Table 7-8
Variations in Problems bI Neighborhood FaC'.ilities*
(N = 90 Beats)
Number of Facilities by Type: Problem TIpe: PRVAPT CHRCH SCHL PARK ROAD THRUST COMARA INDUST HOSP
SERPERS NS NS NS -.27 NS -.18 NS -.17 NS
LSERPERS NS .21 NS NS NS NS NS -.21 NS
SERPROP NS .42 .23 .17 -.20 NS NS NS -.28
LSERPROP .17 -.23 NS NS .20 NS NS NS NS
GENASST NS -.28 -.19 NS NS NS NS NS .50
EMASST NS NS -.20 NS .43 NS NS .30 NS
SUSPP .19 .37 .39 .35 NS NS NS NS -.20
TRAFF NS NS NS NS .29 .24 .27 NS NS
*The coefficients in the table are Pearson Product-Moment Correlations that are statistically significant at the 0.05 level unless marked NS. The variable abbreviations for the facility types are as follows:
PRVAPT = number of apartment complexes CHRCH = number of churches and religious facilities SCHL = number of private and public schools and universities PARK = number of parks, recreational areas , and cemeteries ROAD = number of major highways and interestates THRUST = number of major through streets traversing the neighborhood COMARA = number of Shopping centers, malls, major commercial areas INDUST = number of industrial parks/areas HOSP = number of hospitals/medical facilities
Requests to police for general assistance were very positively
related to the number of hospitals in the neighborhood, since a
substantial proportion of general assi stance calls concerned hospi tal
reports of inflicted injuries to the police. Emergency assistance
calls were positively related to the number of major roads and
industrial areas. The relationship with roads is not surprising since

•
120
many of the emergency assistance calls involved traffic accidents with
personal injuries where emergency medical assistance is needed.
Reports of suspicious persons or property are positively
associated with the number of apartment complexes, churches, schools,
and parks. All of these facilities tend to attract a large number of
unacquainted individuals, which may account for these positive
relationships. Finally, traffic calls, as might be expected, are
positively related to the number of major thoroughfares and the number
of streets which traverse the neighborhood. Traffic problems are also
po si tively inf luenced by the number of commercial areas, such as
shopping malls and centers.
Neighborhood Profiles by Problem Ty~
In order to summarize these findings on the relationships between
the proportion of problems reported to police and neighborhood
demographic and land use variables, this section attanpts to sketch
profiles of neighborhoods using the correlations presented above.
Table 7-9 lists the variables that were sigificantly related to
individual problem types, indicating the direction and magnitude of
the relationship.

121
Table 7-9
Summary of Correlations Between Problem Type and Neighborhood Level Variables
Problem Type:
Serious Problems with Persons
Less Serious Problems with Persons
Serious Problems with Property
Less Serious Problems with Property
General Assistance
Emergency Assistance
(N = 90 Beats)
Variables with Positive Influence Negative Influence
- % black residents (S)* - median family income (S) - population density (M) - % recreational land (W) - % residential land (M) - % vacant land (M)
- parks (W) - through-streets (W) - industrial areas (W)
- % black residents (8) - median family income (8) - % Hispanic residents (W) - % recreational land (W) - population density (M) - % vacant land (M) - % residential land (M) - % industrial land (W) - churches (W)
- % black residents (M) - % hispanic residents (W) - population density (M) - % public land (W) - % residential land (8) - % commercial land (W) - churches (M) - % industrial land (W) - schools (W) - % vacant land (W) - parks (W) - major thoroughfares (W)
- hospitals (W)
- median family income (M) - % black residents (M) - % industrial land (W) - population density (W) - % vacant land (W) - % public land (W) - apartment complexes (W) - churches (W) - through-streets (W)
- % recreational land (W) - % residential land (W) - ho s pi tal s ( 8) - churches (W)
- school s (W)
- median family income (W) - % hispanic residents (W) - % vacant land (8) - population density (M) - major thoroughfares (M) - % residential land (M) - industrial areas (M) - commercial areas (W)
- schools (W)

Problem Type:
Suspicious Persons or Property
Traffic Problems
122
Table 7-9 (Continued)
Variables with Positive Influence Negative Influence
- median family income (M) - % black residents (W) - % residential land (M) - % commercial land (M) - apartment complexes (W) - % industrial land (W) - churches (M) - % public land (W) - school s (M) - ho spi tal s (W) - parks (M)
- median family income (W) - % black. residents (M) - % commercial land (W) - popula tion densi ty (M) - % recreational land (W) - % residential land (M) - % public land (W) - major thoroughfares (W) - through-streets (W) - commercial areas (W)
*The letters in parenthesis indicate the magnitude of the correlation defined as follows: S is a strong relationship (± 0.5 or greater), M is a moderate relationship (± 0.3 to 0.49), and W is a weak relationship (± 0.01 to 0.29). All correlations in the table are statistically significant at the 0.05 confidence level.
The relationships reported in Table 7-9 suggest that serious
problems with persons often originate in neighborhoods with high
concentrations of black residents, low family incomes, and relatively
high population density and residential land use. Thus, problems such
as assault, rape, and robbery were reported proportionately more often
from areas that are heavily residential, poor, and black. Less
serious problems with property including disturbances and drunks
manifest a pattern similar to that for serious person-related
problems; less serious problems with persons also frequently originate
from areas that are characterized by high concentrations of
minorities, low incomes, and predominantly residential land use.

123
Serious problems with property including burglary and theft also
were reported proportionately more often in densely populated
neighborhoods with relatively high concentrations of black residents.
As discussed previously, less serious problems with property, such as
vandalism and burglary alarms, show a quite different pattern from
other property- and person-related problems. These less serious
property problems tend to originate in areas with higher incomes,
lower population density, and higher percentage of white residents.
General assistance calls are strongly related to the number of
hospitals in the area; as explained above, this results from the fact
that hospital reports of inflicted injuries are included in the
general assistance category. Thus, where the law requires that
inflicted injuries be reported to the police, hospitals may represent
a major source of demand. Emergency assistance calls, which include
traffic accidents where medical assistance is needed, originate in
areas that are not densely populated, that have sanewhat higher
incomes, and that contain major thoroughfares, such as freeways or
highways.
The distribution of calls concerning suspicious persons or
property mirrors the pattern identified for less serious problems with
persons. Reports of prowlers, suspicious persons, and open doors or
windows originate in higher income areas that are predominantly white.
This kind of service request al so is related to the number of
apartment complexes, churches, schools, and parks in the neighbor
hoods. These facilities attract groups of people, many of whom are
unknown to each other. This may account in part for their impact on
the proportion of suspicious person/property calls made to the police.

124
Finally, traffic problems including property damage accidents and
parking violations are positively associated with neighborhoods
containing major thoroughfares, the number of through-streets, and the
extent of commercial and recreational areas.
Conclusion
Examination of service demands across neighborhood areas
indicates that there are some identifiable distributional patterns.
The findings concur with previous research concerning the location of
serious problems with persons and property in poorer, inner-city
neighborhoods populated heavily with minorities. These are areas
where the social pathologies of urban America, including unemployment,
poverty, and illiteracy tend to concentrate. On the other hand, less
serious property problems and suspi cious person calls originate from
more affluent areas, which may be concerned with protecting household
and personal property from harm or theft. Traffic problems and
requests for assistance originate from many areas of the community,
but also are related to facilities located in neighborhoods. These
patterns suggest that problems are not randomly distributed across
Fort Worth, but tend to cluster according to identifiable patterns.
These patterns, once recognized, might be considered in decisions
about structuring beat areas and deploying police personnel. We
return to these considerations in the last chapter.

125
Footnotes
lIn this report, Hispanics are tho5\e who identified themselves as having Spanish origin in the 1980 census. Spanish origin includes persons of Mexican, Puerto Rican, Cuban, and other Spanish descent.
2In many calls for service, including information calls, the cailer does not provide the police operator with location information. Thus for a substantial set of calls, there is no way to determine where they originate.
3 It should be noted that variations in neighborhood reporting patterns may be influenced not only by neighborhood social and physical characteristics, but also by differential willingness of individuals in different neighborhoods to report various problems to the police. While recognizing the possibility of reporting biases, we cannot include this factor in analysis because we lack measures of it.

126
Appendix 7-1
Sources of Neighborhood (Beat) Level Data
Population and Racial Composition data are derived from the first data released from the 1980 census. Total population counts and counts by racial groups were obtained for each census block in Fort Worth. Using large police beat and census block maps, a conversion table was constructed that located census blocks in individual beats. Population and racial composition data were then aggregated to the beat level.
Income data from the 1980 census were not available at the time this report was prepared. As a substitute, estimates of 1980 median family incomes by Fort Worth census tract were used. These estimates were prepared in 1977 by the North Central Texas Council of Governments and printed in a report "Uniform Data for the City of Fort Worth." In order to translate these income estimates from tracts to beats, census maps were compared with police beat maps and a conversion table computed; from this median family income of beats was estimated.
The land area of beats were estimated through caref ul scaled measurement of police beat maps.
Land usage estimates were made by carefully inspecting land use maps provided by the State of Texas Highway Department that showed land use by type in the City of Fort Worth.
The facilities constructed in Fort Worth neighborhoods were gathered from multiple sources. Detailed city maps were used to determine the number of schools, major thoroughfares, through-streets, and parks in neighborhoods. Current telephone directories were used to locate apartment complexes, hospital s, shopping centers and malls, and churches in beat areas.
Density was calculated by dividing total population in the beat by estimated land area.

CHAPTER 8
POLICE RESPONSE TO CALLS FOR SERVICE
Previous chapters have documented the volume, variety, and
patterns of service requesta received by the police. In this chapter
we consider police response to calls for service, that is, what the
call taker tells the caller that the police will do about the reported
matter. Traditionally, most research on citizen demand patterns has
largely ignored call taker response, focusing instead on the single
issue of whether a unit was dispatched as a result of the call.
Recently, however, phone operator response has become a topic of
considerable interest, due largely to concern about developing more
efficient response strategies than unit dispatch. Re;i'.earchers have
also become aware that for many callers, the only police represen
tative with whom they interact is the call taker, and that call takers
handle a significant proportion of citizen requests either by
providing information themselves or connecting callers with other
sources of information or assistance.
Alternative Means of Police Response
Prior to examining call taker responses to citizen requests for
police service in Fort Worth, it is useful to consider more generally
the potential forms of and constraints on police response. The
traditional view has been that police will respond to most calls for
service by dispatching one or more officers to the scene of the
incident or problem. Historically, "urban police departments have
viewed it as their duty to provide rapid and personal response to

128
citizen complaints or calls for service" (Cahn and Tien, 1981: 2-5).
Citizens, too, have generally shared this conception that police will
(or should) respond to all service requests by sending pt.>J.ice
personnel to the scene. Yet despite this common expectation, police
ability to respond rapidly to calls for service with dispatched
personnel has been eroded by an ever growing demand volume that has
outstripped growth in police resources.
As municipal allocations to police departments have diminished while the number of calls for service has risen, many police administrators have come to realize that, despite efforts to increase productivity, sophisticated computer planning, and schemes to return more officers to patrol duty, they may simply be unable to continue sending a police car to all citizen calls for service (Sumrall, Roberts, and Farmer, 1981: 2).
Given the well established practice of dispatching officers to
most calls and the belief that this is the most appropriate form of
police response, one might presume that departments have developed few
means of alternative response. This, however, is not the case. This
fact is documented by research showing that a substantial proportion
of calls for service do ~ result in the dispatch of a police unit
(Antunes and Scott, 1981; C.ahn and Tien, 1981; Lilly, 1978; Bereal,
1970). After studying over 200 police agencies, Sumrall, Roberts, and
Farmer (1981: 9) concluded that:
Departments throughout the country are using a myriad of alternative responses. These include civilian response, telephone reporting, appointment scheduling, mail-in reporting, referral to other agencies, and no response at all. Surprisingly, 80 percent of the agencies surveyed for this project use some form of alternative response.
A variety of alternative means of police response adopted by urban
police agencies are described in the sections that follow. Later
sections examine patterns of call disposition in Fort Worth.
129
Eligibility Screening and Referral
One response alternative is to reduce demand levels, or at least
the necessity to respond to demand with a dispatched unit, by making
eligibility requirements more stringent. Police telephone operators
perform the primary role in judging eligibility for police services.
Common criteria used to evaluate eligibility include jurisdictional
boundaries, the range of services provided by the department (service
domain), and seriousness and urgency of service requests. For
example, departments may decide that they will no longer provide
certain nonemergency services or will not respond to very minor
incidents. Faced with budgetary constraints, some police agencies
have decided to no longer perform nones sendal services such as
vacation checks of residences, providing transportation in squad cars,
or assisting motorists locked out of cars. Where police decide not to
provide requested services, operators might still assist callers by
referring them to other public or private agencies that may provide
the desired response. Referral is common in calls where demands are
judged ineligible for police response.
While making eligibility rules stricter may reduce demand
somewhat, it seems doubtful that police can feasibly refuse to handle
most calls for service. With the broad range of services that they
provide and their 24-hour schedule of operation, police will continue
to receive requests for many kinds of assistance that no other
agencies offer on a continual, immediate basis. Given that police
appear certain to face high demand loads in the future, other response
alternatives are being contemplated and adopted.

130
Call Prioritization and Response Delays
A response alternative currently used in many police agencies is
prioritization of service request s in terms of seriousnes s and the
speed of patrol officer response. Given an inability to respond
immediately to all calls for service, one alternative is to categorize
calls according to their seriousness and then to delay dispatching
police units to less serious incidents. Many police departments use a
small set of codes to classify the seriousness of incoming service
requests. A recent study by the Police Executive Research Forum found
that 70 percent of the departments studied use sane.form of priority
coding of calls for service (Sumrall, Roberts, and Farmer, 1981).
Although prioritization schemes vary among departments, most have some
means of identifying the most urgent or emergency calls, such as a
robbery in progres s. Some systems also attempt to identify service
requests to which rapid police response is not necessary, including
tho se involving nonanergency situations such as a burglary that
occurred several days previously. The remainder of incoming calls for
service are generally assigned an intermediate priority ranking.
The Report Writing Alternative
Transferring or referring callers to report writers, instead of
dispatching a police unit, is another means of police response. The
purpose of this al terna tive is to avoid dispatching uni ts to the
scene. For many types of crimes, including those that are "cold"
(i. e., occurred several hours before being reported) and where
evidence will not likely be obtained, all that responding officers can
do is take a report. Once completed, this report may simply be filed

131
or forwarded to detectives for investigation. Faced with high demand
loads, some departments have established report writing offices where
pol ice personnel complete crime or incident reports over the phone.
This is seen as more efficient than sending an officer to the scene.
Obviously, this response is inappropriate for situations where
important evidence might be gathered or where callers might need same
form of direct assistance. In calls such as the report of a missing
person or a bicycle theft, however, police can gather necessary
information and commence investigation without having to send a patrol
officer to the scene. The report writing alternative frees responding
units to handle more important matters, although less tangible
benefits derived from face-to-face officer contact with the public may
be forfeited. Some departments provide the report writing alternative
as an option while offering to send a responding unit if the caller so
prefers.
Other variations in this report writing function are possible.
Some departments have established walk-in reporting facilities.
Police operators request that persons reporting less serious matters
where immediate response is unnecessary come into the police station
and complete a report. Other departments mail report forms to those
requesting service, asking that complainants complete the report and
send it back to the police. These mail forms are used in cases such
as minor thefts and traffic accidents.
Disposition of Calls for Service in Fort Worth
Exam ina tion of operator responses to callers provides one
indicator of police disposition of calls for service. Another measure
•
~----~---------------------
132
of demand dispo si tion is calls for service records maintained by
police agencies. Both indicators of call disposition -- operator
responses and police records -- pose difficulties for researchers. A
major problem with analyzing operator responses is that for some calls
no clear response is articulated. Responses such as "okay" or "we'll
take care of it" are imprecise and tell neither the caller nor the
researcher what police action will be taken. On the other hand,
studying police records can also yield a biased view in that police
generally keep data on only those calls judged eligible for unit
dispatch; no record is kept of nondispatched calls.
In this section we examine operator responses to callers in Fort
Worth. PCS fieldworkers recorded verbatim what, if anything~
operators told callers the police would do about the reported matter.
Exam ina tion of responses ref lecta only what the operator told the
caller, although the verbal response usually but not always indicates
what police actually did.
Assessing Eligibility for Police Services
In order to examine patterns of call disposition in Fort Worth,
we first consider the eligibility decisions made by police operators.
In about 9 percent of the calls to police, the caller was informed
that the pol ice would not respond to scme aspect of the request. The
reasons given for the refusal of police service are listed in Table
8-1. These data indicate that mUltiple reasons account for operators
informing callers that their service requests were ineligible for
police response. Some factors were related to the eligibility
requirements previously outlined. Fourteen percent of the calls to

133
which police services were not provided involved a crime or problem
located outside of the jurisdiction. Police response was also refused
because service requests involved noncriminal problems located on
private property. Calls in these two categories were ruled out on the
basis of boundary criteria.
Table 8-1
Reasons Why Service Not Provided by Fort Worth Police Department to Some Calls for Service
(N = 488 calls which is 8.5% of all monitored calls for service)
Reasons Service Not Rendered:
Problem/Crime Not Currently Taking Place Police Can Do Nothing Until Citizen Takes Action Problem/Crime Located Outside of Jurisdiction Civil Matter, Not Appropriate for Police Response Police Offices Closed; Officer Not on Duty Requested Service Not Provided by Police Problem/Crime Located on Private Property Operator Does Not Have Requested Information No Crime or Problem Involved Other Reason
Total
1i
93 89 67 53 53 48* 25 18 12
.2Q
488
Percent
19% 18 14 11 11 10
5 4 2
_6_
100%
*Service requests in this category include needing assistance because locked out of car (13), needing police to stand. by for protection (12), requestB for license registration information (6), escort/transportation (4), vacation checks (3), and other requests (10) •
Call takers in the Fort Worth Police Department also employed
service domain criteria when evaluating the eligibility of service
requests. Domain criteria were invoked about 23 percent of the time
in which service was refused. For example, operators scmetimes
refused service on the basis that the department had chosen not to
provide various services (e.g., assistance to motorists locked out of
vehicles, '~"lca tion checks) or that the incident involved a

~-------~--------------------------.
134
noncriminal, civil matter appropriately dealt with by the courts.
Domain criteria were also invoked in calls judged ineligible because
no crime or problem was involved. These calls generally involved sane
sort of problem or dispute (e.g., neighborhood children playing in the
yard) that was technically not a criminal incident. Although police
might conceivably intervene and attempt to ameliorate the dispute, few
police agencies define their domain so broadly as to include these
types of problems.
Another reason for not initiating police response was that the
problem or crime being reported was not occurring at the time of the
call. Implicit in this rationale was the idea that the problem was
not of great seriousness and that the caller lacked sufficient evi
dence about the matter. If the call was of a very ~erious nature -
for example: about a threatened robbery or homicide -- it is clear
that the police would immediately investigate. But where the matter
is less serious, police may not take action until such time as they
can likely witness the problem/crime and gather evidence. A caller
reporting that kids have been playing on his lawn or throwing trash in
the yard, for example, will likely be told to call back when the
offenders are present since immediate police response is apt to be
fruitless. Here we see the seriousness criteria implicitly used for
judging eligibility.
It is important to note that in a substantial proportion of the
calls where operators said that police could not provide service, some
assistance was given through referral, call transfer, or provision of
information. Of the calls that were refused service by operators, 36
percent were referred to internal units or external agencies, 4

135
percent were transferred to other internal units, and 11 percent were
provided with police-related information.
Activating Initial Police Response
After assessing eligibility, another key task of police operators
l.S selecting a response alternative. As described above, operators
have several alternative modes of call disposition. They can route
the request to dispatchers (as well as noting call priority), transfer
the caller to report writers, refer the caller to internal units or
external agencies, and/or provide needed information to the caller.
Examination of police operator responses to callers in Fort Worth
provides evidence on the relative use of the various response
al terna tives. As noted previously, in about 9 percent of service
requests, the caller was told that police would not provide direct
services. Thus, 91 percent of calls were judged eligible for some
form of police response. The distribution of operator responses to
eligible calls is presented in Table 8-2.
Despi te often limited patrol manpower, more than 40 percent of
callers were told that a police unit would respond to their service
request. The number of calls actually receiving a police unit in
response may even be higher, since units may be dispatched even if
callers were not specifically told that this would happen. For
eX8mple, callers who requested a police unit were sometimes told
""kay." Al though sane of these calls were not dispatched, others
were. Previous studies of operator responses indicate considerable
variation in the extent to which callers were promised that a unit
would respond. Lilly (1978) reports that units were promised 30

136
percent of the time, compared to 49 percent reported by Antunes and
Scott (1981) and 80 percent by Cahn and Tien (1981).
Calls judged appropriate for dispatch were assigned one of three
priority codes designating incident seriousness. Priority code 1 was
used for emergency calls requiring immediate response (e.g., robbery
in-progress), code 2 for serious calls where quick but not immediate
response is warranted (e.g., traffic accident), and code 3 for
nonemergency calls where immediate response is not needed (e.g.,
bicycle theft). Of the more than 2,300 calls where a police unit was
dispatched, only 5 percent were classified by operators as code 1, 74
percent as code 2, and 21 percent as code 3.
Table 8-2
The Distribution of FWPD Operator Responses to Calls for Service*
(N = 5,257)
Number QJ2erator Role/Response Category: of Cases
Police Unit Promised 2,241
Call Transfer: (680) Transfer to Report Writer 392 Transfer to Internal Units 274 Transfer to Other Agencies 14
Referral of Caller: (542: Referral to Internal Units 320 Referral to Other Law Enforcement Agencies 52 Referral to Other Governmental Agencies 69 Referral to Community Social Service Agencies 48 Referral to Other Agencies 53
Information Taken/Provided: (820) Information Taken and Internally Relayed 284 General Information Provided 536
Percent of Cases
42.6%
(13.0) 7.5 5.2 0.3
(10.3 ) 6.1 1.0 1.3 0.9 1.0
(15.6) 5.4
10.2

137
Table 8-2 (Continued)
Operator Role/Response Category:
Other Responses: Information Taken - No Action Promised Other Response, Don't Know Response
Total
Number Percent of Cases of Cases
(974) (18.6) 329 6.3 645 12.3
5,257 100.0%
*This table is based on those calls for service that were judged eligible for police response; calls where the operator said police would not handle the problem are not included.
By examining data on times automatically recorded by the FWPD's
computer-aided dispatch system, it is possible to study the impact of
priority classifications on the speed with which units were
dispa tched. Specifical1y, we are interested in dispatch queue time,
that is, the amount of time from dispatcher receipt of a demand
message until a uni t is dispatched in response. Mean dispatch queue
time was 3.3 minutes for priority 1 calls, 6.3 minutes for priority 2
calls, and 12.5 minutes for priority 3 calls. The use of priority
classifications and the data on dispatch queue times indicate that
cal1 prioritization and response delay to less serious calls is an
important response strategy used by the Fort Worth Police Department.
About 13 percent of callers were transferred, mostly to DECOR,
the department I s report writing station (7 percent), or to other
internal units, such as detectives (5 percent). The calls handled by
DECOR represent demands that would have been handled by patrol unit
dispatch if an alternative had not been available. Another 10 percent
of callers received a referral, that is, the call taker provided the
citizen with information (including name and/or phone number) of other
agencies that might offer needed services. Of these, 6 percent were

138
referred internally, and the remainder :.'~ other private and public
agencies. Antunes and Scott (1981) found that only 4 percent of calls
were transferred, but that 15 percent were referred. Lilly (1978)
found that less than 4 percent of calls were referred and even fewer
transferred • Both studies were conducted In departments of
substantially different size and organization than in Fort Worth.
Police operators directly provided services in two contexts
invol ving no other police intervention. First, they recorded
information that citizens wanted to relay to the police and forwarded
the information internally. For example, callers gave tips to police
on the whereabouts of suspected felons, reported alarms accidentally
triggered, requested previous calls be disregarded, or asked that a
message be forwarded. Here the caller wanted only to relay
information to police, and operators performed this service by taking
the information and routing it to the appropriate location. Calls of
this type account for 5 percent of the total. Secondly, call takers
provided direct service by giving information sought by callers. In
10 percent of monitored calls, the operator disseminated police
related or other information to callers. Here again, service was
provided without any further police actioll.
Still other responses are less easily classified. The
information taken-no action promised category accounts for 12 percent
of all monitored calls. Most of these calls involved operator
responses that were vague and indeterminate. Simple phrases such as
"okay" or "I've got it" are rather common; sanetimes units were
dispatched to these calls and sanetimes not. It is possible that the
caller might have pres lUlled a unit was to be sent even though this was

139
not directly stated. These vague phrases not only make precise
determination of ultimate police response difficult, but also suggest
that call takers do not always clearly instruct callers about the
response they are to receive.
Call Disposition by Nature of Proble. Reported to Police
Examination of disposition of calls for service in terms of the
problem or crime reported to the police provides further insight into
disposition patterns. Table 8-3 is a cross-tabular presentation that
arrays general problem categories (as described in Chapter 4) as rows
and police response categories as columns. The findings in Table 8-3
suggest sane interesting patterns in call dispo si tion. Police uni ts
were promised proportionately most often in service requests involving
serious problems with persons (73 percent) and suspicious persons/
circumstances (68 percent). Units were promised more often in calls
about serious problems (both with persons and property) than in less
serious ones. Predictably, operators told callers that police would
be dispatched least often in cases concerning information or general
assistance.
The report writing al terna tive was used most frequently for
service requests related to serious and less serious property
problems. In these cases, including theft and burglary, callers were
generally given the option of making a report over the phone. Many
callers took advantage of this option, especially in cases where the
crime was committed some time prior to the report or involved smal1
amounts of property damage or loss. Again, each time a citizen call
was handled by DECOR, a patrol officer did not have to take the report
at the scene, increasing available manpower for other duties.

Problem Type:
Serious Problems with Persons
Less Serious Problems with Persons
Serious Problems with Property
Less Serious Problems with Property
General Assistance
Emergency Assistance
Suspicious Person/ Circumstance
Traffic Problem
Caller Wants Information
Caller Wants to Give Information
Ie 8-3
Crosstabulation of Operator Responses by Nature of Problem Reported to Fort Worth Police Department
(N = 5,257)
Police Operator Response
Caller Transferred to: Caller Referred to:
Unit Report Other Unit Internal External Promised Writer Alzencv Unit Agency
73.0% 0 .• 3% 0.7% 0.0% 1.4% (216) (1) (2) (0) (4)
60.3 3.0 3.9 2.0 4.8 (387) (19) (25) (13) (31)
59.4 26.3 1.9 0.6 1.1 (282) (125) ( 9) (3) (5)
44.5 21.0 0.7 1.4 1.1 (373) (176) (6) (12) (9)
27.1 1.1 9.8 8.3 5.3 (72) (3) (26) . (22) (14)
56.8 0.8 1.6 1.5 3.0 (5) (1) (2) (2) (4)
68.5 0.5 0.5 1.2 0.0 (281) (2) (2) (5) (0)
58.5 0.0 1.1 0.9 3.8 (463) (0) ( 9) (7) (30)
0.9 1.6 17.8 24.9 13.1 ( 8) (Ii}) (157) (219) (115)
16.2 10.1 9.7 7.3 2.0 (82) (51) (49) (37) (10)
Information Other Taken Given Response*
3.0% 3.7% 17 .9% (9) (11) (53)
4.5 7.9 13.6 (29) (51) (87)
1.7 1.5 7.6 (8) (7) (36)
1.7 3.8 25.8 (14) (32) (216)
10.2 7.9 30.5 (27) (21) (81 )
2.3 6.1 28.0 (3) (8) (37)
6.3 6.8 16.1 (26) (28) (66)
6.2 7.8 21.7 (49) (62) (172)
3.6 31.5 6.6 (32) (277) (58)
17.0 7.7 29.9 (86) (39) (151)
*Operator responses in this category include vague or general responses (e .• g., "okay, II ''we I 11 take care of it"), no response because none is appropriate (e.g., taped alarm messages, caller hung up), expressions of appreciation (e.g., "thanks") without any other action specified, or other instances where the response could not be determined.
.....
.:::. o

141
Callers were transferred or referred most often when they
requested or provided information to the police. In many cases police
operators did not have the informa tion desired by callers, and
transferred or referred them to police units or other agencies that
might have the information. Operators also transferred or referred
callers wanting to give information (e.g., additional information on
stolen property) to internal police units, such as detectives. In
still other monitored calls, police operators provided or took
information from callers without further transferring or referring
them. The last column of Table 8-3 lists "other responses" that, as
noted previously, were vague and could not be included in the other
more specific categories. Findings reported in Table 8-3 indicate
that disposition decisions are influenced by the type of problem or
crime reported.
Conclusion
This chapter has described a varie ty of al terna tive modes of
police response to citizen calls for service. In addition, it has
shown through data collected by the Police Communications Study that
the Fort Worth Police Department uses several types of responses when
handling calls for service. The selection of response alternatives is
inf luenced by several factors, the most important of which is the
nature and seriousness of the incident reported. Recognition of the
extensiveness of alternative response modes, including telephone
reporting and referral, suggests an important question for
consideration: What differential impacts do these alternative
response modes have? In other words, what are the costs and benefits
associated with each type of response?

CHAPTER 9
CITIZEN EVALUATIONS OF POLICE RESPONSE
While many recent studies have considered citizen evaluations of
police services received, most have concentrated on general citizen
ratings of police or evaluations of responding officer actions. Few
empirical studies have analyzed citizen evaluation of their verbal
exchange with the police call taker. Since the PCS focused on the
initial receipt and processing of citizen demands, it gathered data on
citizen evaluations of the trealJnent and responses provided by the
police operator. Citizen evaluations of their initial contact with
police are presented in this chapter. Data were collected on citizen
evaluations through a survey of individuals who had recently contacted
the Fort Worth Police Department. During the 3-month period of field
reseach more than 1,200 interviews were completed. This survey and the
methodology underlying it have been described in Chapter 2 of this
volume; a copy of the survey is included as Appendix 2 to this report.
Call Taker Treabment of Callers
Analysis of survey results indicates that most persons who called
the Fort Worth Police Department during the field research period were
satisfied with the way they were treated by the police operator that
handled their call. When asked if the police operator was courteous,
an overwhelming 97 percent replied affirms tive1y. Respondents were
also asked if they were given the opportunity to describe their
problem or incident as fully as they wanted. Again, 97 percent said
that they were able to give as much information about the matter as
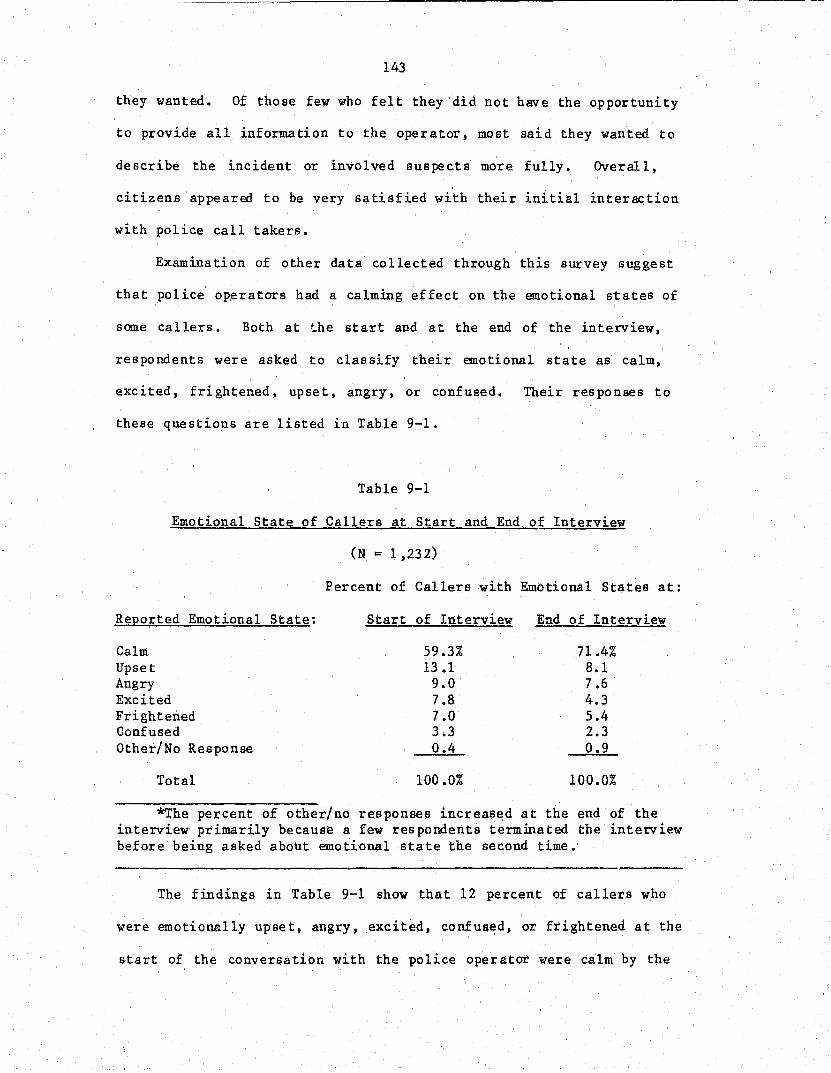
143
they wanted. Of those few who felt they did not have the opportunity
to provide all information to the operator, most said they wanted to
describe the incident or involved suspects more fully. Overall,
citizens appeared to be very satisfied with their initial interaction
with police call takers.
Examination of other data collected through this survey suggest
that police operators had a calming effect on the emotional states of
some callers. Both at ~he start and at the end of the interview,
respondents were asked to classify their emotional state as calm,
excited, frightened, upse t, angry, or confused. Their responses to
these questions are listed in Table 9-1.
Table 9-1
Emotional State of Callers at Start and End of Interview
Reported Emotional State:
Calm Upset Angry Excited Frightened Confused Other/No Response
Total
(N = 1,232)
Percent of Callers with Emotional States at:
Start of Interview
59.3% 13 .1
9.0 7.8 7.0 3.3 0.4
100.0%
End of Interview
71.4% 8.1 7.6 4.3 5.4 2.3 0.9
100.0%
*The percent of other/no responses increased at the end of the interview primarily because a few respondents terminated the interview before being asked about emotional state the second time.
The findings in Table 9-1 show that 12 percent of callers who
were emotionally upset, angry, excited, confused, or frightened at the
start of the conversation with the police operator were calm by the
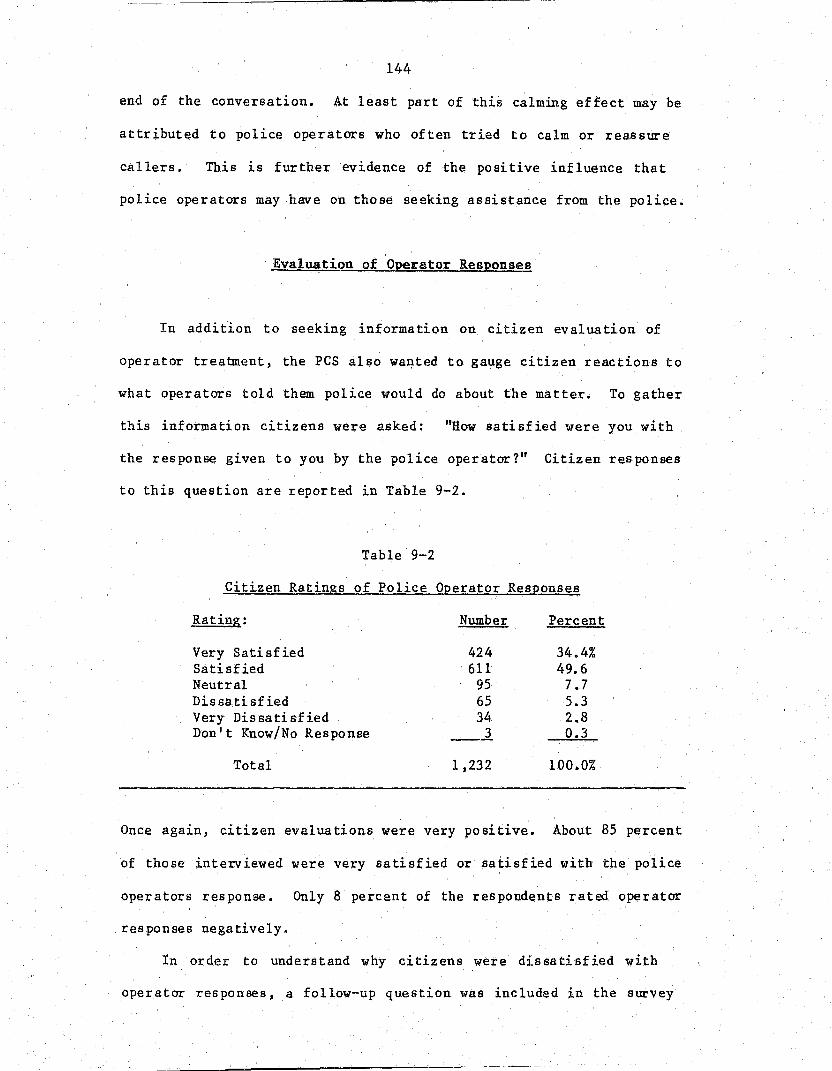
144
end of the conversation. At least part of this calming effect may be
attributed to police operators who often tried to calm or reassure
callers. This is further evidence of the positive influence that
police operators may have on those seeking assistance from the police.
Evaluation of Operator Responses
In addition to seeking information on citizen evaluation of
operator treatment, the PCS also wa~ted to gauge citizen reactions to
what operators told them police would do about the matter. To gather
this information citizens were asked: "How satisfied were you with
the response given to you by the police operator?" Citizen responses
to this question are reported in Table 9-2.
Table 9-2
Citizen Ratings of Police Operator Responses
Rating: Number Percent
Very Satisfied 424 34.4% Satisfied 611 49.6 Neutral 95 7.7 Dis sa ti sf ied 65 5.3 Very Dissatisfied 34 2.8 Don I t Know/No Response 3 0.3
Total 1,232 100.0%
Once again, citizen evaluations were very positive. About 85 percent
of those interviewed were very satisfied or satisfied with the police
operators response. Only 8 percent of the respondents rated operator
responses negatively.
In order to understand why citizens were dissatisfied with
operator responses, a follow-up question was included in the survey

145
that allowed callers to provide multiple reasons for their dissatis-
faction; several gave more than one response, as listed in Table 9-3.
The total number of res ponses is 201 because mUltiple responses were
allowed.
Table 9-3
Reasons for Citizen Dissatisfactio~ with Police Operator Responses
Reason:
Operator Seemed Unconcerned Operator Was Rude, Abrupt, or Discourteous Operator Did Not Promise Unit Would Be Sent Operator Asked Too Many Questions Insufficient Information About Police Response Operator Was Slow in Sending Police Unit Operator Did Not Take Caller or Problem Seriously Requested Service Not Promised by Operator Operator Hung Up or Was Cut Off Other Reasons
Total
Number
26 23 20 20 19 14 13
7 7 ~
201
Percent
12.9% 11.4
9.9 9.9 9.4 7.0 6.4 3.5 3.5
25.9
100.0%
The data reported in Table 9-3 suggest that several reasons
account for citizen dissatisfaction with operator responses, although
again it is important to note that most citizens ~ satisfied with
the response communicated by the operator. The most frequent
complaints were that the operator was rude, abrupt, discourteous, or
seemingly unconcerned about the caller or the problem. Other callers
were displeased because the operator would not send a unit or because
some other service was not provided. Still other reasons for
dissatisfaction centered on delays in sending police units. Callers
complained both that units were not sent quickly enough and that
operators asked too many questions. Thus, while caller
dissatisfaction with operator responses was relatively infrequent, it
stemmed from several different sources.
146
Citizen Evaluation of Report Writing
As described in previous chapters, the Fort Worth Police
Department uses report writing as one alternative means of handling
calls for service. Citizens reporting problems where immediate police
response is unnecessary, including reports of burglaries and missing
persons, are often transferred to a DECOR report writer. This person
speaks with the caller and completes a crime or other police report
over the phone. In some but not all instances, callers are given the
option of making a report over the phone or having an officer come out
to complete the report.
The clientele survey utilized by the Police Communications Study
provided an opportunity to examine citizen evaluation of the report
writing alternative. Of all interviewed citizens, 73 (6 percent) said
that they had been transferred to a report writer. Most often, these
individuals were reporting thefts, missing persons, or vandalism. Of
those individuals who had contact with the report writing station, 60
(80 percent) said they were satisfied to give their report over the
phone. Another 12 respondents (16 percent) said they would have
preferred that an officer come out and take the report. Thus, while
this analysis is based on a small number of cases, the findings
provide some evidence that citizens may be satisfied with response
alternatives other than the dispatch of a police unit to the scene.

147
Conclusion
The findings from the survey of individuals who had recently
contacted the Fort Worth Police Department indicate that most callers
were generally satisfied with operator treatment and response. Those
few who were dissatisfied tended to be unhappy about operator demeanor
(i.e., rudeness, discourteousness), delays in police response, or the
unwillingness of police to provide desired services. Overall, most of
those individuals who gave crime reports over the phone were satisfied
with this form of initial police response.

CHAPTER 10
SUMMARY AND IMPLICATIONS FOR PUBLIC POLICY
This volume has documented patterns and variations of citizen
demands for police service in Fort Worth. It has attempted a detailed
discussion of the kinds of demands placed on the police and the
responses they initiate. The discussion of demand patterns by various
time periods, caller characteristics, and neighborhood demographic
conditions provides information that should prove useful to police
observers and administrators interested in deterndning the kinds of
problems citizens expect the police to handle, and in devising means
of handling them. This chapter summariz es maj or findings, assesses
their implications for policy development, and suggests some avenues
of further research.
Overview of Major Findings
Types of Citizen Deuands
The range of service requests received by the police is
extraordinarily broad; calls to the Fort Worth Police Department as
monitored by the Police Communications Study (PCS) confirm this fact.
Demands involve both life-threatening situations and mundane problems
totally unrelated to the mandated police functions of law enforcement,
crime control, order maintenance, and assistance to citizens. To
place demands in a context that could be understood and discussed, PCS
researchers grouped calls for service into several general problem
ca t';igo'.:ies. The types of calls in each category were specified, a
step that is lacking in many discussions of citizen demand patterns.

149
pes observation showed that only about 15 percent of citizen calls to
the police involved serious problems with persons or property; less
serious problems were reported twice as frequently as serious ones.
Traffic problems represented one of the largest single sources of
demands, about 17 percent of calls. Additionally, more than one fifth
of observed calls were either requests to obtain or Qffer information.
These calls do not appear in police records, which are limited only to
those calls judged eligible for patrol unit dispatch. There were
significant difference s in demand patterns by neighborhood type.
About three fourths of the time, persons calling the police made
only a general, or implied, request, often by simply reporting the
existence of a parti cular si tua tion that they felt might require
police intervention. Callers requested that the police take a
specific action such as sending a patrol unit, arresting a person, or
taking a report at the scene in only 23 percent of the monitored
calls. Of course, as several studies have shown, the most common
police response is to dispatch a unit. This fact may account for the
relatively infrequent number of specific service requests observed;
callers often presume that the normal respc..J.se will be to dispatch a
car.
Variations in Demand Patterns
Although the content of citizen demands for police service has
been the subject of several empirical analyses, very little work has
assessed variation in demand patterns by factors such as time periods,
caller characteristics, or neighorhood context. Instead, some
pa tterns have become widely accepted as ref lective of the truth. Our
analy sis supports some of these "truths," but casts doubt on others.

150
Variation by Time Periods
According to common belief, the volume of demands on police
increases dramatically during the weekend, particularly on Saturday.
Both data gathered by PCS researchers and that from FWPD records
support this belief: call volume in Fort Worth was greatest on
Fridays and Saturdays. Another common belief is that demand vol~e is
greatest during the evening hours; again this was borne out by FWPD
call records. The largest number of calls were received between 9 pm
and midnight, while the fewest were received between 3 am and 6 am.
The volume of demands in most of the problem categories generally
increased from about 9 am to midnight, although more property problems
than problems with persons were reported dur ing the morning hours.
This may ref lect the opening of busines ses for daily trade and the
discovery of weekend break-ins and cares of malicious mischief.
A third widespread perception is that demand volume changes by
month, or at least reflects seasonal changes; interpersonal conflicts
and violent crimes against persons are often thought to increase
during the summer. FWPD data reflect no significant monthly or
seasonal changes in demand patterns, however, although there was a
slight summer increase in call volume in 1980. Whether this is
symptomatic of most police depratments or a reflection of Fort Worth 1 s
relatively moderate climate, which might level out seasonal
fluctuations found in northern cities, is unknown. This question is
not adequately ansTflered with data for only one year.
Variation by Caller Characteristics
When analyzing variations in demand pa t terns according to caller
characteristics, we found that private citizens were more likely than

~~~--~------
151
business representatives to report problems with persons~ suspicious
circumstances, and traffic problems. They were equally as likely to
call about serious problems with property, while business callers more
often reported less serious problems with property, including burglar
alarms which were often unfounded. While busines s callers offered
information to police more often, many of which were reports of
accidentally triggered or unfounded burglar alarms, private citizens
made more, and widely varied, requests for information.
The racial distribution of persons calling the police closely
paralleled that of the general population. Black and Hispanic callers
were more likely than whites to report problems with persons and less
serious property problems, a finding that may ref lect higner crime
rates in neighborhoods inhabited by minority residents. In our
analysis of calling patterns by neighborhood, we found that black and
Hispanic neighborhoods had higher call rates for these problems.
More than 90 percent of persons who called the police were calm,
or at least outwardly calm as determined by voice and speech patterns.
While we adopted a conservative coding scheme that may have inflated
caller calmness somewhat, the strength of this finding belies the
claim that most people who call the police are emotionally distraught.
Those people who were upset, frightened, or confused, however, were
usually calling about a serious problem with persona, one expected to
engender such emotions. These calls are obviously important and call
-for careful yet efficient handling by call takers. The maj ority of
calls to police, though, do not involve such problems, and callers for
the most part make their report or request in a calm manner. This
does not imply that most callers are clear, concise, or organized,
however. A calmly articulated request is not necessarily a carefully

152
articulated request, and police call takers frequently have to probe
to determine the precise nature and intent of the citizen's call.
Deaand Patterns by Neighborhood
Characteristics of the area from which calls originate may be
contextual influences on both the volume and types of demand for
police services. These factors include land area, population density,
racial composition, and land use patterns. PCS researchers examined
these variables at the police beat level, using various data sources
and sta ti sti cal techniques to derive estimates of neighborhood
characteristics. We found tremendous variation in population, income,
and land area by neighborhood. Some beats, for example, contained
families with median incomes of less than $6,000 per year while others
were populated by families earning nearly $30,000 yearly. Land area
of police beats in Fort Worth ranged from less than one fourth square
mile to 76 square miles. Population density, land use, and racial
composition showed similar ranges across the 90 beats.
Just as demographic and geographic characteristics varied
tremendously across beats, so too did the number and percent of calls
for service of different types. The distribution of demands followed
clearly discernable patterns. Analysis showed a clustering of calls
about problems with persons and serious property problems from lower
income, high density areas, while less serious property problems were
reported proportiona tely more often from more affluent neighborhoods.
This clustering was confirmed by correlation analysis at the
neighborhood level which indicated that the relationship between calls
about problems with persons and serious problems with property was
t ! ,

153
strong and positive. Additionally, reports of suspicious persons or
property were positively correl ated with reports of less serious
property problems, and both came primarily from more affluent areas
loca ted on the out skirts of the city. These areas are charac teriz ed
by a low minority population, lower population densi ty, high median
family incomes, and low concentr ations of busines s or commercial
establishments. Areas with high concentrations of black residents and
high population density, on the other hand, generated a large number
of reports of problems with persons and serious property problems.
Neighborhood land use also affects the kinds of problems reported
to the police. The extent of land used for residential purposes was
positively related to calls about persons, serious property problems,
and suspicious persons; it was negatively related to requests for
general and emergency assistance and reports of traffic problems.
Surprisingly, the proportion of land devoted to commercial use in a
beat was negatively related to serious problems with property
(burglary, theft) and showed no significant relationship with less
serious property problems. l
Police Response to Service Deaands
Until recently, most research on citizen demands has overlooked
the full range of call taker responses, concentrating instead on
whether a unit was dispatched. Concern over developing more efficient
response strategies has causf2d an upswing in interest in dispatch
alternatives as well as in call takers themselves. The call taker has
a variety of actions that can be applied to incoming calls. A first
task is to screen the call for eligibility; is it sui table for some

154
type of police handling? In Fort Worth, about 9 percent of calls
received were not handled by the police. Some were ruled out because
they were ineligible for service; they concerned problems occurring
outside the jurisdiction or involved minor disputes occurring on
private property. Other calls were not handled because they involved
problems outside the stated domain of the department; they concerned
services that were not provided (vacation checks), civil matters, or
disputes that were technically nonpolice matters. Several other
reasons for not providing service were offered, but in a substantial
proportion of these calls, even though the operator promised no direct
police assistance, some help was provided through referral.
After assessing eligibility, call takers must select a respon~
al terna tive. They can route the request to dispatchers, refer or
transfer the caller to other sources of information or assistance,
and/or provide information directly to the caller. In Fort Worth,
more than 40 percent of callers were told that a police unit would
respond to their request. This number may underestimate the
proportion of calls that were ultimately answered by a patrol unit,
however. Some callers who asked that a unit be sent were offered a
noncommittal "okay," "yup," or "we'll take care of it" response that
left eventual call disposition uncertain.
About 13 percent of Fort Worth callers were transferred to other
offices, many to the department's report writing section where reports
were taken from citizens directly over the phone, eliminating the need
for unit dispatch. Ten percent of callers were referred elsewhere,
many to units within the department, such as de tectives or line
supervisory personnel. Operators provided information directly about

ISS
10 percent of the time; in these cases, no other police uni ts were
contacted about the matter. Operators also received and relayed
information within the department in about 5 percent of monitored
calls. In these instances, callers merely wanted to pass along
certain information to specific persons or offices.
Call dispo si tion varied according to the type of problem
reported. As expected, calls about serious problems received a
dispatched unit more often than did calls about less serious ones.
Referral to report writers often occurred as a result of calls about
property problems, especially when the crime had occurred scme time
before the report was made. Operators frequently ref erred callers
desiring information, as well as those wanting to provide the police
with information. Clearly, the selection of a response alternative is
strongly influenced by the nature and seriousness of the incident
reported.
Citizen Evaluations of Police Response
General citizen evaluations of police services have failed to
include reviews of call taker behavior, even though many callers deal
only with telephone operators when contacting the police. Analysis of
surveys of more than 1,200 persons who called the Fort Worth Police
Department reveal almost universal satisfaction with call takers: 97
percent felt that operators were courteous and allowed them to give as
much information about the matter as they desired. About 85 percent
of those interviewed were satisfied with operator response. The few
dis sa ti sf ied callers were unhappy with operator demeanor, delays in
police response, or police unwillingness to provide desired services.

156
We noted earlier that more than 90 percent of persons who called
the pol ice were outwardly calm, as judged by pes observers. When
citizens were asked about their emotional state at the start of their
call, however, less than 60 percent recalled that they felt calm; the
remainder were upset, angry, excited, frightened, or confused. By the
end of their conversation with the police call taker, though, an
addi tional 12 percent sta ted that they were calm. Although just
talking to the police and being told that something will be done about
the reported problem may have a calming influence, part of this effect
may be attributable to specific operator actions, assurances, and
information provision.
Finally, the PCS attempted to evaluate the FWPD's report writing
unit. Citizens who reported crimes to which immediate police response
would make lit tIe difference, such as burglaries or mis sing persons,
were often transferred to a civilian report writer. The caller could
provide information by telephone that otherwise would have been
gathered by an officer at the scene. Only 6 percent of respondents
had been transferred to a report writer, but four fifths of those
transferred were satisfied to give their report by phone, evidence
that citizens can be satisfied with response alternatives other than
unit dispatch.
Implications for Public Policy
Police Communications Study findings speak clearly to issues of
current concern to both the police and the public, including police
efficiency in handling ever-increasing demand levels, the structure of

157
possible alternative responses to unit dispatch, police organization
for call handling and patrol deployment, the nature of the police
role, the effects of initial police call processing, and ultimately,
the nature of police performance. We begin our assessment of these
issues where we began back in Chapter 1, with a discussion of several
reasons why exam ina tion of citizen demand pa tterns is an important
issue for both the police and the public.
Citizen Demand and the Police Role
Research during the past decade has established that police are
called upon to do much more than fight crime and enforce the law.
Numerous analyses of both citizen demand and dispa tched calls for
service have shown that performing law enforcement functions is less
common than order maintenance, provision of emergency and routine
assistance, and even information provision. Results of our study
document what has been accepted among police observers for some time.
The problem has been to encourage the police to accept a role that not
only includes, but is often dominated by, noncriminal service
provision. This role may include activities which to seme
administrators and officers do not constitute "real police work."
There seems a widespread fear that this recognition somehow undermines
both their collective authority as primary agents of social control
and their individual respect as tough, hard-nosed law enforcers (a
role that is often self-defined and administered through discretionary
actions in encounters with citizens).
The genesis of how and why the police have come to view
themsel ves, and to a large extent have come to be viewed by the

158
public, primarily as law enforcers and crime fighters is best left to
others. Likely it is a residue of the turbulence of the 1960s plus
the effect of the popularity of television police shows that garnered
high ratings through presentation of stylized, simplistic good versus
evil violence. In any case, police departments as originally
conceived in America were charged with preserving pub lic order,
safeguarding manners and morals, and protecting property. Solving
crime was not initially considered a police responsibility
(Rubinstein, 1973).
There is, of course, no returning to an era when crime was simply
not as widespread as it is today. Crime is significant, it will not
disappear, and the police are one obvious mechanism to help deal with
it. Nevertheless, it seems vital to reconcile at the operating level
the variety of tasks the police are called upon to perform with the
more limited functions some officers recognize as legitimate police
business. Demand analysis coupled with examination of police
response, such as that contained in this report, represent strong
evidence that the public considers the police to be a multifaceted
service providing organization. This fact must be impres sed upon
officers to eliminate some of the lingering resentment toward many
noncriminal service-oriented tasks.
One way would be to expand entry-level training curricula to
emphasize the diversity of the modern police role and to renind
recruits of the beginnings of the watchman system in the United
States. This could improve officer performance of service-oriented
tasks. This step has been taken by many departments, particularly in
relation to domestic crisis intervention, handling public drunkenness
159
in locales where such a condition is no longer a crime, or other areas
that often border on the criminal or could potentially escalate into
criminal incidents. A prior requirement for the creation of
successful and innovative training programs emphasizing the importance
of the police order maintenance and social service roles is acceptance
of the value of performing these roles by top police administrators.
The Effect of Citizen Demand on Police Manageaent and Planning
Data on citizen service demands have had one major use ~n many
police departments; call volume, along with the number and patterns of
crimes committed, has been used to structure patrol districts and
de termme unit deployment. Departments often attempt to distribute
patrol division manpower across districts by equalizing district call
vOlume. 2 Patrol district or beat boundaries are periodically altered
to reflect changes in residential population, commercial development,
or other factors that affect demand volume. Patrol beats and
districts vary greatly in size according to the workload generated.
Similarly, the number of officers assigned to a given area may be
based on expected call volume. Demand Can even affect patrol
strategies. Beats in areas that generate relatively few calls may be
quite large, and assigned units widely spread. For serious or
dangerous calls, response time for back-up cars from within the beat
or from neighboring beats may be slow. Consequently, some departments
have assigned two-officer cars to larger beats.
There has been an emphasis on equalizing call volume;
insufficient consideration has been paid to call content in decisions
regarding beat design and patrol deployment. Andy si s of demand

160
patterns by neighborhood showed considerable differences in the types
of problems reported. Persons from high density and low income areas
called frequently about assaults, fights, domestic disputes, and
burglaries. Callers from areas on the city's outskirts, where
neighborhoods were composed primarily of white, middle- or
upper-income residents, were more concerned with less serious property
problems, including vandalism. Callers from commercial strip
developments and areas containing maj or thoroughfares reported
numerous tra£!ic accidents and burglar alarms.
Instead of attempting to equalize the volume of calls for service
from patrol beats, police planners should consider beat-level
diversity in calling pa tterns. Clearly, diverse neighborhoods may
generate different patterns of demand. Beats might be created to
reflect the types of demands generated a.s well as call volume.
Additionally, patrol deployment strategies that do not consider demand
content may be inefficient in that they may overcommit patrol
personnel to areas domina ted by predominantly minor problems. Not
only do different nE.ighborhoods generate varied demands, but the
officer time required to handle them also varies by incident type.
Officers responding to serious person or property problems, including
assaults and robberies, may spend much longer at an incident scene
than officers responding to less serious problems. Some demands may
also strain patrol resources by requiring the presence of several
back-up cars for long periods.
Data from FWPD records for the 3-month study period indicate that
the average time officers spent handling dispatched calls is 42
minutes. l Table 10-1 demonstrates, however, that calls about serious

161
incidents require officers to be on the scene much longer than do
calls about less serious problems. Calls about serious problems with
persons and property required, on average, about an hour to handle,
while calls about less serious problems with persons or property
required less than half an hour of officer time. Calls about
suspi dous circumstancse generally required the least time to hand Ie,
an average of 23 minutes, largely because many of these calls were
unfounded. Emergency assistance calls, often personal injury traffic
accidents, kept officers on-scene nearly an hour and one half per
call.
Table 10-1
l<Iean Time Officers Spend On-Scene, by Type of Call
Number of Mean Time, Problem Category: Calls in Minutes
1. Serious Problems with Persons 1,721 63.2 2. Less Serious Problems with Persons 7,924 29.8 3. Serious Problems with Property 5,302 56.1 4. Less Serious Problems with Property 5,479 26.9 5. General Assistance 2,750 52.8 6. Emergency Assistance 1,065 87.6 7 • Suspicious Person or Property 2,748 23.0 8. Traffic Problems 5,897 56.3 9. General /Unspecif ied Request 8.883 38.5
Total Calls 41,769
Mean Time Per All Calls 42.3
Data to analyze calling patterns and patrol force workload by
neighborhood are available to most departments. Those which have
installed CAD systems with gea-coded address files can easily fenerate
relevant data. Many conventional departments maintain computeri.z ed

---------------------------------------------------------~
162
call/dispatch records that could also be adapted for this purpose.
Departments should consider using these data to design beats by
examining problems common to an area and the officer time required to
handle them. Analysis of neighborhood demand patterns might also
allow departments to pinpoint areas in which parti cular types of
problems are concentrated and establish directed patrol or specialized
programs to deal with them. It is not clear whether the creation of
patrol districts and beats and the resulting distribution of personnel
on the basis of equalized call o'c crime volume grew out of a common
sense approach or simply f~o~ convenience. Police administrators and
patrol planners should at least consider an alternative method to
officer deployment, one based not on equalization of demand volume,
but on assessment of demand patterns and resulting officer time
alloca tions.
Call Processing and Police Response
How police employees receive, interpret, and dispatch citizen
calls for service -- initial police call processing -- influences
police performance. This fact has been largely ovp.rlooked by police
observers and administrators who, in an effort to improve response
capability, have concentrated on the technology of police response
(CADs, automatic vehicle monitoring, 911) rather than on the actors
and processes involved in answering service requests. In fact, the
most attention has been directed to patrol unit response and officer
activities during ent'ounters with citizens. But police response to
demands involves the activities of call takers and dispatchers as well
as of field personnel.

163
We noted in Chapter 1 that call processing may include three
functions: demand receipt and res ponse determination by police call
takers, message transfer from call takers to dispatchers, and for some
calls, patrol unit dispatch. Call takers act as gatekeepers,
determining service request eligibility and interpreting demand
signals. Dispatchers are response coordinators, determining the
specifics of agency response and monitoring unit status. Both
operators and dispatchers maintain considerable discretion when
performing their tasks. Call takers must code diverse demands into
terminology that can be understood and acted upon by other department
personnel. They determine both complaint and response priority codes
with only a modicum of supervision. Initial demand interpretation by
call takers influences not only whether a unit will be sent, but
whether a caller will be referred, transferred t provided information,
or receive no assistance at all. Dispatchers sequence calls within
priority codes; faced with a backlog of pending calls, they must
choose the next call to be dispatched.
Analysis of PCS data showed that dispatchers were involved in
processing only about 40 percent of calls received; the remainder were
handled by call takers, without patrol unit dispatch. This finding
indicates the importance of the operator gatekeeping function; for
many service demands, call takers are the only police official with
whom citizens interact. Call takers process a significant proportion
of demands themselves, with no assistance from others. They also
divert demands from the patrol function by referring callers to other
sources of information or assistance.
164
Despite their importance to call processing and their role as
direct service providers, police telephone operators are generally
poorly paid, poorly trained, and unsupervised. For any agency that
relies on the telephone for so much of its dealings with the public,
it seems odd that as important a function as gatekeeping has received
so little attention. About the only time call takers are noticed is
iD. those unfortunate instances in which their mistakes result in
improper police response and eventual harm to a caller.
As we have argued elsewhere (Scott and Percy, 1980),
administrators should pay closer attention to their complaint taking
function. At present, few departments har/e instituted entry-level
training programs for call takers; most training is provided
on-the-job. As a result, operators may become proficient in handling
phone answering equipment, but not neceS sarily in interpersonal
relations. No major company whose business involved telephone contact
with custcmers would employ an operator untrained in the techniques of
efficiently eliciting and providing pertinent information; this is
precisely what many police departments do, however. A brusque or rude
manner can be disconcerting to callers J creating ill will or mistrust.
Basic training that emphasizes telephone conversation techniques,
including suggestions on calming distraught callers, eliminating
unnecessary caller verbiage politely, and efficiently probing to
determine relevant details could improve police telephone operations
significantly. This training might a1 so encourage operators to
careful1y spell out the expected police response rather than offering
an inde terminant "yup" or "okay" which tell the caller very lit tle.
I I
I
165
We have noted the scope of call taker and dispa tcher discretion.
This is a necessary aspect of both jobs. Situations brought to police
attention are so diverse and involve so many variables that concise
rules of operation would be unworkable. Nevertheless, increased
supervision of police call processing may be desirable. The
technology exists to make supervision a simple matter. Most
departments tape record all operator and dispatcher transmissions.
These might be reviewed periodically, as the FWPD does, to asses s
individual performance. This review need not be conducted while the
individual ~s on duty, but could be accomplished at the supervisor's
convenience. Tapes could be reviewed for flaws in both operator
technique and decision making, and could be used for instructing both
the transgressor and incoming call processors. Much of what currently
passes for call processing supervision is simply making relative
comparisons of the number of calls each operator handles during a
shift. Call volume handled should not be equated with performance;
supervisor time might be better spent trying to improve telephone
techniques or radio transmissions. Tl.1e cost of such improvements
should prove minimal compared with the potential improvement in
service rendered. Not only would the public be pleased, but
responding officers surely would appreciate receiving accurate and
complete information about a situation prior to arriving at the scene.
This link between initial police response and eventual serv~ce
provision has been largely ignored and deserves more attention from
police administrators.
---~ I
I
I

166
Citizen Deaand and Alternative Police Response
This volume has noted the importance of developing alternatives
to traditional patrol unit response to citizen demands. Before
various al terna tives can be identif ied and evaluated, we must
determine what the police are asked to do and how they respond. Most
callers requesting police action expect that a unit will be dispatched
to the scene, an expectation stemming from the belief that citizens
will be satisfied only if an officer responds in person.
Data presented in Chapter 8 indicate that, at least in Fort
Worth, the police use a variety of responses to handle demand. Units
were dispatched in less than half the calls received. Many calls,
including those involving crimes, were ref erred to the department I s
reporting writing section, where a report was completed by telephone.
Other calls were referred to internal or external sources. Some calls
were transferred to internal bureaus, while others were handled
directly by call takers. For various reaso~s, some calls were refused
service altogether. Although no data were collected on the relative
costs of these various response alternatives, it is likely that any
response supplied by telephone will be less costly than one requiring
patrol officer dispatch. Just as important, however, is our finding
that citizens were generally satisfied with at least one
"nontraditional" form of response, telephone report writing. Our
results parallel those of Cahn and Tien (1981) who found that the
public in Wilmington accepted response delays, tGlephone reporting,
and other nondispatched responses. These preliminary findings are
encouraging and should spur departments to review demand patterns in
their communities to determine what response alternatives might be

167
appropriate. A large part of the success of any alternative will
involve careful explanation by call takers of the optio~s available to
the caller and the reasons why particular options are being invoked.
There is still a great deal to learn about the impacts of
response alternatives, especially as they may relate to subsequent
handling of cases and overall police performance. Departments must
weigh both the benefits and costs of embarking on a program of
organized alternative responses to demands for service. One potential
negative factor, as yet unmeasured, is the potential trade-off between
cost efficiency and benefits of direct citizen-officer contact. While
handling a demand by telephone may be less costly in the short run, it
may not generate less tangible benefits such as citizen-officer trust,
obtaining useful evidence, knowledge about a situation that could
benefit the officer in a later encounter, and an overall feeling of
goodwill toward the department. Even if officer presence at the scene
of an incident, such as a burglary that has occurred previously,
results in no gain ~n solving the crime, it may make the caller more
sympathetic toward the police and more willing to call at same future
time. Also, do report writers, who are often civilians, prepare
reports of the same quality as field officers? Are referred callers
likely to receive services from other agencies or are persons excluded
from traditional patrol unit response unlikely to obtain needed
services? And what impact does res ponse delay have on crime and
noncrime situations? Answers are needed to questions such as these
before a careful assessment of response alternatives can be achieved.
All of the suggestions presented thus far point in the same
direction: to process and respond to citizen service demands

168
efficiently and effectively, police administrators must pay much
closer attention to the development and implementation of departmentru
rules and policies about handling calls for service. Police
communications have often been viewed simply as an internal support
function for the more important tasks performed by the patrol
division. We have tried to demonstrate. that the call proces sing
function plays not only more than a supporting role, but in fact often
determines the nature of police response. For many callers, call
takers ~ the police. For dispatched ca11s, call taker coding
decisions affix an identity and a response priority that represent
reruity at least until the responding officer has a chance to make a
different determination. Dispatcher queuing decisions guide the speed
of police response for calls with equal priority.
With little or no guidance from departmentru rules, and with the
usual lack of supervision from superiors, call processing personnel
are often left on their own when making crucial decisions that can
conceivably involve life and death, psychological trauma, or simple
unpleasantnes s. While the nature of the call processing functions
requires individual discretion, that discretion can be bounded to a
degree by careful administrative attention to rule making,
supervision, and individual performance review. Concomitant with the
development of formal rules should be an upgrading ~n status of call
processors, and a recognition of their central role ~n policing.
Directions for Future Research
The past 10 to 15 years have seen a tremendous growth of interest
in and research about policing. Al though areas such as police

169
communications, call processing, and noncriminal service provision
have received less attention than, for example, the patrol or criminal
·investigation functions, they too have been the subjects of interest
among some observers. Given this recent research, including that
reported in this volume, are there any remaining unanswered questions,
and what are the next logical avenues of research?
Development of Coaparative Data
One obvious need in assessing patterns of citizen service
requests is a valid basis for comparison across departments. At
present there is no standard set of complaint codes that can provide
an accurate basis for comparing demands. Additionally, most analysts
of citizen demand have not described how complaint codes were defined
and grouped into the general categories they normally report. While
some of these problems are being addres sed by an on-going research
project (National Institute of Justice, 1980), it will take a
concerted effort among those who are interested in c~tizen demand to
begin to provide a basis from which comparisons can be generated.
Even if comparative data can be developed, large-scale comparison
on the basis of general categories masks the diversity of demands.
Each of the general problem categories discussed in this report
contains several different types of crimes and problems. At the
individual level, however, each type of incident reported may pose a
significantly different problem for the officer who responds. A
domestic disturbance code, for example, could describe a fight between
husband and wife, an argument between a couple living together, a
drunken brawl among several brothers, a mother's struggle to have her

170
retarded daughter committed to an institution, or any number of other
scenarios. Each one presents a different psychological, physical, and
legal challenge to the police. Even if a call taker is able to elicit
information differentiating among these types of problems, each
incident will receive th~ same complaint code. The accompanying
information on the complaint card then becomes crucial, as does
whether or not this information is passed along to responding
officers.
At one level, then, development of comparative data may be
extremely useful in settling the issue of the types of demands made on
police. At another level, this type of analysis sheds little light on
what police actually do in response to demands. An ideal, yet costly,
research design would incorporate a means of observing calls for
service from initial receipt through call proces sing, dispatch,
officer receipt, and officer field response. We have suggested that
the demand information officers receive when dispatched may help
prepare them for handling the incident and to find the location
quickly. It would be interesting to determine precisely what effect
demand information has on responding officers, how it influences their
mental preparation and actual case handling, and how ofterr an incident
as dispatched is coded the same as on the officer's activity report.
To conduct such analysis at the general level would be extremely
difficult. This is the problem addressed by Goldstein (1979: 246) in
his argument for a "problem-oriented policing";
It seems desirable, at least initially in the development of a problem-solving approach to improved policing, to press for as de tailed a breakdown of problems as po s 8i ble. In addition to distinguishing different forms of behavior and the apparent motivation, as in the case of incidents commonly grouped under the heading of [domestic

171
disturbance], it loS helpful to be much more precise regarding locale and time of day, the type of people involved, and the type of people victimized. Different combinations of these variables may present different problems, posing different policy questions and calling for radically different solutions.
One future research approach might be to identify a single
problem, review police tape recordings to determine the factors
inf luencing the operator's coding decision, determine through direct
observation and officer interviews how dispatched information affect"s
subsequent police actions, and evaluate the nature and effectiveness
of police response, p~rhaps with interviews with relevant citizen
participants. Such research would be difficult to design and costly
to execute, but if done properly, would pinpoint the nature of citizen
demand about and police response to a single issue, determine how call
taker and dispatcher decisions affect the subsequent police-citizen
encounter, identify alternative responses where applicable, and assess
police performance.
Costs and Benefits of Police Response Alternatives
Such an approach suggests the importance of evaluating the costs
and benef its of various police and noupolice al terna tives to
traditional patrol unit response. Several recent studies, including
this one, have identified and discussed various approaches to handling
demand that are designed to reduce patrol force workload and
department costs while maintaining present service levels and citizen
satisfaction with them. These alternatives include telephone report
writing, planned res ponse delays, referral" to other sources of
assistance, police call-back options, and walk- or mail-in reporting
systems, among others. Before any of these al terna ti ves are

172
instituted on a large-scale basis, they should be carefully evaluated,
with particular emphasis on their costs to the police and the public.
To this point, such assessments have been few and widely
scattered. They should consider not only actual dollar costs to
departments, but opportunity costs as well. By not sending an officer
to the scene immediately, or at all, how likely is it that police will
lose the chance to gain valuable informa tion that could lead to
solving a crime or arresting a suspect? What are the trade-offs
between reducing patrol force workload and generating citizen goodwill
with prompt, courteous response? How is citizen evalua tion of
alternative responses affected by call takers telling callers
precisely what their options are, what to expect from police, and when
to expect it? Convincing evidence in support of response alternatives
will likely be required to achieve widespread acceptance of changes in
traditional police response patterns.
Police Operator and Dispatcher Performance
Another unexplored area for further research is the effect of
training and supervision on police call takers and dispatchers. It
would not be difficult to design an evaluation of the effects of
training and supervision on operator and dispatcher behavior; a
pretest-post test design could incorporate elements such as courtesy to
callers, number of times ~perators asked for information already
provided, number of calls handled, amount and content of information
recorded, amount and content of information reI ayed to officers,
degree of probing for information, average length of conversation, and
many other factors. To our knowledge. such a study has never been
173
considered, perhaps because of the relatively low esteem in which
police call processing personnel are generally held by administrators
and officers. Controls for length of service, sworn/ civilian
distinctions, and even job assignment (some communications personnel
are qualified both to answer and dispatch calls) could be instituted.
Baseline data could he collected and compared to data gathered after
training or supervision intervention was made; the result could be a
significant analysis of factors affecting call processor performance.
An important component of such a study would be to assess the
relative costs and benefits of training. Training programs may be
co stly. Departments might be more reluctant to let a trained call
taker or dispatcher move on to another job than they are now, but
increased tenure might require an upgraded pay scale. This cost would
have to be weighed against that of hiring and training new people at
lower pay rates. Would increasing training increase pay scales, job
tenure, and ultimately performance?
Another measure of operator/dispatcher performance could be
evaluations of behavior both by citizen callers and field officers.
The Police Communications Study contained some elements of this
approach, and found that citizens in Fort Worth were very satisfied
with their contacts with call takers. Further research is required to
determine if this was the result of a conscious effort by FWPD
administrators to provide excellent service during the study period,
symptomatic of only a single department, indicative of callers'
inattention to their contacts with call takers, or a typical response
found in most communities.

174
The Need for Neighborhood Contextual Analysis
This study represents, to ;;,ur knowledge, the first attanpt at
analyzing citizen demand patterns by neighborhood type. Much more
work is required in this area, especially if it is to be used as a
source for designing patrol beats. One requiranent is a means of
identifying commercial strip developments, those areas of wholesale
and retail establishments that are found in many urban neighborhoods.
They may contain neighborhood groceries, fast-food franchise
restaurants, local taverns, general merchandise outlets, or any number
of other busines ses. If located within an otherwise primarily
residential beat, they may generate very different sets of demands
than would otherwise be expected. Police planners need to keep them
in mind when considering patrol deployment strategies. Unfortunately,
this will probably require special data collection efforts, as land
use data is often imprecise and of little use for police purposes.
A related research topic might be to determine if there are
differences in citizen expectations about desired police service by
neighborhood type, and if so, what implications they might have for
police response. Our analysis has shown that residents in different
neighborhoods call the police about different types of problems. We
have only speculated as to why this is the case. Residents in some
areas, for example, may desire the police to perform an active order
maintenance role, one designed to reduce neighborhood incivility by
rousting drunks, breaking up groups of youths, and challenging
strangers to identify their business. Residents of other
neighborhoods may favor a reduced police presence, preferdng that the
police be as inconspicuous as possible. Demand data, coupled with

175
direct input from residents, could help police understand what is
expected of them and act accordingly.
Still another research question concerns the propensity of
citizens in different neighborhoods to call the police about crimes
and other police-relevant problems. An implicit assumption in the
contextual analysis p:J:'esented in Chapter 7 was that differences in
neighborhood calls were the result of differential incidence of
problems and crimes. It is pos si ble that residents of different
community areas may also have varying propensities to call the police,
both generally or in regards to parti cular problems. For example,
residents of high crime, inner-city areas may confine calls to police
to serious incidt::nts, being less concerned about minor property
problems such as vandalism or potential problems such as suspi cious
persons. Residents of low crime areas, on the other hand, may be more
"crime-sensi tive, II calling the police about any unusual circumstance
or crime-related situation. This suggests the need for researchers to
study individual and neighborhood influences on the propensi ty of
individuals to contact the police about different types of problems
and crimes. Victimization studies have begun to examine reasons why
citizens fail to report crimes, yet have given little attention to the
full range of neighborhood reporting patterns.
Conclusion
There has been much research directed toward determining the
police role, toward what citizens ask the police to do, and toward how
officers respond during encounters. The body of research on police

176
response, from the time required to arrive at the scene to various
al terna tives to traditional patrol car response, is growing. Some
research has assessed the effects of activities on police performance.
Examination of police call processing and its effects on overall
police response and performance, however, is sorely lacking. This
report has begun to identify areas in which further work is needed.
Our analysis has indicated that such work would be useful in assisting
operating agencies to determine what citizens expect of them, to
improve their response to citizen demand, and to suggest areas where
improvements might make a meaningful difference.

177
Footnotes
lOur measure of commercial land use reflects the presence of large shopping centers, but undercoUllts the number and extent of commercial strip development, no doubt accounting in part for this finding.
2Data from the Police Services Study, conducted by the Workshop in Political Theory and Policy Analysis in 24 police departments from three metropolitan areas in 1977, indicate that call volume and crime statistics were the most commonly used factors in determining beat configuration. Sixty-one percent of the responding departments (14) relied on call volume to design their patrol beats. Another 44 percent (10 departments) said that they also used crime statistics in determining beat configuration.
3 Serv ice time is calculated from time data stored by the FWPD's computer-aided dispatch system. For every dispatched call for service, the responding officer must report the time he arrives on the scene and the time he c0mpletes handling the incident and is ready to receive the next dispatch. Service time is simply the period between these two reported times. Even considering that officers may delay calling the dispatcher upon completion of a call (to rest, attend to personal business, or simply waste time), Table 10-1 provides a good indication of the relative time required to handle each general type of call.
*M' .,......

American Bar Association (1972) Standards Relating to the Urban Police Function. New York, New York: Institute of Judicial Administration.
Antunes, George and Eric J. Scott (1981) "Calling the Cops: Police Telephone Operators and Citizen Calls for Service." Jou:t"nal of Criminal Justice, Vol. 9, No.2, 165-180.
Bercal, Thomas E. (1970) "Calls for Police Assistance: Consumer Demands for Govermnental Service." American Behavioral Scieutist, Vol. 13, Nos. 5-6 (May-August), 681-691.
Cahn, Michael F. and James M. Tien (1981) An Evaluation Report c,lf An Alternative Approach in Police Response: The Wilmingtog Management of Demand Program. Cambridge, Massachusetts: Public Systems Evaluation, Inc.
Cumming, Elaine, Ian Cumming, and Laura Edell (1965) "Policeman as Philosopher, Guide, and Friend." Social Problems, Vol. 12, 276-286.
Goldstein, Herman (1977) Policing a Free Society. Cambridge, Massachusetts: Ballinger.
(1979) "Improving Policing: A Problem-Oriented Approach." Crime and Delinquency, Vol. 25 (April), 236-258.
Levens, Bruce R. and Donald G. Dut ton (1980) "Citizens I Requests for Service and the Vancouver Police Department Response." In Bruce R. Levens and Donald G. Dutton, eds. The Social Service Role of Police - Domestic Crisis Intervention. Ottawa, Ontario, Canada: Minister of Supply and Services, 5-38.
Lilly, J. Robert (1978) "What Are the Police Now Doing?" Journal of Police Science and Administration, Vol. 6, No. 1 (March), 51-60.
Lipsky, Michael (1980) Street Level Bureaucracy: Dilemmas of the Individual in Public Services. New York, New York: Russell Sage Foundation.
Manning, Peter K. (1977) Police Work: The Social Organization of Policing. Cambridge, Massachusetts: MIT Press.
(1980) "Organization and Environnent: Influences on Police Work." In R. V. G. Clarke and J. M. Hough, eds. l.h.!:l Effectiveness of Policing. Farnborough, Hants., England: Gower Publications, Ltd.
Meyer, ,lohn C. (1976) "Empirical Analysis of Police Service Tasks: Antecedent for Management Planning. 1I Journal of Police Science and Administration, Vol. 4, No.1 (March), 264-273.

179
Misner, Gordon E. (1967) "The Urban Police Mission." Issues in Criminology, Vol. 3 (Summer), 35-46.
National Institute of Justice (1980) "Differential Police Response to Calls for Service - Test Design." Program solicitation, October 1980 •
Percy, Stephen L. and Eric J. Scot t (1982a) "Dil;cretion and Performance: The Neglected Roles of Police Operators and Dispatchers." Paper presented at the Annual Meetings of the Academy of Criminal Justice Sciences, Louisvi1le, Kentucky, March 23-27, 1982.
(l982b) "The Importance of Gatekeeping in Urban Police Agencies." Paper presented at the Annual Meeting of the Southwestern Political Science Association, San Antonio, Texas, March 18-20, 1982.
(forthcoming) Demand Processing and Performance in Human Service Organizations.
Reiss, Albert J., Jr. (1971) The Police aud the Public. New Haven, Connecticut: Yale University Press.
---------------------- and David J. Bordua (1967) "Environnent and Organization: A Perspective on the Police." In David J. Bordua, ed. The Police: Six Sociological Essays. New York, New York: John Wiley & Sons, 25-55.
Rl.Dllbaut, Ruben G. and Egon Bittner (1979) "Changing Conceptions of the Police Role: A Sociological Review." In Norval Morris and Michael Tonry, eds. Crime and Justice: An Annual Review of Research, Vol. 1. Chicago, Illinois: University of Chicago Press.
S co t t , Er i c J. (19 81) ..;,:C;.::a:.:1:.,:1:,::s;......:::f:.;::o:,.:r:......:S:.::e:..:r...,v:..,::i::;..:c:.::e::.,::=---,C:,.:i:,:t:..:i""z:::..:e::.:n::.....::D::..,:e::.:m::;:a::.:n::,;d::.....;a::;:n::,;d::;....,;I::,;n=i t=ia=l Police Response. Washington, D.C.: National Institute of Justi ce.
and Analee Moore (1981) Patterns of Police-Referral Agency Interaction. Washington, DC: National Institute of Justi ce.
and Stephen L. Percy (1980) "Improving Police Service Through Telephone Operations." The Police Chief, Vol. 47, No.7 (July), 48-52.
and Asha L. Swarup (1981) Police Communications Study Report on Data Collection and Research Instruments. Bloomington, Indiana: Indiana University, Workshop in Political Theory and Policy Analysis.
Shearing, Clifford D. (1974) "Dia1-A-Cop: A Study of Police Mobilization." In R. L. Akers and E. Sagarin, eds. Crime Prevention and Social Control. New York, New York: Praeger, 77-88.

180
Silberman, Charles E. (1978) Criminal Violence. Criminal Justice. New York, New York: Random House.
Sumrall, Raymond 0., Jane Roberts, and Michael T. Farmer (1981) Differential Police Response Strategies. Washington, D.C.: Police Executive Research Forum.
u.s. Department of Justice (1980) Crime and Seasonality. Washington, DoC.: Bureau of Justice Statistics.
Webster, John A. (1970) "Police Task and Time Study." Journal of Criminal Law, Criminology. and Police Science, Vol. 61, No.1, 94-100.
Wilson, James Q. (1968) Varieties of Police Behavior. New York, New York: Atheneum.

APPENDIX 1
Calls for Service/Dispatch Form
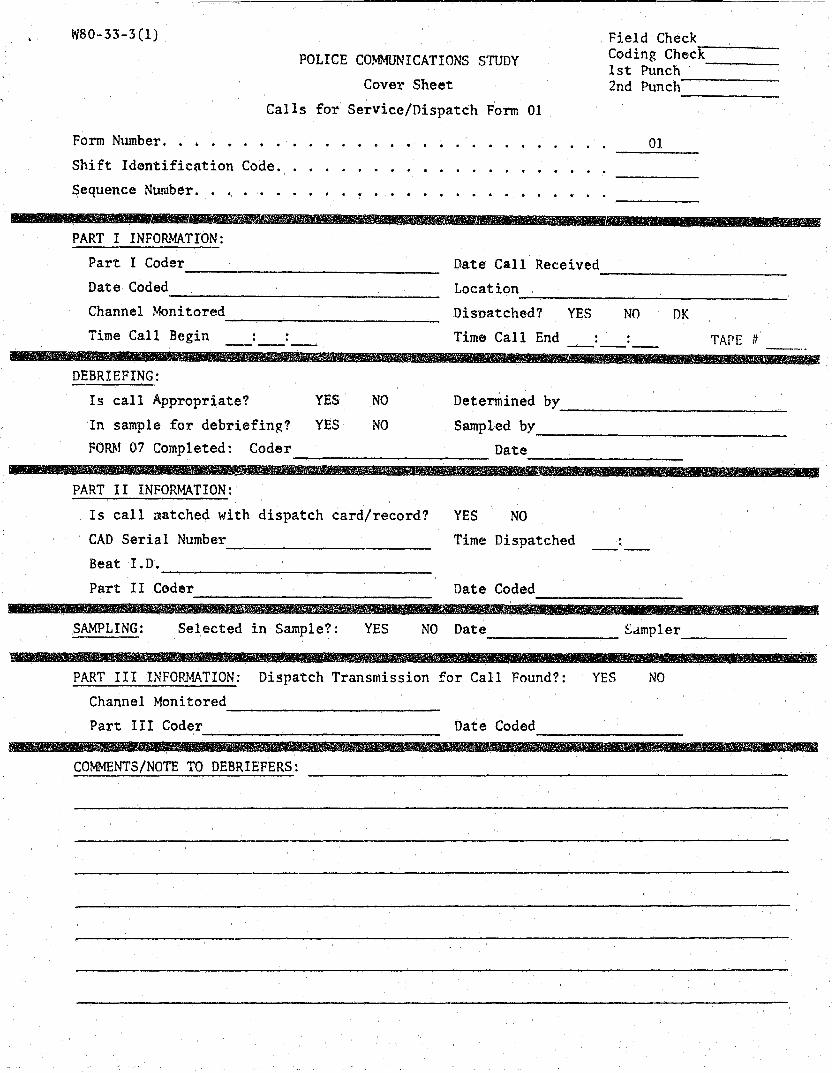
W80-33-3(1) Field Check POLICE COMMUNICATIONS STUDY
Cover Sheet
-:------Coding Check ______ __ 1st Punch 2nd Punch-----------
Calls for Service/Dispatch Form 01
Form Number. . . . . .
Shift Identificntion Code.
Sequence Number. 0 •
PART I INFORMATION:
Part I Coder Date Call Received
OJ.
----------------------------- -------------------Date Coded Location ------------------------- -----------------------------Channel Monitored
Time Call Begin
DEBRIEFING:
--------------------------. . ------
Dispatched? YES NO Time Call End . . ------
Is call Appropriate? YES NO Determined by
DK
TAPE It
-----------------------In sample for debriefing? YES NO Sampled by ---------------------------FORM 07 Completed: Coder Date ---------------------- ----------------
PART II INFORMATION:
Is call natched with dispatch card/record?
CAD Serial Number ------------------------Beat LD. ----------------------------Part II Coder -------------------------
YES NO
Time Dispatched . ----
Date Coded ---------------SAMPLING: Selected in Sample?: YES NO Date ~dmpler --------------- ----------
PART III INFORMATION: Dispatch Transmission for Call Found?: YES NO
Channel Monitored ------------------------Part III Coder Date Coded ------------------------- ----------------
COMMENTS/NOTE TO DEBRIEFERS:
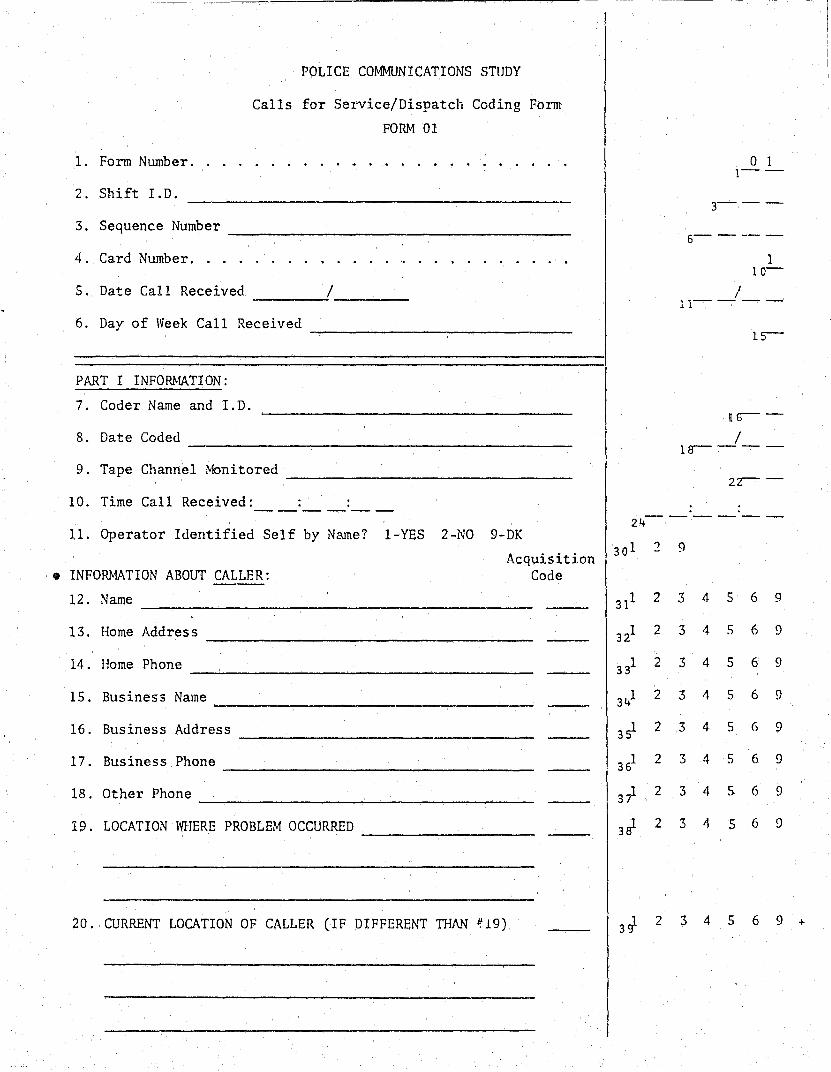
---~----.------------------
POLICE COMMUNICATIONS STUDY
Calls for Sel~ice/Dispatch Coding Form
FORM 01
1. Form Number.
2. Shift I. D.
3. Sequence Number ----------------------------------4. Card Number ...
S. Date Call Received , __ ~/ ___ -6. Day of Week Call Received ---------------------------PART I INFORMATION:
7. Coder Name and LD.
8. Date Coded
9. Tape Channel Monitored
10. Time Call Received: . ------
11. Operator Identified Self by Name? I-YES 2-NO 9-DK
Acquisition • INFORMATION ABOUT CALLER: Code ---
12. Name
13. Home Address
14. Home Phone
15. Business Name
16. Business Address
17. Business Phone
18. Other Phone
19. LOCATION Wl-IERE PROBLEM OCCURRED
20. CURRENT LOCATION OF CALLER (IF DIFFERENT TIiAN #19)
o 1 1--
3---
6------
1 10-
I 11----
15-
as-- --I la----
2Z-- --
. . 24------
30 1 2 9
311 2 3 4- 5 6 9
321 2 3 4 5 6 9
331 2 3 4 5 6 9
341 2 3 4- 5 6 9
3~ 2 3 4 5 6 9
361 2 3 4 5 6 9
3t 2 3 4 5 6 9
3; 2 3 4 5 6 9
3'; 2 3 4 5 6 9 +

Page 2
• 21. Other Description of Location to Which Police Might Respond (other than information listed in items 13, 16, 19, 20).
Acquisition Specific Location Information: Code
a. Nearby intersection. . · . b. Location on street or highway.
c. Placement of building. · . d. Description of exterior building features.
e. Description of location inside building.
f. Exterior location described in proximity to building
g. Named building, e:;tablishment) area. . h. Other description. . . . · . .
" 22. General Description of Problem:
• 23. Description of/Information About the Problem Acquisition and/or Its Participants: Code
a. Caller, Personal Description
b. Suspect, Personal Description
c. Suspect, Other Information
d. Other Participants, Personal Description
e. Other Participants, Other Information
f. Personal Injury Involved
g. Vehicles Involved
h. Weapons Involved
• 24. Problem Reported as In-Progress? I-YES 2-NO 9-DK
1 2 3 4 S 6 ~ 40
1 2 3 4 5 6 9 41
1 2 3 4 5 6 9 42-
1 2 3 4 S 6 9 43
1 2 3 4 S 0 9 44
1 2 3 4- 5 (, 9 45
·1 2 3 if 5 (1 9 46
1 2 3 4 5 6 9 47
4a---
51---
1 2 3 4 5 6 9 54
1 2 3 4 5 6 9 55
1 2 3 4 5 6 9 56
1 2 3 4 5 (1 9 57
1 2 3 4 5 6 9 58
1 2 3 4 5 (1 9 59
1 2 3 4 s· 6 0 60
1 2 3 4 5 6 9 61
1 2 9 62

Page 3
• 25. Specific Service Requests Made by Caller
e 26. First Report of Problem by Caller? I-YES 2-NO 9-DK
,. 27. Operator Response:
@ 28. Operator Demeanor: I-rude/abrupt 2-neutral
3-friendly/reassuring 9-DK
@t 29. Caller Put on Hold or Interrupted? I-YES 2-NO
* * * * * * * * * * * * * * * * * * fill 30. CALLER ATTRIBUTES (Circle Appropriate Code):
a. P osition: I-crime victim 2-suspect 3-person needing assistance/information 4-third party/witness 5-representative of victimized business/agency 6-representative of business/agency needing
assistance/information 9-other/DK
b. A ge: I-young 2-middle 3-old 9-DK
c. S ex: I-male 2-female 9-DK
d. R 'ace: 1-white 2-black 3-~exican/Spanish 4-other 9-DK
e. E motional State: 1-calm 2-excited 3-frightened
4-:mgry 5-upset 6-confused 9-DK
* * * * * * * * * * * * * * * * * * • 31. Time Call Ended: : ------
I -- - END PART r INFORMATION - - - I
63---
66---
69---
72---
75 I 2 9
11---
11+---
17- ---
20---
23---
I 239 26
1 2 27
INEXTI 2 CARD 10-
I 234 569 28
1 2 3 9 29
I 2 9 30
1 2 3 4 9 31
1 2 3 4 5 6 9 32
. . . . 33-------

Page 4
PART II INFORf-1ATION:
(This information is to be obtained from dispatch cards and/ or computer printouts from the CAD system.)
1. Is Dispatch Information found and coded for call for service?:
I-YES 2-NO
2. Coder Name and 1.0. ---------------------------------3. Date Coded -----------------------------------4. Beat 1.0. ------------------------------------------5. PRA Code -------------------------------------------6. Serial Number of Call --------------------------------7. Signal Code -------------------------------------------8. Location Address -----------------------------9. Complainant Address __________________________________ ___
DIFFERENT THAN #8?: I-YES 2-NO
10. Complainant Name ______________________________________ _
lOa. NAME LISTED?:
lOb. OTHER DESCRIPTION LISTED?:
I-YES
I-YES
2-NO
2-NO
11. Complainant Phone Number ________________________________ __
LISTED?: I-YES 2-NO
12. Units Assigned:, / /
13. Time Information: _______________________________________ ___
a. Time Ca11 Entered (10-4)
b. Time Dispatched (10-7)
c. Time Unit Arrived (10-23)
d. Time Back-In Service (10-24)
14. Complaint Taker 10 Number _______________________________ _
15. Dispatcher ID Number ____________________ _
16. Priority Code (Circle one code): 1. 2 4-NONF.
17. SELF RPT Code (Circle one code): 1-1 2-2 3-T 4-NONE
1 2 39
--40
/ 42- -- --
46- -- --
----50
54-------
--60
-----66
70- - ----
74 ------3
10 -
11- --'--
15--'--
19-- -'---
23-- --'- -
27- --
29--
2 :1 4
1 2 3 4 32

Page 5
• 18. Were any REMARKS recorded on call record?: I-YES 2-NO ~-RApm ENTRY
• 19. Record REMARKS verbatim --------------------------------------------
• 20. Were the following descriptions of/information about the PROBLEM/PARTICIPfuVTS included in the REMARKS?:
a. Complainant, Person Name -------------------------------------------------
b. Complainant, Business Name -----------------------------------------------c. Complainant, Personal Description ------------------------------------d. Complainant, Other Information -------------------------------------------e. Suspect, Personal Description
f. Suspect, Other Information ----------------------------------------------g. Other Participants, Personal Description -------------------------------h. Other Participants, Other Information -----------------------------------i. Personal Injury Involved
j. Vehicles Involved ------------------------------------------------------
k. Weapons Involved ______________________________ . ______________________ ___
1. In-Progress (stated)
m. Indication No Further Information ---------------------------------------n. Problem Elaboration ------------------------------------------------------
o. Units en Route ------------------------------.--------------------------.. 21. Were the following descriptions of problem LOCATION included in
the REMARKS?:
a. Nearby Intersection ___________________________________________________ ___
b. Location on Street or Highway -------------------------------------------c. Placement of Building __________________________________________________ _
d. Description of Exterior Building Features --------------------------------e. Description of Location Inside Buildin~ ----------------------------------f. Exterior Location Described in Proximity to Buildin?, ----------------------g. Named Building, Establishment, Area --------------------------------------h. Other Description -------------------------------------------------------
I - - - END PART II INFORMATION - - -
371 2
38 1 2
39 I 2
40 1 2
41 1 2
42 1 2
43 1 2
44 1 2
45 I 2
46 1 2
47 1 2
48 1 2
49 2
50 1 2
51 1 2
52 1 2
53 1 2
511 1 2
55 2
56 2

Page 6
PART III INFORMATION:
(This information is to be obtained from monitored dispatch transmissions.)
WORKSHEET AREA Time Start . . . . --------Units Contacted / ---------
Time End . . . . ------
1. Is Dispatch Transmission found and coded for call for service:
l-YES 2-NO
2. Coder Name and I.D.
3. Date Coded ---------------------------------------------------------------
4. Tape Channel M)nitored ---------------------------------------------
5. Date of Dispatch -------------------------------------------, 6. Time Dispatch Transmission Begins __ : ___ : _____ __
7. Units Contacted: a. Primary ----------------------------------------
b. Backup ----------------------------------8. Signal Code Mentioned
----------------------------------------------9. Officer Priority Code Men tioned ---------------------------
1 2 4 1 1
10 12- --
I 14----
18-
I 19----
. . . . 23------
--'---29
33----
37----
41
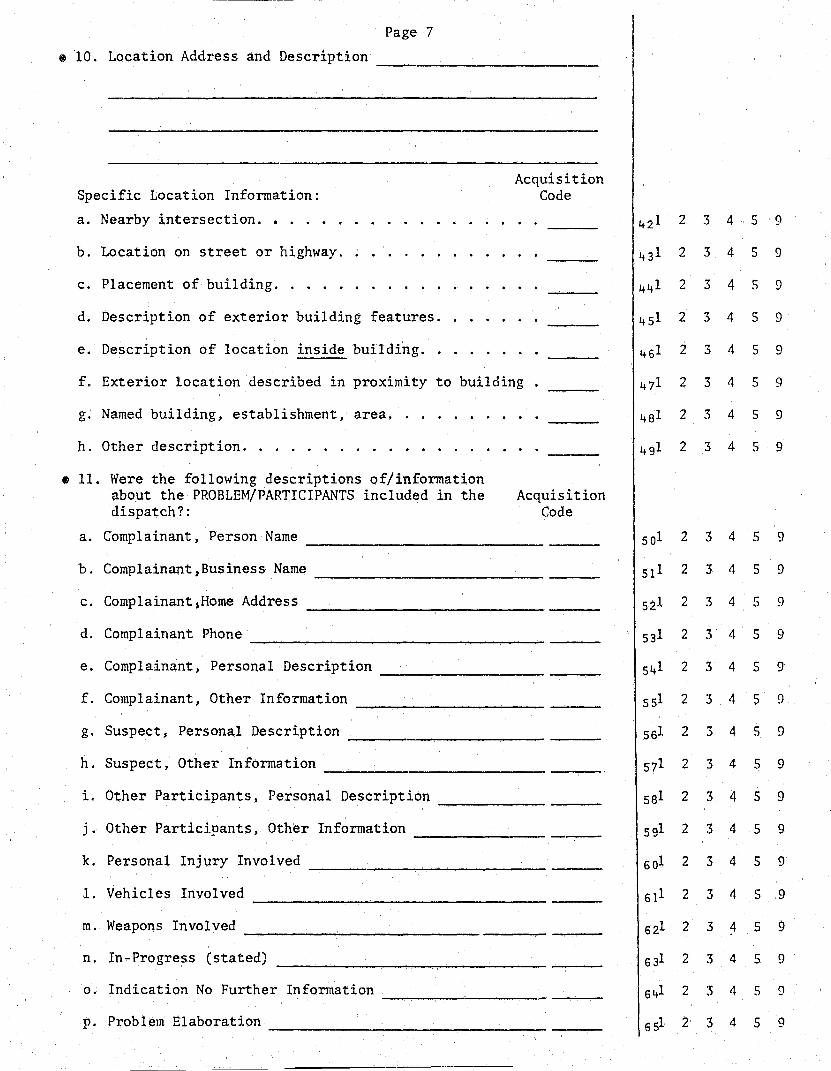
-------------------------~----- -
Page 7
• 10. Location Address and Description -------------------------
Specific Location Information:
a. Nearby intersection. • • . •
b. Location on street or highway.
c. Placement of building ..... .
d. Description of exterior building features .•
e. Description of location inside building.
Acquisition Code
f. Exterior location described in proximity to building
g. Named building, establishment, area.
h. Other description ..•.....
• 11. Were the following descriptions of/information about the PROBLE?-1/PARTICIPANTS included in the dispatch?:
Acquisition Code
a. Complainant, Person Name ----------------------------b. Complainant,Business Name ---------------------------c. Complainant,Home Address
d. Complainant Phone ______________________________________ _
e. Complainant, Personal Description -------------------f. Complainant, Other Information ----------------------g. Suspect. Personal Description ----------------------h. Suspect, Other Information ----------.----------------i. Other Participants, Personal Description --------j. Other Participants, Other Information ------------------k. Personal Injury Involved ----------------------------1. Vehicles Involved
m. Weapons Involved ---------------------------n. In-Progress (stated)
o. Indication No Further Information -------------------p. Problem Elaboration -----------------------------
421 2 3 4 5 9
431 2 3 4 5 9
441 2 3 4 5 9
451 2 3 4 5 9
461 2 3 4 5 9
471 2 3 4 5 9
481 2 3 4 5 9
491 2 3 4 5 9
501 2 3 4 5 9
511 2 3 4 5 9
521 2 3 4 5 9
531 2 3 4 5 9
541 2 3 4 5 9
551 2 3 4 5 9
561 2 3 4 5 9
571 2 3 4 5 9
581 2 3 4 5 9
591 2 3 4 5 9
601 2 3 4 5 9
611 2 3 4 5 9
621 2 3 4 5 9
6~ 2 3 4 5 9
641 2 3 4 5 9
651 2 3 4 5 9

Page 8
• 12. Officer told other units would be sent to the scene. (Circle units mentioned.)
++ - no units mentioned 01 - other patrol units 02 - detectives, evidence technicians, etc. 03 - juvenile officer 04 - animal control 10 - supervisory personnel 51 - ambulance 72 - fire department 88 - wrecker 99 - other unit
e 13. Time End of Dispatch Transmission . . . . ------
1- - - END PART III INFORMATION - - -[
66
68--
70--
72--
. . . . ------74

APPENDIX 2
Caller Debriefing Form

W80-33-9
POLICE COMMUNICATIONS STUDY
Cover Sheet
CALLER DEBRIEFING FORM
Form N~~ber. . . . . • • . . . • • • " " • • " • " " II " "
Sequence Number (From FORM 07) -------------------------Card Number. . •
• " • • " • It " It • 0 • It " " " " " "
Interviewer Name and Code Number -----------------------Date Letter Sent ---------------------------------------Date of Interview --------------------------------------Interview Completed?: I-YES 2-NO (If NO, EXPLAIN BELOW)
Case Number: Calls for Service Form 01 ------------------Total Minutes of Interview " • a " • • • • " "
COMMENTS: ___________________________________________ ___
Interview Verification: By Date ------------------ --------
Field Check -------Codin~ Check
1st Punch
2nd Punch
----------
o 5 1- --
3-----
1 7-
a---
10J_o / 13-----
171 2
01/ /. laf'o-n.i Shift -Seq .No-:---
27---

2
INTRODUCTION: (If Name is KNOWN)
Hello. May I please speak to (name on FORM 07) ... My name is I am part of a research team studying police services in this area. We are working with the permission of the Fort Worth Police Department, but we are an independent research study. You may have received a letter from us explaining our project. I understand that you called the Fort Worth police on day, date from FORM 07 concerning incident description on FORM 07. I would like to talk to you about this incident. This brief survey will take no more than five minutes. Please be assured that all of your responses will be kept completely confidential. Do you have a few moments to sneak to me about this incident?
INTRODUCTION: (If Name is UNKNOWN)
Hello, my name is I am part of a research team studying police services in this area. We are working with the permission of the Fort Worth Police Department, but we are an independent research study. I understand that someone who [lives at this residence or works at this business or agency] recently contacted the Fort Worth police on (date from FORM 07) about (incident description from FORM 07. I would like to talk to this person.
IF CALLER IS SOMEONE DIFFERENT THAN PERSON WHO ANSWERED" REPEAT THE FIRST INTRODUCTION LISTED ABOVE.
IF RESPONDENT HESITATES OR IS UNCERTAIN, ASSURE HIM/HER THAT:
1. All responses are confidential. The police will not learn of their individual responses.
2. We are cooperating with the Fort Worth police, but we are an independent research team.
3. Citizen can call the Fort Worth police at 870-6410 to verify our study.
4. The interview will be quite short.
IF CITIZEN REMAINS HESITANT, SUGGEST THAT YOU CAN CALL BACK AT SOME TIME THAT IS MORE CONVENIENT. SET UP TIME TO CALL. NOTE CALL BACK INFORMATION ON FORM 07.

3
Time Interview Started . ----
First of all, we would like to ask you some questions about your conversation with the police operator when you called the Fort Worth Police Department.
1. When you called, did you receive a recorded message tell ing you that all police operators were busy and that an operator would be with you shortly?
lAo
~ I-YES 12-NO 9-DK/NR1-+ GO TO Q. 2
IF YES: How long did you wait before an operator carne on the line and spoke with you?
[Record in Seconds] ---------------------2. Was the police operator you spoke with male or female?
l-~fale 2-Female 9-DK/NR
3. \\~en you started talking with the police operator ahout this incident were you:
READ: I - calm, 9 - DK/NR 2 - excited, 3 - frightened, 4 - upset, S - angry, or 6 - confused?
4. Could you briefly describe exactly what you told the police operator?
INTERVIEWER SHOULD PROBE FOR DETAILS OF THE INCIDENT AND FOR THE RESPONDENT'S RELATIONSHIP TO THE INCIDENT. RECORD DETAILS BELOW AND CODE RESPONDENT'S RELATIONSHIP.
4A. Respondent's relationship to the incident:
1 - crime victim 2 - person needing assistance/info 3 - third party/witness 4 - representative of victimized business/agency S - representative of business/agency needing
assistance/info 7 - refused 9 - OK/NR
31
, '- +
34 1 ;2 9 +
I 2 3 4 S 6 9+ 35
36- ----
39---
21 2 3 4 S 7 9

4
S. Where did this incident happen?
INTERVIEWER SHOULD PROBE TO DETERMINE APPROPRIATE CODE BELOW
1 - inside residence 2 - inside nearby residence or apartment 3 - outside location near residence (hallway, yard, parking
lot) 4 - at place of work (inside or outside) 5 - commercial location, respondent conducting business
(not place of work) 6 - public place or facility (not place of work) 7 - other location 8 - refused 9 - DK/NR
6. As you were calling the police, did you expect that they would send a police car in response to your call?
I-YES 2-NO 9-DK/NR
7. Did the police operator specifically TELL YOU that a police unit would be sent in response to your call?
~ I-YES 12-NO 9-DK!NR!+ GO TO Q. 8
7A. IF YES: Did the police operator give you any indication of how long it would take police to respond?
7B. ~
IF YES:
I-YES 1-12_-N_O __ 9_-_DK.....;.!_N--JRf-t. GO TO Q. 8
How long did the operator say it would take the police to arrive?
(Circle code below) --------------------I - number of minutes specified --------2 - general indication of fast response 3 - general indication of slow response 4 - other indication of response time 9 - DK/NR
8. Did the police operator transfer you to someone who took a report from you over the phone?
~r-----l-YES 12-NO 9-DK/NR!--i> GO TO Q. 9
\IF YES: Ask Questions 8A-8Cl
8A. Was the police report writer courteous?
I-YES 2-NO 9-DK/NR
1 2 3 4 5
436 7 8 9 +
1 2 9 " 44
1 2 9 + 45
1 29+ 46
1 2 3 4 47
9 +
1 2 9 + 48
I 2 9 .J.
49

5
8B. Did the police report writer tell you what the police would do about the matter you reported?
/ 1-YES \2 -NO 9-DK/NR}-. GO TO Q. BC
BBl. IF YES: What did he or she tell you the police would do?
CIRCLE ONE OR TWO CODES THAT DESCRIBE THE RESPONSE GIVEN TO THE CALLER4
01 - forward report/matter to detectives 02 - forward report/matter to supervisors 03 - general response that matter will be taken
care of 04 - told someone will call them about matter 05 - told police can do little or nothing about
the matter 07 - caller refused to tell debriefer 09 - other response
8C. Were you satisfied to give a report over the phone or would you have preferred that a police officer he sent to take the report in person?
1 - satisfied to give report over phone 2 - prefer officer sent to take report 9 - no opinion -- DK/NR
NOTE TO INTERVIEWER: If the respondent did give a report over the phone, at this point indicate that the following questions will refer to the original police operator and NOT to the report writer.
9. Did the police operator provide you with any other information relevant to your call?
I-YES 12-NO 9-DK/NRI
~ r GO TO GO TO Q. 9A Q. 10
1 2 9 ... 50
51 --
53 --
1 29+ 55
56 1 2 9 +

6
9A. IF YES: What kind (s) of information did the nolice operator give you?
CIRCLE UP TO FIVE Or: THE CODES BELOW I\rylICII DESCRIBE INFORMATION GIVEN BY THE OPERATOR.
01 - name and number of internal police unit or nerson 02 - more detailed information on internal nolice unit 03 - name and phone numher of external agency or nerson 04 - more detailed information on external agency OS - nonpolice related informat ion 06 - information on particular case 07 - crime prevention information 08 - general information on police response or policies 09 - explanation of why police cannot respond 10 - other informati0n 11 - general information about operator response 12 - info on what caller should do (no police response) 13 - info on what caller should do (police response)
10. 0verall, how satisfied were you with the response riven hy the police telephone operator? Were you:
READ: 1 - very satisfied~ 2 - satisfied, GO TO O. 11 3 - neutral, --- T
r--4s - dissatisfied, or ~~------~~ very dissatisfied 9 - DK/NR
IDA. IF DISSATISFIED: Why were you dissatisfied with this response by the police operator?
CIRCLE UP TO FIVE CODES ON THE NEXT PAGE WHICH DESCRIBE WHY CALLER WAS DISSATISFIED.
---57
---59
61
--63
--65
1 2 3 d 67
59+
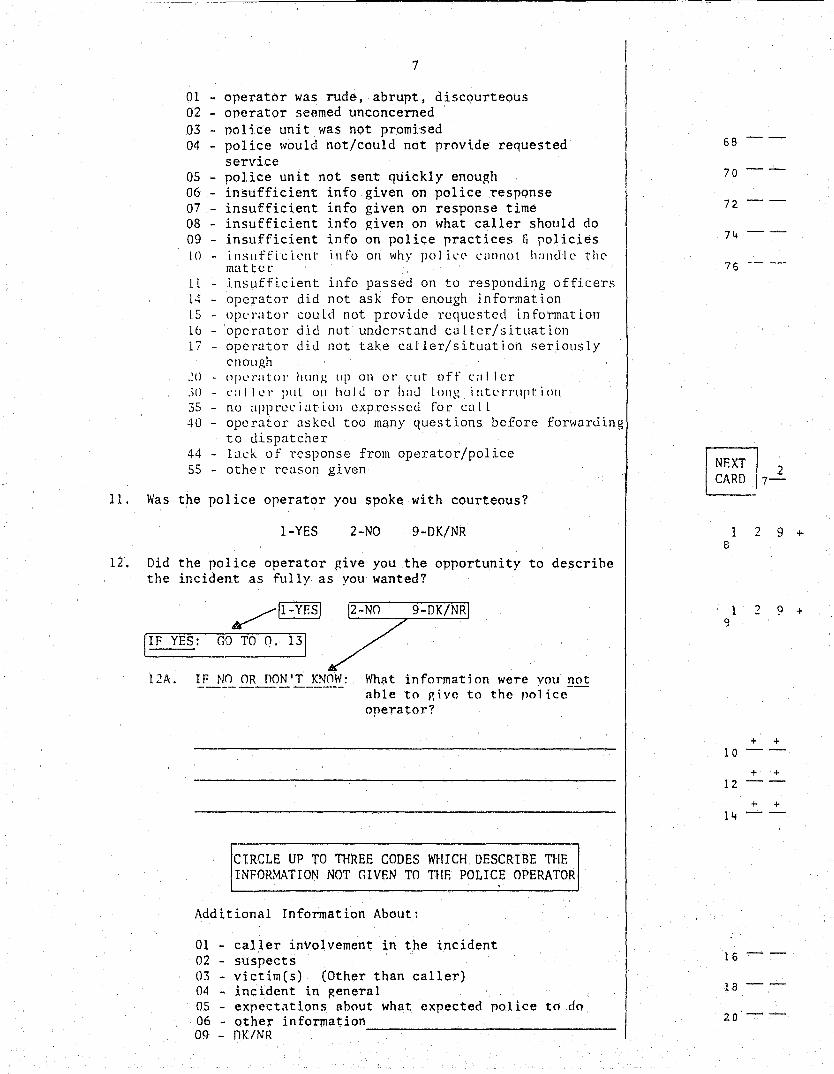
7
01 - operator was rude, abrupt, discourteous 02 - operator seemed unconcerned 03 - police unit was not promised 04 - police would not/could not provide requested
service 05 - police unit not sent quickly enough 06 - insufficient info given on police response 07 - insufficient info given on response time 08 - insufficient info given on what caller should do 09 - insufficient info on police practices & policies 10 - inslIffiL:i.L'nt info on why pol iL'(' c:lJ1flOl handle the'
matter 11 - insufficient info passed on to responding officers 14 - operator did not ask for enough informati.on LS - ope'ratol' could not provide requested in format lOll 16 - operator did not understand caller/situation 17 - operator did flot take caller/situation seriously
l'1l011gh
,: () - 11 fl L' rat () r II lIll g 1I P () n 0 I' <.: 1I t 0 f f <: a I I e r 50 - l':lllel' pilL 011 hold or h:lu lOllg illtl'tTtlptioll
3S - no appreciation expressed for call 40 - operator asked too many questions before forwarding
to dispatcher 44 - lack of response from operator/police SS - other reason given
11. Was the police operator you spoke with courteous?
I-YES 2-NO 9-DK/NR
12. Did the police operator give you the opportunity to descrihe the incident as fully as you wanted?
/II-YESI
[IF YES; GO TO Q. 131
12A. IF NO OR nON'T KNOW: What information were you not ahle to p,ivc to the rolice operator?
CIRCLE UP TO THREE CODES WHICH DESCRIBE THE INFORMATION NOT GIVEN TO TIlE POLICE OPERATOR
Additional Information About:
01 - caller involvement in the incident 02 - suspects 03 - victim(s) (Other than caller) 04 - incident in Renera! OS - expectAtions about what expected police to do 06 - other information 09 - nK/NR ----------------------------------------
68
70
72.
74
76
I NEXT I 2 CARD 7-
I 2 9 + 8
1 2 9 +
+ + 10
+ + 12
+ + 14
16
1 B
20

------ ---~------~
8
13. When you finished talking with the police operator did you feel:
READ: 1 - calm, 2 - excited, 3 - frightened, 4 - upset, 5 - angry, or 6 - confused?
9 - DK/NR
14. Did a police officer arrive in response to your call?
~l-YES !2-NO 9-DK/NRj--a.r,O TO O. 16
14A. IF YES: How long did it take for the police to arrive? (Code in minutes) ----------------
14B. Was police response time faster, slower, or about the same as you exnected?
1 - faster 2 - slower 3 - about the same
9 - DK/NR
l4C. How satisfied were you with police resnonsetime? Were you:
READ: 1 - very satisfied, 2 - satisfied, 3 - neutral, 4 - dissatisfied, or 5 - very dissatisfied
9 - DK/NR
15. Please consider now the actions taken by the police officer or officers who responded to your call. Overall, how satisfied were you with the actions taken by the police. Were you:
READ: 1 - very satisfied, 2 - satisfied, 3 - neutral, 4 - dissatisfied, or 5 - very dissatisfied
9 - DK/NR
16. Based upon this experience with the police, would you say that you now feel more favorable, less favorable, or about the same toward the Fort Worth police?
1 - more favorable 2 - less favorable 3 - about the same
9 - DK/NR
1 2 3 .t 22
5 6 9 T
1 2 9 + 23
24- --
I 2 39+ 27
1 2 3 4 28
59+
1 2 3 4 29
59+
1 2 .) 9 + 30

9
READ: Now I would like to ask you a few general questions that we ask of all interviewed persons. As with all parts of this interview, all of your answers will remain totally confidential.
NOTE TO INTERVIEWER: If the respondent is a BUSINESS REPRESENTATIVE, then skip on to QUESTION #26. IF the respondent is NOT a business representative, then continue on with QUESTION #17.
17. ~~at kind of housing unit do you Ijve in?
1 single family residence 2 - a duplex 3 - an apartment 4 - a mobile home, or an 5 - other type of residence 7 - refused 9 - DK/NR
18. How long have you lived at this residence?
1 - less than 6 months 2 - 6 months to a year 3 - more than a year to 5 years 4 - more than 5 years 7 - refused 9 - DK/NR
19. Do you own, are you buying, or do you rent your home?
1 - own 2 - buying 3 - renting 7 - refused 9 - DK/NR
20. Do you think that crime in your neighborhood in the nast year has increased, decreased, or stayed the same?
1 - increased 2 - decreased 3 - stayed the same 8 - no crime here 7 - refused 9 - DK/NR
21. Overall, would you rate the police services delivered to your neighborhood as outstanding, good, adequate, inadequate, or ve1'y poor?
1 - outstanding 2 - good 3 - adequate 4 - inadequate 5 - very poor 7 - refused 9 - DK/NR
--------~-------------------------------------------------------
1 2 .3 4 31
5 7 9 +
7 9 +
331 2 3 7 9 +
341 2 3 7 8 9 +
351 2 :) 4
5 7 9 +

10
22. How many years of education have you had?
00 01 02 03 04 OS 06 07 08 09 Elementary School Junior High
10 11 12 13 14 15 16 17 18 19 20 High School College or Graduate School
Technical School
23. How many persons live in your residence? ------------------24. How many children (under 18), adults, and senior adults
(over 65) live in your residence?
Number of Children -------Number of Adults -----------Number of Senior Adults ----NOTE TO INTERVIEWER: Be certain total from Question 24 e uals total in Question 23.
25. Is your total family income for a year:
READ: I - below $5,000 2' - between $5,000 and $10,000 3 - between $10,000 and $15,000 4 - between $15,000 and $20,000 5 - between $20,000 and $25,01)0 6 - between $25,000 and $30,000 7 - more than $30,000 8 - refused 9 - DK/NR
.... 26. What is your race or ethnic background? I - White 2 - Black 3 - Mexican American 4 - American Indian 5 - Other 7 - refuse~d---------------------------
9 - DK/NR
27. In what year were you born? 18 19
DON'T ASK:
28. Respondent's Sex I-Male 2-Female
Refused
9-DK/NR
36
38
1+0-- --
1+2-- --
44--
461 2 3 4 5
(i 7 R 9 +
1 23.\ 5 47
1+8
9 +
READ: Thank you very much for your help. Your answers will be of great ~ssistance to our study of police services. My supervisor on this nroject may call you to verify that thi.s interview was conducted. Thank you again.
TIME INTERVIEW ENDS . ------ITEM 7B, code 1, number of minutes 51- ----

APPENDIX 3
Police Officer Questionnaire

OFFICE USE ONLY
Field Check Coding Check ---First Punch ---econd Punch-' ---
POLICF COMMUNICATIONS STIJDY
Police Officer Questionnaire Form 06
Please answer each question by placing a check (I) or writing numbers in the appropriate spaces. All responses will be kept strictly confidential.
1. Date you are completing this form:
2. What is your current rank?
3. How many years have you worked for the Fort Worth P.O.?
4. In which sergeant's district do you currently patrol? . ____ _
5. Have you ever worked in the Fort Worth P.O. is communications center?
, Yes 2 No
6. IIF YES TO QUESTION 5 :1 What was' your job there?
'_Dispatcher 2 Call Taker 3 Both 4 Other
7. How well informed do you feel about the operations of the department's communications center?
_Very well ; nformed 2_fairly well informed
3 Not well informed
8. What effect do you think the Fort 140rth P.D.'s computer-aided dispatch system has had on the fcllowing? (Please check one answer for each item a through e).
a. Police reSDonse time
b. Officer safety
c. Dispatch operations
d. Officer effectiveness in responding to calls for servi ce
e. Radio congestion
Improved No Effect Worsened Don't Know
COOlputer Codi nq Only: Please Do Not Write in This Column
7
o 6 1--
3---
1 6-
----
11-
12 --
14--
'2+ 16
1 2 3 4 + 17
1 19
1 20
1 21 , 22
1 2 3 + 18
2 3 9 +
2 3 9 +
2 .. 9 +
2 3 9 +
1 2 ·3 9 + 23

2
9. In general, do you think the information you now receive when dispatched provides enough details about an incident to enable you to respond effectively?
Yes (GO TO OUESTION 13) 2 ___ No (ANSWER QUESTIONS 10-12)
10. What additional information t~at you currently do not receive would you like to have before arriving at the scene?
(CHECK EACH ITEM THAT APPLIES)
1 ___ More details about the nature of the problem 2 ___ More details about the pa~ticipants 3 More details about how tc .ocate the address 4-0ther i nformat; on (Please sped fy)
------------------~
11. Do you think that in most cases the information you checked Ouestion 10 is currently available to the dispatcher?
1 Yes (GO TO QUESTION 13) 2 No
12. Do you think that complaint takers should be instructed to obtain the information you checked in Question 10?
1 Yes 2 No
13. In your opinion, does the signal you now receive adequately describe the nature of most incidents to which you are dispatched?
1 Yes 2 No
in
14. Are there any particular incident categories that you would like to see added to the department's current list of signals?
Yes (PLEASE INDICATE CATEGORIES BELOW) 2 ~o
15. In general, do you receive enough information about the location to enable you to rapidly find the address to which you are dispatched?
1 Yes 2 No
Canouter Coding Only: Please 00 Not Write in This Column
241 2 +
251 2 +
26 1 2 +
271 2 +
28 1 2 +
1 2 + 29
12+ 30
12+ 31
12+ 32
33--
35--
37--
39--
41--
12+ 43
---I

3
J. ~esides the address, what other information would you find useful in locating the problem or crime scene? (PLEASE LIST BELO~J)
-----------------------_._--------
--------------------------------
17. How often is the nature of the problem as disratched different from that which you discover at the scene?
~ost of the time 2---Some of the time 3-- Very infrequently
18. When there is a difference between the problem as dispatched and the oroblem you discover UDon arrival, do you think it is because: (CHECK ~ACH ITEM TH.l\T APPLIES)
' ___ The caller reported the problem incorrectly or incompletely 2 The complaint taker used an incorrect signal 3---The complaint taker did not obtain enough information (---The nature of the problem chanqed between time of call and --officer arrival time -
5 Other (Please specify) _________________ _
19. How often do you have difficulty in contacting the disoatcher because of radio congestion?
1 Most of the time 2---Some of the time 3---Very infrequently
20. Do you think the radio congestion problem would be relieved by 9reater radio discipline?
Yes 2 No
21. Do you think that police reSDonse to priority 1 calls is Qeneral1y more effecti ve when offi cers :
' ___ Receive only location and siqnal so that they can respond raoidly OR
2 Receive location, signal, and other information about the problem . -that may delay thei r response sOOlewhat
OR 3_0ther (Please specify) __________________ _
Como uter Cor] i ntr
Only: P1easF:''' Not !./r; te in This Column
46- --.
48--
50--
1 23+ 54
60
55' 2 +
56 1 2 .,.
57' ? + ....
58 1 2 .,
59' 2 +
123 -
1 2 J,.
61

4
~~. Assume that the information items listed below are known to the dispatcher. For which of the three types of dispatched calls (Priority 1,2 and 3) listed below would you like to know the following items before arriving at the scene? (PLEASE CHECK (I) THE APPROPRIATE SPACE U~~DER EACH TYPE OF CALL WHE~EVER YOU WOlJLO LIKE Tn K~OW A PARTICULAR INFORMATION ITEM)
a. Complainant name
b. Number of Dersons involved
c. Business name
d. When incident occurred
e. Weapons involved
f. Previous incidents at location
g. Physical violence present
h. Personal injuries involved
i. OescriDtion of vehicles involved
.J •
k.
1.
m.
n.
23.
Information about Suspects
Back-up units dispatched
Role of comnlainant (victim, witness. etc.)
Type of 1 ocati on (house, apt., business, parking lot)
Emotional state of participants
Your aqe?
Pri ority 1 Pri ori ty 2 Pr; ori ty 3
----
24. Your sex? Male 2 Female
25.
26.
Your race? 1 White 3_Hispanic 2 -Slack 4 Other
What level of education have you completed?
1 High school or equivalent 2-Some college, no degree 3-Associate degree - .
4 B.A. or B.S. S-Some graduate work or -graduate degree
TH NK U ER MUCH L N H . PLEASE RETURN IT TO US IN THE ENVELOPE PROVIDED. FEEL FREE TO ADD AnY COMMENTS ON THE BACK OF THIS PAGE.
Computer Codinq Only: Please Do Not Y!rite in This r.olumn
NEXT CARD DUPLI CATE 1-5
2 6-
7---
10---
13---
16----
19---
22----
25---
28---
31---
34----
37---
40---
43---
46---
49--
51 1 2 -I-
521 2 3 4 +
53' 2 3 4 5
+