Embed Size (px)
Citation preview

CO2-expanded solvents, promising green solvents
for preparing effective formulations of poorly
soluble actives
Paula Elena Rojas Labanda
Tesi doctoral
Programa de Doctorat de Química
Directora
Nora Ventosa Rull
Departament de QuímicaFacultat de Ciències
2015


La present memòria es presenta per aspirar al Grau de Doctor per:
Paula Elena Rojas Labanda ,
Vist i plau:
Dr. Nora Ventosa Rull Prof. Rosa María Ortuño
(Directora) (Tutora)
Bellaterra, 18 de Febrer de 2015
i

ii

Agradecimientos
El desarrollo de la presente tesis doctoral ha sido únicamente posible gracias al esfuerzo,
la dedicación, el entusiasmo y el apoyo de muchas personas. Por esta razón, me gustaría
expresar mi máxima gratitud a todas las personas que han colaborado en este trabajo.
Me gustaría agradecer al Prof. Jaume Veciana y a la Prof. Concepció Rovira la oportu-
nidad que me han dado para realizar la Tesis Doctoral en su grupo y por haber transmitido
la importancia del rigor científico y la excelencia. A continuación, quiero expresar toda
mi gratitud a mi directora de Tesis, Nora Ventosa, por todo el tiempo y el esfuerzo que ha
dedicado, por haber compartido conmigo tan humanamente las alegrías y los momentos
más duros, por su entusiasmo por la ciencia bien hecha. También quiero dar las gracias
al Consejo Superior de Investigaciones Científicas por la financiación económica a través
de la beca predoctoral JAE-DOC.
Gracias a Noscira por la productiva colaboración y el suministro del fármaco. Este tra-
bajo no habría sido possible sin la fructífera colaboración con el grupo del Dr.Ing. Andreas
Brauer, de la Universidad Friedrich-Alexander University Erlangen- Nürnberg. Thank you
very much Andreas for all the scientific discussion, for all the support and for having con-
sidered my opinion so much. I also would like to express my gratitude for your warm wel-
come in your group. In addition, I will like to expand my gratitude to Robert and Julian,
for teaching me so patiently all the Raman fundamentals and for all the fun moments in
the lab and the shared beers. Thank you very much for making my research stays so great!
Quiero agradecer al Dr. Jordi Faraudo por habernos ayudado a entender mucho más nue-
stros sistemas con sus simulaciones. Gracias por tener siempre la puerta abierta y ganas
de aclarar todas las dudas posibles. Quiero recalcar también todo el valioso trabajo real-
izado por Josep Merlo, y en especial de Silvia Illa.
Muchas gracias a todo el personal técnico y al de administración del ICMAB, así como
al "Servei D’Anàlisi Química" de la UAB. Quiero agradecer todo el apoyo que he recibido
iii

de Raúl Solanas y Emili de la Serna, vosotros sabéis lo imprescindibles que habéis sido!
Quien sabe si estaría ahora escribiendo estos agradecimientos si no hubiera sido por
Joan. Gracias a ti y a todo tu entorno por haberme acogido tan bien en Barcelona, gracias
por hacerme querer tanto esta cuidad, GRACIAS por haberme exigido siempre desde el
cariño y por haber sido ejemplo.
Estos años no hubieran sido tan especiales si no los hubiera compartido con todos
y cada uno de los miembros que han pasado por Nanomol, gracias por las risas en las
comidas y vuestra paciencia cuando entraba al laboratorio de la segunda planta. Espe-
cialmente, quiero expresar mi más sincera y enorme gratitud a l@s Supercritic@s, sabéis
que sin vosotr@s esto no hubiera sido posible. Gracias a vosotras por haber sido AMIGAS
con mayúsculas, ejemplo de grandes científicas y mejores personas. Ha sido un placer
haber crecido personal y científicamente a lado de gente tan valiosa, no es fácil encontrar
personas con las que trabajar sea tan fácil. Mil millones de gracias por todo!
Si hay algo que también ha sido único, ha sido labirradeldijous, gracias por todas las
conversaciones científicas, políticas, los planes tan chulos y las risas que han hecho todo
tan fácil. Gracias a las grandes personas que forman este grupo tan valioso, habéis hecho
que crezca mucho!
Quiero agradecer a todos mis amigos, los más nuevos de Barcelona por haber entrado
tan de lleno en mi vida, y a mis amigas de toda la vida de Madrid. A estas últimas, gracias
por haber hecho que 600km no sea distancia, gracias por hacerme sentir tan querida y
por el orgullo y la felicidad que siento por tener a las amigas que tengo. Es un auténtico
placer teneos en mi vida y seguir creciendo con vosotras.
Gracias a mi enorme, única y especial familia, por el orgullo que siento de ser Rojas
Labanda, soy lo que soy gracias todos vosotros. Quiero agradecer poder compartir tantas
cosas valiosas para mi con vosotros. Familia, sois muy grandes!
Definitivamente, todo este proceso no hubiera sido posible sin toda la confianza, el
apoyo y el amor de mis padres y mis hermanas. Gracias por la educación que me habéis
dado, por hacerme siempre tan feliz y tan querida, gracias por el orgullo que siento de
familia.
Por último, quiero agradecer con todo mi corazón a mi compañero de vida, gracias
Abel por hacerme dar lo mejor de mi, gracias por exigirme tanto y por hacerme ser mejor
persona cada día. Mil millones de gracias por todo lo que me das, por soñar conmigo y
por hacerme increíblemente feliz a tu lado.
iv

Abstract
The pharmaceutical industry nowadays is facing several challenges, as more than 40% of
compounds identified through combinatorial screening programs are poorly soluble in
water. These molecules are difficult to formulate using conventional approaches and are
associated with innumerable formulation-related performance issues. Formulating these
compounds as pure drug micro particles is one of the newer drug-delivery strategies ap-
plied to this class of molecules. The bioperformance of drugs depends on specific char-
acteristics of particles such as size, surface, crystal structure and morphology. Concretely,
the control of particle size and shape is of vital relevance as they influence a large vari-
ety of important physical properties, manufacturing processability and quality attributes.
Moreover, pharmaceutical companies are more and more urged to develop production
processes with very low environmental impact in particular for reducing the use of volatile
organic compounds in medicine manufacturing as well as the residues in the finished
product. In the case of pharmaceutical industry, requirements for high-quality products
and society concerns about health and environments, makes the implementation of new
efficient and environmentally respectful technologies for the preparation of drugs with
tailored properties an urgent necessity.
Compressed fluids (CF), which emerge in the early 90’s, present unique properties for
the eco-efficient production of Active Pharmaceutical Ingredients (APIs) with an excep-
tional control of the operational variables that allow tuning the final properties of the
active compounds, as detailed in Chapter 1 of this Thesis. Among the most successful
applications of CFs, particle engineering of pharmaceutical actives seems to be at the
moment, the area with the highest blooming. In contrast to conventional particle forma-
tion methods, where a larger particle is originally formed and then milled to the desired
size, CF technology involves growing particles in a tailored manner to reach the desired
final physical properties. This means that the solid particle, once formed, does not have
v

to undergo any thermal nor mechanical stresses, as happens in conventional techniques.
This feature makes supercritical and compressed fluid technology amenable to produce
biomolecules and other sensitive compounds in their native pure state. In addition, CF-
based technologies also present an enormous potential for large scale processing.
In light of the need of implementing environmentally friendly process for the produc-
tion of APIs with controlled size and shape, this Thesis has been devoted to expand the
goodness of CF-based methodologies. Concretely, Chapter 2 focuses on the use of DELOS,
a CF-based precipitation process, to prepare micronized crystalline particles of poorly
soluble actives with low bioavailability and problematic processing by conventional tech-
niques.
Another promising approach to increase the bioavailability of poor soluble drugs is
their formulation as micro particles suspended in an aqueous media forming aqueous
suspensions. In this context, Chapter 3 explores the application of DELOS-susp as a new
one-step method for preparing aqueous suspensions of micronized actives.
Finally, with the objective of expanding the use of CF-based process, the last part of
this Thesis endeavors to investigate and characterize the organization, at the molecular
level, of surfactant-free microemulsion-like systems formed in "water/organic solvent/CO2"
pressurized systems. These nanostructured liquids can be regarded as a universal green
solvents and could be used as nano templates.
vi

Resumen
La industria farmacéutica hoy en día tiene que afrontar varios retos ya que el 40% de los
compuestos resultantes de los programas de selección combinatorios son insolubles en
agua. Como consecuencia, estas moléculas presentan dificultades a la hora de ser proce-
sadas. Una de las estrategias más implementadas para aumentar la velocidad de disolu-
ción de estos nuevos fármacos es su formulación como microparticulas. Las propiedades
de los ingredientes activos están directamente relacionadas con propiedades físicas de las
partículas tales como el tamaño, la forma, la estructura cristalina y la morfología. Conc-
retamente, el control del tamaño y la forma de un fármaco son de vital importancia ya
que estos dos parámetros influencian gran cantidad de propiedades físicas, sus posibili-
dades de procesado y calidad. Además, las compañías farmacéuticas tienen la necesidad
urgente de desarrollar procesos de bajo impacto medioambiental, en particular, para re-
ducir el empleo de disolventes orgánicos volátiles en los procesos de producción de fár-
macos así como el nivel de residuos en el producto acabado. Las estrictas limitaciones
que sufre hoy en día la industria farmacéutica para obtener productos de alta calidad
junto con la creciente preocupación de la sociedad por la seguridad y el medioambi-
ente hacen que la implementación de técnicas más eficientes y más respetuosas con el
medioambiente se convierta en una necesidad urgente.
Los fluidos comprimidos (CF, en sus siglas en inglés) surgieron en los años 90s y pre-
sentan unas propiedades únicas para la preparación de principios activos con un con-
trol excepcional de las variables de operación que permiten modelar las propiedades fi-
nales de los fármacos de una manera sostenible, como se detalla en el Capitulo 1 de esta
Tesis. Una de las aplicaciones más exitosa de los fluidos comprimidos es en la produc-
ción de fármacos. En las cristalizaciones con disolventes convencionales, los tamaños de
partícula deseados se obtienen sometiendo los fármacos a procesos de molienda. En los
procesos a partir de fluidos comprimidos la formación de partículas se hace de manera
vii

controlada para obtener las propiedades finales deseadas en una sola etapa. Esto sig-
nifica, que una vez que la partícula se forma, no tiene que someterse a tensiones térmicas
ni mecánicas. Esta característica hace que las técnicas basadas en el uso de fluidos com-
primidos sean adecuadas para producir biomoléculas y compuestos sensibles. Además,
los procesos con fluidos comprimidos presentan un gran potencial para la aplicación a
grande escala.
En base a la necesidad de implementar procesos sostenibles para la producción de
principios activos con un tamaño y forma definidos, el objetivo de esta Tesis es expandir
la bondad de los procesos de precipitación basados en fluidos comprimidos. Concreta-
mente, el Capitulo 2 está centrado el uso del DELOS, un proceso basado en CFs, para
preparar microparticulas cristalinas de activos con poca solubilidad en agua y que pre-
sentan problemas a la hora de ser procesados por técnicas convencionales.
Otra prometedora estrategia para formular compuestos insolubles en agua es su for-
mulación como suspensiones acuosas donde el fármaco se encuentra suspendido en
forma de partícula micrónica en un medio acuoso. En este contexto, el Capitulo 3 explora
la aplicación del método de una sola etapa DELOS-susp para la obtención de suspen-
siones acuosas de fármacos insolubles en agua de tamaño micrónico.
Por último, con el objetivo de expandir el uso de los fluidos comprimidos, la parte fi-
nal de esta Tesis ha estado dedicada a la investigación y caracterización a nivel molecular
de sistemas tipo microemulsión sin surfactantes formados en mezclas "agua/disolvente
orgánico/CO2" a alta presión. Estos líquidos nanoestructurados se pueden considerar
como prometedores disolventes respetuosos con el medioambiente y como plantillas
para la preparación de materiales nanoparticulados.
viii

Contents
Contents xii
1 Introduction and Objetives 1
1.1 Introduction . . . . . . . . . . . . . . . . . . . . . . . . . . . . . . . . . . . . . . 1
1.2 Objectives . . . . . . . . . . . . . . . . . . . . . . . . . . . . . . . . . . . . . . . 15
Bibliography . . . . . . . . . . . . . . . . . . . . . . . . . . . . . . . . . . . . . . . . . 16
2 Micronization of APIs using compressed fluids 23
2.1 Introduction . . . . . . . . . . . . . . . . . . . . . . . . . . . . . . . . . . . . . . 23
2.1.1 Particle Engineering in the Pharmaceutical Industry . . . . . . . . . . 23
2.1.2 Crystallization of microparticulate APIs using compressed fluids . . . 27
2.1.3 DELOS process . . . . . . . . . . . . . . . . . . . . . . . . . . . . . . . . 34
2.2 DELOS method for the precipitation of ibuprofen as microparticles . . . . . 40
2.2.1 Thermodynamic Analysis of DELOS precipitation of ibuprofen . . . . 41
2.2.2 Summary . . . . . . . . . . . . . . . . . . . . . . . . . . . . . . . . . . . . 50
2.3 Micronization of the thiadiazoline derivative NP from CO2-expanded solvents 51
2.3.1 Solubility behavior of NP . . . . . . . . . . . . . . . . . . . . . . . . . . 51
2.3.2 Preparation of NP micro particles using Compressed Antisolvent Pre-
cipitation method. . . . . . . . . . . . . . . . . . . . . . . . . . . . . . . 53
2.3.3 Preparation of NP microparticles using DELOS method. . . . . . . . . 56
2.3.4 Use of organic solvents as growth inhibitors . . . . . . . . . . . . . . . 60
2.3.5 Summary . . . . . . . . . . . . . . . . . . . . . . . . . . . . . . . . . . . . 72
Bibliography . . . . . . . . . . . . . . . . . . . . . . . . . . . . . . . . . . . . . . . . . 73
ix

3 DELOS-susp for the preparation of pharmaceutical suspensions 81
3.1 Introduction . . . . . . . . . . . . . . . . . . . . . . . . . . . . . . . . . . . . . . 81
3.1.1 Micro-suspensions as Drug Delivery Systems . . . . . . . . . . . . . . 81
3.1.2 Stability of aqueous suspensions . . . . . . . . . . . . . . . . . . . . . . 88
3.2 Development of a DELOS-susp procedure for the preparation of aqueous
suspensions . . . . . . . . . . . . . . . . . . . . . . . . . . . . . . . . . . . . . . 93
3.3 Preparation of aqueous suspensions of the thiadiazoline derivative NP by
DELOS-susp . . . . . . . . . . . . . . . . . . . . . . . . . . . . . . . . . . . . . . 97
3.3.1 Preparation of aqueous suspensions of the thiadiazoline derivative
NP using surfactants . . . . . . . . . . . . . . . . . . . . . . . . . . . . . 102
3.3.2 Influence of process variables on NP microsuspensions. . . . . . . . . 112
3.3.3 Elimination of acetonitrile from NP microsuspensions: Filtration . . 117
3.3.4 Comprehensive characterization of NP microsuspensions . . . . . . . 120
3.3.5 In vivo experiments . . . . . . . . . . . . . . . . . . . . . . . . . . . . . . 126
3.3.6 Acetonitrile elimination and quantification . . . . . . . . . . . . . . . 126
3.3.7 Summary . . . . . . . . . . . . . . . . . . . . . . . . . . . . . . . . . . . . 132
3.4 Crystal growth morphology prediction for the thiadiazoline derivative NP
crystal. . . . . . . . . . . . . . . . . . . . . . . . . . . . . . . . . . . . . . . . . . 134
3.4.1 Introduction to Morphology simulations. . . . . . . . . . . . . . . . . . 134
3.4.2 Morphology prediction. . . . . . . . . . . . . . . . . . . . . . . . . . . . 136
3.4.3 Summary . . . . . . . . . . . . . . . . . . . . . . . . . . . . . . . . . . . . 139
3.5 Preparation of aqueous suspensions of ibuprofen by DELOS-susp . . . . . . 141
3.5.1 Summary . . . . . . . . . . . . . . . . . . . . . . . . . . . . . . . . . . . . 146
Bibliography . . . . . . . . . . . . . . . . . . . . . . . . . . . . . . . . . . . . . . . . . 147
4 Surfactant-free microemulsion-like systems 157
4.1 Introduction . . . . . . . . . . . . . . . . . . . . . . . . . . . . . . . . . . . . . . 157
4.1.1 Microemulsions-like systems . . . . . . . . . . . . . . . . . . . . . . . . 158
4.1.2 CO2-based microemulsions-like systems . . . . . . . . . . . . . . . . . 161
4.1.3 Surfactant-free Microemulsion-like systems . . . . . . . . . . . . . . . 161
4.2 Water/Acetone/CO2 system . . . . . . . . . . . . . . . . . . . . . . . . . . . . . 163
4.2.1 High pressure phase equilibria . . . . . . . . . . . . . . . . . . . . . . . 163
4.2.2 Raman Spectroscopy characterization of microemulsion-like systems 166
4.2.3 Evolution of the ROH in the Water/Acetone/CO2 system . . . . . . . . 169
x

4.2.4 Microemulsion-like solubilization capacity . . . . . . . . . . . . . . . 174
4.2.5 Summary . . . . . . . . . . . . . . . . . . . . . . . . . . . . . . . . . . . . 177
4.3 Water/Acetonitrile/CO2 system . . . . . . . . . . . . . . . . . . . . . . . . . . . 179
4.3.1 High pressure phase equilibria . . . . . . . . . . . . . . . . . . . . . . . 179
4.3.2 Raman spectroscopy characterization of microemulsion-like systems 181
4.3.3 Microemulsion-like solubilization capacity . . . . . . . . . . . . . . . 183
4.3.4 Summary . . . . . . . . . . . . . . . . . . . . . . . . . . . . . . . . . . . . 183
4.4 Molecular Dynamics Simulations . . . . . . . . . . . . . . . . . . . . . . . . . 184
4.4.1 Summary . . . . . . . . . . . . . . . . . . . . . . . . . . . . . . . . . . . . 189
Bibliography . . . . . . . . . . . . . . . . . . . . . . . . . . . . . . . . . . . . . . . . . 190
5 Conclusions 199
6 Experimental Part 201
6.1 Materials . . . . . . . . . . . . . . . . . . . . . . . . . . . . . . . . . . . . . . . . 201
6.2 Solubility analysis . . . . . . . . . . . . . . . . . . . . . . . . . . . . . . . . . . . 202
6.2.1 Determination of solubility in organic solvents at atmospheric pressure202
6.2.2 Solubility analysis in pressurized CO2-expanded solvents . . . . . . . 202
6.3 Preparation of micro and sub microparticles using CO2-expanded solvents 206
6.3.1 Preparation of micro and submicroparticles by Precipitation with a
Compressed AntiSolvent, PCA . . . . . . . . . . . . . . . . . . . . . . . 206
6.3.2 Preparation of micro and submicroparticles by DELOS . . . . . . . . . 207
6.4 Instruments, techniques and procedures used for the characterization of
the micro and submicronparticles . . . . . . . . . . . . . . . . . . . . . . . . . 211
6.4.1 Light Scattering (LS) . . . . . . . . . . . . . . . . . . . . . . . . . . . . . 211
6.4.2 Scanning electron microscopy (SEM) . . . . . . . . . . . . . . . . . . . 214
6.4.3 Morphology of particles . . . . . . . . . . . . . . . . . . . . . . . . . . . 214
6.4.4 X-ray microdiffraction . . . . . . . . . . . . . . . . . . . . . . . . . . . . 215
6.5 Preparation of suspensions of micro particles by DELOS-susp . . . . . . . . 215
6.5.1 Equipment . . . . . . . . . . . . . . . . . . . . . . . . . . . . . . . . . . . 215
6.5.2 Experimental procedure . . . . . . . . . . . . . . . . . . . . . . . . . . . 215
6.6 Instruments, techniques and procedures used for the characterization of
the micro suspensions . . . . . . . . . . . . . . . . . . . . . . . . . . . . . . . . 216
6.6.1 Light Scattering (LS) . . . . . . . . . . . . . . . . . . . . . . . . . . . . . 216
xi

6.6.2 Turbiscan . . . . . . . . . . . . . . . . . . . . . . . . . . . . . . . . . . . 216
6.6.3 Scanning probe microscopy (SEM) . . . . . . . . . . . . . . . . . . . . 218
6.7 Quantification of the excess of organic solvent in the suspensions: . . . . . . 218
6.8 Removal of the excess of organic solvent from the suspensions . . . . . . . . 219
6.8.1 Filtration . . . . . . . . . . . . . . . . . . . . . . . . . . . . . . . . . . . . 219
6.8.2 Diafiltration . . . . . . . . . . . . . . . . . . . . . . . . . . . . . . . . . . 219
6.8.3 Liofilization . . . . . . . . . . . . . . . . . . . . . . . . . . . . . . . . . . 220
6.9 Formation of the microemulsions-like systems . . . . . . . . . . . . . . . . . 221
6.9.1 Phase behavior analysis . . . . . . . . . . . . . . . . . . . . . . . . . . . 221
6.9.2 Experimental procedure . . . . . . . . . . . . . . . . . . . . . . . . . . . 221
6.9.3 Raman characterization of the microemulsion-like systems . . . . . . 222
6.9.4 Variable Volume Cell . . . . . . . . . . . . . . . . . . . . . . . . . . . . . 222
6.9.5 Raman Spectrometer . . . . . . . . . . . . . . . . . . . . . . . . . . . . . 223
6.9.6 Experimental procedure . . . . . . . . . . . . . . . . . . . . . . . . . . . 224
6.9.7 Calculation of the ROH . . . . . . . . . . . . . . . . . . . . . . . . . . . . 224
6.9.8 Solubilization experiments of the thiadiazoline derivative NP and Ibupro-
fen in the microemulsion-like systems . . . . . . . . . . . . . . . . . . 226
6.9.9 Molecular dynamics simulations . . . . . . . . . . . . . . . . . . . . . . 227
Bibliography . . . . . . . . . . . . . . . . . . . . . . . . . . . . . . . . . . . . . . . . . 228
A Solubility values and solubility fitting curves 231
A.1 Solubility values . . . . . . . . . . . . . . . . . . . . . . . . . . . . . . . . . . . . 231
A.1.1 Solubility of ibuprofen in organic solvents at atmospheric pressures
and low temperatures . . . . . . . . . . . . . . . . . . . . . . . . . . . . 231
A.1.2 Solubility values of the thiadiazoline derivative NP in CO2-expanded
mixtures . . . . . . . . . . . . . . . . . . . . . . . . . . . . . . . . . . . . 232
A.2 Solubility fitting curves . . . . . . . . . . . . . . . . . . . . . . . . . . . . . . . . 234
xii

1Introduction and Objetives
1.1 Introduction
Modern drug discovery techniques dating from the late 80’s and early 90’s,(e.g. advances
in automated synthesis, innovative high-throughput screening methods, introduction of
combinatorial chemistry) are biased towards drugs with high lipophilicity, leading to a
number of poorly water-soluble drug candidates that is constantly increasing [1, 2, 3, 4].
In the 90’s, it was generally acknowledged that approximately 40% of the new drug com-
pounds screened were poorly water soluble [5], this value has not change over the years
[6], and the percentage can approach 90% if compound selection is not design with dili-
gence [7]. At present, it is estimated that about 40% of the drugs being in the develop-
ment pipelines are poorly soluble, even up to 60% of compounds coming from synthesis
are poorly soluble and that 70% of the potential drug candidates are discarded due to low
bioavailability before they ever reached the pharmaceutical department [8].
The main reason of these large percentages of poorly soluble drugs candidates is the
drug-like structures that result from optimization of specific binding to target receptors or
enzymes. As a consequence, drug candidates are highly lipophilic, have huge molecular
1

Chapter 1. Introduction and Objetives
weights and lots of substitutions [9]. Hydrophilicity and lipophilicity are two contradict-
ing and often competing prerequisites necessary for the success of a commercial drug
[10]: high lipophilicity helps in transporting molecules across biological membranes and
plays an important role in its biological activity and metabolism, but also renders a wa-
ter insoluble compound [11]. Since dissolution is the first step in the absorption of the
drugs, poor aqueous solubility is one of the major hurdles in the development of new
compounds [6]. Therefore, increasing the dissolution rate of poorly water soluble drugs is
an important and significant challenge to the pharmaceutical industry in order to maxi-
mize absorption [12]. Hence, research of strategies for drug dissolution rate enhancement
is of high interest [13].
The physical properties of Active Pharmaceutical Ingredients (APIs) such as size, de-
gree of crystallinity and shape have the potential to impact the bioperformance of drugs,
particularly for low-solubility compounds, where the rate-limiting-step in drug uptake
may be the dissolution of the API in the gut [14]. From the bioavailability perspective,
small particles are preferred as they provide faster dissolution. As a general rule, broad or
bimodal particle-size distributions should be avoided and narrow distributions with an
optimal mean size are desired [14]. Morphology of crystalline solids can also influence
dissolution rate and biological availability of drugs and other properties such as packing
density, agglomeration and re-dissolution [15, 16]. Moreover, particle shape also influ-
ences downstream operations as separating, washing and drying crystals [17]. Finally,
crystallinity confers various advantages during isolation, processing and storage of the
drug, such as better impurity, improved handling characteristics, such as sticking and
flow and, in the majority of cases, better physical and chemical stability [14].
This Thesis deals with two poorly water soluble drugs: a widely known poor solu-
ble drug, ibuprofen, and a recently discovered poor water soluble active compound, 4-
benzyl-2-(naphtalen-1-yl)-1, 2, 4-thiadiazoline-3, 5-dione. Different techniques have been
applied with the objective of increasing its bioavailability. In the following, a brief intro-
duction of each compound is presented.
∗ Ibuprofen
Ibuprofen (2-(4-isobutyl-phenyl)-propionic acid)(Figure 4.12) is a widely used Non-
Steroidal Anti- Inflammatory (NSAI), antipyretic and anti-rheumatic drug [18]. It was dis-
covered in the 1960s in the U.K. and until nowadays is indicated for the relief of pain and
2

1.1. Introduction
fever by millions of people in the whole world [19]. It is considered a model compound
for poorly soluble drugs, being its solubility in water 0.049 mg/mL. Its LogP value (the oc-
tanol/water partition) is 3.14 [20]. The advantages of ibuprofen over other NSAIs are its
high efficacy and safety. It should be noted that ibuprofen is a relatively safe substance
only when used at low, analgesic dose (up to 1600mg/day) [21]. It is an enantiomeric
compound, being the S-form the therapeutic active form, although the racemic mixture
is the commercialized, as the R-enantiomer does not entail any secondary effects and a
60% of this enantiomer is metabolized in the human body into the S-form [22]. No poly-
morphism has been found [18].
Figure 1.1: Molecular structure of (R,S)-ibuprofen
Due to its very poor solubility in water, ibuprofen presents very low bioavailability
and a bad dissolution profile after oral administration [23, 24]. In addition, flowability
and compressibility are bad, is readily prone to capping and has tendencies to stick to
tablet punches during compression [25]. The pharmacokinetics of ibuprofen have been
extensively studied [26]. Considering the Biopharmaceutical Classification System, (BCS)
[27], which classifies drug substances into four categories according to their solubility and
permeability properties (Figure 1.2), ibuprofen belongs to Class II. For these drugs, that
exhibit low solubility but reasonable membrane permeability, the dissolution rate is the
limiting factor for the drug absorption rate. In view of its importance as a pain reliever, still
several research efforts are focusing on improving the physical, chemical and mechanical
properties of ibuprofen.
∗ 4-benzyl-2-(naphtalen-1-yl)-1,2,4-thiadiazoline-3,5-dione
4-benzyl-2-(naphtalen-1-yl)-1,2,4-thiadiazoline-3,5-dione, from now on, the thiadi-
3

Chapter 1. Introduction and Objetives
Figure 1.2: Biopharmaceutical classification system of drugs. Adapted from [1].
azoline derivative NP or NP, is a newly discovered poorly water-soluble anti-Alzheimer
drug (logP= 4.3) (Figure 1.4). This drug presents a very fast one-face preferential growth
that makes it to crystallize as very large needles. This type of morphology is usually unde-
sirable in pharmaceutical crystallizations as hinders the effective application of several
downstream operations such as particle handling, filtration, drying, milling and com-
paction [28].
Figure 1.3: Molecular structure of NP drug
4
1.1. Introduction
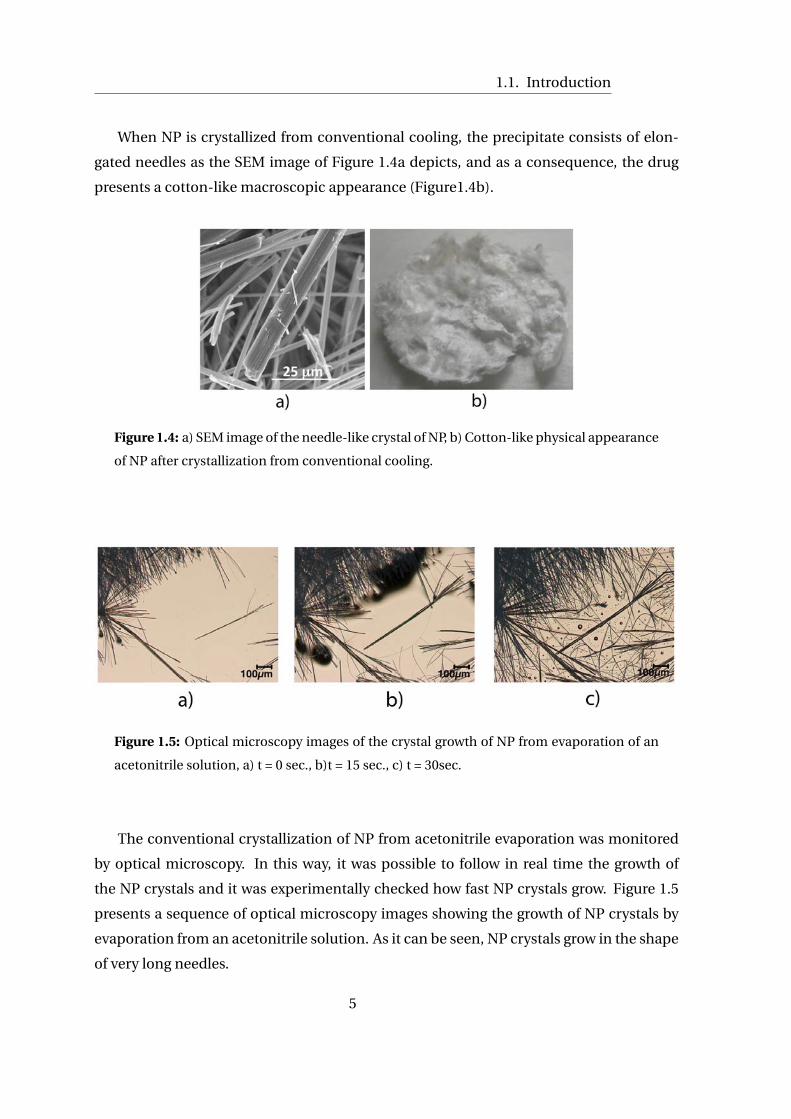
When NP is crystallized from conventional cooling, the precipitate consists of elon-
gated needles as the SEM image of Figure 1.4a depicts, and as a consequence, the drug
presents a cotton-like macroscopic appearance (Figure1.4b).
Figure 1.4: a) SEM image of the needle-like crystal of NP, b) Cotton-like physical appearance
of NP after crystallization from conventional cooling.
Figure 1.5: Optical microscopy images of the crystal growth of NP from evaporation of an
acetonitrile solution, a) t = 0 sec., b)t = 15 sec., c) t = 30sec.
The conventional crystallization of NP from acetonitrile evaporation was monitored
by optical microscopy. In this way, it was possible to follow in real time the growth of
the NP crystals and it was experimentally checked how fast NP crystals grow. Figure 1.5
presents a sequence of optical microscopy images showing the growth of NP crystals by
evaporation from an acetonitrile solution. As it can be seen, NP crystals grow in the shape
of very long needles.
5

Chapter 1. Introduction and Objetives
Approaches to increase bioavailability of drugs
Poorly soluble molecules have been successfully formulated by a variety of techniques
such as: solubilization in surfactant solutions; use of cosolvents; pH adjusted solutions;
emulsions; liposomes; complexation with cyclodextrins; and solid dispersions [29, 30].
However, most of these techniques require a large amount of additives limiting their use
from a safety perspective [31, 10]. This outlook is driving pharmaceutical companies to
search for fast, robust and reliable methods for the delivery of insoluble drugs.
Between the different available approaches for enhancing the dissolution rate of a
drug, micronization and the creation of liquid formulations are among the most useful
and promising approaches [9]. In fact, one of the major advancements in the pharma-
ceutical and drug delivery sector in the last fifteen years has been the recognition of the
benefits obtained when poorly soluble actives are formulated as micro or submicron par-
ticles [7].
Techniques used to produce particles with a controlled particle size can be categorized
into two major classes: top-down and bottom-up technologies.
Figure 1.6: Approaches to produce micro and submicron particles.
Top-down approaches mainly comprise mechanical comminution (crushing, grind-
ing and milling) and high pressure homogenization. Although these techniques are widely
used, their limitations include: long preparation time, difficulty in achieving a narrow size
distribution, high energy input, contamination and adverse effects of the high shear and
temperature on the chemical and physical stability of the materials. The top-down ap-
proach has been hugely useful on the commercial scale, however, it has some inherent
6

1.1. Introduction
drawbacks that impede their application for micronization of several APIs such as ther-
molabile compounds, cotton-like solids and waxy materials. These facts highlight the
need of seeking for new alternative process.
Bottom-up procedures, where micron and submicron materials are built from their
constituent units (molecules, macromolecules, polymers) by synthetic or self-assembly
procedures, provide access to form particles with extremely well defined physicochem-
ical characteristics (size, morphology and internal structure). With precisely controlled
bottom-up processes it is possible to prepare, in a single engineering operation, solid par-
ticles with a narrow particle size distribution. Bottom-up process have further advantages
like low energy requirements, simpler instrumentation, they are less expensive and usu-
ally can be operated at lower temperature [20, 32]. Nevertheles, this approach is still not
established commercially.
One of the most widely used bottom-up procedures for the preparation of micron and
submicron particulate APIs is precipitation [33]. Precipitation and crystallization are usu-
ally mixed terms, Mulling differentiates them and claims that precipitation is a fast crys-
tallization, although it could also imply a non reversible process [34]. In general terms,
precipitation or crystallization is a transient non-equilibrium process associated with a
phase change leading to crystal formation. The driving force for this process is supersatu-
ration (β) [35]. The degree of supersaturation is the ratio of the drug concentration in the
solution to its solubility in that solution at that particular condition.
In any bottom-up process involving precipitation from solution, particle size, parti-
cle size distribution, morphology, and internal structure (polymorphs, solvates, etc.) are
strongly dependent on the evolution of supersaturation (β) during precipitation (Figure
1.7). The supersaturation rate drives nucleation rate and crystal growth at each point of
the solution [35]. For instance, in those precipitation process where large levels of super-
saturation are attained rapidly (trace A of Figure 1.7) and where there is a homogeneity
of this profile throughout the bulk solution, nucleation phenomena will dominate crystal
growth, and very small and essentially mono dispersed particles will be produced. Con-
versely, in those cases when the β profile is more similar to trace B of Figure 1.7, the solute
in solution is depleted by both nucleation and crystal growth mechanisms and, accord-
ingly, large crystals are formed, with broad particle size distribution [36, 37].
Those precipitation process that occur far from equilibrium conditions, where large
levels of β are achieved very fast, precipitation will be favored by kinetic factors rather
than thermodynamic ones. In contrast, precipitations that take place near equilibrium
7

Chapter 1. Introduction and Objetives
Figure 1.7: Qualitative supersaturation profiles corresponding to a crystallization process
where nucleation phenomena are dominant over crystal growth (trace A) or crystal growth
is dominant over nucleation (trace B). β is the ratio between the actual concentration (Ci )
and the saturation concentration, or solubility (Cs),of the solute to crystallize.
conditions, thermodynamic will govern the process, and thermodynamically stable in-
ternal structures are more likely to obtain [14].
Crystallization, as mentioned, is governed by both thermodynamic and kinetic fac-
tors, which are often difficult to control. Thermodynamics determines the maximum
yield achievable and the chemical composition of the crystalline phase. These two crys-
tallization outputs can be modified by changing temperature, pressure and the initial and
final equilibrium states involved in the crystallization procedure. Cooling/heating rates,
mixing regime, vessel design and cooling profiles can deeply impact the final characteris-
tics of the active compound, such as particle size and crystallinity.
Precipitation from conventional liquid solvents exploits temperature or compositional
variations where the rate-limiting step is related to the thermal conductivity or mass trans-
fer of the medium. In conventional crystallizations, efficient stirring systems are required
to appropriately transmit the temperature and compositional changes through the whole
solution with the aim of achieving large values of β homogeneously all over the system.
Mixing efficiency affects the supersaturation achieved and thereby greatly influences par-
ticle size and distribution pattern. Hence, as in large-scale applications stirring efficien-
8
1.1. Introduction
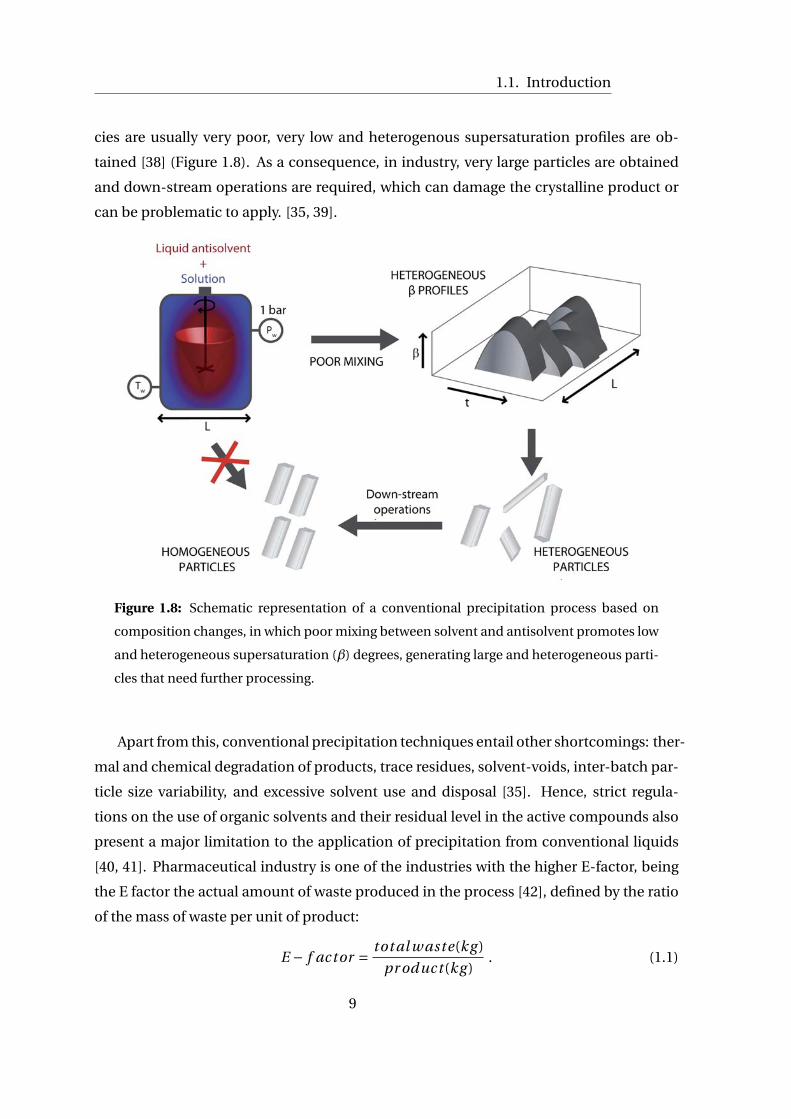
cies are usually very poor, very low and heterogenous supersaturation profiles are ob-
tained [38] (Figure 1.8). As a consequence, in industry, very large particles are obtained
and down-stream operations are required, which can damage the crystalline product or
can be problematic to apply. [35, 39].
Figure 1.8: Schematic representation of a conventional precipitation process based on
composition changes, in which poor mixing between solvent and antisolvent promotes low
and heterogeneous supersaturation (β) degrees, generating large and heterogeneous parti-
cles that need further processing.
Apart from this, conventional precipitation techniques entail other shortcomings: ther-
mal and chemical degradation of products, trace residues, solvent-voids, inter-batch par-
ticle size variability, and excessive solvent use and disposal [35]. Hence, strict regula-
tions on the use of organic solvents and their residual level in the active compounds also
present a major limitation to the application of precipitation from conventional liquids
[40, 41]. Pharmaceutical industry is one of the industries with the higher E-factor, being
the E factor the actual amount of waste produced in the process [42], defined by the ratio
of the mass of waste per unit of product:
E − f actor = tot al w aste(kg )
pr oduct (kg ). (1.1)
9

Chapter 1. Introduction and Objetives
In an effort to reduce the use of volatile organics, pharmaceutical research has fo-
cused on the seek of alternative techniques for material processing. Therefore, the new
paradigm for pharmaceutical industry is to develop robust processing platforms in an en-
vironmentally responsible manner with a high control of process parameters to produce
APIs with will defined product characteristics such as particle size and shape.
Compressed Fluids (CFs)-based technologies appeared in the early 1980s and have
created great expectations in the pharmaceutical industry due to the special features of
CFs that could be exploited. CFs are defined as substances that at normal conditions of
pressure (P ) and temperature (T ) exist as gases but with increased pressure can be con-
verted into liquids or supercritical fluids. The supercritical state is achieved when they are
exposed to conditions above their critical pressure (Pc) and temperature (T c). A single
phase is formed and density greatly varies with small changes in pressure and tempera-
ture close or above the critical point (Figure 1.9). These types of fluids often have liquid-
like densities and, hence, solvating characteristics that are similar to those of liquids, but,
at the same time, they also present gas-like mass transfer properties. These special char-
acteristics start to take place at conditions below but near the critical point (subcritical
region). Table 1.1 shows the physicochemical properties of a CF compared with those of
liquid and gas.
As reflected in Table 1.1 density, viscosity, diffusion coefficient, and heat conductivity
Figure 1.9: P-T Phase diagram of CO2.
10

1.1. Introduction
Table 1.1: Chacteristics of compressed fluids compared to those of liquid and gas.
Property Liquid CF Gas
Density (kg/m3) 1000 200-900 0.6-1
Viscosity (µPa.s) 10−3 10−5-10−4 10−5
Diffusion Coefficient (m2/s) <10−9 10−7-10−8 10−5
Heat conductivity(W/mK) <10−1 10−3-10−1 10−3
values of are between those for liquid and gas. The density of a CF is either the same or
close to that of a liquid, which allows CFs to enhance solubility more than gas could. In
contrast, because its diffusion coefficient is close to that of a gas, the viscosity of a CF is
much lower than that of a gas. These higher diffusivities, lower viscosities and lower sur-
face tension enhance reaction rates. In addition, these physical properties of a CF, such
as density, viscosity, diffusion coefficient, and heat conductivity, can be varied by slightly
changing the temperature and pressure around critical point [9]. Moreover, residual sol-
vent removal by CFs exploits the great diffusivity of the compressed gas as well as the easy
evaporation of organic solvent into the supercritical phase [41].
Other benefits of CFs technologies are linked to the reduced complexity of the process
which stems from a decrease in the number of steps as well as to the improved process
understanding and control while the processing conditions are relatively mild [41]. Tradi-
tional methods for the production of drug microparticles require numerous manufactur-
ing steps that are not required in case of CFs techniques. This brings a huge simplification
and better control of the process.
The most widely used CF is CO2, which is non-toxic, non-flammable, cheap and easy
recyclable. It has gained considerable attention during the past few years as a green sub-
stitute to organic solvents in industrial processing.
A specific advantage of CFs that should be underlined is the almost instantaneous
pressure variation transmission that takes place in CFs, which leads to uniform condi-
tions in the whole solution. In CF-based processes, propagation of the pressure pertur-
bation is correlated to the speed of sound, in contrast to conventional techniques, where
the rate-limiting step is the propagation of temperature and compositional changes. This
extremely fast transmission of pressure changes permits the easy, fast and homogeneous
transmission of diffusion, solvent power and density through the whole solution. As a
11

Chapter 1. Introduction and Objetives
Figure 1.10: Schematic representation of the homogeneous supersaturation (β) profiles
usually achieved by CF-based methods, which result in uniform particles in a single step.
consequence, large levels of supersaturation are attained rapidly and homogeneously
through the bulk solution and hence, nucleation phenomena will dominate crystal growth,
and very small particles will be produced (Figure 1.10). When using CFs as solvents or co-
solvents, large levels of supersaturation which are homogeneous throughout the system
are obtained and, as a consequence, uniform micro and nanoparticulate materials with-
out the need of further downstream operations are obtained [35].
In contrast to conventional particle formation methods, where a larger particle is orig-
inally formed and then comminuted to the desired size, CF technology involves growing
the particles in a controlled manner to attain the desired morphology [40]. This means
that the rigid solid particle, once formed, does not have to undergo the thermal and me-
chanical stresses. This feature makes compressed fluid technology amenable to produce
biomolecules and other sensitive compounds in their native pure state [40].
There are different available CF-based technologies for the preparation of APIs with
12

1.1. Introduction
controlled physical properties which will be introduced in the following Chapters of this
Thesis. Nanomol group (ICMAB-CSIC), where the present Thesis has been conducted,
developed a method based on the use of CO2-expanded solvents ten years ago. CO2-
expanded solvents are mixed solvents composed of compressed CO2 (cCO2) dissolved in
an organic solvent. By varying the CO2 composition, a continuum of liquid media rang-
ing from the neat organic solvent to cCO2 is generated, the properties of which can be ad-
justed by tuning the operating pressure. For example, a large amount of CO2 favors mass
transfer and, in many cases, gas solubility, and the presence of polar organic solvents en-
hances the solubility of solid and liquid solutes. CO2-expanded solvents have been shown
to be optimal solvents in a variety of roles including inducing separations, precipitating
fine particles, facilitating polymer processing, and serving as reaction media for catalytic
reactions. Process advantages include ease of removal of the CO2, enhanced solubility of
reagent gases (compared to liquid solvents), fire suppression capability of the CO2, and
mild process pressures (tens of bars). Reaction advantages include higher gas miscibility
compared to organic solvents at ambient conditions, enhanced transport rates due to the
properties of dense CO2, and between 1 and 2 orders of magnitude greater rates than in
neat organic solvent or cCO2. Environmental advantages include substantial replacement
of organic solvents with environmentally benign dense-phase CO2. Thus, CO2-expanded
solvents have emerged as important components in the optimization of chemical pro-
cesses [43].
From a technical view, CF particle design technology, as it applies to production of
pharmaceutical active ingredients, is in its infancy [9]. Although large-scale commercial
use of CF technology has been successfully used to decaffeinate coffee and tea, as well as
extract spices, hops, and flavoring, it has not yet become the first choice technology for
particle design in the pharmaceutical industry. The reason behind this may be the cost of
installing Good Manufacturing Practices (GMP)-compliant equipment, and the relatively
limited experience of most manufacturers with commercial production scale-up of this
type of technology. A study published [44] at the beginning of the century on scale-up
for particle formulation cast a positive light on the idea. The study offers evidence that
commercial-scale CF facilities can be successful not only for the food and dry cleaning
industries, but also for pharmaceutical particle design. Therefore, industry may slowly
be realizing that GMP compliance is not a true obstacle to CF processing. In addition, it
has been demonstrated before that large capacity plants, with optimized design and op-
eration, lead to prices that are very often, and surprisingly for many people, of the same
13

Chapter 1. Introduction and Objetives
order of magnitude as those related to classical processes submitted to similar constraints
in terms of environmental and consumer protection. Moreover, there are also cases where
compressed fluids permit to make products or operations that cannot be realized by any
other means [45]. Use of cutting-edge technologies such CF can lead to great improve-
ments in the commercialized production methods for particle formulation. The end re-
sult will be enhanced drug bioavailability, which will improve the overall performance of
the drug, and more environmentally friendly manufacturing methods.
14
1.2. Objectives
1.2 Objectives
• This Phd Thesis aims to improve the knowledge of CO2-expanded solvents for the
controlled precipitation of two poorly soluble drugs: the widely known ibuprofen
and a newly discovered drug, which its precipitation from conventional cooling
methods yields very long needles and, as a result, the drug presents a cotton-like
appearance, which hinders its micronization by conventional techniques.
• Commercial application of CO2-expanded solvent-based precipitation technology
requires predictability, consistency and reproducibility of the final physical proper-
ties of the drugs precipitated. For this, a detail and comprehensive understanding of
the influence of all the relevant process parameters and the CO2-expanded solvent
fundamentals is essential. In light of this need, one of the aims of the present Thesis
is to gain more knowledge of all the mechanisms that occurs in a CO2-expanded
solvent-based precipitation method for the production of finely dispersed solids
and liquid suspensions of poorly water soluble drugs.
• In addition, although CFs present unique properties, one limitation for the applica-
tion of CO2-based process is the low solubility of many compounds in CO2. Based
on this, this Thesis also aims to extend the use of cCO2 by preparing microemulsion-
like systems composed of water and CO2-expanded solvents, which can be consid-
ered universal green solvents. This new systems can potentially be used as nano
templates.
15

Chapter 1. Introduction and Objetives
16

Bibliography
[1] A. Fahr and X. Liu, “Drug delivery strategies for poorly water-soluble drugs,” Expert
Opinion on Drug Delivery, vol. 4, no. 4, pp. 403–416, 2007.
[2] S. Venkatesh and R. Lipper, “Role of the development scientist in compound lead se-
lection and optimization,” Journal of Pharmaceutical Sciences, vol. 89, no. 2, pp. 145–
154, 2000.
[3] C.-K. Kim and J.-S. Park, “Solubility enhancers for oral drug delivery: Can chemical
structure manipulation be avoided?,” American Journal of Drug Delivery, vol. 2, no. 2,
pp. 113–130, 2004.
[4] S. Stegemann, F. Leveiller, D. Franchi, H. de Jong, and H. Lindén, “When poor solu-
bility becomes an issue: From early stage to proof of concept,” European Journal of
Pharmaceutical Sciences, vol. 31, no. 5, pp. 249–261, 2007.
[5] T. Takagi, C. Ramachandran, M. Bermejo, S. Yamashita, L. Yu, and G. Amidon, “A
provisional biopharmaceutical classification of the top 200 oral drug products in the
united states, great britain, spain, and japan,” Molecular Pharmaceutics, vol. 3, no. 6,
pp. 631–643, 2006.
[6] C. Lipinski, “Poor aqueous solubility - an industry wide problem in drug discovery,”
American Pharmaceutical Review, vol. 5, no. 3, pp. 82–85, 2002.
[7] E. Merisko-Liversidge and G. Liversidge, “Nanosizing for oral and parenteral drug
delivery: A perspective on formulating poorly-water soluble compounds using wet
media milling technology,” Advanced Drug Delivery Reviews, vol. 63, no. 6, pp. 427–
440, 2011.
17

Bibliography
[8] L. Gao, G. Liu, J. Ma, X. Wang, L. Zhou, X. Li, and F. Wang, “Application of drug
nanocrystal technologies on oral drug delivery of poorly soluble drugs,” Pharma-
ceutical Research, vol. 30, no. 2, pp. 307–324, 2013.
[9] T. Yasuji, H. Takeuchi, and Y. Kawashima, “Particle design of poorly water-soluble
drug substances using supercritical fluid technologies,” Advanced Drug Delivery Re-
views, vol. 60, no. 3, pp. 388–398, 2008.
[10] S. Verma, R. Gokhale, and D. Burgess, “A comparative study of top-down and bottom-
up approaches for the preparation of micro/nanosuspensions,” International Jour-
nal of Pharmaceutics, vol. 380, no. 1-2, pp. 216–222, 2009.
[11] D. Lewis, M. Jacobs, and M. Dickins, “Compound lipophilicity for substrate binding
to human p450s in drug metabolism,” Drug Discovery Today, vol. 9, no. 12, pp. 530–
537, 2004.
[12] J. Hu, K. Johnston, and R. Williams III, “Nanoparticle engineering processes for en-
hancing the dissolution rates of poorly water soluble drugs,” Drug Development and
Industrial Pharmacy, vol. 30, no. 3, pp. 233–245, 2004.
[13] N. Rasenack and R. Müller, “Dissolution rate enhancement by in situ micronization
of poorly water-soluble drugs,” Pharmaceutical Research, vol. 19, no. 12, pp. 1894–
1900, 2002.
[14] N. Variankaval, A. Cote, and M. Doherty, “From form to function: Crystallization
of active pharmaceutical ingredients,” AIChE Journal, vol. 54, no. 7, pp. 1682–1688,
2008.
[15] E. Moreno-Calvo, On the polymorphism and structural characterization in the family
of even saturated carboxylic acids. PhD thesis, Universidad de Barcelona., 2008.
[16] K. Chow, H. Tong, S. Lum, and A. Chow, “Engineering of pharmaceutical materi-
als: An industrial perspective,” Journal of Pharmaceutical Sciences, vol. 97, no. 8,
pp. 2855–2877, 2008.
[17] H. Cano, N. Gabas, and J. Canselier, “Experimental study on the ibuprofen crystal
growth morphology in solution,” Journal of Crystal Growth, vol. 224, no. 3-4, pp. 335–
341, 2001.
18

Bibliography
[18] N. Rasenack and B. W. Muller, “Ibuprofen crystals with optimized properties,” Inter-
national Journal of Pharmaceutics, vol. 245, pp. 9 – 24, 2002.
[19] K. Adrjanowicz, K. Kaminski, Z. Wojnarowska, M. Dulski, L. Hawelek, S. Pawlus,
M. Paluch, and W. Sawicki, “Dielectric relaxation and crystallization kinetics of
ibuprofen at ambient and elevated pressure,” Journal of Physical Chemistry B,
vol. 114, no. 19, pp. 6579–6593, 2010.
[20] N. Rasenack, H. Steckel, and B. Muller, “Preparation of microcrystals by in situ mi-
cronization,” Powder Technology, vol. 143-144, pp. 291–296, 2004.
[21] J. Bradley, K. Brandt, B. Katz, L. Kalasinski, and S. Ryan, “Comparison of an antiin-
flammatory dose of ibuprofen, an analgesic dose of ibuprofen, and acetaminophen
in the treatment of patients with osteoarthritis of the knee,” New England Journal of
Medicine, vol. 325, no. 2, pp. 87–91, 1991.
[22] S. Adams, P. Bresloff, and C. Mason, “Pharmacological differences between the opti-
cal isomers of ibuprofen: evidence for metabolic inversion of the (-) isomer,” Journal
of Pharmacy and Pharmacology, vol. 28, no. 3, pp. 256–257, 1976.
[23] N. Kasim, “Molecular properties of who essential drugs and provisional biopharma-
ceutical classification.,” Mol Pharm, vol. 1, no. 1, pp. 85–96, 2004.
[24] M. Lindenberg, S. Kopp, and J. Dressman, “Classification of orally administered
drugs on the world health organization model list of essential medicines according
to the biopharmaceutics classification system,” European Journal of Pharmaceutics
and Biopharmaceutics, vol. 58, no. 2, pp. 265–278, 2004.
[25] L. Seton, M. Roberts, and F. Ur-Rehman, “Compaction of recrystallised ibuprofen,”
Chemical Engineering Journal, vol. 164, no. 2-3, pp. 449–452, 2010.
[26] Y. Obidchenko, N. Khuchua, R. Abramovich, A. Savochkina, A. Karamyan, S. Bars-
egyan, Y. Khomyakov, M. Ovcharov, and V. Chistyakov, “Preparation of micronized
ibuprofen substance and assessment of its bioavailability,” Pharmaceutical Chem-
istry Journal, vol. 47, no. 7, pp. 382–386, 2013.
[27] G. Amidon, H. Lennernas, V. Shah, and J. Crison, “A theoretical basis for a biophar-
maceutic drug classification: The correlation of in vitro drug product dissolution and
in vivo bioavailability,” Pharmaceutical Research, vol. 12, no. 3, pp. 413–420, 1995.
19

Bibliography
[28] J. Chen and B. Trout, “Computer-aided solvent selection for improving the mor-
phology of needle-like crystals: A case study of 2,6-dihydroxybenzoic acid,” Crystal
Growth and Design, vol. 10, no. 10, pp. 4379–4388, 2010.
[29] F. Kesisoglou, S. Panmai, and Y. Wu, “Nanosizing - oral formulation development
and biopharmaceutical evaluation,” Advanced Drug Delivery Reviews, vol. 59, no. 7,
pp. 631–644, 2007.
[30] V. Patravale, A. Date, and R. Kulkarni, “Nanosuspensions: A promising drug delivery
strategy,” Journal of Pharmacy and Pharmacology, vol. 56, no. 7, pp. 827–840, 2004.
[31] B. E. Rabinow, “Nanosuspensions in drug delivery,” Nature Reviews Drug Discovery,
vol. 3, no. 9, pp. 785–796, 2004.
[32] X. Zhang, Q. Xia, and N. Gu, “Preparation of all-trans retinoic acid nanosuspensions
using a modified precipitation method,” Drug Development and Industrial Phar-
macy, vol. 32, no. 7, pp. 857–863, 2006.
[33] H. de Waard, W. Hinrichs, and H. Frijlink, “A novel bottom-up process to produce
drug nanocrystals: Controlled crystallization during freeze-drying,” Journal of Con-
trolled Release, vol. 128, no. 2, pp. 179–183, 2008.
[34] J. Mullin Crystallization, 1993.
[35] I. Pasquali, R. Bettini, and F. Giordano, “Supercritical fluid technologies: An innova-
tive approach for manipulating the solid-state of pharmaceuticals,” Advanced Drug
Delivery Reviews, vol. 60, no. 3, pp. 399 – 410, 2008.
[36] D. Horn and J. Rieger, “Organic nanoparticles in the aqueous phase - theory, experi-
ment, and use,” Angewandte Chemie - International Edition, vol. 40, no. 23, pp. 4330–
4361, 2001.
[37] M. Löffelmann and A. Mersmann, “How to measure supersaturation?,” Chemical En-
gineering Science, vol. 57, no. 20, pp. 4301–4310, 2002.
[38] B. Sinha, R. Müller, and J. Mschwitzer, “Bottom-up approaches for preparing drug
nanocrystals: Formulations and factors affecting particle size,” International Journal
of Pharmaceutics, vol. 453, no. 1, pp. 126–141, 2013.
20

Bibliography
[39] E. Elizondo, J. Veciana, and N. Ventosa, “Nanostructuring molecular materials as
particles and vesicles for drug delivery, using compressed and supercritical fluids,”
Nanomedicine, vol. 7, no. 9, pp. 1391–1408, 2012.
[40] C. Vemavarapu, M. J. Mollan, M. Lodaya, and T. E. Needham, “Design and process
aspects of laboratory scale {SCF} particle formation systems,” International Journal
of Pharmaceutics, vol. 292, no. 1, pp. 1 – 16, 2005.
[41] I. Pasquali and R. Bettini, “Are pharmaceutics really going supercritical?,” Interna-
tional Journal of Pharmaceutics, vol. 364, no. 2, pp. 176 – 187, 2008.
[42] R. Sheldon, “The e factor: Fifteen years on,” Green Chemistry, vol. 9, no. 12, pp. 1273–
1283, 2007.
[43] P. G. Jessop and B. Subramaniam, “Gas-expanded liquids,” Chemical Reviews,
vol. 107, no. 6, pp. 2666–2694, 2007.
[44] M. Perrut, “Supercritical fluids applications in the pharmaceutical industry,” S.T.P.
Pharma Sciences, vol. 13, no. 2, pp. 83–91, 2003.
[45] M. Perrut, “Supercritical fluid applications: Industrial developments and economic
issues,” Industrial & Engineering Chemistry Research, vol. 39, no. 12, pp. 4531–4535,
2000.
21

Bibliography
22

2Micronization of APIs using compressed
fluids
2.1 Introduction
2.1.1 Particle Engineering in the Pharmaceutical Industry
Pharmaceutical materials science is a discipline which deals with the application of phys-
ical principles common in materials science in areas such as drug delivery, control of the
drug form, manufacture and processing of nanoscopic and microscopic particle systems,
and the structure and properties of bulk powders and their assemblies for use in phar-
maceutical applications [1]. This new area of material science arises from the urge of
obtaining reproducible drugs with a specifically tailored form and size at the micro and
nanoscale. This is a major issue that must be addressed by chemist, materials scientifics,
engineers and pharmaceutical formulators.
Specific characteristics of particles such as size, surface, crystal structure and mor-
phology are among the most important factors to control biopharmaceutical properties
23

Chapter 2. Micronization of APIs using compressed fluids
of drug products [2]. Particle shape affects the efficiency of downstream processes (filtra-
tion, washing and drying). It also influences material properties such as the bulk density
and the mechanical strength, which play a significant role in storage and handling. Aci-
cular crystal habit is undesirable from a product manufacturing point of view because
it entails poor powder flow properties, poor filtration characteristics, tendency to cake,
and brittleness [3]. Brittle particles often fracture upon handling, which may result in a
polydisperse particle size distribution which it is unfavorable since they adversely affect
powder mixing phenomena, provide poor content uniformity, and afford the possibility
of particle segregation in mixed materials [4]. Furthermore, pharmaceutical powders with
an acicular habit are typically cohesive and present a high compressibility [5]. A high com-
pressibility is indicative of a non-free flowing powder [6], which makes product tableting
difficult and inefficient. The shape of grown crystals depend on the internal structure of
crystals (e.g. space group, intramolecular and intermolecular bonding) and on the exter-
nal conditions of growth (e.g. temperature, pressure, supersaturation, solvents, additives
or impurities) [7].
Particle size and shape can influence a large variety of important physical properties,
manufacturing processability and quality attributes of active pharmaceutical pharma-
ceutical ingredients (APIs) including:
• Dissolution rate and bioavailability of active pharmaceutical ingredients
• Drug release rate for sustained and controlled release formulations
• In vivo particle distribution and depositions
• Absorption rate and clearance time, especially for aerosols and different colloid sys-
tems designed for targeted drug delivery
• Content and dose uniformity and other properties related to the physicochemical
stability
• Aerosoization behavior and performance of respiratory formulations
• Flow and packing properties, mixing and segregation of powders, rheological char-
acteristics of liquid ans semisolid formulations
• "Grittiness" (grainy perception) of solid particles in chewable tablets, dermal oint-
ments and creams
24

2.1. Introduction
All these properties ultimate affect the safety and efficacy of drugs [8]. One of the most
critical properties to the performance of a drug in humans is its plasma concentration
profile, frequently referred to as bioavailability. Bioavailability is the fraction of adminis-
tered dose of drug that reaches systemic circulation and is an important pharmacokinetic
property of the solid-state of the drug. Hence, the formulation needs to be optimized to
ensure that sufficient drug will be available to engage the target in humans and be effica-
cious.
As claimed in the Introduction of this Thesis (Chapter 1), micronization is a suitable
approach to successfully enhance bioavailability of drugs when the dissolution velocity
is the rate limiting step, that is for drugs belonging to Class II of the Biopharmaceutical
Classification system. The main reason for the increased dissolution velocity, and thus
improved bioavailability, for microparticles is by surface area enlargement: size reduc-
tion leads to an increased surface area and hence, according to the Noyes-Whitney [9]
equation to a better dissolution velocity. The Noyes-Whitney equation derives from the
Fick’s law and it is expressed as:
dC
d t= D ∗ A∗ (CS −Cb)
V h, (2.1)
in which dC /d t is the dissolution rate of a drug formulation, D is the diffusion coeffi-
cient, A is the surface area of drug exposed to the dissolution media, CS is the saturation
solubility of the drug, Cb is the concentration of drug in solution, V is the volume of the
dissolution media, and h is the thickness of the diffusion layer at the solid-liquid interface.
The diffusion layer, h, should be small for small particles [10]. As it is reflected in this ex-
pression (equation 2.1), the dissolution rate (dC /d t ) of a drug is directly proportional to
its surface area (A), hence, decreasing particle size is a successful approach for increasing
dissolution of drugs.
Figure 2.1: Surface enlargement.
25

Chapter 2. Micronization of APIs using compressed fluids
Commercially used processes for micronization include mechanical milling, recrys-
tallization, solid dispersion, freeze drying, and spray drying. However, these processes
have limitations that include organic solvent use, thermal degradation, large residual sol-
vent content, and difficulties in controlling particle size and size distribution during pro-
cessing. These limitations affect drug particle stability, powder flow properties, and effi-
ciency of the delivery system [11].
Current practices of API particle-size control often involve some type of size reduc-
tion subsequent to crystallization (Figure 2.2) in order to achieve some or all of the fol-
lowing objectives: break up needles or elongated rods into smaller aspect ratio particles,
reduce the mean particle size significantly from that achieved during crystallization, re-
duce batch-to-batch variations, or create a more monodisperse distribution of sizes. This
size reduction often implies micronization by mechanical disruption process either by
milling techniques, such as jetmilling, milling in a pearl-ball-mill, or by high-pressure ho-
mogenization. The physical properties of drugs strongly influence the performance of
these techniques and they are not suitable for thermolabiles, waxy or materials with low
packing density, such as needle-like particles.
However, dry milling (pin or jet milling) has a number of liabilities resulting from the
mechanical disruption process that can alter the surface properties as a thermodynami-
cally activated surface is created [12]. Other disadvantages are:
∗ serious industrial hygiene concerns due to dust generation
∗ crystal form/crystallinity may be impossible to preserve across the milling step
∗ the product from dry milling is often rich in fines and/or highly electrostatic making
downstream processing difficult
∗ is a very expensive operation
These drivers are leading the industry to adopt strategies that incorporate particle size
and shape control into the final crystallization directly so that terminal dry milling can
be eliminated from factory processes. As mention in the Introduction (Chapter 1) com-
pressed fluid technology is an outcome of such research with particular emphasis in green
synthesis and particle formation.
26

2.1. Introduction
Figure 2.2: Steps required in conventional micronization vs Single step supercritical fluid
micronization.
2.1.2 Crystallization of microparticulate APIs using compressed fluids
As mentioned in the Introduction (Chapter 1), the most widely used compressed fluid
(CF) is CO2 because it is nontoxic, nonflammable and easy recyclable. Apart from being
considered a green solvent [13], the moderate critical parameters of CO2 (Pc = 7.4 MPa,
Tc = 304.1K) together with its low price and high availability make CO2-based technology
very attractive from an economical perspective [14]. Processes using CO2 are developed
in a non- oxidizing atmosphere and without the need for the application of high shear
forces, which makes them particularly suitable for the processing of thermally, chemically
or physically labile materials, such as biological compounds, chemical intermediates and
pharmaceuticals. In this sense, precipitation technologies using compressed CO2 (cCO2)
hold a great deal of promise in the pharmaceutical industry [15].
The physicochemical properties of compressed CO2 (cCO2) are key factors in particle
design. In particular, solubility in cCO2 is the major prerequisite for designing particles
27

Chapter 2. Micronization of APIs using compressed fluids
using this dense gas as a crystallization solvent media.
To choose a process for particle design, the first thing to consider is the solubility of
the substance to be crystallized in the compressed fluid. The choice between different
methods will then be made considering the desired particle size, shape and structure,
processing costs and production scale [16]. The study of the molecular constituents phase
behavior in pure CO2 or CO2-expanded solvents becomes crucial, and constitutes an im-
portant first step towards successful achievement of a particulate material. One of the
most effective methods for performing such studies implies the use of a high pressure
variable volume cell equipped with windows that allow visualization of its interior. Solu-
bility measurements help to prevent time and economic expenses derived from trial-and-
error procedures and constitute a valuable tool to select the most convenient CF-based
process for the preparation of particulate materials.
As one of the main objectives of using CO2 is to avoid the presence of organic solvents
in the processing of compounds, the study of the phase behavior in pure CO2 is usually
the first step when performing solubility studies. A certain amount of the compound of
interest is placed inside the high pressure phase analyzer at the working conditions of
temperature and pressure. The addition of CO2 into the cell could lead to three different
scenarios: the progressive dissolution of the solid in CO2, the swelling of the CO2 inside
the solid or neither situation. This last case is the most common behavior for the major
of drugs, polymers and polar substances. In the latter, further studies in CO2-expanded
mixtures would be required [17].
In order to get the solubility curve of a compound in the mixture of organic solvent
and CO2, the solubility of the compound in the pure organic solvent and in pure CO2
need to be measured, as well as the solubility of the compound in the mixture of organic
solvent/CO2 at different CO2 concentrations. One of the most widely used method to
measure the solubility of a compound in a CO2-expanded mixture is called the Vanish-
ing method [18] which it is explained in detail in Section 6.2.2 of the Experimental Part.
Examples of solubility curves are depicted in Figure 2.3 where it is shown the very dif-
ferent scenarios that can occur when adding CO2 to a solution of a solid in an organic
solvent. The behavior is defined by the minimum composition from which the CO2 starts
to provoke the precipitation of the compound, such value can be extracted from the inter-
section of the solubility curve with the ideal dilution line of the compound in the organic
solvent/CO2 mixture. This intersection is defined as the limit molar fraction of CO2 (xL),
as above this value, CO2 will cause the precipitation of the drug. The ideal dilution line
28

2.1. Introduction
defines the expected solubility variation in an ideal process. In an ideal dilution, solubility
in a mixture of solvents varies linearly with the mixture composition.
The solubility behavior of ibuprofen in CO2-expanded acetone shows that CO2 acts
as a cosolvent until molar fractions of 0.82 (Figure 2.3a), whereas in the case of naproxen
(Figure 2.3b), the addition of CO2 over a solution of the drug in acetone causes the precipi-
tation of the drug, revealing the antisolvent character of CO2 from very low molar fractions
of CO2 (xCO2 ) [19]. Moreover, CO2 can show a synergic behavior with the organic solvent,
as was observed in the solubility behavior of hexamethylenetetramine in CO2-expaned
ethanol (Figure 2.3c) [20].
Figure 2.3: Solubility curves of a) ibuprofen, b) naproxen in CO2-expanded acetone at 10
MPa and 298 K and c) hexamethylenetetramine in CO2-expanded ethanol at 10MPa and
313K. Dashed lines represent the ideal dilution line, which connects linearly the solubility
values of the compound in the organic solvent and in CO2. xL is the molar fraction of CO2
where the solubility curve cross the ideal dilution line.
On the basis of the different solubility behaviors that a solute might have in pure CO2
or in mixtures of CO2-organic solvents, several precipitation processes have been devel-
oped to produce micro and nanoparticulate APIs in a single step as it is depicted in Figure
2.4. These precipitation processes can be classified into different groups depending on
whether the CF, usually CO2, acts as a solvent, antisolvent, solute or cosolvent with re-
spect to the material to precipitate .When CO2 is used as a solvent, the size distribution
and morphology of the particles produced are a function of the concentration of the ma-
terials in CO2 and the subsequent expansion conditions. In contrast, the CO2 anti-solvent
process is based on the change in the solubilization power of a solvent that results from
adding CO2 to it, as well as the miscibility of that solvent in CO2 [21].
29

Chapter 2. Micronization of APIs using compressed fluids
Figure 2.4: CF-based processes using either pure CO2 or CO2-expanded solvents. Adapted
from [15].
• CF as a Solvent: Rapid Expansion of Supercritical Solutions (RESS) process
Here, the solute is first solubilized in the supercritical fluid. The solution is then
expanded across a nozzle or capillary at supersonic velocities. The rapid expansion
leads to supersaturation of the solute due to an abrupt decrease of the dense fans
solvating power and subsequent precipitation of virtually contaminant-free parti-
cles. The RESS process has been demonstrated to produce contaminant-free mi-
cro particles ranging from a few microns to several hundred microns, but some
examples in the literature report nanometric particles using appropriate nozzles
[22, 23, 24]. The RESS process has also been applied for coprecipitation of solutes
[25]. The facts that affect particle size and morphology in the RESS process include
the length/diameter ratio of the expansion device, the RESS time scale dictated by
the expansion trajectory from the preheater and the expansion device, and particle
agglomeration during free jet expansion [16]. A major limitation of the RESS process
is that, at moderate temperatures and pressures (60◦Cand 300 bars), the solubility of
30

2.1. Introduction
compounds in CO2 is on the order of 0.01wt% or less. Indeed, the high temperatures
that are often required make this process unsuitable for labile polymers and drugs.
A large amount of fluid is needed to produce a small yield, hence, RESS process is a
comparatively costly technique.
• CF as a solute: Particles from Gas Saturated Solutions (PGSS) process
As the solubility of compressed gases in liquids and solid-like polymers is usually
high and much higher than the solubility of such liquids and solids in the com-
pressed gas phase, the PGSS process consists in solubilizing supercritical CO2 in
melted or liquid-suspended substances, leading to a so-called gas-saturated solu-
tion/ suspension. When this solution is rapidly depressurized through a nozzle,
microparticles can be formed due to the reduction in temperature and atomization
experienced by the gas saturated solution during the expansion, which leads to the
solidification of the melt in a micro particulate form. Advantages of PGSS process
include the lack of necessity for the solute to be soluble in CO2 and the absence of
solvents. However, its main limitation is the melting of the compound, which can
be problematic for heat- sensitive molecules. In order to tackle this problem, some
drugs have been processed with polyethylene glycol 4000, which dissolves the drugs
and lowers their melting point allowing its precipitation at milder conditions.
• CF as an antisolvent
cCO2 is a relatively poor solvent for most polymers and pharmaceutical compounds,
therefore, these relatively low solubilities are exploited in this process wherein the
solute of interest is dissolved in a conventional solvent to form a solution. The pre-
ferred ternary phase behavior is such that the solute is virtually insoluble in com-
pressed cCO2 while the solvent is completely miscible with cCO2 at the recrystal-
lization process temperature and pressure. The advantage of processes using CO2
as an antisolvent in comparison to conventional precipitation techniques is that
powders may be produced at ambient temperatures, in a low shear environment
and with a low level of oxygen exposure. All these considerations are relevant for
the production of drug and protein powders. It also has the advantages of having
a higher solute throughput and flexibility of solvent choice. Antisolvent techniques
are probably the most used for the micronization of pure active drugs and polymers
from particles sizes ranging from nanometers to microns. The solute can be recrys-
31

Chapter 2. Micronization of APIs using compressed fluids
tallized in two ways:
– In the Gas Anti-Solvent (GAS) process a batch of solution is expanded several-
fold by mixing with dense CO2 in a vessel. Because the CO2 expanded solvent
has a lower solvent strength that the pure solvent, the mixtures become super-
saturated, forcing the solute to precipitate or crystallize as micro particles.
– The Precipitation with Compressed Anti-solvents (PCA) process, involves the
spraying of solution through a nozzle as fine droplets into compressed CO2.
Using PCA-like methods, precipitates with a high residual solvent content are
generally achieved and lengthy drying periods are usually required, which of-
ten leads to particle agglomeration and aggregation. This inconvenience can
be reduced by promoting a better mass transfer between the supercritical anti-
solvent and the solution during its spraying, which can be achieved by favoring
intensive mixing between both fluids, for example, using an ultrasonic nozzle.
• CF as a co-solvent
In contrast to antisolvent techniques, DELOS (Depressurization of an Expanded
Solution) process takes advantage of the cosolvent behavior that CO2 can present
over solutions of compounds in certain organic solvents [26]. In this method, CO2
is added to an organic solution of the compound(s) to precipitate, resulting in a
new pressurized solution, usually at pressures lower than 10MPa, in which the sol-
vent medium is formed by the CO2-expanded mixture. The rapid evaporation of
the CO2 upon depressurization of the solution generates an abrupt, fast and ho-
mogeneous cooling that provokes the straightforward precipitation of the solute as
micro or submicronparticles. This abrupt and homogeneous temperature reduc-
tion produced during the depressurization of the CO2-expanded solution generates
a pronounced and very uniform increase of the supersaturation in every point of
the solution, favoring the assembling of solute molecules through homogeneous
primary nucleation rather than by crystal growth, and promoting the formation of
micro or submicron sized particles with narrow particle size distributions and ex-
ceptional supramolecular structural homogeneity. The use of CO2-expanded sol-
vents instead of pure CO2 offers numerous advantages for novel process develop-
ment including enhanced solubilities of polar organic compounds and tunability
of their solvent properties [17]. DELOS method takes profit of the advantages of
32

2.1. Introduction
CO2-based processing while avoiding the use of severe working conditions. This
methodology use milder conditions of pressure (10MPa) and temperature (308K)
than most of the described methodologies. Lower temperatures allow the process-
ing of heat-labile compounds, while milder pressures would reduce the capital cost
of a high-pressure plant when scaling up the process.
In Table 2.5 is gathered comparative data from different CO2-based precipitation process.
Figure 2.5: Comparison of different CO2-based techniques.
In DELOS, CO2 acts as a cosolvent, which allows to work with more concentrated so-
lutions than in technologies using pure CO2. This makes possible to precipitate higher
amounts of polar and high molecular weight compounds than in RESS process, working
at lower pressures. In addition, this method is suitable for drugs with low melting point
or for polymers that are not able to absorb high quantities of CO2. In comparison to other
CF crystallization techniques, like RESS and PCA, DELOS process requires mild working
pressures, which is a crucial parameter in the economical evaluation of the process for
industrial applications. In cases when CO2 acts as anti solvent, the most suitable pro-
cesses are GAS and PCA. The PGSS method can only be applied when drugs melt and can
dissolve a significant amount of CO2 at the working conditions.
The collection of particles in DELOS in performed in a filter at atmospheric pressure,
however in PCA and GAS technologies, the collection is conducted at high pressure, and
therefore the operation of such processes in a continuous mode is much more compli-
33

Chapter 2. Micronization of APIs using compressed fluids
cated. Another important parameter when comparing CO2-based technologies is the
complexity of the facilities. It is important to bear in mind that as working pressure in-
creases, the cost associated to the high-pressure equipment is also increased, especially
when scaling-up. In this way, DELOS is presented as a promising alternative as it does
not required high pressures. The working pressures in GAS method are very similar to the
ones employed in DELOS, however, in GAS precipitation, the formation of the particles
relies on the efficient stirring of the mixture, which makes the scalability more complex
and increase the final cost. In PGSS, PCA and RESS the need of a nozzle also hampers the
scalability of the process.
2.1.3 DELOS process
DELOS method procedure consists of three stages which are depicted in Figure 2.6. First,
the solid to be crystallized is dissolved in an organic solvent at atmospheric pressure and
working temperature (TW ) to form a solution with an initial concentration (Ci ) which is
charged into the high-pressure vessel. Second, the initial solution is pressurized up to the
working pressure (PW ) by the addition of a given amount of CO2, expressed by the CO2
molar fraction of the mixture organic solvent/CO2 (xW ). In this second stage, the solute
concentration (CW ) should remain below the saturation limit in the CO2-expanded mix-
ture. That is, the solute is soluble in the CO2-expanded mixture showing a single liquid
phase. Finally, the solution is depressurized from the working pressure (PW ) to atmo-
spheric pressure, through a nonreturn simple valve. During the depressurization, CO2
evaporates very rapidly from the solution producing a large, fast, and extremely homoge-
neous decrease of the solution temperature down to a final temperature (TF ). The parti-
cles precipitated, due to this temperature decrease, are filtrated at atmospheric pressure.
The equipment and protocols used in the present Thesis for DELOS experiments are de-
scribed in Section 6.3.2 of the Experimental Part.
DELOS process is suitable for the preparation of drugs as micro and nano particu-
late materials, when CO2 behaves as a co-solvent in the mixture of the drug in the CO2-
expanded solvent at the working conditions of pressure and temperature. Therefore, it
is essential to have a good understanding of the solubility behavior of the compound of
interest in the appropriate CO2-expanded solvent system for optimal design of a success-
ful DELOS experiment. Another requirement for an adequate DELOS experiment is that
the solubility of the drug in the organic solvent should strongly depend on temperature.
34

2.1. Introduction
Figure 2.6: Steps in the DELOS process
Hence, apart from knowledge of the phase behavior of the drug in the CO2-expanded sol-
vent, information regarding the solubility dependence with temperature of the drug in
the organic solution is also essential.
35

Chapter 2. Micronization of APIs using compressed fluids
Thermodynamical considerations of DELOS method
Differently from conventional cooling crystallization processes, it can be assumed in this
case, the final temperature (TF ) obtained after depressurization is reached before primary
nucleation takes place. Therefore, as schematized in Figure 2.6, the initial solute concen-
tration is re-establish (CF = Ci ). The magnitude of the temperature decrease, defined as
∆T = TF -TW determines the yield and the characteristics of the crystalline particles pro-
duced. It has been demonstrated that changes on the flow rate through the depressuriza-
tion valve and on the working pressure (PW ) keeping the molar fraction of CO2 constant
(xW ), do not affect ∆T [27]. This result is very important from a practical point of view
since it allows to reduce PW to a much lower value than those used in other high pressure
crystallization techniques, without affecting the yield neither the final characteristics of
the precipitate. The magnitude of the temperature decrease is determined by the nature
of the solvent employed in the process and the CO2 content (xW ) of the expanded solu-
tion before its depressurization. During the depressurization of the expanded solution,
CO2 goes from the liquid state at PW to the vapor state at atmospheric pressure. Since
DELOS process is an adiabatic process, the heat required for the CO2 vaporization must
be extracted from the liquid solution and as a consequence, the solution experience the
large, abrupt and homogenous decrease of temperature [27]. The heat required (qR ) for
the vaporization of CO2 is the vaporization enthalpy:
qR =∆Hvap ·nCO2 , (2.2)
where ∆H is the vaporization enthalpy and nCO2 is the number of CO2 moles. As this is
an adiabatic process, the heat required for the vaporization of CO2 should be the same as
the extracted heat (qE ):
qE = qR . (2.3)
The extracted heat is given by:
qE = n(di s) ·C p(di s) ·∆T , (2.4)
where n(di s) is the moles of the solution and C p(di s) is the specific heat of the solvent.
Hence, as a consequence, the decrease in temperature (∆T ) experienced by the solution
depends on the organic solvent and the mass of solvent as well as the molar fraction of
CO2:
∆T = ∆Hvap ·nCO2
n(di s) ·Cp(di s). (2.5)
36

2.1. Introduction
It can be inferred from expression 2.5, that as larger is the CO2 content (nCO2), larger will
be the temperature decrease ∆T .
Under the conditions of DELOS crystallization, it could be considered that the differ-
ence between the initial concentration of the compound in the organic solution (Ci ), and
the solute solubility in the organic solvent at the final temperature reached after depres-
surization (C SF ) is the maximum supersaturation achieved (∆C =CI -CS
F ). Thus, the higher
∆C , the higher the maximum supersaturation attained, and nucleation will be more fa-
vored than crystal growth provoking the crystallization of small particles. The process
parameters that affect ∆C are the initial concentration of the compound in the organic
solvent (Ci ) and the CO2 content (xW ), as the latter will determine the final temperature
achieved after depressurization (TF ) and this value will define the solubility of the com-
pound in the organic solution (C SF ). The higher the xW and Ci , the higher the supersat-
uration attained, and hence, smaller the particles produced. However, in most cases,xW
and Ci can not be increased unlimited, as in order to achieve successful crystallization
experiments, the experimental conditions must ensure that the CO2-expanded mixture
in stage b of the DELOS process (see Figure 2.6) is in the liquid region, along or close be-
low the solubility curve. Only in the cases where the addition of CO2 provokes a synergic
enhancement of the solubility in the organic solvent, both parameters can be increased
unlimited. Figure 2.7 depicts the example of a solubility curve (blue line) of the compound
in a CO2-expanded mixture where CO2 acts as a cosolvent. In this case, the solubility line
limits the values of xW and Ci . The dashes lines are the working lines of the different ex-
perimental conditions representing the addition of pure CO2 over an initial solution of the
compound in the organic solvent with a defined Ci . If Ci is increased (from experiment
A to experiment B), the maximum xW should be lower in order to be in the single phase
region of the solubility curve as Figure 2.7 shows.
A recent study carried out in Nanomol [28] reveals that it is possible to predict the rela-
tive specific weight of the process parameters on the supersaturation ratio, and therefore,
on particle characteristics by simply determining the solubility variation of the compound
to be crystallized with temperature at atmospheric pressure. This study was conducted
over the precipitation of cholesterol and aspirin performed along the solubility curve and
was designed to compare the weight of xW and Ci parameters on the supersaturation
achieved and on particle characteristics, and to discern which parameter yields a more
important decrease in particle size.
Figure 2.8 shows, in the temperature range studied, that aspirin solubility in acetone
37
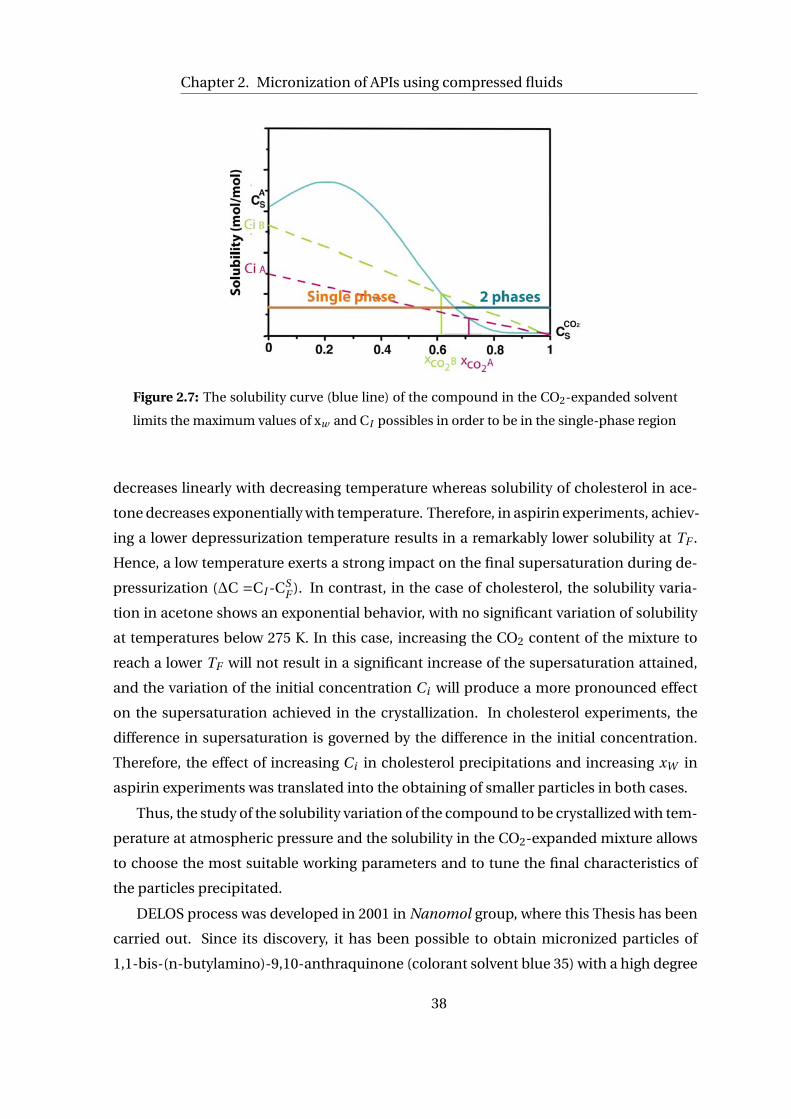
Chapter 2. Micronization of APIs using compressed fluids
Figure 2.7: The solubility curve (blue line) of the compound in the CO2-expanded solvent
limits the maximum values of xw and CI possibles in order to be in the single-phase region
decreases linearly with decreasing temperature whereas solubility of cholesterol in ace-
tone decreases exponentially with temperature. Therefore, in aspirin experiments, achiev-
ing a lower depressurization temperature results in a remarkably lower solubility at TF .
Hence, a low temperature exerts a strong impact on the final supersaturation during de-
pressurization (∆C =CI -CSF ). In contrast, in the case of cholesterol, the solubility varia-
tion in acetone shows an exponential behavior, with no significant variation of solubility
at temperatures below 275 K. In this case, increasing the CO2 content of the mixture to
reach a lower TF will not result in a significant increase of the supersaturation attained,
and the variation of the initial concentration Ci will produce a more pronounced effect
on the supersaturation achieved in the crystallization. In cholesterol experiments, the
difference in supersaturation is governed by the difference in the initial concentration.
Therefore, the effect of increasing Ci in cholesterol precipitations and increasing xW in
aspirin experiments was translated into the obtaining of smaller particles in both cases.
Thus, the study of the solubility variation of the compound to be crystallized with tem-
perature at atmospheric pressure and the solubility in the CO2-expanded mixture allows
to choose the most suitable working parameters and to tune the final characteristics of
the particles precipitated.
DELOS process was developed in 2001 in Nanomol group, where this Thesis has been
carried out. Since its discovery, it has been possible to obtain micronized particles of
1,1-bis-(n-butylamino)-9,10-anthraquinone (colorant solvent blue 35) with a high degree
38

2.1. Introduction
Figure 2.8: Solubility of aspirin (ASP)(left) and cholesterol (COL)(right) in acetone as a func-
tion of temperature
of crystallinity and reducing the particle size two orders of magnitude in comparison to
the particles produced by conventional cooling crystallization technique from methanol
solutions [26]. The feasibility of DELOS method to process active pharmaceutical ingre-
dients (ibuprofen, cholesterol, aspirin, naproxen) as finely divided powders with narrow
size distribution, high crystallinity degree, high polymorphic purity and free from resid-
ual solvent has also been demonstrated. Moreover, it has been confirmed that DELOS
process is a kinetically controlled crystallization in which high supersaturation levels are
rapidly achieved. This fact makes this process especially indicated for obtaining kineti-
cally controlled polymorphs of exceptional polymorphic purity. In addition, recently, a
new polymorph of β-sitosterol has been discovered, which was more crystalline than the
native form, though its precipitation by DELOS process [29].
It is clear from all theses studies that the feasibility and performance of DELOS process
has been extensively demonstrated. Hence, this chapter is devoted to the the develop-
ment of systematic procedures with two main objectives: the optimization of thermody-
namic parameters, that will be explored in the first section of the chapter, and the second
part will be focused on understanding how the crystallization of molecules with very high
precipitation kinetics takes place under DELOS method.
39

Chapter 2. Micronization of APIs using compressed fluids
2.2 DELOS method for the precipitation of ibuprofen as mi-
croparticles
Ibuprofen, as it is considered a model for poorly-soluble water compounds, has been pro-
cessed by several conventional methods with the aim of reducing its particle size and
thus achieve an increase in its bioavailability. Particle size reduction of ibuprofen is of-
ten difficult to achieve during dry milling, particularly below the reported brittle-ductile
transition particle size of 854 µm [30] as ibuprofen is known to show great ductility [31],
although recent findings suggest that submicron sized micronized product is achievable
by wet milling [32, 33]. There are several examples in the literature of milled ibuprofen
[34, 35]: it has been micronized by air jet milling [36] and also by a continuous fluid energy
mill [36]. The micronization of drugs using mills, as explained previously, is extremely in-
efficient, producing particles with broad size distribution and that can be afflicted with
impurities due to abrasion [37].
Ibuprofen has been extensively studied by Müller et al. [12, 38, 39]. They achieved
a dissolution enhancement with an in situ process of micronization of the drug. This
process is called the solvent change method and consists of forming a dispersion by in-
stantaneously mixing two liquids in the presence of a stabilizer. Then, the dispersion is
spray-dried to dry the already formed particles. The particles obtained using this method
are in the range of microns, however, the process requires the aid of stabilizing agents. In
this method, the generation of particles relies on the efficient mixing of the two solvents
and as mentioned in the Introduction of this Thesis (Chapter 1), the scaling-up of effective
mixing entails many obstacles.
Several authors have reported micronization of ibuprofen using supercritical fluid
crystallization techniques, as they have a huge potential for producing micron-sized par-
ticulate materials in a single step [40]. The most widely used procedure has been RESS
[41]. However, the RESS process operates at high pressures and requires complex atom-
ization systems for precipitating significant amounts. In this situation, a multi-nozzle sys-
tem or the use of a porous sintered disk through which pulverization occurs are required.
In both cases, particle size distribution is not easy to control, and may be much wider
than in the case of a single nozzle. There is still a big challenge in the scaling-up of the
RESS process [42]. Another considerable limitation of RESS process for micronization of
ibuprofen lies in the too low solubility of the compound in pure CO2. The filtration of the
40

2.2. DELOS method for the precipitation of ibuprofen as microparticles
solid at high pressure also entails some experimental difficulties. Attending to these draw-
backs, DELOS method introduces some advantages: the solubility of ibuprofen in several
CO2-expanded solvents (ethanol, acetone, acetonitrile) is much higher than in pure CO2,
hence, more quantities of the product can be crystallized. The scaling-up of this method
is very simple since this procedure does not require neither complex agitation systems
nor sophisticated atomization apparatus, conversely as in RESS process. In addition, the
simpler equipment and lower pressures of DELOS introduce economic advantages.
The feasibility of producing microparticles of ibuprofen by DELOS has already been
demonstrated [28]. However, up to now, there is not a deep understanding of the thermo-
dynamics behind the precipitation of ibuprofen by DELOS, which should allow to control
process parameters in order to obtain higher yields and narrower particle size distribu-
tion.
2.2.1 Thermodynamic Analysis of DELOS precipitation of ibuprofen
The relationship between supersaturation and particle size is one of the most important
for engineering and optimization of the precipitation process. The nucleation rate in-
creases exponentially with supersaturation [43]. As stated before, in DELOS, the ∆C = C I
- C SF is the maximum supersaturation that can be achieved. Thus, in order to promote
nucleation phenomena, a proper design of a DELOS crystallization should define a set of
working conditions such to obtain the maximum supersaturation attainable.
The solubility curves of Ibuprofen in CO2-expanded ethanol, acetone and acetoni-
trile were measured previously in Nanomol under the framework of the PhD Thesis of Dr.
Muntó [44]. Figure 2.9 depicts the phase diagram for Ibuprofen in CO2-expanded aceton-
trile (a), ethanol (b) and acetone (c) at 298 K and at 10 MPa in terms of the concentration
of ibuprofen as a function of the CO2 concentration in the solvent mixture in a solute-free
basis. Over the solubility curves is the two-phase region, where the system is composed of
a solid phase and a liquid phase. Under the curve is the single-phase region where ibupro-
fen is dissolved in the CO2-expanded mixture. The phase boundary in the three cases has
a sigmodal shape. Attending to this type of solubility curve, the two process parameters
that affect the supersaturation, xW and Ci can not be increased unlimited. Hence, the
following section endeavors to study the specific weight of these process parameters on
the maximum supersaturation (∆C ) that could be attained and, as a consequence, on the
final characteristics of ibuprofen particles.
41
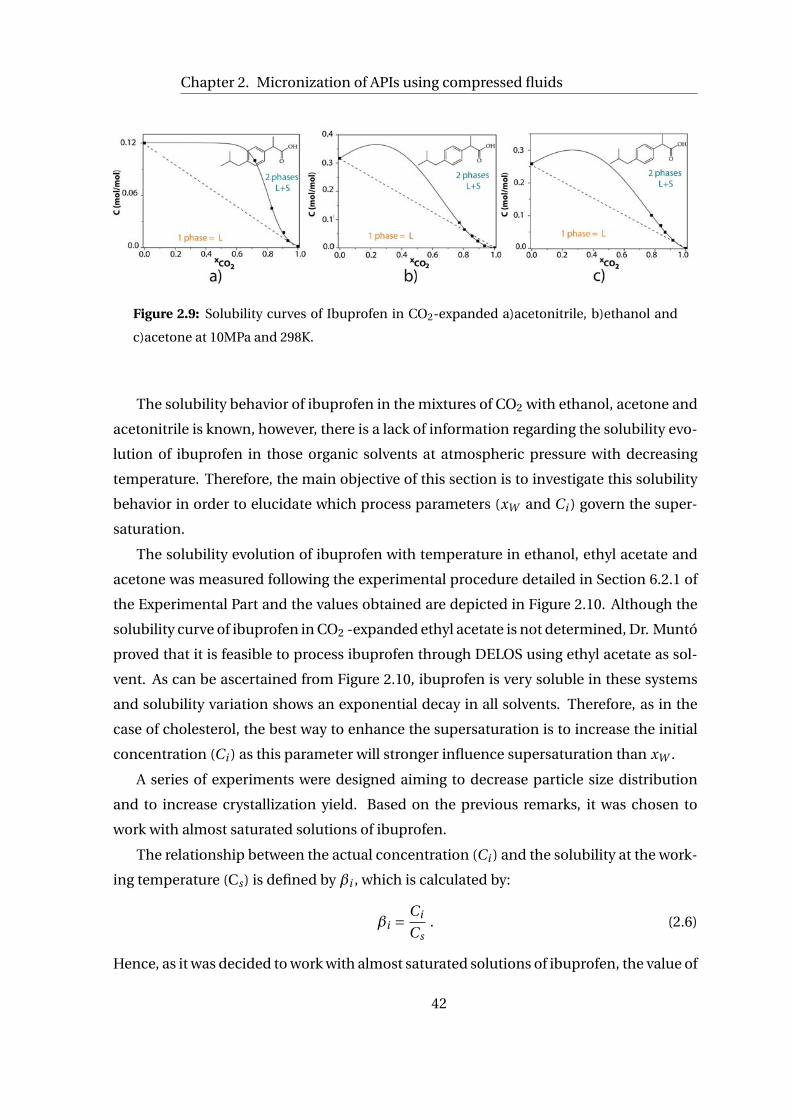
Chapter 2. Micronization of APIs using compressed fluids
Figure 2.9: Solubility curves of Ibuprofen in CO2-expanded a)acetonitrile, b)ethanol and
c)acetone at 10MPa and 298K.
The solubility behavior of ibuprofen in the mixtures of CO2 with ethanol, acetone and
acetonitrile is known, however, there is a lack of information regarding the solubility evo-
lution of ibuprofen in those organic solvents at atmospheric pressure with decreasing
temperature. Therefore, the main objective of this section is to investigate this solubility
behavior in order to elucidate which process parameters (xW and Ci ) govern the super-
saturation.
The solubility evolution of ibuprofen with temperature in ethanol, ethyl acetate and
acetone was measured following the experimental procedure detailed in Section 6.2.1 of
the Experimental Part and the values obtained are depicted in Figure 2.10. Although the
solubility curve of ibuprofen in CO2 -expanded ethyl acetate is not determined, Dr. Muntó
proved that it is feasible to process ibuprofen through DELOS using ethyl acetate as sol-
vent. As can be ascertained from Figure 2.10, ibuprofen is very soluble in these systems
and solubility variation shows an exponential decay in all solvents. Therefore, as in the
case of cholesterol, the best way to enhance the supersaturation is to increase the initial
concentration (Ci ) as this parameter will stronger influence supersaturation than xW .
A series of experiments were designed aiming to decrease particle size distribution
and to increase crystallization yield. Based on the previous remarks, it was chosen to
work with almost saturated solutions of ibuprofen.
The relationship between the actual concentration (Ci ) and the solubility at the work-
ing temperature (Cs) is defined by βi , which is calculated by:
βi = Ci
Cs. (2.6)
Hence, as it was decided to work with almost saturated solutions of ibuprofen, the value of
42

2.2. DELOS method for the precipitation of ibuprofen as microparticles
0
0.2
0.4
0.6
180 200 220 240 260 280 300 320
Cs (
mo
l/m
ol so
lve
nt)
Temperature (K)
Ethanol
Ethyl acetate
Acetone
Acetonitrile
Figure 2.10: Solubility of ibuprofen in different organic solvents as a function of tempera-
ture
βi was fixed at 0.9 for all the DELOS precipitation experiments from different organic sol-
vents. Dr. Muntó conducted her experiments at a value of βi of 0.6. Table 2.1 summarizes
the process operation parameters (xW , organic solvent) of all the conducted experiments
as well as the final temperature reached after depressurization, when crystallization oc-
curs, and the corresponding absolute supersaturation (∆C ) attained during depressuriza-
tion. All the experiments were conducted at PW = 10 MPa and TW = 298 K.
Experiments 1 and 2 were carried out keeping all the process parameters constant ex-
cept xW . It can be inferred how the increase in the molar fraction of CO2 is translated into
a lower TF . Moreover, the effect of the nature of solvent is also reflected in the tempera-
ture decrease experienced by the solution. The values presented in Table 2.1 indicate that
the temperature decrease is different for each solvent.
In all the experiments, finely divided powders with micrometric size of highly crys-
talline ibuprofen were obtained as it is reflected in the X-ray powder diffraction spectra
depicted in Figure 2.11. However, in the experiment using ethanol (experiment 4) the
amount of solid collected in the filter was very low and not enough to perform a proper
characterization. The precipitated solid instead of remaining in the filter, passed trough
it and stayed in the mother liquor. This can be rationalized assuming that the particles
produced are smaller than the pore size of the filter (200 nm) which might be possible
considering the high supersaturation obtained in the experiment 4. Another hypothesis
for such a low collection of solid can be found in the crystallization kinetics of ibuprofen
43

Chapter 2. Micronization of APIs using compressed fluids
Table 2.1: DELOS experiments for the precipitation of Ibuprofen from different CO2-
expanded solvents.
Exp. Solvent Cia xW
b TFc ∆T d CS
Fe ∆C f
(mol/mol) (K) (K) (mol/mol) (mol/mol)
1 Acetone 0.28 0.74 261 -37 0.078 0.208
2 Acetone 0.28 0.82 250 -48 0.052 0.234
3 Ethyl acetate 0.25 0.83 241 -57 0.026 0.227
4 Ethanol 0.23 0.84 248 -50 0.029 0.204
5 Acetonitrile 0.06 0.80 248 -50 0.045 0.018
DELOS Experiments at 298 K and 10 MPa using different solvents, a initial concentration of Ibuprofen
in the organic solvent, bCO2 molar fraction, c Temperature reached after depressurization,
d Difference from the working temperature to the final temperature,e Solubility of Ibuprofen
in the organic solvent at the final temperature, f Supersaturation.
in ethanol.
Figure 2.11: X-ray powder diffraction spectra of the raw ibuprofen and the ibuprofen pre-
cipitated by DELOS using acetone, ethyl acetate and acetonitrile.
44

2.2. DELOS method for the precipitation of ibuprofen as microparticles
Table 2.2: DELOS crystallization of outcome: Particle size distribution and Yield.
Experiment Solvent ∆C (mol/mol)a Size distribution (µm)b UIc Yield (%)d
d(0.1) d(0.5) d(0.9)
1 Acetone 0.20 3.38 9.76 24.14 14 60
2 Acetone 0.23 2.84 6.78 14.37 19 78
3 Ethyl acetate 0.22 3.36 8.27 24.25 13 47
4 Ethanol 0.20 - - - 4
5 Acetonitrile 0.01 3.99 13.04 46.86 8 64
aSupersaturation, bVolumetric particle size distributions expressed in percentiles of 10, 50 and 90%
of accumulated volume, c Uniformity index is defined as d(10)/d(90)*100,d DELOS yield expressed in
% of recovered mass.
The outcome of the crystallization experiments is displayed in Table 2.2. Particle size
distribution has been measured by Light Scattering following the experimental procedure
detailed in Section 6.4.1 of the Experimental Part.
The smaller and narrower particle size distribution and the higher yield corresponds
to experiment 2. In this experiment, the supersaturation achieved is higher than in exper-
iment 1 and the experiments of Dr.Muntó. In all the experiments performed in this Thesis
the supersaturation has been increased with respect to the experiments conducted during
her Thesis, and thus, smaller particles with better yields have been achieved. Neverthe-
less, the most significant decrease in particle size and increase in yield was achieved using
acetone as organic solvent. This fact highlights the relevance of choosing the appropriate
solvent for a successful crystallization. Khan and Jiabi [45] precipitated ibuprofen using
methods such as cooling hot solutions of the drug and precipitation of crystals of drug
solutions from different organic solvents. They also obtained the smallest particles sizes
(and consequently the highest dissolution rates) when using ethanol and acetone.
The experiments reported in Table 2.1 were repeated in similar conditions, obtaining
analogous output.
The morphology of the precipitated obtained was characterized by Scanning Electron
Microscopy following the experimental protocol presented in Section 6.4.2 of the Experi-
mental Part. Crystal shape also depends on the solvent employed as Figure 2.12 reveals.
As can be seen in Figure 2.12, ibuprofen particles present a high agglomeration. For
45

Chapter 2. Micronization of APIs using compressed fluids
Figure 2.12: SEM images of ibuprofen precipitated through DELOS when using a) ethyl
acetate, b) acetone and c) acetonitrile
this reason, in order to properly assess the difference in morphology observed when using
different organic solvents, ibuprofen particles were further characterized by a microscope-
based particle characterization system Morpholgi 3G. Morpholgi 3G is an imaging system
that analyzes particles based on pictures of each one taken by the microscope. It mea-
sures size and shape of particles by static image analysis technique. The data acquisition
(images of each particle) was carried out over a liquid suspension. The particles were
suspended in water with 0.01% vol. of Tween 80 and sonicated for 5 min, hence, agglom-
eration of particles was averted. Section 6.4.3 gathers a more detail description of the
equipment used and the complete protocol required for sample preparation.
The main difference with Light Scattering technique is that Morphologi 3G measures
the perimeter of the particles as well as the length and width of the particle. In this case,
particle size is measured in number of particles. The software also allows to compare the
shape of different particles.
Figure 2.13 displays the mean size of the particles from experiments using acetone,
ethyl acetate and acetonitrile, expressed as number distribution and volume distribution.
As can be ascertained, the values obtained are in agreement with the reported values from
Light Scattering measurements.
More relevant information is reported in Figure 2.14 where the comparison of the
three samples is depicted. This comparison tells us that particles obtained using acetone
and ethyl acetate are very similar between them and the ones obtained from acetonitrile
differ from the two other. The difference between the particles is related to their circular-
46

2.2. DELOS method for the precipitation of ibuprofen as microparticles
Figure 2.13: Particle size expressed as equivalent diameter in number and in volume distri-
bution of ibuprofen particles precipitated by DELOS using acetone, ethyl acetate and ace-
tonitrile.
ity.
Figure 2.14: Comparison of of ibuprofen particles precipitated by DELOS using acetone,
ethyl acetate and acetonitrile.
Figure 2.15a compares the circularity calculated by the Software for the three samples.
Circularity is the ratio of the circumference of a circle equal to the object’s projected area
to the perimeter of the object:
Ci r cul ar i t y = 2 ·pπ · Ar ea
Per i meter. (2.7)
As mention, circularity of particles from acetone and ethyl acetate is very similar and ace-
tonitrile particles present a higher circularity value. Another important parameter is the
47

Chapter 2. Micronization of APIs using compressed fluids
aspect ratio, defined as the relation between the width of the particle to the length. The
aspect ratio of the different particles is depicted in Figure 2.15b and it is inferred that the
more elongated particles are the ones obtained when using ethyl acetate as solvent.
Figure 2.15: Circularity and aspect ratio of ibuprofen particles precipitated by DELOS using
acetone, ethyl acetate and acetonitrile.
Finally, a representative selection of images of the particles taken by Morphologi 3G is
disclosed in Figure 2.16, where the shape of ibuprofen particles is clearly seen. Ibuprofen
particles precipitated by DELOS using acetone and ethyl acetate yield more elongated and
rectangular particles compared to the particles obtained by DELOS precipitation from
CO2-expanded acetonitrile that are more squared.
Several authors have also seen differences in the morphology of the ibuprofen parti-
cles precipitated using different organic solvents [45, 46, 38, 47]. However, the morphol-
ogy of ibuprofen particles does not affect the dissolution profile [48], therefore is not a
characteristic of the drug that need to be optimized.
48

2.2. DELOS method for the precipitation of ibuprofen as microparticles
Figure 2.16: Images of ibuprofen precipitated through DELOS when using acetone, ethyl
acetate and acetonitrile
49

Chapter 2. Micronization of APIs using compressed fluids
2.2.2 Summary
• The solubility variation of ibuprofen in various organic solvents with temperature
has been measured in order to assess which process parameter govern supersatura-
tion. The solubility variation in all the solvents presents an exponential decay with
decreasing temperature, hence an increase in the initial concentration will have a
stronger impact on the supersaturation attained in DELOS precipitation process
than xW .
• DELOS crystallization experiments starting from very concentrated solutions of ibupro-
fen were conducted, obtaining highly crystalline finely dispersed micro particulate
solids except when starting from ethanol.
• Yield and particle size characteristics of ibuprofen precipitated by DELOS can be
tuned by the initial concentration and the solvent nature. It has been possible to
obtain smaller particles and to increase DELOS yield in ibuprofen DELOS precipita-
tions in comparison to previous DELOS experiments performed in Nanomol group.
50

2.3. Micronization of the thiadiazoline derivative NP from CO2-expandedsolvents
2.3 Micronization of the thiadiazoline derivative NP from
CO2-expanded solvents
As described in more detail in the Introduction of this Thesis (Chapter 1), 4-benzyl-2-
(naphtalen-1-yl)-1,2,4-thiadiazoline-3,5-dione, from now on, the thiadiazoline derivative
NPor NP, is a highly hydrophobic substance which has shown therapeutic activity against
Alzheimer disease. This compound crystallizes as very long needles and as a consequence
cotton-like solids are obtained, which are extremely difficult to micronize by top-down
methodologies.
In the present Thesis, and under the frame of a collaborative project with the com-
pany NOSCIRA, it was investigated the viability of crystallizing this drug from CF-based
methodologies with the objective of producing micro-particle of NP, which can be easily
formulated as injectables.
The determination of the solubility of the drug in different organic solvents as well as
in CO2-expanded mixtures is the first step in the assessment of the feasibility of process-
ing NP via CO2-based methodologies.
2.3.1 Solubility behavior of NP
Solubility of NP in organic solvents
The solubility of the NP compound was measured in different organic solvents (belonging
to Class 1, 2 and 3 according to the European Pharmacopeia1). Table 2.3 gathers solubil-
ity values of the drug measured at atmospheric pressure at 298 and 313 K following the
experimental protocol described in Section 6.2.1 of the Experimental Part.
Solubility of NP in CO2-expanded mixtures
As mentioned in the Introduction of this Chapter (see Section 2.1.2), in order to select
the best approach to process a compound by compressed fluid precipitation techniques,
the solubility behavior of the drug in CO2 or in CO2- expanded mixtures should be deter-
mined. Wubbolts [49] described the Vanishing method (see Section 6.2.2 of the Experi-
mental Part) for the determination of the solubilities of solids in CO2-expanded solvents
1ICH Harmonised Tripartite Guideline, Impurities: Guidelines for residual solvents, ICH Steering Com-
mittee Meeting, 1977.
51

Chapter 2. Micronization of APIs using compressed fluids
Table 2.3: NP Solubility in different organic solvents at 295 K and 313 K
Solvent Cs (mol/mol)·103
T=298 K T=313 K
Acetone 11.65 11.21
Acetonitrile 3.90 4.68
Ethyl acetate 6.45 8.81
Ethanol 0.34 0.52
as well as the modeling of such data. This method is based on the visual determination
of the disappearance of the last crystal when known amounts of a co-solvent or a clear
solution are added to supersaturated mixtures of different compositions. The concentra-
tion of the compound at the Vanishing point represents the solubility of the solute in the
CO2-expanded solvent at a given xCO2 .
In the present work, it has been investigated the solubility behavior of NP in CO2-
expanded acetone and in CO2-expanded acetonitrile at 10 MPa at different CO2 contents
and at two different temperatures: 298 K and 313 K. The solubility curves are depicted in
Figure 2.17. Solubility values and the fitting curves are displayed in the Appendix of this
Thesis.
As can be inferred from Figure 2.17, CO2 acts as an anti-solvent over solutions of NP
in acetone and acetonitrile at 298 K. In the "acetone/CO2/NP" system, the phase bound-
aries shifted upwards with increasing temperature, leading to a high solubility of NP in
the expanded mixture. However, for all range of CO2 molar fractions (xCO2 ), CO2 be-
haves as an anti-solvent over NP solutions in acetone and acetonitrile. In the system
"acetonitrile/CO2/NP" the increase in temperature is reflected in an increase in the mis-
cibility region of the 3 components, and at low CO2 concentrations, CO2 acts as a co-
solvent. The intersection of the phase boundary with the ideal dilution line is at molar
fractions of CO2 of 0.4.
These findings showed that the most suitable techniques to process NP are the ones
taking advantages of the anti-solvent behavior of CO2 over the mixture. Based on this,
it was proposed to investigate the precipitation of NP through compressed antisolvent
methods.
52

2.3. Micronization of the thiadiazoline derivative NP from CO2-expandedsolvents
Figure 2.17: Solubility variation of NP at 10 MPa in a) CO2-expanded acetone at 298 K, b)
CO2-expanded acetone at 313 K, c) CO2-expanded acetonitrile 298 K and d) CO2-expanded
acetonitrile 313 K. The experimental values are represented by black dots, the dashed line
is the solubility variation in an ideal dilution process. The pink lines are the fitted solubility
curve.
2.3.2 Preparation of NP micro particles using Compressed Antisolvent
Precipitation method.
In a Precipitation with Compressed Anti-solvent (PCA) process, an organic solution of the
compound to precipitate is injected through a nozzle into a reactor previously brought
to the operating conditions of pressure (PW ), temperature (TW ) and molar fraction of
CO2 (XW ). The antisolvent effect of the compressed CO2, which rapidly diffuses into the
sprayed solution, causes the precipitation of the solute, which is filtered at high pressure
inside the reactor (see Figure 2.18).
Successful compressed antisolvent precipitation requires, not only the insolubility of
the solute in the organic solvent/CO2 mixture, but also the complete miscibility between
53

Chapter 2. Micronization of APIs using compressed fluids
Figure 2.18: Schematic representation of a PCA process. Adapted from [15].
the liquid solvent and the compressed antisolvent. Considering the solvent- antisolvent
binary system, this condition is achieved by working at PW larger than that of the mixture
critical point (MCP), which differs in more or less extent from that of pure CO2 (T c = 7.39
MPa, Pc = 304.3 K) depending on the nature and % of organic solvent present in the mix-
ture. According to the data reported in the literature [50], for the acetone/CO2 mixture the
Pc and Tc for the mixture composition of interest (high molar CO2 fractions) are approxi-
mately 9 MPa and 323 K. Based on these data, all experiments were performed at PW over
the critical pressure of the organic solvent/CO2 systems used and therefore, conditions of
complete miscibility between solvent-antisolvent should have been achieved. However, it
should also be considered that the presence of a solute can modify the vapour-liquid equi-
libria (VLEs) of the binary system, in general, moving the MCP of the ternary system to-
wards higher pressures compared to that for the corresponding binary one [51, 52]. How-
ever, as the phase behavior of NP in CO2-expanded acetone and acetonitrile is known, it
was experimentally checked that in the range of possible operating conditions, the mix-
54

2.3. Micronization of the thiadiazoline derivative NP from CO2-expandedsolvents
tures of organic solvent and CO2 presented a single liquid phase. The phase is liquid in
some experiments as the working temperature is lower than the critical temperature of
the mixture.
A series of experiments were designed in order to check the feasibility of PCA for the
one-step preparation of micro particulate NP and are displayed in Table 2.4.
Table 2.4: PCA experiments for the precipitation of NP.
Exp. Solvent CO2 Statea Twb (K) βi
c Ci (mol/mol)∗103d xWe Yield(%) f
1 Acetone Liquid 298 1 7.70 0.96 70
2 Acetone Supercritical 313 0.7 7.70 0.96 80
3 Acetone Supercritical 313 1 11.21 0.96 90
4 Acetone Liquid 298 0.7 5.27 0.96 25
5 Acetone Supercritical 313 0.7 7.70 0.90 100
6 Acetone Supercritical 313 0.7 7.70 0.80 No solid
7 Acetonitrile Supercritical 313 0.7 3.28 0.90 No solid
PCA Experiments performed at 10 MPa using different solvents, a state of CO2, b working temperature,
c Initial saturation Ci /CS , d initial concentration,e molar fraction of CO2, f Yield expressed as %of mass recovered.
In experiments 6 and 7 no solid was precipitated as the experimental conditions are
close to the phase boundary. In the rest of experiments, a precipitate with cotton-like
appearance was obtained. The solid was characterized by SEM following the experimen-
tal protocol described in detail in Section 6.4.2. Representative SEM images of the PCA
solids are shown in Figure 2.19. SEM micrographs reveal the existence of long needle-like
particles and hence, the solid keeps the cotton-like macroscopic appearance of the raw
material. Light Scattering measurement were performed over some representative solids
following the experimental protocol explained in Section 6.4.1. The particle size distribu-
tion of the solids was approximately between d(0.1) = 2µm, d(0.5) =10µm, d(0.9) = 40µm,
values that are in agreement with the long needles observed by SEM.
As it is not possible to avoid the undesired cotton-like appearance and the precipita-
tion of NP as very long needle-like particles, it was proposed to explore the viability of
precipitating NP using another CO2-based method, the DELOS platform. Therefore, the
next section is dedicated to investigate the feasibility of using DELOS for the precipitation
of NP as a micro particulate material.
55
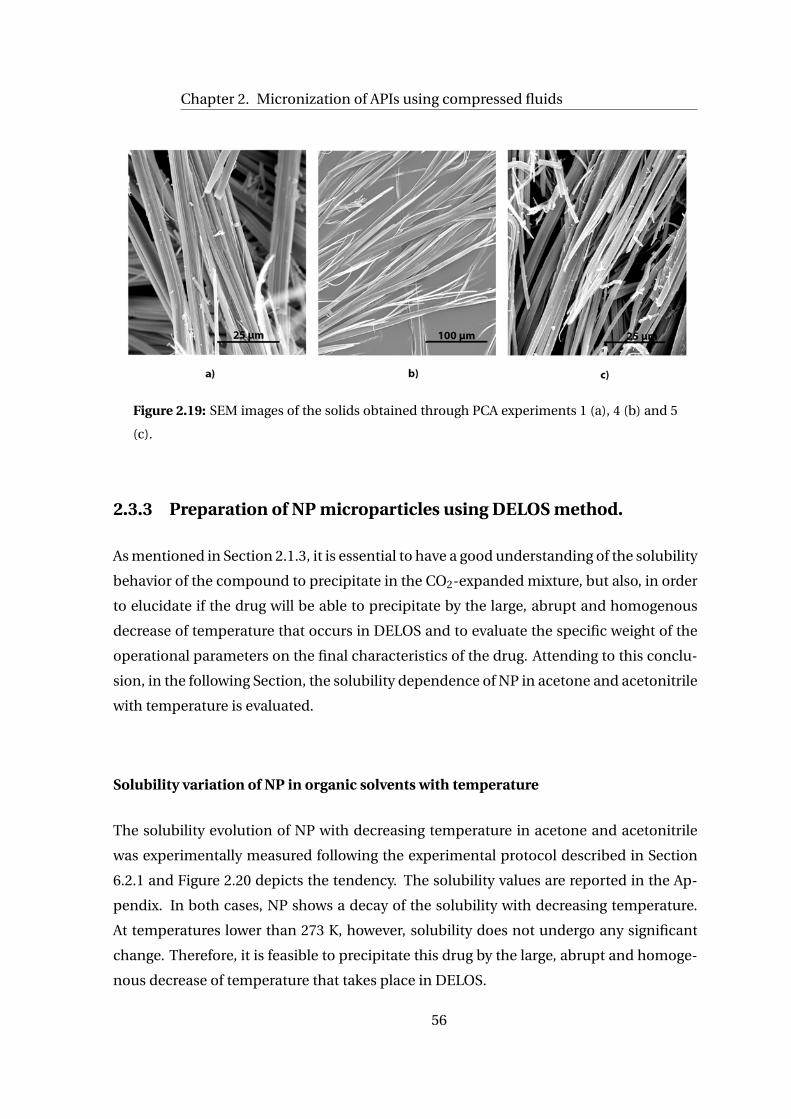
Chapter 2. Micronization of APIs using compressed fluids
Figure 2.19: SEM images of the solids obtained through PCA experiments 1 (a), 4 (b) and 5
(c).
2.3.3 Preparation of NP microparticles using DELOS method.
As mentioned in Section 2.1.3, it is essential to have a good understanding of the solubility
behavior of the compound to precipitate in the CO2-expanded mixture, but also, in order
to elucidate if the drug will be able to precipitate by the large, abrupt and homogenous
decrease of temperature that occurs in DELOS and to evaluate the specific weight of the
operational parameters on the final characteristics of the drug. Attending to this conclu-
sion, in the following Section, the solubility dependence of NP in acetone and acetonitrile
with temperature is evaluated.
Solubility variation of NP in organic solvents with temperature
The solubility evolution of NP with decreasing temperature in acetone and acetonitrile
was experimentally measured following the experimental protocol described in Section
6.2.1 and Figure 2.20 depicts the tendency. The solubility values are reported in the Ap-
pendix. In both cases, NP shows a decay of the solubility with decreasing temperature.
At temperatures lower than 273 K, however, solubility does not undergo any significant
change. Therefore, it is feasible to precipitate this drug by the large, abrupt and homoge-
nous decrease of temperature that takes place in DELOS.
56

2.3. Micronization of the thiadiazoline derivative NP from CO2-expandedsolvents
Figure 2.20: Evolution of the solubility of NP in acetone and acetonitrile with temperature.
DELOS precipitation of the thiadiazoline derivative NP
Table 2.5 presents the operational conditions of DELOS crystallization experiments of NP.
In all the experiments, particles of NP were successfully obtained for the first time by DE-
LOS. It can be checked how as the xW is increased, lower temperatures are reached. Most
of the experiments conducted started from acetonitrile at 313 K as the cosolvent behavior
of CO2 ,and hence, the range of variation of xW and Ci is larger.
Table 2.6 summarizes the outcome of crystallization experiments. Yields, particle size
distribution measurements and microscopic studies by SEM have been done following
the experimental protocols presented in Sections 6.3.2, 6.4.1 and 6.4.2 of the Experimental
Part, respectively.
Experiments 8 and 9 were carried out using CO2-expanded acetone. In these two ex-
periments, the yields obtained are very low and particle size of the solids precipitated are
larger than the ones obtained when using CO2-expanded acetonitrile. Based on these two
facts, the use of acetone for processing NP by DELOS has been rejected. As occurs with
ibuprofen crystallizations, the nature of the solvent employed plays an important role in
the final characteristics of the solid obtained.
In acetone experiments (8 and 9) there is a correlation between the supersaturation
attained during depressurization (∆C) and particle size of the particles obtained. In ex-
periment 9, performed at higher Ci , a higher supersaturation is achieved and as a conse-
quence smaller particle sizes and higher yields are obtained.
57

Chapter 2. Micronization of APIs using compressed fluids
Table 2.5: DELOS experiments for the micronization of NP starting from different temper-
atures, initial concentrations (βi ), xW using acetone (ACE) or acetonitrile (ACN) as organic
solvents and the yields obtained.
Exp. Solvent Ta Cib( βi
c ) xWd ∆Te CS
Ff ∆Cg
(K) ·103(mol/mol) (K) ·103(mol/mol) ·103(mol/mol)
1-2 ACN 298 2.87(0.7) 0.47 43 1.56 1.31
3 ACN 313 3.75(0.8) 0.59 70 1.25 2.50
4 ACN 298 2.05(0.5) 0.58 65 0.94 1.11
5-6 ACN 313 4.69(1) 0.46 55 1.56 3.13
7 ACN 313 4.69(1) 0.36 51 1.56 3.13
8 ACE 313 5.8(0.5) 0.36 50 2.86 2.75
9 ACE 313 8.98(0.8) 0.5 55 2.64 6.34
DELOS Experiments using different solvents and at adifferent working temperatures,b initial
concentration of NP in the organic solvent (mol/mol), c Supersaturation ratio,d CO2 molar fraction,
after depressurization, f Solubility of NP in the organic solvent at the final temperature (mol/mol),
e Temperature reached, g Supersaturation attained expressed as mass difference (mol/mol).
Table 2.6: DELOS crystallization outcome: particle size distribution and yield (η).
Exp. Solvent ∆Ca Size distribution (µm)b UIc Yield(%)d
·103(mol/mol) d(0.1) d(0.5) d(0.9)
1-2 ACN 1.31 1.26 3.67 15.41 8 55
3 ACN 2.50 1.17 4.45 28.37 4 85
4 ACN 1.11 0.97 2.34 7.72 13 35
5-6 ACN 3.13 1.16 3.10 14.9 7 65
7 ACN 3.13 1.18 3.13 11.79 10 55
8 ACE 2.75 1.29 4.42 23.02 5 10
9 ACE 6.34 1.12 2.99 13.21 8 20
asupersaturation attained as mass difference (mol/mol) bVolumetric particle size
distributions expressed in percentiles of 10, 50 and 90%, c Uniformity index is defined ,
as d(10)/d(90)*100, d Yield expressed as % of mass recovered.
58

2.3. Micronization of the thiadiazoline derivative NP from CO2-expandedsolvents
In experiments from CO2-expanded acetonitrile, it has been possible to precipitate NP
microparticles with particle size distribution below 10µm for the very first time. However,
in this set of experiments (1-7) there is no clear correlation between the experimental
conditions that result in the highest supersaturation (experiments 6-8) and particle size
and yields of the precipitates. Even though, values of particle size distribution are very
promising, as a very substantial reduction in size has been achieved : 10% of the particles
in volume are below 1.4 µm and 50% are below 5 µm.
Figure 2.21: Comparision of the particle size distribution obtained in the experiments 2-7.
As it is depicted in Figure 2.21, particle size distribution of the previous experiments
(2-7) shows the presence of two different particle populations, one smaller centered at
around 2 µm and another with lager size centered at around 10-20 µm depending on the
experiment. The global contribution of the latter population to the final particle size dis-
tribution changes from experiment to experiment regardless of the process parameters.
The morphological characterization of the particles of NP obtained in this set of ex-
periments was done by SEM. In all experiments, small needle-like particles, as the ones
depicted in Figure 2.22 were obtained. By careful inspection of the SEM images, two dif-
ferent sizes can be noticed and the same conclusion from the Light Scattering results can
be withdrawn. A wide size distribution has a deceptively low dissolution rate due to the
presence of large particles at the end to the distribution. Therefore, this type of particles
size distribution should be averted. A narrow particle size distribution is always prefer-
able as this means that particles are more homogenous and this is translated into a higher
bioavailabilty.
The presence of two populations of particle size in the solids obtained by DELOS
59

Chapter 2. Micronization of APIs using compressed fluids
Figure 2.22: SEM images of NP precipitated through DELOS. Experiments 3 (a), 6 (b) and 8
(c).
method reveals that particles are being formed by more than one process [53]. A possible
explanation of this phenomenon is that, a second particle growth can occur during filtra-
tion and drying of the solids. This uncontrolled growth of the crystals should occur after
nucleation takes place, as there is no clear evidence between the operational variables
and the outcome of the experiments. It is important to bear in mind that, as mentioned
in the Introduction of this Thesis (Chapter 1), NP crystals present a very fast kinetics, that
results in the formation of very long needles, hence, the tendency of NP particles to grow
is very high.
In order to overcome the presence of these two populations, it was proposed to use
quenching agents that could stop the growth of the nucleus formed just after depressur-
ization occurs.
2.3.4 Use of organic solvents as growth inhibitors
The first approach followed to avert the uncontrolled growth of the NP after depressur-
ization was to use specific organic solvents as growth inhibitors. Some organic solvents
can interact with specific sites of the NP molecule avoiding its crystal growth. The use
of modifiers to selectively change crystal growth kinetics during crystallization is a gen-
eral processing strategy that can be easily used to modify crystal size and shape [53]. It
is reported the strong influence of solvents on the habit of crystalline materials, however
the role played by solvent-surface interactions in enhancing or inhibiting crystal growth
60
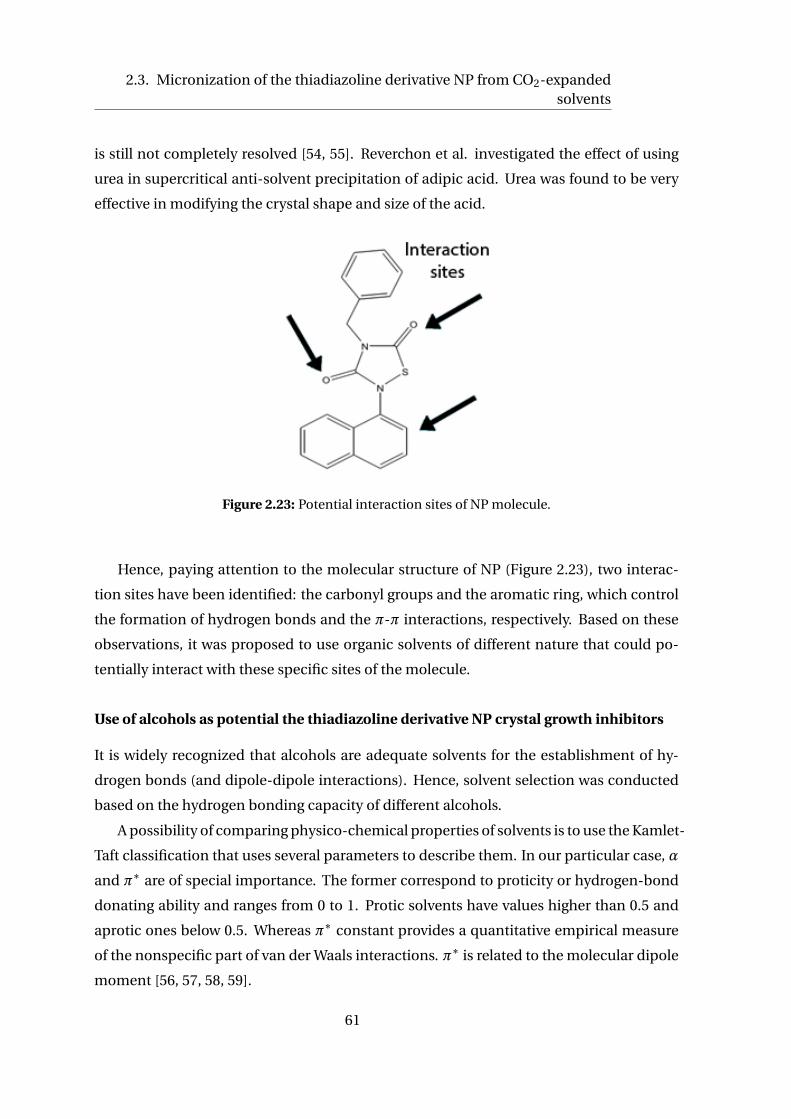
2.3. Micronization of the thiadiazoline derivative NP from CO2-expandedsolvents
is still not completely resolved [54, 55]. Reverchon et al. investigated the effect of using
urea in supercritical anti-solvent precipitation of adipic acid. Urea was found to be very
effective in modifying the crystal shape and size of the acid.
Figure 2.23: Potential interaction sites of NP molecule.
Hence, paying attention to the molecular structure of NP (Figure 2.23), two interac-
tion sites have been identified: the carbonyl groups and the aromatic ring, which control
the formation of hydrogen bonds and the π-π interactions, respectively. Based on these
observations, it was proposed to use organic solvents of different nature that could po-
tentially interact with these specific sites of the molecule.
Use of alcohols as potential the thiadiazoline derivative NP crystal growth inhibitors
It is widely recognized that alcohols are adequate solvents for the establishment of hy-
drogen bonds (and dipole-dipole interactions). Hence, solvent selection was conducted
based on the hydrogen bonding capacity of different alcohols.
A possibility of comparing physico-chemical properties of solvents is to use the Kamlet-
Taft classification that uses several parameters to describe them. In our particular case, α
and π∗ are of special importance. The former correspond to proticity or hydrogen-bond
donating ability and ranges from 0 to 1. Protic solvents have values higher than 0.5 and
aprotic ones below 0.5. Whereas π∗ constant provides a quantitative empirical measure
of the nonspecific part of van der Waals interactions. π∗ is related to the molecular dipole
moment [56, 57, 58, 59].
61

Chapter 2. Micronization of APIs using compressed fluids
Table 2.7 presents the solvents selected with their corresponding solvatochromic val-
ues and the solubility of NP in them at 313 K. Acetonitrile is included for comparison
purposes.
Table 2.7: Alcoholic organic solvents chosen as potential growth inhibitors of NP crystals
and their corresponding solvatochromic values. The solubility of NP at 313 K in the solvents
is also presented. Acetonitrile is included as a reference
Solvent α a π∗b Cs(mol/mol)·103c
Methanol (MeOH) 0.98 0.60 0.5
Ethanol (EtOH) 0.86 0.54 0.5
Isopropanol(IPA) 0.76 0.48 0.6
n-Butanol(n-BuOH) 0.84 0.47 1.2
Acetonitrile (ACN) 0.19 0.75 4.6
aevaluates the hydrogen-bonding contribution, b π∗provides information
of the nonspecific part of the van der Waals interactions,c solubility
on NP in the solvent at 313 K.
The α and π∗ values of the alcohols chosen are very similar among them and very
different compared to acetonitrile’s parameters, which means that the effect of these sol-
vents on the precipitation of NP could be different of the ones produced by acetonitrile.
The solubility of NP in the mixtures alcohol/acetonitrile at different compositions and
at 298 and 313 K was assed. The results are depicted in Figure 2.24 and the solubility values
are disclosed in the Appendix of this Thesis. As can be inferred from the values presented
in Table 2.7, solubility of NP in pure alcohols is very low in comparison to the solubil-
ity in acetonitrile. Hence, as expected, solubility of NP in mixtures alcohol/acetonitrile
increases as the mixture gets richer in acetonitrile. The increase in temperature is also
translated in an increase of solubility. In rich acetonitrile mixtures (xAC N higher than 0.5)
at 313 K (see Figure 2.24b) a synergetic enhancement of the solubility is observed. This
synergetic enhancement also occurs for the mixture n-butanol/acetonitrile at 298K and
at xAC N higher than 0.7, reaching its maximum at xAC N = 0.9 (Figure 2.24a). At both tem-
peratures, NP presents the highest solubility in the mixture n-butanol/acetonitrile and
the lowest in the methanol mixture. Nevertheless, the solubilities in the mixtures are high
enough to be used as solvents in the DELOS process. Hence, all the chosen alcohol/ ace-
62

2.3. Micronization of the thiadiazoline derivative NP from CO2-expandedsolvents
tonitrile mixtures are suitable to prepare micron and sub-micron particles of NP using
CO2-expanded solvents.
The first set of experiments was done using the mixture ethanol/acetonitrile at differ-
ent compositions of the mixture as a mean to evaluate the effect of alcohol concentration
in particle characteristics of DELOS precipitates. Table 2.8 displays the experimental con-
ditions of this serie of DELOS crystallizations. In this case, experiments 5-6 were taken
as a reference experiment as are the ones that attained the higher supersaturation (∆C)
during depressurization. These experiments were conducted using acetonitrile at 313K
and 10MPa, βi = 1, xW = 0.47.
Figure 2.24: Solubility of NP in different mixtures alcohol/acetonitrile at a) 298 K and b) 313
K. The lines are a visual tool.
Although DELOS yields are high in most of the experiments, precipitate was found in
the mother liquors in all the experiments except in experiments 10 and 12. Figure 2.25
shows representative images of the SEM characterization of the solid collected in exper-
iments 10-15 where, once again, the presence of two types of particle size distributions
were detected: submicron needle-like particles and very long and thin fibers.
However, Light Scattering results reveal a high variability in between measurements
of the same sample, as Table 2.9 displays. As it is described in Section 6.4.1, the proper
sampling consists of measuring 3 replicas of the same solid. In the solids obtained using
alcohols as potential growth inhibitors, the variation between each replica is considerably
important. This means that the particles obtained are very heterogenous. The variability
in particle size in between the same samples occurs for all the DELOS experiments per-
formed using mixtures of ethanol/acetonitrile as solvent. Despite this great variability,
63

Chapter 2. Micronization of APIs using compressed fluids
Table 2.8: DELOS experiments using different mixtures of ethanol/acetonitrile mixtures.
Experiment ACN:EtOH (molar relationship)a Ci ·103b(βic ) xW
d Yielde (%)
10 80:20 6.9(0.99) 0.53 53
11 60:40 5.4(0.95) 0.48 58
12 50:50 5.6(0.98) 0.52 67
13 30:70 3.0(0.95) 0.49 64
14 10:90 1.2(0.94) 0.48 30
15 10:90 1.2(0.94) 0.67 75
DELOS Experiments at 313 K and 10 MPa using a mixture of acetonitrile and ethanol as solvent,
athe proportion between the two solvents is expressed as molar relationship(mol/mol),b initial
concentration of NP in the mixture of solvents,c Initial Supersaturation ratio,d CO2 molar
fraction, e Yield expressed as %of mass recovered.
Figure 2.25: SEM images of NP precipitated from ethanol/acetonitrile mixture from exper-
iment 13.
the best results in terms of particle size distribution were obtained in the solid precipi-
tated through the experiment 13, using the molar relationship Acetonitrile/EtOH 30/70.
Figure 2.26 compares particle size distribution of the solid obtained from 30/70 ace-
tonitrile/ethanol mixture and pure acetonitrile. The red curve corresponds to the solid
obtained without ethanol, and the green, dark blue and navy blue to the different sam-
ples from the same solid. It is clearly seen the great variability of particle size distribution
of the solid obtained in the presence of ethanol. The green curve is centered at a smaller
particle size that the red one, which means that some of the NP crystal are smaller when
64

2.3. Micronization of the thiadiazoline derivative NP from CO2-expandedsolvents
Table 2.9: Particle size distribution of different samples of the solid obtained in experiment
13.
Sample Size distribution (µm)a
d(0.1) d(0.5) d(0.9)
13 A 0.6 1.4 4.4
13 B 0.8 1.9 7.9
13 C 1.3 5.9 38.8
13 D 1.5 6.4 40.4
aVolumetric particle size distributions
expressed in percentiles of 10, 50 and 90%.
using ethanol. Hence, it can be assumed a possible growth inhibition effect of EtOH, al-
though, another phenomenon should occur after depressurization that makes some NP
particles to grow. One possible reason that could explain this observed behavior is that
as NP is not soluble in ethanol, an antisolvent precipitation may occur while NP is still in
contact with the mother liquor. Indeed, as acetonitrile is more volatile than ethanol, it is
very likely that an ethanol enrichment of the mother liquor could occur. This difference
in volatility could produce preferential paths in the cake during drying of the particles. If
the drying is not homogenous for the whole cake, differences in the growth of particles in
between the same sample can occur.
Figure 2.26: Comparison of the particle size distribution of the solid obtained using ace-
tonitrile (red) and the solid precipitated from the 30/70 Acetonitrile/EtOH mixture (green,
dark blue and navy blue.)
Summarizing, it has been possible to precipitate NP from CO2-expanded ethanol/
65

Chapter 2. Micronization of APIs using compressed fluids
acetonitrile mixtures. Ethanol may behave as a growth inhibitor although there is still
a second unknown process of growth of NP crystals. The best results, in terms of particle
size distribution, were obtained using the mixture ethanol/acetonitrile 30:70 at 313 K. It
was at this composition of the mixture ethanol/acetonitrile where NP presents its higher
value of solubility.
Attending to this observation, the next step was to move to other mixtures of alco-
hol/ acetonitrile. Prior to perform DELOS crystallizations using other alcohols and as
a mean to gain more knowledge of the system under study, the solubility curve of NP
in CO2-expanded methanol/ acetonitrile mixture and in CO2-expanded n-butanol/ ace-
tonitrile was measured. These two solvents are the ones where NP presents its lowest and
highest values of solubilities, respectively. The composition of the mixture alcohol/ ace-
tonitrile was fixed to 30:70 based on the ethanol/ acetonitrile results and also because at
this molar relationship, the synergist enhancement of solubility occurs for the rest of the
mixtures at 313K. The solubility curves were performed following the same experimen-
tal protocol as the solubility curves of NP in the CO2-expanded acetonitrile and acetone
which is described in Section 6.2.2 of the Experimental Part and are depicted in Figure
2.27. The experimental values and the fitting curves are reported in the Appendix of this
Thesis. In both curves, CO2 acts as a cosolvent until molar fractions of CO2 of around
0.5 and as anti-solvent at higher molar fractions. The behavior of CO2 in the mixtures
of alcohol/acetonitrile is very similar to the behavior in pure acetonitrile (Figure 2.17).
Therefore, these mixtures are suitables for using them as solvents in DELOS method. As
the solubility of NP in ethanol and isopropanol has values in between the solubility in
methanol and in n-butanol, and as the solvatochromic parameters of the four solvents
are very close to each other, it was assumed that the behavior of CO2 in ethanol and in
isopropanol should be very similar to the solubility curves measured.
The different mixtures 30:70 (molar relationship) alcohol/ acetonitrile at 313 K and
10 MPa are suitable for micronization of NP. Table 2.10 discloses the experimental condi-
tions of the conducted DELOS crystallization using the above described mixtures. The ex-
periment 13 performed using the mixture acetonitrile/ethanol 30/70 molar relationship,
which is the one that produce the smallest particles, is included for comparison purposes.
In experiments 16-18 it was feasible to precipitate NP through DELOS with appropri-
ate yields. Except in the case of the mixture methanol/acetonitrile, in the rest of the ex-
periments precipitate was found in the mother liquor. Nevertheless, SEM images shows
(Figure 2.28) that it was not possible to avoid the presence of long fibers in the solids ob-
66

2.3. Micronization of the thiadiazoline derivative NP from CO2-expandedsolvents
Figure 2.27: Solubility curves of NP in a) CO2-expanded metanol/acetonitrile 30:70 and b)
CO2-expanded n-butanol/acetonitrile 30:70 at 313 K and 10 MPa.
tained using alcohols as growth inhibitors.
Figure 2.28: SEM images of the solid precipitated using mixtures of alcohol/acetonitrile
Light scattering measurements (Figure 2.29) confirm the observations drawn from the
SEM images. The comparison of particle size distributions obtained in DELOS crystalliza-
tion using different alcohol/acetonitrile mixtures reveals that the crystal growth of NP is
sensitive to the nature of the alcohol employed, as the shape of particle size distribution
varies from one mixture to another. However, in none of the mixtures studied the pres-
ence of the long fibers has been averted. The first particle size distribution is centered at
67

Chapter 2. Micronization of APIs using compressed fluids
Table 2.10: Experimental conditions of DELOS crystallizations using alcohol/acetonitrile
(30:70 molar relationship).
Experiment Solvent Molar relationshipa Ci ·103(βi )b xWd Yield (%)e
10 Ethanol 30:70 3.0(0.95) 0.49 64
16 n-Butanol 30:70 4.0 (0.99) 0.52 53
17 Methanol 30:70 2.4 (0.98) 0.55 70
18 Isopropanol 30:70 2.4(0.99) 0.55 53
DELOS Experiments at 313 K and 10 MPa using a mixture of acetonitrile and alcohol as solvent,
athe proportion between the two solvents is expressed as molar relationship, b initial concentration
of NP in the mixture ofNP in the mixture of solvents (mol/mol), c Initial Supersaturation ratio,
d CO2 molar fraction, e Yield expressed as %of mass recovered.
around 2 µm for all the mixtures, however, as mentioned, the weight of the second popu-
lation of particles depends on the alcohol employed.
Figure 2.29: Particle size distribution of the solid precipitated using mixtures of alco-
hol/acetonitrile.
68

2.3. Micronization of the thiadiazoline derivative NP from CO2-expandedsolvents
Use of toluene and anisole as growth inhibitors
As the alcohols used do not behave as growth inhibitors of NP particles, it was thought
to investigate the effect of using other types of solvents for avoiding the second growth
mechanism of NP crystals. Until now, the best results regarding particle size distribu-
tion has been obtained in the presence of pure acetonitrile, an organic solvent with a
high affinity for dipole-dipole interactions. Attending to this fact, this section comprise
a preliminary study using other organic solvents which can easily establish dipole-dipole
interactions or π - π interactions.
Anisol and Toluene were the chosen solvents and their solvatochromic parameters are
disclose in Table 2.11 as well as the solubility of NP in these solvents at 313 K.
Table 2.11: Organic solvents chosen as potential growth inhibitors of NP crystals and their
corresponding solvatochromic values. The solubility of NP at 313 K in the solvents is also
presented. Acetonitrile is included as a reference.
Solvent αa π∗b Cs ·103c
Anisole 0.00 0.73 38
Toluene 0.00 0.54 15
Acetonitrile (ACN) 0.19 0.75 4
aevaluates the hydrogen-bonding contribution, bπ∗ provides
information of the nonspecific part of the van der Waals
interactions, c solubility on NP in the solvent at 313 K(mol/mol).
As reflected in the α values from Table 2.11, neither anisole nor toluene have the ca-
pacity of forming hydrogen bonds, however, both exhibit a high polarizability.
The solubility of NP in both solvents is very high. A new set of experiments were con-
ducted using anisole and toluene as potential growth inhibitors. Table 2.12 displays the
experimental conditions of these experiments.
However, as reflected in the values from Table 2.12, no solid was precipitated when us-
ing anisole and toluene as pure solvents. This can be rationalized taking into account the
high solubility of NP in these organic solvents. Based on this, it was proposed to examine
the viability of using mixtures of acetonitrile with these solvents. In the case of the mix-
ture acetonitrile/anisole, NP was precipitated by the anti-solvent effect of the addition of
CO2, so it was explored the possibility of using anisole with another type of solvent. Some
69

Chapter 2. Micronization of APIs using compressed fluids
Table 2.12: Experimental conditions of DELOS crystallizations using toluene and anisole as
solvents.
Experiment Solvent Ci ·103a(βi ) b xWc Yield (%)d
19 Anisol 38 (1) 0.55 0
20 n-Butanol 14 (0.9) 0.41 0
DELOS Experiments at 313 K and 10 MPa using pure anisole or toluene,a initial
concentration of NP in the solvent(mol/mol), bInitial Supersaturation ratio,
c CO2 molarfraction, d Yield expressed as % of mass recovered.
preliminary experiments were conducted and the experimental conditions are summa-
rized in Table 2.13. Nevertheless, as can be checked from Light Scattering results (Figure
2.30) and SEM characterization (Figure 2.31), the particle size distribution is not improved
when adding toluene or anisole in comparison to pure acetonitrile.
Table 2.13: Experimental conditions of DELOS crystallizations using mixtures of
toluene/acetonitrile, anisole/acetonitrile and n-butanol/anisole as solvents.
Experiment Solvent Molar rel.(mol/mol)a Ci (mol/mol)103b(βic ) xW
d Yield (%)e
21 Anisole/Acn 30:70 8.81(1) 0.55 0
22 Anisole/n-But. 30:70 29.41(1) 0.55 21
23 Toluene/Acn 5:95 8.1(1) 0.51 40
DELOS Experiments at 313K and 10MPa using mixtures of organic solvents, aexpressed as
molar relationship(mol/mol), b initial concentration of NP in the solvent, c Initial Supersaturation
ratio,d CO2 molar fraction, e Yield expressed as %of mass recovered.
Therefore, whereas these organic solvents have the ability to form hydrogen bonds
or present a high polarizability, it can be concluded that the use of organic solvents as
growth inhibitors can not be considered a successful approach as the final properties of
NP particles have not been improved in terms of size, particle size distribution neither
shape.
The next approach proposed for avoiding this undesired growth of NP crystals was
to use water as a quenching agent. As a consequence the DELOS-susp method for the
production of suspensions were defined. DELOS-susp is a modification of DELOS for
70

2.3. Micronization of the thiadiazoline derivative NP from CO2-expandedsolvents
Figure 2.30: Particle size distribution of the solid precipitated using mixtures of
toluene/acetonitrile and n-butanol/anisole as solvents.
Figure 2.31: SEM images of the solid obtained from DELOS precipitations using mixtures
of toluene/acetonitrile and n-butanol/anisole as solvents.
71

Chapter 2. Micronization of APIs using compressed fluids
the obtaining of dispersed systems such as vesicular formulations, by performing the de-
pressurization step of the CO2-expanded solution over an aqueous flow. Using this novel
method, it has been possible to obtain highly stable nanovesicles [60] [61] [62].
2.3.5 Summary
• The phase behavior of NP in CO2-expanded acetone and CO2-expanded acetoni-
trile has been measured as the solubility of NP in pure acetone and acetonitrile was
suitable for processing it by CO2-based methodologies.The solubility curves of NP
in the expanded mixtures reveal that compressed anti solvent techniques are the
most appropriate for processing NP. However, by PCA, NP crystallizes as very long
needles and the mechanical properties of the final powder are not improved.
• The precipitation of NP by DELOS has been achieved and it has been possible to
decrease particle size using acetonitrile as organic solvent. The solid obtained is a
finely dispersed powder (see Figure 2.32). In this case, the thermodynamic analysis
used for enhancing the properties of the final drug is not valid as there is a second
phenomenon of uncontrolled growth of NP crystals.
• The use of organic solvents (alcohols and aromatic compounds) as growth inhibitors
to avoid this undesired crystal growth has not been successful as the final properties
of the particles have not been improved with respect to using pure acetonitrile.
Figure 2.32: Comparison of NP precipitated by evaporation from acetonitrile evaporation
and NP obtained by DELOS using acetonitrile as organic solvent. The upper images show
the corresponding macroscopic appearance of the solids obtained.
72

Bibliography
[1] K. Byrappa, S. Ohara, and T. Adschiri, “Nanoparticles synthesis using supercritical
fluid technology - towards biomedical applications,” Advanced Drug Delivery Re-
views, vol. 60, no. 3, pp. 299–327, 2008.
[2] I. Pasquali, R. Bettini, and F. Giordano, “Solid-state chemistry and particle engineer-
ing with supercritical fluids in pharmaceutics,” European Journal of Pharmaceutical
Sciences, vol. 27, no. 4, pp. 299 – 310, 2006.
[3] D. Jarmer, C. Lengsfeld, K. Anseth, and T. Randolph, “Supercritical fluid crystalliza-
tion of griseofulvin: Crystal habit modification with a selective growth inhibitor,”
Journal of Pharmaceutical Sciences, vol. 94, no. 12, pp. 2688–2702, 2005.
[4] H. Brittain, S. Bogdanowich, D. Bugay, J. DeVincentis, G. Lewen, and A. New-
man, “Physical characterization of pharmaceutical solids,” Pharmaceutical Re-
search, vol. 8, no. 8, pp. 963–973, 1991.
[5] S. Beach, D. Latham, C. Sidgwick, M. Hanna, and P. York, “Control of the physical
form of salmeterol xinafoate,” Organic Process Research and Development, vol. 3,
no. 5, pp. 370–376, 1999.
[6] K. Nagel and G. Peck, “Investigating the effects of excipients on the powder flow char-
acteristics of theophylline anhydrous powder formulations,” Drug Development and
Industrial Pharmacy, vol. 29, no. 3, pp. 277–287, 2003.
[7] J. Lu and J. Ulrich, “Improved understanding of molecular modeling - the impor-
tance of additive incorporation,” Journal of Crystal Growth, vol. 270, no. 1-2, pp. 203–
210, 2004.
73

Bibliography
[8] B. Shekunov, P. Chattopadhyay, H. Tong, and A. Chow, “Particle size analysis in phar-
maceutics: Principles, methods and applications,” Pharmaceutical Research, vol. 24,
no. 2, pp. 203–227, 2007.
[9] A. Noyes and W. Whitney, “The rate of solution of solid substances in their own so-
lutions,” The Journal of the American Chemical Society, vol. 19, no. 12, pp. 930–934,
1897.
[10] R. Müller, C. Jacobs, and O. Kayser, “Nanosuspensions as particulate drug formula-
tions in therapy: Rationale for development and what we can expect for the future,”
Advanced Drug Delivery Reviews, vol. 47, no. 1, pp. 3–19, 2001.
[11] J. Hu, K. Johnston, and R. Williams III, “Nanoparticle engineering processes for en-
hancing the dissolution rates of poorly water soluble drugs,” Drug Development and
Industrial Pharmacy, vol. 30, no. 3, pp. 233–245, 2004.
[12] N. Rasenack and R. Müller, “Dissolution rate enhancement by in situ micronization
of poorly water-soluble drugs,” Pharmaceutical Research, vol. 19, no. 12, pp. 1894–
1900, 2002.
[13] E. Beckman, “Green chemical processing using CO2,” Industrial and Engineering
Chemistry Research, vol. 42, no. 8, pp. 1598–1602, 2003.
[14] M. Poliakoff, J. Fitzpatrick, T. Farren, and P. Anastas, “Green chemistry: Science and
politics of change,” Science, vol. 297, no. 5582, pp. 807–810, 2002.
[15] E. Elizondo, J. Veciana, and N. Ventosa, “Nanostructuring molecular materials as
particles and vesicles for drug delivery, using compressed and supercritical fluids,”
Nanomedicine, vol. 7, no. 9, pp. 1391–1408, 2012.
[16] J. Jung and M. Perrut, “Particle design using supercritical fluids: Literature and
patent survey,” The Journal of Supercritical Fluids, vol. 20, no. 3, pp. 179 – 219, 2001.
[17] P. G. Jessop and B. Subramaniam, “Gas-expanded liquids,” Chemical Reviews,
vol. 107, no. 6, pp. 2666–2694, 2007.
[18] F. Wubbolts, O. Bruinsma, and G. Van Rosmalen, “Measurement and modelling of the
solubility of solids in mixtures of common solvents and compressed gases,” Journal
of Supercritical Fluids, vol. 32, no. 1-3, pp. 79–87, 2004.
74

Bibliography
[19] M. Munto, N. Ventosa, S. Sala, and J. Veciana, “Solubility behaviors of ibuprofen and
naproxen drugs in liquid "co2-organic solvent" mixtures,” Journal of Supercritical
Fluids, vol. 47, no. 2, pp. 147–153, 2008.
[20] S. Sala, N. Ventosa, T. Tassaing, M. Cano, Y. Danten, M. Besnard, and J. Veciana,
“Synergistic enhancement of the solubility of hexamethylenetetramine in subcriti-
cal co2-ethanol mixtures studied by infrared spectroscopy,” ChemPhysChem, vol. 6,
no. 4, pp. 587–590, 2005.
[21] T. Yasuji, H. Takeuchi, and Y. Kawashima, “Particle design of poorly water-soluble
drug substances using supercritical fluid technologies,” Advanced Drug Delivery Re-
views, vol. 60, no. 3, pp. 388–398, 2008.
[22] M. Turk, P. Hils, B. Helfgen, K. Schaber, H. Martin, and M. Wahl, “Micronization of
pharmaceutical substances by the rapid expansion of supercritical solutions (ress):
a promising method to improve bioavailability of poorly soluble pharmaceutical
agents,” The Journal of Supercritical Fluids, vol. 22, no. 1, pp. 75 – 84, 2002.
[23] C. Domingo, E. Berends, and G. Van Rosmalen, “Precipitation of ultrafine organic
crystals from the rapid expansion of supercritical solutions over a capillary and a frit
nozzle,” Journal of Supercritical Fluids, vol. 10, no. 1, pp. 39–55, 1997.
[24] S. Cihlar, M. Tuerk, and K. Schaber, “Submicron particles of organic solids by rapid
expansion of supercritical solutions,” Journal of Aerosol Science, vol. 30, no. Suppl. 1,
pp. S355–S356, 1999.
[25] B. Subramaniam, R. A. Rajewski, and K. Snavely, “Pharmaceutical processing with
supercritical carbon dioxide,” Journal of Pharmaceutical Sciences, vol. 86, no. 8,
pp. 885–890, 1997.
[26] N. Ventosa, S. Sala, J. Veciana, J. Torres, and J. Llibre, “Depressurization of an ex-
panded liquid organic solution (delos): A new procedure for obtaining submicron-
or micron-sized crystalline particles,” Crystal Growth and Design, vol. 1, no. 4,
pp. 299–303, 2001.
[27] N. Ventosa, S. Sala, and J. Veciana, “Delos process: A crystallization technique us-
ing compressed fluids - 1. comparison to the gas crystallization method,” Journal of
Supercritical Fluids, vol. 26, no. 1, pp. 33–45, 2003.
75

Bibliography
[28] S. Sala, A. Cordoba, E. Moreno-Calvo, E. Elizondo, M. Munto, P. E. Rojas, M. A. A.
Larrayoz, N. Ventosa, and J. Veciana, “Crystallization of microparticulate pure poly-
morphs of active pharmaceutical ingredients using CO2-expanded solvents,” Crystal
Growth & Design, vol. 12, no. 4, pp. 1717–1726, 2012.
[29] E. Moreno-Calvo, F. Temelli, A. Cordoba, N. Masciocchi, J. Veciana, and N. Ventosa,
“A new microcrystalline phytosterol polymorph generated using co2-expanded sol-
vents,” Crystal Growth and Design, vol. 14, no. 1, pp. 58–68, 2014.
[30] R. Rowe and R. Roberts, “The mechanical properties of powders,” Advanced in Phar-
maceutical Sciences, pp. 1–62, 1995. cited By 1.
[31] M. Shariare, N. Blagden, M. de Matas, F. Leusen, and P. York, “Influence of solvent
on the morphology and subsequent comminution of ibuprofen crystals by air jet
milling,” Journal of Pharmaceutical Sciences, vol. 101, no. 3, pp. 1108–1119, 2012.
[32] A. Bhakay, M. Merwade, E. Bilgili, and R. Dave, “Novel aspects of wet milling for
the production of microsuspensions and nanosuspensions of poorly water-soluble
drugs,” Drug Development and Industrial Pharmacy, vol. 37, no. 8, pp. 963–976, 2011.
[33] L. Peltonen and J. Hirvonen, “Pharmaceutical nanocrystals by nanomilling: Critical
process parameters, particle fracturing and stabilization methods,” Journal of Phar-
macy and Pharmacology, vol. 62, no. 11, pp. 1569–1579, 2010.
[34] Y. Obidchenko, N. Khuchua, R. Abramovich, A. Savochkina, A. Karamyan, S. Bars-
egyan, Y. Khomyakov, M. Ovcharov, and V. Chistyakov, “Preparation of micronized
ibuprofen substance and assessment of its bioavailability,” Pharmaceutical Chem-
istry Journal, vol. 47, no. 7, pp. 382–386, 2013.
[35] X. Han, L. Jallo, D. To, C. Ghoroi, and R. Dave, “Passivation of high-surface-energy
sites of milled ibuprofen crystals via dry coating for reduced cohesion and improved
flowability,” Journal of Pharmaceutical Sciences, vol. 102, no. 7, pp. 2282–2296, 2013.
[36] X. Han, C. Ghoroi, D. To, Y. Chen, and R. Dave, “Simultaneous micronization and
surface modification for improvement of flow and dissolution of drug particles,” In-
ternational Journal of Pharmaceutics, vol. 415, no. 1-2, pp. 185–195, 2011.
76

Bibliography
[37] N. Rasenack, H. Hartenhauer, and B. MÃijller, “Microcrystals for dissolution rate en-
hancement of poorly water-soluble drugs,” International Journal of Pharmaceutics,
vol. 254, no. 2, pp. 137–145, 2003.
[38] N. Rasenack and B. Muller, “Properties of ibuprofen crystallized under various con-
ditions: A comparative study,” Drug Development and Industrial Pharmacy, vol. 28,
no. 9, pp. 1077–1089, 2002.
[39] N. Rasenack, H. Steckel, and B. Muller, “Preparation of microcrystals by in situ mi-
cronization,” Powder Technology, vol. 143-144, pp. 291–296, 2004.
[40] M. Perrut, J. Jung, and F. Leboeuf, “Enhancement of dissolution rate of poorly-soluble
active ingredients by supercritical fluid processes: Part i: Micronization of neat par-
ticles,” International Journal of Pharmaceutics, vol. 288, no. 1, pp. 3 – 10, 2005.
[41] A. Hezave and F. Esmaeilzadeh, “Micronization of drug particles via ress process,”
Journal of Supercritical Fluids, vol. 52, no. 1, pp. 84–98, 2010.
[42] U. T. Lam, Bioparticle engineering Using Dense Gas Technologies. PhD thesis, The
University og New South Wales, 2009.
[43] F. Wubbolts, Supercritical Crystallization: Volatile Components as (Anti-) Solvents.
PhD thesis, Technische Universiteit Delft, 2000.
[44] M. Munto, Micro- i nanoestructuracio de materials moleculars funcionals amb fluits
comprimits: Desenvolupament de metodologies de preparacio i estudis fisicoquoim-
ics. PhD thesis, UAB, 2009.
[45] G. Khan and Z. Jiabi, “Preparation, characterization, and evaluation of physicochem-
ical properties of different crystalline forms of ibuprofen,” Drug Development and
Industrial Pharmacy, vol. 24, no. 5, pp. 463–471, 1998.
[46] H. Garekani, F. Sadeghi, A. Badiee, S. Mostafa, A. Rajabi-Siahboomi, and A. Rajabi-
Siahboomi, “Crystal habit modifications of ibuprofen and their physicomechanical
characteristics,” Drug Development and Industrial Pharmacy, vol. 27, no. 8, pp. 803–
809, 2001.
77

Bibliography
[47] H. Cano, N. Gabas, and J. Canselier, “Experimental study on the ibuprofen crystal
growth morphology in solution,” Journal of Crystal Growth, vol. 224, no. 3-4, pp. 335–
341, 2001.
[48] N. Rasenack and B. W. Muller, “Ibuprofen crystals with optimized properties,” Inter-
national Journal of Pharmaceutics, vol. 245, pp. 9 – 24, 2002.
[49] F.E.Wubbolts, Supercritical Crystallization-Volatile Components as (Anti-)Solvents.
PhD thesis, Technische Universiteit Delft, 2000.
[50] J. Todd Reaves, A. Griffith, and C. Roberts, “Critical properties of dilute carbon diox-
ide + entrainer and ethane + entrainer mixtures,” Journal of Chemical and Engineer-
ing Data, vol. 43, no. 4, pp. 683–686, 1998.
[51] E. Reverchon and I. De Marco, “Supercritical antisolvent micronization of cefonicid:
Thermodynamic interpretation of results,” Journal of Supercritical Fluids, vol. 31,
no. 2, pp. 207–215, 2004.
[52] E. Reverchon and I. De Marco, “Supercritical antisolvent precipitation of
cephalosporins,” Powder Technology, vol. 164, no. 3, pp. 139–146, 2006.
[53] J. Mullin Crystallization, 1993.
[54] M. Lahav and L. Leiserowitz, “The effect of solvent on crystal growth and morphol-
ogy,” Chemical Engineering Science, vol. 56, no. 7, pp. 2245–2253, 2001.
[55] J. Ter Horst, R. Geertman, and G. Van Rosmalen, “The effect of solvent on crystal
morphology,” Journal of Crystal Growth, vol. 230, no. 1-2, pp. 277–284, 2001.
[56] M. Kamlet, R. Doherty, M. Abraham, Y. Marcus, and R. Taft, “Linear solvation en-
ergy relationships. 46. an improved equation for correlation and prediction of oc-
tanol/water partition coefficients of organic nonelectrolytes (including strong hy-
drogen bond donor solutes),” Journal of Physical Chemistry, vol. 92, no. 18, pp. 5244–
5255, 1988.
[57] M. Kamlet and R. Taft, “The solvatochromic comparison method. i. the alfa-scale of
solvent hydrogen-bond acceptor (HBA) basicities,” Journal of the American Chemi-
cal Society, vol. 98, no. 2, pp. 377–383, 1976.
78

Bibliography
[58] M. Kamlet, J. Abboud, and R. Taft, “The solvatochromic comparison method. 6.
the pi scale of solvent polarities,” Journal of the American Chemical Society, vol. 99,
no. 18, pp. 6027–6038, 1977.
[59] R. Taft, J.-L. Abboud, M. Kamlet, and M. Abraham, “Linear solvation energy rela-
tions,” Journal of Solution Chemistry, vol. 14, no. 3, pp. 153–186, 1985.
[60] L. Ferrer Tasies, E. Moreno Calvo, M. Cano-Sarabia, M. Aguilella Arzo, A. Angelova,
S. Lesieur, S. Ricart, J. Faraudo, N. Ventosa, and J. Veciana, “Quatsomes: Vesicles
formed by self-assembly of sterols and quaternary ammonium surfactants,” Lang-
muir, vol. 29, no. 22, pp. 6519–6528, 2013.
[61] E. Elizondo, E. Moreno, I. Cabrera, A. Cordoba, S. Sala, J. Veciana, and N. Ventosa, “Li-
posomes and other vesicular systems: Structural characteristics, methods of prepa-
ration, and use in nanomedicine,” Progress in Molecular Biology and Translational
Science, vol. 104, pp. 1–52, 2011.
[62] M. Cano-Sarabia, N. Ventosa, S. Sala, C. Patio, C.o, R. Arranz, and J. Veciana, “Prepa-
ration of uniform rich cholesterol unilamellar nanovesicles using CO2-expanded sol-
vents,” Langmuir, vol. 24, no. 6, pp. 2433–2437, 2008.
79

Bibliography
80

3DELOS-susp for the preparation of
pharmaceutical suspensions
3.1 Introduction
3.1.1 Micro-suspensions as Drug Delivery Systems
Dispersed systems, such as suspensions, emulsions and liposomes, consist of systems of
at least two phases: the substance that is dispersed known as the dispersed or internal
phase, and the continuous (or) external phase. These systems are widely used in various
industrial sectors, such as pharmaceuticals, foodstuffs, cosmetics, agriculture, polymers,
chemicals and ceramics [1] (Figure 3.1). In order to successfully penetrate the market,
the structural characteristics of these systems must be tailorable to provide high quality
products.
A well established strategy to increase bioavailability of poorly water soluble drugs
is the creation and formulation of well dispersed micro- and submicroscale drugs sus-
pended in an aqueous solution, so called suspensions [2]. Pharmaceutical micro- sus-
81

Chapter 3. DELOS-susp for the preparation of pharmaceutical suspensions
Figure 3.1: Scheme of a stable aqueous suspension.
pensions are a two phase systems composed of micro-scale particulate drugs suspended
in a continuous liquid media.
Micro-suspensions can be used for compounds that are water insoluble but which are
soluble in oils and can also be used to successfully formulate compounds that are insol-
uble in both water and oil. These suspensions overcome delivery issues for poorly water
soluble compounds by obviating the need to dissolve them, and by maintaining the drug
in a preferred crystalline state with a particle size sufficiently small for pharmaceutical ac-
ceptability. In addition, utilization of the dense, solid state confers an additional advan-
tage of higher mass per volume loading. This is crucial when a high dosing is required.
Moreover, the suspension technology has subsequent revealed secondary benefits that
are now beginning to be realized: the particulate nature of the dosage form might offer
alternative pharmacokinetic profiles in intravenous delivery that can offer less toxic and
more efficacious regimes. Moreover, as explained in Chapter 2, micronization of poorly
soluble drug increases its dissolution rate, thereby addressing a number of issues related
to poor oral bioavailability. The solid state of the drug offers solutions to issues of chem-
ical stability [3, 4]. By suspending the drugs as micro or nanoparticles, one can achieve
a dose that is higher than that of a solution, which is thermodynamically limited by the
aqueous solubility of the drug [5, 1, 6, 4].
Since the last two decades, production and stabilization of pharmaceutical suspen-
sions has been an effective focus of pharmaceutical industry [4].
Aqueous forms of micro and submicron particles require special formulation tech-
niques to optimize the properties of the drugs. An important target in this context is the
82

3.1. Introduction
conversion of the generally coarse crystalline product into the finest particulate disper-
sion possible [7].
The available techniques to produce suspensions are very similar to the methods to
produce microparticles of APIs and hence can be also categorized into two major classes:
top-down (milling) and bottom-up (precipitation and chemical reaction) technologies, as
depicted in Figure 3.2.
Figure 3.2: Methods for the preparation of micro and submicronparticles. Adapated from
[7].
Top-down approaches are disintegration methods applicable to coarse suspensions.
There are two basic disintegration technologies for preparation of aqueous suspensions:
• Pearl/ball milling
In pearl/bal milling, the coarse suspension is loaded into a milling container con-
taining milling pearls from, i.e. glass, zircon oxide or special polymers such as hard
polystyrene derivatives. The pearls are moved by a stirrer, the drug is ground to
nanocrystals in between the pearls [8]. This is the basic technology developed by G.
Liversidge and coworkers, who patented it under the name of NanoCrystals®. This
patent-protected technology was developed in 1990 and was formerly owned by the
company NanoSystems, recently acquired by Elan. To produce NanoCrystals®, the
83

Chapter 3. DELOS-susp for the preparation of pharmaceutical suspensions
drug powder is dispersed in a surfactant solution and the obtained suspension un-
dergoes a pearl milling process for hours to several days. The first products on the
market using this technology were Rapamune and Emend and were launched in
2002 and 2003, respectively. A general problem of pearl mills is the potential ero-
sion of material from the milling pearls leading to product contamination. Scaling
up with pearl mills is possible; however, there is a certain limitation in the size of
the mill due to its weight [8].
• High Pressure homogenization:
The second most frequently used disintegration method is milling by high pressure
homogenization. In the high pressure homogenization technique, the coarse drug
suspension is forced under pressure through a valve that has a nano aperture. Typi-
cal pressures applied are between 100 and 1500 bars. As the drug suspension passes
through the nano aperture with high velocity, the static pressure is decreased, lead-
ing to the formation of small gas bubbles, which implode as they exit the valve. The
cavitation forces created breakdown the drug particles. It is not possible to obtain
the desired particle size for many drugs in a single homogenization cycle.
When producing suspensions using homogenization methods, the most important
technologies are: Microfluidizer technology and Piston-gap homogenization.
The Microfluidizer technology is a jet stream principle. The suspension is acceler-
ated and passes with a high velocity through an especially designed homogeniza-
tion chamber. There are two types of chambers: a) a Z-type chamber, where the
suspension changes a few times the direction of its flow leading to particle colli-
sion and shear forces. In the second type of chamber, b) the Y-type, the suspension
stream is divided into two streams which then collide frontally. A disadvantage of
the technology is the large number of passes through the microfluidizer required to
achieve the desired particle size.
Piston-gap homogenization was developed in the middle of the 1990s by Müller
and coworkers and was patented under the name DissoCubes®. In this technology,
the drug powder is dispersed in an aqueous surfactant solution and subsequently
forced by a piston through a tiny homogenization gap with pressures ranging up
to 4000 bar. The width of the homogenization gap depends on the viscosity of the
suspension and the applied pressure and usually ranges from 5 to 20 µm. The re-
84

3.1. Introduction
sulting high streaming velocity of the suspension causes an increase in the dynamic
pressure which is compensated by a reduction in the static pressure below the va-
por pressure of the aqueous phase. Formation of gas bubbles occurs because the
water starts boiling at room temperature. These gas bubbles collapse immediately
when the liquid leaves the homogenization gap at atmospheric pressure [9]. Figure
3.3 presents a typical piston gap homogenizer.
Figure 3.3: Basic principle of high pressure homogenization using a piston gap homoge-
nizer. Adapated from [10].
Milling processes are in principle unsuitable for the production of micro dispersed sys-
tems with narrow size distribution since with decreasing particle size it becomes increas-
ingly more difficult to use the applied mechanical energy in the form of shearing and cavi-
tation forces. Moreover, the unavoidable milling element abrasion contaminates the final
product and is difficult to separate, especially in active compound formulations. All me-
dia milling processes involve high energy input [11]. In general, in top-down process con-
siderable heat is generated which may cause degradation of heat sensitive APIs. Milling
has been shown to cause mechanical activation at drug particle surfaces [12].
In spite of these disadvantages, milling processes do find widespread use in the formu-
lation of poorly soluble active compounds [13, 14] since alternative technologies which
could deliver micro and submicron particles are essentially still in the development stage
[15].
In contrast to top-down techniques, bottom-up methods generate micro and submi-
cron particles by building them from drug molecules in solution. This can be achieved by
85

Chapter 3. DELOS-susp for the preparation of pharmaceutical suspensions
controlled precipitation (or crystallization). These processes can occur in the bulk solu-
tion or in droplets, depending on the technique [9].
Particle production by bottom-up processes is an area of growing interest as the num-
ber of marketed products employing nanotechnology is expected to increase. Although
specific production techniques vary, they converge at the point of controlling the parti-
cle growth kinetics through mixing rate during precipitation or evaporation rate of the
droplets [7].
Formation of a stable suspension with the smallest particle size requires high nucle-
ation rate but low growth rate. Both process rates are dependent on supersaturation as
explained in Chapter 1, therefore, high-supersaturation conditions are chosen for rapid
nucleation.
Precipitation is the traditional approach to produce nano and microsized drug mate-
rials, but has the problem of a possible uncontrolled particle growth. The company Baxter
introduced a combination technology called NANOEDGE, where precipitation is followed
by a second high energy step, typical high pressure homogenization.
The precipitation processes from homogeneous solution with suitable process control
allow the preparation of extremely fine particulate dispersions. These technical advan-
tages also make precipitation processes particularly attractive from an economic view-
point. For the manufacturing of micro- and submicrosuspensions, precipitation condi-
tions are chosen so as to minimize particle size.
Figure 3.4 gives a general overview of precipitation and condensation processes for
the production of organic micron or submiconparticles in aqueous media. The starting
point of the three groups of methods is a molecularly dispersed solution of the API.
The individual process disclosed in Figure 3.4 differs in respect to the adjustment of
the temporal supersaturation profile as well as in the choice and function of the additives.
Process I and II employ lipophilic solvents and particle size restriction occurs through an
emulsion step as an intermediate stage and is adjusted mechanically by homogenization
[16]. In process III, the formation of micron and submicron particles takes place through a
transient emulsion phase which forms spontaneously. When hydrophilic and fully water-
miscible solvents are used (process IV and V), particle formation takes place by precipita-
tion, according to nucleation and crystal growth or at extremely high supersaturation by
spinodal phase separation. In each case, agglomeration can take place.
Except in the case of lipophilic solvents (process I and II) particle size distribution is
controlled by the level of the adjustable supersaturation as well as by surfactant additives.
86

3.1. Introduction
Figure 3.4: Precipitation and condensation processes for the preparation of organic micro
and submicronsuspensions. Adapted from [7].
Only in process I and V, particle formation takes place by pure precipitation processes.
In the other variants, a pseudo latex system is formed though physical condensation of
dissolved macromolecules [7].
Conventional precipitation process also entails some problems by the generation of
various unstable polymorphs, hydrates and solvates during processing. In addition, these
approaches involve the use of solvents which are usually difficult to remove completely
[2]. Moreover, though bottom-up approaches have shown promise, considerable gaps
exist and more work is required before these techniques can be commercialized [17].
As mentioned in the Introduction of this Thesis, the scaling-up of conventional pre-
cipitation techniques comprises several difficulties, and cCO2 based technology emerges
as a very promising approach for the production of micro dispersed systems at large scale.
The two most popular cCO2-based methods are RESOLV and RESAS [18, 19, 20]. These
processes consist of a simple modification of the RESS method for preparing stable sus-
pensions. As described in Chapter 2, RESS methodology effectiveness relies on the solu-
bility of the active compound in cCO2, that it is usually very low.
The development of versatile methods for the preparation of stable aqueous suspen-
87

Chapter 3. DELOS-susp for the preparation of pharmaceutical suspensions
sions of poorly soluble drugs is still a major challenge, despite the extensive effort based
on traditional techniques [4]. While the uncountable benefits of producing pharmaceu-
tical nanosuspensions have been and continue to be explored, the methods to produce
them have not been well established.
The possibility and ability for large-scale production of a delivery system or a dosage
form is the essential prerequisite for its introduction to the pharmaceutical market. It is
pointless to have a very neat delivery system but no possibility to produce it on a large
scale to supply the market [6]. Moreover, it is well established that the method of man-
ufacture can significantly impact the formation and stability of suspensions and hence
their overall performance [11].
In light of this need, this Chapter is devoted to explore new ways to manufacture stable
pharmaceutical micro- and submicron suspensions in a fast, safe and predictable man-
ner, which is still a requirement in the pharmaceutical industry.[4]. In the following, a
small introduction regarding the stability of suspensions and the role of surfactants in the
obtaining of aqueous suspensions is presented.
3.1.2 Stability of aqueous suspensions
Stability issues associated with suspensions have been widely investigated and can be
categorized as physical and chemical stability. Drug particles can either settle down or
cream up in the formulation medium depending on their density relative to the medium
[21] (Figure 3.16).
Role of surfactants in aqueous suspensions
Finely dispersed particles in an aqueous phase have a high tendency to agglomerate to-
gether leading to the formation of larger aggregates [1]. Aggregation of particles lowers
the stability of the systems and the crisis is even more severe when a suspension contains
a high concentration of particles [22, 23]. A surfactant (a contraction of the term surface-
active agent) literally means active at a surface. The name amphiphile is sometimes used
synonymously with surfactant. The word is derived from the Greek word amphi, mean-
ing both, which relates to the fact that all surfactants consist of two parts, one soluble
in a specific fluid (lyophilic part) and one which in insoluble (lyophobic) (see Figure 3.6)
[24]. The relation of both parts of the surfactant is described by the hydrophile-lipophile
balance, (HLB) which is a number between 0 and 40 indicative of the emulsification be-
88

3.1. Introduction
Figure 3.5: Common destabilization mechanism of suspensions.
Figure 3.6: Schematic representation of a surfactant.
havior and it is related to the balance between the hydrophilic and lipophilic portions of
the molecules.
A surfactant is a substance that, when present at low concentration in a system, has
the property of adsorbing onto the surfaces or interfaces of the system and of altering to a
marked degree the surface or interfacial free energies of those surfaces (or interfaces). The
term interface indicates a boundary between any two immiscible phases; the term surface
denotes an interface where one phase is a gas, usually air. The interfacial free energy is
the minimum amount of work required to create that interface [25]. The interfacial (or
surface) tension is also a measure of the difference in nature of the two phases meeting
at the interface (or surface). The greater the dissimilarity in their natures, the greater the
interfacial (or surface) tension between them. A surfactant is therefore a substance that at
89

Chapter 3. DELOS-susp for the preparation of pharmaceutical suspensions
low concentrations adsorbs at some or all of the interfaces in the system and significantly
changes the amount of work required to expand those interfaces [26].
It is thought that surfactants inhibit crystal growth and aggregation of particles in sus-
pensions by adsorbing on the crystal surfaces [22, 23, 27]. There are two main mecha-
nisms through which colloidal suspensions can be stabilized in both aqueous and non-
aqueous medium, i.e. electrostatic repulsion and steric stabilization [28, 29, 3, 21]. These
two mechanisms can be achieved by adding ionic and non- ionic stabilizers into the
medium, respectively. Amphiphilic non-ionic stabilizers are usually utilized to provide
steric stabilization which is dominated by solvation effect. As the non-ionic stabilizers
are introduced into suspensions, they are absorbed onto the drug particles through an
anchor segment that strongly interacts with the dispersed particles, while the other well-
solvated tail segment extends into the bulk medium [21].
As mentioned, the adsorption of polymers and surfactants at the growing interface
reduces the interfacial surface energy and hence, inhibits particle growth. When particles
of a drug are formed, a new surface area is created, which necessitates a free-energy (∆G)
cost defined by:
∆G = γs/l ∗∆A , (3.1)
in which γs/l is the interfacial tension and∆A is the new area formed. This arises because
water molecules incur fewer attractive forces with other water molecules when located
at a free surface. The system prefers to reduce this increase in surface area by either dis-
solving incipient crystalline nuclei, in the case of precipitation, or by agglomerating small
particles, regardless of their formation mechanism. This tendency is resisted by the addi-
tion of surface-active agents, which, as explained above, reduce the γs/l and therefore the
free energy of the system (Figure 3.7).
Nucleation is the key step in a crystallization process [30]. Effective stabilizers for
bottom-up preparation methods should have the ability to promote the rate of nucle-
ation. Surfactants and polymers, apart from decreasing the surface tension of the system,
increase the the viscosity of a solution at any temperature [31]. This decrease in surface
tension and increase in viscosity enhance nucleation rate. This can be rationalized bear-
ing in mind the nucleation rate expression according to the classical theory of homoge-
nous nucleation [32]:
J = A∗exp(− B
l nS2) , (3.2)
90

3.1. Introduction
Figure 3.7: Creation and stabilization of microparticles from the perspective of surface en-
ergetics: a) In the case of unfavorable energetics, hydrophobic crystal surface directly con-
tacting water molecules leads to crystal agglomeration, because, as shown by the arrows,
water molecules are energetically driven to leave the surface. b) A surfactant-stabilized
crystal surface reduces interfacial tension by allowing attractive mater-surfactant interac-
tions.The crystal surface is stabilized and shows reduced tendency to agglomerate.Adapted
from [3].
where J is the nucleation rate, S is the supersaturation, A is
A = N0 ∗υ , (3.3)
being N0 the number of molecules of solute per unit volume and υ the frequency of molec-
ular transport to the solid-liquid interface,
υ≈ kT
3Πa02η
, (3.4)
where η is the viscosity and a0 is the mean effective diameter of the diffusing species.
And B in expression (3.2) is
B = 16Πσ3υs2
3k3T 3, (3.5)
where σ is the surface tension at the solid-liquid interface, k is the Boltzmann constant,
υs is the volume of a solute molecule and T is the temperature. According to equations
3.2 and 3.5, a decrease in surface tension increases the nucleation rate, and as a result,
91

Chapter 3. DELOS-susp for the preparation of pharmaceutical suspensions
particle size decrease [33, 34]. Based on expression (3.4), an increase in viscosity reduces
the number of collisions and decreases the rate of mass transfer from the solution to the
growing solid-liquid interface as a result of diffusion [31].
The addition of surfactants and polymers as stabilizers can greatly improve the sta-
bility of a drug suspension system [35, 36, 37], however, unfortunately, there exists no
systematic technique to determine the effectiveness of additives a priori. Therefore, due
to a lack of predictability, stabilizers are typically chosen empirically or using heuristics.
In addition, there are no high throughput means to test the effectiveness of various stabi-
lizers. Currently, there are a few studies incorporating theoretical predictions of stabilizer
effectiveness, in particular, models proposed to explain the enhancement of stability by
additives, and a study on the stabilization of covalent metal nano-scale crystals [38], but
none for small pharmaceutical crystals. Furthermore, no models exist to compare the
stabilization capabilities of using multiple stabilizers simultaneously, therefore leaving
the possibility of additive synergism unexplored [39].
92

3.2. Development of a DELOS-susp procedure for the preparation of aqueoussuspensions
3.2 Development of a DELOS-susp procedure for the prepa-
ration of aqueous suspensions
DELOS-susp method arises as a novel and promising methodology for the preparation
of colloidal molecular micro and nanoparticles in an eco-efficient manner [40, 41]. In
this Thesis, it is explored for the first time the use of DELOS-susp for the preparation of
aqueous suspensions.
Taking advantage of the versatility of the DELOS method, a simple modification was
introduced after the depressurization stage, keeping the simplicity of the process intact.
In this new platform, called DELOS-susp, the CO2-expanded solution is depressurized
into an aqueous phase instead of passing through a filter (Figure 3.8). The explanation
behind this modification is to inhibit the undesired particle growth and agglomeration
that can take place after depressurization during filtration of particles. During filtration,
the nucleus are still in contact with the mother liquors and therefore they can continue
growing. Mechanistically, the liquid at the receiving end of the rapid depressurization that
occurs in DELOS, could suppress particle growth of the precipitate.
As depicted in Figure 3.8, the first and second stage of DELOS-susp procedure are the
same as in DELOS method (see Figure 2.6 of Chapter 2) and are the following: the API
is dissolved in a conventional organic solvent at atmospheric pressure and at working
temperature (TW ). The solution is charged into the high pressure vessel, which has been
previously driven to the working temperature (TW ). CO2 is then added to obtained a vol-
umetric expanded solution of the API at TW and at high pressure (PW ) with a given molar
fraction of CO2 (xW ). Finally, this CO2-expanded solution is depressurized from PW to at-
mospheric pressure over a continuous aqueous flow, giving a aqueous suspension of the
drug.
Experimental protocol and equipment
The equipment adapted in this Thesis for preparing suspensions is schematized in Fig-
ure 3.9. This set-up comprises a 300mL reactor where CO2 is pumped through a high
pressure pump (B-1), which head is cooled by a cooling unit. Before entering the high
pressure vessel, CO2 is heated to the working temperature (TW ) using a heat exchanger
(TIC). The amount of CO2 added to the reactor through valve V1-b is measured by a mass
flowmeter (FCO2). The vessel temperature is controlled using an external fluid heating
93
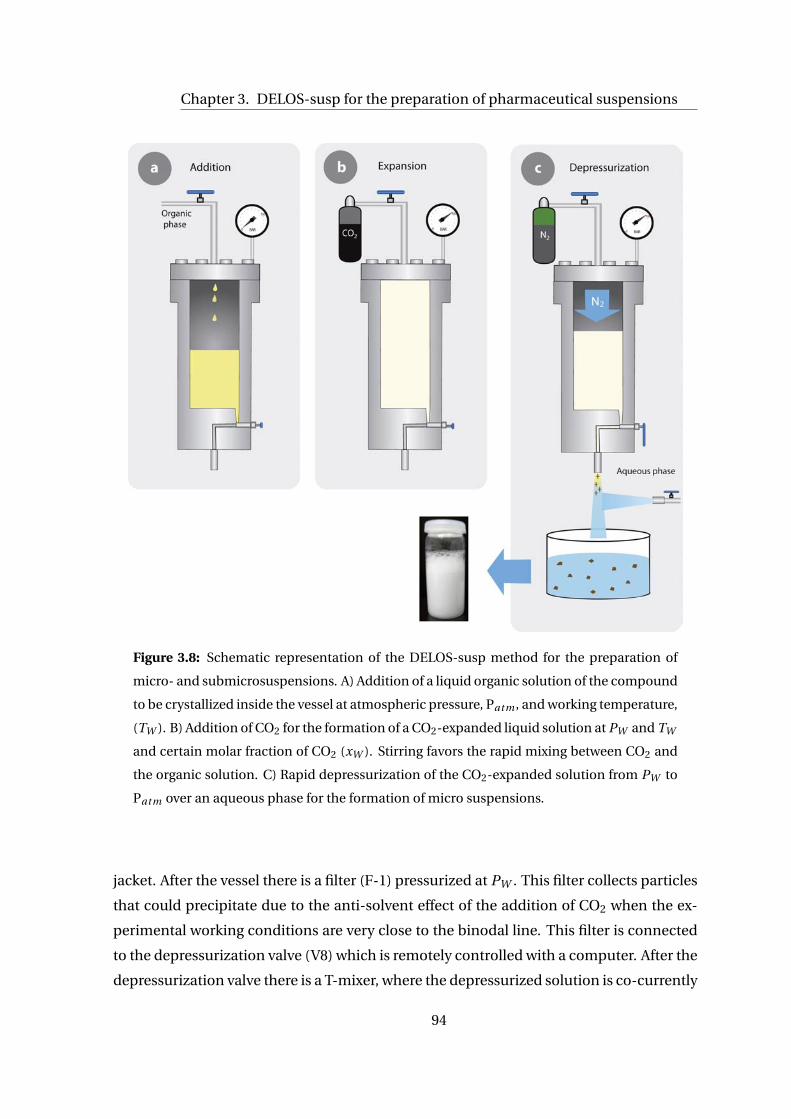
Chapter 3. DELOS-susp for the preparation of pharmaceutical suspensions
Figure 3.8: Schematic representation of the DELOS-susp method for the preparation of
micro- and submicrosuspensions. A) Addition of a liquid organic solution of the compound
to be crystallized inside the vessel at atmospheric pressure, Patm , and working temperature,
(TW ). B) Addition of CO2 for the formation of a CO2-expanded liquid solution at PW and TW
and certain molar fraction of CO2 (xW ). Stirring favors the rapid mixing between CO2 and
the organic solution. C) Rapid depressurization of the CO2-expanded solution from PW to
Patm over an aqueous phase for the formation of micro suspensions.
jacket. After the vessel there is a filter (F-1) pressurized at PW . This filter collects particles
that could precipitate due to the anti-solvent effect of the addition of CO2 when the ex-
perimental working conditions are very close to the binodal line. This filter is connected
to the depressurization valve (V8) which is remotely controlled with a computer. After the
depressurization valve there is a T-mixer, where the depressurized solution is co-currently
94

3.2. Development of a DELOS-susp procedure for the preparation of aqueoussuspensions
mixed with the aqueous phase. During depressurization the aqueous phase is pumped at
a constant flow by a peristaltic pump (B-3). The aqueous suspension is collected in a
plastic bucket (T).
Figure 3.9: Schematic representation of the DELOS-susp set-up for the preparation of
micro- and submicrosuspensions.
The distance between the depressurization valve and the T-mixer has kept constant as
well as the flow at which the aqueous phase is pumped during depressurization.
The experimental protocol followed for the preparation of micro and submicron sus-
pensions of APIs is the following:
1. A certain volume (VI ) of an initial solution of the compound to be crystallized in
organic solvent with a specific Ci is added to the high pressure vessel at atmospheric
pressure and at the working temperature (TW ).
2. After 30 minutes, once the solution has achieved TW , the vessel is pressurized with
compressed CO2 through valve V-1b, producing a volumetric expanded liquid solu-
tion with the desired molar fraction of CO2 ( xW ) at the working pressure (PW ). The
stirring is switched on during the addition of CO2 to favor the mixing between cCO2
and the organic solution.
3. The system "solute/organic solvent/CO2" is left to equilibrate during at least 1hour.
95

Chapter 3. DELOS-susp for the preparation of pharmaceutical suspensions
4. Filter F-1 is pressurized at PW . Valve V-6 is opened to connect the pressurized filter
F-1 with the vessel. Filter F-1 collects any precipitate formed due to the antisolvent
behavior of CO2 that could take place.
5. The CO2-expanded solution is then depressurized from PW to atmospheric pres-
sure though valve V-8 into the T-mixer where it is mixed with a certain volume of an
aqueous phase (Vaq ) which is being pumped with a specific flow (F ). A current of
nitrogen at PW is used as embolus to push down the expanded solution in order to
maintained constant pressure in the reactor during depressurization.
6. The mixing of the depressurized solution with the aqueous phase leads to the for-
mation of aqueous suspensions.
96

3.3. Preparation of aqueous suspensions of the thiadiazoline derivative NP byDELOS-susp
3.3 Preparation of aqueous suspensions of the thiadiazo-
line derivative NP by DELOS-susp
DELOS-susp method emerges as a promising approach to tackle the uncontrolled growth
of NP crystal that occurs after depressurization of the CO2-expanded solution in DELOS
process. Although it is not exactly clear from the experimental results explained in Chap-
ter 2 what is the mechanism that cause this phenomenon, it is very common in precipita-
tion that agglomeration of the particles occurs during filtration of the particles [18]. This
agglomeration can cause a variety of issues including crystal growth [21]. The following
section is devoted to explore this new alternative of DELOS platform for the preparation
of stable aqueous micro and submicro-suspensions of NP crystals.
In order to validate DELOS-sups method for the production of aqueous suspensions
of NP and to asses the quenching effect of water after depressurization, two DELOS-susp
preliminary experiments were designed on the basis of the DELOS crystallization exper-
iments which had the highest yield and which produced the smallest particles. Exper-
iment DELOS 3 was the one with the highest yield and the experimental conditions of
experiments 5-6 produced the particles with the smallest particle size (see Section 2.3.3
and Table 2.5.) These DELOS crystallizations were conducted at TW = 313 K and PW = 10
MPa using acetonitrile as organic solvent. Experiment DELOS 3 was carried out at β=0.8
whereas experiment DELOS 6 carried out at a higher initial concentration and hence at
a higher initial supersaturation, βi =1. The molar fraction of CO2 in experiment 3 was
xW =0.6 and in experiment 6, xW =0.4.
As mentioned, the experimental procedure of DELOS-susp is the same of DELOS for
the two first stages and the difference of both process relies on the third stage: In DELOS-
susp, the CO2-expanded solution is depressurized through a one-way automatic valve
into a T mixer, to which a current of water is co-currently pumped with a certain flow
(F = 500 mL/min). The huge, rapid and homogeneous cooling due to CO2 venting during
depressurization extremely reduces the solubility of NP in acetonitrile, causing the nucle-
ation of the active, whose growth is partially quenched by the current of water leading to
the formation of a microsuspension.
Table 3.1 discloses the operational conditions of the conventional DELOS experiments
and the new DELOS-susp experiments.
In both DELOS-susp experiments, aqueous suspensions of NP were obtained for the
97

Chapter 3. DELOS-susp for the preparation of pharmaceutical suspensions
Table 3.1: DELOS-susp experiments designed based on DELOS experiments.
Experiment Ci *103a βib xW
c Yield (%)d Size distribution (µm)e
d(0.1) d(0.5) d(0.9)
DELOS 3 3.75 0.8 0.59 85 1.10 4.45 28.37
DELOS-susp 1 3.75 0.8 0.65 95 1.2 5.00 30.15
DELOS 6 4.69 1 0.4 66 1.16 3.10 14.90
DELOS-susp 2 4.65 1 0.45 92 1.1 3.80 19.65
All experiments were conducted at PW =10 MPa and TW = 313 K.a initial concentration of NP
in acetonitrile in mol/mol, bβi = Ci /CS ,c molar fraction of CO2, d yield expressed as % os mass
recovered.e Volumetric particle size distributions expressed in percentiles of 10, 50 and 90%.
first time. However, these suspensions were not stable and the solid settled down very
fast.
To delucidate if DELOS-susp yields smaller particles of NP than DELOS, both suspen-
sions were filtered under vacuum to characterize the solids recovered. The particles fil-
trated were dried under vacuum and measured by Light Scattering and SEM following the
procedures described in detail in Sections 6.4.1 and 6.4.2 of the Experimental Part respec-
tively. Figures 3.10 and 3.11 display each characterization.
Figure 3.10: Comparison of representative SEM pictures of the NP particles obtained
though DELOS (a, experiment 3) and after filtration of the suspensions obtained by DELOS-
susp: b) experiment 1 and c) experiment 2.
The SEM images of the solids obtained after filtration and drying of the NP suspen-
sions show us two types of particles homogeneously distributed. Both particles are needle-
98

3.3. Preparation of aqueous suspensions of the thiadiazoline derivative NP byDELOS-susp
Figure 3.11: Comparison of particle size distribution of the solids obtained by experiments
DELOS 3 and 6 to the solids obtained after filtration and drying under vacuum of the sus-
pensions produced by DELOS-susp.
like particles. There is a population of submicron particles very similar to the one ob-
served in DELOS experiments and another composed of larger needles with a equivalent
sphere diameter of 20 µm.
Light Scattering results present a difference in between the two samples obtained by
DELOS-susp. It can be clearly seen in Figure 3.11 that the solid produced in DELOS-susp
experiment 1 is composed of a broad but unimodal particle size distribution, whereas, the
solid obtained in DELOS-susp experiment 2 has a bimodal particle size distribution. The
second peak of the distribution presents an average size of 20µm. This second peak could
reflect a phenomena that occurs after depressurization and can be attributed to the dif-
ference in the DELOS yield of both DELOS-susp experiments. Experiment DELOS-susp 2
is conducted at the same experimental conditions that DELOS experiment 6, which yield
was 66%. Therefore, 34% of the initial NP does not precipitate by the large and abrupt de-
crease in temperature produced in DELOS and, as a consequence, remains in the mother
liquor (upper part of Figure 3.12). It can be assumed that the NP molecules that do not
precipitated due to the abrupt decrease in temperature, crystallized by anti-solvent pre-
cipitation when the active compound enters the water current. In experiment DELOS-
susp 1, which is performed as DELOS experiment 3 (yield 85%), this phenomenon takes
place in much lower magnitude as the amount of NP that stays in the mother liquor is
smaller as the DELOS precipitation yield obtained is higher. Hence, the resulting particle
size distribution is broad but unimodal.
As a mean to understand this difference in particle size distribution and to prove the
above mentioned hypothesis, a experiment were conducted which is schematized in Fig-
99

Chapter 3. DELOS-susp for the preparation of pharmaceutical suspensions
Figure 3.12: Two solutions with the amount of NP that does not precipitate in DELOS ex-
periment were prepared. Then, the same amount of water used in DELOS-susp (500 mL)
was added. NP precipitated by anti-solvent effect of water. The suspensions were filtered
and the solids were dried and weighted to assess the amount of NP that precipitate by anti-
solvent.
ure 3.12.
The amount of solid that does not precipitated by the large and abrupt decrease of
100

3.3. Preparation of aqueous suspensions of the thiadiazoline derivative NP byDELOS-susp
temperature was estimated based on the corresponding DELOS yields. Therefore, in ex-
periment DELOS 3, the DELOS yield is 85%, expressed as recovered mass in the filter in
relation to the initial mass of NP charged into the vessel. Hence, the difference is the
amount of NP that remains in the mother liquor: 15%. For experiment DELOS 6, this
amount is higher (34%) as the DELOS yield is lower (66%). As the initial amount of NP
dissolved in acetonitrile (Ci ) is known for both conditions, it is possible to estimate the
concentration of NP in the mother liquor. Two acetonitrile solutions with these concen-
trations of NP were prepared. And then, to reproduce what might occur in experiments
DELOS-sups 1 and 2, 500 mL of water was added to those solutions. In both cases, a
precipitate was observed because NP crystallized by anti-solvent precipitation. The new
suspensions obtained were filtered and dried to measure the amount of solid that crystal-
lize by the anti-solvent behavior of water. This simple test allows the quantification of the
antisolvent precipitation yield. The DELOS-susp yield is the sum of the DELOS yield plus
the anti-solvent yield. The values of the yields of the DELOS-susp experiments presented
in Table 3.1 are calculated following this procedure.
In experiment DELOS-susp 1, where most of the solid precipitated by the large, abrupt
and homogenous decrease in temperature, a unimodal particle size distribution was achieved
as can be checked in Figure 3.11. Hence, attending to these preliminary results, in order to
conduct a successful DELOS-susp experiment, the experimental conditions must ensure
the maximum DELOS yield possible. In light of this conclusion, for the preparation of
aqueous suspensions of APIs by DELOS-susp, the experimental conditions should guar-
antee the maximum DELOS yield to avoid at the highest extend the possibility of obtain-
ing anti-solvent precipitation of the drug when the depressurized solution is quenched by
the aqueous flow.
The comparison between particle size distribution of the DELOS experiment 3 and
DELOS-susp experiment 1 (Figure 3.11) reveals that, for the same experimental condi-
tions, DELOS-susp performs better in terms of particle size reduction, as a unimodal dis-
tribution is achieved. This could be explained considering that the addition of water at
the end of the depressurization could inhibit crystal growth of NP particles.
Considering these promising results, it was proposed to improve the stability of the
suspensions by the addition of surfactants that could avoid crystal growth and agglomer-
ation of the crystals in suspensions.
101

Chapter 3. DELOS-susp for the preparation of pharmaceutical suspensions
3.3.1 Preparation of aqueous suspensions of the thiadiazoline deriva-
tive NP using surfactants
In the course of the development of a stable micro- and submicrosuspension formulation
of NP, various surfactants were screened to achieve the desired particle size, with a narrow
distribution in size and to prevent agglomeration. The selection of surfactants and the
concentration used in each experiment was based on previous experience of Noscira or
based on information reported in the literature. However, as NP is a newly discovered
drug, there is no previous experimental data in the literature referring to the behavior of
this drug.
The surfactants selected were dissolved in the water phase over which was depres-
surized the CO2-expanded solution of NP, in accordance to the DELOS-susp protocol de-
scribed in Section 6.5.2 of the Experimental Part. The surfactants chosen are briefly de-
scribed below, including some specific properties such as molecular weight, molecular
structure and the hydrophile - lipophile balance, (HLB), which was previously described.
Description of the surfactant used
• Gelurice® 44/14: It is produced by the reaction of hydrogenated palm kernel oil
and polyethylene glycol, PEG 33. It contains PEG 33 esters (mainly PEG mono- and
dilaurate, i.e; esters of PEG with C12 chains either at one end only or at both ends),
glycerides (mainly mono-, di- and trilaurin, i.e. the triglyceride with C12 chains),
unreacted PEG 33, and a small amount of glycerol. Gelucire 44/14 possesses surfac-
tant properties [42, 43, 44]. [].
– Average Molecular weight = 300 -1500 g/mol
– HLB = 14
• Poloxamer F-127: Also known as Poloxamer 407, it belongs to the category of hy-
drophilic non-ionic surface active polyoxyethylene - polyoxypropylene - polyoxyethy-
lene block copolymers (Pluronics) [45, 45, 46].
– Average Molecular weight = 9840 -14600 g/mol
– HLB = 18
• Hydroxypropyl methylcellulose, HPMC: is a coating agent and film-former used
as an inactive ingredient in the pharmaceutical industry. It has also been used as
102

3.3. Preparation of aqueous suspensions of the thiadiazoline derivative NP byDELOS-susp
a rate-controlling polymer for sustained-release dose forms. Hypromellose is con-
sidered an inert ingredient. It has a high viscosity [47, 48, 49, 50].
– Average Molecular weight = 324.284 g/mol
– HLB = 10
• Polyvinylpyrrolidone (PVP): is a water-soluble polymer that results from the poly-
merization of vinylpyrrolidone. Different chain lengths yield in different viscosities.
It is one of the most interesting and versatile polymers used in the pharmaceutical
industry [51, 52].
– Average Molecular weight = 2500-2 500 000 g/mol
• Sodium dodecyl sulfate (SDS): It is also known as Sodium Lauryl Sulfate (SLS). It
is an anionic surfactant naturally derived from coconut and/or palm kernel oil. It
usually consists of a mixture of sodium alkyl sulfates, mainly the lauryl [53, 54, 55,
56].
– Average Molecular weight = 288.379 g/mol
– HLB = 40
• Polysorbate 80: Also known as Tween 80, is a common hydrophilic nonionic excip-
ient used in the pharmaceutical industry.
– Average Molecular weight = 1310 g/mol
– HLB = 15
103

Chapter 3. DELOS-susp for the preparation of pharmaceutical suspensions
Figure 3.13: Molecular structure of the surfactants employed: a) Polysorbate 80 , b) HPMC,
c) PVP, d) SDS and e) Poloxamer F-127. The molecular structure of Gelurice® 44/14 is not
reported.
Preparation of aqueous suspensions of the thiadiazoline derivative NP by DELOS-susp
in the presence of surfactants
Following the same DELOS-susp protocol described in Section 6.5.2 of the Experimen-
tal Part and the same equipment as in the preparation of suspensions of NP in the ab-
sence of surfactants (see Section 6.5.1 of the Experimental Part for more details), a new
set of experiments were designed to evaluate the effect of the addition of surfactants in
the aqueous phase over the structural characteristics of NP particles of the suspensions.
The unique difference introduced in the experimental protocol is that instead of pump-
ing pure water, an aqueous solution of the surfactant is used to quench the depressurized
104

3.3. Preparation of aqueous suspensions of the thiadiazoline derivative NP byDELOS-susp
solution (see Figure 3.14).
Figure 3.14: Addition of surfactant in the aqueous flow during depressurization.
The experiments designed to study the influence of the nature of the surfactant on
the stability and particle size reduction of NP crystals are displayed in Table 3.2 as well
as the reference DELOS-susp experiment without surfactant, experiment 1. This set of
experiments were performed at the same processing variables as the ones used in exper-
iment 1 as those ones ensure the maximum DELOS yield. The experimental conditions
are the following: temperature (TW = 313 K), pressure (PW = 10 MPa), CO2 content (xW =
0.65), water flow (F = 500 mL/min) and the initial concentration of NP in acetonitrile (Ci =
3.75*10−3 mol/mol). As mentioned before, the new variable introduced is the surfactant
employed.
In all the experiments, milky suspensions of NP were obtained, with a much higher
macroscopically stability than the suspensions prepared in the absence of surfactants (ex-
periment 1), as can be seen in Figure 3.15.
The stability of the aqueous suspensions of the thiadiazoline derivative NP obtained
105

Chapter 3. DELOS-susp for the preparation of pharmaceutical suspensions
Table 3.2: DELOS-susp experiments for evaluating the impact of the surfactant for the
preparation of NP aqueous suspensions.
Experiment Surfactant Surfactant/NP ratio (g:g)a
1 - -
3 Gelurice® 44/14 0.77:1
4 Poloxamer F-127 0.8:1
5 HPMC 0.8:1
6 PVP 1:1
7 SDS 0.8:1
8 Tween80 0.8:1
DELOS-susp experiments performed at TW = 313 K, PW =10 MPa, xW = 0.65 and
F =500 mL/min for testing the influence of various surfactants, a amount of
surfactant expressed as grams of surfactant per gram of NP.
Figure 3.15: Comparsion of the macroscopic appearance of two aqueous suspensions of
NP obtained through DELOS-susp in the absence of surfactant (experiment 1) and in the
presence of Poloxamer F-127 (experiment 4).
by DELOS-susp were optically monitored and particle size distribution of particles were
measured by Light Scattering. The results of both characterizations are displayed in Table
3.3. The macroscopic appearance of the suspensions of NP in the presence of Poloxamer
F-127, Gelurice® 44/14, HPMC and Tween80 are the same: they are stable and homoge-
nous milky aqueous suspensions. On the other hand, suspensions obtained with PVP
and SDS are not stable as NP particles tend to cream up. SDS is an ionic surfactant, which
exerts an electrostatic repulsion among particles. PVP is a nonionic surfactant but be-
106

3.3. Preparation of aqueous suspensions of the thiadiazoline derivative NP byDELOS-susp
Table 3.3: Comparison of particle size distribution results of the microsuspensions ob-
tained by DELOS-susp using different surfactants.
Experiment Surfactant Macroscopic stabilitya Size distribution (µm)b
d(0.1) d(0.5) d(0.9)
1 - 77 9.2 23.6 51.5
3 Gelurice® 44/14 3 3.3 9.4 23.0
4 Poloxamer F-127 3 0.6 1.6 5.5
5 HPMC 3 1.4 5.2 17.1
6 PVP 7 1.6 8.2 22.8
7 SDS 7 1.2 3.8 17.6
8 Tween80 3 0.9 2.4 8.0
aOptical monitored macroscopically stability, b Volumetric particle size distributions expressed
in percentiles of 10, 50 and 90% of NP suspensions after 10 min of US.
cause of their dipolar resonance form, it also shows some of the properties of zwitteri-
onics. Zwitterionic surfactants may present both positive and negative charges at their
surface [26]. The rest of the surfactants utilized are non-ionic polymers, which confer a
steric repulsion [3](Figure 3.16). In the case of stabilizing NP particles in aqueous sus-
pensions produced by DELOS-susp, non-ionic polymers are more suitable than the ionic
surfactant SDS and the polymer PVP, which shows some zwitterionic properties. SDS and
PVP, at the concentrations used (1:1 and 0.8:1 surfactant/NP (g:g) respectively) are not
acceptable for the preparation of stable aqueous suspensions of NP.
The mechanics of the surfactant-stabilized suspensions can be considered from the
perspective of potential energy. If particles approach each other too closely, they will ag-
glomerate. This must be prevented to ensure a stable system. Energetically, this requires
the placement of a sufficiently high energy barrier at relatively long separation distances
to prevent particles coming too close together. A non-ionic polymeric surfactant coats
the surface with a hydrophobic chain and permits a hydrophilic tail to project into the
water. This provides the necessary repulsive barrier between two neighboring particles.
In the case of the aqueous suspensions of NP, agglomeration of particles is prevented by
adding some non-ionic surfactants, whereas the addition of the ionic surfactant SDS or
the polymer PVP, which exhibits some properties of zwitterionics, makes NP particles to
107

Chapter 3. DELOS-susp for the preparation of pharmaceutical suspensions
Figure 3.16: Steric and electric stabilization. Adapted from [21].
flocculate and cream up.
Particle size and size distribution has been the key parameters used for evaluating the
physical stability of micro and submicrosuspensions of NP [21]. Microsuspensions of NP
were characterized by Laser Scattering following the experimental protocol explained in
Section ?? of the Experimental Part and the results obtained are disclosed in Table 3.3. The
Light Scattering protocol was exactly the same as the one used to characterized particle
size distribution of the the solids obtained by DELOS and the ones collected by filtration
of the suspensions obtained by DELOS-susp in the absence of surfactants.
For comparison purposes, the values of particle size distribution of the suspension ob-
tained without surfactant after 10 minutes in a sonication bath is included. Particle size
measurements reveal that all the surfactants screened affect crystal growth of NP as the
particles of the microsuspensions in the presence of surfactants are much smaller than
the one without surfactant. Particle size of NP particle is reduced more than a half in the
presence of any surfactant in comparison to the particles obtained in the absence of sur-
factant. Therefore, the use of surfactants is beneficial as all of them are able to reduce
NP crystal growth. The surfactants that perform better in terms of particle size reduction
are Tween 80 and Poloxamer F-127. Gelurice® 44/14, PVP, SDS and HMPC have approxi-
mately the same effect in crystal growth inhibition.
108

3.3. Preparation of aqueous suspensions of the thiadiazoline derivative NP byDELOS-susp
Although PVP and SDS are not able to stabilize the final microsuspensions at the same
degree as the rest of surfactants, they exert an efficient impact in crystal growth, as can be
checked by the small size of the particles obtained when these additives are used. Con-
versely, although the macroscopic appearance of the microsuspensions produced using
HMPC and Gelurice® 44/14 are similar to the ones of Poloxamer F-127 and Tween80, par-
ticle size of these suspensions are very different. NP particles produced in the presence of
HPMC and Gelurice® 44/14 are similar in size to the ones in the presence of SDS and PVP.
HPMC and Gelurice® 44/14 are able to stabilize the final NP microsuspensions although
their impact on particle size reduction is not relevant. The microsuspensions with the
smaller particle size and narrower distribution were obtained using Poloxamer F-127 and
surfactant Tween 80.
In order to elucidate which surfactant were the most appropriate for the production of
stable micro and submicron aqueous suspensions of NP, Laser Scattering measurements
of the as prepared microsuspensions in the presence of Tween80 and Poloxamer F-127
without sonicating the suspensions were performed and the results are disclosed in Table
3.4.
Table 3.4: Comparison of particle size distribution results of the microsuspensions ob-
tained by DELOS-susp using Tween80 and Poloxamer F-127 before and after 10 min in a
sonication bath.
Experiment-Surfactant Size distribution (µm) a UIb Size distribution (µm) UI
0 min 10 min
d(0.1) d(0.5) d(0.9) d(0.1) d(0.5) d(0.9)
4-Poloxamer F-127 0.8 2.7 9.3 8.6 0.6 1.6 5.5 10.9
8-Tween80 4.8 21.3 81.0 5.92 0.9 2.4 8.0 11.25
a Volumetric particle size distributions expressed in percentiles of 10, 50 and 90% of NP
suspensions without US and after 10 min of US and b Uniformity index is defined as d(10)/d(90)*100
The results displayed in Table 3.4 compare particle size distribution and how uniform
is that distribution for the suspensions obtained in the presence of Poloxamer F-127 and
Tween80 before and after being sonicated. As can be ascertained, the sonicated suspen-
sions are ver similar between them as reflected by the Uniformity Index. However, the
as prepared suspension in the presence of Tween 80 presents a larger particle size and a
109

Chapter 3. DELOS-susp for the preparation of pharmaceutical suspensions
wider distribution. The as prepared suspension obtained when using Poloxamer F-127
has a smaller and more homogenous particle size distribution. These last measurements
confirm that the most appropriate surfactant for obtaining stable microsuspensions of
NP is Poloxamer F-127.
The morphological characterization of the particles of the microsuspensions were
performed by Scanning Electron Microscopy following the experimental protocol described
in Section ?? of the Experimental Part and the micrographs are displayed in Figure 3.17.
In all the pictures micro- and submicronparticles of needle-like shape are distinguished.
The difference in between the solids relies on the proportion between submicron parti-
cles against the larger particles (15-25µm). Despite the nature of the surfactant employed,
all NP particles precipitated as needle-like crystals. If the morphology of the particles re-
mains the same and only a growth inhibition is observed, this means that the surfactant
adsorption is similar on all the faces of the crystal [57].
Figure 3.17: SEM images showing the influence of the surfactant employed: a) Gelurice®
44/14, b) Poloxamer F-127, c) HMPC, d) Tween80, e) SDS and f) PVP.
The mechanism of growth inhibition by polymers appears to be poorly understood.
Although there are several reports in the literature on the inhibition of crystallization by
110

3.3. Preparation of aqueous suspensions of the thiadiazoline derivative NP byDELOS-susp
polymers, the mechanism is rarely discussed [57]. It is claimed that the role of stabi-
lizer at the molecular level is an often overlooked aspect to the creation of pharmaceu-
tical suspensions [58] and there is a lack of understanding their mechanism of action
[59, 60, 61, 30]. This fact hinders the selection of a suitable stabilizer and makes this
step pretty challenging. The challenge stems mainly from two aspects: (i) lack of fun-
damental understanding of interactions within suspensions and (ii) lack of an efficient
and high throughput stabilizer screening technique. Selecting the anchor groups that in-
teract strongly with the drug surface can be challenging due to the limited understanding
of interactions between particles and stabilizers at molecular level. The current practice
for stabilizer screening involves trial production of suspensions with different stabilizers,
which could be burdensome and require vast amount of efforts especially with a large
number of potential stabilizer candidates [21].
Influence of mixing surfactants.
Mixing a polymeric and an ionic surfactant could complement each other and enables
combining electrostatic and steric mechanisms [3]. To test if it was possible to obtain a
synergetic enhancement in the physico-chemical properties of NP microsuspensions, a
experiment was designed mixing different types of surfactants (Table 3.5): the ionic sur-
factant SDS was mixed with the polymeric surfactant Poloxamer F-127, as this one was
the one which performed better in terms of particle size reduction.
Table 3.5: DELOS-susp experiment for evaluating the effect of mixing surfactants
Experiment Mix of surfactants Surfactant/NP ratio (g:g)a
9 SDS+Poloxamer F-127 0.8/0.8:1
DELOS-susp experiments performed at TW = 313 K, PW = 10MPa, xW = 0.65 and
F = 500mL/min, a amount of surfactant expressed as grams of surfactant per gram of NP.
A stable milky microsuspension of NP was obtained, hence the addition of Poloxamer
F-127 to SDS cancels the flocculation effect that SDS alone provokes in NP microemul-
sions. Particle size measurements of the microsuspensions as prepared and sonicated 10
min in an ultrasound bath are disclosed in Table 3.6.
The effect of mixing SDS+Poloxamer F-127 enhances the properties of NP microsus-
pensions in terms of particle size and particle size distribution with respect to the use
111

Chapter 3. DELOS-susp for the preparation of pharmaceutical suspensions
Table 3.6: Particle size distribution of the microsuspensions obtained in the DELOS-susp
experiments for evaluating the effect of mixing surfactants before and after 10 min in a son-
ication bath.
Experiment Surfactant 0 min (µm)a 10 min (µm)b
d(0.1) d(0.5) d(0.9) d(0.1) d(0.5) d(0.9)
9 SDS+Poloxamer F-127 1.2 4.0 13.9 1.0 2.5 8.4
4 Poloxamer F-127 0.8 2.7 9.3 0.6 1.6 5.5
a Volumetric particle size distributions expressed in percentiles of 10, 50 and 90% of NP suspensions
before and after 10 min in a sonication bath.
of SDS alone but Poloxamer F-127 still yields the best results in terms of particle size re-
duction. In many cases a combination of stabilizers is more beneficial [62], but there are
other studies that demonstrated that a combination of ionic and non-ionic stabilizers is
not always advantageous to enhance the properties of suspensions [63].
Once the screening of surfactants has been conducted and based on the promising
results obtained preparing microsuspensions of NP using Poloxamer F-127, the following
section of the chapter is devoted to the optimize the conditions of the experiments using
this surfactant and to a more compendious characterization of the microsuspensions.
3.3.2 Influence of process variables on NP microsuspensions.
In this section, the influence of different process variables on the final characteristics of
NP microsuspensions prepared by DELOS-susp using Poloxamer F-127 is studied. Parti-
cle size, morphology and stability were selected as the most important physicochemical
parameters of NP microsuspensions.
Influence of the amount of water
All the previous experiments were conducted pumping the same amount of water co-
currently with the expansion of the compressed solution. A small tests was performed to
elucidate what happened if the amount of water was increase almost double (Table 3.7).
The comparison of particle size distribution of the microsuspensions obtained from
experiments using Vaq = 500mL (experiment 4) and Vaq = 900mL (experiment 10) as pre-
112

3.3. Preparation of aqueous suspensions of the thiadiazoline derivative NP byDELOS-susp
Table 3.7: DELOS-susp experiments for evaluating the effect of the amount of water.
Experiment Amount of water (mL)
4 500
10 900
DELOS-susp experiments performed at TW = 313 K,
PW =10 MPa, xW = 0.65 and F = 500 mL/min for testing
the influence of the water flow.
pared are depicted in Figure 3.18.
Figure 3.18: Influence of the water flow in the particle size distribution of the suspensions
as prepared.
It can be ascertained from particle size distribution results (Figure 3.18) that the in-
fluence of increasing the amount of water does not have any impact on particle size dis-
tribution. What it is relevant for a successful precipitation by DELOS-susp is that water
is co-currently being pump when the depressurization starts, so the solution of the com-
pound is always quenched by the current of water.
The fact that the amount of water do not have any influence on particle size is a highly
beneficial aspect as allows to change the concentration of the drug in the final micro-
suspensions keeping constant the particle size of the compound. Another important ad-
vantage of DELOS-susp in relation to other supercritical fluid based technologies such as
RESOLV or RESAS, is that suspensions can be more loaded as the amount of the drug to
precipitate does not depend on the solubility of such compound in CO2, but in the solu-
bility of the CO2-expanded mixture, which is usually much higher.
113

Chapter 3. DELOS-susp for the preparation of pharmaceutical suspensions
Hence, the following experiments were conducted using Vaq = 500 mL of water and
a constant flow of F = 500 mL/min, as in this way the microsuspensions will be more
concentrated.
Influence of Poloxamer F-127 concentration and point of addition
Once the appropriate amount of water was defined, a set of experiments (Table 3.8) was
designed to evaluate the effect of surfactant concentration utilized as well as the location
of the surfactant. Poloxamer F-127 can be dissolved in the solution of NP in acetonitrile
or can be placed in the current of water (see Figure 3.19). Experiments 1 and 4 are also
presented for comparison purposes.
Figure 3.19: Possible location of Poloxamer F-127 :organic phase or aqueous phase.
The focus of suspension characterization was on particle size, morphology and sta-
bility. Tendency of NP particles to agglomerate has been evaluated by measuring parti-
cle size distribution before and after being sonicated and establishing a relation between
uniformity index as prepared (U .I 0) and uniformity index after being sonicated 10 min
114

3.3. Preparation of aqueous suspensions of the thiadiazoline derivative NP byDELOS-susp
Table 3.8: DELOS-susp experiments for evaluating the effect of the amount and the location
of Poloxamer F-127
Experiment Amount of surfactant (g Polox:g NP) Location of Poloxamer F-127
Organic phase Aqueous phase
1 0:1 - -
4 0.8:1 - x
11 0.08:1 - x
12 0.15:1 x x
13 0.8:1 x -
14 1.6:1 x x
15 1.6:1 - x
DELOS-susp experiments performed at TW = 313 K, PW = 10 MPa, xW = 0.65 and F = 500 mL/min for testing
the influence of the amount and location of Poloxamer F-127.
(U .I 10). This new parameter has been defined as Agreggation Tendency (AT ):
AT = U .I 0
U .I 10. (3.6)
If particles tend to agglomerate, (U .I 0) and (U .I 10) will differ among them as the sonica-
tion bath will break the agglomerates. On the contrary, if particles do not agglomerate,
the effect of the sonication bath will not be relevant and these two values will be similar.
In all the experiments presented in Table 3.8 milky homogenous and macroscopically
stable aqueous suspensions of NP were produced.
Particle size of the suspensions were measured as prepared and after 10min in a soni-
cation bath for comparison purposes with previous measurements and in order to calcu-
late AT. The results obtained are disclosed in Table 3.9.
From the values presented in Table 3.9 some conclusions can be withdrawn: compar-
ing experiment 1 and 11, it is inferred how a small addition of Poloxamer F-127 exerts
a great impact on the macroscopic appearance of the suspensions and on particle size.
Attending to the particle size distribution values of the suspensions without sonication,
an increase in surfactant concentration is translated into a decrease of particle size. Nev-
ertheless, there is a limit concentration and above that limit, 0.8:1 g Polx/NP, there is no
more reduction in particle size. This result is highly relevant as the best relationship be-
tween the Poloxamer F-127 and NP has been found, and with this amount of surfactant
115

Chapter 3. DELOS-susp for the preparation of pharmaceutical suspensions
Table 3.9: Particle size measurements of NP suspensions prepared by DELOS-susp to eval-
uate the concentration and location of Poloxamer F-127.
Experiment 0 min (µm)a U .I 0b 10 min (µm)c U .I 10
d ATe
d(0.1) d(0.5) d(0.9) d(0.1) d(0.5) d(0.9)
- - - 9.2 23.6 51.1 18.00
4 0.82 2.8 9.4 8.72 0.6 1.6 5.5 10.91 0.79
11 1.1 4.3 20.8 5.29 0.7 2.3 8.3 8.43 0.62
12 1.1 4.4 25.5 4.31 0.9 2.4 8.3 10.84 0.39
13 1.2 3.6 11.5 10.43 1.1 2.7 7.6 14.47 0.72
14 1.2 3.8 13.8 8.70 1.1 2.6 8.6 12.79 0.67
15 1.3 3.8 13.1 9.92 1.1 2.8 10.0 11.00 0.90
aVolumetric particle size distributions expressed in percentiles of 10, 50 and 90% of NP suspensions without
ultrasound and c after 10 min of US,b d Uniformity index is defined as d(10)/d(90)*100 and e Aggregation
Tendency is calculated as U .I 0/U .I 10.
is possible to obtain stable NP suspensions where particles are not aggregated. The exis-
tence of a maximum value of surfactant concentration from which particle size no longer
changed with increasing surfactant concentration has already been observed [64].
Particle size distributions of the suspensions sonicated 10 min present values more
similar between them. This means that when the agglomerates are broken, values of
particle size of NP particles are closer to each other hence, growth inhibition is achieved
with the smallest concentration of Poloxamer F-127, 0.08:1 g Polx/NP and the rest of the
amount of Poloxamer F-127 avoids agglomeration of NP particles.
Uniformity Index reflects that the more homogeneous particle size distribution is ob-
tained in experiment 13 as is in this experiments where U .I presents the highest value.
Uniformity index also reveals that after sonication, particle size distributions are more
similar among them as U .I values are closer to each other. As mentioned before, the
higher the tendency of NP particles to agglomerate, the bigger the different between par-
ticle size distribution before and after the sonication bath, therefore, AT value will be
smaller. If the tendency of NP particles to agglomerate is not very relevant, the effect of
applying ultrasounds will not exert a strong impact on particle size distribution, there-
fore UI before and after ultrasounds should be similar among them, hence, AT will have
116

3.3. Preparation of aqueous suspensions of the thiadiazoline derivative NP byDELOS-susp
a value closer to 1. When the concentration of Poloxamer is 0.8:1 g Polx/NP the tendency
of the particles to aggregate is smaller as when using ten time less concentration and this
is reflected by a higher AT value.
Particle size distribution of the suspension in the presence of 0.08:1 g Polx/g NP after
10 min in a sonication bath is the same as the one of the suspension obtained using 0.8:1
g Polx/g NP as prepared. This means that the dispersion effect achieved after 10 min of a
sonication bath is the same as the one obtained by adding tenfold amount of surfactant.
Table 3.9 highlights that the location of the surfactant does not affect the final proper-
ties of the microsuspensions as there is no important difference in particle size distribu-
tion. Based on this, in the upcoming experiments, the surfactant was always dissolved in
the aqueous phase.
The concentration of the surfactant has proven to be one of the key parameters in
stabilization and particle formation. The optimum concentration has been found, which
is 0.8:1 g Polx/g NP, a higher concentration will not be translated into a smaller particle
size. The growth inhibition is achieved using a lower concentration, 0.08:1 g Polx/g NP.
However, with this amount of Poloxamer F-127, aggregation of NP particles is not avoided
and the application of ultrasounds is required to achieve the same particle size as when
using ten fold concentration of Poloxamer F-127.
3.3.3 Elimination of acetonitrile from NP microsuspensions: Filtration
As produced, suspensions contain acetonitrile (max. 20% vol.) that comes from the de-
pressurization of the CO2-expanded organic solution of NP into the aqueous phase dur-
ing the DELOS-susp process. This excess of organic solvent needs to be reduced under
400 ppm, which is the maximum concentration of acetonitrile allowed by the European
Pharmacopeia for acetonitrile as it belongs to Class II of organic solvents.
An easy way to remove the excess of acetonitrile is by vacuum filtration of NP micro-
suspensions. The filtration was carried out following the experimental protocol described
in Section 6.8.1 of the Experimental Part. In order to measure particle size distribution
by Light Scattering it is required to form a stable suspension. The solids filtrated are re-
suspended in pure water, however in order to form a stable suspension, the sample was
sonicated in a bath during 10min, as Figure 3.20 depicts.
Table 3.10 displays particle size measurements of the solids obtained after filtration
and drying of NP microsuspensions re-suspended in water and sonicated 10 min. Fil-
117

Chapter 3. DELOS-susp for the preparation of pharmaceutical suspensions
Figure 3.20: Removal of the excess of acetonitrile from NP microsuspensions by filtration.
The application of 10 min of US are required to re-dispersed NP micro particles in pure
water.
tration of the suspensions entails aggregation of particles and therefore in order to mea-
sure stable milky suspensions, it was required to apply ultrasounds. It can be ascertained
comparing the size of the solids obtained from experiments 4 and 11 that the reduction in
size observed in the microsuspensions when adding tenfold more surfactant is lost when
samples are filtrated due to this agglomeration phenomena. Therefore, if the suspension
is going to be filtrated and the preferable form of the drug is as dried powder, with a small
quantity of surfactant (0.08:1 g Polx/g NP) is enough to stop crystal growth of NP crys-
tals as the excess of Poloxamer is just essential for stabilizing the microsuspension and
prevent particle agglomeration.
Depending on the final application, DELOS-sups method is a suitable platform for
the preparation of stable aqueous suspensions of NP or dry powders of NP microparti-
cles, that can be easily re-suspended in water after 10 min in a sonication bath. Generally,
118

3.3. Preparation of aqueous suspensions of the thiadiazoline derivative NP byDELOS-susp
Table 3.10: Particle size measurements of NP particles obtained after filtration and drying
of the suspensions, resuspended in water and ultrasonicated for 10 min.
Experiment Amount of surfactant (g Polox:g NP) Particle size distribution (µm)a
d(0.1) d(0.5) d(0.9)
1 - 1.1 3.8 18.9
4 0.8:1 0.4 1.4 5.7
11 0.08:1 0.8 2.1 8.7
12 0.15:1 1.1 3.3 19.6
13 0.8:1 1.1 2.8 10.7
14 1.6:1 1.2 3.3 13.5
15 1.6:1 1.1 2.4 7.1
aVolumetric particle size distributions expressed in percentiles of 10, 50 and 90% of NP suspensions
after 10 min of US
it is better to transport and storage drugs as powders than as suspensions. If, on the other
hand, the final form preferable is in the form of aqueous suspensions of dispersed mi-
croparticles, a method to eliminate the organic solvent that do not alter the properties of
the particles will be presented in future sections.
The fact that dispersions of microparticles can be post processed as a dry powder
for solid dosage is a very interesting property for injectable products. These dried pow-
ders are designed to re-disperse into microparticles when placed in water or an alter-
nate water-based environment. The ability of the dried powder to re-disperse into a non-
aggregated microparticulate dispersions is critical to the development of a solid dosage
form that maintains the benefits of this enabling delivery technology [5].
Based on this observation, there are two experimental conditions of interest: for ap-
plications where dried solids are preferred, experiment with the small amount of Polox-
amer (experiment 11), and when suspensions are the chosen option, the experiment with
tenfold more concentration of surfactant (experiment 4). Hence, the following character-
ization has been carried out for the suspensions obtained in those experiments.
119

Chapter 3. DELOS-susp for the preparation of pharmaceutical suspensions
3.3.4 Comprehensive characterization of NP microsuspensions
The following section endeavors to a more detailed characterization of NP microsuspen-
sions regarding stability and reproducibility. In addition, two different methods for the
elimination of acetonitrile has been developed for suspensions with the minimum amount
of surfactant, 0.08 g Polx/NP (experiment 11) and for the tenfold Poloxamer F-127 concen-
tration, 0.8 g Polx/NP (experiment 4).
Reproducibility of DELOS-susp method for the preparation of stable NP suspensions
One of the first thing to evaluate was the reproducibility of DELOS-susp for preparing
stable suspensions of NP with the aid of Poloxamer F-127. Figure 3.21 depicts the super-
position of particle size distribution of the suspensions and the solids obtained by filtra-
tion after performing twice experiments 4 and 11. The results reveal the robustness of the
DELOS-susp method as solids and suspensions with the same particle size distribution
are achieved.
Figure 3.21: Reproducibility of DELOS-susp for the preparation of stable NP suspensions
(a) and dried solid powders (b).
120

3.3. Preparation of aqueous suspensions of the thiadiazoline derivative NP byDELOS-susp
Role of the surfactant
In addition, as a mean to gain more knowledge of the effect of the addition of Poloxamer
F-127 in the final properties of microsuspensions, a small test were further conducted.
The solid obtained after filtration and drying of the suspension obtained by DELOS-susp
without surfactant (experiment 1) were re-suspended in a solution of water with the same
concentration of Poloxamer F-127 as the ones used in the DELOS-susp experiments in the
presence of surfactants (Table 3.6). These new suspensions of NP were characterized by
Laser Scattering and the values are displayed in Table 3.11.
Table 3.11: Particle size measurement of the solid obtained after filtration and drying of the
suspension 1 and re-suspended in a solution of Poloxamer F-127 and water after 10 min of
US.
Amount of surfactant (g Polx: g NP) 10 min (µm)a
d(0.1) d(0.5) d(0.9)
0.08:1 1.6 7.8 31.3
0.8:1 1.3 4.8 18.7
1.6:1 1.4 5.0 17.4
aVolumetric particle size distributions expressed in percentiles of 10, 50
and 90% of NP suspensions after 10 min of US
Particle size of the solid re-suspended in a solution of the polymer in water are much
higher than when the polymer is added during depressurization. These results high-
light that the Poloxamer F-127 confers immediate protection and is more effective when
present at the time of creation of the new, fresh surface than if added afterwards [3].
Stability of suspensions
Stability is one of the critical aspects in ensuring safety and efficacy of drug products.
Therefore, stability issues associated with drug suspensions deserve significant attention
during pharmaceutical product development [21]. For pharmaceutical use, a suspension
must have a minimal tendency to agglomerate, which could lead to the formation of a
hard cake. The traditional method to evaluate sedimentation or creaming is by visual ob-
servation over a period of time [21]. Hence, suspensions were optical monitored during
121

Chapter 3. DELOS-susp for the preparation of pharmaceutical suspensions
2 days after their preparation. During this time, it was observed how NP particles settle
down. However, particles are completely re-disperse into the suspension just by shak-
ing manually. A suspension with slow sedimentation rate is acceptable, perhaps even
preferable, provided the product is re-suspendable and homogeneous [3]. Apart from
this optical monitoring, the dispersion rate of the particles from suspensions 4 and 11
was assessed using an equipment called Turbiscan and following the experimental proto-
col explained in Section 6.6.2 of the Experimental Part. Turbiscan is used to characterize
the dispersion state of emulsions, suspensions, foams, etc. Changes in terms of size and
concentration (such as creaming, sedimentation, flocculation or coalescence) are directly
monitored. This technique consists in sending photons (light) into the sample. These
photons, after being scattered many times by objects in suspension (droplets, solid par-
ticles, gas bubbles, ...) emerge from the sample and are detected by the measurement
device of the Turbiscan. A mobile reading head, composed of a NIR diode and two detec-
tors (transmission for transparent phases and backscattering for cloudy phases), scans a
glass cell containing the sample. The measurement enables the quantification of several
parameters linked to particles average diameter and volume fraction. The rate of sedi-
mentation of a suspended phase depends on several factors which need to be controlled.
Assuming that all dispersed particles are uniform in shape and size and that the parti-
cles are sufficiently far apart so that the movement of one does not affect the neighboring
particles, the rate of sedimentation can be estimated by Stokes’ equation [65]:
V = d 2 ∗ (ρ1 −ρ2)∗ g
18∗η0, (3.7)
where V is the sedimentation rate, d the diameter of the suspended particles, ρ1 the par-
ticles’ density, ρ1 is the density of the medium, g is the acceleration of gravity, and η0 is
the viscosity of the external phase. Although the Stokes’ equation does not consider all
the variables which affect the stability of a suspension, it gives an approximation of the
settling rate and an appreciation of the variables governing the sedimentation process.
For example, by reducing the particle size or by increasing the viscosity and density of the
external phase, the rate of sedimentation can be retarded.
The Turbiscan software enables to calculate the sedimentation rate and it also gives a
parameter called Turbiscan Stability Index (TSI) that permits to compare different sam-
ples. The smaller the TSI, the more stable the suspension is. Table 3.12 provides the TSI
and the sedimentation rate for suspensions 4 and 11. TSI parameter allows a quantita-
tive comparison of the stability of both samples and, as expected, the sample with the
122
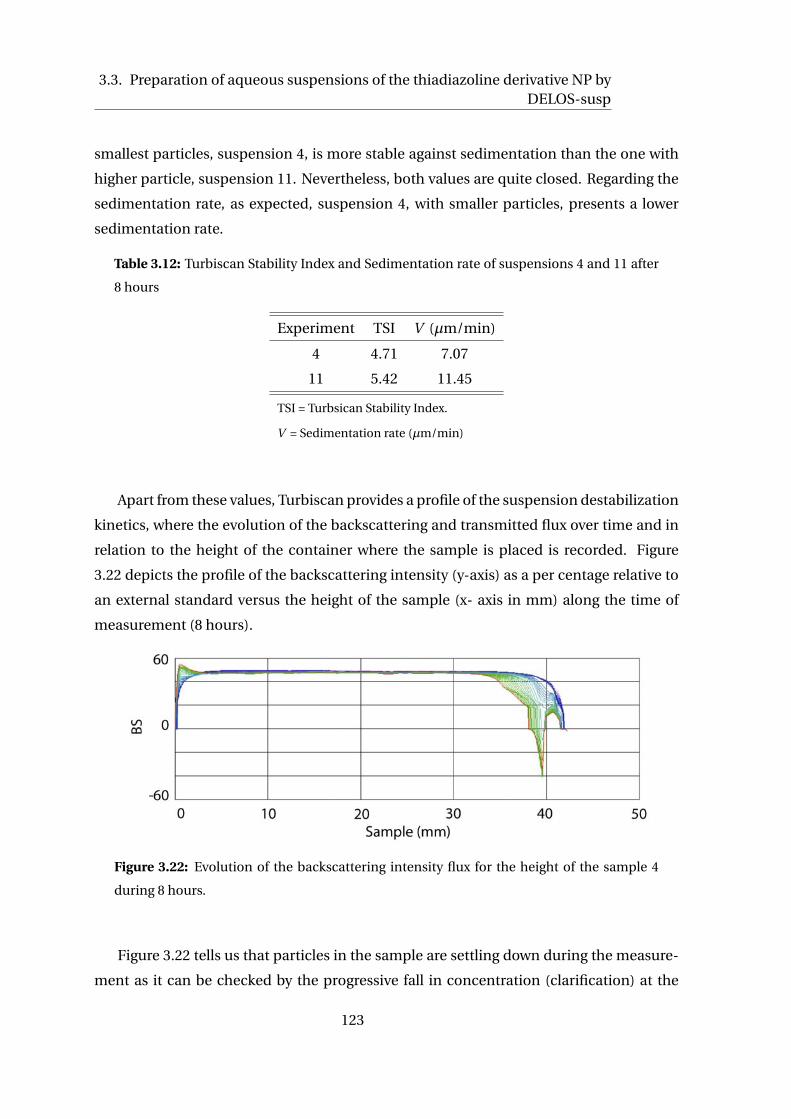
3.3. Preparation of aqueous suspensions of the thiadiazoline derivative NP byDELOS-susp
smallest particles, suspension 4, is more stable against sedimentation than the one with
higher particle, suspension 11. Nevertheless, both values are quite closed. Regarding the
sedimentation rate, as expected, suspension 4, with smaller particles, presents a lower
sedimentation rate.
Table 3.12: Turbiscan Stability Index and Sedimentation rate of suspensions 4 and 11 after
8 hours
Experiment TSI V (µm/min)
4 4.71 7.07
11 5.42 11.45
TSI = Turbsican Stability Index.
V = Sedimentation rate (µm/min)
Apart from these values, Turbiscan provides a profile of the suspension destabilization
kinetics, where the evolution of the backscattering and transmitted flux over time and in
relation to the height of the container where the sample is placed is recorded. Figure
3.22 depicts the profile of the backscattering intensity (y-axis) as a per centage relative to
an external standard versus the height of the sample (x- axis in mm) along the time of
measurement (8 hours).
Figure 3.22: Evolution of the backscattering intensity flux for the height of the sample 4
during 8 hours.
Figure 3.22 tells us that particles in the sample are settling down during the measure-
ment as it can be checked by the progressive fall in concentration (clarification) at the
123

Chapter 3. DELOS-susp for the preparation of pharmaceutical suspensions
sample top (around 40 mm). A fall in backscattering intensity means a decrease in con-
centration. Conversely, at the bottom of the sample, an increase in concentration is ob-
served as the backscattering intensity increases with time. Figure 3.22 also reveals that
particle size does not change during the measurement time as the backscattering inten-
sity at the center area of the sample does not change. If particles tend to agglomerate
during the measurement, a decrease in the backscattering will be recorded [66].
Apart from the stability against sedimentation and the confirmation that particles do
not change during Turbiscan measurements (8 hours), the stability of the suspensions
with time has been assessed. Particle size of the suspensions 4 and 11 was measured after
one week, two weeks, one month and two months and the values of the distributions as
prepared and after 2 months are compared in Table 3.13. From theses results, it can be
inferred the high physical long-term stability with respect to particle size changes of the
suspensions of NP prepared by DELOS-susp.
Table 3.13: Comparison of particle size measurements of the suspensions as prepared and
after two months.
Experiment As prepared (µm)a After 2 months (µm)b
d(0.1) d(0.5) d(0.9) d(0.1) d(0.5) d(0.9)
4 0.8 2.7 9.4 0.7 2.0 7.2
11 1.1 4.3 20.8 1.0 4.1 17.9
aVolumetric particle size distributions expressed in percentiles of 10, 50
and 90% of NP suspensions as prepared and b after 2 months.
This can be a consequence of the narrow size particle distribution. If particle size is
uniform, there is no driving force for the well-known Ostwald ripening effect to occur
(Figure 3.23). Ostwald ripening has been described for highly dispersed systems, which
means a reduction in size of the finest particle fraction and their final disappearance com-
bined with a simultaneously growth of larger particles. Reasons for the Ostwald ripening
are the different saturation solubilities in the vicinity of different sized particles and the
concentration gradient existing between them [21]. Moreover, this result also highlights
the effect of the addition of the Poloxamer F-127 as the surfactant adhered to particles
surfaces reduces the mass-transfer coefficient and hence, the ripening effect is also de-
creased.
124

3.3. Preparation of aqueous suspensions of the thiadiazoline derivative NP byDELOS-susp
Figure 3.23: Schematic illustration of Ostwald ripening.
In addition, particulate samples of the microsuspensions prepared by DELOS-susp
were highly crystalline and kept the same crystalline structure as in the raw material as
can be checked in Figure 3.24. A highly crystalline powder compares favorably in terms of
the physical stability, with the amorphous materials often obtained by milling.
0
500
1000
1500
2000
2500
3000
3500
0 10 20 30 40
Co
un
ts
2θ
solid susp 4
Raw NP
Figure 3.24: Comparison of the X-ray powder Difraction spectra of the raw NP and the pro-
cessed by DELOS-susp, experiment 4.
125

Chapter 3. DELOS-susp for the preparation of pharmaceutical suspensions
3.3.5 In vivo experiments
The suspension free of acetonitrile obtained after filtration of NP suspension prepared
with a concentration of 0.08 g Polox./ 1 g NP and re-suspended in water was used for an
in vivo assay. Several suspensions of the thiadiazoline derivative NP in water prepared
by different techniques were injected to monkeys, and the results were highly encourag-
ing as the formulation prepared by DELOS-susps was the ones that yielded the highest
dissolution velocity.
3.3.6 Acetonitrile elimination and quantification
The good results obtained in vivo encouraged us to investigate a different way to elimi-
nate the acetonitrile from the suspensions obtained by DELOS-susp. Since filtering the
suspensions promotes particle agglomeration, a different strategy like diafiltration and
lyophilisation has been evaluated as depicted in Figure 3.25. Diafiltration should be ap-
plied in cases when liquid suspensions of NP are the preferable option. Lyophilisation
and filtration, on the other hand, remove all the solvent and therefore, these techniques
should be applied when solid particles are required. In the following, diafiltration and
lyophilisation techniques are described and the final characteristics of free acetonitrile
suspensions and dried solids are presented. The removal of acetonitrile by filtration and
the characterization of the obtained dried particles and the free acetonitrile suspensions
are already described in Section 6.8.1 of this Chapter.
Table 3.14 compares the efficacy of each technique in terms of removal of acetonitrile
from suspensions, measured by Headspace-gas chromatography-flame ionization detec-
tion (HS-GC-FID) in collaboration with "Servei D’Anàlisi Química" of UAB. In the case of
lyophilisation and filtration, the solids were re-suspended in water and a free acetonitrile
suspensions of NP were obtained. These new suspensions were the ones measured.
Lyophilisation is the technique that yields better results regarding the elimination of
acetonitrile from aqueous suspensions, nevertheless, the three methodologies applied re-
move successfully the excess of organic solvents according to the limits permitted by the
European Pharmacopeia for acetonitrile as it belongs to Class II of organic solvents (400
ppm).
In addition, in order to assess the goodness of each technique, a more comprehensive
characterization of the suspensions and the solids obtained after diafiltration and lyofil-
ization respectively has been carried out.
126

3.3. Preparation of aqueous suspensions of the thiadiazoline derivative NP byDELOS-susp
Figure 3.25: Different methods studied for acetonitrile removal.
Table 3.14: Acetonitrile content of NP suspensions obtained as prepared and after diafiltra-
tion, lyophilisation and filtration.
Experiment (gPolx: gNP) As prepared Filtration Diafiltration Lyophilisation
(ppm) (ppm) (ppm) (ppm)
4 0.8:1 »410 <10 25 <1
11 0.08:1 »410 <10 170 <1
Diafiltration
This methodology allows to change the dispersing medium of particles without chang-
ing their concentration during the process: acetonitrile/water dispersing medium was
substituted by pure water, removing as a result the undesired acetonitrile from the for-
mulation. Samples were pumped through a filtering column (for more details see Sec-
tion 6.8.2 of the Experimental Part), that allowed acetonitrile and water molecules to pass
127

Chapter 3. DELOS-susp for the preparation of pharmaceutical suspensions
through while retaining NP particles. At the same time, pure water was introduced into
the system in order not to concentrate the sample and replace the dispersing medium
by water. The membrane of the column differentiate components based on size. Compo-
nents larger than the membrane pore are quantitatively held back by the membrane while
smaller components pass through the membrane structure along with the permeate. It is
a continuous diafiltration in an airtight system and it is a self-regulating and constant flow
process. The hollow fiber membrane and cross-flow filtration system provide faster and
gentler separation that helps avoid membrane fouling and maximizes product recovery
(see Figure 3.26)
Figure 3.26: Schematic of hollow fiber membrane showing tangential cross flow diafiltra-
tion.
An aliquot of 10 mL of each suspensions was diafiltered. In order to successful remove
acetonitrile, 6 diafiltration cycles (1 hour) are required. Samples were used without fur-
ther modification. From sizes shown in Table 3.15, it is extracted that this process does
not alter the characteristics of the original suspension and promotes mild conditions for
the elimination of the organic solvent. As samples were diafiltered one month after its
preparation, the comparison has done with the distribution measured after one month.
In this case, the preparation of suspensions with a molar relation of 0.8:1 g Polx./g NP is
preferable as it makes a difference since allows the achievement of desired particle sizes
without using sonication. Diafiltration does not modify neither the particle size distribu-
tion neither the morphology of NP particles as Figure 3.27 depicts.
128

3.3. Preparation of aqueous suspensions of the thiadiazoline derivative NP byDELOS-susp
Table 3.15: Comparison of particle size distribution of NP suspensions after a month and
after diafiltration.
Experiment (g Polx: g NP) US mina After one month(µm)b After diafiltration(µm)c
d(0.1) d(0.5) d(0.9) d(0.1) d(0.5) d(0.9)
4 0.8:1 0 0.8 2.9 10.8 0.8 2.9 10.7
4 0.8:1 10 0.5 1.2 4.2 0.6 1.6 5.5
11 0.08:1 0 1.1 4.1 16.9 1.1 4.0 15.5
11 0.08:1 10 0.7 1.2 7.1 0.8 2.3 7.6
a minutes of ultrasounds, aVolumetric particle size distributions expressed in percentiles of 10, 50 and
90 after one month and bafter diafiltration.
Figure 3.27: SEM micrographs of free acetonitrile suspension 4 after diafiltration (a) and
before (b).
The stability of the free-acetonitrile suspensions were checked after one month of
storage and particle size remains constant. Therefore, it can be concluded that diafiltra-
tion is a very suitable technique to remove the excess of acetonitrile from the suspensions
prepared by DELOS-susp.
129

Chapter 3. DELOS-susp for the preparation of pharmaceutical suspensions
Lyophilisation
Lyophilisation or freeze-drying is often the preferred method of sample drying because
a high level of dryness is achieved with low residual solvent levels. In addition, it allows
to convert solutions or suspensions into solids of sufficient stability for distribution and
storage. It is a process that consists of removing water from a frozen sample by subli-
mation and desorption under vacuum. A typical freeze-drying process consists of three
stages; that is, freezing, primary drying, and secondary drying. Freezing is an efficient
dessication step where most of the solvent, typically water, is separated from the solutes
to form ice. Primary drying, or ice sublimation, begins whenever the chamber pressure
is reduced and the shelf temperature is raised to supply the heat removed by ice subli-
mation. During primary drying, the chamber pressure is well below the vapor pressure of
ice, and ice is transferred from the product to the condenser by sublimation and crystal-
lization onto the cold coils/plates in the condenser. Secondary drying is the stage where
water is desorbed from the freeze concentrate, usually at elevated temperature and low
pressure. Some secondary drying occurs even at the very beginning of primary drying as
ice is removed from a region, but the bulk of secondary drying occurs after primary drying
is over and the product temperature has increased [67].
This process generates various stresses during freezing and drying steps [68, 69, 70].
This technique has been largely discussed in many articles devoted to liposomes formu-
lations [71, 72], but very few recent articles are concerned with particles freeze-drying
[73, 74]. Therefore, some authors have reported that, for these systems, some additives
must be used in order to obtain successful results [75].
An aliquot of 1 mL was lyophilized following the experimental protocol described in
Section 6.8.3 of the Experimental Part. The lyophilized samples (Figure 3.28a) were re-
suspended in 1 mL of water to keep the same concentration of NP in water as in the orig-
inal suspension. In the case of sample 4, the solid was easily resuspended just shaking
manually. However, the suspension was not stable and it was not possible to obtain a
proper measurement of particle size and as a consequence the sample was sonicated.
The solid obtained from sample 11 was not able to bere-suspended in water manually
and it was sonicated for 10 minutes also (Figure 3.28b).
For an accurate comparison, an aliquot of 1 mL of the original suspensions was also
sonicated for 10 min and measured by Light Scattering to avoid any undesired effect of a
bigger influence of the sonication bath due to the smaller volume of the sample. (The vol-
130

3.3. Preparation of aqueous suspensions of the thiadiazoline derivative NP byDELOS-susp
Figure 3.28: Samples lyophilized (a) and resuspended samples in water (b).
ume of the samples sonicated were always 5 mL.) Surprisingly, particle size distribution
of both samples were smaller than the ones of the original suspensions. Figure 3.16 shows
the SEM characterization of the solid lyophilized and the solid lyophilized re-suspended
in water after 10 min of US. It can be inferred from the micrographs that after sonicating
the suspension of the lyophilized solids re-suspended in water, particles of NP are broken.
Table 3.16: Light scattering result of the Lyophilized solids re-suspended in 1ml of water
after 10 min of US and 1ml of the suspensions after 10 min of US.
Experiment (gPolx: gNP) Particle size distribution(µm)a
d(0.1) d(0.5) d(0.9)
4-Lyo 0.8:1 0.3 0.8 2.5
4 0.8:1 0.6 1.5 5.5
11-Lyo 0.08:1 0.4 1.0 3.1
11 0.08:1 0.9 1.6 5.2
4-Lyo and 11-Lyo are the solids after Lyophilization, aVolumetric
particle size distributions expressed in percentiles of 10, 50 and 90.
It has been reported that freeze-drying of nanoparticles can break particles [75]. More-
over, lyophilization of NP suspensions were performed without the aid of additives. As it
has been explained, this techniques is quite aggressive. Therefore, a proper optimization
131

Chapter 3. DELOS-susp for the preparation of pharmaceutical suspensions
Figure 3.29: SEM micrographs showing the effect of ultrasounds on the lyophilized NP par-
ticles: a) and c) are the solids lyophilized after 10 min of US and b) and d) without applying
US.
of the parameters of this procedure, as well as the use of cryogenic protectors, is required.
The results presented here should be considered a preliminary step and a deeper study
will be conducted soon.
3.3.7 Summary
• The feasibility of DELOS-susp for the preparation of stable aqueous suspensions of
NP has been assessed. The effect of addition of water at the end of depressurization
overcome the undesired growth of NP particles observed during DELOS precipita-
tions.
• The suspensions prepared in the absence of surfactant were not stable and particles
creamed. As a consequence, several surfactants were screened and the one which
132

3.3. Preparation of aqueous suspensions of the thiadiazoline derivative NP byDELOS-susp
performed better in terms of particle size reduction and stability was Poloxamer F-
127.
• The effect of Poloxamer F-127 on particle size of NP crystal was evaluated: with a
concentration of 0.08 g Polox: g NP, particle growth was avoided, however particles
tend to agglomerate. Using tenfold concentration, agglomeration is averted.
• The robustness of DELOS-susp has been established for preparing stable aqueous
suspensions of NP as well as for producing finely dispersed dried powders of this
compound by filtration of the suspensions.
• Diafiltration of suspensions has been presented as a suitable method for removing
the excess of acetonitrile when the final preferable form is aqueous suspensions.
• A preliminary study for the lyophilization of suspensions has been proposed. How-
ever, it was found that lyophilization performed at those conditions and without the
aid of additives breaks NP particles.
133

Chapter 3. DELOS-susp for the preparation of pharmaceutical suspensions
3.4 Crystal growth morphology prediction for the thiadia-
zoline derivative NP crystal.
The conventional crystallization of NP from acetonitrile evaporation was monitored by
optical microscopy, as explained in the Introduction of this Thesis (Chapter 1). In this way,
it was experimentally observed how NP crystals present a one-face preferential growth
and crystallize as very long needles. It has been possible to precipitate this drug as micro
and submicroparticles with a particle size distribution centered at 1µm and with 90% (in
volume) of the particles below 10µm by DELOS-sups in the presence of Poloxamer F-127.
However, despite of the methodology applied and the surfactants employed, particles al-
ways crystallized in the shape of needle-like. As a mean to understand the crystal growth
of this new drug, a morphology prediction of NP crystal was proposed using the molecular
modeling software Materials Studio.
Morphology refers to the macroscopic appearance of a crystal. It is characterized by a
set of surfaces and their relatives areas. The morphology of a crystal is determined by the
slowest growing faces (often referred to as the morphologically important faces) as a con-
sequence of the relative growth rates of the various faces of the crystal [32]. The growth
rates of the different faces depend on the internal structure of the crystal, as well as exter-
nal factors imposed on the crystal by crystallization conditions, such as supersaturation,
impurities, temperature and the choice of solvents. The individual face growth kinetics
depends to a different extent on supersaturation [57].
The morphology of crystalline solids influences their physical properties [76]. Since
many physical properties of crystals are implicitly dependent on their shape, the mor-
phology of crystalline solids can influence dissolution rate of chemicals and biological
availability of drugs; filtration, grinding, dusting and handling, packaging and storage of
crystalline products and, density and texture optimization, among others [77]. The ratio-
nalization of the relationship between crystal morphology and the arrangement of atoms
in the bulk crystal lattice is of great interest in many areas of science.
3.4.1 Introduction to Morphology simulations.
The aim of morphology prediction is to simulate the habit of a single crystal of a crys-
talline material using its internal crystal structure. Morphology prediction is performed
using the atomic structure of a crystal and a subsequently analysis of the relevant faces
134

3.4. Crystal growth morphology prediction for the thiadiazoline derivative NPcrystal.
in conjunction to surface chemistry. Three different methods are available within our re-
sources to predict morphology from the knowledge of the crystal structure:
• The Bravais-Friedel Donnay-Harker, BFDH Method:
The Bravais-Friedel Donnay-Harker, BFDH, laws are based on the crystal lattice and
space group symmetry to generate an ordered list of possible growing faces versus
their appearance importance and their relative growth rate [78]. The slowest growth
rates occur at the faces with the largest interplanar spacing. The BFDH method use
the Donnay-Harker rules to isolate the likely growth planes and then the Bravais-
Friedel rules to deduce their relative growth rates. The relative growth rate of {hkl}
forms on crystals is inversely proportional to the interplanar distance dhkl . There-
fore, the larger the dhkl , the more pronounced is the morphological importance of
the face, usually reflecting the weakest interactions between the face and the next
group layer. This method, however, does not account for the composition of the
crystal and position of crystallization units (atoms, ions or molecules) and their
bonds. It does not consider atomic composition or molecule itself. For that rea-
son, the strongest the bonding effect in the crystal, the less accurate the method
is.
• The Growth Morphology Method
The Growth Morphology [79] method assumes that the growth rate of a face is pro-
portional to its attachment energy. That is, faces with the slowest attachment en-
ergy are the slowest growing and, therefore, have the most morphological impor-
tance. From the energy calculation and, hence, the growth rate, a center-to-planar
distance is assigned to each face. It was proposed by Hartman and Perdok and
Hartman and Bennema. This method considers the role of intermolecular forces in
crystallization and tries to find relations between crystal structure and crystal mor-
phology on an energy basis. The attachment energy method does not include ther-
modynamic (temperature and supersaturation) as well as kinetics effects of crystal
growth on the final morphology. It attempts to provide a rough estimate of a generic
morphology determined by the interactions between the molecules in the crystal.
• The equilibrium morphology Method
Determines the the equilibrium morphology by the minimum of the surface ener-
gies for all relevant crystal faces at zero Kelvin.
135

Chapter 3. DELOS-susp for the preparation of pharmaceutical suspensions
In this work, the morphology prediction for the NP crystal has been conducted using the
The Bravais-Friedel Donnay-Harker, BFDH, method as well as the The Growth Morphol-
ogy method. During the growth morphology calculation, all possible surface configu-
rations for a given growth face are screened and a number of energetic and geometric
properties of theses surfaces are calculated. Out of the list of surface configurations, the
most stable one will limit the growth rate of the surface and that surface will dominates
the habit facet.
The atomic structure of the NP molecule has been determined from powder X-ray
diffraction for the first time in a collaboration with Prof. Norberto Masciocchi from the
Università dell’ Insubria in Como, Italy.
The crystal morphology is calculated using force field technology. In order for a pre-
diction to be successful, it is important to select an energy expression that is able to de-
scribe accurately all molecular fragments and the influence of intermolecular interactions
in the crystal and at the surface.
3.4.2 Morphology prediction.
The growth morphology of NP has been predicted from its crystal structure via molec-
ular modeling-based simulation techniques. The crystal structure, as mentioned, was
determined from powder X-ray diffraction by Prof. Norberto Masciocchi and the crystal-
lographic data is reported in Table 3.17.
Table 3.17: Crystallographic data of NP determined from PXRD.
Crystal System orthorhombic
Space group P212121
Lattice parameters a = 13.319
b = 4.697
c = 26.369
α = 90 deg
β = 90 deg
γ = 90 deg
Before performing any morphology prediction that involves energetic considerations,
it is very important to select an appropriate energy expression and verify that it is able
136

3.4. Crystal growth morphology prediction for the thiadiazoline derivative NPcrystal.
to accurately describe the crystal cell parameters, the molecular fragments and the inter-
molecular interactions in the crystal.
In this case, five available force-field has been tested: COMPASS, COMPASS II, CVFF,
CVFF-nocroos-nomorse and PCFF [80] with forcefield assigned atomic point charges. The
cell parameters predicted by Geometry optimization with the different force fields are
presented in Table 3.18 as long as the errors in reproducing the experimental values.
Table 3.18: Cell parameters predicted by geometry optimization with different force fields
and the errors in reproducing the experimental ones.
Cell parameter COMPASS COMPASSII CVFF CVFF-nocross-nomorse PCFF
a 13.832 13.339 14.555 14.504 14.114
b 4.325 4.322 4.052 4.062 4.131
c 25.904 27.396 26.531 26.497 27.626
α= β = γ = 90 deg
Error (%)
a 3.85 0.16 9.28 8.90 5.97
b 7.91 7.97 13.73 13.52 12.04
c 1.77 3.89 0.61 0.48 4.76
The results displayed in Table 3.18 show that all force fields reproduce the b parameter
with the highest error. COMPASS II does the best job in reproducing the experimental
structure. Figure 3.30 presents the optimized cell using COMPASS II forcefield.
The growth morphology of NP crystal structure is determined by the BFDH and the
The Growth Morphology Method using the COMPASS II forcefield. Figure 3.31 depicts
the morphology predictions using both methods respectively.
Both methods predict the same morphology and the simulated habit is needle-like, in-
dicating that the b axis is intrinsically the fast-growing direction. The predicted morphol-
ogy are in good agreement with the experimental morphology. The strong interactions Π
- Π between the aromatic rings makes the crystal to growth following that direction. The
predicted major faces and the associated percentage areas of the facets for NP crystal and
the energy attachment of each face are given in Table 3.19. It can be checked how the face
with the highest Attachment energy (absolute value),{0 1 1}, is the face that grows more
and as a consequence, this is the face with the lowest surface area (each face 4% of the
137

Chapter 3. DELOS-susp for the preparation of pharmaceutical suspensions
Figure 3.30: Optimize cell of NP crystal predicted by COMPASS II forcefield.
Figure 3.31: Predicted morphology of NP by the BDFH method and the Growth Morphology
method using COMPASS II forcefield.
138

3.4. Crystal growth morphology prediction for the thiadiazoline derivative NPcrystal.
Table 3.19: Dominant crystal surfaces predicted from Crystal Morphology prediction using
COMPASS II as force field for NP with the associated attachment energy and percentage of
total area.
Face Multiplicity Eatt % Area
{0 0 2} 2 -45.11 31
{1 0 1} 4 -53.42 53
{0 1 1} 4 -108.72 16
Eatt is the Attachment energy.
%Area is the percentage of the total area.
total area).
Once the crystal structure and the predicted morphology is known, new strategies for
preventing crystal growth can be designed. However, several authors reported that in
relation to the crystal surfaces and the molecular structures of the most effective stabi-
lizer they found for several drugs, there appears to be no apparent pattern to choose the
best additives for a particular drug [30, 59]. A more rigorous modeling involving calcu-
lation of binding energies for the adsorption of additives onto the crystal surface should
be required to understand the mechanism by which the surfactants inhibits NP crystal
growth. However, the difficulty in linking molecular level interactions between the stabi-
lizer molecule and crystal surfaces is based on the complexity of these systems that com-
prises multiple components and the dynamic nature of the precipitation process itself.
3.4.3 Summary
• The morphology of the NP crystal has been predicted using two methods: the BFDH
and the Growth Morphology Method.
• The selection of a proper forcefield that predict well the cell parameters is essential
for a successful morphology prediction. For this reason, several forcefields has been
assessed and the predicted lattice parameters have been compared. The best job in
reproducing the experimental cell of NP was done by COMPASS II.
• The BFDH and the Growth Morphology Method using COMPASS II predicted a needle-
like habit elongated along the b axis which is in good agreement with the experi-
139

Chapter 3. DELOS-susp for the preparation of pharmaceutical suspensions
mental morphology.
140

3.5. Preparation of aqueous suspensions of ibuprofen by DELOS-susp
3.5 Preparation of aqueous suspensions of ibuprofen by DELOS-
susp
DELOS-susp method has been proven to be a promising alternative for preparation of
NP microsuspensions. Based on the encouraging results presented in Section 3.3, the
next section of this Chapter is devoted to explore the feasibility of DELOS-susp for the
preparation of stable suspensions of ibuprofen, a well known poor water soluble drug.
In DELOS-susp, the supercritical solution is expanded into a liquid media instead of
passing through a filter and a dispersion of the drug in an aqueous media is obtained.
Mechanistically, the liquid at the receiving end of the rapid depressurization that takes
place in DELOS, could suppress particle growth of the precipitate as depicted in Figure
3.32.
Figure 3.32: Schematic representation of the DELOS-susp method for the preparation of
micro- and submicrosuspensions.
The production of stable micro and submicro-suspensions of drugs by DELOS-susp
141

Chapter 3. DELOS-susp for the preparation of pharmaceutical suspensions
involves the depressurization of a CO2-expanded solution of the active compound over
an aqueous phase. As depicted in Figure 3.32, the first and second stage of DELOS-sups
procedure are the same as in DELOS methology (see Figure 2.6 of Chapter 2): the API
is dissolved in a conventional organic solvent at atmospheric pressure and at working
temperature (TW ). The solution is charged into the high pressure vessel once, previously
driven to the working temperature (TW ). CO2 is then added to obtained a volumetric ex-
panded solution of the API at TW and at high pressure (PW ) with a given molar fraction of
CO2 (xW ). Finally, this CO2-expanded solution is depressurized from PW to atmospheric
pressure over a certain volume of aqueous media (Vaq ) with a continuous aqueous flow
(F ) giving a aqueous suspension of the drug.
As revealed in Section 3.3, in order to circumvent anti-solvent precipitation of the poor
water soluble drug when it enters the water current, experimental conditions must ensure
the maximum DELOS yield possible.
In Section 2.2 of Chapter 2, the operation variables of DELOS for the precipitation of
ibuprofen has been optimized. Hence, experiment 2, that was conducted at TW = 298
K, PW = 10 MPa, xW = 0.82, using acetone as solvent and a Ci of ibuprofen in acetone
of 0.28 mol/mol (βi = 0.9), was chosen as a reference experiment for the preparation of
stable suspensions by DELOS-susp because at those conditions the highest DELOS yield
was achieved (Yield = 78%).
The selection of surfactant was carried out based on the promising results obtained
with NP and studies reported in the literature [62]. The same proportions between drug
and surfactant were evaluated. It is important to note that ibuprofen solubility in ace-
tone is one order of magnitude higher than NP solubility in acetonitrile, therefore more
concentrated suspensions were obtained although the current flow of the water were in-
creased up to 700 mL/min. Table 3.20 collects the experiments conducted for the prepa-
ration of stable aqueous suspensions of ibuprofen by DELOS-susp.
In all the experiments conducted, aqueous suspensions of ibuprofen were produced.
The suspension produced without the aid of surfactants were not stable and ibuprofen
particles tend to cream up after 2 hours of its preparation (see Figure 3.33). The rest of
ibuprofen suspensions, except the suspension obtained in the presence of HPMC using
0.8:1 g HMPC/ g Ibu (suspension 5) were milky homogenous and stable suspensions. The
suspension obtained after experiments 5 consists of very big agglomerates. Therefore,
this suspension was not characterize as it is not macroscopically homogenous.
142

3.5. Preparation of aqueous suspensions of ibuprofen by DELOS-susp
Table 3.20: Experiments conducted for the preparation of micro and submicrosuspensions
of Ibuprofen by DELOS-susp.
Experiment Surfactant Surfactant/IBU ratio (g:g)a
1 - -
2 Poloxamer F-127 0.08:1
3 Poloxamer F-127 0.8:1
4 HPMC 0.08:1
5 HPMC 0.8:1
6 Tween80 0.08:1
7 Tween80 0.8:1
DELOS-susp experiments performed at TW = 298 K, PW = 10 MPa, xW = 0.82
and F = 700 mL/min for preparing stable ibuprofen aqueous suspensions, a amount
of surfactant expressed as grams of surfactant per gram of IBU.
Figure 3.33: Macroscopically comparison between the suspension of ibuprofen in the pres-
ence (a) and in the absence of surfactant (b).
∗ Particle size distribution of ibuprofen suspensions
The characterization of the suspensions prepared by DELOS-susp were analysed by
Light Scattering using the protocol described in Section 6.4.1 of the Experimental Part
just as prepared and applying 10 min of US and the results are presented in Table 3.21.
In the case of suspensions of ibuprofen, the presence of surfactants at those concen-
trations do not inhibit so much the crystal growth of ibuprofen particles and the effect of
adding tenfold concentration of surfactant is negligible. Attending to the values of par-
143

Chapter 3. DELOS-susp for the preparation of pharmaceutical suspensions
Table 3.21: Particle size distribution of Ibuprofen suspensions prepared by DELOS-susp as
prepared and after 10 min of US.
Experiment As prepared (µm)a 10 min US (µm)a
d(0.1) d(0.5) d(0.9) d(0.1) d(0.5) d(0.9)
DELOS 2 - - - 2.84 6.7 14.37
1 - - - 5.4 11.3 23.1
2 4.8 16.9 97.5 2.8 5.8 14.5
3 5.9 13.3 28.1 5.1 10.3 18.7
4 7.8 13.5 35.4 3.9 9.5 18.6
6 4.9 11.0 24.4 3.4 7.3 14.7
7 5.4 11.3 23.12 5.1 11.9 27.0
aVolumetric particle size distribution expressed in percentiles of 10,
50 and 90 as prepared and a after 10 min of ultrasounds.
ticle size distribution without applying ultrasounds, the best results are obtained when
using Tween 80 at a concentration of 0.08:1 g Tween 80/ g Ibuprofen. After 10 min in an
sonicated bath, the particle size distributions of the suspensions in the presence of Tween
80 and Poloxamer F-127 are quite similar.
The suspension prepared using HPMC with the highest concentration was not ho-
mogenous and therefore it was not further characterized. The one using ten times less
of HMPC yields the bigger particle size distribution. In addition, as can be ascertained
from Figure 3.34, HMPC alters the morphological aspect of ibuprofen particles. There are
previous studies that highlights that HMPC displays poor stabilizing performance citeVa-
nEerdenbrugh2009,Jongen2000.
∗ Characterization of ibuprofen micro particles obtained by filtration of the micro-
suspensions
As in the case of NP, the suspensions contained an excess of acetone and therefore
were filtered and dried. The solids obtained were characterized by SEM and by Light
Scattering following the experimental procedure detailed in Sections 6.4.2 and 6.4.1 re-
spectively. For Light Scattering measurements, the dried ibuprofen powders were re-
suspended in pure water. In order to have a stable suspension that could be characterized,
144

3.5. Preparation of aqueous suspensions of ibuprofen by DELOS-susp
suspensions were sonicated 10 min.
As Figure 3.34 shows, the morphology of ibuprofen particles does not change as a
function of the surfactant used as except for the solids precipitated using HPMC. It has
been reported that HPMC induces different morphologies [34].
Figure 3.34: SEM images of the ibuprofen obtained after filtration and drying of the sus-
pensions prepared by DELOS-susps in the absence of surfactant, experiment 1(a), and em-
ploying surfactants: experiments 2-7 from Table 3.20.
The particle size measurements of ibuprofen particles re-suspended in pure water
are presented in Table 3.22. The free-acetone ibuprofen aqueous suspensions obtained
present similar particles size distributions as the ones containing acetone after 10min of
ultrasounds. The preparation of stable suspensions of ibuprofen should be regarded as a
preliminary study. More experiments changing the surfactant nature and concentration
should be design in order to obtain smaller ibuprofen particles, as in this case, the size is
not improved in comparison to DELOS precipitation of ibuprofen.
145

Chapter 3. DELOS-susp for the preparation of pharmaceutical suspensions
Table 3.22: Particle size distribution of the solids of Ibuprofen resuspended in water.
Experiment 10 min US (µm)a
d(0.1) d(0.5) d(0.9)
1 2.5 7.1 19.5
2 2.8 5.8 14.2
3 2.8 6.1 12.7
4 2.3 4.4 7.8
6 2.5 5.3 9.9
7 3.0 6.3 11.7
aVolumetric particle size distribution expressed
in percentiles of 10, 50 and 90 as prepared
after 10 min of ultrasounds.
3.5.1 Summary
• The feasibility of preparing stable aqueous suspensions of ibuprofen by DELOS-
susps has been demonstrated. However, the additives screened and the concentra-
tions employed do not exert a significant impact on the crystal growth of ibuprofen.
• The best results in terms of particle size reduction has been achieve using Tween 80.
• HPMC does not display good stabilizing properties and it also modifies ibuprofen
crystal morphology.
• The preparation of stable suspensions of ibuprofen can be considered a preliminary
study, a more comprehensive screening of surfactant and concentrations is essen-
tial in order to reduce particle size of ibuprofen.
146

Bibliography
[1] R. H. Muller and K. Peters, “Nanosuspensions for the formulation of poorly soluble
drugs: I. preparation by a size-reduction technique,” International Journal of Phar-
maceutics, vol. 160, no. 2, pp. 229 – 237, 1998.
[2] V. Patravale, A. Date, and R. Kulkarni, “Nanosuspensions: A promising drug delivery
strategy,” Journal of Pharmacy and Pharmacology, vol. 56, no. 7, pp. 827–840, 2004.
[3] B. E. Rabinow, “Nanosuspensions in drug delivery,” Nature Reviews Drug Discovery,
vol. 3, no. 9, pp. 785–796, 2004.
[4] P. Pathak, M. Meziani, T. Desai, and Y.-P. Sun, “Nanosizing drug particles in super-
critical fluid processing,” Journal of the American Chemical Society, vol. 126, no. 35,
pp. 10842–10843, 2004.
[5] E. Merisko-Liversidge, G. G. Liversidge, and E. R. Cooper, “Nanosizing: a formulation
approach for poorly-water-soluble compounds,” European Journal of Pharmaceuti-
cal Sciences, vol. 18, no. 2, pp. 113 – 120, 2003.
[6] R. Müller, C. Jacobs, and O. Kayser, “Nanosuspensions as particulate drug formula-
tions in therapy: Rationale for development and what we can expect for the future,”
Advanced Drug Delivery Reviews, vol. 47, no. 1, pp. 3–19, 2001.
[7] D. Horn and J. Rieger, “Organic nanoparticles in the aqueous phase - theory, experi-
ment, and use,” Angewandte Chemie - International Edition, vol. 40, no. 23, pp. 4330–
4361, 2001.
[8] C. M. Keck and R. H. Müller, “Drug nanocrystals of poorly soluble drugs produced by
high pressure homogenisation,” European Journal of Pharmaceutics and Biophar-
maceutics, vol. 62, no. 1, pp. 3 – 16, 2006.
147

Bibliography
[9] H.-K. Chan and P. Kwok, “Production methods for nanodrug particles using the
bottom-up approach,” Advanced Drug Delivery Reviews, vol. 63, no. 6, pp. 406–416,
2011.
[10] J.-U. Junghanns and R. Mu, T. Muller, “Nanocrystal technology, drug delivery and
clinical applications,” International Journal of Nanomedicine, vol. 3, no. 3, pp. 295–
309, 2008.
[11] S. Verma, R. Gokhale, and D. Burgess, “A comparative study of top-down and bottom-
up approaches for the preparation of micro/nanosuspensions,” International Jour-
nal of Pharmaceutics, vol. 380, no. 1-2, pp. 216–222, 2009.
[12] R. Huttenrauch, S. Fricke, and P. Zielke, “Mechanical activation of pharmaceutical
systems,” Pharmaceutical Research, vol. NO. 6, pp. 302–306, 1985.
[13] G. Liversidge and K. Cundy, “Particle size reduction for improvement of oral bioavail-
ability of hydrophobic drugs: I. absolute oral bioavailability of nanocrystalline dana-
zol in beagle dogs,” International Journal of Pharmaceutics, vol. 125, no. 1, pp. 91–97,
1995.
[14] B. H. L. B. Rainer H. Müller, Simon Benita, ed., Emulsions and Nanosuspensions for
the Formulation of Poorly Soluble Drugs. Medpharm„ 1998.
[15] D. Horn and J. Rieger, “Organic nanoparticles in the aqueous phase - theory, experi-
ment, and use,” Angewandte Chemie - International Edition, vol. 40, no. 23, pp. 4330–
4361, 2001.
[16] R. Müller, S. Gohla, and C. Keck, “State of the art of nanocrystals - special features,
production, nanotoxicology aspects and intracellular delivery,” European Journal of
Pharmaceutics and Biopharmaceutics, vol. 78, no. 1, pp. 1–9, 2011.
[17] S. Verma, Y. Lan, R. Gokhale, and D. Burgess, “Quality by design approach to under-
stand the process of nanosuspension preparation,” International Journal of Pharma-
ceutics, vol. 377, no. 1-2, pp. 185–198, 2009.
[18] S. Dalvi, M. Azad, and R. Dave, “Precipitation and stabilization of ultrafine parti-
cles of fenofibrate in aqueous suspensions by resolv,” Powder Technology, vol. 236,
pp. 75–84, 2013.
148

Bibliography
[19] P. Pathak, M. J. Meziani, T. Desai, and Y.-P. Sun, “Formation and stabilization of
ibuprofen nanoparticles in supercritical fluid processing,” The Journal of Supercriti-
cal Fluids, vol. 37, no. 3, pp. 279 – 286, 2006.
[20] L. Songtipya and A. Sane, “Effect of concentration and degree of saturation on co-
precipitation of catechin and poly(l-lactide) by the resolv process,” Journal of Super-
critical Fluids, vol. 75, pp. 72–80, 2013.
[21] L. Wu, J. Zhang, and W. Watanabe, “Physical and chemical stability of drug nanopar-
ticles,” Advanced Drug Delivery Reviews, vol. 63, no. 6, pp. 456–469, 2011.
[22] A. Ain-Ai and P. Gupta, “Effect of arginine hydrochloride and hydroxypropyl cellu-
lose as stabilizers on the physical stability of high drug loading nanosuspensions of
a poorly soluble compound,” International Journal of Pharmaceutics, vol. 351, no. 1-
2, pp. 282–288, 2008.
[23] M. Sangalli, L. Zema, A. Maroni, A. Foppoli, F. Giordano, and A. Gazzaniga, “Influ-
ence of betacyclodextrin on the release of poorly soluble drugs from inert and hy-
drophilic heterogeneous polymeric matrices,” Biomaterials, vol. 22, no. 19, pp. 2647–
2651, 2001.
[24] B. K. Krister Holmberg, Bo Jönsson and B. Lindman, Surfactants and Polymer in
Aqueous Solution. John Wiley & Sons, Inc., 2002.
[25] D. Myers, Surfaces, Interfaces, and Colloids:Priniciples and Applications. John Wiley
& Sons, Inc., 1999.
[26] M. J. Rosen, Surfactants and Interfacial phenomena. Wilet-Interscience, 2004.
[27] W. Tiyaboonchai and N. Limpeanchob, “Formulation and characterization of am-
photericin b-chitosan-dextran sulfate nanoparticles,” International Journal of Phar-
maceutics, vol. 329, no. 1-2, pp. 142–149, 2007.
[28] M. Nutan and I. Reddy, “General principles of suspensions,” Pharmaceutical suspen-
sions: from formulation development to Manufacturing, pp. 39–66, 2009.
[29] C.-J. Kim, “Surface chemistry and colloids,” Advanced Pharmaceutics: Physicochem-
ical Principles, pp. 193–256, 2004.
149

Bibliography
[30] S. Xie, S. Poornachary, P. Chow, and R. Tan, “Direct precipitation of micron-size
salbutamol sulfate: New insights into the action of surfactants and polymeric ad-
ditives,” Crystal Growth and Design, vol. 10, no. 8, pp. 3363–3371, 2010.
[31] S. Dalvi and R. Dave, “Controlling particle size of a poorly water-soluble drug using
ultrasound and stabilizers in antisolvent precipitation,” Industrial and Engineering
Chemistry Research, vol. 48, no. 16, pp. 7581–7593, 2009.
[32] J. Mullin Crystallization, 1993.
[33] K. Chari, B. Antalek, J. Kowalczyk, R. Eachus, and T. Chen, “Polymer-surfactant inter-
action and stability of amorphous colloidal particles,” Journal of Physical Chemistry
B, vol. 103, no. 45, pp. 9867–9872, 1999.
[34] N. Jongen, P. Bowen, J. Lematre, J.-C. Valmalette, and H. Hofmann, “Precipitation
of self-organized copper oxalate polycrystalline particles in the presence of hydrox-
ypropylmethylcellulose (hpmc): Control of morphology,” Journal of Colloid and In-
terface Science, vol. 226, no. 2, pp. 189–198, 2000.
[35] A. Balakrishnan, B. Rege, G. Amidon, and J. Polli, “Surfactant-mediated dissolution:
Contributions of solubility enhancement and relatively low micelle diffusivity,” Jour-
nal of Pharmaceutical Sciences, vol. 93, no. 8, pp. 2064–2075, 2004.
[36] R. Thakur and R. Gupta, “Rapid expansion of supercritical solution with solid co-
solvent (ress - sc) process: Formation of griseofulvin nanoparticles,” Industrial and
Engineering Chemistry Research, vol. 44, no. 19, pp. 7380–7387, 2005.
[37] M. Wulff, M. Aldën, and D. Craig, “An investigation into the critical surfactant con-
centration for solid solubility of hydrophobic drug in different polyethylene glycols,”
International Journal of Pharmaceutics, vol. 142, no. 2, pp. 189–198, 1996.
[38] L.-H. Zhu, L.-Z. Wang, H.-R. Li, Y. Lei, H.-H. Pan, and S.-J. Han, “Molecular dynamics
simulation for dmf aqueous solution,” Acta Chimica Sinica, vol. 61, no. 4, pp. 526–
530, 2003.
[39] A. M. M. Cerdeira, Production and Stabilization of Nnaosuspensions of Poorly Soluble
Durg Substances. PhD thesis, ETH Zurich, 2012.
150

Bibliography
[40] I. Cabrera, E. Elizondo, O. Esteban, J. Corchero, M. Melgarejo, A. Pulido, D. Cor-
doba, E. Moreno, U. Unzueta, E. Vazquez, I. Abasolo, S. Schwartz, A. Villaverde,
F. Albericio, M. Royo, M.and Garcia Parajo, and J. Ventosa, N. Veciana, “Multifunc-
tional nanovesicle-bioactive conjugates prepared by a one-step scalable method us-
ing co2-expanded solvents,” Nano Letters, vol. 13, no. 8, pp. 3766–3774, 2013.
[41] M. Cano-Sarabia, N. Ventosa, S. Sala, C. Patio, C.o, R. Arranz, and J. Veciana, “Prepa-
ration of uniform rich cholesterol unilamellar nanovesicles using CO2-expanded sol-
vents,” Langmuir, vol. 24, no. 6, pp. 2433–2437, 2008.
[42] A. Da Fonseca Antunes, B. De Geest, C. Vervaet, and J. Remon, “Gelucire 44/14 based
immediate release formulations for poorly water-soluble drugs,” Drug Development
and Industrial Pharmacy, vol. 39, no. 5, pp. 791–798, 2013.
[43] A. Svensson, C. Neves, and B. Cabane, “Hydration of an amphiphilic excipient, gelu-
cire 44/14,” International Journal of Pharmaceutics, vol. 281, no. 1-2, pp. 107–118,
2004.
[44] O. Chambin and V. Jannin, “Interest of multifunctional lipid excipients: Case of gelu-
cire 44/14,” Drug Development and Industrial Pharmacy, vol. 31, no. 6, pp. 527–534,
2005.
[45] S. Cafaggi, E. Russo, G. Caviglioli, B. Parodi, R. Stefani, G. Sillo, R. Leardi, and G. Big-
nardi, “Poloxamer 407 as a solubilising agent for tolfenamic acid and as a base for
a gel formulation,” European Journal of Pharmaceutical Sciences, vol. 35, no. 1-2,
pp. 19–29, 2008.
[46] S. Khattak, S. Bhatia, and S. Roberts, “Pluronic f127 as a cell encapsulation mate-
rial: Utilization of membrane-stabilizing agents,” Tissue Engineering, vol. 11, no. 5-6,
pp. 974–983, 2005.
[47] T. Gafourian, A. Safari, K. Adibkia, F. Parviz, and A. Nokhodchi, “A drug release study
from hydroxypropylmethylcellulose (hpmc) matrices using qspr modeling,” Journal
of Pharmaceutical Sciences, vol. 96, no. 12, pp. 3334–3351, 2007.
[48] J. Siepmann and N. Peppas, “Modeling of drug release from delivery systems based
on hydroxypropyl methylcellulose (hpmc),” Advanced Drug Delivery Reviews, vol. 64,
no. SUPPL., pp. 163–174, 2012.
151

Bibliography
[49] P. Thapa and M. Ghimire, “Effect of drug solubility and polymer viscosity on in-vitro
drug release from hpmc matrix tablet,” Indian Drugs, vol. 42, no. 6, pp. 389–391, 2005.
[50] D. Zhou, D. Law, J. Reynolds, L. Davis, C. Smith, J. Torres, V. Dave, N. Gopinathan,
D. Hernandez, M. Springman, and C. Zhou, “Understanding and managing the im-
pact of hpmc variability on drug release from controlled release formulations,” Jour-
nal of Pharmaceutical Sciences, vol. 103, no. 6, pp. 1664–1672, 2014.
[51] K. Chowdary, K. Rao, and R. Shaik, “Enhancement of solubility and dissolution rate of
nimesulide by cyclodextrins, poloxamer and pvp,” International Journal of Chemical
Sciences, vol. 9, no. 2, pp. 637–646, 2011.
[52] L. Song, C.-N. Zhang, J. Liu, Y.-Q. Zhang, and S.-R. Guo, “Study on paa and pvp as
drug delivery carriers,” Shanghai Jiaotong Daxue Xuebao/Journal of Shanghai Jiao-
tong University, vol. 39, no. 10, pp. 1680–1684, 2005.
[53] J. Carvalho, F. Alves, T. Batista, F. Carvalho, P. Santiago, and M. Tabak, “Sodium dode-
cyl sulfate (sds) effect on the thermal stability of oxy-hbgp: Dynamic light scattering
(dls) and small angle x-ray scattering (saxs) studies,” Colloids and Surfaces B: Bioint-
erfaces, vol. 111, pp. 561–570, 2013.
[54] S. Hejazi, M. Erfan, and S. Alireza Mortazavi, “Precipitation reaction of sds and potas-
sium salts in flocculation of a micronized megestrol acetate suspension,” Iranian
Journal of Pharmaceutical Research, vol. 12, no. 3, pp. 239–246, 2013.
[55] B. Phani Kumar, S. Umayal Priyadharsini, G. Prameela, and A. Mandal, “Nmr inves-
tigations of self-aggregation characteristics of sds in a model assembled tri-block
copolymer solution,” Journal of Colloid and Interface Science, vol. 360, no. 1, pp. 154–
162, 2011.
[56] D. Tulumello and C. Deber, “Sds micelles as a membrane-mimetic environment for
transmembrane segments,” Biochemistry, vol. 48, no. 51, pp. 12096–12103, 2009.
[57] S. Raghavan, A. Trividic, A. Davis, and J. Hadgraft, “Crystallization of hydrocortisone
acetate: Influence of polymers,” International Journal of Pharmaceutics, vol. 212,
no. 2, pp. 213–221, 2001.
[58] F.S.Romanski, The Production and stabilization of pharmaceutical nanosuspensions.
PhD thesis, New Brunswick Rutgers, The State University of New Jersey, 2011.
152

Bibliography
[59] S. Khan, M. Matas, J. Zhang, and J. Anwar, “Nanocrystal preparation: Low-energy
precipitation method revisited,” Crystal Growth and Design, vol. 13, no. 7, pp. 2766–
2777, 2013.
[60] B. Van Eerdenbrugh, G. Van den Mooter, and P. Augustijns, “Top-down production
of drug nanocrystals: Nanosuspension stabilization, miniaturization and transfor-
mation into solid products,” International Journal of Pharmaceutics, vol. 364, no. 1,
pp. 64–75, 2008.
[61] S. Verma, S. Kumar, R. Gokhale, and D. Burgess, “Physical stability of nanosuspen-
sions: Investigation of the role of stabilizers on ostwald ripening,” International Jour-
nal of Pharmaceutics, vol. 406, no. 1-2, pp. 145–152, 2011.
[62] I. Ghosh, S. Bose, R. Vippagunta, and F. Harmon, “Nanosuspension for improving the
bioavailability of a poorly soluble drug and screening of stabilizing agents to inhibit
crystal growth,” International Journal of Pharmaceutics, vol. 409, no. 1-2, pp. 260–
268, 2011.
[63] J. Lee, J.-Y. Choi, and C. Park, “Characteristics of polymers enabling nano-
comminution of water-insoluble drugs,” International Journal of Pharmaceutics,
vol. 355, no. 1-2, pp. 328–336, 2008.
[64] M. Matteucci, M. Hotze, K. Johnston, and R. Williams III, “Drug nanoparticles by
antisolvent precipitation: Mixing energy versus surfactant stabilization,” Langmuir,
vol. 22, no. 21, pp. 8951–8959, 2006.
[65] R. Chakraborti and J. Kaur, “Noninvasive measurement of particle-settling velocity
and comparison with stokes’ law,” Journal of Environmental Engineering (United
States), vol. 140, no. 2, 2014.
[66] O. Mengual, G. Meunier, I. Cayre, K. Puech, and P. Snabre, “Characterisation of insta-
bility of concentrated dispersions by a new optical analyser: The turbiscan ma 1000,”
Colloids and Surfaces A: Physicochemical and Engineering Aspects, vol. 152, no. 1-2,
pp. 111–123, 1999.
[67] X. Tang and M. Pikal, “Design of freeze-drying processes for pharmaceuticals: Prac-
tical advice,” Pharmaceutical Research, vol. 21, no. 2, pp. 191–200, 2004.
153

Bibliography
[68] J. Sassone, E. Jo, L. Noguera, and J. Mullick, “Freeze-drying in pharma,” Pharmaceu-
tical Manufacturing and Packing Sourcer, no. SUMMER, pp. 46–50, 2009.
[69] F. Franks, “Freeze-drying of bioproducts: Putting principles into practice,” European
Journal of Pharmaceutics and Biopharmaceutics, vol. 45, no. 3, pp. 221–229, 1998.
[70] W. Abdelwahed, G. Degobert, S. Stainmesse, and H. Fessi, “Freeze-drying of
nanoparticles: Formulation, process and storage considerations,” Advanced Drug
Delivery Reviews, vol. 58, no. 15, pp. 1688–1713, 2006.
[71] H. Talsma, M. Van Steenbergen, P. Salemink, and D. Crommelin, “The cryopreserva-
tion of liposomes. 1. a differential scanning calorimetry study of the thermal behav-
ior of a liposome dispersion containing mannitol during freezing/thawing,” Phar-
maceutical Research, vol. 8, no. 8, pp. 1021–1026, 1991.
[72] K. Tanaka, T. Takeda, K. Fujii, and K. Miyajima, “Cryoprotective mechanism of
saccharides on freeze-drying of liposome,” Chemical and Pharmaceutical Bulletin,
vol. 40, no. 1, pp. 1–5, 1992.
[73] C. Schwarz and W. Mehnert, “Freeze-drying of drug-free and drug-loaded solid lipid
nanoparticles (sln),” International Journal of Pharmaceutics, vol. 157, no. 2, pp. 171–
179, 1997.
[74] A. Saez, M. Guzm"Ãa"n, J. Molpeceres, and M. Aberturas, “Freeze-drying of poly-
caprolactone and poly(d,l-lactic-glycolic) nanoparticles induce minor particle size
changes affecting the oral pharmacokinetics of loaded drugs,” European Journal of
Pharmaceutics and Biopharmaceutics, vol. 50, no. 3, pp. 379–387, 2000.
[75] M. Choi, S. Brianon, J. Andrieu, S. Min, and H. Fessi, “Effect of freeze-drying pro-
cess conditions on the stability of nanoparticles,” Drying Technology, vol. 22, no. 1-2,
pp. 335–346, 2004.
[76] E. Moreno-Calvo, T. Calvet, M. Cuevas-Diarte, and D. Aquilano, “Relationship be-
tween the crystal structure and morphology of carboxylic acid polymorphs. pre-
dicted and experimental morphologies,” Crystal Growth and Design, vol. 10, no. 10,
pp. 4262–4271, 2010.
[77] E. Moreno-Calvo, On the polymorphism and structural characterization in the family
of even saturated carboxylic acids. PhD thesis, Universidad de Barcelona., 2008.
154
Bibliography
[78] P. Bennema, “Morphology of crystals, past and future,” Science and Technology of
Crystal Growth, pp. 149–164, 1995.
[79] G. Clydesdale, K. Roberts, and R. Docherty, “Habit95 - a program for predicting the
morphology of molecular crystals as a function of the growth environment,” Journal
of Crystal Growth, vol. 166, no. 1-4, pp. 78–83, 1996.
[80] H. Sun, “The compass force field: Parameterization and validation for phosp-
hazenes,” Computational and Theoretical Polymer Science, vol. 8, no. 1-2, pp. 229–
246, 1998.
155

Bibliography
156

4Surfactant-free microemulsion-like
systems
4.1 Introduction
The most abundant and inexpensive solvents on earth are water and CO2, which, in ad-
dition, are environmentally benign, non-toxic and non-flammable fluids. Based on this,
systems containing both solvents offer new possibilities in replacement of more toxic sol-
vents in fields like chemical processing, pharmaceutical, microelectronics, particle for-
mation, organometallic catalysis, synthesis of polymers and so on.
Solvents based on liquid and supercritical CO2 have evolved from pure CO2, to CO2-
expanded solvents, complexing agents, micelles, and water/CO2 microemulsions. The
solvent quality of compressed CO2 may be tuned with pressure and temperature. In light
of the emergence of these new green systems, the following chapter is devoted to the de-
scription of new CO2-based microemulsion-like systems containing water and organic
solvents.
157

Chapter 4. Surfactant-free microemulsion-like systems
4.1.1 Microemulsions-like systems
Microemulsions are clear solutions of oil, water or other aqueous solutions and surfac-
tants, with a rich variety of microstructures at the nanoscale level. They are thermody-
namically stable, that is, for example, reversible to temperature cycles and they are trans-
parent [1]. Microemulsions are isotropic, optically transparent and thermodynamically
stable solutions. They were discovered by Schulman in the 1940s [2] and Winsor [3]. How-
ever, Mother Gardiner’s recipe for washing woolen clothes in Australia predates this by
100 years. It comprises methanol, grated bar soap and a little eucalyptus oil. The most
sophisticated modern washing detergents do to surpass it in effectiveness [4].
The first to call these solutions, consisting of water, oil, surfactant, and alcohol, "micro-
emulsions" were Schulman et al. [5] in 1959. Another definition was given later by Daniels-
son and Lindman in 1981 [6]: a microemulsion is a system of water, oil and an amphiphile
which is a single optically isotropic and thermodynamically stable liquid solution.
The term microemulsion was selected because of a fundamental misunderstanding of
the nature of these systems. During a long period of time there were no agreed definition
on what should constitute a microemulsion, but the term was used broadly to include
several types of surfactant systems. A major reason for the confusion is due to the pre-
fixes used to denote them, the term micro does not correlate to the size of the domains,
which are on the nanoscale [7]. Nowadays, the fundamental understanding has matured
into a considerable consensus and there are interesting applications of these systems in a
variety of fields [1].
The extensive research on microemulsions was prompted by two oil crisis in the 1970s,
when oil companies focused on the research of microemulsions because they could be
used as a tool for optimizing oil recovery. Besides the economic interest, in the 1980s
researchers took an interest in the understanding of phase behavior, the different nanos-
tructures and the unique properties of microemulsions like their low interfacial tension
[8].
At the nanoscopic scale, microemulsions are structured either as well defined nano
droplets dispersed in a continuous media (water in oil (w/o) or oil in water (o/w)) [9, 2]
or as bicontinuous structures [10, 11] (see Figure 4.1). Often, o/w microemulsions are
abbreviated as L1-phases, w/o as L2-phases, and bicontinuous structures often as Lα-
phases or sponge phases. Bicontinuous structures consist of networks of oil and water
nanodomains separated and stabilized by a surfactant interfacial film. There is a huge
158

4.1. Introduction
Table 4.1: Comparison between microemulsions and emulsions
Emulsions Microemulsions
2 liquid phases 1 structure liquid phase
Thermodynamically unstable Thermodynamically stable
Turbid aspect Trasparent or translucent
Non spontaneous formation Spontaneous formation
Micrometirc domain Nanometric domains
diversity of other structures available: beside droplets, lamellar [12], random [13] or bi-
continuous [14] nanostructures, a network of water tubes in an oil matrix or a network of
oil tubes in a water matrix, have been identified. The microstructure is commonly remi-
niscent of random bicontinuous connected cylinders of oil in water or of water in oil and
it is claimed that bicontinuos structures are more the rule than the exception. It is impor-
tant to note that these are all dynamic aggregates [4] and that their net curvature is close
to zero [8].
Another important phase classification was introduced by Winsor [3] who discovered
four general types of phase equilibria:
• Winsor I: two phases in equilibrium, o/w structure and an almost pure upper oil
phase.
• Winsor II: two phases in equilibrium, an aqueous phase containing surfactant and
an upper w/o phase.
• Winsor III: three phase system consistint of a surfactant poor water phase, a bison-
tinuous middle phase and an almost pure upper oil phase.
• Winsor IV: classical single phase microemulsions that can be L1, L2 or Lα.
Microemulsions have been intensively studied during the last few years by many scien-
tists and technologists. Most of the recent applications of microemulsions take advantage
of the fact that, though macroscopically homogenous, microemulsions are heterogenous
on the submicroscopic scale. The unique properties of microemulsions make them in-
teresting for commercial products and technical processes. In particular, the high sol-
ubilizing power of microemulsion systems for organic and inorganic compounds favors
159

Chapter 4. Surfactant-free microemulsion-like systems
Figure 4.1: Different nano structures of microemulsions: a) oil-in-water, b) bicontinuous
and c) water-in-oil.
their use as solvents for a large number of applications. The applications investigated
at present range from classical fields like solubilisation media in food, cosmetic [15] and
pharmaceutical industry [16], oil recovery [1], ground water remediation [17], soil cleanup
[18] and organic chemistry, to new subjects like improvement of fuels or the use as decon-
tamination media. Microemulsions have been used as chemical reactors because of their
special interfacial properties which allow an intimate contact, at nanoscale level, of hy-
drophilic and hydrophobic domains [19]. The microemulsion route is very efficient in
terms of stabilization of the products that can be dissolved in the different domains and
in controlling their particle size.
Summarizing, microemulsions have attracted the attention of academia and industry
since a long time because of their unique properties: they show thermodynamic stability,
optical clarity and high solubilisation capacity [20], and they are isotropic with ultralow
interfacial tensions [21]. Though they are macroscopically homogeneous solutions, an
ordered structure can be found on the nanoscopic scale.
One problem of using conventional microemulsions is the separation and removal of
solvent from products [19]. Additionally, microemulsions composed of conventional sol-
vents could be formed and destroyed by composition and temperature changes, which
require efficient stirring systems to ensure a homogeneous modification. In this sense,
CO2-based microemulsions emerge as a promising alternative to overcome these prob-
lem, as CO2 used as solvent offers several advantages such rapid separation, easy removal
of solvent and the introduction of pressure as a new operational parameter.
160

4.1. Introduction
4.1.2 CO2-based microemulsions-like systems
Water-in-CO2 (W/C) microemulsions may be utilized as environmentally benign non-
toxic solvents in chemical processes. The solvent quality of compressed CO2 can be tuned
with pressure and temperature to manipulate the properties of the microemulsion. The
fluid properties of CO2 such as density, and hence solvent quality, can be adjust by slightly
changing temperature or pressure, which further enhances the ease of solvent removal
through rapid evaporation. cCO2 is generally a very poor solvent, especially for polar and
high molecular weight solutes, and this limits its use in many potential applications [22].
One of the most promising approaches for enhancing the solubility of polar substances
in cCO2 is to form water CO2-based microemulsions. CO2 properties are much different
from those of water [23], hence, water CO2-based microemulsions can be considered as
green universal solvents, what favors their use as solvents for a large number of purposes
[24]. These organized fluids have the attractive characteristics of cCO2 and the solvation
properties of bulk water [25]. Over the past 40 years, a lot of effort has been put in the
formation and characterization of CO2-based microemulsions [26, 27, 28, 29, 23, 19].
Water and compressed CO2 microemulsions have been widely used in many fields,
such as chemical reactions, nano particle synthesis, extraction of hydrophiles and pro-
teins [30]. Nevertheless, in order to become a viable green technology, the amount of
surfactant required to form CO2-based microemulsions need to be reduced until its min-
imum value.
Over the last three decades and among the more than 10.000 publications dealing with
microemulsions (CO2-based and conventional microemulsions), only few papers deal
with the so-called surfactant-free microemulsions [31, 32, 33, 34, 35, 36, 37, 38, 39, 40].
Up to now, and as far as we know, it is only possible to form CO2-based microemulsions
with the aid of surfactants. This Thesis presents, for the first time, surfactant-free CO2-
based microemulsion-like systems.
4.1.3 Surfactant-free Microemulsion-like systems
The concept of surfactant-less microemulsions has been known for a long time. Strange
observations dating back to the early XXth century about membrane enzyme reactions
in lipid-less media, non-linear effects in evaporation of ternary mixtures [41], the polar
paradox in oxidation rates of ternary fluids, as well as unexplained single phase ternary
solutions that contain ethanol, led to the proposition in the seventies by the group of
161

Chapter 4. Surfactant-free microemulsion-like systems
Barden, [42] that surfactant-less microemulsions should go beyond a nice name to some
strange unexplained behavior. This observed behavior of some homogeneous ternary
fluids that can be reversibly phase separated by simple centrifugation, but correspond
to a thermodynamic equilibrium in the phase diagram. The existence of surfactant-less
microemulsions was very controversial at the beginning mainly due to the redundant ar-
gument that microemulsions were composed by at least a ternary system in which one
component is an amphiphile, therefore, surfactant- less microemulsions could not exist.
In 1976 the group of Barden started an investigation with the aim to determine the
effect of an interfacial environment on the properties of metal-ligand complexes [43]. In
this work the system water/hexane was studied with hexadecyl-trimethylammonium per-
chlorate as surfactant and 2-propanol as cosurfactant. The objective was to characterize
the system in absence of metals and ligands. In another set of studies, the phase behav-
ior of the pseudo-ternary systems alcohol/ hydrocarbon/brine was examined [44, 45, 46].
The single phase areas were similar to those observed with surfactants. Also the deter-
mined interfacial tensions of these systems were similar to surfactant-based microemul-
sion systems. In 1981, Lara et al. explored the ternary system water/2-propanol/benzene
with heat capacity measurements. Their experimental results supported the formation of
systems similar to microemulsions. Also a bicontinuous structure was suggested [47].
Hence, in the late 1970s several groups found similar structures to microemulsions
in systems in the abcense of surfactants. However, there was no continuation of these
initial works. Some recent studies have tried to understand and explain the mechanism
of the formation of these domains [37, 36]. Pfennig and Schott [48] published a study with
computer simulations where the formation of nano-droplets in the close vicinity of the
interface induced by mass transfer across these interfaces is described. In their simulation
they found areas in a ternary system where stable nano-droplets were formed.
However, recent scattering experiments with light [31], X-rays and neutrons [49], gave
proof of structures identical to standard micelles, which led to the conclusion that well-
defined aggregates exist in ternary solutions containing two alcohols (ethanol and oc-
tanol). Some of these experiments also demonstrated that these structures are not caused
by critical fluctuations, because the signals of different solution components give differ-
ent q dependencies [50].
Another recent publication regarding surfactant - free microemulsion- like systems is
the work published by Wang et al. They have reported a surfactant-free microemulsion -
like system that comprises only an ionic liquid and water [51].
162

4.2. Water/Acetone/CO2 system
Though the literature concerning the structure and microenvironment of these sur-
factant -less microemulsions is quite scarce [40], these systems have the advantage of
the absence of harmful surfactants facilitating the recovery of products and making them
more environmentally friendly. The surfactant-less microemulsion systems have been
shown to serve as an appropriate media for enzymatic reactions, [36] to be more suitable
than microemulsions composed of surfactants for biocatalytic process [40, 35] and for the
hydrolysis of chlorophyll [52].
Klossek et al. [49] also investigated the formation of surfactant less microemulsions
in ternary mixtures that fulfill the following requirements : solvent 1 being miscible with
solvent 2 and that additional component 3 is highly soluble in solvent 2 but not in solvent
1, which are the same pre requites as in our CO2-based surfacatant-free microemulsion-
like systems. This chapter deals with the formation and characterization of surfactant-
free CO2-based microemulsions-like systems that were observed studying the behavior
of ternary mixtures composed of water and CO2-expanded solvents.
4.2 Water/Acetone/CO2 system
The first mixture studied has been the mixture composed of acetone/water/CO2 at 10
MPa at different temperatures. Water and acetone are completely miscible and acetone
expands greatly upon the addition of CO2 [53]. However, as mentioned, water and CO2
represent extremes of the solvent spectra, therefore the solubility of CO2 in water is no-
tably low. As described in the previous section, microemulsions are a single transparent
phase systems, therefore, the knowledge of the phase behavior of the mixture is the pre-
liminary step in the study of microemulsions.
4.2.1 High pressure phase equilibria
A break-through in the understanding of microemulsions was due to the determination
of phase diagrams. Extensive work on phase diagrams contributed much to clarify the
existence range of microemulsions and to relate phase behavior to molecular interactions
[1].
High pressure phase equilibria have been a subject of rapidly increasing interest since
the 90s. Mixtures containing carbon dioxide, water and an organic solvent are among the
most extensively studied [54]. The phase behavior of ternary mixtures of water, acetone
163

Chapter 4. Surfactant-free microemulsion-like systems
and CO2 at high pressure has been the subject of many studies revealing a high pressure
fluid-fluid phase equilibrium [55, 56]. Therefore, according to a phenomenon called "salt-
ing out with a supercritical fluid", which was first described by Elgin and Weinstock in the
late 50s, initially homogeneous mixtures of acetone and water can be split in two fluid
phases by pressurization with CO2 (Figure 4.2).
Figure 4.2: Salting out with a supercritical gas
A way to present the phase behavior within a ternary system is the Gibbs triangle,
which is a equilateral triangle. Along the sidelines either the mass, volume, or mole frac-
tion of the components are plotted. Every corner corresponds to the pure component.
When the phase behavior is investigated as a function of temperature as well, the triangle
is extended to the Gibbs Prism. In this case the Gibbs triangle is the basis and temperature
the ordinate.
The phase behavior of the ternary system of water, acetone and CO2 at high pressure
is already reported in the literature [54].
In the framework of this Thesis, it has been optically monitored what happens upon
the addition of CO2 at constant pressure (10 MPa) to miscible mixtures of water and ace-
tone at different molar proportions and at different temperatures: 298 K, 308 K and 238 K.
The compositions at which the phase splits into two different phases, a dense water rich
phase and a water lean light phase, have been measured following the experimental pro-
tocol described in Section 6.9.1 and using the Variable Volume cell, which is described in
Section 6.2.2 of the Experimental Part. The addition of a substance isobaric and isother-
mally is possible by increasing the volume of the Variable Volume Cell.
Table 4.2 discloses the CO2 molar fraction (xCO2 ) at which the single liquid phase
164

4.2. Water/Acetone/CO2 system
splits into two liquid phases. Figure 4.3 presents in a ternary diagram the experimentally
measured compositions at which different initial mixtures of water/acetone/CO2 splits
into two phases at 10 MPa and different temperatures. The continuous lines represent
the working lines, from initial mixtures of water and acetone (50/50, 60/40, 70/30 wa-
ter/acetone molar relationship) upon the addition of pure CO2 keeping constant pressure
at temperature.
Table 4.2: Compositions of the ternary system water/acetone/CO2 when the single phase
breaks into two liquid phases at 10 MPa and different temperatures.
Water/Acetone (molar relationship)a xCO2b
298K 308K 328K
50/50 0.17 0.18 0.20
60/40 - 0.14 -
70/30 0.10 0.12 0.14
aWater/Acetone molar relationship of the initial solution,
bCO2 composition where the single phase breaks into 2 liquid phases.
As it is ascertained from Figure 4.3, an increase in temperature from 298 K to 308 K and
to 328 K is translated into a decrease in the miscibility gap. As a consequence, the single
phase region is increased, this means that at high temperature, more CO2 is required to
break the single phase.
The phase behavior of a system containing water, CO2 and an organic liquid depends
primarily on the hydrogen bonding tendency of the organic liquid [55]. Therefore, moni-
toring the evolution of hydrogen bonding is a powerful tool to get insights at the molecular
level of the phase behavior of the ternary system which permits to relate phase behavior
and molecular interactions. Vibrational spectroscopy probes the local environment of a
molecule [57] and gives insights about the state of aggregation of the molecules. Hence,
Raman Spectroscopy has been proven to be a valuable tool to investigate the nanostructre
of several systems [58]. In this Thesis, Raman Spectroscopy has been used to characterize
at the molecular level the effect of the addition of compressed CO2 over a mixture of water
and acetone, before the system separates into two liquid phases.
165

Chapter 4. Surfactant-free microemulsion-like systems
Figure 4.3: Ternary diagram of water/acetone/CO2 at 10 MPa and at a) 298 K, b) 308 K and c)
328 K. The continuous lines represent the working lines of adding CO2 to the initial mixtures
of water/acetone: mixture 50/50 blue line, mixture 60/40 green line and mixture 70/30 pink
line. The black dots represent the compositions where the single phase splits into 2 liquid
phases (values from Table 4.2).
4.2.2 Raman Spectroscopy characterization of microemulsion-like sys-
tems
Raman spectroscopy provided evidence into the state of aggregation of water molecules
in the ternary systems at high pressure. The Raman spectrum of the OH stretch vibra-
tion of the water molecules gives insights into the development of hydrogen bonding at
a molecular level. Raman spectroscopy is probably the most important of the techniques
which has been employed to obtain information relating the intra- and inter-molecular
vibrational modes of liquid water. Liquid water may have as many as seven fundamental
intramolecular vibrational distributions and as many as nine intermolecular vibrational
distributions. The use of the term distributions refers to the fact that all modes are in-
homogeneously broadened, i.e., the bond lengths and bond angles are widely distributed
due to intermolecular interactions. The various Gaussian Raman OH-stretching compo-
nents are thought to arise from various amounts of hydrogen bonding and their intensi-
ties change with rising temperature [59].
The formation and destruction of hydrogen bonds could be monitored by the signa-
ture of the OH-vibration band between 3000 and 3800 cm−1 for liquid water (also true for
liquid alcohols). This band is sensitive for changes in temperature, pressure and compo-
sition over a wide range [58, 60]. Increasing pressure, decreasing temperature or concen-
166

4.2. Water/Acetone/CO2 system
trating the water content leads to an intensification of the hydrogen bonds and vice versa
as Figure 4.4 presents.
Figure 4.4: OH stretching band of water: as temperature increases, the mean distance be-
tween water molecules decreases which means there is a loosening of hydrogen bonds.
This is reflected by an increase of the higher-frequency peak intensities. Conversely, when
temperature decreases, water molecules are closer and there is an increase of the lower-
frequency peak intensities.
The deconvolution of the OH-vibration band shows that the intensification of the hy-
drogen bonds is reflected by an increase of the lower-wavenumber peak intensities while
a loosening of hydrogen bonds is reflected by an increase of the higher-wavenumber peak
intensities [61]. Actually, the entire OH-vibration band between 3000 and 3800 cm−1 con-
sists of several (the number and the central wavenumbers are debated [62]) peaks which
make the detailed evaluation of the signal complex and the interpretation at least contro-
versial [63]. Nevertheless, following the previously made remarks, there is a consensus in
literature that contributions at high wavenumbers can be assigned to the least bonded
molecules, and contributions at lower wavenumbers can be assigned to the hydrogen
bonded molecules. These remarks are valid for infrared absorption spectroscopy as well
as for Raman spectroscopy. Raman signals (here between 3050 and 3450 cm−1) can be
assigned to the hydrogen bonded water molecules (Ib) and the high wavenumber Raman
signals (here between 3450 and 3850 cm−1) can be assigned to the least bonded water
167
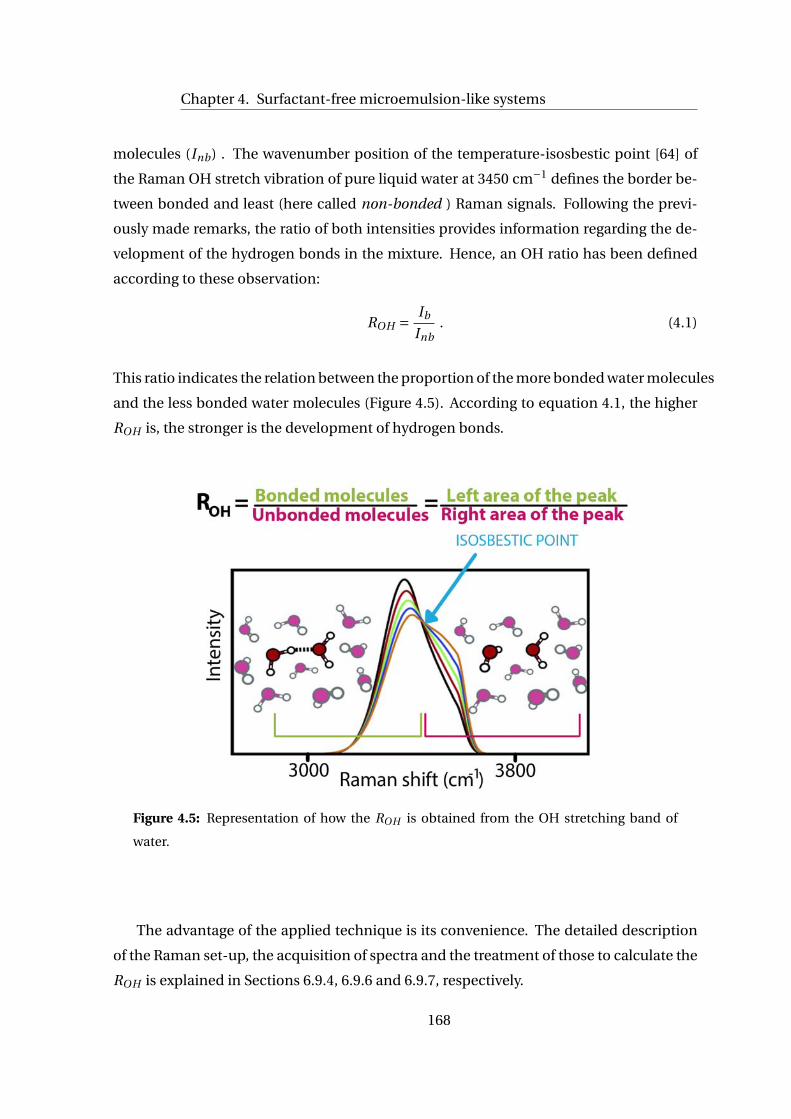
Chapter 4. Surfactant-free microemulsion-like systems
molecules (Inb) . The wavenumber position of the temperature-isosbestic point [64] of
the Raman OH stretch vibration of pure liquid water at 3450 cm−1 defines the border be-
tween bonded and least (here called non-bonded ) Raman signals. Following the previ-
ously made remarks, the ratio of both intensities provides information regarding the de-
velopment of the hydrogen bonds in the mixture. Hence, an OH ratio has been defined
according to these observation:
ROH = Ib
Inb. (4.1)
This ratio indicates the relation between the proportion of the more bonded water molecules
and the less bonded water molecules (Figure 4.5). According to equation 4.1, the higher
ROH is, the stronger is the development of hydrogen bonds.
Figure 4.5: Representation of how the ROH is obtained from the OH stretching band of
water.
The advantage of the applied technique is its convenience. The detailed description
of the Raman set-up, the acquisition of spectra and the treatment of those to calculate the
ROH is explained in Sections 6.9.4, 6.9.6 and 6.9.7, respectively.
168

4.2. Water/Acetone/CO2 system
4.2.3 Evolution of the ROH in the Water/Acetone/CO2 system
Initial mixtures of water and acetone have been diluted by adding a third component: CO2
or acetone. The addition has been performed at 10 MPa and 308 K isobaric and isothermal
following the experimental protocol described in Section 6.9.6 of the Experimental Part.
The addition of CO2 and acetone has been monitored by Raman Spectroscopy. Figure 4.6
depicts the OH stretching band of water upon the addition of CO2 for the mixture 50/50.
Figure 4.6: OH stretching band of water of the mixture water/acetone 50/50 upon the ad-
dition of CO2. The blue line marks the point chosen to calculate the ROH (temperature-
isosbestic point of water).
The ROH has been computed from the OH stretching vibration Raman signal of water
(Figure 4.6) to monitor the evolution of the development of hydrogen bonding between
water molecules, according to the methodology explained in detail in Section 6.9.7. Figure
4.7 plots the evolution of the ROH when adding CO2 and when additing acetone to initial
mixtures of water/acetone 50/50 and 60/40 as a function of the molecular density of water
(ρH20) defined as moles of water divided by the volume of the cell. ρH20 gives information
about the evolution of bulk water density upon the addition of CO2 and the probability of
a water molecule to be close to another water molecule.
When the initial mixtures of water and acetone are diluted with pure acetone, the
evolution of the ROH for the initial mixtures 50/50 and 60/40 is the same and the ratio
linearly decreases, which means that the effective distance between water molecules de-
creases. Hence, the addition of acetone isobaric and isothermally to the initial mixture of
169

Chapter 4. Surfactant-free microemulsion-like systems
Figure 4.7: a) Composition evolution of the system upon progressive addition of acetone
(black arrow) and CO2 over the initial mixtures, 50/50 (blue line) and 60/40 (green line)
represented in a ternary diagram. b) Comparison of the ROH ratio as a function of the water
density (water mols/cell volume) of the mixture 50/50 during the addition of CO2 (blue
triangles) and the addition of acetone (black squares) at 10 MPa and 308 K. c) Comparison
of the ROH ratio as a function of the water density (water mols/cell volume) of the mixture
60/40 during the addition of CO2 (green dots) and the addition of acetone (black squares)
at 10 MPa and 308 K.
water/acetone 50/50 and 60/40, dilutes the water molecules. However, the tendency of
the ROH upon the addition of CO2 over these initial mixtures of water and acetone until
phase separation occurs is different that in the case of the addition of acetone. The ten-
dency of the ROH for the addition of CO2 to the mixtures 50/50 and 60/40 (water/acetone
molar relationship) is the same for both mixtures. Small additions of CO2 make ROH to
decrease, which means that the effective distance between water molecules increases (the
proportion of less bonded molecules is increased). However, if the addition of CO2 con-
tinues, ROH increases until phase separation takes place. An increase of ROH means that
the effective distance between the water molecules is decreased. In other words, from a
170

4.2. Water/Acetone/CO2 system
certain point of the ternary mixtures (ρH20=0.01445 mol/mL,ρH20=0.0097mol/mL for the
mixtures 60/40 and 50/50 respectively), the addition of CO2 reduces the mean distance
between water molecules, that is, water molecules tend to be more bonded forming clus-
ters.
The ROH ratio has also been calculated for the addition of CO2 over the initial mixture
70/30 (water/acetone molar relationship). Figure 4.8 presents the evolution of the ROH
for the three initial mixtures 70/30, 60/40 and 50/50 at 10MPa and 308K.
Figure 4.8: a) Composition evolution of the system upon progressive addition of CO2 over
the 3 initial mixtures, 50/50 (blue line), 60/40 (green line) and 70/30 (pink line) represented
in a ternary diagram. b) Evolution of the ROH ratio as a function of the water density (water
mols/cell volume) of the mixtures 50/50 (blue triangles), 60/40 (green dots) and 70/30 (pink
diamonds) during the progressive addition of CO2 at 10 MPa and 308 K.
It can be ascertained that the tendency followed by the ROH is the same for the there
initial mixtures. In the mixture 70/30, from a ρH20= 0.01914mol/mL, the water molecules
distance decreases, meaning that water molecules are more bonded.
If water molecules cluster to water-rich regions, other water-lean nanoscopic regions
should exist with higher acetone and CO2 content relative to the bulk. Therefore, although
the system is a single transparent phase macroscopically homogenous, it presents an or-
ganization at the nanoscopic scale formed by domains of different nature. The system
water/acetone/CO2 at certain conditions of composition, temperature and pressure dis-
plays the physical characteristics of a surfactant-free microemulsion-like systems.
This phenomenom of forming water clusters is not observed when the initial mixtures
are diluted with acetone instead of with CO2 as can inferred from Figure 4.7.
171

Chapter 4. Surfactant-free microemulsion-like systems
Effect of Temperature over the microemulsion-like structure
In order to get more knowledge about the relation between phase behavior and molecular
interactions of the ternary mixture composed of water/acetone/CO2 and with the aim of
gaining more understanding regarding the formation of water-rich clusters in the single
phase region of this ternary mixture, the evolution of ROH upon the addition of CO2 over
homogenous mixtures of water and acetone at different temperatures has been moni-
tored. The experimental protocol followed is the same as the one used to characterize the
system at 308 K and it is explained in detail in Section 6.9.6 of the Experimental Part.
The phase behavior of the systems at 298 K and 328 K has already been shown (see
Figure 4.3). An increase in temperature from 308 K to 328 K is translated into a decrease
of the miscibility gap and as a consequence the single phase region is enlarged, meaning,
that at high temperature, more CO2 is required to break the single phase. Conversely, as
temperature decreases so does the solubility of the 3 components, and less CO2 need to
be added to split the single phase.
Figure 4.9 depicts the OH stretching band of water for the mixture 50/50 at 298 K (a)
and at 328 K (b). As can be inferred, the shape of the OH band changes with temperature,
and in agreement with the OH stretching band depicted in Figure 4.4, the left part of the
peak decreases with increasing temperature.
Figure 4.9: OH stretching band of water of the mixture water/acetone 50/50 upon the ad-
dition of CO2 at 298 K (a) and at 308 K (b).
The ROH evolution was monitored upon the addition of CO2, in this case, only to the
initial mixtures of water/acetone with a molar relationship of 50/50 and 70/30 and the
measured tendency is plotted in Figure 4.10.
172

4.2. Water/Acetone/CO2 system
Figure 4.10: a) Upper: Composition evolution of the system upon progressive addition of
CO2 over the initial mixtures, 50/50 (green line) and 70/30 (orangeline) represented in a
ternary diagram at 10 MPa and 298 K. Bottom: Evolution of the ROH ratio as a function
of the water density (water mols/cell volume) of the mixtures 50/50 (green squares) and
70/30 (orange triangles) during the progressive addition of CO2 at 10 MPa and at 298 K and
b) Composition evolution of the system upon progressive addition of CO2 over the initial
mixtures, 50/50 (green line) and 70/30 (orangeline) represented in a ternary diagram at 10
MPa and 328 K. Bottom: Evolution of the ROH ratio as a function of the water density (water
mols/cell volume) of the mixtures 50/50 (green squares) and 70/30 (orange triangles) during
the progressive addition of CO2 at 10 MPa and at 328 K.
The addition of CO2 at 10 MPa and 298 K (Figure 4.10a) provokes two different scenar-
ios depending on the amount of water in the initial mixture. For the equimolar mixture,
the tendency of the ROH is very similar to the one previously observed for the mixtures at
308K: small additions of CO2 dilutes the water molecules, however, from a certain com-
position (ρH20 = 0.096 mol/ml), the addition of CO2 provokes the formation of water clus-
173

Chapter 4. Surfactant-free microemulsion-like systems
ters, as can be inferred from the increase of the ROH . In the mixture 70/30, the decrease
in the ROH with small additions of CO2 does not occur and therefore, water molecules
tend to form clusters since the first addition of CO2 to the initial mixture. Hence, it can
be concluded from the evolution of the hydrogen bonding capacity of water that at 298 K,
the liquid mixture presents a certain nanostructure in terms of domains of different na-
ture. In the mixture 50/50, the nanostructuring appears at compositions of ρH20 = 0.096
mol/ml until phase separation occurs. In the water richer mixture (70/30) the formation
of nano domains takes place since the first addition of CO2.
At high temperature (Figure 4.10b), CO2 addition over the initial mixture 50/50 makes
the water molecules to be less bonded as can be observed from the continuos decrease of
the ROH . Just before phase separation occurs, it can be seen a slight increase of the ROH
ratio, but much less pronounced that for the mixture at 308 K. The same conclusion can
be withdrawn from the evolution of the ROH ratio in the mixture 70/30. Therefore, the
evolution of the ROH ratio reveals that the microemulsion-like structure is not formed at
328 K where the miscibility of the 3 components is higher.
An important conclusion can be withdrawn from the comparison of the evolution of
the ROH at the three different temperatures for the initial mixtures studied. It is possible
to relate the phase behavior of the system to the molecular interactions and to the state
of aggregation of water molecules, as the most pronounced structuring occurs when the
miscibility region is smaller.
4.2.4 Microemulsion-like solubilization capacity
In order to further support the hypothesis of the existence of water-rich and water-lean
domains in a clear solution, the solubilization power of this microemulsion-like system
was assessed. For this reason, a widely known poor water soluble compound, ibupro-
fen (see Chapter 1) was chosen as a non-water and non-CO2 soluble compound (sol-
ubility of ibuprofen in water = 0.18·10−5 mol·mol−1 [65] and solubility of ibuprofen in
CO2 = 0.13·10−2 mol·mol−1 [66]). However, ibuprofen is known to present a high solubility
in pure acetone and in CO2-expanded acetone at the working conditions of temperature
and pressure [67]. Figure 4.11 presents the solubility curve of ibuprofen in CO2-acetone
mixture at 10 MPa and 298 K, where it can be ascertained that CO2 acts as a co-solvent for
a wide range of CO2 molar fractions. The solubilization experiment of ibuprofen in the
microemulsion-like system is conducted at 308 K. An increase of temperature increases
174

4.2. Water/Acetone/CO2 system
the solubility of ibuprofen in the system.
Figure 4.11: Solubility curve of ibuprofen in CO2-expanded acetone at 10 MPa and 298 K
[67].
The solubilization experiments were conducted in the High pressure Variable Cell de-
scribed in Section 6.2.2 of the Experimental Part and following the experimental proce-
dure presented in Section 6.9.8 of the same Chapter. Experiments were carried out at con-
stant pressure (10 MPa) and temperature (308 K). Briefly, the experiments were conducted
as the following: a certain solution of ibuprofen in acetone is prepared and charged into
the High Pressure Variable Volume Cell, which was previously driven to the working tem-
perature. Then, a certain volume of water was added to have the desired molar relation-
ship between water and acetone. The addition of water provokes the precipitation of
ibuprofen by its anti-solvent behavior. Then, CO2 was added very slowly keeping pres-
sure and temperature constant. The addition of a third component keeping pressure and
temperature constant is possible thanks to the movable piston of the Variable Volume
Cell that allows to increase the volume of the Cell. The addition is stopped when a single
transparent phase is observed.
Ibuprofen is precipitated in the initial mixture of water/acetone, and by the addition
of CO2, it has been possible to dissolve it as a single transparent phase is obtained. This
is unexpected as the dissolution is achieved by adding a solvent where ibuprofen is very
poorly soluble. Hence, the solubilization of ibuprofen supports the conclusions obtained
from the Raman spectroscopy characterization: the addition of CO2 over initial mixtures
of water/acetone provokes the structuration of the system at the nanoscale. As ibuprofen
is neither soluble in water nor in CO2, it should be dissolved in the water-lean domains of
175

Chapter 4. Surfactant-free microemulsion-like systems
the microemulsion-like system.
Figure 4.12 shows how from an initial state (a), where ibuprofen is precipitated in the
mixture of water/ acetone, a single transparent phase is obtained by the addition of CO2.
The appearance of this single transparent phase reveals that ibuprofen is dissolved in the
water-lean domains.
Figure 4.12: Microemulsion-like solubilization powder: ibuprofen is precipitated in the ini-
tial mixture of water/acetone (50/50) at 10 MPa and 308 K (a) and upon the addition of CO2
a single transparent phase is obtained (b).
Table 4.3 discloses the different condition explored for the solubilization experiments
for the 3 different molar compositions of water and acetone. For the mixture 60/40, two
amounts of ibuprofen were dissolved. In all the experiments presented in Table 4.3 a sin-
gle phase was obtained by the addition of CO2.
176

4.2. Water/Acetone/CO2 system
Table 4.3: Ibuprofen solubilization in the domains of the microemulsion-like system
Experiment Water/Acetone (molar relationship) Ci(mol/mol)a
1 50/50 0.278
2 60/40 0.278
3 60/40 0.371
3 70/30 0.278
Solubilization of Ibuprofen in the domains of the microemulsion-like systems performed at
P = 10 MPa and T = 308 K,a concentration of Ibuprofen in acetone expressed as mol/mol
4.2.5 Summary
• The phase behavior of the ternary system Water/Acetone/CO2 at 10 MPa and at dif-
ferent temperatures (298 K, 308 K and 328 K) has been assessed. Homogeneous
mixtures of water and acetone can be split into two liquid phases by the addition of
CO2 at high pressure. In addition, it has been experimentally proven how as tem-
perature increases, miscibility of the three components increases.
• Raman Spectroscopy has been successfully used for monitoring the evolution of
the hydrogen bonds of water during addition of CO2 over initial mixtures of water
and acetone. The OH stretching band of water turned out to be a very useful tool for
evaluating the mean distance between water molecules during addition of CO2 over
initial mixtures of water and acetone until phase separation takes place. Based on
this peak, a ratio has been defined (ROH ) which gives information of how bonded
water molecules are.
• Raman Spectroscopy reveals that small additions of CO2 increase the mean distance
between water molecules. However, if the addition of CO2 continues, but still in the
single phase region, it has been assessed how water molecules tend to form clusters
for the mixtures at 308 K. If there are water-rich regions in the single transparent
phase, there should be other water-lean regions. Therefore, at certain conditions of
pressure, temperature and composition this system presents a certain structure at
the nanoscale while it is macroscoscopically homogeneous.
• The formation of this water-rich domains occurs for different initial compositions
177

Chapter 4. Surfactant-free microemulsion-like systems
of water and acetone at 10 MPa and 308 K. However, at higher temperature (328 K)
where the single phase region is larger, the formation of water clusters does not take
place. Conversely, at lower temperature (298 K), the nano structuring is enhanced
and starts at smaller additions of CO2. It has been demonstrated that it is possible
to relate phase behavior with interactions at the molecular level.
• In order to support Raman Spectroscopy measurements, the solvation capacity of
the water-rich and water-lean domains has been evaluated using a poor water sol-
uble compound that also presents low solubility in CO2, ibuprofen. It has been pos-
sible to dissolve high quantities of this drug in the water-lean domains, probing the
salvation capacity of this microemulsion-like system.
178

4.3. Water/Acetonitrile/CO2 system
4.3 Water/Acetonitrile/CO2 system
It is very interesting to investigate, from a theoretical and practical point of view, if the for-
mation of domains of clearly different composition in macroscopically homogenous mix-
tures of water/organic solvent/CO2 at high pressures can occur in other ternary systems.
Based on this, it was proposed to explore new possibilities of CO2-based surfactant-free
microemulsion-like systems. This section, therefore is dedicated to extend the possible
ternary systems sensitive to form microemulsion-like structures.
The ternary system should fulfill the same conditions as the water /acetone/ CO2 sys-
tem. The acetonitrile/ water/ CO2 was chosen because its high pressure phase behavior
is very similar to the former. The water-acetonitrile mixture can be split into two phases
upon the addition of CO2: a dense water-rich phase and a lighter water-lean phase, richer
in the mixture of CO2-expanded acetonitrile, as in the case of the water/acetone/CO2
ternary system [68]. Acetone and acetonitrile are both polar aprotic organic solvents with
large dipole moments that can accept hydrogen bonds [69].
The same experimental protocol employed to determine the existence of nano do-
mains of different nature in mixtures of water/acetone/ CO2 at high pressure before phase
separation was applied to characterize the new ternary system composed of water/ ace-
tonitrile/ CO2. The protocol is presented in Section 6.9.6 of the Experimental Part.
4.3.1 High pressure phase equilibria
As mentioned, knowledge of the phase behavior of the mixture at high pressure is essen-
tial. The ternary mixture water/acetonitrile/CO2 is not so studied as the acetone one, and
the phase equilibria at 10 MPa have not been found reported in the literature.
The addition of CO2 was performed over initial mixtures of water and acetonitrile with
the same molar proportion as in the case of acetone: 50/50, 60/40 and 70/30. The com-
position at which the single phase breaks into two separate phases, a dense water-rich
phase and a light water-lean phase, has been measured following the same experimental
protocol as in the previous ternary mixture, which is described in detail in Section 6.9.1 of
the Experimental Part.
Figure 4.15 presents the high pressure ternary diagram of the water/acetonitrile/CO2
system at 10 MPa and 308 K. The compositions at which the single phase breaks into two
liquid phases are disclosed in Table 4.4. As it is shown, the miscibility region of the ternary
179

Chapter 4. Surfactant-free microemulsion-like systems
diagram is smaller than for the ternary diagram of water/acetone/CO2 at the same condi-
tions of pressure and temperature.
Figure 4.13: Ternary diagram of water/acetonitrile/CO2 at 10 MPa and at 308 K. The con-
tinuous lines represents the working lines of adding CO2 to the initial mixtures of wa-
ter/acetonitrile: mixture 50/50 yellow line, mixture 60/40 dark blue line and mixture 70/30
orange line.
Table 4.4: Compositions of the ternary system water/acetonitrile/CO2 when the single
phase breaks into two liquid phases at 10 MPa and 308 K.
Water/Acetonitrile (molar relationship)a xCO2b
50/50 0.09
60/40 0.06
70/30 0.04
aWater/Acetonitrile molar relationship of the initial solution,
bCO2 composition where the single phase breaks into 2 liquid phases.
180

4.3. Water/Acetonitrile/CO2 system
4.3.2 Raman spectroscopy characterization of microemulsion-like sys-
tems
The monitoring of hydrogen bond capacity of water molecules in the system water/ ace-
tonitrile upon the addition of CO2 and acetonitrile has also carried out. The same pro-
cedure as in the water/acetone/CO2 system was followed, which is described in detail in
Section 6.9.6 of the Experimental Part.
The ROH has been calculated from the OH stretching band of water when CO2 and
acetonitrile has been added isobaric (10 MPa) and isothermally (308 K) to an initial mix-
ture 50/50 water/acetonitrile. Figure 4.14 depicts the comparison of the evolution of the
ROH for both scenarios. In the acetonitrile/ water/CO2 system the evolution of the ROH
when adding CO2 to the mixture 50/50 is different as in the acetone system. In the mix-
tures with acetonitrile, the ratio always increases. This means that, since the first addition
of CO2, the CO2 does not dilute the water molecules. Small additions of CO2 make the
water molecules to be closer. However, when the initial mixture 50/50 water/acetonitrile
is diluted with pure acetonitrile, the addition of the latter makes the water molecules to
be more diluted as the ROH always decrease.
Figure 4.14: a) Composition evolution of the system upon progressive addition of acetoni-
trile (dark arrow) or CO2 over the initial mixture 50/50 (yellow line) represented in a ternary
diagram. b) Comparison of the evolution of the ROH ratio as a function of the water density
(water mols/cell volume) of the mixture 50/50 during the progressive addition of acetoni-
trile (black squares) and the addition of CO2 (yellow dots) at 10 MPa and 308 K.
The evolution of the ROH for the addition of CO2 over the three different initial mix-
tures of water/acetonitrile: 50/50, 60/40 and 70/30 has also been assessed and the ten-
181

Chapter 4. Surfactant-free microemulsion-like systems
dency observed in depicted in Figure 4.15.
Figure 4.15: a) Composition evolution of the system upon progressive addition of CO2 over
the initial mixtures, 50/50 (yellow line), 60/40 (dark blue) and 70/30 (orange line) repre-
sented in a ternary diagram. b) Evolution of the ROH ratio as a function of the water density
(water mols/cell volume) of the mixtures 50/50 (yellow dots), 60/40 (dark blue diamonds)
and 70/30 (orange triangles) during the progressive addition of CO2 at 10 MPa and 308 K.
In the case of acetonitrile/water mixtures, the addition of CO2 never increases the
mean distance between water molecules as ROH never decreases. Since the first addition
of CO2, the ROH increases for the 3 mixtures, meaning that the water molecules tend to
form clusters since the beginning of the addition of CO2. As in the water/acetonitrile/CO2
the miscibility between the three components is smaller than in the water/acetone/CO2
system at the working conditions, the nanostructuring starts at smaller CO2 concentra-
tions. These results are in agreement with the observations ascertained from the exper-
iments at 298 K: the shorter the miscibility region, the sooner the nanostructuring takes
place.
The difference in the behavior of the evolution of the ROH for the mixtures of wa-
ter/acetone and water/acetonitrile upon the addition of cCO2 at high pressure can be
explained by the tendency of these organic solvents of forming hydrogen bonds with wa-
ter. Acetonitrile forms fewer hydrogen bonds with water that does acetone at water-rich
compositions, therefore the formation of water nanodomains in the ternary mixture of
water/acetonitrile/CO2 is easier than in the water/acetone/CO2 system as the interac-
tion between water and acetonitrile is not so strong as the water-acetone interaction [69].
Moreover, in polar CO2-expanded solvents, such as a CO2-expaned acetonitrile, signifi-
182

4.3. Water/Acetonitrile/CO2 system
cant solvent sorting occurs and the presence of CO2 is far more effective at inducing clus-
tering of acetonitrile molecules than of acetone molecules [53].
4.3.3 Microemulsion-like solubilization capacity
As in the case of the acetone/water/CO2 ternary system, the solvent power of the microemulsion-
like was evaluated. The protocol followed was the same as the previous one and it is de-
scribed in Section 6.9.8 of the Experimental Part. In this case, instead of using ibuprofen as
a model drug, the thiadiazoline derivative NP was the compound chosen for probing the
solubilization capacity of the microemulsion-like system composed of water/acetonitrile/CO2.
As described in Chapter 1, NP as ibuprofen, presents very low solubility in water.
In this case, the achievement of a single transparent phase was possible only with the
initial mixture of 60/40 and working with an initial concentration of NP in acetonitrile of
2.2·10−3 mol/mol.
4.3.4 Summary
• A ternary system with a very similar behavior at high pressure to the Water/Acetone/CO2
system has been identified, composed of Water/Acetonitrile/CO2.
• The phase behavior of the Water/Acetonitrile/CO2 at 10 MPa and 308 K has been
experimentally measured. The miscibility of these three components at those con-
ditions is smaller than for the system Water/Acetonitrile/CO2.
• The hydrogen bonding tendency of water molecules has been experimentally mea-
sured by Raman Spectroscopy. In this system, since the first addition of small quan-
tities of CO2, water tends to form clusters.
• The solvation capacity of the domains present at the nanoscale in the system water/
acetonitrile/ CO2 has been tested using a poor water soluble compound, NP. It has
been possible to dissolve this drug in the water-lean domains of the microemulsion-
like system.
183

Chapter 4. Surfactant-free microemulsion-like systems
4.4 Molecular Dynamics Simulations
Molecular Dynamic (MD) simulations consist of solving numerically the equations of mo-
tion for the atoms making up the system wanted to simulate. The simulations were con-
ducted by Dr. Jordi Faraudo from the Instituto de Ciencias de los Materiales de Barcelona,
(ICMAB).
Using MD simulations, an atomistic interpretation of the previous experimental re-
sults on the microemulsion-like behavior of the water/acetone/CO2 ternary mixture can
be provided. The possibility of replacing acetone by other organic solvents has also been
explored. As an example of a representative system of the microemulsion-like behavior
of the mixture water/acetone/CO2, a specific composition of the system for the mixture
water/acetone 50/50 has been considered at 10 MPa and 308 K. This specific composition
has been chosen in the region where Raman Spectroscopy reveals the existence of water
clusters. The point in the ternary system selected has been the one with a ρH20=0.092
mol/mL. In Figure 4.16, a snapshot illustrating the simulation results is shown and in Fig-
ure 4.17 a quantitative structural analysis based on radial correlation functions is pre-
sented.
Figure 4.16: Snaphot from MD simulations of the Water/Acetone/CO2 ternary mixture at
ρH20=0.092 mol/mL, 10 MPa and 308 K. Water and CO2 molecules are shown as spheres
with Van deer Waals radius. Acetone molecules (which form a network across the system)
are shown as a surface calculated using the molecular surface solver of VMD [70] with a 1.4
Å probe radius. The employed color code is red for O, white for H and cyan for C.
184

4.4. Molecular Dynamics Simulations
Figure 4.17: Radial distribution functions calculated from MD simulations of the ternary
Water/Acetone/CO2 mixture (10 MPa and 308K,ρH20=0.092 mol/mL, mixture 50/50) a) Cor-
relations of water (H atom) with: O atoms from acetone (red dashed-dotted line), O atoms
from water (solid black line) O atoms from CO2 (blue dashed line). b)Correlations of C
atoms from CO2 with C atoms from CO2 (solid black line) or C atoms from Acetone (read
dashed-dotted line). CO2-water correlations from the top panel are also reproduced here.
The insets show typical molecular configurations corresponding to the peaks indicated with
arrows.
The observed nanostructuration can be described as follows. There is a (possibly bi-
continuous) network of acetone molecules distributed over the whole system, which con-
tains pockets with hydrogen bonded water molecules. CO2 molecules are distributed ho-
mogeneously across the system but avoiding contact with water rich pockets. The result-
ing structure can be understood by noting that acetone molecules have favorable inter-
actions with both water and CO2 but water and CO2 tend to repel each other. Acetone is
able to make hydrogen bonds with water through the carbonyl group, as demonstrated by
the sharp peak at 1.7 Å in the acetone-water correlation function (Figure 4.17a). Acetone
is also able to interact favorably with CO2 through the apolar methyl groups, as denoted
also by a clear peak in the acetone-CO2 correlation function (Figure 4.17b). The peaks in
the correlation functions also indicate that the acetone-CO2 interaction is not as strong as
the acetone-water interaction. Water molecules are found in partially ordered structures,
evidenced by the presence of two sharp peaks in the correlation function (at 1.8 Å and
3.2 Å). A typical water cluster contributing to the peaks in the correlation function is also
shown in Figure 4.17a. Also, water tends to be anticorrelated with (effectively repelled by)
185

Chapter 4. Surfactant-free microemulsion-like systems
CO2, and the correlation function reaches the value 1 (no correlation) after distances of
about 1 nm. On the other hand, the broad peaks in the CO2 radial correlation functions
shown in Figure 4.17b indicate that CO2 molecules tend to be coordinated both with other
CO2 molecules and acetone molecules. In Figure 4.17b it is also shown a typical config-
uration contributing to these broad peaks in the CO2-CO2 and CO2-acetone correlation
functions. Typically, two or three CO2 molecules (with C-C distance about 4 Å) are found
that are surrounded by acetone molecules (with a peak at a carbon-carbon separation of
4.4 Å).
It is also instructive to compare the simulation results for the ternary water/acetone/CO2
mixture with the results for the binary equimolar mixture acetone-water. Figure 4.18 dis-
plays the comparison of the radial correlation functions in the binary and ternary mix-
tures.
Figure 4.18: a) Comparison between the water (O)-water (H) radial distribution function
obtained in presence (purple line) or absence (red line) of CO2. The black line is calcu-
lated from the simulations of the water/acetone/CO2 ternary mixture (10 MPa and 308
K, ρH20=0.092 mol/mL, mixture 50/50) and the red line from the simulations of the Wa-
ter/acetone equimolar mixture also at 10 MPa and 308 K. b) Comparison between the radial
distribution function between acetone (O atom) and water (H atom) obtained in presence
(black line) or absence (red line) of CO2. The black line is calculated from the simulations of
the water/acetone/CO2 ternary mixture (10 MPa and 308 K, ρH20=0.092 mol/mL, mixture
50/50) and the red line form the simulations of the water/acetone equimolar mixture also
at 10 MPa and 308 K.
Water-water and acetone-water correlation functions show the same features found
here for the ternary system, but the correlation peaks discussed previously have lower
186

4.4. Molecular Dynamics Simulations
values for the binary system. In other words, addition of CO2 increases the estructura-
tion of water and also increases the acetone-water interaction. The comparison between
the acetone hydrogen-oxygen correlation function in the binary and ternary system are
depicted in Figure 4.19. Interestingly, there is more hydrogen bonding between acetone
molecules (higher peaks in the correlation functions) in the binary system. Hence, the ad-
dition of CO2 reduces the mutual correlations between acetone molecules and increases
their interaction with water.
Figure 4.19: Comparison between the radial distribution function between oxygen and hy-
drogen atoms in acetone obtained in presence (black line) or absence (red line) of CO2. The
black line is calculated from the simulations of the water/acetone/CO2 ternary mixture (10
MPa and 308 K, ρH20=0.092 mol/mL, mixture 50/50) and the red line from the simulations
of the water/acetone equimolar mixture also at 10MPa and 308K.
The simulated structure of the system water/acetone/CO2 is depicted in Figure 4.20.
The size of water clusters has been estimated to be approximately around 2 nm. This is
in agreement with the reported values of the size of the domains in surfactant-less mi-
croemulsions systems [49].
MD simulations have also been performed with the ternary system water/acetonitrile/CO2
at 10 MPa and 308 K in order to gain more understanding of the experimental results ob-
tained. In addition, the system ethanol/water/CO2 has also been simulated at the same
conditions of temperature and pressure. The ternary diagram of the latter is reported in
the literature. In this case, the initial mixture of water/ethanol is split into two phases
upon the addition of CO2. However, the nature of the phases is different, and the system
187

Chapter 4. Surfactant-free microemulsion-like systems
Figure 4.20: Simulated structure of the water/acetone/CO2 system at the compositions
where water forms clusters.
breaks into a water and ethanol rich dense phase and a CO2 rich light phase. Based on
this behavior, the formation of water clusters is not expected. The characterization of the
water/ethanol/CO2 by Raman Spectroscopy is not possible as the signal of OH of ethanol
interferes with the OH stretching band of water and it is not possible to measure what
happens to water molecules. However, it has been proven how it is not possible to dis-
solved ibuprofen in the ternary system water/ethanol by adding CO2 as happened in the
water/acetone/CO2 system.
Ethanol and acetonitrile are both miscible with water but their hydrogen bonding ca-
pacity is different. For both systems, a composition of the ternary system very close to
the binodal line but still in the one phase region of the ternary diagram has been chosen
for carrying out the MD simulations at 10 MPa and 308 K. In Figure 4.21, the obtained ra-
dial distribution functions describing water-water, water-organic solvent and water-CO2
correlations are shown for both systems. Comparison of the intensity of the peaks for the
water-water correlations show that water is more structured in the water/acetonitrile/CO2
mixture than in the water/acetone/CO2 system (Figure 4.21) and in turn, these two mix-
tures show more water structure than the water/ethanol/CO2 system. This strong en-
hancement of the water structure in the water/acetonitrile/CO2 mixture is accompanied
by a dramatic decrease in the correlation between water and acetonitrile molecules. The
water hydrogen-acetonitrile nitrogen peak present at about 2 Å indicates some degree of
188

4.4. Molecular Dynamics Simulations
hydrogen bonding but the fact that the correlation function is always g(r)<1 demonstrates
a global tendency of acetonitrile to anticorrelate with water. This effect is observed only
in the case of acetonitrile. Ethanol-water correlations (Figure 4.21) have a similar struc-
ture (but weaker intensity) than those found between water and acetone (Figure 4.21).
MD simulations have provided a theoretical support to justify the experimental Raman
Figure 4.21: Radial distribution functions involving water molecules calculated from MD
simulations of mixtures with different organic solvents. a) ternary Water/Acetonitrile/CO2
(10 MPa and 308 K, ρH20=0.092 mol/mL, mixture 50/50). b)Water/Ethanol/CO2 mixture (10
MPa and 308 K, x(CO2)=0.15, ρH20=0.092 mol/mL, mixture 50/50)).
measurements and the solubilization experiments performed.
4.4.1 Summary
• MD simulations strongly support the experimental results obtained by Raman Spec-
troscopy. MD simulations confirm the formation of water clusters upon the addi-
tion of CO2 at 10 MPa and 308 K over an initial mixture of water/acetone 50/50.
• MD simulations have also been conducting replacing acetone by acetonitrile and
ethanol. The higher structuring takes place in the acetonitrile system, then in ace-
tone and the one with the less water structuration is the ethanol mixture. These re-
sults are in agreement with the experimental ROH calculated from the OH stretching
band of water by Raman Spectroscopy and by the dissolution experiments.
189

Chapter 4. Surfactant-free microemulsion-like systems
190

Bibliography
[1] C. Stubenrauch, ed., Microemulsions: Backgrounds, New Concepts, Applications, Per-
spectives. WILEY, 2009.
[2] T. Hoar and J. Schulman, “Transparent water-in-oil dispersions: The oleopathic
hydro-micelle,” Nature, vol. 152, no. 3847, pp. 102–103, 1943.
[3] P. A. Winsor, “Hydrotropy, solubilisation and related emulsification processes,”
Trans. Faraday Soc., vol. 44, pp. 376–398, 1948.
[4] B. W. Ninham and P. L. Nostro, Molecular Forces and Self Assembly. Cambridge Uni-
versity Press, 2010.
[5] J. H. Schulman, W. Stoeckenius, and L. M. Prince, “Mechanism of formation and
structure of micro emulsions by electron microscopy,” The Journal of Physical Chem-
istry, vol. 63, no. 10, pp. 1677–1680, 1959.
[6] I. Danielsson and B. L. Lindman, “The definition of microemulsion,” Colloids and
Surfaces, vol. 3, no. 4, pp. 391 – 392, 1981.
[7] D. J. McClements, “Nanoemulsions versus microemulsions: Terminology, differ-
ences, and similarities,” Soft Matter, vol. 8, no. 6, pp. 1719–1729, 2012.
[8] M. L. Klossek, Nanostructured Liquids, Colloids and EnviEnvironment Acceptable
Liquid Media. PhD thesis, Universität Regensburg, 2013.
[9] J. L. Anderson, J. Ding, T. Welton, and D. W. Armstrong, “Characterizing ionic liquids
on the basis of multiple solvation interactions,” Journal of the American Chemical
Society, vol. 124, no. 47, pp. 14247–14254, 2002.
191

Bibliography
[10] D. Langevin, “Micelles and microemulsions,” Annual Review of Physical Chemistry,
vol. 43, no. 1, pp. 341–369, 1992.
[11] L. E. Scriven, “Equilibrium bicontinuous structure,” Nature, vol. 263, pp. 123–125,
Sept. 1976.
[12] K. Shinoda and H. Kunieda, “Conditions to produce so-called microemulsions: Fac-
tors to increase the mutual solubility of oil and water by solubilizer,” Journal of Col-
loid and Interface Science, vol. 42, no. 2, pp. 381 – 387, 1973.
[13] B. Lindman, K. Shinoda, U. Olsson, D. Anderson, G. Karlström, and H. Wennerström,
“On the demonstration of bicontinuous structures in microemulsions,” Colloids and
Surfaces, vol. 38, no. 1, pp. 205 – 224, 1989.
[14] Y. Gao, S. Wang, L. Zheng, S. Han, X. Zhang, D. Lu, L. Yu, Y. Ji, and G. Zhang, “Mi-
croregion detection of ionic liquid microemulsions,” Journal of Colloid and Interface
Science, vol. 301, no. 2, pp. 612 – 616, 2006.
[15] C. Solans, Microemulsions in cosmetic, Industrial Applications of Microemulsions.
Marcel Dekker, 1997.
[16] M. Lawrence and G. Rees, “Microemulsion-based media as novel drug delivery sys-
tems,” Advanced Drug Delivery Reviews, vol. 45, no. 1, pp. 89–121, 2000.
[17] S. Wellert, M. Karg, H. Imhof, A. Steppin, H.-J. Altmann, M. Dolle, A. Richardt, B. Tier-
sch, J. Koetz, A. Lapp, and T. Hellweg, “Structure of biodiesel based bicontinuous mi-
croemulsions for environmentally compatible decontamination: A small angle neu-
tron scattering and freeze fracture electron microscopy study,” Journal of Colloid and
Interface Science, vol. 325, no. 1, pp. 250 – 258, 2008.
[18] V. Dwarakanath and G. A. Pope, “Surfactant phase behavior with field degreasing
solvent,” Environmental Science & Technology, vol. 34, no. 22, pp. 4842–4848, 2000.
[19] M. Lopez-Quintela, C. Tojo, M. Blanco, L. G. Rio, and J. Leis, “Microemulsion dynam-
ics and reactions in microemulsions,” Current Opinion in Colloid & Interface Science,
vol. 9, no. 3âAŽÃDÃn4, pp. 264 – 278, 2004.
192

Bibliography
[20] K. Shinoda, M. Araki, A. Sadaghiani, A. Khan, and B. Lindman, “Lecithin-based mi-
croemulsions: phase behavior and microstructure,” The Journal of Physical Chem-
istry, vol. 95, no. 2, pp. 989–993, 1991.
[21] L. Do, A. Withayyapayanon, J. Harwell, and D. Sabatini, “Environmentally friendly
vegetable oil microemulsions using extended surfactants and linkers,” Journal of
Surfactants and Detergents, vol. 12, no. 2, pp. 91–99, 2009.
[22] J. Eastoe, C. Yan, and A. Mohamed, “Microemulsions with co 2 as a solvent,” Current
Opinion in Colloid and Interface Science, vol. 17, no. 5, pp. 266–273, 2012.
[23] K. P. Johnston, K. L. Harrison, M. J. Clarke, S. M. Howdle, M. P. Heitz, F. V. Bright,
C. Carlier, and T. W. Randolph, “Water-in-carbon dioxide microemulsions: An envi-
ronment for hydrophiles including proteins,” Science, vol. 271, no. 5249, pp. 624–626,
1996.
[24] C. Stubenrauch, T. Sottmann, R. Strey, and I. Lynch, “Comment on "gelation of mi-
croemulsions and release behaviour of sodium salicylate from gelled microemul-
sions" [eur. j. pharm. biopharm. 71 (2009) 297],” European Journal of Pharmaceutics
and Biopharmaceutics, vol. 72, no. 3, p. 632, 2009.
[25] M. Sagisaka, S. Iwama, S. Hasegawa, A. Yoshizawa, A. Mohamed, S. Cummings,
S. Rogers, R. Heenan, and J. Eastoe, “Super-efficient surfactant for stabilizing water-
in-carbon dioxide microemulsions,” Langmuir, vol. 27, no. 10, pp. 5772–5780, 2011.
[26] M. J. Clarke, K. L. Harrison, K. P. Johnston, and S. M. Howdle, “Water in supercritical
carbon dioxide microemulsions: Spectroscopic investigation of a new environment
for aqueous inorganic chemistry,” Journal of the American Chemical Society, vol. 119,
no. 27, pp. 6399–6406, 1997.
[27] S. Ray and S. Moulik, “Phase behavior, transport properties, and thermodynamics of
water/aot/alkanol microemulsion systems,” Journal of Colloid And Interface Science,
vol. 173, no. 1, pp. 28–33, 1995.
[28] J. Eastoe, Z. Bayazit, S. Martel, D. C. Steytler, and R. K. Heenan, “Droplet structure in
a water-in-co2 microemulsion,” Langmuir, vol. 12, no. 6, pp. 1423–1424, 1996.
[29] J. Eastoe, C. Yan, and A. Mohamed, “Microemulsions with co2 as a solvent,” Current
Opinion in Colloid & Interface Science, vol. 17, no. 5, pp. 266–273, 2012.
193

Bibliography
[30] J. Zhang and B. Han, “Supercritical co2-continuous microemulsions and com-
pressed co2-expanded reverse microemulsions,” The Journal of Supercritical Fluids,
vol. 47, no. 3, pp. 531–536, 2009.
[31] G. Smith, C. Donelan, and R. Barden, “Oil-continuous microemulsions composed
of hexane, water, and 2-propanol,” Journal of Colloid And Interface Science, vol. 60,
no. 3, pp. 488–496, 1977.
[32] B. Keiser, D. Varie, R. Barden, and S. Holt, “Detergentless water/oil microemulsions
composed of hexane, water, and 2-propanol. 2. nuclear magnetic resonance studies,
effect of added nacl,” Journal of Physical Chemistry, vol. 83, no. 10, pp. 1276–1280,
1979.
[33] N. Borys, S. Holt, and R. Barden, “Detergentless water/oil microemulsions. iii. effect
of koh on phase diagram and effect of solvent composition on base hydrolysis of
esters,” Journal of Colloid And Interface Science, vol. 71, no. 3, pp. 526–532, 1979.
[34] G. Lund and S. Holt, “Detergentless water/oil microemulsions: Iv. the ternary
pseudo-phase diagram for and properties of the system toluene/2-propanol/water,”
Journal of the American Oil Chemists’ Society, vol. 57, no. 8, pp. 264–267, 1980.
[35] M. Zoumpanioti, H. Stamatis, V. Papadimitriou, and A. Xenakis, “Spectroscopic and
catalytic studies of lipases in ternary hexane-1-propanol-water surfactantless mi-
croemulsion systems,” Colloids and Surfaces B: Biointerfaces, vol. 47, no. 1, pp. 1–9,
2006.
[36] Y. Khmelnitsky, A. Van Hoek, C. Veeger, and A. Visser, “Detergentless microemul-
sions as media for enzymatic reactions. spectroscopic and ultracentrifugation stud-
ies,” Journal of Physical Chemistry, vol. 93, no. 2, pp. 872–878, 1989.
[37] J. Drapeau, M. Verdier, D. Touraud, U. Kröckel, M. Geier, A. Rose, and W. Kunz, “Effec-
tive insect repellent formulation in both surfactantless and classical microemulsions
with a long-lasting protection for human beings,” Chemistry & Biodiversity, vol. 6,
no. 6, pp. 934–947, 2009.
[38] B. Keiser and S. Holt, “Reactions in detergentless microemulsions: Incorporation of
copper(ii) into meso-tetraphenylporphine ((tpp)h2) in a water/oil microemulsion,”
Inorganic Chemistry, vol. 21, no. 6, pp. 2323–2327, 1982.
194

Bibliography
[39] C. O’Connor and D. Cleverly, “Bile salt stimulated human milk lipase catalyzed ester
hydrolysis in detergentless microemulsion media,” Biocatalysis and Biotransforma-
tion, vol. 12, no. 3, pp. 193–204, 1995.
[40] M. Zoumpanioti, M. Karali, A. Xenakis, and H. Stamatis, “Lipase biocatalytic
processes in surfactant free microemulsion-like ternary systems and related
organogels,” Enzyme and Microbial Technology, vol. 39, no. 4, pp. 531–539, 2006.
[41] “Green solvents-progress in science and application,” Green Chem., vol. 11, pp. 603–
603, 2009.
[42] J. DeSimone, “Practical approaches to green solvents,” Science, vol. 297, no. 5582,
pp. 799–803, 2002.
[43] G. D. Smith, B. B. Garrett, S. L. Holt, and R. E. Barden, “The interaction of copper(ii)
and n.alpha.-acyl-l-histidinol at the interface of an oil-continuous microemulsion,”
The Journal of Physical Chemistry, vol. 80, no. 15, pp. 1708–1713, 1976.
[44] B. M. Knickerbocker, C. V. Pesheck, L. E. Scriven, and H. T. Davis, “Phase behavior
of alcohol-hydrocarbon-brine mixtures,” The Journal of Physical Chemistry, vol. 83,
no. 15, pp. 1984–1990, 1979.
[45] B. M. Knickerbocker, C. V. Pesheck, H. T. Davis, and L. E. Scriven, “Patterns of three-
liquid-phase behavior illustrated by alcohol-hydrocarbon-water-salt mixtures,” The
Journal of Physical Chemistry, vol. 86, no. 3, pp. 393–400, 1982.
[46] J. E. Pulg, D. L. Hemker, A. Gupta, H. T. Davis, and L. E. Scriven, “Interfacial tensions
and phase behavior of alcohol-hydrocarbon-water-sodium chloride systems,” The
Journal of Physical Chemistry, vol. 91, no. 5, pp. 1137–1143, 1987.
[47] J. Lara, G. Perron, and J. E. Desnoyers, “Heat capacities and volumes of the ternary
system benzene-water-2-propanol,” The Journal of Physical Chemistry, vol. 85,
no. 11, pp. 1600–1605, 1981.
[48] R. Schott and A. Pfennig, “Modelling of mass-transfer induced instabilities at liquid-
liquid interfaces based on molecular simulations,” Molecular Physics, vol. 102, no. 4
PART III, pp. 331–339, 2004.
195
Bibliography
[49] M. Klossek, D. Touraud, T. Zemb, and W. Kunz, “Structure and solubility in
surfactant-free microemulsions,” ChemPhysChem, vol. 13, no. 18, pp. 4116–4119,
2012.
[50] S. Schüttl, J. Marcus, O. Diat, D. Touraud, W. Kunz, T. Zemb, and D. Horinek, “Emer-
gence of surfactant-free micelles from ternary solutions,” Chemical Science, vol. 5,
no. 8, pp. 2949–2954, 2014.
[51] R. Wang, W. Leng, Y. Gao, and L. Yu, “Microemulsion-like aggregation behaviour of
an lcst-type ionic liquid in water,” RSC Advances, vol. 4, no. 27, pp. 14055–14062,
2014.
[52] D. Lavallee, E. Huggins, and S. Lee, “Kinetics and mechanism of the hydrolysis of
chlorophyll a in ternary solvent microemulsion media,” Inorganic Chemistry, vol. 21,
no. 4, pp. 1552–1553, 1982.
[53] P. G. Jessop and B. Subramaniam, “Gas-expanded liquids,” Chemical Reviews,
vol. 107, no. 6, pp. 2666–2694, 2007.
[54] M. Wendland, H. Hasse, and G. Maurer, “Multiphase high-pressure equilibria of car-
bon dioxide-water-acetone,” The Journal of Supercritical Fluids, vol. 7, no. 4, pp. 245–
250, 1994.
[55] J. Elgin and J. Weinstock, “Phase equilibrium at elevated pressures in ternary sys-
tems of ethylene and water with organic liquids. salting out with a supercritical gas,”
Journal of Chemical and Engineering Data, vol. 4, no. 1, pp. 3–12, 1959.
[56] P. Traub and K. Stephan, “High-pressure phase equilibria of the system co2-water-
acetone measured with a new apparatus,” Chemical Engineering Science, vol. 45,
no. 3, pp. 751–758, 1990.
[57] B. Renault, E. Cloutet, H. Cramail, T. Tassaing, and M. Besnard, “On the perturbation
of the intramolecular h-bond in diols by supercritical co2: A theoretical and spectro-
scopic study,” Journal of Physical Chemistry A, vol. 111, no. 20, pp. 4181–4187, 2007.
[58] T. Kawamoto, S. Ochiai, and H. Kagi, “Changes in the structure of water deduced
from the pressure dependence of the raman oh frequency,” Journal of Chemical
Physics, vol. 120, no. 13, pp. 5867–5870, 2004.
196

Bibliography
[59] D. M. Carey, “Measurement of the raman spectrum of liquid water,” Journal of Chem-
ical Physics, vol. 108, no. 7, pp. 2669–2675, 1998.
[60] O. Knauer, M. Lang, A. Braeuer, and A. Leipertz, “Simultaneous determination of the
composition and temperature gradients in the vicinity of boiling bubbles in liquid
binary mixtures using one-dimensional raman measurements,” Journal of Raman
Spectroscopy, vol. 42, no. 2, pp. 195–200, 2011. cited By 9.
[61] M. Sokolova, S. Barlow, G. Bondarenko, Y. Gorbaty, and M. Poliakoff, “Comparison
between ir absorption and raman scattering spectra of liquid and supercritical 1-
butanol,” Journal of Physical Chemistry A, vol. 110, no. 11, pp. 3882–3885, 2006.
[62] G. Walrafen, M. Hokmabadi, and W.-H. Yang, “Raman isosbestic points from liquid
water,” The Journal of Chemical Physics, vol. 85, no. 12, pp. 6964–6969, 1986.
[63] B. Auer and J. Skinner, “Ir and raman spectra of liquid water: Theory and interpreta-
tion,” Journal of Chemical Physics, vol. 128, no. 22, 2008.
[64] G. E. Walrafen, M. R. Fisher, M. S. Hokmabadi, and W. Yang, “Temperature depen-
dence of the lowâAŽ and highâAŽfrequency raman scattering from liquid water,” The
Journal of Chemical Physics, vol. 85, no. 12, pp. 6970–6982, 1986.
[65] J. Manrique and F. Martinez, “Solubility of ibuprofen in some ethanol + water cosol-
vent mixtures at several temperatures,” Latin American Journal of Pharmacy, vol. 26,
no. 3, pp. 344–354, 2007.
[66] D. Suleiman and C. A. Eckert, “Phase equilibria of alkanes in natural gas systems. 2.
alkanes in ethane,” Journal of Chemical & Engineering Data, vol. 40, no. 3, pp. 572–
577, 1995.
[67] M. Munto, N. Ventosa, S. Sala, and J. Veciana, “Solubility behaviors of ibuprofen and
naproxen drugs in liquid "co2-organic solvent" mixtures,” Journal of Supercritical
Fluids, vol. 47, no. 2, pp. 147–153, 2008.
[68] M. Lazzaroni, D. Bush, R. Jones, J. Hallett, C. Liotta, and C. Eckert, “High-pressure
phase equilibria of some carbon dioxide-organic-water systems,” Fluid Phase Equi-
libria, vol. 224, no. 1, pp. 143–154, 2004.
197

Bibliography
[69] D. Venables and C. Schmuttenmaer, “Spectroscopy and dynamics of mixtures of wa-
ter with acetone, acetonitrile, and methanol,” Journal of Chemical Physics, vol. 113,
no. 24, pp. 11222–11236, 2000.
[70] W. Humphrey, A. Dalke, and K. Schulten, “Vmd: Visual molecular dynamics,” Journal
of Molecular Graphics, vol. 14, no. 1, pp. 33–38, 1996.
198
5Conclusions
The work performed in the present Thesis on the use of CO2-expanded solvents method-
ologies for the production of microparticulate materials, either as solids or in an aqueous
suspensions, and on the study of new surfactant-less CO2-based microemulsion-like sys-
tems has driven to the following conclusions:
• DELOS methodology has proven to be an effective method for the one-step prepara-
tion of micron sized solid particles of two poorly soluble compounds. Using ibupro-
fen, as a model drug of poorly water soluble compounds, it has been shown how the
precipitate’s final characteristics can be modulated tuning the process operational
parameters.
• It has been possible to control the extremely fast one-face preferential growth of the
thiadiazoline derivative NP by DELOS method. This active precipitates from con-
ventional cooling in the form of very large needles, presenting as a consequence a
cotton-like appearance. By DELOS, it has been possible to obtained micro particles
of this active avoiding the cotton-like appearance.
199

Chapter 5. Conclusions
• It has been shown the feasibility of producing stable aqueous suspensions of the
thiadiazoline derivative NP and ibuprofen by DELOS-susp with the aid of surfac-
tants with a stability larger than 2 months.
• Using DELOS-susp methodology, it has been possible to reduce more the particle
size of the thiadiazoline derivative NP particles, achieving submicronparticles.
• It has been demonstrated that surfactant-free pressurized microemulsion-like sys-
tems can be formed by adding CO2 to mixtures of water and an organic solvent,
such as acetone or acetonitrile, with high mutual miscibility. The addition of CO2
causes the rupture of the homogeneity of the initial water-organic solvent mixture
and the structuration of the system at the nanoscale.
• The existence of water-rich and water-lean nanodomains in a macroscopically trans-
parent liquid phase has been revealed by Raman spectroscopy, which has been
proven to be a very useful technique to characterize the microenvironment of wa-
ter molecules in these systems. These results are promising since microemulsion-
like systems with compressed CO2 are an effective way to enhance the solubility of
solutes. Surfactant-free CO2-based microemulsion-like systems enable more envi-
ronmentally friendly process routes.
Based on all these conclusions, this Thesis contributes to demonstrate that CO2-expanded
solvents are very attractive eco-efficient alternative for the production of micro and sub-
micron actives.
200

6Experimental Part
6.1 Materials
NP, 4-benzyl-2-(naphtalen-1-yl)-1,2,4-thiadiazoline-3,5-dione, was supplied by Noscira
S.A (Madrid, Spain). Ibuprofen ((RS)-2-(4-(2-methylpropyl)phenyl)propanoic acid) was
obtained from Fagron Iberica (Barcelona, España). Poloxamer F-127, Sodium dodecyl
sulfate (SDS, purity >98.5%) and Polyvinylpyrrolidone (PVP) were purchased from Sigma-
Aldrich (Tres Cantos, Spain). Hydroxypropyl methylcellulose (HPMC) was supplied by
Noscira, S.A (Madrid, Spain). Polysorbate 80 (Tween 80) was obtained by Fluka Analytical
and Gelurice® 44/14 was purchased from Gattefosé, Saint-Priest (Lyon, Francia).
Organic solvent, HPLC grade, were obtained from Teknokroma (Sant Cugat del Vallés,
Spain). The formation of micro emulsion-like systems were conducted using organic sol-
vent reagent grade, also purchased from Teknokroma (Sant Cugat del Vallés, Spain). Car-
bon dioxide (purity 99.9%) was supplied by Carburos Metálicos, S.A. (Barcelona, Spain).
All chemicals were used without further purification. Water was pre-treated with the Mili-
Q Advantage A10 water purification system (MIlipore Ibérica, Madrid, Spain).
201

Chapter 6. Experimental Part
6.2 Solubility analysis
6.2.1 Determination of solubility in organic solvents at atmospheric pres-
sure
Measurements at 298 K, 308 K and 313 K
Solubility of the drug studied in organic solvents at atmospheric pressure was determined
according to the gravimetric method of Gracin and Rasmuson [1] which consists on the
following steps: A solution containing excess solids was placed in a temperature con-
trolled water bath and stirred for 24h. The supersaturated solution was filtered using a
PTFE syringe filter (200nm) and two aliquots of 5mL of the filtered solution were taken.
For each aliquot, the organic solvent was removed using a rotatory evaporator and the
remaining solids were left in a vacuum chamber at room temperature overnight to en-
sure no residual solvent. The amount of solids was determined gravimetrically and the
solubility is reported is moles of drug per mole of organic solvent based on duplicate de-
terminations.
Measurements at low temperature
The protocol used for the determination of the solubility of the drugs at low temperature
is the same described above except that instead of using a water bath a cryogenic bath is
required for achieving low temperatures. For each specific temperature, a different mix-
ture of solvent and liquid nitrogen is employed.
6.2.2 Solubility analysis in pressurized CO2-expanded solvents
Equipment: High pressure phase Analyzer or Variable Volume Cell
Solubility measurements in CO2-expanded solvents were performed in a home-made high
pressure analyzer, which is schematized in Figure 6.1. This systems is equipped with a
variable volume cell (Jergusson liquid level gauge 16T-40) placed inside a thermostatic
air chamber for temperature control. The cell has two opposite borosilicate windows all
along the cell height for visual observation of the cell content and changes in phase be-
havior. A stainless steel cylindrical solid sample holder inserted at the bottom of the cell
prior to pressurization allowed the introduction of additional solids. The cell volume is
202

6.2. Solubility analysis
varied with the movement of a stainless steel piston that is controlled by changing the air
pressure in the pneumatic system. The piston position (0-20 cm) is calibrated for the cor-
responding cell volume using propanol, which varied from 69.5 ml to 92.9 ml without the
solid sample holder and from 66.3 ml to 89.1ml for the case when the solid sample holder
is inserted into the cell. The magnetic stirrer placed at the bottom of the cell led to mixing
of the solids placed in the sample holder with the cell contents.
Figure 6.1: Schematic of the system with the variable volume cell, P, stainless steel pis-
ton, H/C heating/cooling air chamber, P1 recirculation pump, P2 CO2 pump, P3 sol-
vent/solution pump, PRV, pressure reducing vale, PI pressure indicator, TI temperature
transducer, PT pressure transducer, RD rupture disc.
The system is equipped with three pumps: a recirculation pump (P1), which is a mag-
netically driven external gear pump (Micropumo GAH Series, Micropump, Vancuver, WA,
USA) for the recirculation of the cell contents and to ensure good mixing of the mixture, a
syringe pump (P2) (model 260D, Teldyne Isco Inc., Lincoln, NE, USA) to introduce com-
pressed CO2, and a piston pump (P3) (Jasco Inc, Easton, MD, USA) to introduce liquid
solvent or solution at high pressure. The system is also equipped with pressure and tem-
203

Chapter 6. Experimental Part
perature indicators as well as safety devices, such as rupture disks.
Figure 6.2: Images of the Variable Volume Cell
Experimental protocol: Vanishing point method
The phase behavior of NP in acetone, acetonitrile and in the mixtures of acetonitrile and
alcohols were determined according to the Vanishing point method of Wubbols [2] at 10
MPa and at 298 K and 313 K for acetone and acetonitrile and only at 313 K for the mixtures
of alcohols and acetonitrile. At those conditions, an initial mixture composition has to be
selected to ensure the presence of a supersaturated solution at the beginning of each run.
The vanishing point is determined when complete dissolution of the suspended crystals
is achieved by adding pure organic solvent to the expanded mixture. Such solid is in equi-
librium with a saturated phase of itself in a homogenous mixture between two fluids A
and B. The increase of the solvating capacity of A/B binary mixture through the change of
its composition provokes the progressive re-dissolution of the solute. The vanishing point
method is an adequate procedure for performing solubility studies either at atmospheric
pressure, where A and B are conventional solvents, or at high pressure, where A and B can
be a conventional solvent and a compressed fluid.
The steps for obtaining the solubility data and the corresponding solubility curve are
the ones presented below:
1. The piston is settle to its lower position that correspond to the minimum volume
of the cell. If necessary, a known amount of solid is place inside the screw-on cup
204

6.2. Solubility analysis
located at the bottom of the cell. Vacuum is then applied by an external pump and
the thermostated chamber is brought to the desired temperature.
2. Known quantities of solute, organic solvent and CO2 are introduced into the cell to
achieve the desired two phases system (a solid and a liquid phase) at the working
conditions of pressure and temperature selected.
3. Once the starting biphasic point is achieved, pure organic solvent, organic solution
of the solute in the organic solvent or pure CO2 is slowly added to the cell to com-
pletely dissolve the solid and achieve a single phase again. This point corresponds
to the solubility of the compound in the mixture of organic solvent/CO2 at a specific
xW at PW and TW In some cases, the piston reached the highest position before the
complete dissolution of the solute, and a new experiment need to be designed. In
the latter case, the starting point of the new experiment is the final point of the pre-
vious experiment in which the maximum volume of the cell was already achieved.
4. When the vanishing point is determined, the mass balance of the components is
calculated to obtained the value of the compound in the mixture of organic solvent/
CO2.
∗ Modeling
Wubbolts et al. [2] developed a simple empirical model to describe the solubility of
a solute in a CO2-expanded solvent at equilibrium as function of the CO2 concentration,
(xCO2) as follows:
Cs =Cs(or g )(1−xCO2 )A+B xCO2 +Cs(CO2)xCO2 , (6.1)
where Cs(or g ) and Cs(CO2) represent the solute solubility in pure organic solvent and CO2,
respectively. All solubilities are reported in solute-free basis in terms of moles per mole of
solvent mixture as expression indicates:
Cs = ns
nor g +nCO2
(6.2)
205

Chapter 6. Experimental Part
6.3 Preparation of micro and sub microparticles using CO2-
expanded solvents
6.3.1 Preparation of micro and submicroparticles by Precipitation with
a Compressed AntiSolvent, PCA
Equipment
The experimental configuration used for the PCA precipitation experiments is depicted
in Figure 6.3. The configuration include a heat exchange (C1) for cooling CO2 before it
Figure 6.3: Scheme of the equipment employed in the PCA precipitation experiments.
is pumped into the precipitation vessel (R) by a Dosapro Milton Roy high pressure pump
(P2). The flow of CO2 is measured by the flowmeter F1 (Optimassmfm 7150K/01S) and it
is heated by a heat exchange (H1) before it is introduce into the reactor though valve V2.
The organic solution is injected through a hollow cone nozzle (N) (φ=100 µm, Lechlet,
Metzingen, Germany) inside the precipitation vessel using (R) a HPLC pump (P1) (model
PU-2080 from Jasco Inc.,Easton, US). The vessel R has an internal volume of 300mL and is
206

6.3. Preparation of micro and sub microparticles using CO2-expandedsolvents
equipped with an external heating jacket (H2) which enables to control its temperature.
A sintered metal fiber (F0) covered with a PTFE membrane (φ=0.22 µm) is place inside
the autoclave in order to collected the precipitates. If the solids are not filtered by F0,
they are trapped in an external filter (F1) (Headline Filters, Aylesford, UK) which comprise
an internal concentric metal filter covered by a regenerated cellulose membrane (φ=0.22
µm). A back pressure regulator (BP) is used to control the pressure during the experiment.
The depressurization valve, V4, is placed after F1. The last part of the configuration is
the collector (RC) where the CO2-expanded organic solvent is trapped. CO2 is directed
to a filter and then to the atmosphere. The system is also equipped with pressure and
temperature indicators as well as safety devices, such as rupture disks.
Experimental procedure
The preparation of micro and submicronparticles by PCA was conducted using the equip-
ment shown in Figure 6.3 and following the experimental protocol here presented. The
precipitation chamber (R) is filled with CO2 and allow to equilibrate to the operating pres-
sure (PW ) and temperature (TW ). For achieving the desired molar fraction of CO2 the
back pressure valve (BP) is opened and CO2 and pure organic solvent are simultaneously
pumped at a flow ratio that generated the working CO2 molar fraction (xW ) inside the
vessel. After 20 minutes the steady state has been reached and injection of pure organic
solvent is stopped and a certain volume of the organic solution of the compound to pre-
cipitate is sprayed though the hollow cone nozzle (N) at the same flow rate of the pure
solvent, into the current of CO2. The antisolvent effect of the compressed CO2 over the
solution provokes the precipitation of the compound as a particulate solid, which is col-
lected in the pressurized filters F0 and F1. The removal of the possible organic solvent
traces in the solid is carried out by a current of CO2 at the same working conditions of
flow, pressure and temperature during one hour. After depressurization through valve V4,
dried particles are collected from the filters.
6.3.2 Preparation of micro and submicroparticles by DELOS
Equipment
• 100mL
The equipment used for the DELOS precipitation of ibuprofen is schematized in
207

Chapter 6. Experimental Part
Figure 6.4. The configuration comprises a 100 mL reactor. The reactor contains an
external heating jacket for adjusting the desired temperature. CO2 is introduced
by a syringe pump (model 260D, ISCO Inc., Lincoln, US) trough valve VCO2 to the
reactor. There is a micrometric valve, VCO2r to control de flow of CO2. After the re-
actor there is a filter (Gas filter) to collect any solid that could precipitate due to the
antisolvent effect of CO2. The CO2-expaned solution is depressurized through the
depressurization valve, V3. After this valves, there is the DELOS filter, which collects
at atmospheric pressure the particles that precipitate by the large, abrupt and ho-
mogenous decrease in temperature that takes place in DELOS precipitations. There
is a pressure indicator before the depressurization valve to ensure that the system
is equilibrated at the working pressure and a temperate indicator just after valve
V3 to measure the final temperature that reaches the solution. This final tempera-
ture is required for the calculation of the supersaturation during depressurization.
At the end of the configuration there is a plastic bucket where the organic solvent
is trapped. CO2 is directed to a filter and to the atmosphere. The system is also
equipped with pressure and temperature indicators as well as safety devices, such
as rupture disks.
Figure 6.4: Scheme of the 100mL Plant used for the DELOS experiments.
208

6.3. Preparation of micro and sub microparticles using CO2-expandedsolvents
• 300mL
The 300mL plant used for the precipitation of NP by DELOS is shown in Figure 6.5.
In this configuration, CO2 is pumped though a high pressure pump, P1, previously
cooled by a heat exchanger, S1. Before entering into the reactor, R, CO2 is heated
to the working temperature, TW using a second heat exchanger, S2. The flow in-
troduced through V3 is measured using a flowmeter, C. After the reactor, R, there is
a valve, V4 that connects to a filter, F, which is pressurized at the working pressure,
PW in order to separate the solid that could precipitated by the antisolvent effect
of the addition of CO2. After that, there is the depressurization valve, that leads to
another filter or to a systems of filters in parallel when there is a lot of solid, where
the particles produced by DELOS are trapped. The end of the configuration is also
a collector (RC) where the organic solvent is trapped. CO2 is directed to a filter and
then to the atmosphere.
Figure 6.5: Scheme of the 300mL Plant used for the DELOS experiments.
Apart from the differences in volume of the vessel of both configuration, the de-
209

Chapter 6. Experimental Part
pressurization configuration also changed in the 300 mL plant, where the manual
depressurizing valve used in the 100 mL system is substituted by an automatic one,
whose flow rate can be better controlled. In the large plant, the plant is connected
to a computer where a software controls and registers the operating variables.
Experimental procedure
The preparation of micro and submicronparticles of the drugs either in the 100 mL or in
the 300 mL is the same and it is performed according to the following procedure: A vol-
ume of a solution of the drug in an organic solvent is introduced into the reactor, which
has been previously driven to the working temperature (TW ). The volume of the solution
added is calculated in order to have the desired molar fraction of CO2 (xW ). The solution
of the drug in the organic solvent is left inside the reactor for 30min stirring to ensure it
reaches the working temperature. Then, the autoclave is pressurized with compressed
CO2 though valve V3 or VCO2r (300 mL or 100 mL plant respectively), producing a volu-
metric expanded liquid solution. The expanded mixture is left to equilibrate for at least
1hour. The Gas filter is pressurized at the working pressure. The valve that connects the
reactor with the GAS filter is opened. The entry of Nitrogen is opened once the pressure
of the Nitrogen flow is adjusted to the working pressure. The current of Nitrogen at PW is
used as embolus to push down the expanded solution in order to maintain constant pres-
sure in the reactor during depressurization. In this way a homogenous depressurization
is guaranteed.
Calculation of the DELOS yield
The DELOS yield is calculated weighting the mass of the particles precipitated that re-
mains in the DELOS filter divided by the initial mass of the compound charged into the
vessel:
DELOSY i eld(%) = mi
mDELOS, (6.3)
being m1 the mass of the drug in the initial solution and mDELOS the mass of the drug
recovered in the DELOS filter.
210

6.4. Instruments, techniques and procedures used for the characterization ofthe micro and submicronparticles
6.4 Instruments, techniques and procedures used for the
characterization of the micro and submicronparticles
6.4.1 Light Scattering (LS)
Equipment
The volumetric particle size distribution of the precipitates has been assessed by Light
Scaterring (LS) using a particle size analyzer (Mastersizer 2000, Malvern Instruments,
UK). Mastersizer 2000 uses the technique of laser diffraction to measure the size of par-
ticles. It does this by measuring the intensity of light scattered as a laser beam passes
through a dispersed particulate sample. This data is then analyzed to calculate the size of
the particles that created the scattering pattern. Laser diffraction measures particle size
distributions by measuring the angular variation in intensity of light scattered as a laser
beam passes through a dispersed particulate sample. Large particles scatter light at small
angles relative to the laser beam and small particles scatter light at large angles, as illus-
trated in Figure 6.6 . The angular scattering intensity data is then analyzed to calculate
the size of the particles responsible for creating the scattering pattern, using the Mie the-
ory of light scattering. The Mie theory was developed to predict the way light is scattered
by spherical particles and deals with the way light passes through, or is adsorbed by, the
particle. Therefore, the more isotropic is the particle, the best accuracy will be obtained.
Figure 6.6: Scattering angles of different particles sizes.
The equipment gives the results as volume-equivalent sphere diameter, which is the
diameter of a sphere with the same volume as the particle. The volume-equivalent sphere
diameter is the unique way to describe a 3-dimensional object with one number.
Light Scattering technique is a volumetric technique, this means that measures in vol-
ume, therefore the most accurate way to present the results is as volumetric particle size
211

Chapter 6. Experimental Part
distribution. The relationship between 1 µm and 10 µm size particles is 1:1000 in the
case of the volume standard even though it is 1:1 for the number standard. Thus, quite a
different impression can be imparted for the particle size distribution of the same mea-
surement target depending on which standard (volume or number) is used. A volumetric
particle size distribution can be converted into a numeric one, however, as Light Scat-
tering measures volume, the transformation entails some error. As can be seen in Figure
6.7, larger particles account for the highest volumetric percentage of the total volume of
particles, and therefore shifts the distribution towards highest values.
Figure 6.7: Volumetric Particle size distributions: Larger particles accounts for the larger
volumetric percentage of the total volume of particles.
The optical system of Masterizer is depicted in Figure 6.8, the one of the left is the red
laser source and the one of the left is the blue light source. The red laser gets bent 90◦
degrees with some precision folded optics, and then passes through the measurement
cell, where the laser hits the particles, and particles scatter light. This scattered light is
recorded in the circle plane detectors with narrow angles, as well as in the side and back
detectors. In this way, it is possible to capture a wide angle range that allow to measure
a wide particle size range. As particle size limits depends on the wavelength applied, an
additional blue light source is included in the optical system to extend the resolution to
the finest particles. The scattered light is only captured in the high angles detectors, (side
and backs detectors), as no information is recorded in the focal plane detectors.
Mie theory requires knowledge of the optical properties of both the sample being mea-
sured and the dispersant medium.
212

6.4. Instruments, techniques and procedures used for the characterization ofthe micro and submicronparticles
Figure 6.8: Optical system of Mastersizer, the one on the left is the red laser
Experimental Protocol
A previous treatment of the sample is required: a certain mass of each sample is sus-
pended in a liquid dispersant medium and sonicated (Ultrasons-H, Selecta, Abrera, Spain)
for achieving a homogenous suspensions of the solid in such solvent. The best disper-
sium media for each drug was chosen based on previous experience in Nanomol. The
dispersium media for each drug is presented in Table 6.1 as well as the specification for
the previous treatment of the sample.
Table 6.1: Operating conditions employed for the measurement of particle size distribution
of micro particles by LS
Compounda Dispersant medium IRb (mg/mL)c Surfactant Sonication time(s)
Ibuprofen Ultrapure water 1.33 25/5 Tween80d 600
saturated with ibuprofen
NP Ultrapure water 1.33 25/5 - 600
saturated with NP
a The refractive index used for the solids were 1.7, b Refractive of the dispersant medium,c Mass of drug
per volume of dispersant.d 0.1% vol.
In order to have a representative measurement of particle size distribution, for each
solid obtained, 3 different samples are taken and suspended in their corresponding dis-
persant medium. In addition, the software of Mastersizer 2000 measures 3 times each
sample and gives us a result an average value. Therefore, the values presented in this
213

Chapter 6. Experimental Part
Thesis correspond to an average of 3 samples for the same solid.
The protocol for particle size distribution analysis by LS involves the cleaning for the
system with pure dispersant medium, laser alienation, measuring the dispersant medium
particle size as background and finally measuring the sample. The measures were char-
acterized in volumetric distributions.
6.4.2 Scanning electron microscopy (SEM)
The surface morphology of the particulate materials was studied using a field emission
scanning electron microscope (Quanta 200 FEG-ESEM, FEI, Eindhoven, The Netherlands).
The samples were prepared by direct deposition of the powders onto a carbon tape placed
on the surface of an aluminum stub. The samples were coated with gold for 4 minutes us-
ing a sputter coater (K550x, Emitech, Ashford, UK).
6.4.3 Morphology of particles
Size and Shape of particles were further characterized using the equipment Morphologi
G3 (Malvern Instruments, UK) that use the technique of static image analysis. There are
three essential stages in the measurement process:
• Sample preparation and dispersion
This step is critical to getting good results; spatial separation of individual particles
and agglomerates is the goal. The solid were prepared following the same procedure
as in the Light Scattering measurement (see section 6.4.1). A drop of the suspension
was sealed in between two disk holders.
• Image capture
The instrument captures images of individual particles by scanning the sample un-
derneath the microscope optics, while keeping the particles in focus. The Mor-
phologi G3 can illuminate the sample from below or above, while accurately con-
trolling the light levels.
• Data analysis
The instrument measures a range of morphological properties for each particle.
214

6.5. Preparation of suspensions of micro particles by DELOS-susp
6.4.4 X-ray microdiffraction
The crystalline degree of the prepared materials was characterized by X-ray microdiffrac-
tion using a D8 Advance X-ray diffractometer with a bidimensional detector GADDS (Gen-
eral Area Detector Diffraction System), (Bruker-AXS, Karlsruhe, Germany). A conven-
tional Cu X-ray source and a 0.5nm collimator were used.θ -2θ measurements were per-
formed from 3◦ to 60◦ in 2θ during 900 s.
6.5 Preparation of suspensions of micro particles by DELOS-
susp
6.5.1 Equipment
TThis set-up comprises a 300mL reactor where CO2 is pumped through a high pressure
pump, B-1, which head is cooled by a cooling unit. Before entering the high pressure
vessel, CO2 is heated to the working temperature, TW , using a heat exchanger (TIC). The
amount of CO2 added to the reactor through valve, V1-b, is measured by a mass flowme-
ter, FCO2. The vessel temperature is controlled using an external fluid heating jacket.
After the vessel there is a filter (F-1) pressurized at PW . This filter collects particles that
could precipitate due to the anti-solvent effect of the addition of CO2 when the experi-
mental working conditions are very close to the binodal line. This filter is connected to
the depressurization valve, V8, which is remotely controlled with a computer. After the de-
pressurization valve there is a T-mixer, where the depressurized solution is co-currently
mixed with the aqueous phase. During depressurization the aqueous phase is pumped
at a constant flow by a peristaltic pump, B-3. The aqueous suspension is collected in a
plastic bucket (T).
6.5.2 Experimental procedure
A certain volume of the solution of the drug in the organic solvent (NP in acetonitrile
and ibuprofen in acetone) is placed into the reactor, once the reactor is already warmed
at the working temperature. After 30 min of thermal equilibration, CO2 is introduced to
achieved the desired working pressure (PW ) and molar fraction of CO2 (xW .) After an
hour, the CO2-expanded solution is depressurized through a one-way automatic valve
215

Chapter 6. Experimental Part
Figure 6.9: Scheme of the 300mL Plant used for the DELOS-susp experiments.
into a T mixer, to which a certain volume of water or a aqueous solution of the surfactant
is being pumped. The suspension were collected in a plastic bucket.
6.6 Instruments, techniques and procedures used for the
characterization of the micro suspensions
6.6.1 Light Scattering (LS)
The particle size distribution of the particles presented in the suspensions were measured
by Light Scattering using the Malvern 2000 instrument. When the samples were stable
enough were measured as prepared, there is, no ultrasounds were applied. In cases where
the suspensions were not stable, a volume of 5mL of the suspensions were sonicated (10
min for NP and ibuprofen suspensions).
6.6.2 Turbiscan
Turbiscan technology (Multiple Light Scattering) consists in measuring the backscatter-
ing and transmission intensities versus the sample height in order to detect particle size
change (coalescence, flocculation) and phase separation (sedimentation, creaming). This
technique consists in sending photons (light) into the sample. These photons, after be-
ing scattered many times by objects in suspension (droplets, solid particles, gas bubbles)
216

6.6. Instruments, techniques and procedures used for the characterization ofthe micro suspensions
emerge from the sample and are detected by the measurement device of the Turbiscan.
There are two detectors: one that measure transmission for non opaque samples (0◦ from
light source) and another one that capture the backscattering light for opaque sample
(135◦ from the light source). Backscattering is directly related to the photon transport
man free path. Thus, backscattering intensity depends on particle size and concentra-
tion. Figure 6.10 shows a picture of the configuration of Turbiscan. The detection head
of Turbiscan moves up and down along the cylindrical cell. The detection head scans the
entire length of the sample acquiring transition and back-scattering data each 40µm.
Figure 6.10: Scheme of the Turbiscan equipment.
The software of Turbiscan provides a Turbiscan Stability Index, that is a number re-
lated to the global stability of the sample. It is a quick and easy way to characterize the
sample and enables to compare various formulations.
Turbiscan is used to detect at an early stage creaming or sedimentation phenomena
in order to shorten the ageing test. The spectra are displayed as back scattering intensity
(Y-axis) per cent relative to an external stander and on the X-axis is represented the sam-
ple height in mm. If particles tend to settle down, a progressive fall in concentration at the
sample bottom occurs and this is translated into a progressive fall in backscattering a the
top of the sample (Figure 6.11). Conversely, there is a progressive increase in concentra-
tion at the bottom of the sample and therefore the backscattering increases at the bottom
of the sample.
217

Chapter 6. Experimental Part
Figure 6.11: Scheme how settle down of particles is measured in Turbiscan.
The sample do not required previous treatment, however, it is very important to intro-
duce the sample in Turbiscan just after its preparation. 20 mL of the suspension is placed
inside the Turbiscan cuvettes and the measurement takes place for 8 hour.
6.6.3 Scanning probe microscopy (SEM)
For the direct observation of the particles of the suspensions, a drop of the suspensions
was placed over the surface of an aluminum stub and left under vacuum for 24 hours for
removal of the water and the organic solvent. The samples were coated with gold for 4
minutes using a sputter coater (K550x, Emitech, Ashford, UK).
6.7 Quantification of the excess of organic solvent in the
suspensions:
Acetonitrile content by Headspace- gas chromatography - flame ionization detection
(HS-GC-FID)
Acetonitrile content of suspensions after filtration/re-suspension, diafiltration or ly-
ofilization re-constitution was analyzed by standard addition using a HP 6890 Series II
gas chromatographer dotted with a flame ionization detector (Agilent Technologies, USA)
and a Headspace sampler (Module 7964, Agilent Technologies, USA). 4 mL of plain and
doped samples were placed in 10 mL HS vials for acetonitrile content quantification. The
instrumental parameters corresponding to the Headspace module included an equilibra-
tion time of 15 min, an injection time of 0.5 min and a sampling, loop and transfer line
temperature of 80, 95 and 105◦C, respectively. The chromatographic column used was a
DB624 (30 m x 0.32 mm x 1.8µm i.d) from Agilent and the injection was performed in a 1:2
split mode at 275 ◦C. The temperature program comprised first 45 ◦Cduring 3 min, then
218

6.8. Removal of the excess of organic solvent from the suspensions
a ramp of 30 ◦C/min until 250 ◦Cand finally 2 min at that temperature. Running time was
12 min. The carrier gas was helium (46 cm/s) and the detection temperature 250 ◦C.
6.8 Removal of the excess of organic solvent from the sus-
pensions
6.8.1 Filtration
Part of the as prepared suspension were filtered under vacuum thought a filter paper of
pore size (0.2µm). The solid obtained after filtration was dried under vacuum for at least
48 hours. To make sure all the solvent content was removed, the solids were weighted in
a high precision balance until the same weight was obtained three consecutive times.
6.8.2 Diafiltration
Diafiltration is a tangential flow filtration (TFF) method of washing or removing a perme-
able molecule (impurities, sats, solvents, small proteins, etc) from a solution. The equip-
ment used is the KrossFlo® Research IIi TFF System (KE2i) and is presented in Figure 6.12.
By selecting an appropriate membrane, it is possible to exchange the buffer of a solution.
Tangential Flow Filtration using a hollow fiber membrane is accomplished by pumping
the process solution into the inner diameter of a tubular fiber. In the case of removing
the acetonitrile content of the suspensions, the pores of the membrane walls of the fiber
allow the acetone and water molecules to pass through (permeate), while the particles of
NP are retained in the bulk flow and continues through to the dentate (Figure 6.12). Di-
afiltration occurs by adding the replacement buffer, in this case, miliQ water, to the bulk
flow at the same rate of permeable species.
The typical TFF system includes a pump, pressure measurement device, flow mea-
surement device, process reservoir and hollow fiber filter module. The pump circulates
the process solution from the process reservoir, through the filter and back to the process
vessel at a controlled flow/shear rate. Diafiltration occurs simple by adding the diafiltra-
tion buffer to the circulation directly into the process vessel or within the recirculation
loop.
In order to remove all the excess of acetontitrile in the suspensions of NP, a volume of
10mL of the suspensions were added to the sample container, then it is connected to the
219

Chapter 6. Experimental Part
Figure 6.12: Configuration of the KrossFlo® Research IIi TFF System (KE2i).
column and the buffer reservoir. 6 cycles were required to remove the acetonitrile.
6.8.3 Liofilization
Lyophilization or freeze drying is a process in which water is removed from a product
after it is frozen and placed under a vacuum, allowing the ice to change directly from
solid to vapor without passing through a liquid phase. Lyophilization or freeze-drying
has been done in collaboration with Telstar Company (Terrasa, Spain). The lyophlization
equipment consists of a heating plate and a condenser connect to a vacuum pump. The
process consists of three separate, unique, and interdependent processes:
• Freezing
Proper freezing will ensure a good cake. The objective is to produce a frozen matrix
with sufficient crystal structure to allow the sublimating material to escape. The
freezing was conducted at -55◦Cduring 3 hours.
• Primary drying
220

6.9. Formation of the microemulsions-like systems
The pressure is reduced to a value lower its critical temperature and as a conse-
quence there is a phase transitions from solid to gas: sublimation. Sublimation
drives the unbound moisture out the product. This is usually the longest process. It
was performed at -35◦Cand 0.06 mBar for 33 hours.
• Secondary drying
It is also called, desorption. In this process, the ionically bound water goes out of
the material and this occurs by heating the product. It was carried out at 10◦Cand
lasted 4 hours.
The resulting cakes obtained after lyophilization of the suspensions were well formed and
contained a residual humidity of 0.6% for the suspension with the low amount of surfac-
tant and 0.75% for the suspension with tenfold amount of surfactant.
6.9 Formation of the microemulsions-like systems
6.9.1 Phase behavior analysis
The phase behavior analysis of the systems water/acetone/CO2 and water/acetonitrile/CO2
were performed in the home-made view cell, already described in previous section (sec-
tion ??).
6.9.2 Experimental procedure
A solution of water and the organic solvent is prepared at different molar relationships
50/50, 60/40 and 70/30 water/organic solvent. The solution is added to the cell once is
warmed up to the working temperature (TW ) via the HPLC pump and the amount of so-
lution is measure by difference in mass using a mass balance. The solution is added until
the working pressure (PW = 10MPa) is reached inside the cell. Prior to the addition, the
cell should be completely clean and dried. In order to removed all residual air, the cell
was flushed several times with CO2.
The recirculation pump is switched on and the solution is left to equilibrate for 15 min
to ensure the solution is at the working temperature. After this time, addition of CO2 takes
place working in the mode of constant flow with the ISCO pump. The flow of CO2 is set
to a low value to ensure the system has time to equilibrate and is fixed at 0.1mL/min (at
221

Chapter 6. Experimental Part
atmospheric temperature). The piston is controlled by a software and it is programmed to
ensure 10MPa during the addition of CO2. The software modifies the pneumatic pressure
to let the piston move up increasing the volume to keep pressure inside the cell constant.
The appearance of turbidity is considered the moment where the single liquid phase splits
into 2 different liquid phases. The system is left under mixing for 30 minutes to be sure
that it is the composition of phase boundary.
6.9.3 Raman characterization of the microemulsion-like systems
The Raman characterization of the microemulsion-like systems were conducted in the
Applied Raman Scatterring Lab. of the SAOT center, at the Friedrich-Alexander University
Erlangen-Nürnberg. The acquisition of the Raman spectra of the mixture is performed
directly from the high pressure view cell with an in-house built Raman sensor (Figure 6.13
)
Figure 6.13: Schematic representation of the Variable Volume Cell and the in-house built
Raman sensor.
6.9.4 Variable Volume Cell
A sketch of the experimental setup is shown in Figure 6.13. The optical accessible vessel
is equipped with four borosilicate windows and is made of stainless steel which stands
maximum pressures of 20 MPa and maximum temperatures of 393 K. The volume is ad-
justable between 24 mL and 56 mL by means of a moveable piston. Liquid solvents and
222

6.9. Formation of the microemulsions-like systems
CO2 are fed into the vessel using high pressure high precision syringe pumps from Tele-
dyne ISCO. The amount of fluid pumped into the vessel is computed from the discharged
volume indicated by the pumps in combination with the density of the fed fluids. Inside
the vessel a magnetic stirrer agitates the fluids assuring homogeneous conditions in the
one phase regime of the mixtures. For temperature control the heating jacket of the vessel
was connected to a heating circulator.
6.9.5 Raman Spectrometer
The laser is a frequency doubled Nd:YVO4 continuous wave laser with a maximum power
of 5 W. During the measurements the laser power was set to 250 mW since this power re-
sulted in a sufficient signal-to-noise ratio and did not saturate the detector. The laser was
guided via a glass fiber to the sensor system. At the fiber outlet a convex lens collimated
the laser beam. A short pass filter blocked the wavelengths longer than 532 nm originating
from light matter (SiO2 and impurities) interactions inside the fiber. The collimated laser
beam was focused into the measuring chamber with a lens of 100 mm focal length. This
achromatic lens is used to collimate the backscattered Raman signals. The collimated
signal is focused onto the entrance of an optical fiber bundle by means of an achromatic
lens with a focal length of 200 mm. On the path to the fiber bundle the elastically scat-
tered light is discriminated with an optical density of more than 8 at a long pass-filter
and a beam-splitter. The fiber bundle is used to guide the signals to the spectrograph.
The spectrograph is equipped with a grating of 600 lines mm-1 and used in connection
with an charge coupled device (CCD)-detector. The chip of the detector has a dimension
of 1600 x 400 pixels with a single pixel size of 16 µm x 16 µm. On the vertical axis a full
vertical binning was applied and on the horizontal axis a 4 times pixel binning was used
leading to 400 pixels along the spectral axis covering the wavenumber range from 300 to
3900 cm−1. The quantum efficiency of the back illuminated CCD in the relevant wave-
length region exceeds 0.9. In order to reduce the detector noise the readout speed was set
as slow as possible to 15 kHz and the detector was cooled to 193 K. For signal evaluation
a background noise spectra was taken before every measurement series and subtracted
from every spectrum. Every single data point (spectra and intensity ratios) contained in
the subsequent figures consists of an average of 100 individual measurements. The expo-
sure time of a single measurement was set to 300 ms.
223
Chapter 6. Experimental Part
6.9.6 Experimental procedure
The protocol followed for the Raman characterization of the microemulsion-like systems
is the following. The cell is driven to the working temperature. A certain volume of the
solution composed of water and organic solvent is added to the cell until the working
pressure is reached (10MPa) and is left with stirring for 15 minutes. Then, the addition of
CO2 is conducted also working at constant flow mode. In this case, the pressure is kept
constant inside cell by moving manually the piston. The amount of CO2 added to cell was
250mL/µ (at 0.8◦C). After each addition, the mixture was left to homogenize for 15 min.
After that time, the Raman spectra were recorded.
6.9.7 Calculation of the ROH
The Raman signal contribution of water from the Raman spectrum of the ternary mix-
ture need to be isolated and second, the OH vibration band between 3000 and 3800 cm−1
need to be spectrally divided in a high (non-bound water molecules) and a low wavenum-
ber (bond water molecules) region separated from each other at the isosbestic point [3].
Following the previously made remarks the ratio of both intensities provides information
regarding the development of the hydrogen bonds in the mixture.
For the reported application the deconvolution of the band’s envelope is not neces-
sary, leading to a very simple mathematical treatment of the spectra: The first step of the
post processing is a baseline correction with a polynomial function of degree 4. Second
step is a normalization of all spectra on the Raman-peak of acetone appearing approxi-
mately at 800 cmcm−1 [4]. This peak is indicated as "normalization peak" in Figure 6.16
and was chosen for normalization purposes since it not spectrally interferes with neither
water nor CO2. The characteristic Raman signals of the OH-vibration, the CH-vibration
and of CO2 are exhibited. Besides the CH-peak (acetone) and the OH-band (water) the
CO2-peaks are visible in spectrum. A reliable interpretation of the OH-band Raman sig-
nal requests a purification of the OH-Raman signal from the CH-overlap. To get rid of
that spectral overlap and to evaluate solely the change of the OH-band during the exper-
iments, a spectrum of pure acetone is subtracted from every single Raman spectrum of
the mixtures.
The OH-band is split into a higher wavenumber part Inb , which is assigned to the non-
bound water molecules, and into a smaller wavenumber part Ib , assigned to more bonded
water molecules. Ib covers wavenumbers from 3050 cm−1 to 3450 cm-−1, while nb covers
224

6.9. Formation of the microemulsions-like systems
Figure 6.14: Raman spectra of different mixtures of the ternary system water/acetone/CO2.
Figure 6.15: Raman spectra of different mixtures of the ternary system water/acetone/CO2.
wavenumbers from 3450 cm−1 to 3850 cm−1. The border between the two parts Inb and Ib
is set at the temperature-isosbestic point of the Raman OH stretch vibration of pure liquid
water at 3450 cm−1 [5]. The different OH-bands indicate an increase of Ib with increasing
225
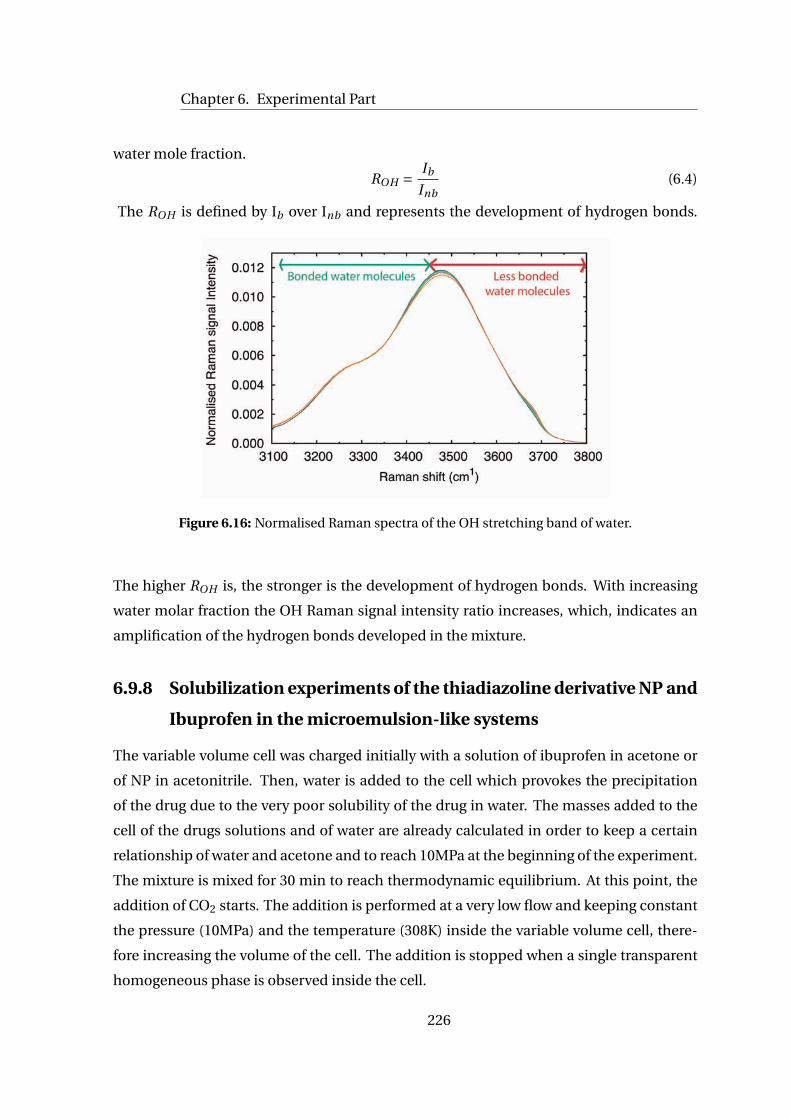
Chapter 6. Experimental Part
water mole fraction.
ROH = Ib
Inb(6.4)
The ROH is defined by Ib over Inb and represents the development of hydrogen bonds.
Figure 6.16: Normalised Raman spectra of the OH stretching band of water.
The higher ROH is, the stronger is the development of hydrogen bonds. With increasing
water molar fraction the OH Raman signal intensity ratio increases, which, indicates an
amplification of the hydrogen bonds developed in the mixture.
6.9.8 Solubilization experiments of the thiadiazoline derivative NP and
Ibuprofen in the microemulsion-like systems
The variable volume cell was charged initially with a solution of ibuprofen in acetone or
of NP in acetonitrile. Then, water is added to the cell which provokes the precipitation
of the drug due to the very poor solubility of the drug in water. The masses added to the
cell of the drugs solutions and of water are already calculated in order to keep a certain
relationship of water and acetone and to reach 10MPa at the beginning of the experiment.
The mixture is mixed for 30 min to reach thermodynamic equilibrium. At this point, the
addition of CO2 starts. The addition is performed at a very low flow and keeping constant
the pressure (10MPa) and the temperature (308K) inside the variable volume cell, there-
fore increasing the volume of the cell. The addition is stopped when a single transparent
homogeneous phase is observed inside the cell.
226

6.9. Formation of the microemulsions-like systems
6.9.9 Molecular dynamics simulations
Molecular Dynamics (MD) simulations are based on the numerical solution of the New-
tonian equations of motion for all atoms of a molecular system constrained to the given
thermodynamic conditions. In our simulations, water was described employing the TIP4P/
2005 model, which is known to correctly reproduce the phase diagram of water both at low
and high pressures [6]. This model is also the best available in reproducing the hydrogen
bonding features of liquid water at all pressures. All other molecules (CO2, acetone, ace-
tonitrile and ethanol) were described using the CGenFF version of the CHARMM force
field.
All MD simulations reported here were performed using the NAMD 2.9 software. The
equations of motion were solved with a 2 fs time step. The temperature was kept constant
at 308 K using the Langevin thermostat with a relaxation constant of 1 ps−1. A constant
pressure of 10 MPa was applied using a isotropic Nosé-Hoover-Langevin piston with stan-
dard NAMD parameters (oscillation period of 100 fs and decay time of 50 fs). Periodic
boundary conditions in all directions were employed in all our simulations. Electrostatic
interactions were computed using the particle mesh Ewald summation method (PME)
with the standard settings in NAMD (1 Å spatial resolution and were updated each 2 time
steps). Lennard-Jones interactions were truncated at 1.2 nm employing a switching func-
tion starting at 1.0 nm.
In all cases, the simulation box contained 1000 water molecules and 1000 organic sol-
vent molecules (ethanol, acetonitrile or acetone). In the case of ternary mixtures with
acetone, simulations with 353 CO2 molecules were considered. Typical simulations have
between 1.0-1.5 Œ104 atoms in a cubic box of lateral size between 50 Å and 55 Å, depend-
ing on the simulation.
In all simulations we performed an initial energy minimization followed by a short
equilibration NPT simulation (typically a few ns) until the simulation box reach a stable,
equilibrium size. Then, we performed 20 ns production run. Typically, only the last 10 ns
of the production run were employed for data analysis. The snapshots of the simulations
and the calculations of the radial distribution functions g(r) were obtained from the MD
trajectories by using the Visual Molecular Dynamics (VMD) software.
227

Chapter 6. Experimental Part
228

Bibliography
[1] S. Gracin and Ã. C. Rasmuson, “Solubility of phenylacetic acid, p-hydroxyphenylacetic
acid, p-aminophenylacetic acid, p-hydroxybenzoic acid, and ibuprofen in pure sol-
vents,” Journal of Chemical & Engineering Data, vol. 47, no. 6, pp. 1379–1383, 2002.
[2] F. Wubbolts, O. Bruinsma, and G. Van Rosmalen, “Measurement and modelling of the
solubility of solids in mixtures of common solvents and compressed gases,” Journal of
Supercritical Fluids, vol. 32, no. 1-3, pp. 79–87, 2004.
[3] P. Geissler, “Temperature dependence of inhomogeneous broadening: On the mean-
ing of isosbestic points,” Journal of the American Chemical Society, vol. 127, no. 42,
pp. 14930–14935, 2005.
[4] G. Dellepiane and J. Overend, “Vibrational spectra and assignment of acetone alfa,
alfa, alfa acetone-d3 and acetone-d6,” Spectrochimica Acta, vol. 22, no. 4, pp. 593–614,
1966.
[5] G. Walrafen, M. Hokmabadi, and W.-H. Yang, “Raman isosbestic points from liquid
water,” The Journal of Chemical Physics, vol. 85, no. 12, pp. 6964–6969, 1986.
[6] C. Vega and J. Abascal, “Simulating water with rigid non-polarizable models: A general
perspective,” Physical Chemistry Chemical Physics, vol. 13, no. 44, pp. 19663–19688,
2011.
229

Bibliography
230

ASolubility values and solubility fitting
curves
A.1 Solubility values
A.1.1 Solubility of ibuprofen in organic solvents at atmospheric pres-
sures and low temperatures
231

Appendix A. Solubility values and solubility fitting curves
Table A.1: Solubility values of ibuprofen in organic solvents at atmospheric pressures and
low temperature
T(K) Cs (mol/mol)
Ethanol Ethyl acetate Acetone Acetonitrile
193 0.0042 0.0000 0.0000 0.0010
213 0.0048 0.0095 0.0148 0.0020
233 0.0099 0.0162 0.0301 0.0070
283 0.1325 0.1404 0.1656 0.0080
288 0.1712 0.1780 0.2012 0.0199
293 0.1982 0.2281 0.2490 0.0304
303 0.3175 0.3675 0.3825 0.0607
308 0.4987 0.4651 0.4633 0.1014
A.1.2 Solubility values of the thiadiazoline derivative NP in CO2-expanded
mixtures
The solubilities values that have been obtained by the Vanishing point method for achiev-
ing the solubility curve of NP in acetone/ CO2 at 10MPa and 298K and 313K, acetonitrile/
CO2 at 10MPa and 298K and 313K, and in the CO2-expanded mixtures of methanol/ ace-
tonitrile 30/70 (molar relationship) and n-butanol/acetonitrile 30/70 (molar relationship)
at 10MPa and 313K are reported in Table A.2. The values of solubility in pure acetone,
acetonitrile and in the mixtures of methanol/ acetonitrile and n-butanol/ acetonitrile has
been obtained following the method described in Section 6.2.1.
232

A.1. Solubility values
Table A.2: Solubility values of NP in different CO2-expanded mixtures of different compo-
sitions at Pw =10MPa and different temperatures.
Acetone
298K 313K
xW Cs (mol/mol) xW Cs (mol/mol)
0.00a 0.007680 0.00a 0.0104668
0.25 0.004050 0.20 0.0067287
0.35 0.002810 0.40 0.0037382
0.52 0.001106 0.60 0.0011962
0.62 0.000740 0.80 0.0007476
0.75 0.000230 1.00 0.0000000
1.00 0.00000 - -
Acetonitrile
298K 313K
xW Cs (mol/mol) xW Cs (mol/mol)
0.00a 0.003940 0.00a 0.0104668
0.40 0.001550 0.20 0.0067287
0.50 0.001130 0.40 0.0037382
0.64 0.000717 0.60 0.0011962
0.84 0.000179 0.80 0.0007476
1.00 0.000000 1.00 0.0000000
Methanol/Acetonitrile n-butanol/Acetonitrile
313K 313K
xW Cs (mol/mol) xW Cs (mol/mol)
0.00a 0.00239 0.00a 0.00523
0.40 0.00155 0.42 0.00358
0.50 0.00119 0.50 0.00284
0.54 0.00095 0.54 0.00179
0.78 0.00035 0.90 0.00029
1.00 0.00000 1.00 0.00000
233
Appendix A. Solubility values and solubility fitting curves
A.2 Solubility fitting curves
∗ Solubility curve of the thiadiazoline derivative NP in CO2-expanded acetone at 298K
and 10MPa
Cs =Cs(or g )(1−xCO2 )2.02+0.903∗xCO2 , (A.1)
∗ Solubility curve of the thiadiazoline derivative NP in CO2-expanded acetone at 313K
and 10MPa
Cs =Cs(or g )(1−xCO2 )1.93+0.33∗xCO2 , (A.2)
∗ Solubility curve of the thiadiazoline derivative NP in CO2-expanded acetonitrile at
298K and 10MPa
Cs =Cs(or g )(1−xCO2 )2.01−0.44∗xCO2 , (A.3)
∗ Solubility curve of the thiadiazoline derivative NP in CO2-expanded acetonitrile at
313K and 10MPa
Cs =Cs(or g )(1−xCO2 )0.77+0.68∗xCO2 , (A.4)
∗ Solubility curve of the thiadiazoline derivative NP in CO2-expanded methanol/acetonitrile
at 313K and 10MPa
Cs =Cs(or g )(1−xCO2 )0.417+1.22∗xCO2 , (A.5)
∗ Solubility curve of the thiadiazoline derivative NP in CO2-expanded butanol/acetonitrile
at 313K and 10MPa
Cs =Cs(or g )(1−xCO2 )1.34+4.75∗xCO2 , (A.6)
234

Publications
∗ Sala, S.; Cordoba, A.; Moreno-Calvo, E.; Elizondo, E.; Munto, M.; Rojas, P. E.; Lar-
rayoz, M. A. A.; Ventosa, N. & Veciana, J. "Crystallization of Microparticulate Pure
Polymorphs of Active Pharmaceutical Ingredients Using CO2-Expanded Solvents."
Crystal Growth & Design, 2012, 12, 1717-1726.
∗ Rojas, P.E.; Hankel, R.; Cano-Sarabia, M.; Sala, S.; Veciana, J.; Braeuer, A. & Ventosa,
N. "Surfactant-free CO2-based microemulsion-like systems." Chemical Communi-
cations, 2014, 50, 8215-8218.
∗ Rojas, P. E.,Sala, S, Elizondo, E., Veciana J.,Ventosa N. "Particle engineering with
CO2-expanded solvents: the DELOS platform". Chapter included in Advances in
Organic Crystal Chemistry: Comprehensive Reviews 2015.
∗ Rojas,P.E., J.Shuster, R.Hankel, J.Veciana, J.Faraudo, A.Brauer, N.Ventosa, "Exploring
new possibilities of CO2-based surfactant-free microemulsion-like systems" Lang-
muir, in preparation.
∗ Rojas, P. E., Sala, S, Elizondo, E., Veciana J.,Ventosa N, "Preparation of suspensions
of microparticles of a very poorly water soluble drug by one-step procedure using
CO2-expanded solvents" Pharma Ress, in preparation.
235


![Trabajo de jordi labanda[1]](https://img.pdfslide.net/doc/110x75/5594ff6e1a28aba3428b4637/trabajo-de-jordi-labanda1.jpg)