Embed Size (px)
Citation preview

PAVEMENT FAILURE ANALYSIS EXAMPLE PROBLEMS
by
J. A. Epps and F. N. Finn
Research Report 214-20 Research Study 2-9-74-214
Engineering, Economy and Energy Considerations in Design, Construction and Materials
Sponsored by the State Department of Highways
and Public Transportation
July 1980
TEXAS TRANSPORTATION INSTITUTE The Texas A&M University System
College Station, Texas


TABLE OF CONTENTS
INTRODUCTION
NORTH TEXAS PAVEMENT
Pavement Distress Possible Causes of Distress Historical Records
Pavement Structural Section Construction Records
FIELD TESTING
Dynaf1ect Trench Core Samples
LABORATORY TESTING
Division D-9 Texas Transportation Institute
CONCLUSIONS
WEST TEXAS PAVEMENT
Pavement Distress Possible Causes of Distress Historical Records
Pavement Structural Section Construction Records
Field Testing Laboratory Testing Overlay Thickness Requirement Rehabilitation Alternatives Conclusions
CONCLUSIONS AND RECOMMENDATIONS
1
3
3 3 3
3 3
5
5 6 7
7
7 9
11
12
12 12 12
12 13
13 13 14 15 15
16

INTRODUCTION
When pavements fail prematurely it is often in the best interest
of the owner agency to identify the probable cause. Based on findings
from these investigations it will be possible to initiate corrective
procedures to avoid continuing problems of similar types. These cor
rective actions may require changing an altering existing design,
construction, material testing methods and/or specification acceptance
criteria.
The reliability of a failure analysis will vary depending on the
information available. In some cases the cause of failure will be
obvious, such as truck loads (number and weight) having increased
significantly above expected levels. In many cases the analysis will
not be so straightforward and a more in-depth study will be necessary
to identify the factors responsible for the undesirable pavement per
formance. Thus, the investigation can be planned and conducted at two
levels; (1) an evaluation of data which requires a minimum of additional
testing and depends largely on design and construction records plus
comparisons with current observations, and (2) an in-depth evaluation
and analysis which would require further field and laboratory testing
based on the findings from records and observations.
In some cases the major concern will be rehabilitation of an in
service distressed pavement. Depending on the circumstances, a failure
investigation mayor may not be appropriate. If there is nothing
unusual about the occurrence of distress the main concern will be the
selection of appropriate rehabilitation procedures. However, if the
occurrence of distress is considered unusual it may be useful toconduct
1
a failure investigation before selecting a rehabilitation procedure.
The purpose of such an investigation would be to minimize any adverse
effects of the original construction on the performance of therehabili
tated pavement.
Generally, engineers will have several options available for reha
bilitation of a specific pavement. These options will depend on the
functional class of roadway, traffic current condition, environment
and service requirements. In choosing from among the various rehabili
tated alternatives three factors should be evaluated; (1) pavement
performance, (2) costs, and (3) energy requirements. Inherent in these
considerations are reliability, user convenience and budgeting
restraints.
Pavement failure analysis procedures have been outlined in a series
of reports prepared in project 214. These reports are listed below.
Report 214-16
Report 214-17
Reprot 214-18
Guidelines for Flexible Pavement Fqilure Investigations.
Pavement Failure Analysis With Guidelines for Rehabilitation of Flexible Type Pavement.
Costs Associated with Pavements, Construction, Rehabilitation and Maintenance.
Report 214-19 ..... Energy Requirements Associated with Pavement Construction, Rehabilitation and Maintenance.
Two examples of the use of these guidelines are given below. The
first example involves the premature failure of pavement in North Texas.
A detailed laboratory and field testing program was performed to identify
the probable cause of the distress. The second example presented below
involves the establishment of rehabilitation alternatives for a nineteen-
year old pavement in west Texas. Life cycle cost and energy consider-
ations are given together with field and laboratory data which support
the selections of available rehabilitation alternatives.
2
"
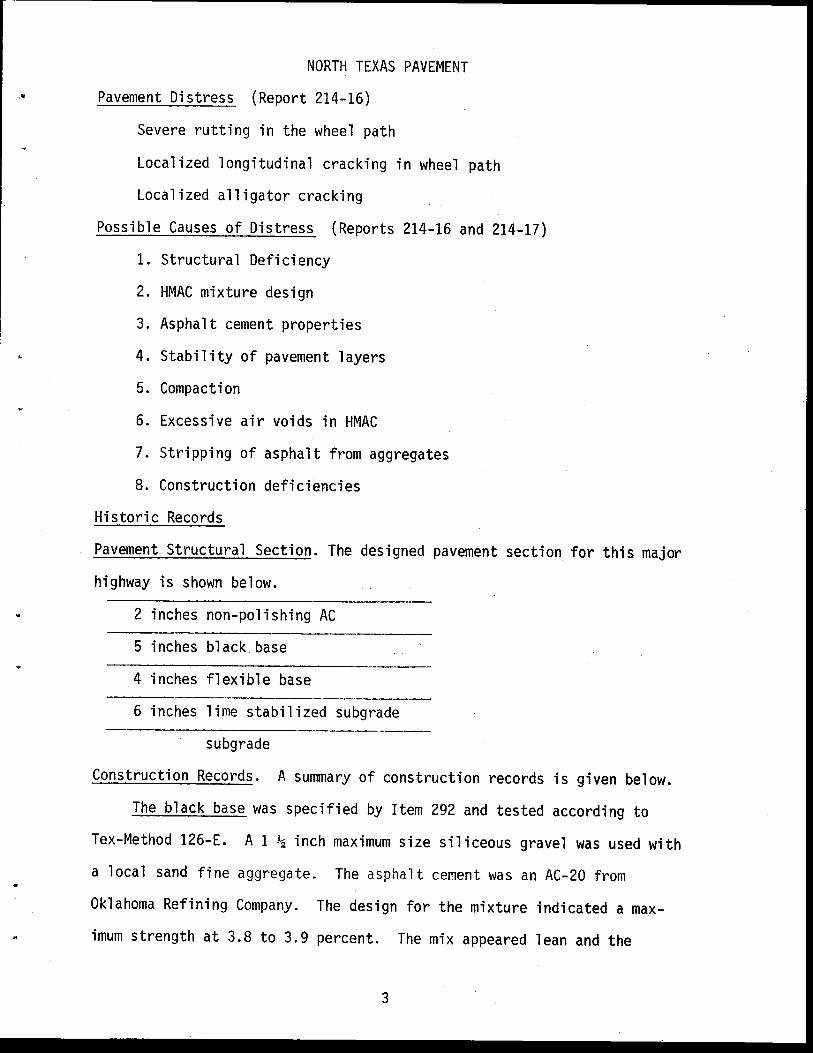
NORTH TEXAS PAVEMENT
Q Pavement Distress (Report 214-16)
Severe rutting in the wheel path
Localized longitudinal cracking in wheel path
Localized alligator cracking
Possible Causes of Distress (Reports 214-16 and 214-17)
1. Structural Deficiency
2. HMAC mixture design
3. Asphalt cement properties
4. Stability of pavement layers
5. Compaction
6. Excessive air voids in HMAC
7. Stripping of asphalt from aggregates
8. Construction deficiencies
Historic Records
Pavement Structural Section. The designed pavement section for this major
highway is shown below.
2 inches non-polishing AC
5 inches black base
4 inches flexible base
6 inches lime stabilized subgrade -------------------------
subgrade
Construction Records. A summary of construction records is given below.
The black base was specified by Item 292 and tested according to
Tex-Method 126-E. A 1 ~ inch maximum size siliceous gravel was used with
a local sand fine aggregate. The asphalt cement was an AC-20 from
Oklahoma Refining Company. The design for the mixture indicated a max
imum strength at 3.8 to 3.9 percent. The mix appeared lean and the
3

asphalt content was increased to 4.2 percent. At this asphalt content
the mixture was borderline on strength (50 psi required for Class 1 black
base). The asphalt content was reduced to 4.0 percent and utilized for
the project. Five percent air voids were obtained in the laboratory
compacted mixtures.
The mixture was produced at 295° for the first few weeks of the job.
The temperature was reduced to 275-2800 F for the remainder of the black
base. Suitable coating was not obtained at 250°F. Compaction was per
formed at 225°F with a steel wheel roller followed by pneumatic rolling.
Field densities of about 95-96% of laboratory density were obtained. Two,
2 ~ inch lifts were placed. Average production was 2000 tons per day.
The haul from the plant to the job averaged 10 miles. Moisture contents
of the mixture were about 0.5 percent.
The asphalt concrete hot mixture was specified by Item 340. The
type 0 asphalt concrete was made with a non-absorptive, non-polishing
sandstone coarse aggregate, sandstone screening, local field sand and
5 percent asphalt cement. The sandstone was obtained from Cyril,
Oklahoma and the AC-20 asphalt cement from Oklahoma Refining company.
One to three percent air voids were obtained in the laboratory; fifty
five percent of the aggregate was retained on the No. 10 sieve.
The mixture was produced at 275-2800 F. Rolling was delayed to
allow the mixture to cool. The high mixing temperature was required to
achieve proper coating. Two l-inch lifts were utilized on part of the
job. The remainder of the job was constructed with a two-inch lift.
Moisture contents of the mixture were about 0.5 percent.
Hot mix construction was performed between March, 1977 and June,
1977, with a new Barber-Greene drum mixer plant rated at 300 tons per
hour. A 200-ton surge silo was also utilized on the job. The surge
4
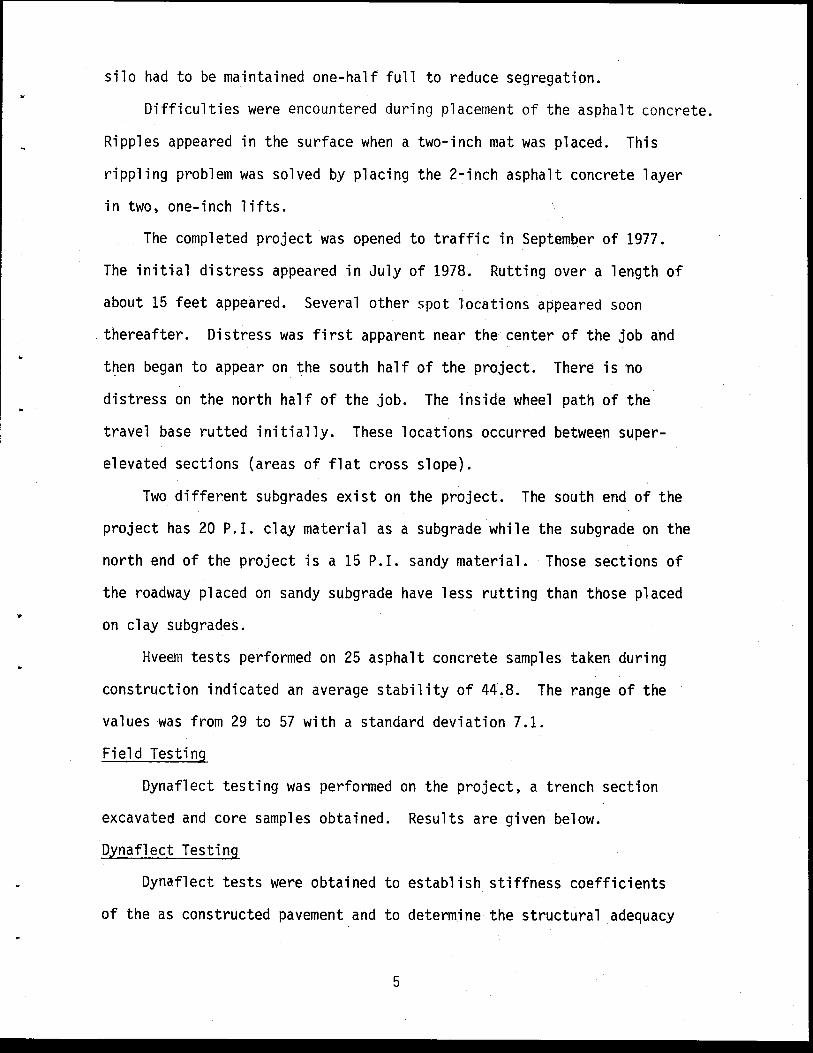
silo had to be maintained one-half full to reduce segregation.
Difficulties were encountered during placement of the asphalt concrete.
Ripples appeared in the surface when a two-inch mat was placed. This
rippling problem was solved by placing the 2-inch asphalt concrete layer
in two, one-inch lifts.
The completed project was opened to traffic in September of 1977.
The initial distress appeared in July of 1978. Rutting over a length of
about 15 feet appeared. Several other spot locations appeared soon
thereafter. Distress was first apparent near th~ center of the job and
then began to appear on the south half of the project. There is no
distress on the north half of the job. The inside wheel path of the
travel base rutted initially. These locations occurred between super
elevated sections (areas of flat cross slope).
Two different subgrades exist on the project. The south end of the
project has 20 P.I. clay material as a subgrade while the subgrade on the
north end of the project is a 15 P.I. sandy material. Those sections of
the roadway placed on sandy subgrade have less rutting than those placed
on clay subgrades.
Hveem tests performed on 25 asphalt concrete samples taken during
construction indicated an average stability of 44.8. The range of the
values was from 29 to 57 with a standard deviation 7.1.
Field Testing
Dynaf1ect testing was performed on the project, a trench section
excavated and core samples obtained. Results are given below.
Dynaflect Testing
Dynaf1ect tests were obtained to establish stiffness coefficients
of the as constructed pavement and to determine the structural adequacy
5

of the designed pavement section.
The pavement structural design was performed using the Flexible
Pavement Design System (FPS) in May of 1976. The inputs to the design
system were obtained from various representative samples and from 0-10
Traffic Counts and Projections.
The original estimated 18,000 lb. equivalent single axle load
repetitions was 2,436,000 for the period 1975-1995. For the projected
traffic the life of the facility is 14years. If the traffic was doubled
to 5,000,000 the predicted life would be decreased by about one half
for the designed section utilized. Increased traffic (over and above
that expected) on the facility by itself is not sufficient to account for
the early deterioration.
The stiffness coefficients assummed for the original design are
shown on Table 1. Stiffness coefficients were determined from Dynaflect
measurements made on the constructed pavement. These are shown for
comparison purposes on Table 1. As constructed values were selected as
shown on Table 1 and the predicted life of the pavement determined by
use of FPS. The predicted life was reduced from 14 to 8 years using
these new coefficients.
Some of the areas of the roadway cored, indicated an asphalt
concrete thickness of only 3/4 inch. For this structural section the
predicted life is only 4 years.
The analysis with the Dynaflect and FPS indicate that traffic by
itself is not sufficient to cause the observed pavement failure.
Trench
A trench was excavated at station 491+50 on April 4, 1979. The
entire outsection line was intersected with the trench. Pavement cross
6
..
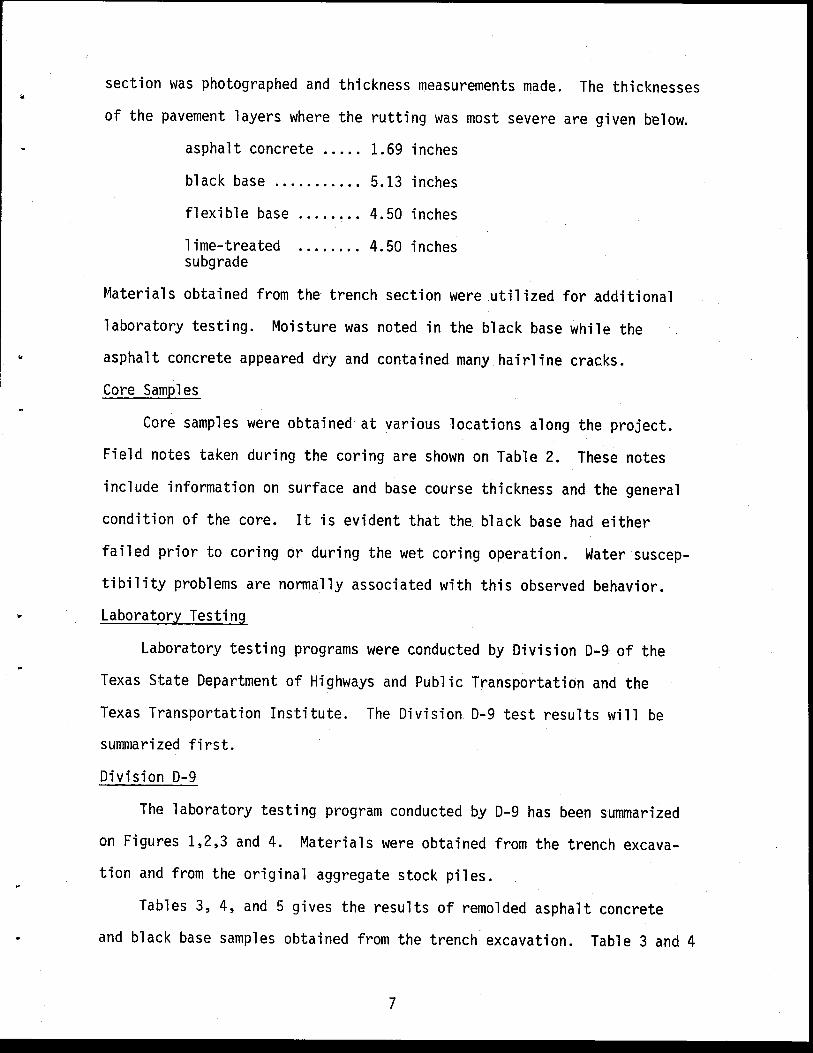
..
section was photographed and thickness measurements made. The thicknesses
of the pavement layers where the rutting was most severe are given below.
asphalt concrete ..... 1.69 inches
black base ........... 5.13 inches
flexible base
lime-treated subgrade
4.50 inches
4.50 inches
t4aterials obtained from the' trench section were utilized for additional
laboratory testing. Moisture was noted in the black base while the
asphalt concrete appeared dry and contained many hairline cracks .
Core Samples
Core samples were obtained at various locations along the project.
Field notes taken during the coring are shown on Table 2. These notes
include information on surface and base course thickness and the general
condition of the core. It is evident that the black base had either
failed prior to coring or during the wet coring operation. Water suscep
tibility problems are normally associated with this observed behavior.
Laboratory Testing
Laboratory testing programs were conducted by Division 0-9 of the
Texas State Department of Highways and Public Transportation and the
Texas Transportation Institute. The Division 0-9 test results will be
summarized first.
Division 0-9
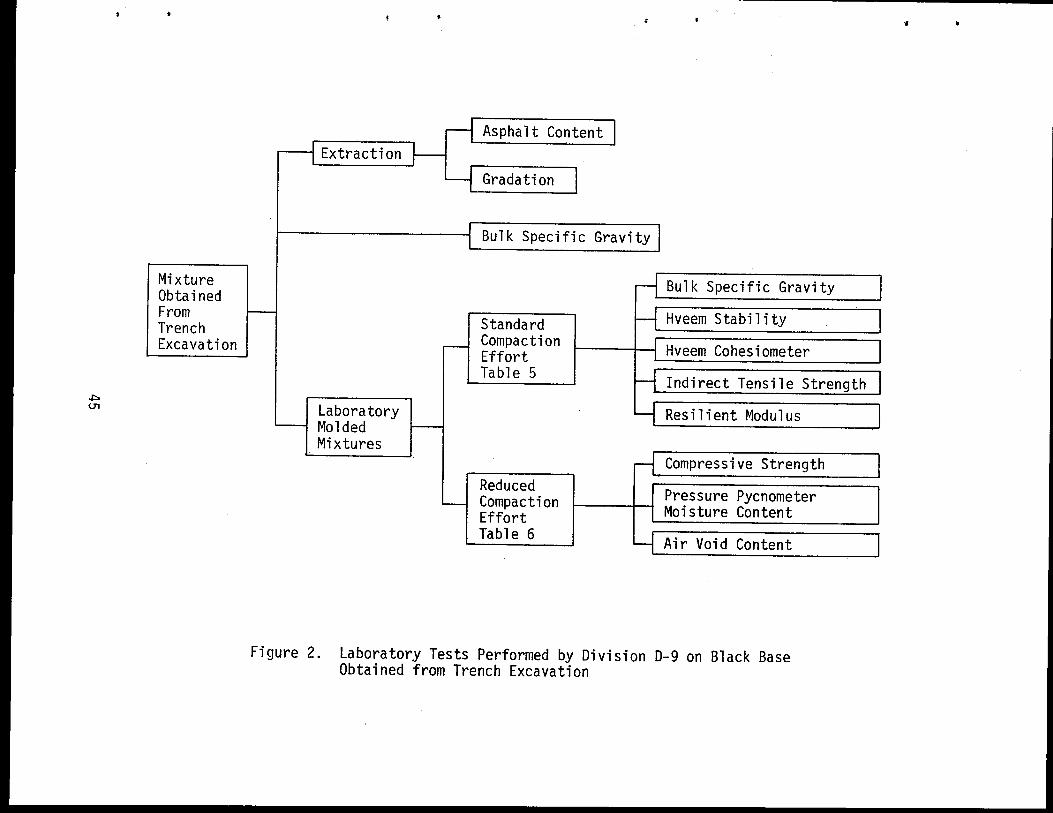
The laboratory testing program conducted by 0-9 has been summarized
on Figures 1,2,3 and 4. Materials were obtained from the trench excava
tion and from the original aggregate stock piles.
Tables 3, 4, and 5 gives the results of remolded asphalt concrete
and black base samples obtained from the trench excavation. Table 3 and 4
7

gives the gradation and asphalt content of the asphalt concrete and black
base respectively. Table 5 shows the remolded mixture properties.
The asphalt concrete mixture meets all gradation specifications except
the minus No. 200 sieve. Additional asphalt was added to the asphalt
concrete to establish an optimum for this mixture (Table 5). The ex
tracted asphalt content of 5.6 is near optimum for this mixture.
Cohesiometer values for both the asphalt concrete and black base are very
high. The resilient modulus of the black base is also exceptionally high.
Table 6 contains results obtained on black base mixtures subjected
to varied compactive efforts (Figure 2). The purpose of this test series
was to establish the effect of density on mixture properties. Strength
increases as density increases and the moisture content increases as
density decreases or air voids increase. The remolded mixture meets all
the requirements of the specifications for strength when molded at the
correct compaction effort. Specimens molded at reduced compactive effort
produced uncoated aggregates.
Samples of aggregates were obtained from the job stockpile and soil
constants were determined (Figure 3). The plastic index was 9 and the
sand equivalent 53. Five percent of the material passed the number 200
sieve. The addition of 1 percent lime reduced the plastic limit to 7 and
the sand equivalent was increased to 70.
The original properties of the asphalt used for the series of labora
tory tests are shown on Table 7. Properties of the asphalt after laboratory
molding and compaction are also shown on the same Table (Figure 3).
Properties of mixture molded from the stockpile aggregate and project
asphalt are shown on Tables 8 and 9 (Figure 3). A series of black base
samples were molded with the large gyratory compactor which contained 1%
8

".
lime and another series which contained 1% of a commerical antistrip
additive (Table 8). The optimum asphalt content is near 4.0 percent
which is the same as that used during construction. The mixture is
relatively insensitive to changes in density caused by the changes in
asphalt content as measured by the unconfined compression test. Both
test speeds indicate a borderline strength for Grade 1 black base.
Both the lime slurry and liquid antistrip additive improved the
unconfined strengths slightly and lowered the amount of moisture absorbed
by a small amount. Test Hethod Tex-126-E is apparently not sensitive
to improvements made in the mixture by adding antistripping agents.
Table 9 contains results of black base mixtures molded with the
small gyratory compactor. Samples were prepared with no additive, 1
percent lime and 1 percent of antistrip additive.
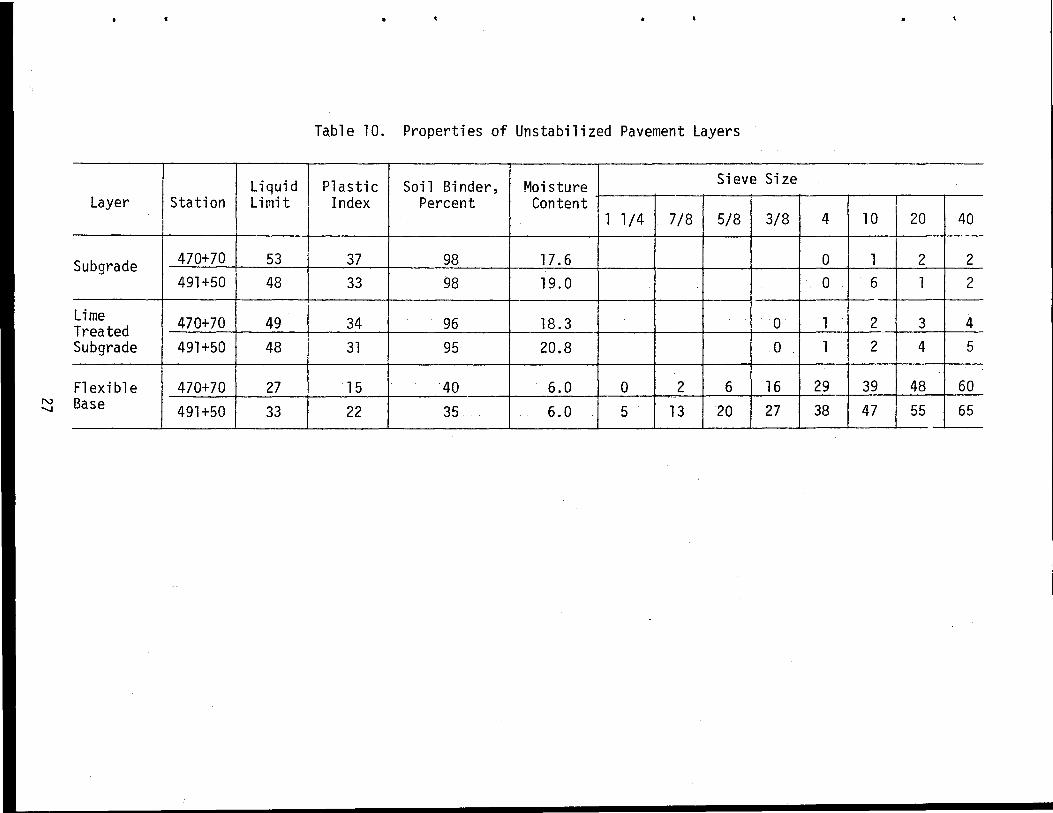
Properties of the subgrade, lime treated subgrade and flexible base
are shown on Table 10 (Figure 4). The subgrade and lime stablized subgrade
contained moisture contents about 4 percentage points above the plastic
limits. Excessive moisture appears to be present in all layers. The lime
was most effective in reducing the plastic index of the subgrade. The
plastic index of the flexible base appears excessive.
Texas Transportation Institute
The laboratory testing program conducted by the Texas Transportation
Institute (TTl) is shown (Figure 5).
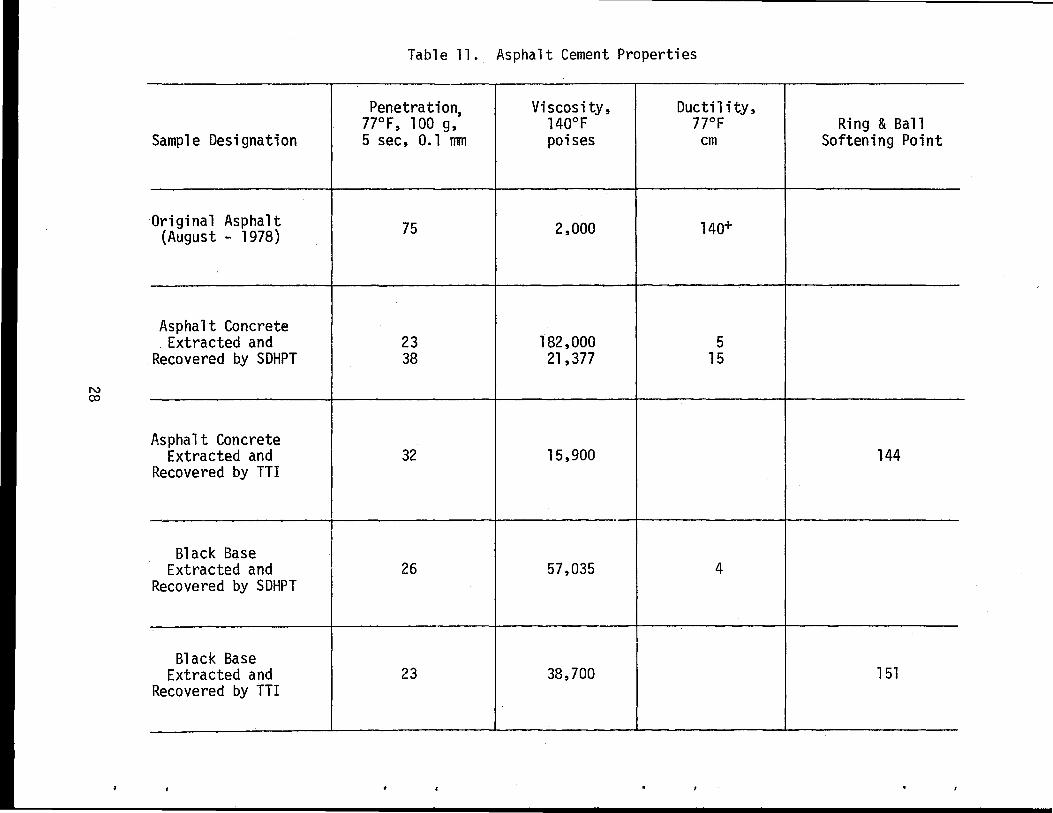
Asphalt Properties
Asphalt properties were obtained on both the original and the extracted
and recovered asphalt. Results are shown in Table 11. Although the results
are limited, it is evident that excessive hardening has occurred. A two to
four fold increase in asphalt viscosity is normally expected during hot
9

mixing, i.e. from 2,000 poises to 4,000 poises.
Mixture Properties
Core samples from the pavement were obtained by use of "dry" coring
techniques. Coring with water was not possible as the water washed the
asphalt off of the aggregate. Core samples were subjected to the test
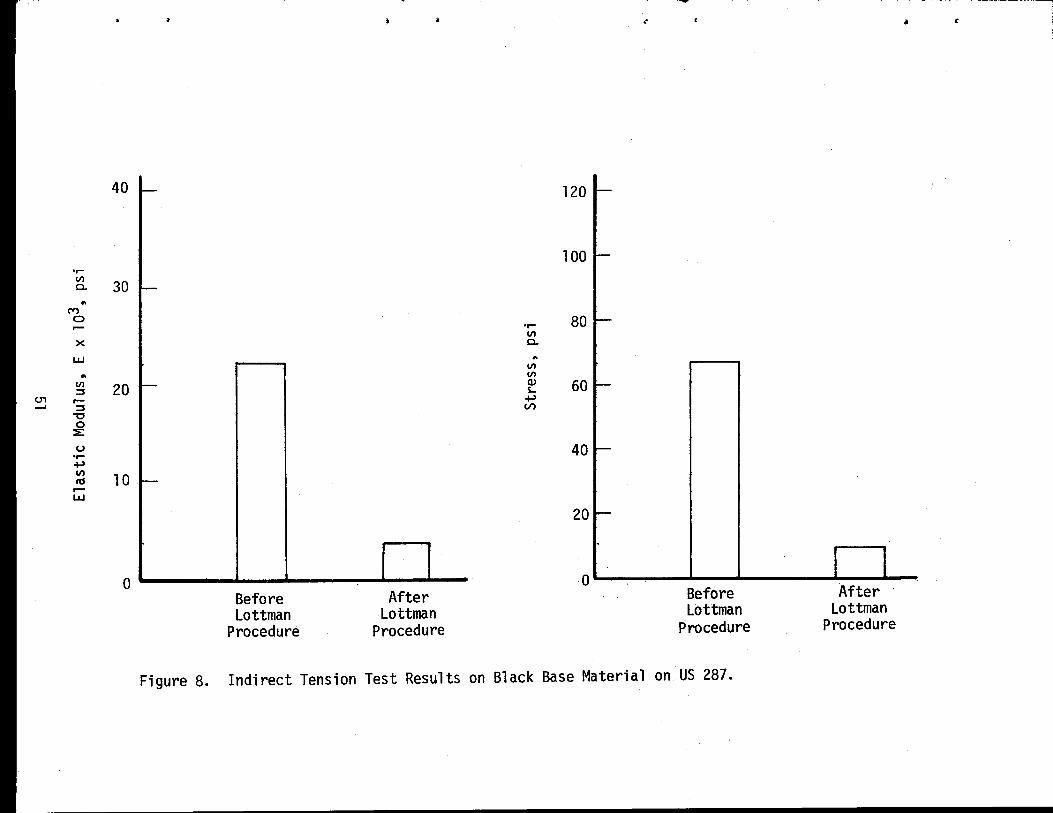
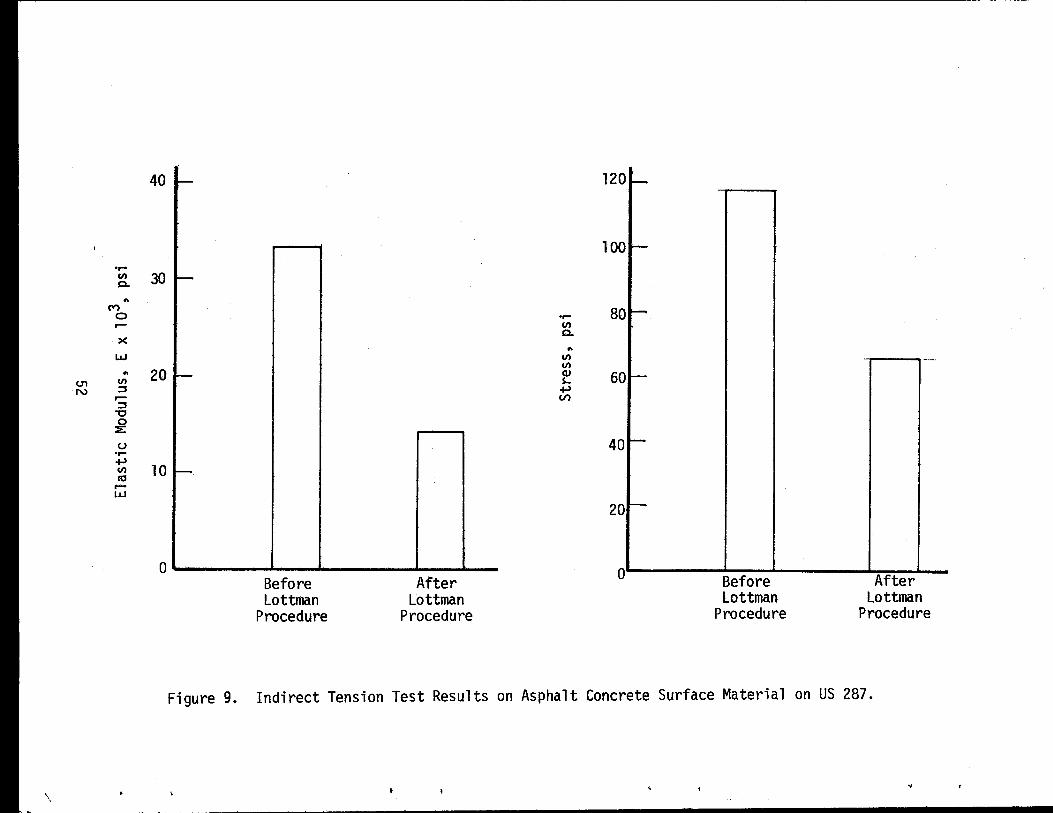
sequence shown in Figure 5. Resilient modulus, indirect tensile strength,
Hveem stability and Marshall stability test results both before and
after water soaking are shown on Figures 6 to 10 and Tables 12
to 15.
Two water soaking tests were performed. The test identified as the
7-day soak procedure is performed by first vacuum saturating the samples
for 2 hours and then soaking the samples under water for 7 days. The
Lottman procedure consists of vacuum saturating the samples followed by
subjecting the samples to 18 freeze-thaw cycles (0 to 120°F).
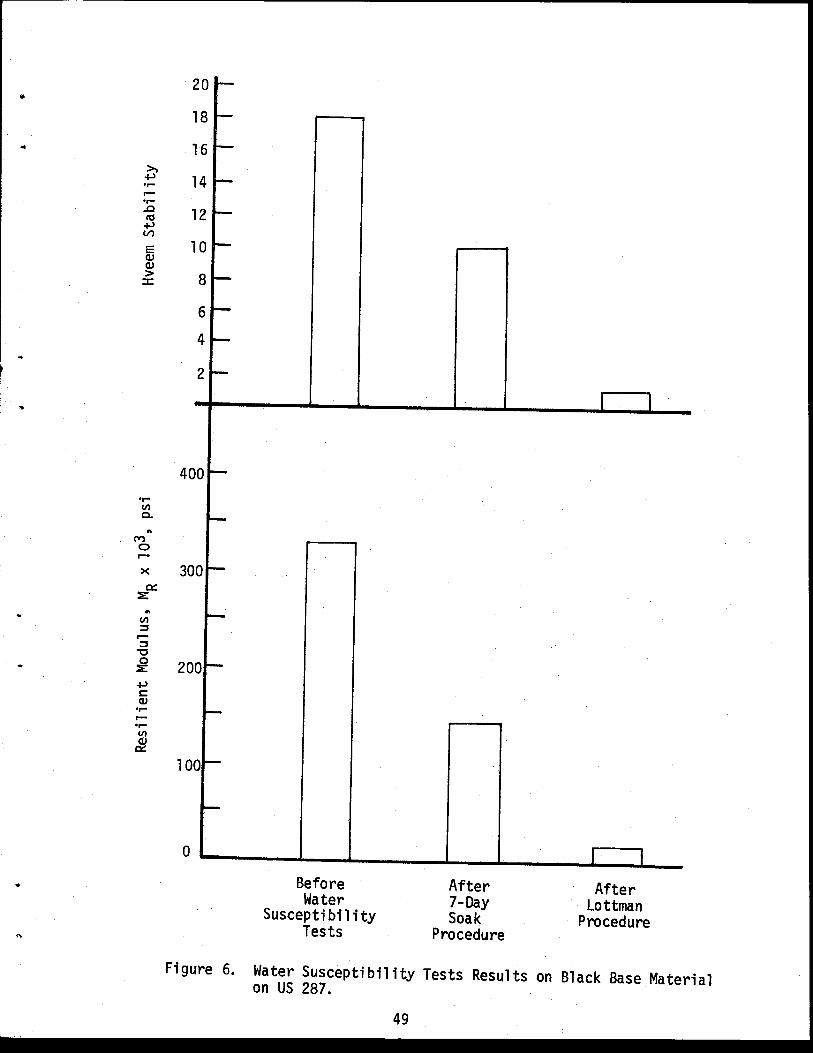
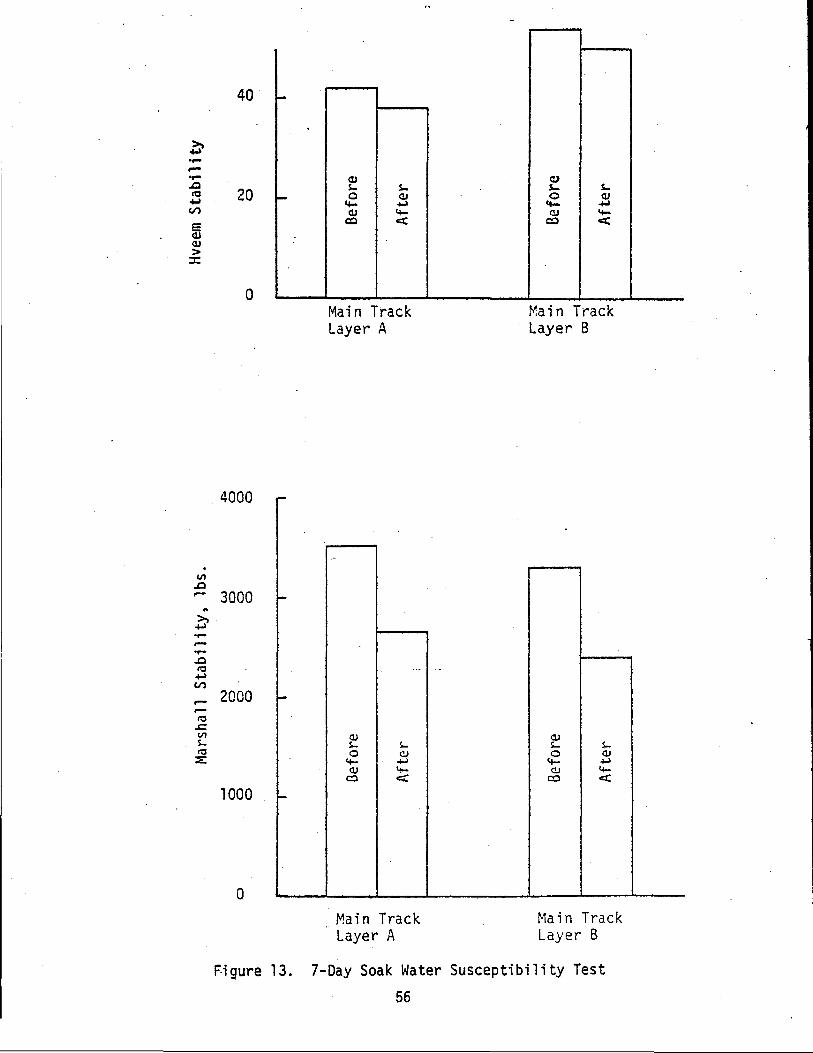
Figures 6, 8 and 10 indicate the water susceptibility of the black
base as measured by the drop in resilient modulus, Hveem stability,
indirect tensile strength and modulus, Marshall stability and Marshall
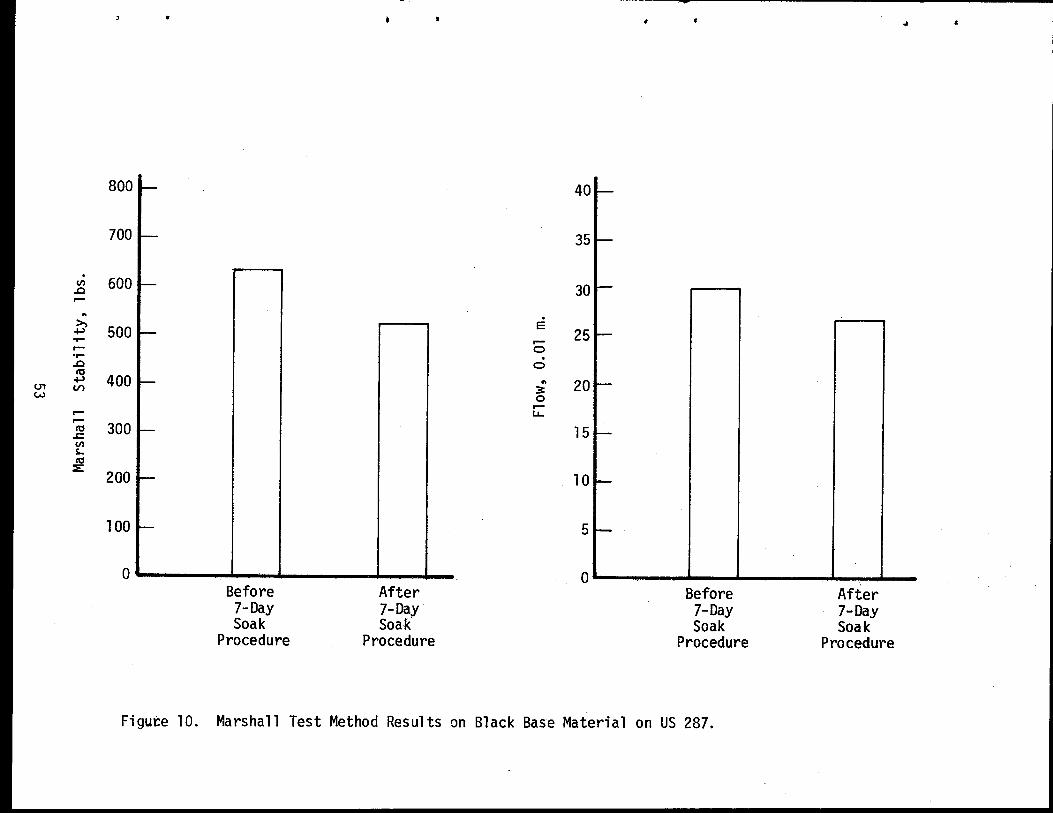
flow. Resilient modulus drops on the order of 30 percent for the 7-day
soak procedure and 50 percent for the Lottman procedure should be
considered evidence of potential water stripping problems. Figures 7 and
9 and Table 12 indicate that the asphalt concrete surface course is not as
sensitive to water as the black base. It should be noted that the average
air void content of the asphalt concrete surface course is 9 percent and
the base courses 7.7 percent (Table 12).
Hveem stability values obtained on the core samples are low for both
the surface and base courses (Figures 6 and 7 and Table 13). Marshall
stability values for the black base are somewhat low, while the flow values
10

far exceed the normal 8 to 18 range.
Conclusions
The black base placed on this project is water susceptible and will
strip in the presence of moisture. The laboratory test results indicating
strength and stability loss in the presence of moisture confirm this state
ment. In addition, coring problems were noted when water was used during
the coring operation. Reports from field patching crews have indicated
that the black base was removed very easily and lacked cohesion.
Stability values obtained on the black base and surface course were
low. These low stabilities contributed to the rutting problem. Relatively
high air void contents (low density) also contribute to the low stabil
ities. The high air void contents in the surface course allow water to
enter the black base from the surface.
The pavement will continue to rut unless it can be adequately sealed.
A surface seal will reduce the rate of rutting. However water has access
to the black base from the flexible base. A free draining flexible base
would have provided improved performance. Accelerated rutting rates can
be expected in the hot, moist summer months.
The water susceptibility test presently utilized as part of test
method 126-E does not adequately define potential stripping problems in
black bases. (Black bases placed in Districts 13 and 15 have similar
problems.) The reason for this lack of sensitivity is not clear; however,
the air void content of the laboratory prepared samples and the technique
utilized to saturate the sample may contribute.
Antistrip additives should be considered for use if stripping is a
potential problem. Lime slurry treatments have proven to be beneficial in
laboratory tests.
11
WEST TEXAS PAVEMENT
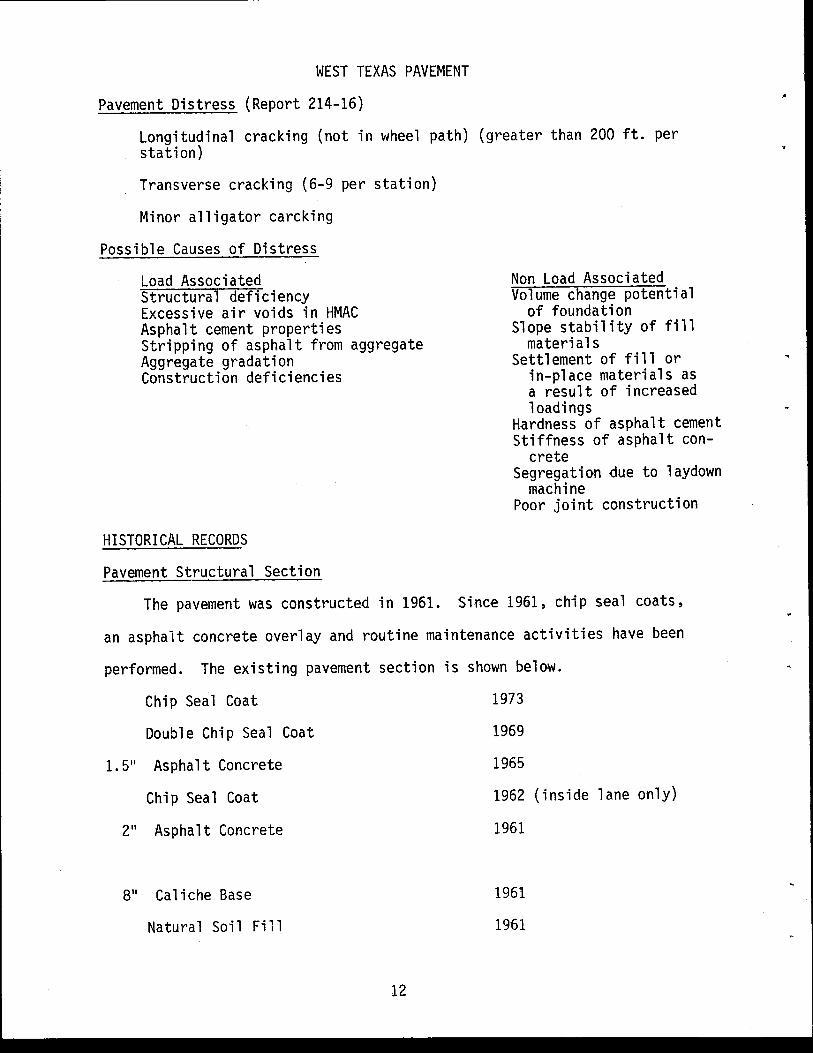
Pavement Distress (Report 214-16)
Longitudinal cracking (not in wheel path) (greater than 200 ft. per station)
Transverse cracking (6-9 per station)
Minor alligator carcking
Possible Causes of Distress
Load Associated Structural deficiency Excessive air voids in HMAC Asphalt cement properties Stripping of asphalt from aggregate Aggregate gradation Construction deficiencies
HISTORICAL RECORDS
Pavement Structural Section
Non Load Associated Volume change potential
of foundation Slope stability of fill
materials Settlement of fill or
in-place materials as a result of increased loadings
Hardness of asphalt cement Stiffness of asphalt con
crete Segregation due to laydown
machine Poor joint construction
The pavement was constructed in 1961. Since 1961, chip seal coats,
an asphalt concrete overlay and routine maintenance activities have been
performed. The existing pavement section is shown below.
Chip Seal Coat
Double Chip Seal
1. 511 Asphalt Concrete
Chip Seal Coat
211 Asphalt Concrete
811 Caliche Base
Natural Soil Fill
Coat
12
1973
1969
1965
1962
1961
1961
1961
(inside lane only)
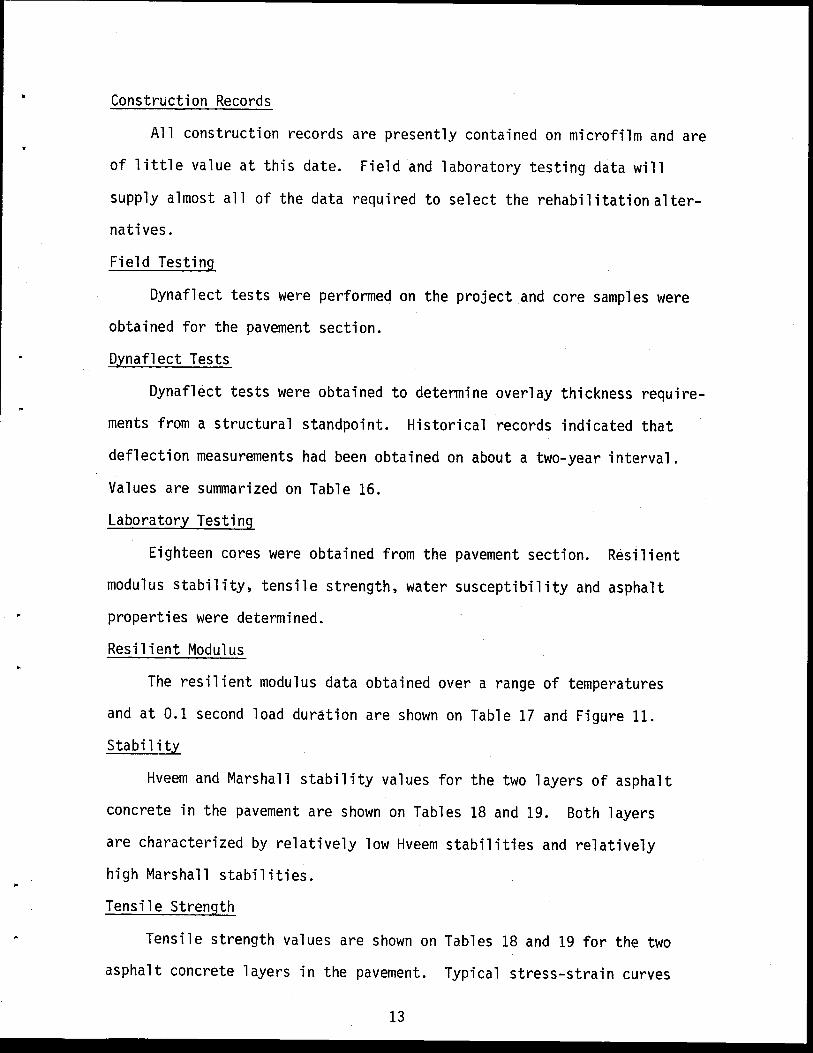
Construction Records
All construction records are presently contained on microfilm and are
of little value at this date. Field and laboratory testing data will
supply almost all of the data required to select the rehabilitation alter
natives.
Field Testing
Dynaflect tests were performed on the project and core samples were
obtained for the pavement section.
Dynaflect Tests
Dynaflect tests were obtained to determine overlay thickness require
ments from a structural standpoint. Historical records indicated that
deflection measurements had been obtained on about a two-year interval.
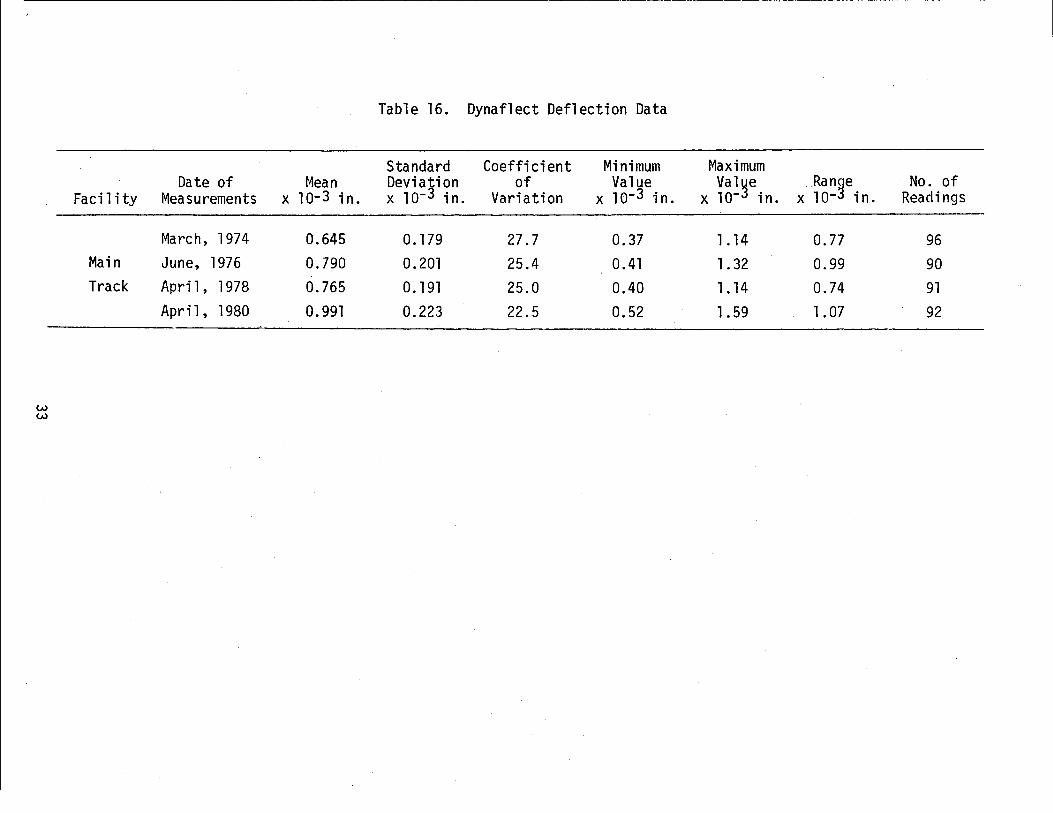
Values are summarized on Table 16.
Laboratory Testing
Eighteen cores were obtained from the pavement section. Resilient
modulus stability, tensile strength, water susceptibility and asphalt
properties were determined.
Resilient Modulus
The resilient modulus data obtained over a range of temperatures
and at 0.1 second load duration are shown on Table 17 and Figure 11.
Stability
Hveem and Marshall stability values for the two layers of asphalt
concrete in the pavement are shown on Tables 18 and 19. Both layers
are characterized by relatively low Hveem stabilities and relatively
high Marshall stabilities.
Tensile Strength
Tensile strength values are shown on Tables 18 and 19 for the two
asphalt concrete layers in the pavement. Typical stress-strain curves
13
for the top and bottom layers are shown on Figure 12.
Water Susceptibility
Two water susceptibility tests were performed with results shown on
Tables 18 and 19 and Figures 13 and 14. The bottom layer shows evidence
of water susceptibility. Prolonged exposure to water in-service would prob
ably result in stripping of the asphalt from the aggregate in the bottom
layer of asphalt concrete.
Asphalt Properties
Asphalt extraction and recovery tests were performed on selected
pavement samples from the pavement. Results are shown on Table 20.
Overlay Thickness Reguirement
Traffic
The existing annual truck traffic on the pavement has been calculated
to be 730,000 equivalent 18,000 lbs. axle load applications. The design
lane (travel lane) will carry about 70 percent of the truck traffic. Thus
the design average daily equivalent 18,000 lbs. axle load application rate
is about 2,000.
Overlay Thickness
Based on The Asphalt Institute's Overlay Design Method, a 2-inch
overlay will be required to carry the existing traffic for the next twenty
years. Traffic and deflection information as described above was utilized
in this design method.
It should be noted that the FPS overlay design method could also have
been used to determine the overlay thickness.
As stated above 2 inches is required for traffic loads. However, the
existing cracks in the track will probably reflect through the overlay in
two years or less. Thus, the use of an interlayer (stress absorbing layer)
14
(stress relieving layer) needs to be considered. Asphalt-rubber ct.ip
seal and heater-scarification are two interlayer systems. A positive
method for control of the reflection cracking is recycling of the
existing asphalt bound material.
Thickness of Recycled Pavement
Deflection measurements and laboratory data were utilized to
characterize the subgrade, base course, and bituminous bound materials.
Layered elastic computer programs were used to calculate stresses and
strains in the pavement and pavement thickness requirements were
determined. Conventional pavement design approaches such as FPS could
also be utilized to check the reasonableness of the computer solutions.
A 6.5 to 7.5 inch asphalt bound layer will be required on top of the
existing base course. A value of 7 inches is selected for design
purposes at this time.
Rehabilitation Alternatives
Ten rehabilitation alternatives have been initially selected for
the pavement section (Report 214-17). The alternatives are briefly
defined in Table 21. The costs for evaluating the alternatives have
been obtained from Report 214-18. Selected costs are shown on Table 22.
Life-cycle costs are shown on Table 23. Life-cycle costing procedures as
shown outlined in Report 214-19 were used. A summary for each alternative
is shown on Table 24.
Life cycle energy requirements for the rehabilitation alternatives
have been calculated using the data and methods described in Report 214-9.
Results of these calculations are given on Table 24.
Conclusions
1. The transverse and longitudinal cracking pattern in this pavement
15

section is typical of other pavements in the west Texas area. This type of
cracking is probably thermal cracking. The use of softer asphalt cements,
asphalts with different temperature susceptibility and/or asphalts with
improved aging characteristics will improve pavement performance. Absorp
tive aggregates, low asphalt contents and high air void content mixes
contribute to the occurrence of this type of distress.
2. Ten rehabilitation alternatives have been defined, alternatives 4
to 8 involve recycling. Alternatives 2, 3, 9 and 10 provide various types
of interlayers to reduce reflection cracking. Plan 1 is the typical
rehabilitation method and has the lowest initial cost. Table 25 presents
the advantages and disadvantages for each rehabilitation alternative. The
selection of the rehabilitation alternative for the pavement section will
depend on the amount of funding initially available, consideration of the
life cycle costs, the life-cycle energy requirements and recognition of
the advantages, disadvantages and uncertainties associated with
each alternative. For example, the recycling alternatives have initial
costs, and relatively low life cycle costs and reduced maintenance require
ments.
CONCLUSIONS AND RECOMMENDATIONS
1. Two examples have been given which demonstrate the techniques
involved in conducting pavement failure analysis. It should be recognized
that each investigation may have to be tailored slightly to the individual
project under investigation. However, it is desirable and extremely im
portant that a fixed series of field measurements and laboratory tests be
performed on all projects. The following is suggested as a minimum for
asphalt treated materials.
16
A. Field Tests
1. Pavement Condition Survey
2. Dynaflect
3. Pavement Roughness
4. Core Samples - (depth measurement and laboratory testing)
B. Laboratory Testing
1. Mixtures
a. Hveem stability
b. Water-Susceptibility
c. Indirect tension
d. Resilient modulus
e. Air void content
2. Asphalts
a. Penetration - 77°F
b. Viscosity - 140°F
3. Aggregates
a. Gradation
b. Shape, surface texture, absorption
2. By accumulating pavement failure investigation data over a series
of projects it will be possible to suggest changing or altering existing
design, construction, materials testing methods and/or specification
acceptance critiera.
3. If a decision is made to conduct a field distress investigation,
it will be necessary to develop an appropriate plan for the investigation.
Such a plan will assure the collection of appropriate information relevant
to the specific type of distress.
In all probability both field and laboratory activities will be
17

involved. In each case it will be important to make use of trained
technologists and the laboratory facilities available. Assistance in
planning and testing can be obtained by contacting, Materials and Tests
Division, File D-9, State Department of Highways and Public Transportation,
Austin, Texas 78703.
18
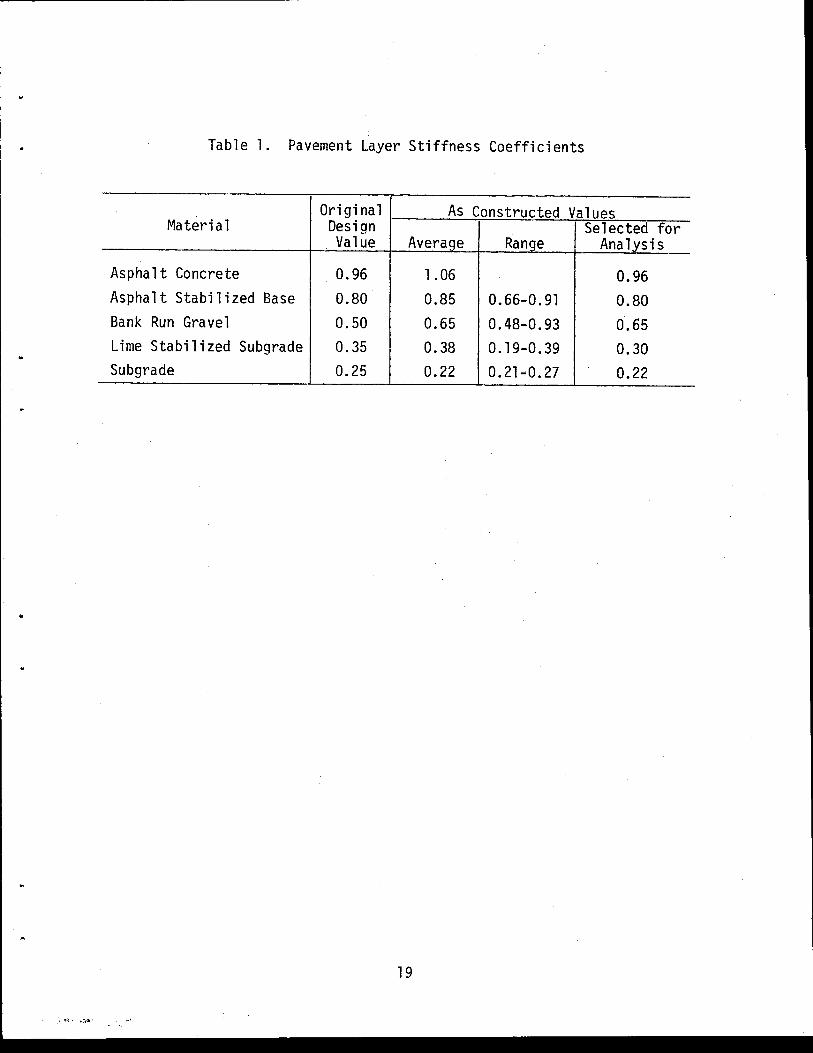
Table 1. Pavement Layer Stiffness Coefficients
Original As Constructed Values Material Design Selected for
Value Average Range Analysis
Asphalt Concrete 0.96 1.06 0.96 Asphalt Stabilized Base 0.80 0.85 0.66-0.91 0.80 Bank Run Gravel 0.50 0.65 0.48-0.93 0.65 Lime Stabilized Subgrade 0.35 0.38 0.19-0.39 0.30 Subgrade 0.25 0.22 0.21-0.27 0.22
..
19

Table 2.
: Asphalt Black Station Location from C/L Concrete Base Remarks
Left Lane Thickness, Thickness, Inches Inches
410+0 61 Lt. C/L Lt. Lane 2 3/8" 5" Good stable core removed intact
412+50 111 Lt. II 2 1/8" 5" Lt. side, Lt. lane (outside wheel path) - stable core, removed intact
413+75 31 Lt. II 2 1/8" 4 1/2" Rt. side, Lt. lane (inside wheel path) - stable core
422+50 31 Lt. II 2" -- Lt. side, Lt. lane (outside wheel path) - HMAC stable; Black Base failed
425+0 31 Lt. II 1 7/8" * Failure in Lt. lane from 425+75 to 426 * 1st course Black Base intact
2nd course failed 426+50 31 Lt. II 1 1/2" -- Inside Lt. lane 1st course
Black Base intact; 2nd course failed
430+0 71 Lt. II 2" -- 1st course Black Base intact; 2nd course failed
432+50 41 Lt. II 2" 3" 1st course Black Base intact; 2nd course fail ed
440+0 91 Lt. II 1" -- 1st course Black Base intact; 2nd course failed
442+0 41 Lt. 1" -- 1st course Black Base intact; 2nd course failed
445+0 2" 5" Good core removed intact
20
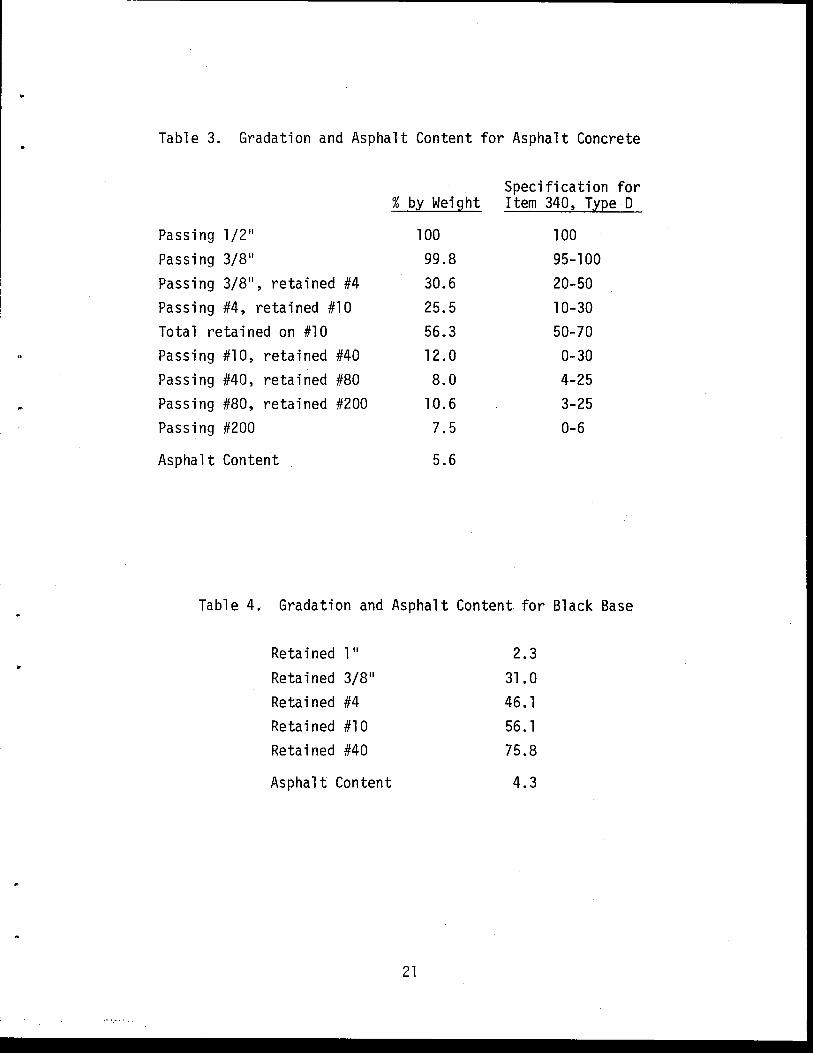
Table 3. Gradation and Asphalt Content for Asphalt Concrete
Specification for % b~ Weight Item 340, T~Ee D
Passing 1/2" 100 100 Passing 3/8" 99.8 95-100 Passing 3/8", retained #4 30.6 20-50 Passing #4, retained #10 25.5 10-30 Total retained on #10 56.3 50-70
I n Passing #10, retained #40 12.0 0-30 Passing #40, retained #80 8.0 4-25 Passing #80, retained #200 10.6 3-25 Passing #200 7.5 0-6
Asphalt Content 5.6
Table 4. Gradation and Asphalt Content for Black Base
Retained 1" 2.3 Retained 3/8" 31.0 Retained #4 46.1 Retained #10 56.1 Retained #40 75.8
Asphalt Content 4.3
21

N N
Asphalt Concrete
Black Base
Table 5. Properties of Remolded Asphalt Concrete and Black Base Mixtures
Indirect Resilient Material Hveem Hveem Tensile Modu1us6 Stabi 1 i ty Cohesiometer Strength, ps i x 10
psi
As Received 48 448 133 0.900
1% Additional Asphalt 22 363 110 0.650
2% Addi tiona 1 Aspha1 t 0 218
3% Additional Asphalt 0 171
As Received 51 518 139 1.790
Bulk Specific Gravity
2.361
2.388
2.373
2.341
2.366

•
•
Table 6. Effect of Density on Black Base Mixture Properties
Unconfined Unit Air Test Test Compressive
Specimen Weight, Voids, Speed Temp. Strength, No. 1 bs/ft 3 Percent* in/min of psi
1 150.4 1.3 0.15 140 124.6
2 151. 6 0.7 0.15 120 189.1
3 151 .5 0.8 10.0 140 253.8
4 151 . 1 1.0 0.15 140 127.5
5 150.5 1.4 10.0 140 288.7
6 144.8 5.1 0.15 140 36.1
7 144.3 5.4 10.0 140 86.3
8 138.0 9.6 10.0 140 32.8
9 137.7 9.8 0.15 140 6.0
* Determined by pressure pycnometer. All samples contained 4.3 percent asphalt cement. Samples 6 - 9 molded at reduced compactive efforts .
23
Moisture Content After
Pressure Saturation,
Percent
0.13 0.08 0.12
0.23 0.24 1.39 1.58 2.64 3.11

Table 7. Properties of Asphalt Cement Used in the Laboratory Testing Program
Penetration, Viscosity, 1 OOg, 5 sec, Ductility,
Asphalt Condition 140°F nOF nOF
Original 1970 88*
After laboratory mixing and compaction--no 5821 56 70 lime added
After laboratory mixing and compaction--l% 5069 62 141 1 ime added
* after thin film oven test
24

N U1
Table 8. Black Base Mixture Properties--Aggregates Obtained from Project Stockpile and Compaction with Large Gyratory Compactor
Moisture Content
Unconfined After Unit Air Test Test Compressive Pressure Aspha 1t
Specimen Weight, Voids, Speed, Temp, Strength, Saturation, Content, Mixture Number 1 bs/ft3 Percent in/min OF psi Percent Percent
1 151.3 7.6 10.0 138 86.9 0.43 3.5 No 2 152.2 6.5 0.15 138 44.9 0.00 4.5
Additive 3 147.5 10.6 10.0 138 51.8 1.49 2.5 4 152.7 6.5 0.15 138 4l.3 0.11 4.0 5 150.1 8.7 10.0 138 77 .7 0.98 3.0 6 151 . 1 7.6 10.0 138 93.9 0.50 3.66 7 152.3 7.0 O. 15 138 44.3 0.37 3.5 8 150.6 8.4 0.15 138 36.7 0.90 3.0 9 152.0 6.6 10.0 138 95.0 0.02 4.5
10 152.1 6.9 10.0 138 99.1 0.23 4.0 11 152.4 6.8 0.15 138 44.9 0.31 3.66 12 148.9 9.7 0.15 138 24.3 l. 41 2.5
153.2 6.5 0.15 138 48.5 0.36 3.5 1 % Lime 151. 9 6.7 0.15 142 48.0 0.00 4.5
147.7 10.5 0.15 140 4l.1 1.22 2.5 150.5 8.5 0.15 138 42.6 0.80 3.0 152.6 6.6 0.15 140 48.6 0.00 4.0 151.6 7.6 10.0 140 95.3 0.58 3.25 151.9 7.4 0.15 140 46.9 0.48 3.25 152.9 6.7 10.0 142 9l.8 0.46 3.5 152.5 6.6 10.0 138 100.8 0.00 4.0 151.7 6.8 10.0 138 86.0 0.00 4.5 149.3 9.2 10.0 140 88.0 0.86 3.0 146.2 11.3 10.0 138 87.6 1.33 2.5
1% 152.5 6.7 10.0 139 107.4 0.34 3.66 Antistrip 153.4 6.2 0.15 139 50.7 0.26 3.66
153. 1 6.3 0.15 140 45.5 0.26 3.66 Agent 152.5 6.7 10.0 140 99.8 0.38 3.66

Table 9. Black Base Mixture Properties--Aggregates Obtained from Project Stockpile and Compaction with Small Gyratory Compactor
Indirect Tensil e Resilient Water
Hveem Hveem Strength, Modulus, Absorption, Mixture Stability Cohesiometer psi psi x 10 6 Percent
No Additive 39 227 65 0.474 1.4
1 % Lime 37 308 56 0.507 1.1
1% Antistrip 48 259 50 0.414 1.0
26
• •
Table 10. Properties of Unstabilized Pavement Layers
Liquid Plastic Soil Binder, Moi sture Sieve Size Layer Station Limit Index Percent Content
1 1/4 7/8 5/8 3/8 4 10 20 40
Subgrade 470+70 53 37 98 17.6 0 1 2 2 491+50 48 33 98 19.0 0 6 1 2
Lime 470+70 49 34 96 18.3 0 1 2 3 4 Treated Subgrade 491+50 48 31 95 20.8 0 1 2 I 4 5
Flexible 470+70 27 15 40 6.0 0 2 6 16 29 39 48 60 .. Base 491+50 33 22 35 6.0 5 13 20 27 38 47 I 55 65
N (Xl
Sample Designation
Original Asphalt (August - 1978)
Asphalt Concrete . Extracted and
Recovered by SDHPT
Asphalt Concrete Extracted and
Recovered by TTl
Black Base Extracted and
Recovered by SDHPT
Black Base Extracted and
Recovered by TTl
Table 11. Asphalt Cement Properties
Penetration, Vi scosi ty, Ductil ity, 77°F, 100 g, 140°F 77°F Ring & Ball 5 sec, O. 1 mm poises cm Softening Point
75 2,000 140+
23 182,000 5 38 21,377 15
32 15,900 144
26 57,035 4
23 38,700 151

Table 12. Resilient Modulus Results on Surface and Base Materials
• Resilient Modulus @ 77°F, MR X 106
Ma teri a 1 Sample Air Before After 7- After No. Voids Soaking day soak Lottman
A 9.6 0.180 0.0530 B 11.7
Surface C 10.9 0.187 0.144 547 5.5 0.296 421 8.1 0.321 450 8.7 0.347
Average 9. 1 0.266 0.144 0.0530
A-l 8.7 0.252 0.155 A-2 9.4 0.233 0.0137 B-1 9.7 0.207 0.0180 B-2 9.6 0.194 0.123 B-3 8.3 0.306 0.156 C-l 9.3 0.240 0.0135
Base C-2 9.0 0.256 0.0200 C-3 9.0 0.202 0.128
547A 5.8 0.413 547B 6.8 0.343 547C 5.2 0.427 421A 5. 1 0.488
450A 5.3 0.494 450B 6.3 0.467
Average 7.7 0.323 0.140 0.0163
29
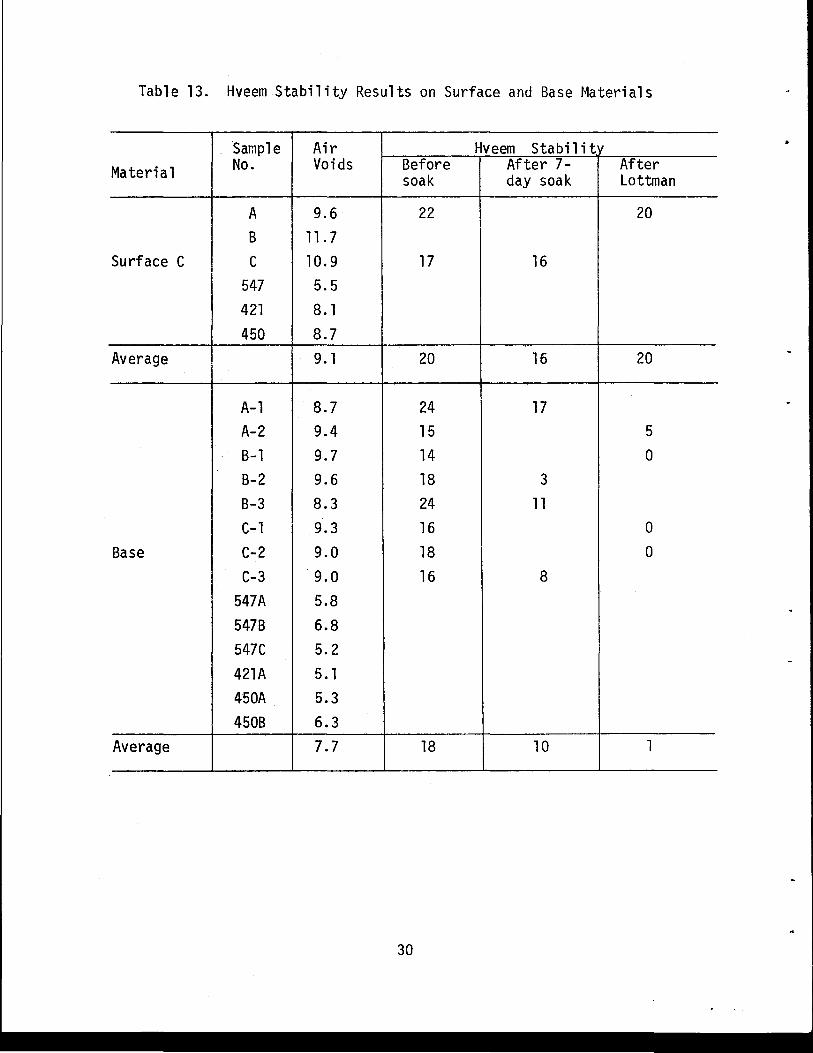
Table 13. Hveem Stability Results on Surface and Base l~aterials
Sample Air HVeem Stabilitv Material No. Voids Before After 7- After
soak day soak Lottman
A 9.6 22 20 B 11.7
Surface C C 10.9 17 16 547 5.5 421 8.1 450 8.7
Average 9.1 20 16 20
A-l 8.7 24 17 A-2 9.4 15 5 B-1 9.7 14 0 B-2 9.6 18 3 B-3 8.3 24 11
C-l 9.3 16 0
Base C-2 9.0 18 0
C-3 9.0 16 8 547A 5.8 547B 6.8 547C 5.2 421 A 5. 1 450A 5.3 450B 6.3
Average 7.7 18 10 1
30
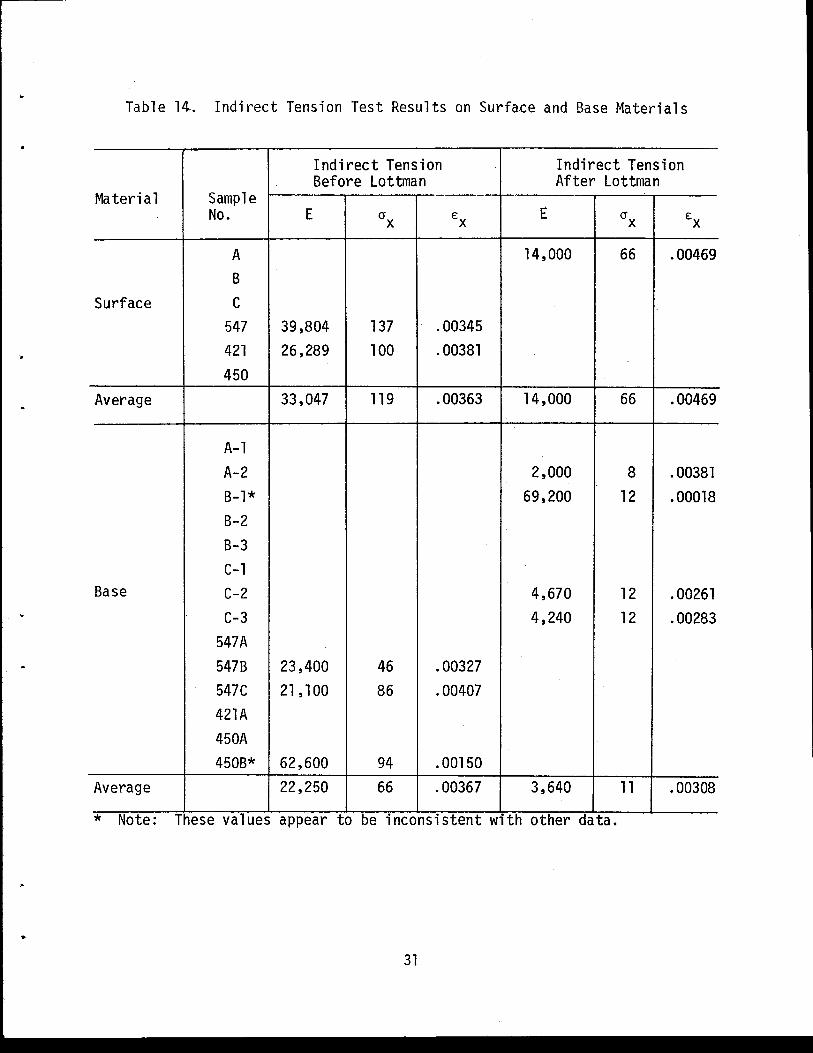
... Table l~. Indirect Tension Test Results on Surface and Base Materials
Indirect Tension Indirect Tension Before Lottman After Lottman
Material Sample No. E Ox EX E Ox EX
A 14,000 66 .00469 B
Surface C 547 39,804 137 .00345 421 26,289 100 .00381
450 Average 33,047 119 .00363 14,000 66 .00469
A-l A-2 2,000 8 .00381 B-l* 69,200 12 .00018 B-2 B-3 C-l
Base C-2 4,670 12 .00261 C-3 4,240 12 .00283
547A 547B 23,400 46 .00327 547C 21,100 86 .00407 421A 450A 450B* 62,600 94 .00150
Average 22,250 66 .00367 3,640 11 .00308 . * Note: These values appear to be lnconslstent wlth other data.
31

Table 15. Marshall Stability Test Results on Black Base Material
r·1arsha11 Stabil i ty
Material Sample Before 7-day soak After 7-day soak
No. Stabi 1 i ty Flow Stabi 1 i ty Flow 1 bs 0.01 in 1 bs 0.01 in
547A 410 29
421A 1110 37
450A 380 35
Base A-l 480 29
B-2 568 28
8'-3 670 24
C-3 397 28
Average 630 30 529 27
32
w w
Faci 1 i ty
Main Track
Date of Measurements
March, 1974 June, 1976 April, 1978 Apr; 1, 1980
Mean x 10-3 in.
0.645 0.790 0.765 0.991
Table 16. Dynaflect Deflection Data
Standard Coefficient Minimum Deviajion of Value x 10- in. Variation x 10-3 in.
0.179 27.7 0.37 0.201 25.4 0.41 0.191 25.0 0.40 0.223 22.5 0.52
Maximum Val~e Ran~e No. of
x 10- in. x 10- in. Readings
1.14 0.77 96 1.32 0.99 90 1.14 0.74 91 1.59 1.07 92

Table 17. Resilient Modulus
Resilient Modulus x 106 psi
Samples -13°F 32°F 68°F 77°F 104°F
1.4 Al 3.468 1.802 1.037 0.8103 0.2510
1.4 81 3.567 2.012 0.954 0.7386 0.2671
1.4 Cl 3.622 2.152 0.935 0.7600 0.287:3
5 Cl 4.089 2.126 1.070 0.7164 0.2767
5.8 A1 4.059 2.839 1.012 0.7513 0.2352
8.8 Al 4.725 2.536 1.114 0.8612 0.2302
5 C2 4.264 2.712 0.977 0.6950 0.2534
5.8 A2 4.579 2.299 1.075 0.7026 0.2679
7-A2 3.906 1.781 0.809 0.4885 0.2249
7 82 4.879 2.492 1.186 0.3943 0.4458
8.8 A2 4.142 2.952 0.949 0.7545 0.4238
34

W 0'1
lSample
3Al 3Bl
3Cl SAl
581
5.8Bl
5.8el 7Al 7Bl
7Cl ~.8[l1 8.8Cl
Bulk Sp. Gr.
2.229 2.245
2.252 2.279 2.277 2.286
2.290 2.255 2.271 2.270 2.310 2.298
.-
Rj ce X Sp. Air Gr. Voids
2.323 4.1 3.4
3.1 1.9
2.0 1.6
1.4
2.9 2.2 2.3 D.5
1.1 --
~1~ 6 Hveem x a . psi 77°F .- S R
0.8934 39 92 0.8224
0.8331 29 95 0.7777 13 84 0.5644 0.7513
0.7205 18 86 0.7105 12 84 0.8858 0.7125 0.8333 0.8258 15 80
Table 18. Top Layer Material, Properties
~Iarshall Indi rect Tens i on 7-Day Soak Lottman Procedure NR 6 Hveem Marshall ~R1Q6 Hveem Indirect Tension
Stab, Flow E Ex x 10 ax. psi Stab .• Flow. psi '. S R E a Ex' lbs. .01i~ psi PSl in/i n 77?F S R 'lbs .blin '77"£ psi p~i in/in
.7152 28 91 2660 27 3558 14
.2748 6 76 21711·nO .0050 1.363 16 86 2863 21
3333 14
70100 185 .0025
.7845 10 75 53335 177 .0033 .5975 14 85 2531 23
3553 14.5
80152 164 .0021 59229 194 .0032
.8047 0 35 57488 168 .0025
'.1,
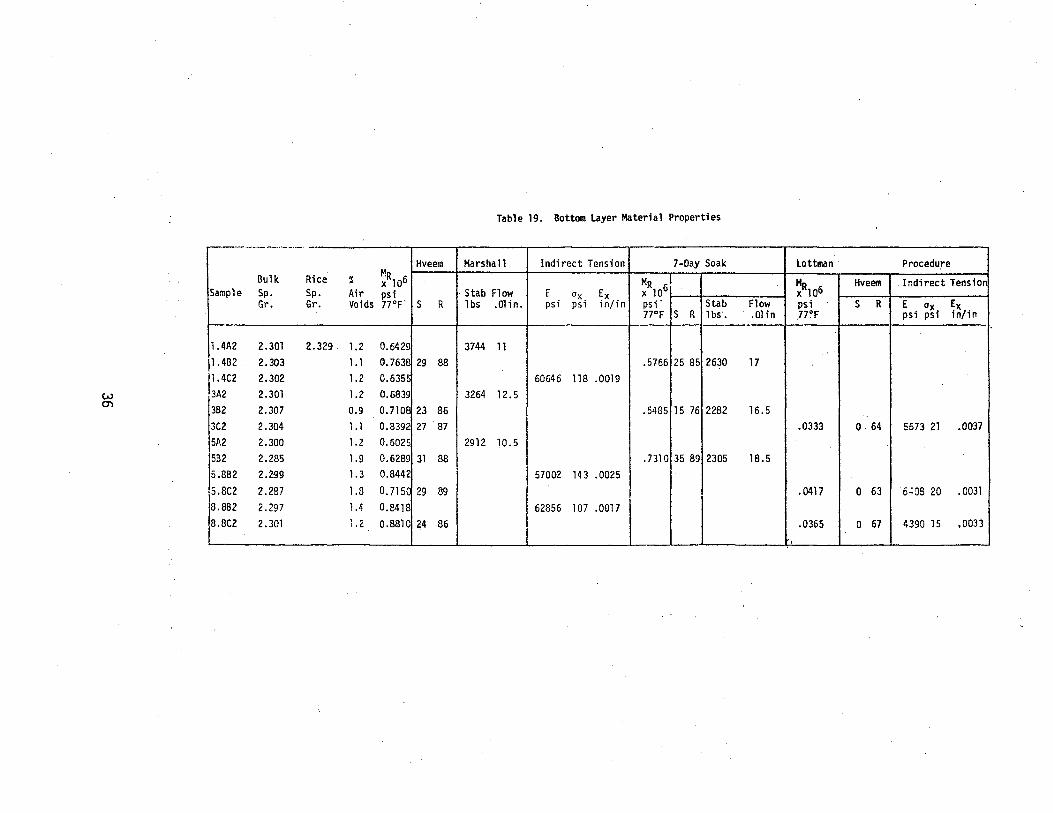
Table 19. Bottom layer Material Properties
..-----._----_ .. _-_._. -Hveem Marsha 11 Indirect Tension 7-0ay Soak Lottman Procedure
Bulk Rice % MR 6 MR M Hveem Indirect Tension x 10 x 106 /106 Sample Sp. Sp. Air psi Stab Flow E ClX Ex
Gr. Gr. Voids 77°F· S R 1bs .01 in. psi psi in/in psi - Stab Flow psi S R E . ax. Ex 77°F S R 1bs. .01 in .77 of PSl PS1 in/in
1.4A2 2.301 2.329· 1.2 0.6429 3744 11 1.4B2 2.303 1.1 0.763E 29 88 .5766 25 85 2630 17
11.4C2 2.302 1.2 0.635! 60646 118 .0019 3A2 2.301 1.2 0.6839 3264 12.5 3B2 2.307 0.9 0.710E 23 86 .5485 15 76 2282 16.5 3C2 2.304 1.1 0.8392 27 87 .0333 O· 64 5673 21 .0037 5A2 2.300 1.2 0.5025 2912 10.5 582 2.285 1.9 0.6289 31 88 .7310 35 89 2305 18.5 5.8B2 2.299 1.3 0.8442 57002 143 .0025 5.8C2 2.287 1.8 0.715( 29 89 .0417 0 63 6';08 20 .0031 8.8B2 2.297 1.4 0.8418 62856 107 .0017 8.8e2 2.301 1.2 0.BB10 24 86 .0365 0 67 4390 15 .0033
,
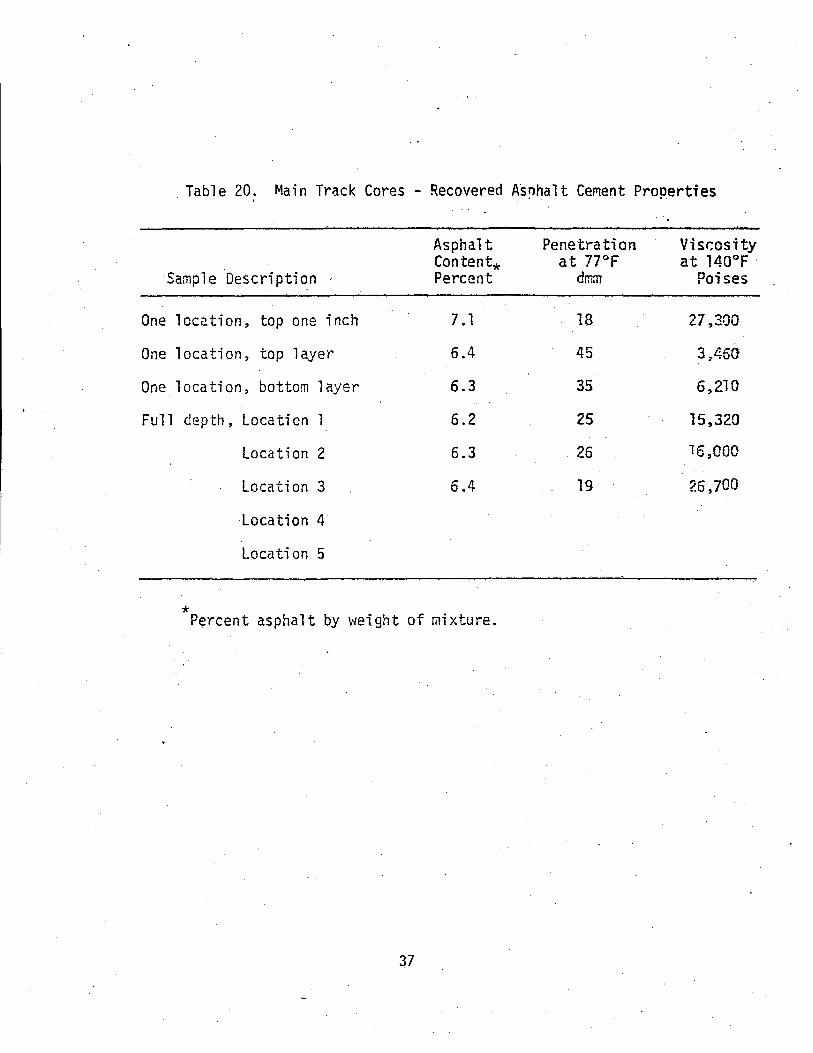
Table 20; Main Track Cores - Recovered A~~halt Cement Properties . :.
Asphal t Penetration Visr;osity Content* at 77°F at 140°F·
Sample Description Percent dmm Poises
One location, top one inch 7.1 18 27,300
One location. top 1 ayer 6.4 45 3",460
One locati on, bottom layer 6.3 35 6,210
Full depth, Locati en 1 6.2 25 15,320
Location 2 6.3 26 16~OOO
Location 3 6.4 19 ,r 700 ~O •
Location 4
Locati on 5
* Percent asphalt by v-Ieight of mixture.
37

Table 21. Pavement Rehabilitation Alternatives Defined
Plan 1: Two-inch asphalt concrete overlay with maintenance' on a 7-year cycle {asphalt concrete $25.00 per ton}.
Plan 2: Chip seal' plus 2-inch asphalt concrete overlay with maintenance (chip seal SO.55 per square yard, asphalt concrete 525.00 per ton).
FL:~n 3: Fabric reinforcement plus 2-inch asphalt ccr.cr~te overlay \-lith naii,tenance (fabricreinforcerr,ent S1.25 pet" squat"e yard, a~nhalt concrete 525.00 per ton).
?lan 4: Recycle existing 4 inches of ~3terial c!n~ ~1end a selected aggregate into recycled ~ixture. A 2-inch ov~rlaJ is schedul~d after 5 years (recycling at 520.CO per :on dnd overlay at 525.00 per ton).
Plan 5: Recyclir:l] existing 4 inches of asphalt r:aterials cnd.2 inch~s of asphdlt concrete overlay with maintenarce (recycling 516.00 per ton, asphalt concrete 525.0'J per ton).
Plan 6: Recycling existing 4 inches of asphalt materials and 2 inches of asphalt concrete overlay with maintenance which inclUdes a 2-inch overlay (recycling 516.00 per ton, asphalt concrete $25.00 per ton) ..
Plan 7: Recycling existing 4 inches of asphalt mate.rials and 2 inches of asphalt concrete overlay with rr~intenance (recycling $20.00 per ton, asphalt concrete $25.00 per ton).
Plan 8: Delay recycling 4 years and then recycle and add 2 inches . of asphalt concrete overlay with maintenance (recycling ·$16.00 per ton, asphalt concrete 525.DO per ton).
Plan 9: Heater-scarify to a depth of 1 to 1.5 inch and 2 inches of aspha 1 t concrete overl ay wi th rna i ntenance (hea ter-scar; fi cati on SO. 90 per square yard, aspha 1 t concrete 525.00 per ton).
Plan 10: Asphalt-rubber interlayer and 2 inches of asphalt c.oncrete overlay with maintenance (asphalt-rubber interlayer$1.25 per square yard, asphal t concrete 525.00 per ton).
38
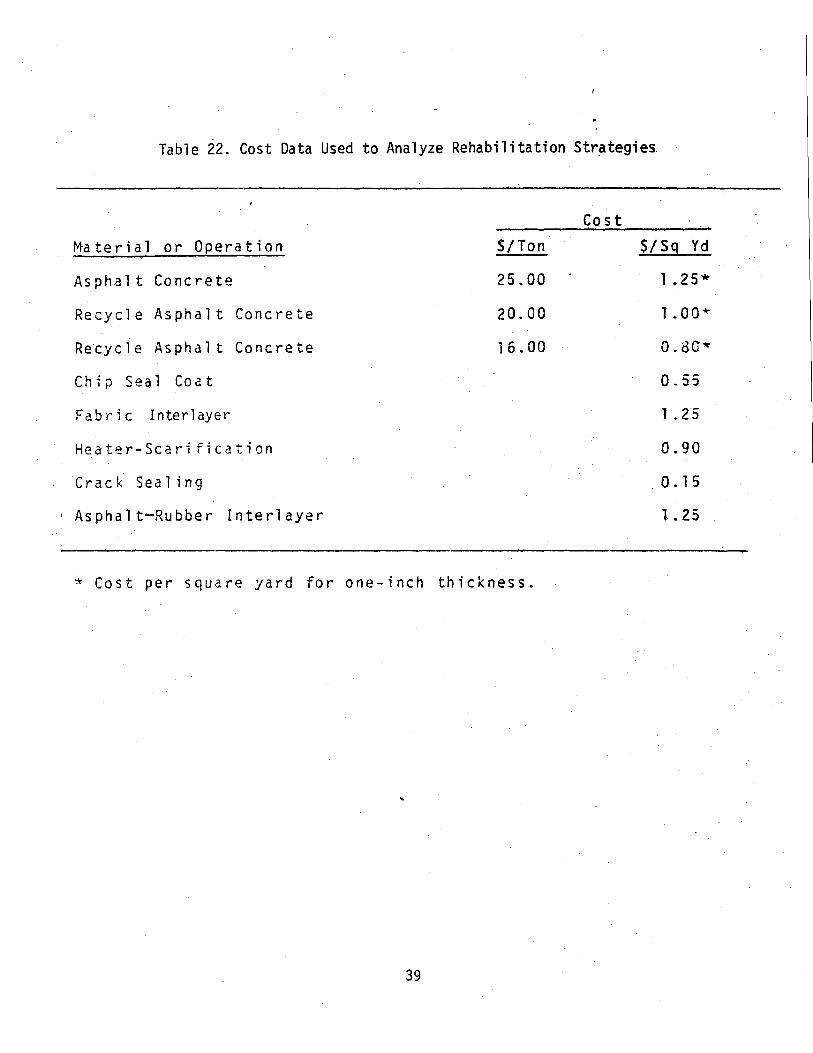
Table 22. Cost Data Used to Analyze Rehabilitation Str~tegies
Material or Operation
Asphal t Concrete
Recycle Asphalt Concrete
Re~ycle Asphalt Concrete
Chip Seal Coat
Fabric Interlayer
Heater-Scari fication
Crack Seal ing
I Asphalt-Rubber Interlayer
SITon
25.00
20.00
16.00
* Cost per square yard for one-inch thickness.
39
Cost
S/59 Yd
1.25*
1.00*
D.8C*"
0.55
1 .25
0.90
O. 15
1 .25

Table 23. Rehabil i tat; on Alternatives Cost Schedule*
---- '._-_._------ ___ 0_ •• _____ .' __ •••• _____ •• " ____ •• _____ • ____ __ • __ •• 4 __________
Plan 1 Plan 10 Plan 2 fabric Plan 5 Phil 6 Plilll 7 1'1 illI Il Plan 9 Asphalt-Rubber
Plan 1 Seal Coat Reinforcement neeyc1e Recycle Hecydc H"cyclc IICol lCI··Sca r fry InterlaYf!r 2" A.C. +Z- A.C. ·.2" A.C. Plan 4 +Z" A.C. +2" A.C. .2" fI.C. .2" JI.. C. +2" A.C. t2" A.C.
Yc,lr Ovcrla,l Overlal Overlal RC9ck Ovcrlal Ovcr.:!~y_ .Qver-'-,y. . n~'.:'.:.! ~ 1._. Ovcrlax Overlal
1930 2 •. 50 3.05 J.n, 11.00 5.10 5.70 ~ 1i.50 0.15 3.40 3.75. 19111 0.15 1982 0.15 19113 O.Oll 0.15 1984 0.13 O.Oll 0.03 6.50 0.01l o.oa 1985 0.15 0.13 2.50 1986 0.15 0.15 0.13 0.13 0.13 1981 2.50 0.15 19118 0.15 0.15 0.011 O.OIl O.OB 0.15 0.15 1969 2.50 1990 0.01l 2.50 D.13 D.lJ 0.13 2.50 2.50 1991 0.13 0.08 0.01l 19')2 0.15 0.08 -0.15 0.15 0.15 1993 0.15 0.13 0.01l 0.13 0.1:1 o.on 0.00
~ 199., 2.50 0.15 0.13 0.15 2.50 0.15 0.13 0.11 a 1995 0.15 0.15 0.15 (J.EI 0.15 0.15 1'996 3.05 0.15 0.15. 0.15 0.15 0.15 1991 0.011 0.15 0.15 0.15 0.15 0.15 1998 0.13 0.15 0.15 0.01l 0.15 0.15 0.15 1999 0.15 0.15 0:15 o. )" 0.15 0.t5 2000 0 .. 15 0.00 0.l5 0.15 0.13 0.15 0.15 O. )5
.....-... --------_. ._------_ .... _ .... -- ------_.--_._-- ....... - -_ .. , . . .- .. . , .......... .. -.. ---_ ........ __ ... _----...... _.- ....... -.... --.-
*thmitJersrcprc-scn'l costs per $quare yard.
. .
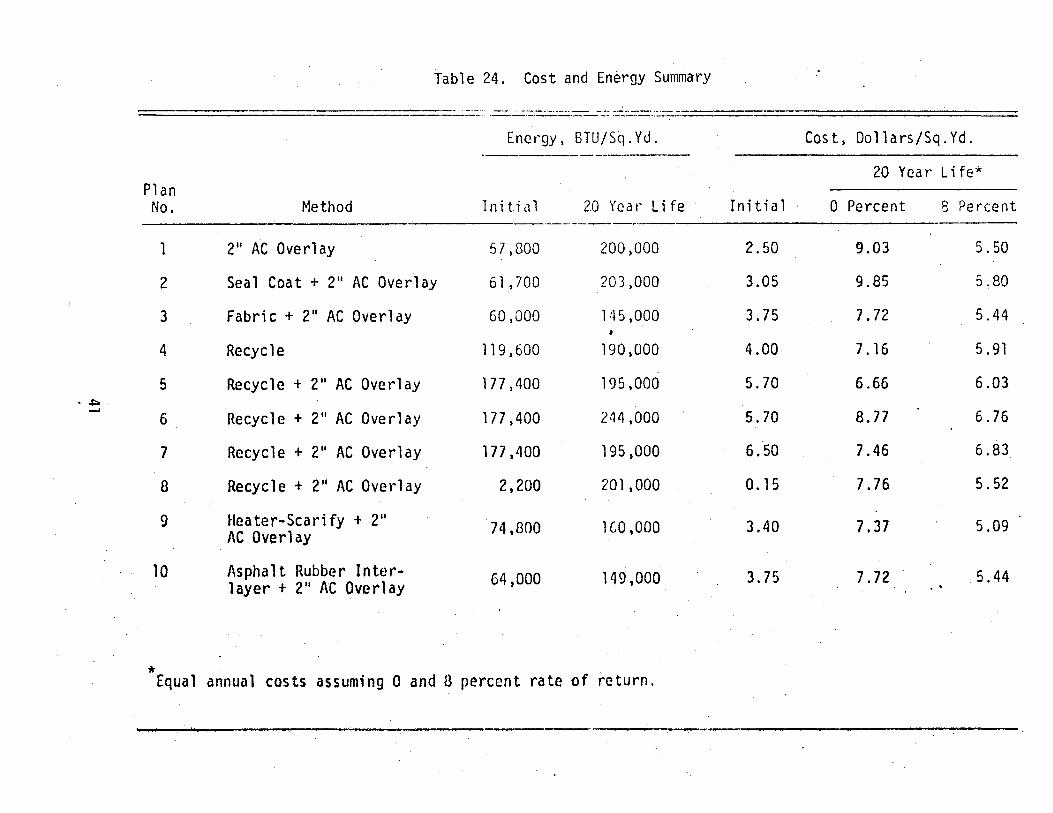
Table 24. Cost and Energy Summary
_ .. -.-.- -- .- ---_ ... ----,,_ .•. -----.... -.----- ... -----_._---- -- ---'---'"
Energy, BTUjSq.Yd. Cost, DollarsjSq.Yd. -----------------
20 Year L i fe* Plan
No. ~1ethod Initial 2.0 Year Life Initial 0 Percent 8 Pe rcent _. __ .. _----,...
1 2" AC Overl ay 57,800 200,000 2.50 9.03 5.50
2 Seal Coat + 2" AC Overlay 61,700 203,000 3.05 9.85 5,80
3 Fabric + 2" AC Overlay 60,000 145,000 3.75 7.72 5.44
4 Recycl e 119,600 190,000 4.00 7.16 5.91
5 Recycle + 2" AC Overlay 177 ,400 195,000 5.70 6.66 6.03 . • ..j:::o
....... 6 Recycle + 2" AC Overlay 177,400 244,000 5.70 8.77 6.76
7 Recycle + 2" AC Overlay 177 ,400 195,000 6.50 7.46 6.83
8 Recycle + 2" AC Overlay 2,200 201 ,000 O. 15 7.76 5.52
9 Beater-Scarify + 2" 74,800 lCO.OOO 3.40 7.37 5.09 AC Overlay
10 Asphalt Rubber Inter- 64,000 149,000 3.75 7.72 5.44 1 ayer + 211 AC Overl ay ..
* Equal annual costs assuming 0 and 8 percent rate of return.

Plan No. and Description
1 - T\'1o-;nch
. 2 - Chip seal + two-inch overlay
Table 25. Advantages and Disadvantages of Rehabilitation Alternatives
Advantages
Minimum initial cost Minimum construction time Incr-eased tire wear
Somewhat delayed reflection cracking
Relatively low initial cost
Time for Rehabi 1; ta ti on,
Disadvantages Months*
Early reflection cracking High Maintenance requirement .0.5 Pl"obilbly strllcturillly inadequate
for extended use Require preliminar-y deep patching
Refl ecti on crack; ng 1 css than Pl an 1 Relatively high maintenance requirement 0.5 Probably structurally inadequate
for extended use Require preliminary deep patching
~--~----------------~--~~----------------------------------------3 - Fabric rein
forcement + b/o-; nch overlay
4 - Recycling existing material without overlay
5, 6 & 7 -Recycling existing material + overlay
Reduction in total amount of reflection cracking
Relatively low initial cost Increased tire wear
Eliminates all existing cracks
Delays for~ation of new cracks for 3-5 year
Relatively low maintenance costs
Eliminates all existing cracks
Delays formation of new cracks for 5-7 years
Increased tire wear Low maintenance cost
Somcltlhat del ayed refl ecti on crack; ng Relatively high maintenance requirement 0.5 Probably structut'a 11y i nadequa te for
extended use Requires preliminary deep patching Can not recycle at a later date
Relative high initial cost Mi nor improvement inti rc \'ICar Increa5ed COllstruct-j on time Limited bid competition
High inttial cost Increased construction time Limited bid competition
1.0
1.5
Chance of Success**
60
70
75
60
90

8 - Delay rehabilita ti on and recycle at later date and overlay
9 & 10 -Hea tersca rification and i nterl ayer + overlay
*
Low initial cost
Reduction total amount of reflection cracking
Relatively low initial cost Increased tire wear Can be recycled at later date
Table 25 (continued)
High continued maintenance prior to rehabilitation
Somewhat delayed reflection Relatively high maintenance requirement Probably structurally inadequate for
extended lise Requires preliminary deep patching
Assumes no weather delays and good contractor.
** Chance to perform 7 years without overlay *** . Cost for 0 interest rate from Table 3.
• 1. 5 9C
0.5 81
. ,

- Asphalt Content Table 4
r Extraction ~ Gradation - Table 3
Bulk Specific Gravity I I Mixture Obtained From -Trench H Bul k SJ}eci fic Gravity I Excavation
--1 Hveem Stability I Laboratory Molded Hveem Cohes i ometer I Mixtures Table 5
----1 Indirect Tensile Strength 1 ----i Resilient Modulus 1
Figure 1. Laboratory Tests Performed by Division D-9 on Asphalt Concrete Surface Course Obtained from Trench Excavation
44
Mixture Obtained From Trench Excavation
r--f Extracti on ~ r--f Asphalt Content 1
y Gradation
I Bulk Specific Gravity I
r-i Bulk Specific Gravity 1 I---- ~ Hveem Stability 1 Standard
.--- Compaction { Hveem Cohesiometer 1 Effort
Tabl e 5 ~ Indirect Tensile Strength 1 Laboratory L-i Resilient Modulus
'---- t~ol ded ~
Mixtures ~ Compressive Strength
Reduced Pressure Pycnometer Compaction '--- Moisture Content Effort
Table 6 Lf Air Void Content
Figure 2. Laboratory Tests Performed by Division 0-9 on Black Base Obtained from Trench Excavation
1
1
I I
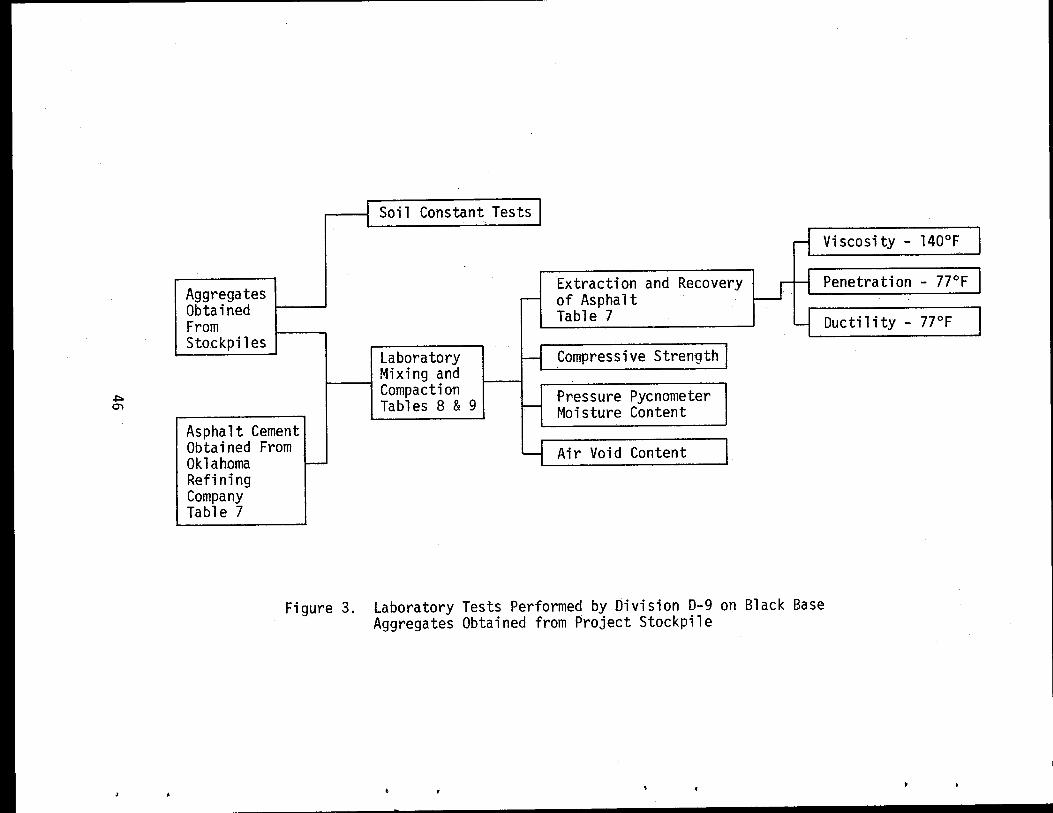
,Soil Constant Tests
r-1 Viscosity -
H Aggregates Extraction and Recovery Lr Penetration
r-- of Asphalt Obtained From
Table 7 ~ Ductility -Stockpiles
H Laboratory Compressive Strength Mixing and Compaction Pressure Pycnometer Tables 8 & 9 ~ t~oi sture Content
Asphalt Cement Obtained From y Air Void Content Oklahoma f--
Refining Company Table 7
Figure 3. Laboratory Tests Performed by Division D-9 on Black Base Aggregates Obtained from Project Stockpile
140°F I - 77°F I 7JOF 1

Material Obtained From Trench Excavation Table 10
rl Atterberg L imi ts I
I------+----Il Percent Soil Binder I Gradation I
Figure 4. Laboratory Tests Performed by Division D-9 on Subgrade, Lime Treated Subgrade and Subbase Obtained from Trench Excavation
47
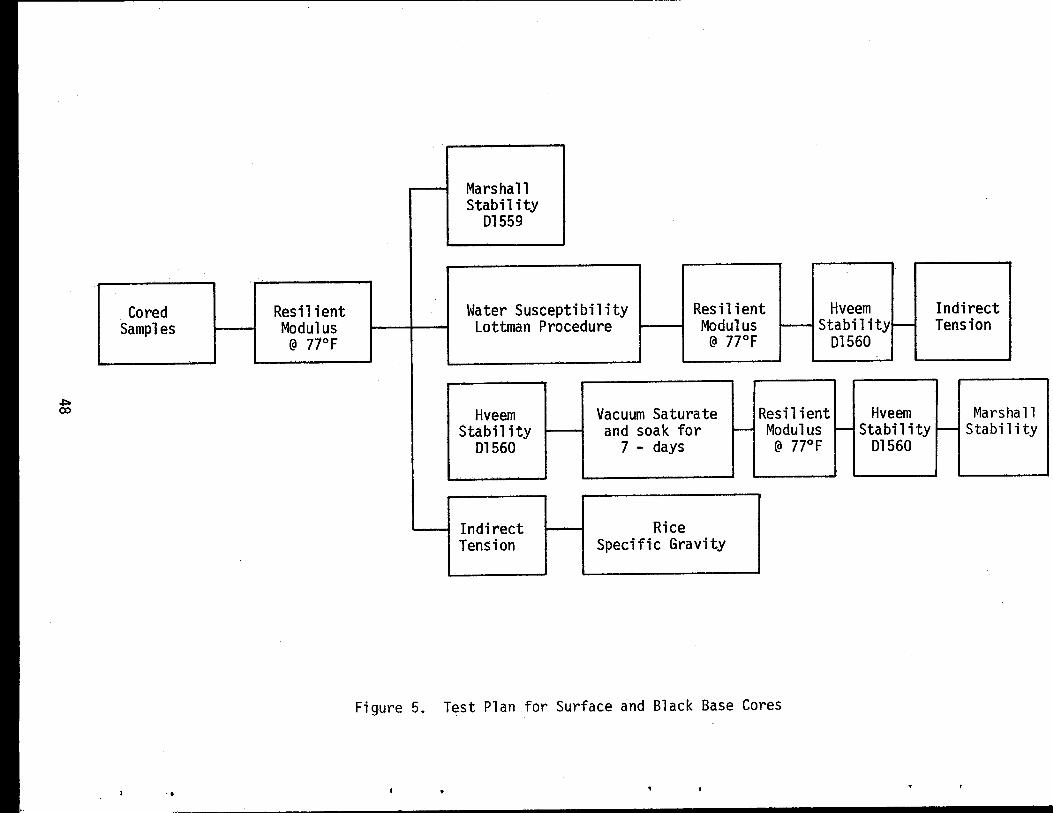
Cored Samples
Resilient Modulus @ 77°F
Marshall Stability
01559
Water Susceptibility Lottman Procedure
Resilient Modulus
@ 77°F
Hveem f-- Stabi 1 ity~
01560
Indirect Tension
Hveem Stabi1 ity
01560
Vacuum Saturate and soak for
Resilient Hveem Marshall
L-- Indirect Tension
7 - days
Rice Specific Gravity
f- Modul us -- Stabi 1 i ty - Stabi 1 i ty @ 77°F 01560
Figure 5. Test Plan for Surface and Black Base Cores
•
..
..
~ 'r-r-'r-.0 to ....,
V')
E Q) Q)
> :J:
'r-(/) Q.
.. M o r-
2 0
1 8
1 6
1 4
1 2
1 O
8
6
4
2
40 0
t--
t-
~
I-
t-
I-
r--
t-
r--
t-
I I
I-
~
x 30 01-e::
::E:
'r-r'r-(/)
&
i--
00 ~
t-
1 OO t--
t-
O
Before Water
Susceptibility Tests
After 7-Day Soak
Procedure
J 1
After Lottman
Procedure
Figure 6. Water Susceptibility Tests Results on Black Base Material on US 287.
49

..... r..... ..c n:l +l V)
E Q) Q)
> :c
..... III 0.
M o r-
.. III ::s r-::s "0
20 :.....-
18 -
16 -14 -
12 -10 ----8 f-
6 -4 -
2 I--
4 00 -
,....-
00 f-
-
~ 2 00 -+l s::: Q) ..... r..... III
~
~
1 00 -
-
0
Before Water
Suscept.i bi 1 i ty Tests
After 7-0ay Soak
Procedure
After Lottman
Procedure
Figure 7. Water Susceptibility Test Results on Asphalt Concrete Surface Material on US 2R7.
50
40 f- 120 -
100 f-.,.... til 30 0- f-..
('\')
0 80 f-,..... .,.... til
x 0-
W .. til .. til
til 20 r- QJ 60 I--;:, ~
c..n ,..... of.) --' ;:, V)
"0 0
::E
U 40 I--.,.... of.) til 10 ~ -,..... w
20 I-
0 0 I 1 Before After Before After Lottman Lottman Lottman Lottman
Procedure Procedure Procedure Procedure
Figure 8. Indirect Tension Test Results on Black Base Material on US 287.
.... en 0-
M 0 r-
)(
I.1J .. c.n en N ~
r-~ "0 0
::E:
u .... ...., en ItS r-I.1J
\
40 I--
30 10-
20 --
10 I--
o~------~--~------~--~---Before Lottman
Procedure
After Lottman
Procedure
.... en 0-.. en en QJ s.. ....,
V')
120
100
80
60
40
20
o
f-
I--
f--
I--
I--
!--
Before Lottman
Procedure
"-_.
After Lottman
Procedure
Figure 9. Indirect Tension Test Results on Asphalt Concrete Surface Material on US 287.
. II)
.0 r-
.. >,
of.J ..... r-..... .0 10 of.J
tTl V') W
r-r-10
oJ:: II)
~ 10
:E:
800
700
600
500
400
300
200
100
0
I--
~
I--
r-
f--
f--
,.--
I--
Before 7-Day Soak
Procedure
After 7-Day Soak
Procedure
40
35
30 .
E 25 r-
0 . 0 .. 20 ::: 0 r-U.
15
10
5
0
t--
t--
I--
~
-
'--
-t-
Before 7-Day Soak
Procedure
Figure 10. Marshall Test Method Results on Black Base Material on US 287.
After 7-Day Soak
Procedure

5
.,.. VI 0- 5 .. ex:
4
VI ::l r-::l -0 0
:E: ~
C <l.I ..... r-..... VI CJ c::
105 I t
a 50 roo 140
Temperature, of
-0-- Field Cores-Top Layer -'fr- Field Cores-Bottom Layer
Figure 11. Resilient Moqulus
54

200 _ A __
150
.. lOO .,...
til 0-
ft
til til Q) s.. ..,
V) 50
•
o ~------~------~--------~------~----o .0010 .0020 .0030 .0040
Strain, in./in.
o Layer A
o Layer B
.. Figure 12. Stress-Strain Relationship for Layers A & B at MP 8.8
55
l;t .... -.... ~ to
oW en
e Q) Q)
> :t:
. In
.Ll ,.... .. ~ .... .-..... ~ to oW en .-,.... to
.t:: In s.. to
:E:
40 ~
20 ...
a
4000 -
3000 -
2000 I-
1000 ~
a
Q) s.. s.. 0 cu
C+- oW Q) C+-
c::c <:
rv1a in Track layer A
'c
C]J s.. s.. 0 CJ
'+- ~
cu '+-c::l c:::
··c
Main Track layer A
·0
(:J S0- $. 0 cu
(f-, oW CJ C+-
c;, <:
Main Track Layer B
Cl) s.. s.. 0 C]J 4- -l-l <lJ '+-
c:l ex::
Main Track layer B
Figure 13. 7-0ay Soak Water Susceptibility Test
56

M 0 ..-)(
.... III 0-
III :::3
..-:::3 -0 a
:!E: .f-l c <lJ ..... r-.... III <lJ
et:
.... III 0-.. <lJ ~ :::3
.--.,... rt)
U.
.f-l rt)
Vl Vl <lJ ~ .f-l U')
1000 r-
800 I-
600 ;-
400 I-
200 l-
o
200 ....
100 -
a
<lJ ~ 0 4- ~ C'J <lJ
co .;..I q... e(
Main Track Layer A
<lJ ~ 0 4-(l) ~ co (l)
.f-l 4-cC
Hain Track Layer A
<lJ ~ 0 4-<lJ
co
~ ill .f-l 4-cC
Mai n Track Layer B
<lJ ~ ~ 0 <lJ 4- .f-l <lJ 4-
co cC
Plain Track Layer 8
Figure 14. Lottman Water Susceptibility Test
57
I
I