Embed Size (px)
Citation preview
1
2
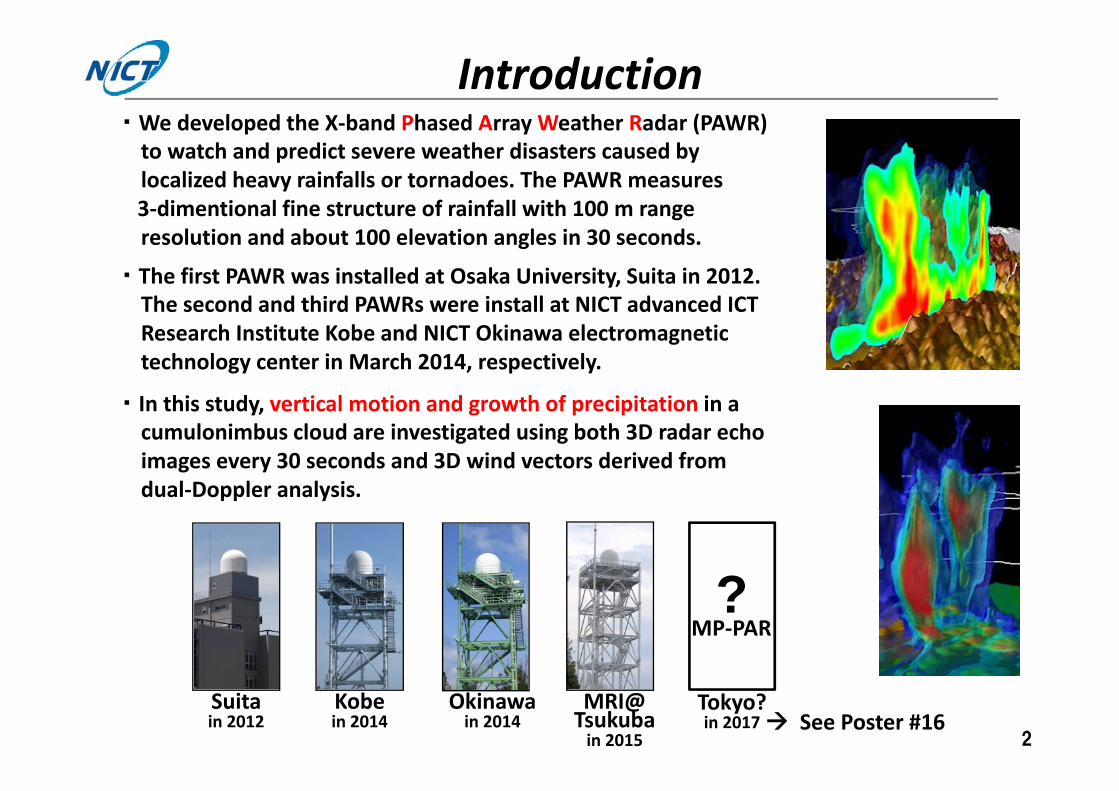
・ We developed the X‐band Phased Array Weather Radar (PAWR) to watch and predict severe weather disasters caused by localized heavy rainfalls or tornadoes. The PAWR measures 3‐dimentional fine structure of rainfall with 100 m range resolution and about 100 elevation angles in 30 seconds.
・ The first PAWR was installed at Osaka University, Suita in 2012. The second and third PAWRs were install at NICT advanced ICT Research Institute Kobe and NICT Okinawa electromagnetic technology center in March 2014, respectively.
・ In this study, vertical motion and growth of precipitation in a cumulonimbus cloud are investigated using both 3D radar echo images every 30 seconds and 3D wind vectors derived from dual‐Doppler analysis.
Introduction
?
Suita in 2012
Kobe in 2014
Okinawa in 2014
MRI@Tsukuba in 2015
Tokyo? in 2017
MP‐PAR
See Poster #16
3
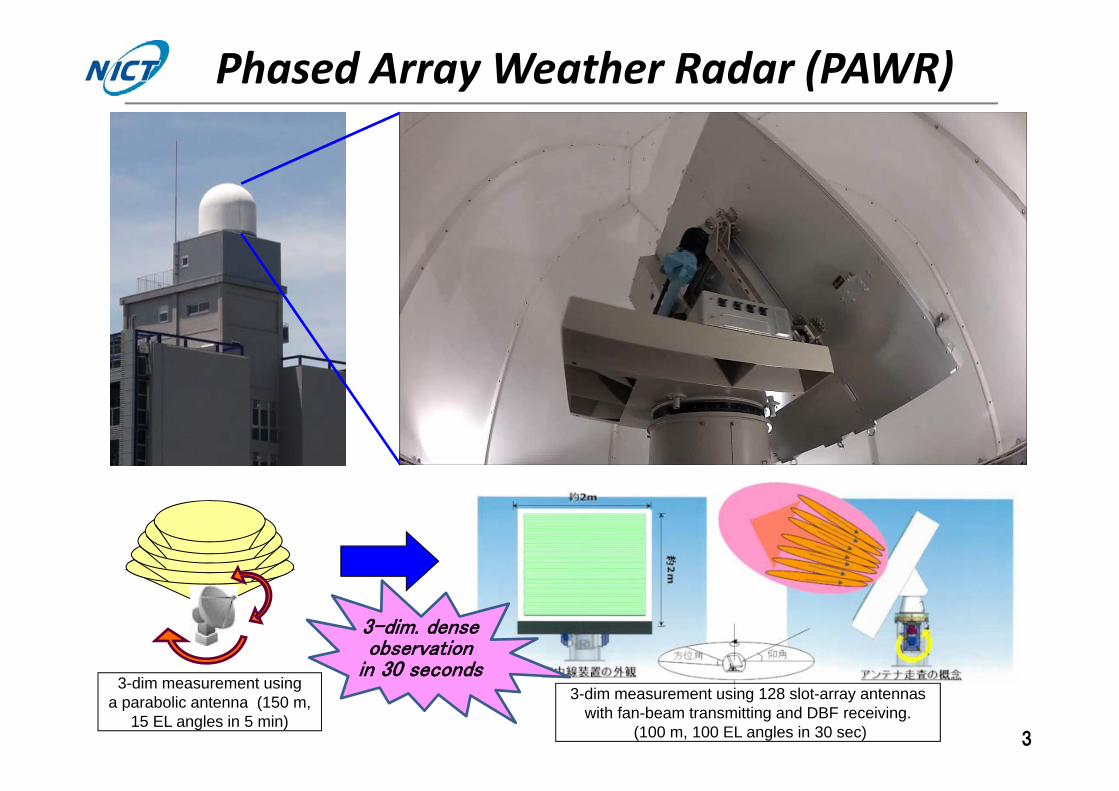
3-dim. denseobservation
in 30 seconds
Phased Array Weather Radar (PAWR)
3-dim measurement using a parabolic antenna (150 m,
15 EL angles in 5 min)
3-dim measurement using 128 slot-array antennaswith fan-beam transmitting and DBF receiving.
(100 m, 100 EL angles in 30 sec)
4
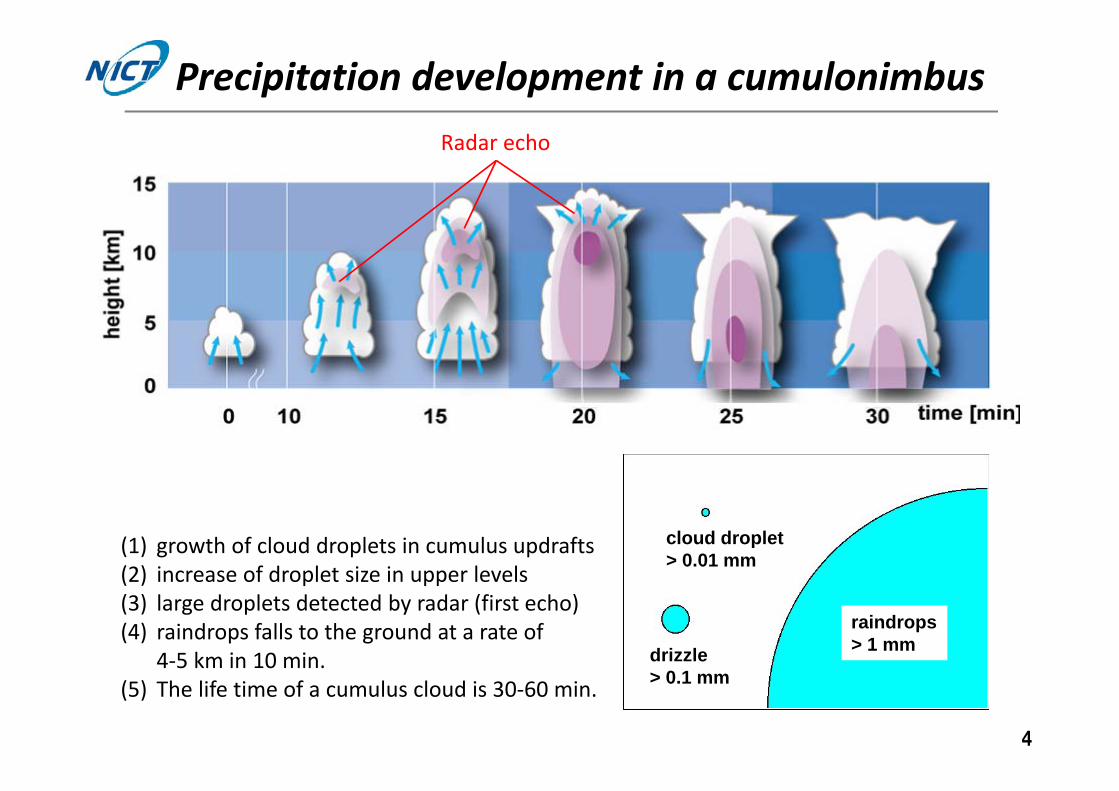
Precipitation development in a cumulonimbus
cloud droplet> 0.01 mm
drizzle> 0.1 mm
raindrops> 1 mm
(1) growth of cloud droplets in cumulus updrafts (2) increase of droplet size in upper levels(3) large droplets detected by radar (first echo)(4) raindrops falls to the ground at a rate of
4‐5 km in 10 min.(5) The life time of a cumulus cloud is 30‐60 min.
Radar echo
5
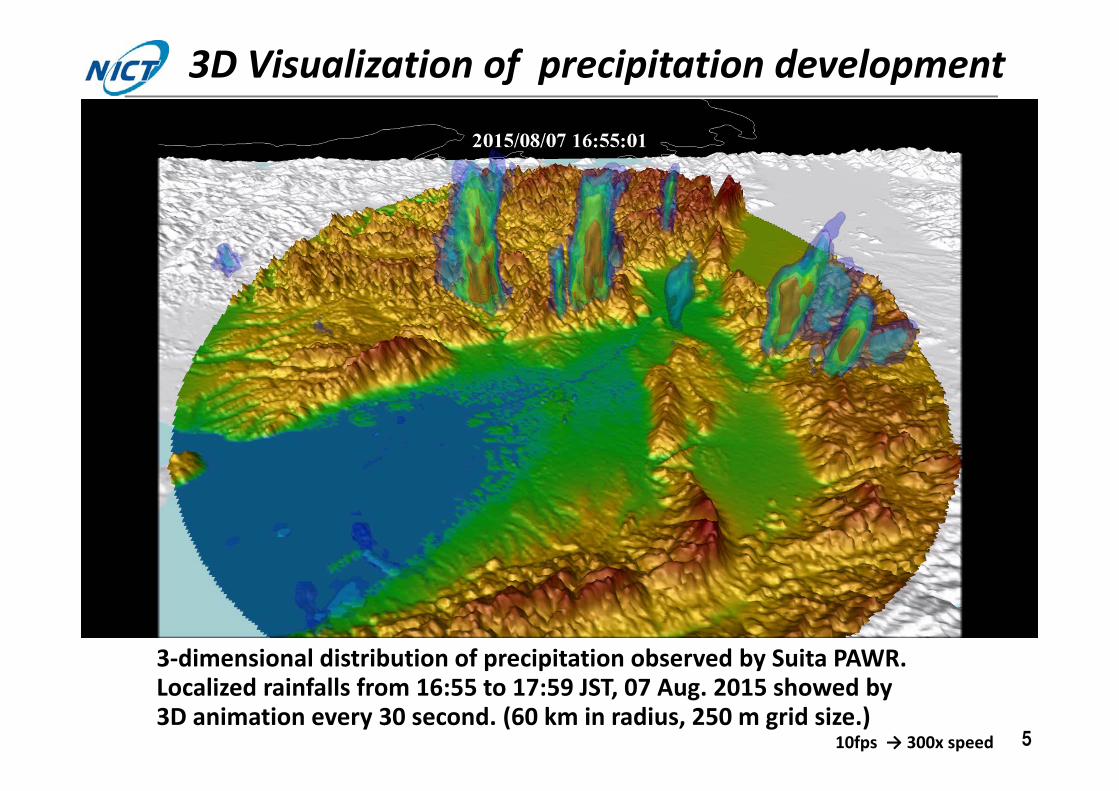
3‐dimensional distribution of precipitation observed by Suita PAWR. Localized rainfalls from 16:55 to 17:59 JST, 07 Aug. 2015 showed by 3D animation every 30 second. (60 km in radius, 250 m grid size.)
10fps → 300x speed
3D Visualization of precipitation development
6
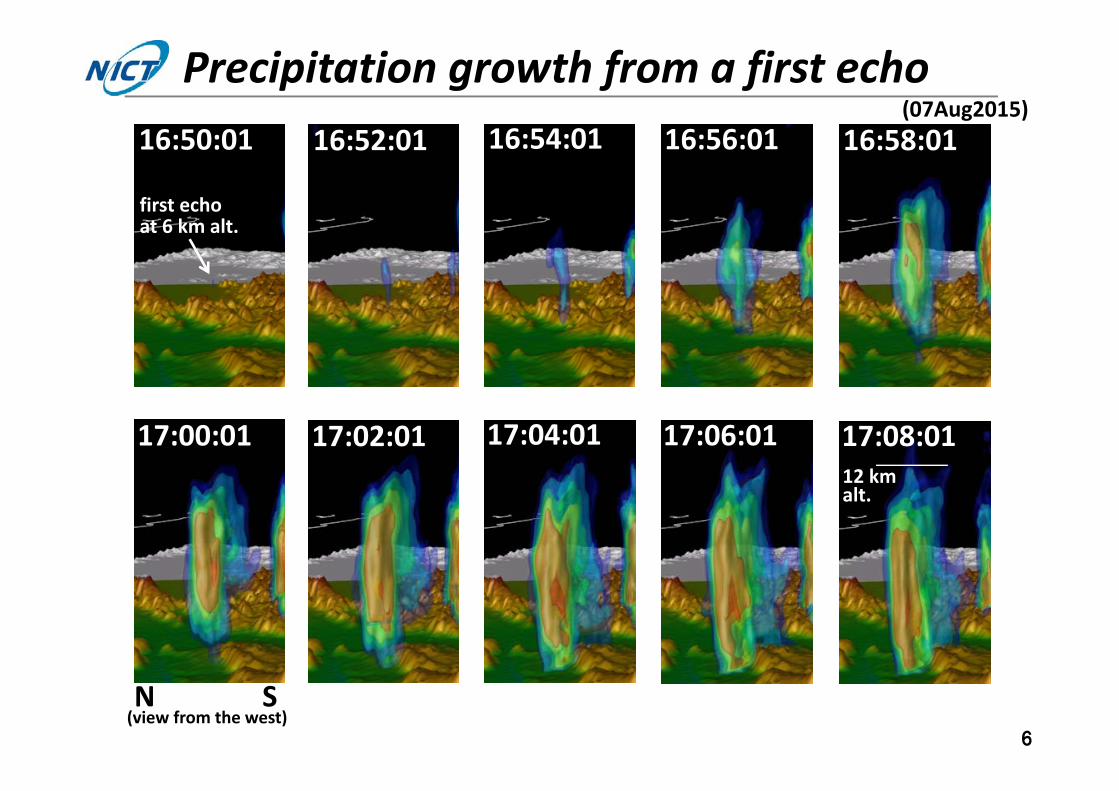
16:50:01 16:52:01 16:54:01 16:56:01 16:58:01
17:00:01 17:02:01 17:04:01 17:06:01 17:08:01
Precipitation growth from a first echo
N S(view from the west)
first echoat 6 km alt.
(07Aug2015)
12 kmalt.
7
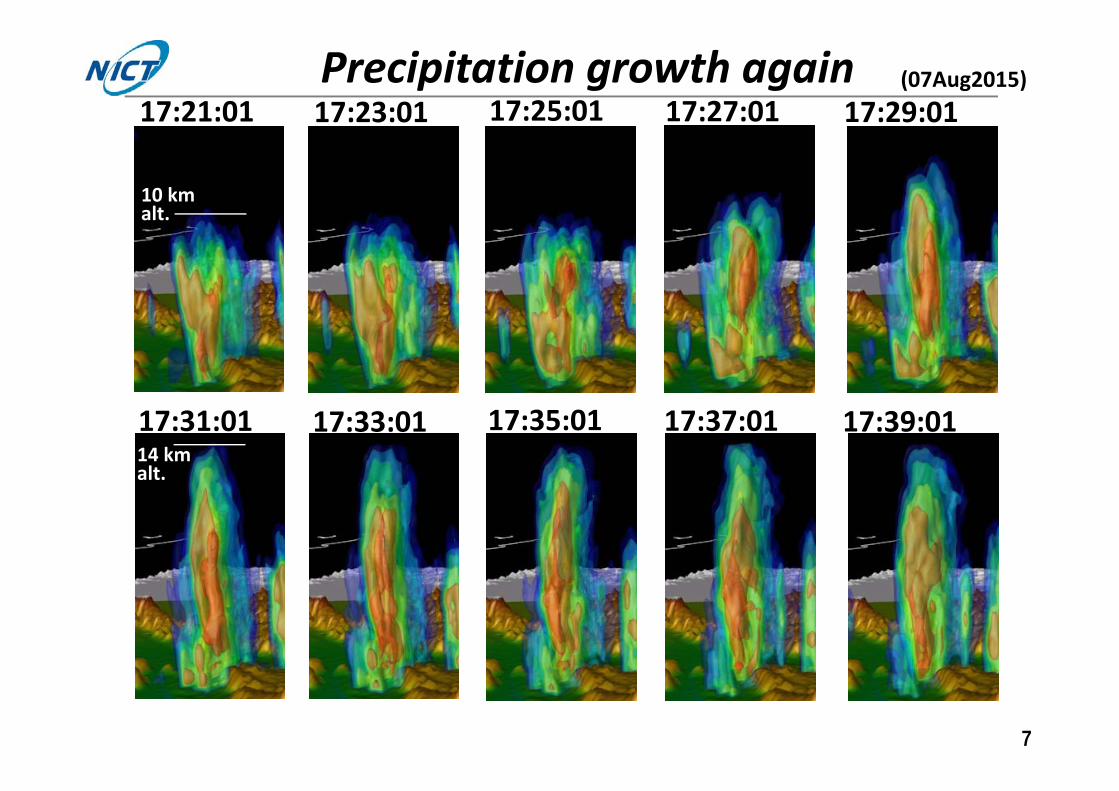
17:21:01 17:23:01 17:25:01 17:27:01 17:29:01
17:31:01 17:33:01 17:35:01 17:37:01 17:39:01
Precipitation growth again
10 kmalt.
14 kmalt.
(07Aug2015)
8
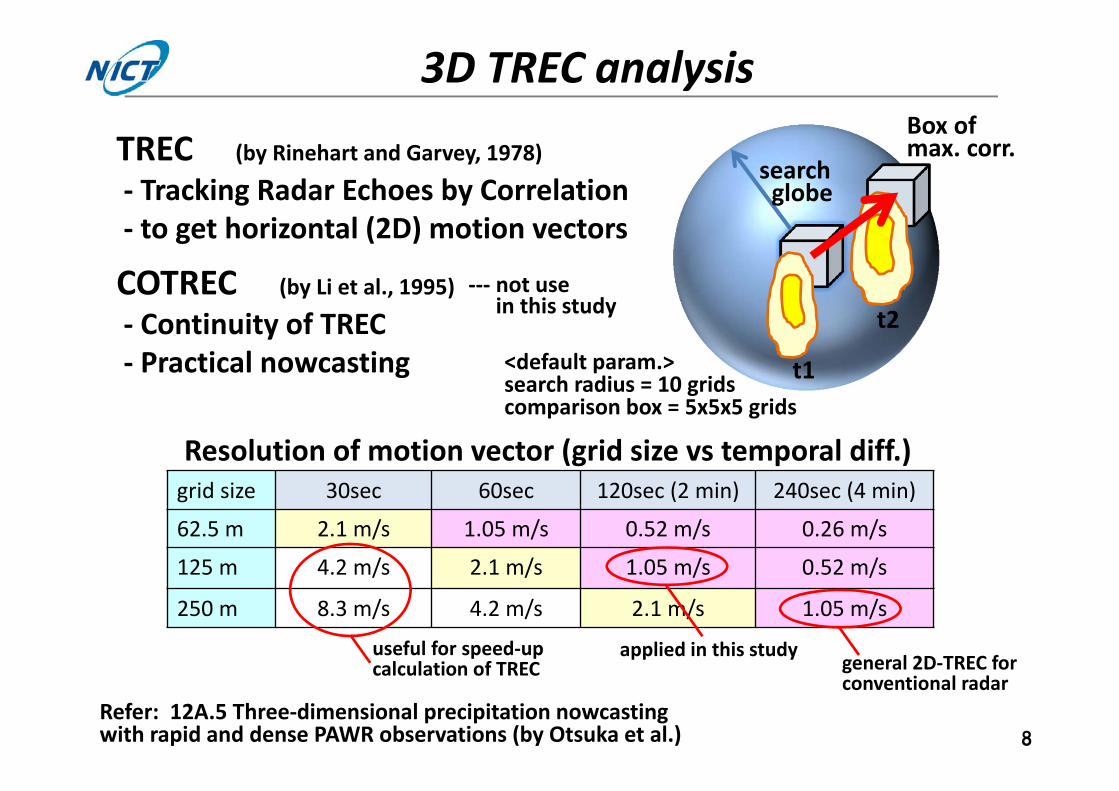
3D TREC analysis
t1
t2
searchglobe
Box of max. corr.TREC (by Rinehart and Garvey, 1978)
‐ Tracking Radar Echoes by Correlation‐ to get horizontal (2D) motion vectors
COTREC (by Li et al., 1995)‐ Continuity of TREC ‐ Practical nowcasting
Resolution of motion vector (grid size vs temporal diff.)
<default param.>search radius = 10 grids comparison box = 5x5x5 grids
grid size 30sec 60sec 120sec (2 min) 240sec (4 min)
62.5 m 2.1 m/s 1.05 m/s 0.52 m/s 0.26 m/s
125 m 4.2 m/s 2.1 m/s 1.05 m/s 0.52 m/s
250 m 8.3 m/s 4.2 m/s 2.1 m/s 1.05 m/s
general 2D‐TREC forconventional radar
‐‐‐ not usein this study
Refer: 12A.5 Three‐dimensional precipitation nowcasting with rapid and dense PAWR observations (by Otsuka et al.)
applied in this studyuseful for speed‐up calculation of TREC
9
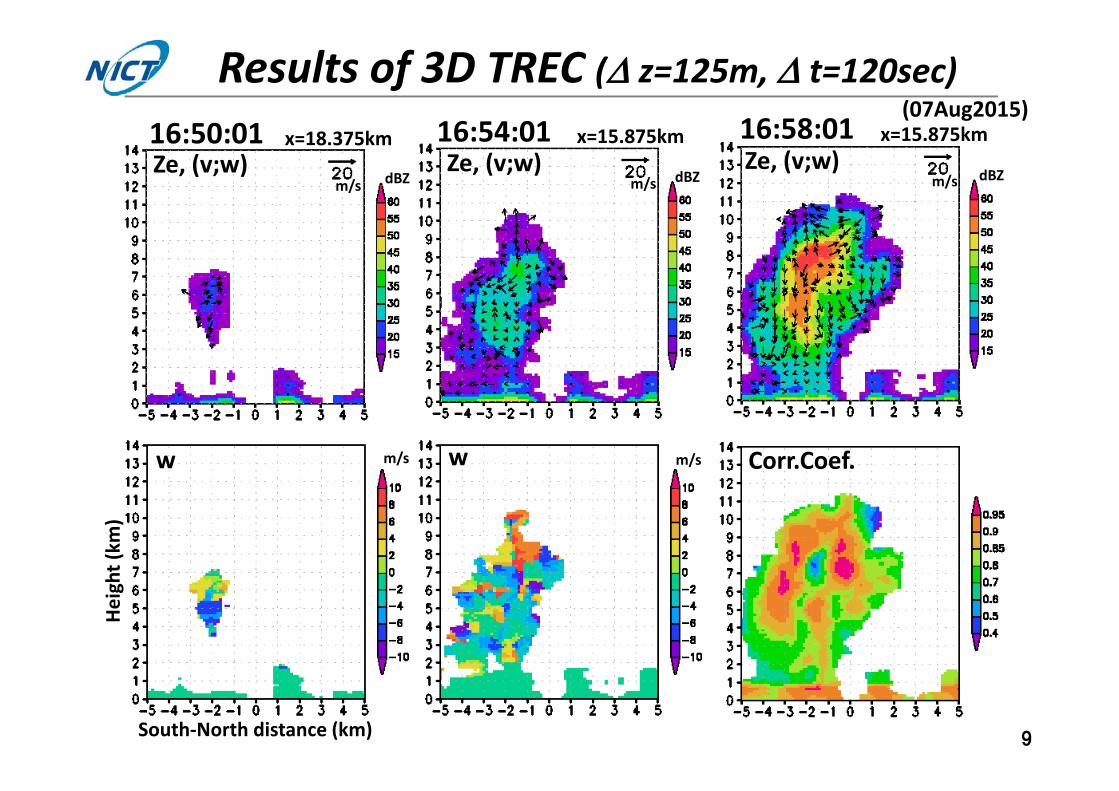
Results of 3D TREC (z=125m, t=120sec)
Corr.Coef.w
South‐North distance (km)
Height (km
)
m/s w m/s
16:50:01Ze, (v;w)
x=18.375km
dBZm/s
16:58:01Ze, (v;w)
x=15.875km
dBZm/s
16:54:01Ze, (v;w)
x=15.875km
dBZm/s
(07Aug2015)
10
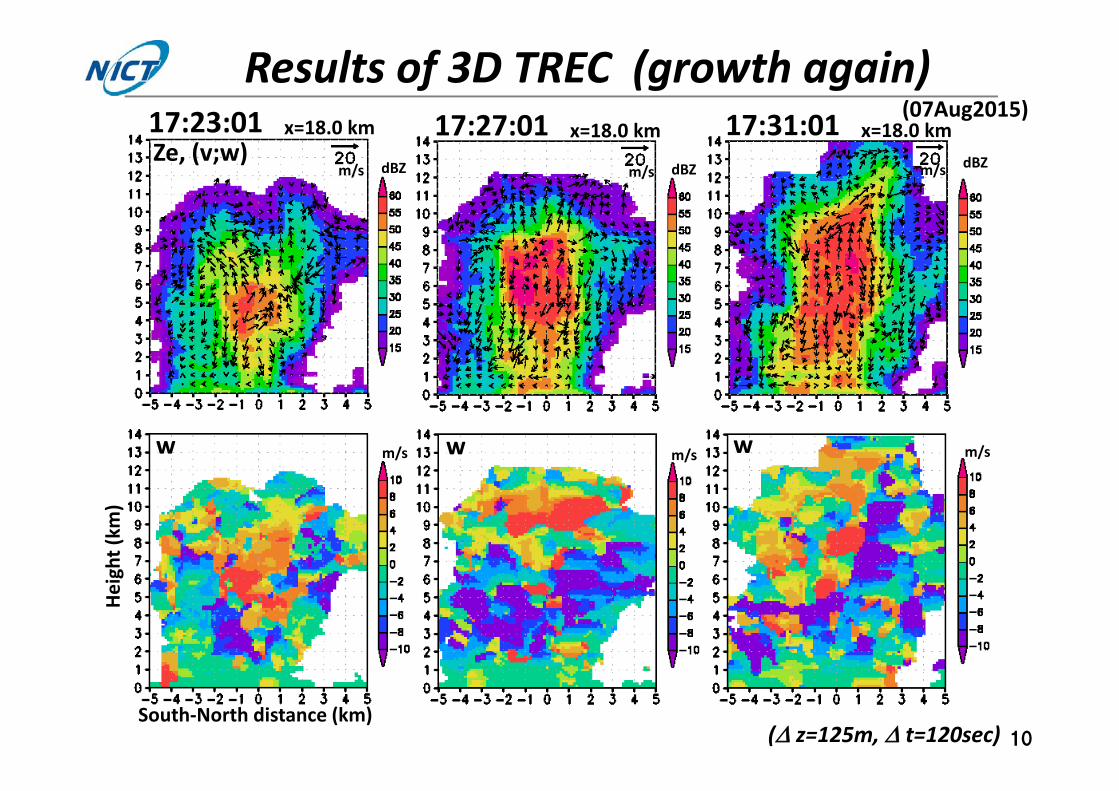
Results of 3D TREC (growth again)
w
South‐North distance (km)
Height (km
)
w w
17:23:01Ze, (v;w)
x=18.0 km
dBZm/s dBZm/s dBZm/s
m/s m/s m/s
(z=125m, t=120sec)
17:27:01 x=18.0 km 17:31:01 x=18.0 km(07Aug2015)
11
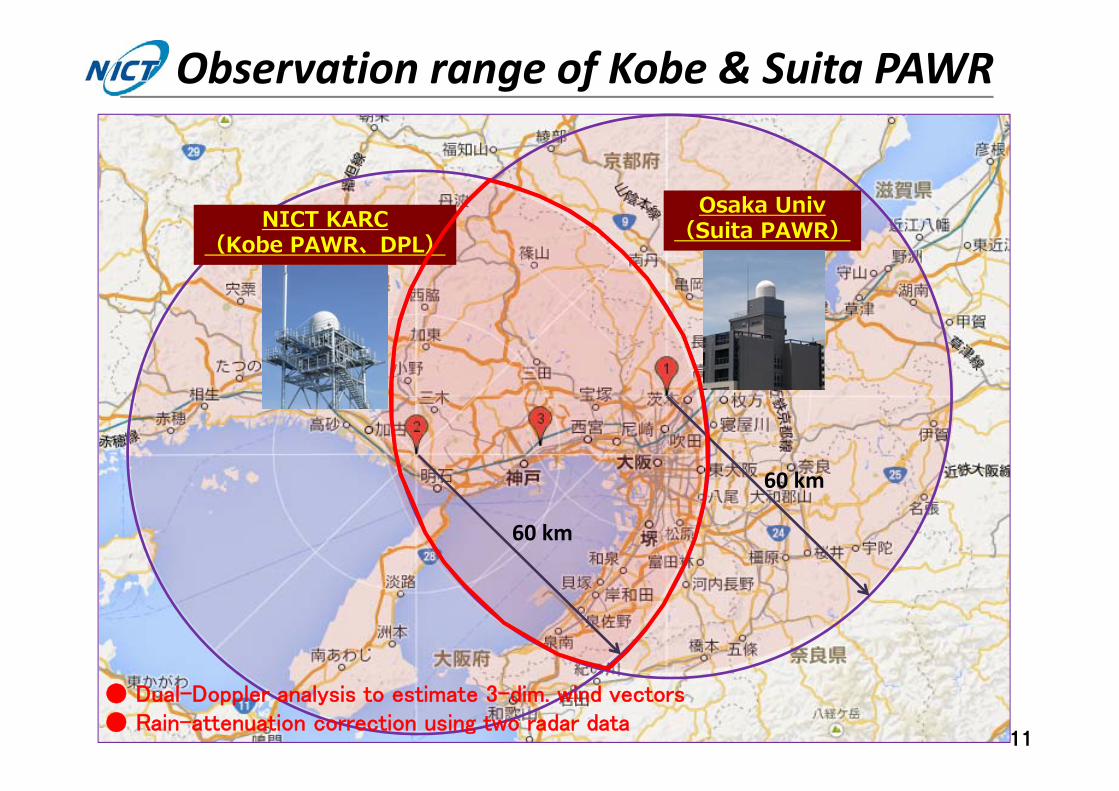
Osaka Univ(Suita PAWR)NICT KARC
(Kobe PAWR、DPL)
Observation range of Kobe & Suita PAWR
60 km
60 km
● Dual-Doppler analysis to estimate 3-dim. wind vectors● Rain-attenuation correction using two radar data
12
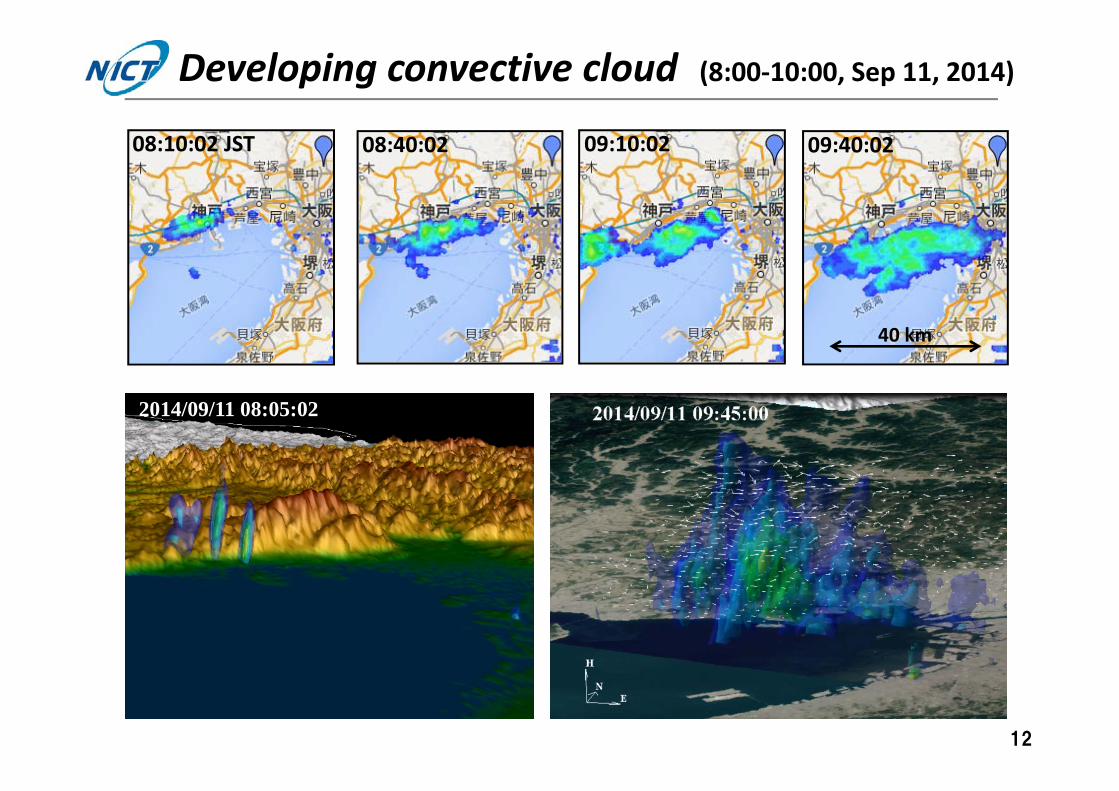
09:40:0208:10:02 JST 08:40:02 09:10:02
40 km
2014/09/11 08:05:02
Developing convective cloud (8:00‐10:00, Sep 11, 2014)
13
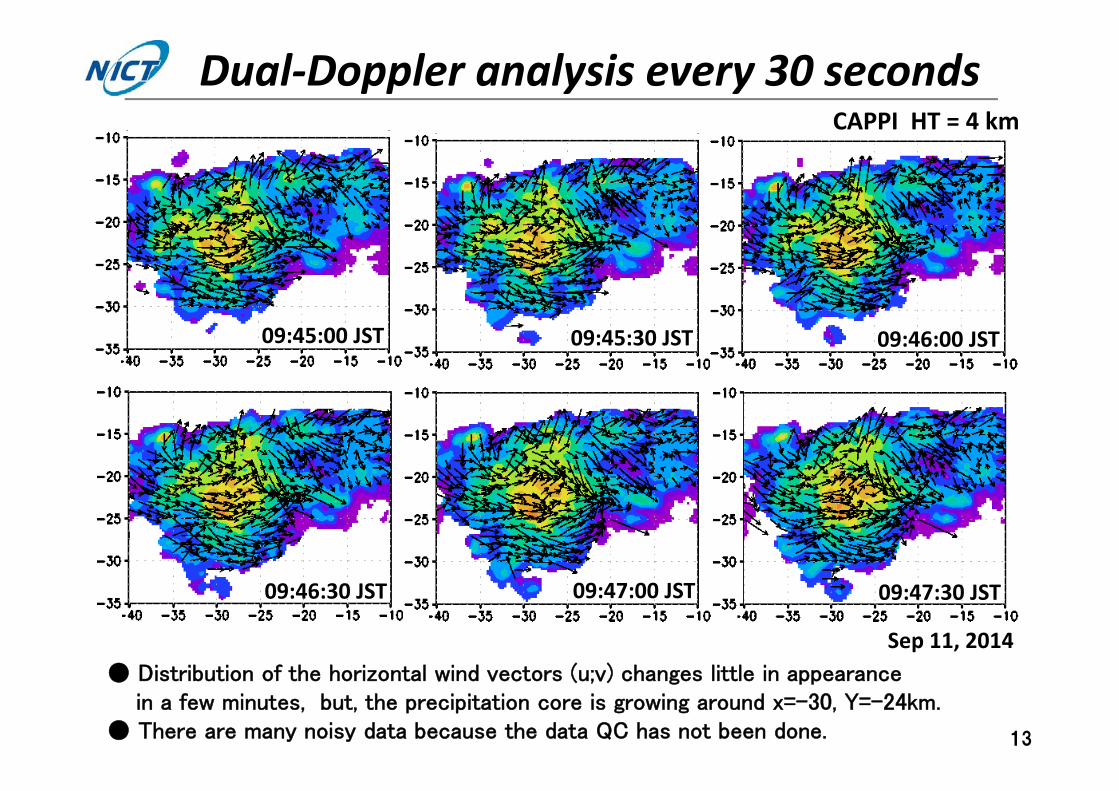
09:45:00 JST 09:45:30 JST 09:46:00 JST
09:46:30 JST 09:47:00 JST 09:47:30 JST
CAPPI HT = 4 km
● Distribution of the horizontal wind vectors (u;v) changes little in appearance in a few minutes, but, the precipitation core is growing around x=-30, Y=-24km.
● There are many noisy data because the data QC has not been done.
Dual‐Doppler analysis every 30 seconds
Sep 11, 2014
14
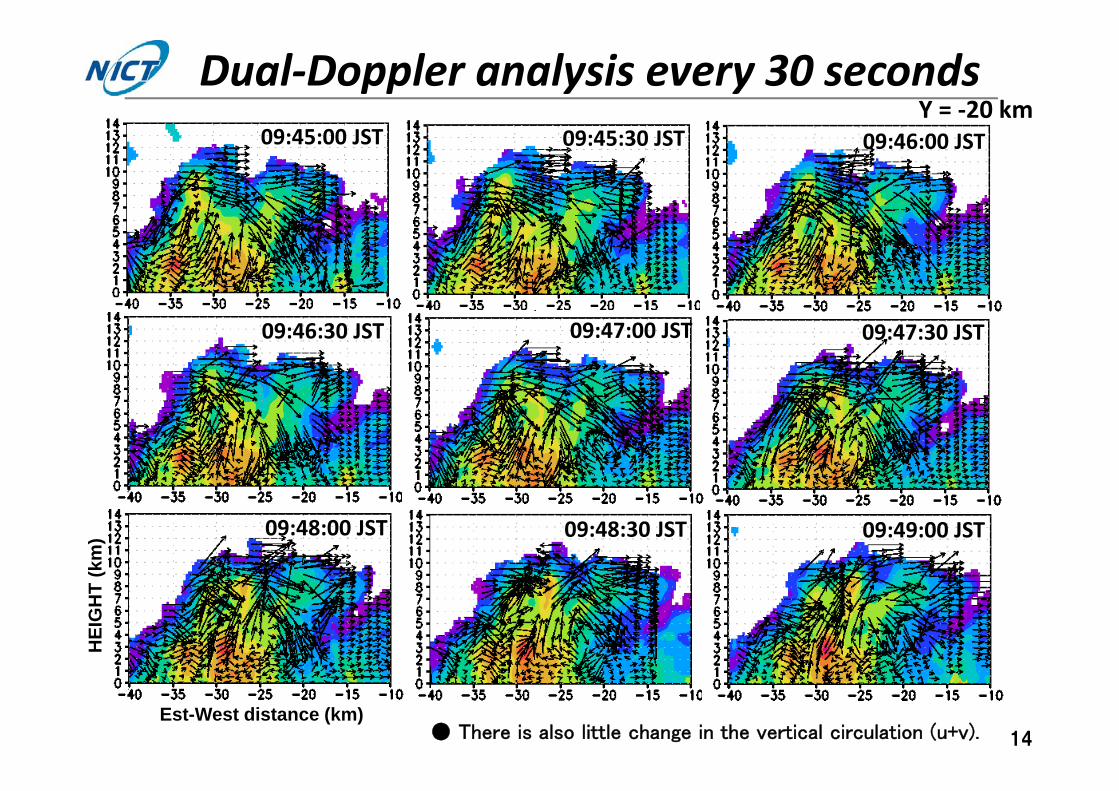
09:45:30 JST
09:46:30 JST 09:47:30 JST09:47:00 JST
09:46:00 JST09:45:00 JST
09:48:30 JST09:48:00 JST 09:49:00 JST
HEI
GH
T (k
m)
Est-West distance (km)
Y = ‐20 km
● There is also little change in the vertical circulation (u+v).
Dual‐Doppler analysis every 30 seconds
15
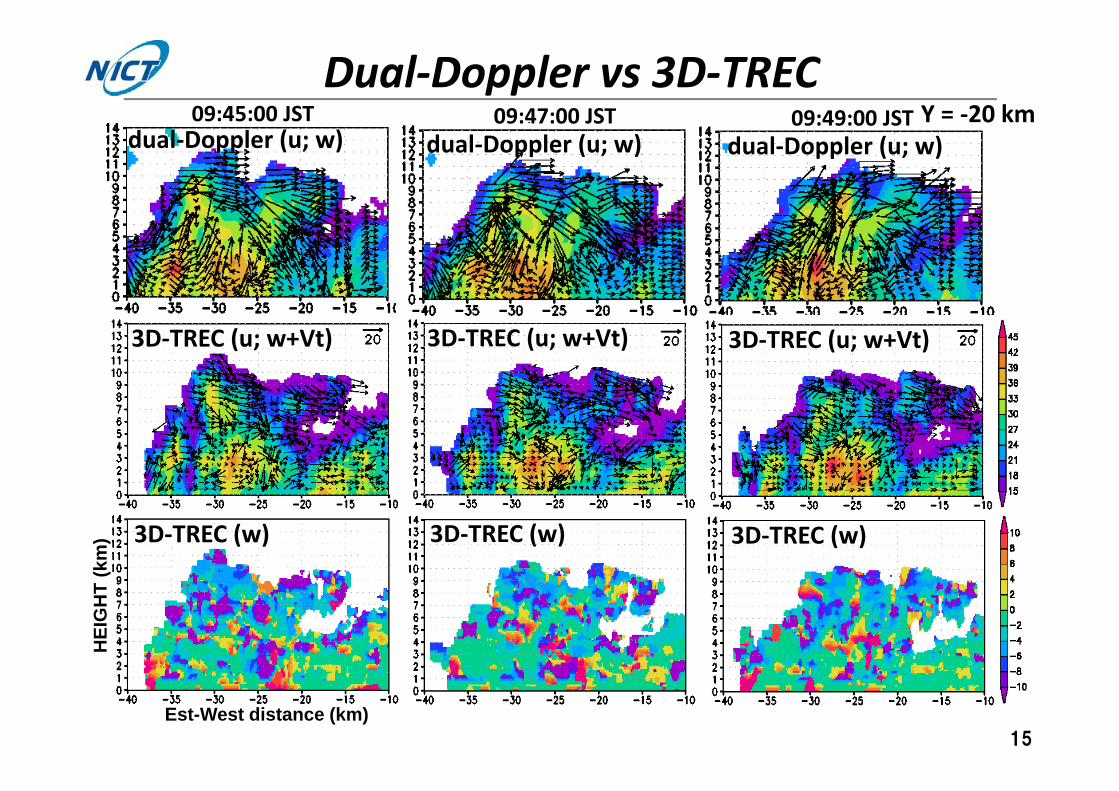
09:45:00 JST 09:49:00 JST09:47:00 JST
3D‐TREC (u; w+Vt)
dual‐Doppler (u; w)
3D‐TREC (w)
3D‐TREC (u; w+Vt)
3D‐TREC (w)
3D‐TREC (u; w+Vt)
3D‐TREC (w)
dual‐Doppler (u; w) dual‐Doppler (u; w)
Dual‐Doppler vs 3D‐TRECH
EIG
HT
(km
)
Est-West distance (km)
Y = ‐20 km
16
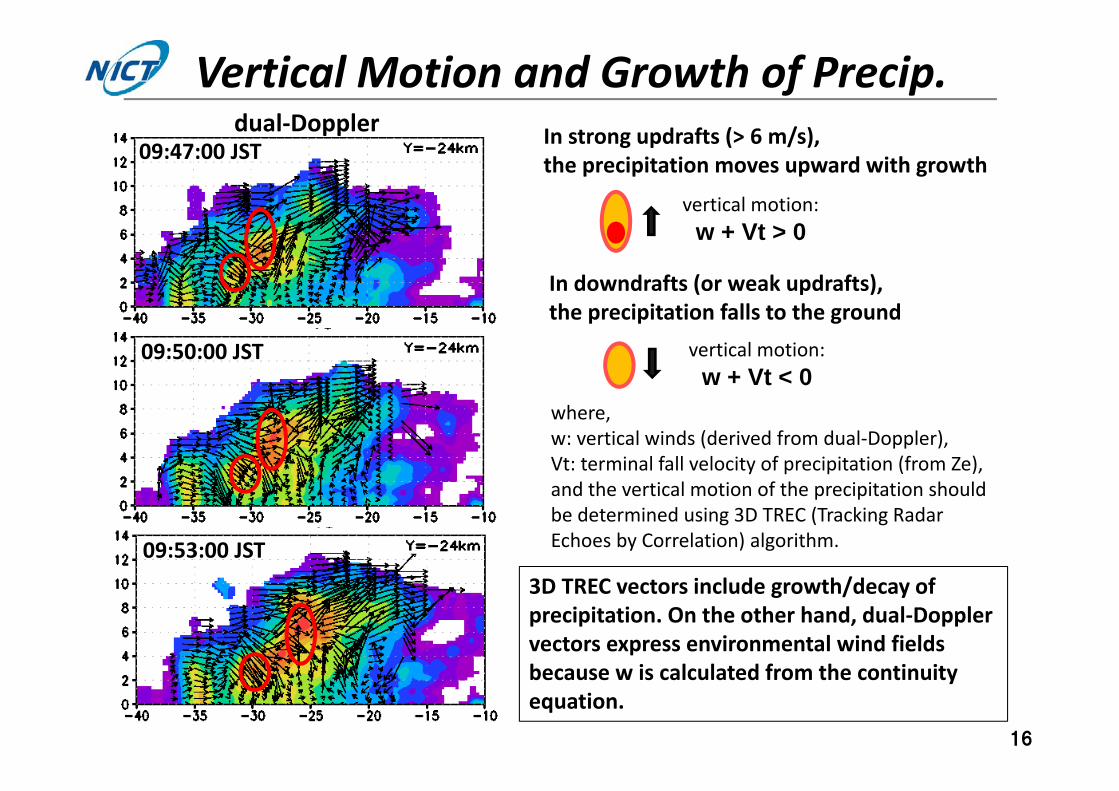
09:47:00 JST
09:50:00 JST
09:53:00 JST
In strong updrafts (> 6 m/s), the precipitation moves upward with growth
vertical motion:w + Vt > 0
where, w: vertical winds (derived from dual‐Doppler), Vt: terminal fall velocity of precipitation (from Ze), and the vertical motion of the precipitation should be determined using 3D TREC (Tracking Radar Echoes by Correlation) algorithm.
In downdrafts (or weak updrafts), the precipitation falls to the ground
3D TREC vectors include growth/decay of precipitation. On the other hand, dual‐Doppler vectors express environmental wind fields because w is calculated from the continuity equation.
vertical motion:w + Vt < 0
Vertical Motion and Growth of Precip.dual‐Doppler
17
The phased array weather radar (PAWR) measures precipitation development from the first echo appearance with high spatial‐temporal resolution (100 m, 100 EL angles, 30 seconds).
3D‐TREC algorithm reveals the vertical motion and growth of precipitation. Every 30 seconds data will be useful to speed‐up calculation of TREC.
Dual‐Doppler analysis shows that wind vectors in the convective circulation every 30 seconds, that are maintained for at least several minutes.
Precipitation is basically growing in the updraft region, although the vertical motion calculated by 3D‐TREC is different from the dual‐Doppler vertical wind.
Summary