Embed Size (px)
Citation preview
Pay for People:
Compensating Tennessee’s State Workers
John G. Morgan Comptroller of the Treasury
Office of Research May 2004
STATE OF TENNESSEE
John G. Morgan COMPTROLLER OF THE TREASURY
Comptroller STATE CAPITOL
NASHVILLE, TENNESSEE 37243-0264
PHONE (615) 741-2501
May 10, 2004 The Honorable John S. Wilder Speaker of the Senate The Honorable Jimmy Naifeh Speaker of the House of Representatives and Members of the General Assembly State Capitol Nashville, Tennessee 37243 Ladies and Gentlemen: Transmitted herewith is a report by the Office of Research about state employee compensation in Tennessee, as directed by Public Chapter No. 208 (2003). The report examines the size and composition of the state government workforce and evaluates both the level and structure of state employee compensation. It also provides options for the state to increase its ability to attract and retain quality employees and raise the productivity of the state government workforce. Sincerely, John G. Morgan Comptroller of the Treasury
Pay for People: Compensating Tennessee’s State Workers
Kevin Krushenski
Associate Legislative Research Analyst
Richard Gurley Senior Legislative Research Analyst
Alisa Palmisano
Associate Legislative Research Analyst
Ethel R. Detch, Director Douglas Wright, Assistant Director
Office of Research 505 Deaderick Street, Suite 1700
Nashville, TN 37243-0268 615/401-7911
www.comptroller.state.tn.us/orea/reports
John G. Morgan Comptroller of the Treasury
May 2004

Comptroller of the Treasury, Office of Research. Authorization Number 307319, 600 copies, May 2004. This public document was promulgated at a cost of $2.23 per copy.
i
Executive Summary Tennessee spent $1.6 billion, about eight percent of the total state budget, on salary and benefits for approximately 44,000 full-time state employees in fiscal year 2003. This amounted to over $38,000 per employee. Critics have assailed state employee compensation from both sides. Supporters of higher compensation argue that state employees are severely underpaid relative to counterparts in the private sector and other public sector employers. At the same time, opponents of higher compensation argue that state employees often produce low-quality work and may be overpaid. In reality, state employee compensation is substantially more complex than either argument would indicate. Compensation—only one piece of human resource management—is comprised of an assortment of salary and benefits.
State government must provide stable core services for the general public affecting basic health, safety, and economic activity. As a result, the public sector workforce is not completely comparable to that of the private sector, yet the state still must compete with the private sector for workers. In addition, the public sector can benefit from private sector innovations and ideas.
The Comptroller of the Treasury’s Office of Research conducted a survey, the State Employee Opinion Survey, of state employees in September 2003. The survey results are cited throughout the report.
This report:
• Provides a brief history of human resource management in the public sector; • Examines the size and composition of the state government workforce in the context
of the Tennessee labor market; • Evaluates both the level and structure of Tennessee state employee compensation and
provides comparisons with other public and private sector employers; and • Outlines options for Tennessee to increase its ability to attract and retain quality
employees and raise the productivity of the state government workforce.
Tennessee has fewer state employees per capita than most other Southeastern states. According to data from the Southeastern States Salary Conference, only Alabama and Florida have fewer state employees per capita. Spending on state employee salaries in Tennessee for 2002 was about $234 per capita, third lowest in the Southeast and significantly less than the regional average of $313.
This report concludes:
Salaries for many state positions are below salaries for comparable jobs at other public and private sector employers. In addition, state employee salaries may not be highly correlated with the value of employees’ labor. Tennessee last conducted a comprehensive study, with accompanying overhaul of the state employees’ compensation and classification system, in 1984. Since then, the General Assembly has provided general raises for state employees most years and some additional funding for hard-to-staff positions, but pay increases for many state government jobs have failed to keep pace with the market. Salaries for many positions are below typical market rates and appear to be falling further behind. As the first group of departments implements performance-based budgeting standards in fiscal year 2004-05, departmental leadership needs to consider each employee’s role in fulfilling the
ii
overall mission. Employers should evaluate pay scales to discern whether they accurately reflect the positions and the difficulty of work required. (See page 19.)
Tennessee government’s compensation structure lacks explicit provisions to reward performance. Tennessee’s overall approach to human resource management may inadvertently discourage improved performance. Research has demonstrated that tying compensation to performance increases employee motivation and output. Survey results indicate that a majority of state employees would support a pay for performance system. However, Tennessee government does not have such a system in place. Most state employees believe that it is hard for good employees to get promotions.
Tennessee has some compensation strategies that tie compensation to years of service with the state (annual leave, longevity pay, and retirement) or family status (insurance). Providing various levels of compensation based on factors other than performance can distort the labor market and decrease the likelihood that some high-quality candidates will work for state government. (See pages 19-26.)
Its culture and compensation structure may make Tennessee state government unattractive to many potential employees. State government lacks explicit incentives to reward high performance. Research has shown that performance incentives tend to attract talented and highly motivated employees. Since some other employers provide performance-based pay and Tennessee does not, many talented and motivated employees will choose not to work for state government.
Members of the labor market are becoming more mobile. Though in the past Americans often expected to spend their careers with one employer, many now plan to work for a variety of employers during their professional lives. Because longevity pay, annual leave, and retirement benefits become more generous as employee tenure increases, employment with the state is less attractive to these employees.
Finally, potential employees who value career advancement are likely to avoid state government. Over 70 percent of respondents to the State Employee Opinion Survey agreed that “[i]t is hard for good state employees to get promoted.” Two primary factors limit advancement opportunities within Tennessee government. First, state government is a mature industry. In growing firms or growing economic sectors, employees can move up because new jobs are created. However, the number of state employees is relatively stable. Experienced state employees have low turnover. Thus, management positions seldom become vacant. These factors limit advancement opportunities in state government. (See pages 26-27.)
Despite these issues, employee tenure in Tennessee government remains high. The 2003 median employee tenure for state employees was nine years, longer than the median for government employers nationwide or the private sector. Several factors probably contribute to this. State employees are less likely to be fired or laid off than workers at other employers. Forty percent of state employees believe that some employees in their divisions should be fired, and several interviewees cited civil service protections as an impediment to firing poor employees. If employees perceive reluctance on the part of managers to fire ineffective employees, some may respond by putting forth only minimal effort because they think it unlikely that they will be terminated. Data from the State Employee Opinion Survey appears to support this hypothesis. Managers in the career service were also more likely than
iii
managers in the executive service to agree with the statement: “I have difficulty motivating the people I supervise.” (See pages 27-30.)
Although Tennessee state government’s workforce has been stable, market and demographic forces likely will cause significant human resource challenges in the coming years. Over half of the managers in Tennessee government are already eligible to retire with full or partial benefits. Though Tennessee government has managed to retain employees in recent decades, replacing those employees when they retire may prove more difficult. Low overall average compensation, coupled with minimal consequences for poor performance or rewards for superior performance, will continue to make Tennessee government a less attractive place to work for high quality employees. Thus, Tennessee government’s proven success in retaining employees will not necessarily translate into an ability to hire sufficient talent to replace future retirees. The state of Tennessee could face a significant shortage of quality staff in the coming years. (See pages 30-31.)
Tennessee government lacks a comprehensive strategic approach to state employee compensation. In fiscal year 2003, the average full-time Tennessee state employee salary was $31,728. Of that amount, an average of $1,130 (3.6 percent) was longevity pay. Employees received $6,622 in benefits on average, equal to over 21 percent of the average salary. Employees also receive substantial benefits in paid time off through holidays, annual leave, sick leave, and a shorter full-time workweek. Although not an actual cash benefit, the average estimated value of paid time off for state employees was $7,374, equivalent to more than 23 percent of their average salary.
Employees receive a substantial portion of their compensation outside base salary in the form of benefits and longevity pay. Neither the Department of Personnel nor any other entity in state government has established a formal process for evaluating the effectiveness of state compensation strategies in attracting, retaining, and motivating state employees. Furthermore, the framework for establishing the cost of individual compensation components is scattered throughout state government with many benefit levels established in statute. Tennessee could make its overall compensation package more attractive by focusing resources in particular areas. Allowing employees to channel their compensation to benefits they most value could increase the satisfaction level of current employees and the attractiveness of state government to potential employees. (See pages 31-33.)
Tennessee government offers richer benefits than many public and private sector employers. Failure to clearly articulate the value of these benefits limits their use as a recruitment and retention tool. Although salaries in Tennessee government are lower than many private and public sector employers, many other factors—a shorter full-time workweek, significant paid time off, and generous benefits—make Tennessee state government an attractive place to work. Though state employees realize these benefits are valuable, they often do not understand the true cost. Failure to understand the value of benefits will make job opportunities at other employers, where salaries are often higher and benefits lower, more attractive to current and potential state employees. (See pages 33-34.)
Tennessee’s civil service laws likely impede the hiring and promotion of some high-quality applicants and employees. More than 37,000 of Tennessee government’s 44,000 state employees are within career service, traditionally known as civil service. State law requires the Department of Personnel to maintain employment lists and promotion lists based
iv
on scores from competitive examinations for job openings within career service. Though these examinations may include tests, they are often based on education and experience. A promotion list includes candidates with the three highest scores, and an employment list (for new hires) includes candidates with the five highest scores. Agencies must hire from these lists for career service positions.
Critics of civil service argue these lists limit access to some quality applicants. They contend that those at the top of registers and promotion lists are frequently of lower quality than those below them. Several states have moved to zone scoring to allow managers to choose from a larger applicant pool, and some have abandoned employment lists altogether. These strategies can increase the likelihood that state managers will have the legal authority to hire the most qualified candidates. (See page 35.)
Many state managers fail to provide sufficient feedback and direction to employees through regular communication and evaluations. Few things are more critical to the success of state government than communication between management and subordinates. Managers define subordinate duties and how they support the goals of the broader organization. Effective performance evaluations provide employees feedback on performance and the steps they can take to improve their performance. State regulations require “periodic reviews of job performance” including “a formal written assessment of the employee’s performance” for all career service employees. Multiple interviewees noted that many state managers fail to communicate effectively with their subordinates, and employee evaluations are generally infrequent and often contain little useful information on employee performance. Finally, interviewees commented that many managers consistently give employees positive evaluations to “keep the peace,” even if employees are performing poorly. In those cases, if a manager eventually decides an employee’s performance warrants termination, that manager’s evaluations provide evidence against the termination in employee appeals. (See page 36.)
Recommendations (See pages 37-39.) Legislative The General Assembly may wish to mandate a new comprehensive pay plan and adjust state employee salaries to reflect it.
The General Assembly may wish to amend some sections of TCA §8-30-214 to allow state agencies to implement pay for performance pilot programs to determine the feasibility for state government.
The General Assembly may wish to amend some sections of TCA Title 8, Chapter 30 to give state managers greater flexibility in personnel matters. Several other states have deregulated their personnel systems in recent years.
The General Assembly may wish to allow incremental bonuses for employees with satisfactory performance during their first five years of employment. Turnover is highest among the state’s newest employees. Providing incentives to those employees might improve retention.
v
The General Assembly and state Treasurer, working with the administration, should consider whether to allow state employees greater flexibility in allocation of salaries and benefits. State officials might want to consider a hybrid retirement option or allow employees to vest in the retirement plan with fewer years of service. Perhaps the state could provide a greater contribution to the 401(k) plan. Retention of younger employees should be a major consideration in any changes.
Administrative The Department of Personnel, working with the State Treasurer, should consider mandatory training for all new employees about various retirement investment strategies and related issues.
The Department of Personnel should review the present evaluation system, particularly training provided to managers, and consider ways to make it more effective. Communication between managers and employees, both informal and through employee evaluations, is critical to establish expectations, convey the extent to which expectations have or have not been met, and shape strategies to improve employee performance.
The Department of Personnel may wish to consider ways to market state government employment in a manner that clearly articulates employee benefits.
Table of Contents Introduction ....................................................................................................................... 1
Methodology...................................................................................................................... 1
Background....................................................................................................................... 2
Government Human Resource Management—A Brief History ............................. 2
State Employees in the Tennessee Labor Market ................................................ 3
State Workforce Size....................................................................................... 3
State Workforce Demographics ...................................................................... 6
State Workforce Quality .................................................................................. 7
State Employee Compensation in Context............................................................ 7
Salaries ........................................................................................................... 8
Workweek...................................................................................................... 10
Paid Time Off ................................................................................................ 11
Health Insurance ........................................................................................... 12
Retirement Plans........................................................................................... 13
Other Benefits ............................................................................................... 15
Flexible Benefits ............................................................................................ 16
Intangible Benefits......................................................................................... 17
Merit Pay in Tennessee....................................................................................... 18
Analysis and Conclusions ............................................................................................... 19
State salary levels low compared to private and other public employers............ 19
State salary structure does not allow for rewarding performance ....................... 19
Team-Based Rewards................................................................................... 22
Nonmonetary Rewards.................................................................................. 22
Implementation Challenges........................................................................... 23
Lessons in Pay for Performance ................................................................... 25
Broadbanding ................................................................................................ 26
State government culture and compensation structure unattractive ................... 26
Employee tenure high despite societal changes ................................................. 27
Significant human resource challenges expected ............................................... 30
Strategic approach to state employee compensation lacking ............................. 31
State employee benefits are valuable, but not clearly articulated ....................... 33
Civil service laws may impede hiring and promotion of quality employees......... 35
Managerial feedback and direction to employees need improvement ................ 36
Recommendations .......................................................................................................... 37
Legislative ........................................................................................................... 37
Administrative...................................................................................................... 38
Appendix A: Organizations/Persons Interviewed ............................................................ 40
Appendix B: State Employee Opinion Survey................................................................. 42
Appendix C: Public Chapter 208, 2003 ........................................................................... 51
Appendix D: Response from Department of Personnel .................................................. 52
List of Exhibits Exhibit 1: Employment in Tennessee by Sector, 2002......................................................4
Exhibit 2: State Employees per Capita in Southeastern States, 2002 ..............................5
Exhibit 3: State Employee Salary Cost per Capita in Southeastern States, 2002 ............5
Exhibit 4: Officials and Administrators Retirement Eligibility .............................................6
Exhibit 5: State Government Employees and Statewide Workforce by Age, 2003 ...........7
Exhibit 6: Average Annual Salaries for Selected Occupations..........................................9
Exhibit 7: Full-Time Workweek among Regional Government Employers, 2002............10
Exhibit 8: Paid Time Off among Regional Government Employers, 2002 ......................11
Exhibit 9: Employer Share of Health Insurance Premiums among Regional Employers .......................................................................................................................12
Exhibit 10: Employer Cost of Defined Benefit Retirement Plans as Percent of Final Salary, 2003 ...........................................................................................................14
Exhibit 11: Relative Importance of Job Aspects to Tennessee State Employees...........18
Exhibit 12: Tennessee Employee Openness to Pay for Performance ............................24
Exhibit 13: Median Employee Tenure in 2002 and 2003 ................................................28
Exhibit 14: Turnover Rates by Employee Tenure, 1999-2000 ........................................30
Exhibit 15: State Government Employees by Age, 1987 and 2003 ................................31
Exhibit 16: Relative Cost of Employee Benefits for Tennessee Government .................32
Exhibit 17: Relative Importance of Benefits to Tennessee State Employees .................33
Exhibit 18: State Spending on Benefits for Tennessee State Employees.......................34
1
Introduction Tennessee spent $1.6 billion, about eight percent of the total state budget, on salary and benefits for approximately 44,000 full-time state employees in fiscal year 2003. This amounted to over $38,000 per employee. Critics have assailed state employee compensation from both sides. Supporters of higher compensation argue that state employees are severely underpaid relative to counterparts employed by the private sector and other public sector employers. Opponents of higher compensation argue that state employees often produce low-quality work and may be overpaid. The reality of state employee compensation is substantially more complex than either argument would indicate. Compensation—only one piece of human resource management—is comprised of an assortment of salary and benefits.
In addition, state government must provide stable core services for the general public affecting basic health, safety, and economic activity. As a result, the public sector workforce is not completely comparable to that of the private sector, yet the state still must compete with the private sector for workers. The public sector also can benefit from private sector innovations and ideas.
Public Chapter 208 of 2003 directed the Comptroller of the Treasury to study compensation of state employees. (See Appendix C.) This report:
• Provides a brief history of human resource management in the public sector;
• Examines the size and composition of the state government workforce in the context of the Tennessee labor market;
• Evaluates both the level and structure of Tennessee state employee compensation and provides comparisons with other public and private sector employers; and
• Outlines options for Tennessee to increase its ability to attract and retain quality employees and increase the productivity of the state government workforce.
Methodology The conclusions reached and recommendations made in this report are based on:
• A review of research and other literature on public and private sector human resource management practices;
• Analysis of employment data for the state of Tennessee and other public and private sector employers;
• A review of state laws and regulations governing personnel management in Tennessee and other states;
• A survey of state employees (survey included as Appendix B);
• Interviews of university and federal government researchers specializing in employee compensation and human resource management; and
• Interviews of public and private sector human resource managers.
The Comptroller’s Office of Research administered the State Employee Opinion Survey, in September 2003. The survey includes opinion and preference questions on a wide range of
2
compensation and broader work environment issues. (See Appendix B.) The Comptroller’s Office of Research mailed surveys to 1,000 career service employees (all within the executive branch), 200 executive service employees within the executive branch, and 200 state employees outside the executive branch. A total of 658 employees responded, or 47 percent, well within the acceptable range for social science research.1 Survey results appear throughout this report.
Background
Government Human Resource Management—A Brief History Human resources management has evolved substantially since the mid-1800s. The spoils system dominated public personnel procedures during the 18th and 19th century with politicians commonly using government positions as rewards for members of their political parties. In the late 19th century, scandals in the political hiring process provided momentum for civil service reform across the country. By 1871, Congress passed the first piece of civil service legislation, creating a seven-member Civil Service Commission charged with the formation of rules and regulations for federal personnel management.2 Although the Commission wrote several rules, its function was largely suspended within three years.3 In 1883, Congress passed the Pendleton Civil Service Act, the first comprehensive federal civil service reform legislation. Mirroring many British civil service procedures, the Pendleton Act created a system based on competitive examinations, security of tenure, and political neutrality.4
Using the Pendleton Act as a model, several states, including Colorado, New Jersey, California, and Ohio, implemented civil service reform measures in the early 20th century.5 Other states refrained from following suit until the Social Security Act of 1935 required each state receiving Social Security funds to place employees under civil service by January 1, 1940. As a result of this mandate, 37 states, including Tennessee, passed civil service reform between 1936 and 1939.6 Tennessee did not implement the reform until 1939 when the Governor signed Public Chapter 221. This legislation provided for competitive testing, a Civil Service Commission, and a personnel system “based on merit principles and scientific methods,” creating the modern civil service program in Tennessee.7 Since the first legislation passed in 1939, Tennessee’s Civil Service Commission has grown from five to nine members. Although the civil service system has been renamed and reconstructed as the career service program it remains largely unchanged.
Reformers created the civil service system as a solution to glaring flaws they saw in government personnel practices: hiring, promotions, and pay increases often followed political patronage and personal relationships rather than merit. Civil service systems promote the use of objective criteria in these decisions. However, a recent wave of reformers has argued that, by requiring major personnel decisions to be based on a limited array of criteria, civil service systems hamstring managers’ ability to attract and retain quality employees and can contribute to a 1 “In a mail survey, a response rate of 10 to 50 percent is considered common,” W. Lawrence Neuman, Social Research Methods: Qualitative and Quantitative Approaches, 3rd ed., (Needham Heights, MA: Allyn & Bacon, 1997) p. 247 2 Paul Van Riper, History of the United States Civil Service, (Evanston, IL: Row, Peterson and Company) p. 68. 3 Ibid., p. 69 4 Ibid., p. 98. 5 Pedro Camoes, “What Lies Beneath: The Political Roots of State Merit Systems,” Journal of Public Administration Research and Theory, vol. 13, January 2003, pp. 27-43. 6 Ibid. 7 Public Chapter 221 (1939).
3
culture of mediocrity in government. David Osborne and Ted Gaebler stated in their 1992 book Reinventing Government that “[t]he only thing more destructive than a line item budget system is a personnel system built around civil service.”8
In the past 10 years, many states have reformed their personnel systems. In the late 1990s, New York abandoned the “rule of three” for hiring purposes and replaced it with zone scoring, which allows managers to choose from a pool of applicants with a certain minimum score on tests rather than being limited to only the top three scorers.9 Under legislation passed in 2002, Washington will substantially reduce the number of job classifications in state government.10 Wisconsin has consolidated hundreds of job classes and provided larger salary ranges for the new classes.11 Texas and Virginia have given state agencies freedom to determine whom to hire and promote and to set salaries within relatively broad salary structures. Both also allow agencies to pay outside these salary structures through hiring, recruitment, and performance bonuses.12 Georgia has pursued the most ambitious reform agenda. All employees hired after July 1, 1996, are unclassified employees, not governed by any central salary structure or civil service laws.13 Florida officials have also implemented radical changes, including eliminating seniority for all state employees, but have been criticized for changes that appear to favor downsizing and privatization, not enhancement of workforce quality and performance.14
Tennessee has not participated in this recent wave of reform. A 1998 survey of states evaluated the extent to which state governments had deregulated their personnel systems on a scale of zero to 19, with zero representing no meaningful deregulation and 19 representing near total deregulation. The response items generally measured the level of discretion agencies and individual managers possessed to hire, fire, compensate, and promote employees. Tennessee received a score of four. Only four of the 45 responding states received a lower score.15
State Employees in the Tennessee Labor Market
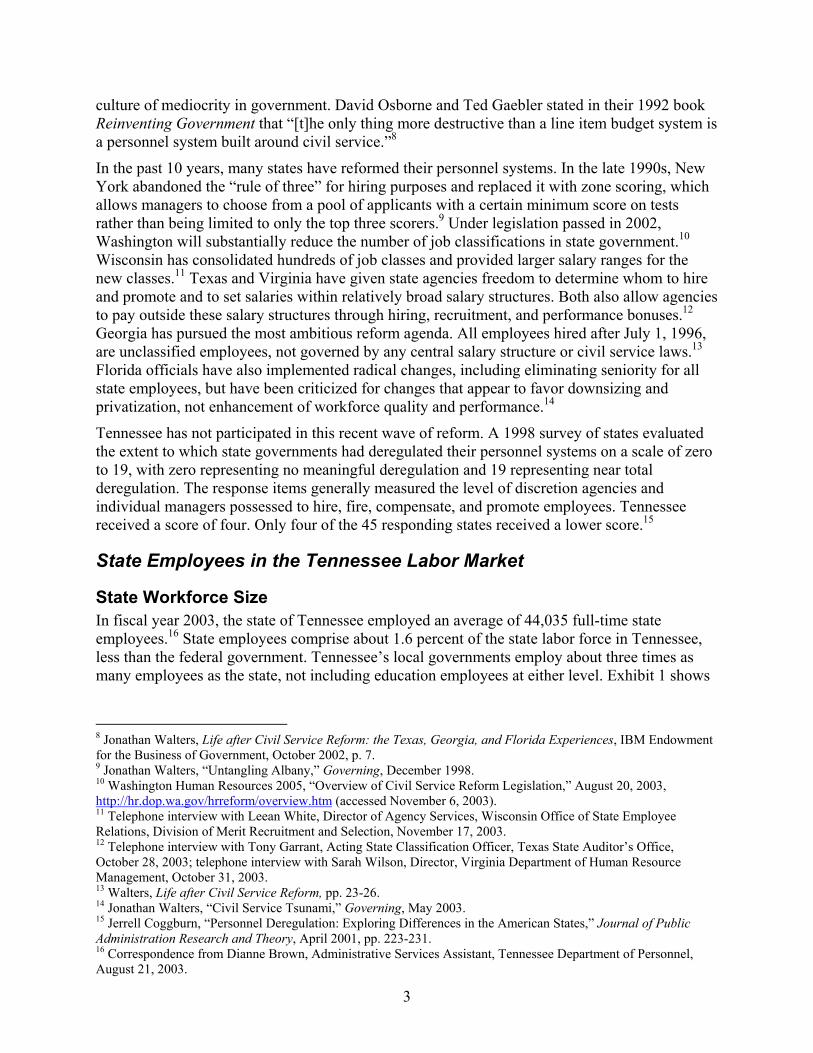
State Workforce Size In fiscal year 2003, the state of Tennessee employed an average of 44,035 full-time state employees.16 State employees comprise about 1.6 percent of the state labor force in Tennessee, less than the federal government. Tennessee’s local governments employ about three times as many employees as the state, not including education employees at either level. Exhibit 1 shows
8 Jonathan Walters, Life after Civil Service Reform: the Texas, Georgia, and Florida Experiences, IBM Endowment for the Business of Government, October 2002, p. 7. 9 Jonathan Walters, “Untangling Albany,” Governing, December 1998. 10 Washington Human Resources 2005, “Overview of Civil Service Reform Legislation,” August 20, 2003, http://hr.dop.wa.gov/hrreform/overview.htm (accessed November 6, 2003). 11 Telephone interview with Leean White, Director of Agency Services, Wisconsin Office of State Employee Relations, Division of Merit Recruitment and Selection, November 17, 2003. 12 Telephone interview with Tony Garrant, Acting State Classification Officer, Texas State Auditor’s Office, October 28, 2003; telephone interview with Sarah Wilson, Director, Virginia Department of Human Resource Management, October 31, 2003. 13 Walters, Life after Civil Service Reform, pp. 23-26. 14 Jonathan Walters, “Civil Service Tsunami,” Governing, May 2003. 15 Jerrell Coggburn, “Personnel Deregulation: Exploring Differences in the American States,” Journal of Public Administration Research and Theory, April 2001, pp. 223-231. 16 Correspondence from Dianne Brown, Administrative Services Assistant, Tennessee Department of Personnel, August 21, 2003.
4
the percent of the Tennessee labor force employed by the private sector and various government employers.
Exhibit 1: Employment in Tennessee by Sector, 2002
Private Sector79%
Local Education5%
Unemployed5%
General Local Govt5%
Federal Govt2%
General State Govt2%
State-Run Schools2%
Sources: U.S. Bureau of Labor Statistics, “Current Employment Statistics,” http://www.bls.gov/sae/home.htm#data (accessed November 17, 2003); U.S. Bureau of Labor Statistics, “Local Area Unemployment Statistics,” http://www.bls.gov/lau/home.htm#data (accessed November 17, 2003);
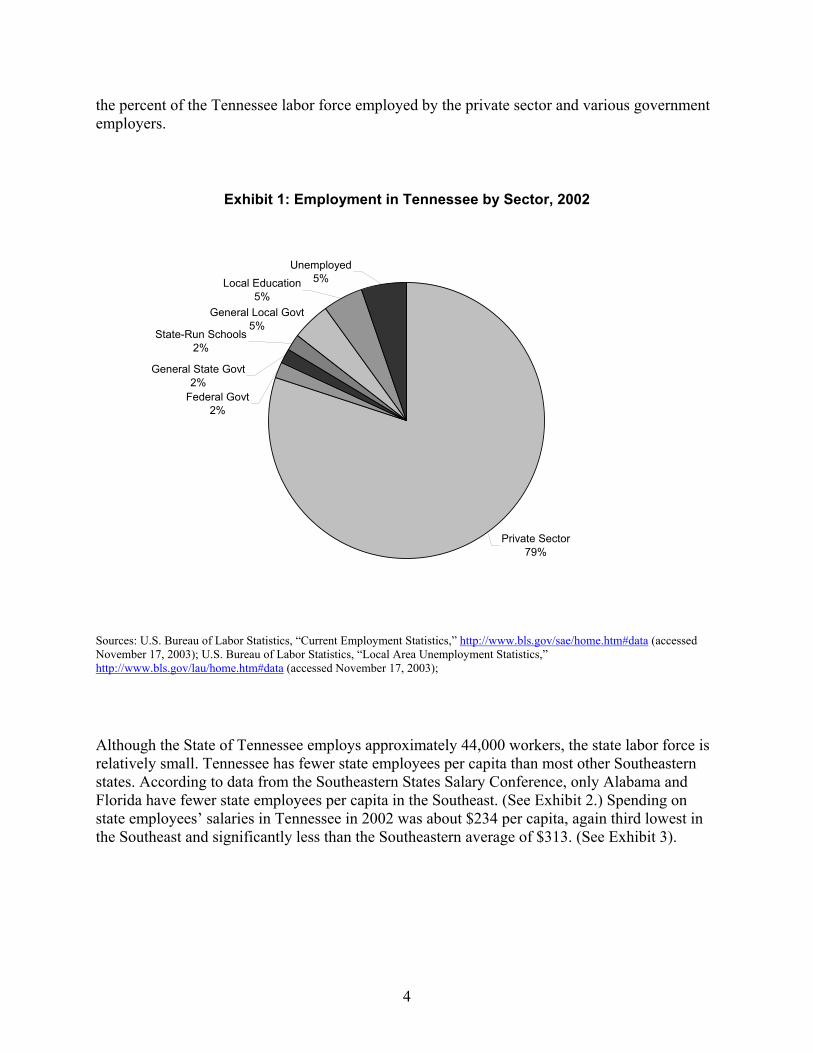
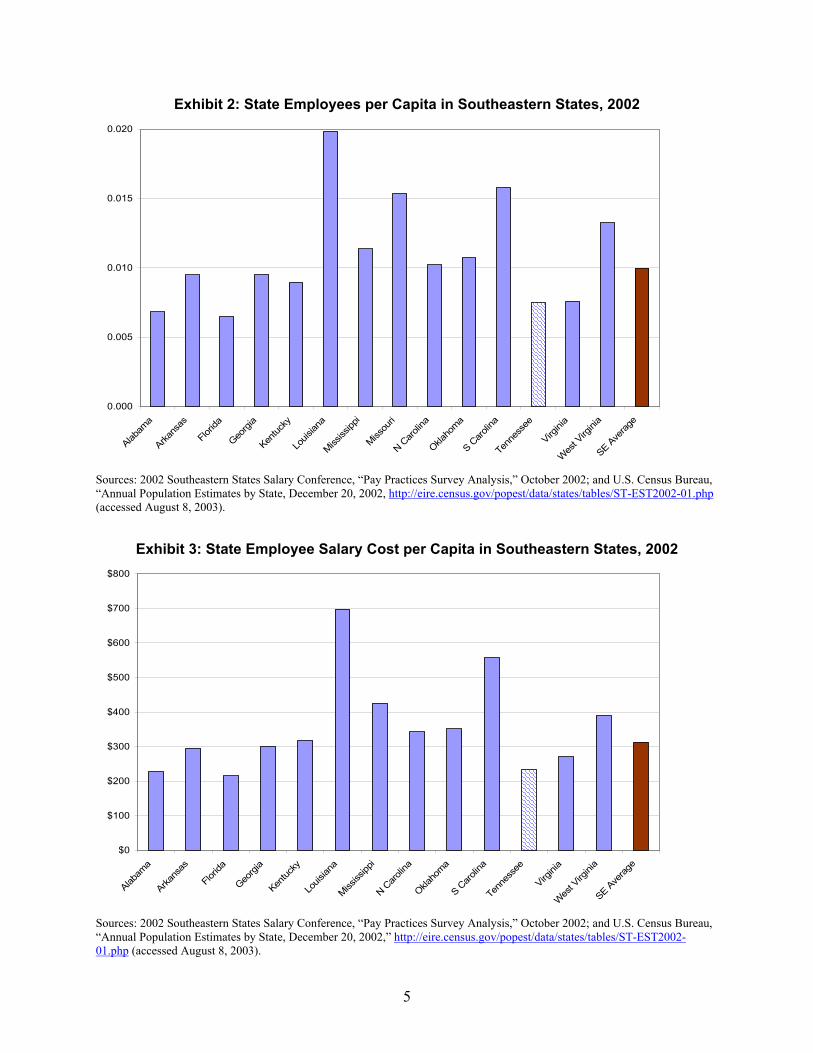
Although the State of Tennessee employs approximately 44,000 workers, the state labor force is relatively small. Tennessee has fewer state employees per capita than most other Southeastern states. According to data from the Southeastern States Salary Conference, only Alabama and Florida have fewer state employees per capita in the Southeast. (See Exhibit 2.) Spending on state employees’ salaries in Tennessee in 2002 was about $234 per capita, again third lowest in the Southeast and significantly less than the Southeastern average of $313. (See Exhibit 3).
5
Exhibit 2: State Employees per Capita in Southeastern States, 2002
0.000
0.005
0.010
0.015
0.020
Alabam
a
Arkans
as
Florid
a
Georgi
a
Kentuc
ky
Louis
iana
Mississ
ippi
Missou
ri
N Caro
lina
Oklaho
ma
S Caro
lina
Tenn
esse
e
Virgini
a
Wes
t Virg
inia
SE Ave
rage
Sources: 2002 Southeastern States Salary Conference, “Pay Practices Survey Analysis,” October 2002; and U.S. Census Bureau, “Annual Population Estimates by State, December 20, 2002, http://eire.census.gov/popest/data/states/tables/ST-EST2002-01.php (accessed August 8, 2003).
Exhibit 3: State Employee Salary Cost per Capita in Southeastern States, 2002
$0
$100
$200
$300
$400
$500
$600
$700
$800
Alabam
a
Arkans
as
Florid
a
Georgi
a
Kentuc
ky
Louis
iana
Mississ
ippi
N Caro
lina
Oklaho
ma
S Caro
lina
Tenn
esse
e
Virgini
a
Wes
t Virg
inia
SE Ave
rage
Sources: 2002 Southeastern States Salary Conference, “Pay Practices Survey Analysis,” October 2002; and U.S. Census Bureau, “Annual Population Estimates by State, December 20, 2002,” http://eire.census.gov/popest/data/states/tables/ST-EST2002-01.php (accessed August 8, 2003).
6
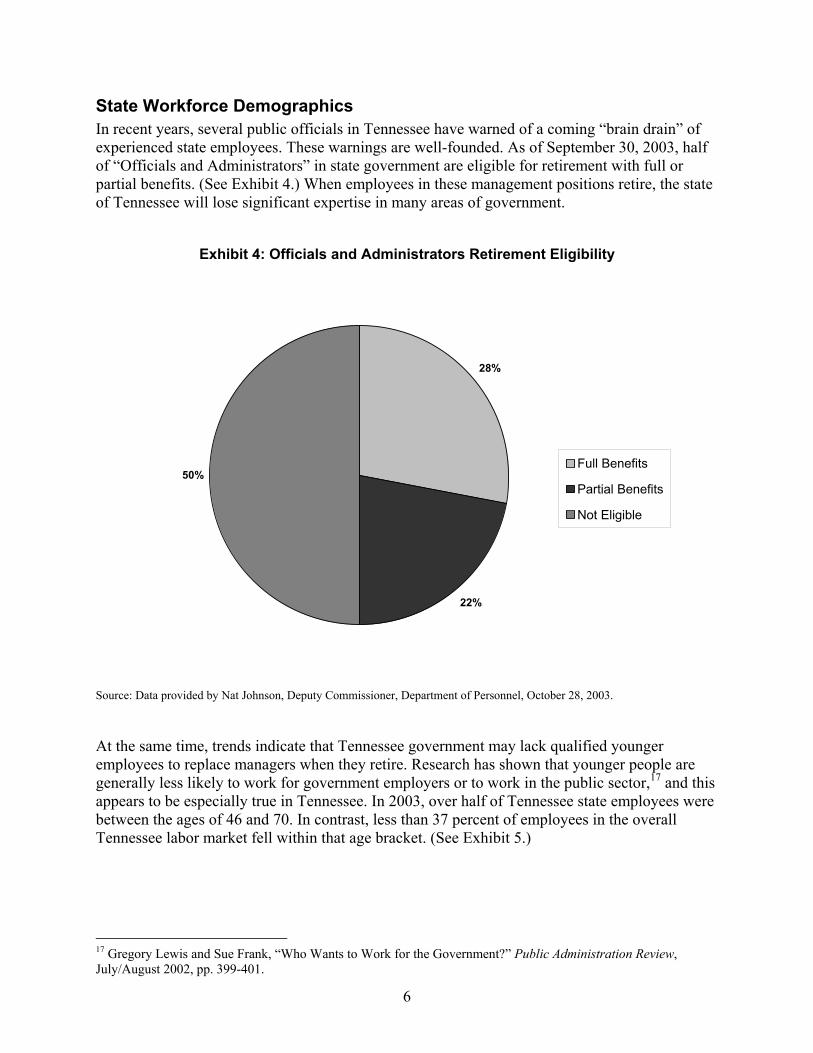
State Workforce Demographics In recent years, several public officials in Tennessee have warned of a coming “brain drain” of experienced state employees. These warnings are well-founded. As of September 30, 2003, half of “Officials and Administrators” in state government are eligible for retirement with full or partial benefits. (See Exhibit 4.) When employees in these management positions retire, the state of Tennessee will lose significant expertise in many areas of government.
Exhibit 4: Officials and Administrators Retirement Eligibility
28%
22%
50%Full Benefits
Partial Benefits
Not Eligible
Source: Data provided by Nat Johnson, Deputy Commissioner, Department of Personnel, October 28, 2003.
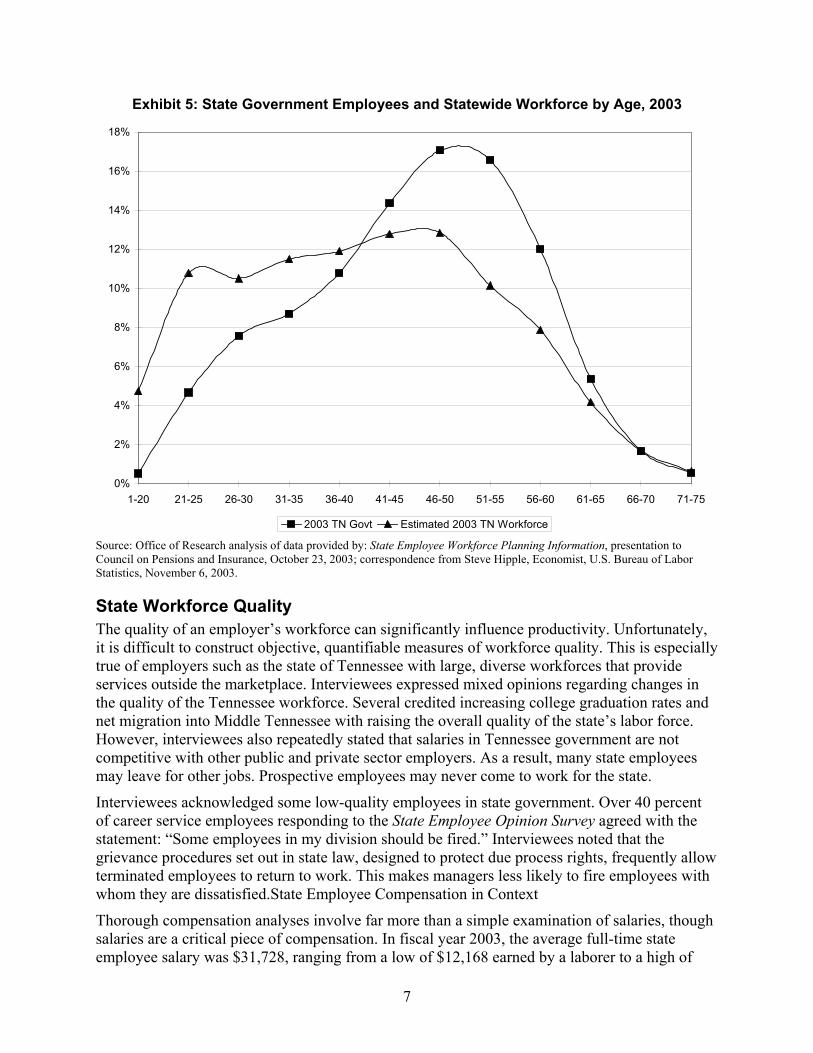
At the same time, trends indicate that Tennessee government may lack qualified younger employees to replace managers when they retire. Research has shown that younger people are generally less likely to work for government employers or to work in the public sector,17 and this appears to be especially true in Tennessee. In 2003, over half of Tennessee state employees were between the ages of 46 and 70. In contrast, less than 37 percent of employees in the overall Tennessee labor market fell within that age bracket. (See Exhibit 5.)
17 Gregory Lewis and Sue Frank, “Who Wants to Work for the Government?” Public Administration Review, July/August 2002, pp. 399-401.
7
Exhibit 5: State Government Employees and Statewide Workforce by Age, 2003
0%
2%
4%
6%
8%
10%
12%
14%
16%
18%
1-20 21-25 26-30 31-35 36-40 41-45 46-50 51-55 56-60 61-65 66-70 71-75
2003 TN Govt Estimated 2003 TN Workforce Source: Office of Research analysis of data provided by: State Employee Workforce Planning Information, presentation to Council on Pensions and Insurance, October 23, 2003; correspondence from Steve Hipple, Economist, U.S. Bureau of Labor Statistics, November 6, 2003.
State Workforce Quality The quality of an employer’s workforce can significantly influence productivity. Unfortunately, it is difficult to construct objective, quantifiable measures of workforce quality. This is especially true of employers such as the state of Tennessee with large, diverse workforces that provide services outside the marketplace. Interviewees expressed mixed opinions regarding changes in the quality of the Tennessee workforce. Several credited increasing college graduation rates and net migration into Middle Tennessee with raising the overall quality of the state’s labor force. However, interviewees also repeatedly stated that salaries in Tennessee government are not competitive with other public and private sector employers. As a result, many state employees may leave for other jobs. Prospective employees may never come to work for the state.
Interviewees acknowledged some low-quality employees in state government. Over 40 percent of career service employees responding to the State Employee Opinion Survey agreed with the statement: “Some employees in my division should be fired.” Interviewees noted that the grievance procedures set out in state law, designed to protect due process rights, frequently allow terminated employees to return to work. This makes managers less likely to fire employees with whom they are dissatisfied.State Employee Compensation in Context
Thorough compensation analyses involve far more than a simple examination of salaries, though salaries are a critical piece of compensation. In fiscal year 2003, the average full-time state employee salary was $31,728, ranging from a low of $12,168 earned by a laborer to a high of
8
$204,912 earned by two physicians. However, state employees received an average of $6,622 in benefits,18 about 21 percent of the average salary. That amount does not include paid time off and a shorter workweek enjoyed by state employees. When the value of these non-cash benefits is included, state employees received the equivalent of almost $14,000 in benefits on average, over 44 percent of the average salary.
Many factors besides compensation influence employee satisfaction. These include job security, relationships with coworkers and supervisors, the relative pleasantness of a specific job, and intrinsic satisfaction gained from a specific job. A true analysis of employment should consider these factors as well.
Salaries State employees receive cash compensation two ways: base pay and longevity pay. Base salaries for career service employees must fall within ranges established by the Department of Personnel. One theory holds that actual salary distributions should resemble a bell curve with most employees paid around the middle of the range with a few people paid near the bottom and a few people paid near the top. However, this is not the reality in Tennessee and many other state governments. Instead, salaries are compressed. Salary compression occurs when most employees are paid near or at the bottom of the salary range. As a result, the average salary is well below the midpoint of the range. This often includes new hires and experienced employees and top performers as well as below-average performers.
Tennessee also has a longevity pay plan in addition to base salary. After working in state government for three years, state employees receive longevity pay each year. Longevity pay is equal to $100 times the total years of employment in Tennessee government up to 25 years of service. For example, an employee who has worked with the state for 12 years would receive $1,200 in longevity pay that year.19 The Department of Personnel staff believes that Tennessee’s program is one of the most generous longevity pay programs offered by state governments.20
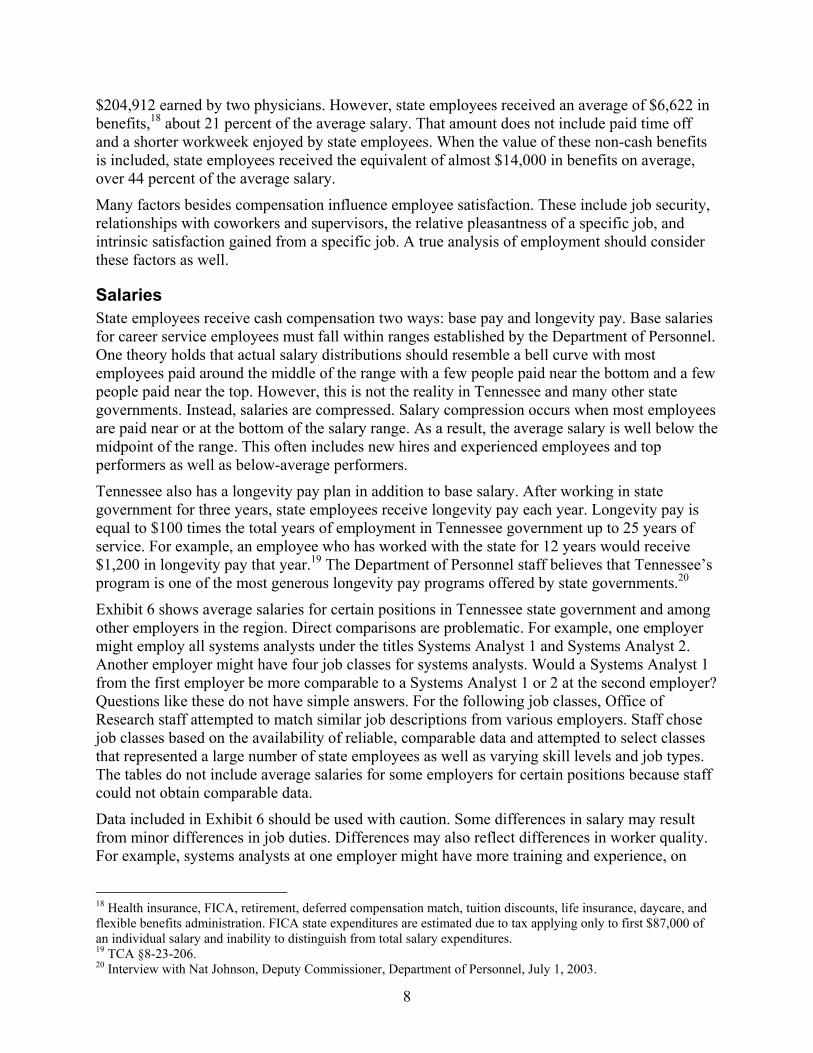
Exhibit 6 shows average salaries for certain positions in Tennessee state government and among other employers in the region. Direct comparisons are problematic. For example, one employer might employ all systems analysts under the titles Systems Analyst 1 and Systems Analyst 2. Another employer might have four job classes for systems analysts. Would a Systems Analyst 1 from the first employer be more comparable to a Systems Analyst 1 or 2 at the second employer? Questions like these do not have simple answers. For the following job classes, Office of Research staff attempted to match similar job descriptions from various employers. Staff chose job classes based on the availability of reliable, comparable data and attempted to select classes that represented a large number of state employees as well as varying skill levels and job types. The tables do not include average salaries for some employers for certain positions because staff could not obtain comparable data.
Data included in Exhibit 6 should be used with caution. Some differences in salary may result from minor differences in job duties. Differences may also reflect differences in worker quality. For example, systems analysts at one employer might have more training and experience, on
18 Health insurance, FICA, retirement, deferred compensation match, tuition discounts, life insurance, daycare, and flexible benefits administration. FICA state expenditures are estimated due to tax applying only to first $87,000 of an individual salary and inability to distinguish from total salary expenditures. 19 TCA §8-23-206. 20 Interview with Nat Johnson, Deputy Commissioner, Department of Personnel, July 1, 2003.
9
average, than systems analysts at another employer. Also, salaries include incentives and bonuses, where applicable. Salaries for Tennessee state government include longevity pay.
Exhibit 6: Average Annual Salaries for Selected Occupations21
SOCIAL WORKER CORRECTIONAL OFFICER TN State Government $ 30,016 TN State Government $ 21,643 Border State Average $ 33,291 Border State Average $ 24,120
Metro Nashville $ 36,351 Metro Nashville $ 29,805 TN Local Government Average $ 31,263 TN Local Government Average $ 26,680
TN Federal Government $ - TN Federal Government $ - TN Private Sector $ - TN Private Sector $ 23,814
SECRETARY REGISTERED NURSE
TN State Government $ 24,403 TN State Government $ 36,186 Border State Average $ 23,266 Border State Average $ 36,663
Metro Nashville $ 26,186 Metro Nashville $ 45,188 TN Local Government Average $ 24,260 TN Local Government Average $ 44,400
TN Federal Government $ 33,586 TN Federal Government $ 54,405 TN Private Sector $ 23,183 TN Private Sector $ 47,370
HUMAN RESOURCES MANAGER PROGRAMMER / ANALYST
TN State Government $ 55,351 TN State Government $ 41,021 Border State Average $ 56,167 Border State Average $ 39,203
Metro Nashville $ 79,372 Metro Nashville $ 41,791 TN Local Government Average $ 48,510 TN Local Government Average $ 41,230
TN Federal Government $ 72,868 TN Federal Government $ 67,435 TN Private Sector $ 59,419 TN Private Sector $ 57,685
CUSTODIAL WORKER GROUP CARE WORKER TN State Government $ 15,077 TN State Government $ 18,414 Border State Average $ 16,628 Border State Average $ 20,172
Metro Nashville $ 22,241 Metro Nashville $ 18,337 TN Local Government Average $ 20,860 TN Local Government Average $ 19,514
TN Federal Government $ 29,008 TN Federal Government $ - TN Private Sector $ 17,858 TN Private Sector $ -
Sources: American Federation of Teachers, AFT Public Employees Compensation Survey 2003, June 2003; 2002 Southeastern States Salary Conference, Job Survey Analysis¸ October 2002; data provided by Jamie Birdwell, Human Resources Analyst, Metropolitan Nashville-Davidson County Department of Human Resources; data provided by Martha Wetteman, Research and Statistics Supervisor, Tennessee Department of Labor and Workforce Development; Nat Johnson, Deputy Commissioner, Tennessee Department of Personnel, Presentation to the Council on Pensions and Insurance, October 23, 2003; Actual State of State Employees 2003-2004, Tennessee State Employees Association.
21 State of Tennessee equivalent job classes: Social Worker 2, Correctional Officer, Administrative Secretary, Registered Nurse 2, Personnel Director 2, Programmer/Analyst 2, Custodial Worker 1, Developmental Technician.
10
Overall, Tennessee government pays lower salaries for these occupations than comparison employers. As the exhibit shows, salaries in Tennessee government for some occupations are in line with those of at least some other employers. However, for some positions, salaries in Tennessee government are below all other employers in the comparison group. Tennessee government salaries are far below those of other employers for high-skill positions. Metropolitan Nashville-Davidson County pays registered nurses 25 percent more than Tennessee state government on average and pays correctional officers 38 percent more. Registered nurses in the private sector in Tennessee make 31 percent more than comparable employees in state government, and computer programmers average 41 percent more. Such sizable disparities have a tremendous impact on state government’s ability to recruit and retain employees. There are no job classes where Tennessee employees are paid significantly more than other employers.
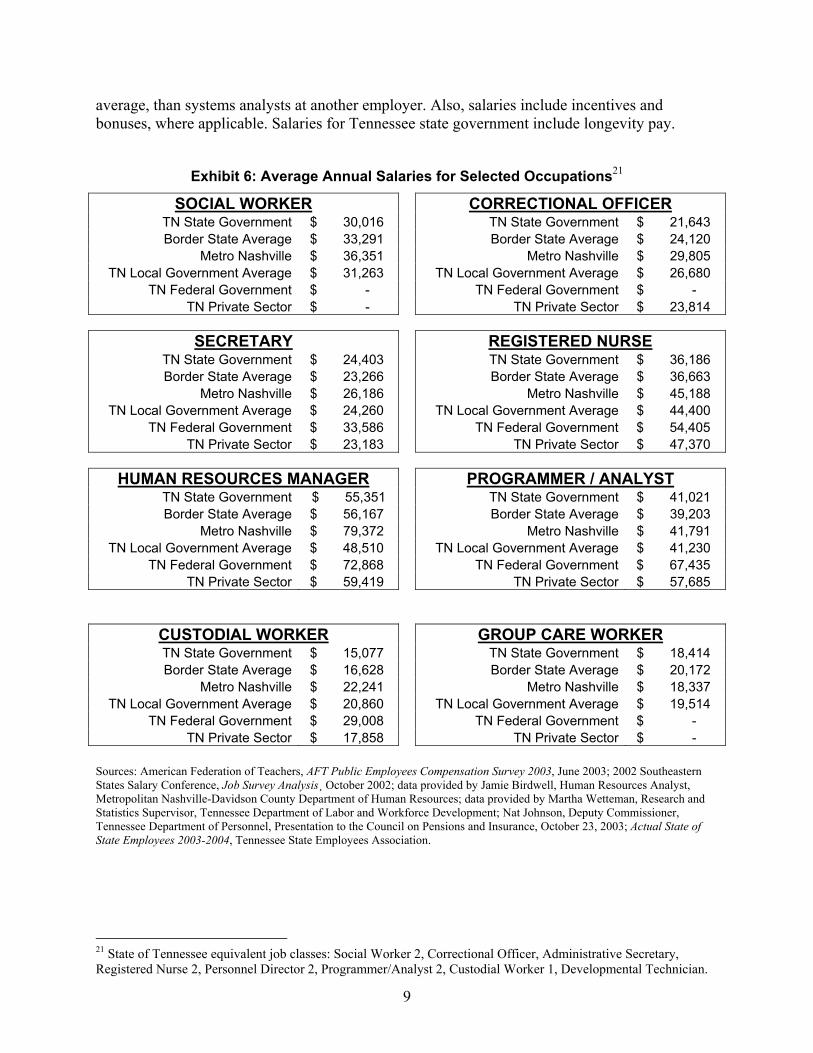
Workweek One of the most immediate benefits enjoyed by state employees is a shorter workweek than other regional government employers. Exhibit 7 shows the full-time workweek for employees of Tennessee’s border states and metropolitan Nashville-Davidson County. Only Kentucky shares Tennessee’s workweek of 37.5 hours; all other employers examined have a standard workweek of 40 hours. In 1980, the General Assembly reduced the workweek to 37.5 hours in lieu of a pay increase. This was accomplished by increasing the lunch break to a full hour.22
Exhibit 7: Full-Time Workweek among Regional Government Employers, 2002
0
5
10
15
20
25
30
35
40
45
Alabama Arkansas Georgia Kentucky Mississippi Missouri NorthCarolina
Virginia Tennessee MetroDavidson
Co.
Hou
rs p
er W
eek
Sources: 2002 Southeastern States Salary Conference, “Pay Practices Survey Analysis,” October 2002; and Metropolitan Nashville-Davidson County Department of Human Resources, “Highlights of Employee Benefits,” 2003, http://www.nashville.gov/civil_service/csr/section_4.htm (accessed August 8, 2003).
22 Public Acts 1980, Ch. 923.
11
Many state employees may work over the 37.5 hour standard workweek, but generally a 40-hour workweek is not required in Tennessee government; most private sector employers and Tennessee’s border states mandate the 40-hour workweek as shown in Exhibit 7 above.
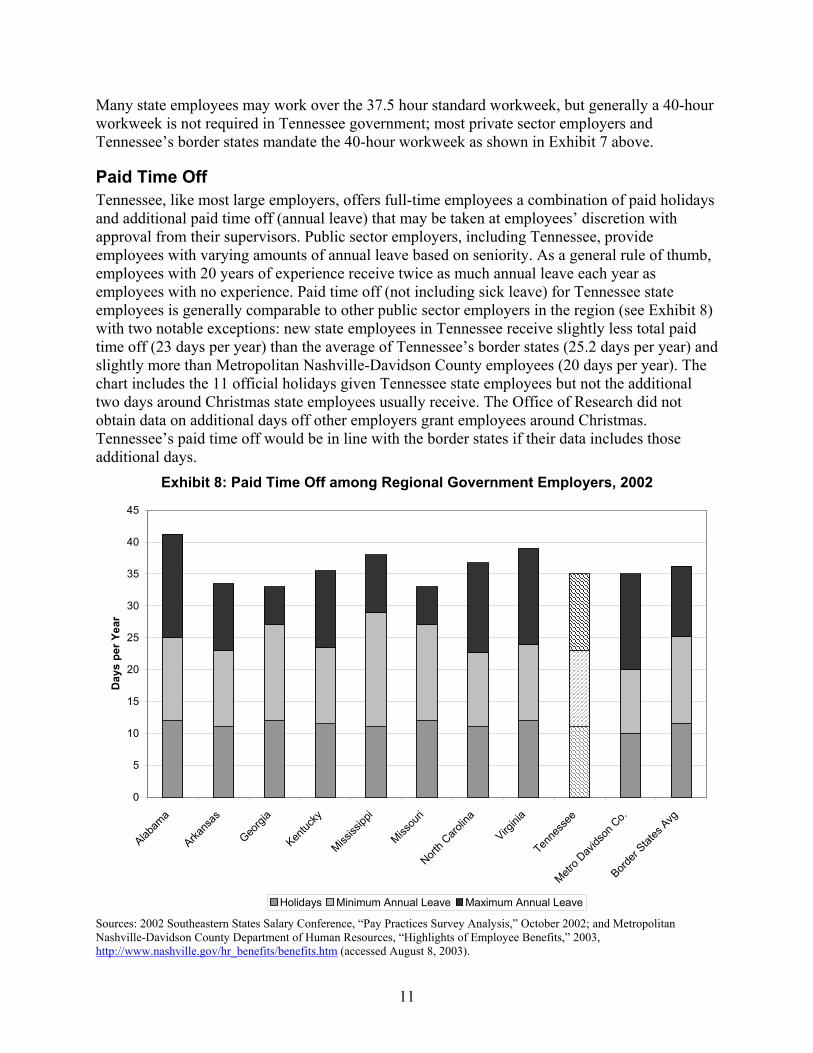
Paid Time Off Tennessee, like most large employers, offers full-time employees a combination of paid holidays and additional paid time off (annual leave) that may be taken at employees’ discretion with approval from their supervisors. Public sector employers, including Tennessee, provide employees with varying amounts of annual leave based on seniority. As a general rule of thumb, employees with 20 years of experience receive twice as much annual leave each year as employees with no experience. Paid time off (not including sick leave) for Tennessee state employees is generally comparable to other public sector employers in the region (see Exhibit 8) with two notable exceptions: new state employees in Tennessee receive slightly less total paid time off (23 days per year) than the average of Tennessee’s border states (25.2 days per year) and slightly more than Metropolitan Nashville-Davidson County employees (20 days per year). The chart includes the 11 official holidays given Tennessee state employees but not the additional two days around Christmas state employees usually receive. The Office of Research did not obtain data on additional days off other employers grant employees around Christmas. Tennessee’s paid time off would be in line with the border states if their data includes those additional days.
Exhibit 8: Paid Time Off among Regional Government Employers, 2002
0
5
10
15
20
25
30
35
40
45
Alabam
a
Arkans
as
Georgi
a
Kentuc
ky
Mississ
ippi
Missou
ri
North C
arolin
a
Virgini
a
Tenne
ssee
Metro D
avids
on C
o.
Border
States
Avg
Day
s pe
r Yea
r
Holidays Minimum Annual Leave Maximum Annual Leave Sources: 2002 Southeastern States Salary Conference, “Pay Practices Survey Analysis,” October 2002; and Metropolitan Nashville-Davidson County Department of Human Resources, “Highlights of Employee Benefits,” 2003, http://www.nashville.gov/hr_benefits/benefits.htm (accessed August 8, 2003).
12
The state of Tennessee also offers employees 12 days of sick leave each year, slightly less than the average of its border states (12.25) and the same as Metropolitan Nashville-Davidson County.23 Many private sector employers have moved to a system of paid time off that can be used for any purpose rather than separate sick and annual leave. Others handle absences due to illness informally.
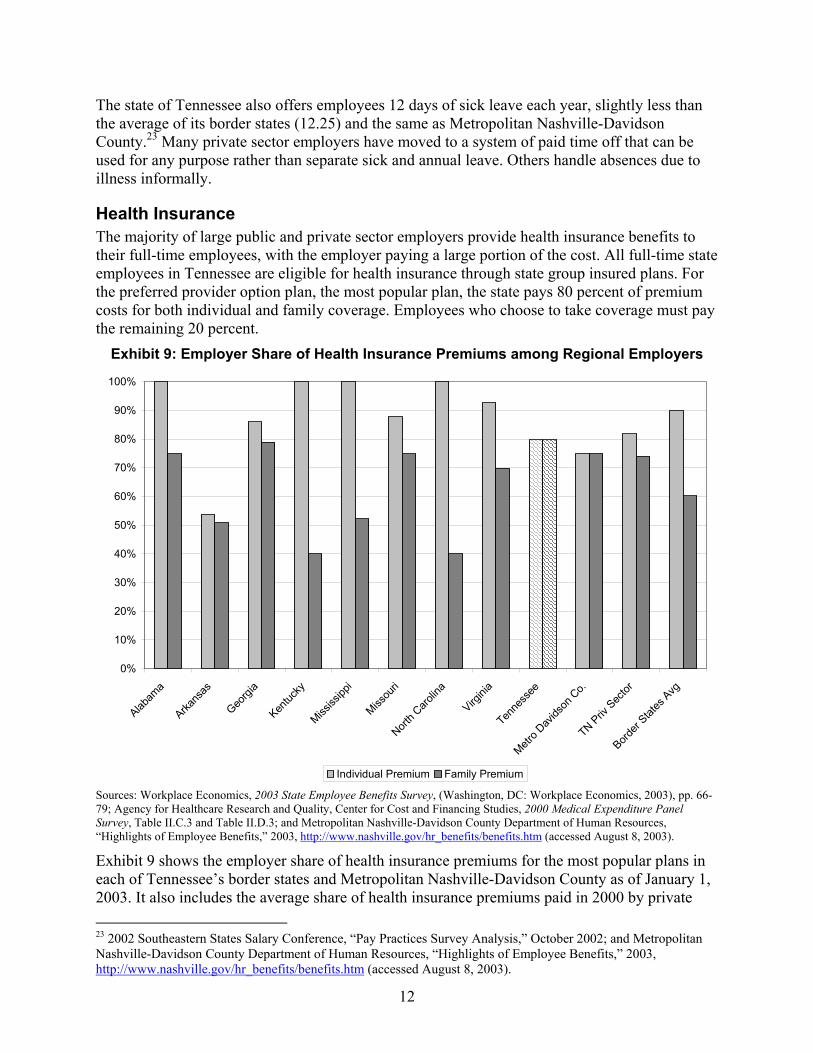
Health Insurance The majority of large public and private sector employers provide health insurance benefits to their full-time employees, with the employer paying a large portion of the cost. All full-time state employees in Tennessee are eligible for health insurance through state group insured plans. For the preferred provider option plan, the most popular plan, the state pays 80 percent of premium costs for both individual and family coverage. Employees who choose to take coverage must pay the remaining 20 percent.
Exhibit 9: Employer Share of Health Insurance Premiums among Regional Employers
0%
10%
20%
30%
40%
50%
60%
70%
80%
90%
100%
Alabam
a
Arkans
as
Georgi
a
Kentuc
ky
Mississ
ippi
Missou
ri
North C
arolin
a
Virgini
a
Tenne
ssee
Metro D
avids
on C
o.
TN Priv
Sec
tor
Border
States
Avg
Individual Premium Family Premium Sources: Workplace Economics, 2003 State Employee Benefits Survey, (Washington, DC: Workplace Economics, 2003), pp. 66-79; Agency for Healthcare Research and Quality, Center for Cost and Financing Studies, 2000 Medical Expenditure Panel Survey, Table II.C.3 and Table II.D.3; and Metropolitan Nashville-Davidson County Department of Human Resources, “Highlights of Employee Benefits,” 2003, http://www.nashville.gov/hr_benefits/benefits.htm (accessed August 8, 2003).
Exhibit 9 shows the employer share of health insurance premiums for the most popular plans in each of Tennessee’s border states and Metropolitan Nashville-Davidson County as of January 1, 2003. It also includes the average share of health insurance premiums paid in 2000 by private 23 2002 Southeastern States Salary Conference, “Pay Practices Survey Analysis,” October 2002; and Metropolitan Nashville-Davidson County Department of Human Resources, “Highlights of Employee Benefits,” 2003, http://www.nashville.gov/hr_benefits/benefits.htm (accessed August 8, 2003).
13
sector employers in Tennessee who offered health insurance. That year, 89.9 percent of private sector employees in Tennessee were eligible for employer-sponsored coverage.24 Tennessee’s border states pay 90 percent of the cost of individual insurance coverage on average, significantly higher than the 80 percent state share of premiums paid by Tennessee. However, Tennessee pays 80 percent of the cost of family coverage, more than Metropolitan Davidson County, the average private sector share in Tennessee, or any of Tennessee’s border states. Tennessee’s border states pay 60 percent of family coverage premiums on average.
Retirement Plans Retirement plans are a critical benefit for many employees, and their nature has evolved significantly in recent decades. In 1981 the state of Tennessee assumed all or part of state employee contributions to the retirement system in lieu of a pay raise. This amounted to up to five percent of the employee’s earnable compensation.25 Traditionally, many employers offered defined benefit plans, from which employees would receive a fixed payment each month after retirement based on years of service, average salary, and other factors. However, in recent decades, many private sector employers have abandoned defined benefit plans in favor of defined contribution plans, plans in which employees and/or employers deposit a fixed amount into accounts every month.26 At retirement, employees draw payments from the accrued deposits and investment earnings within those accounts.
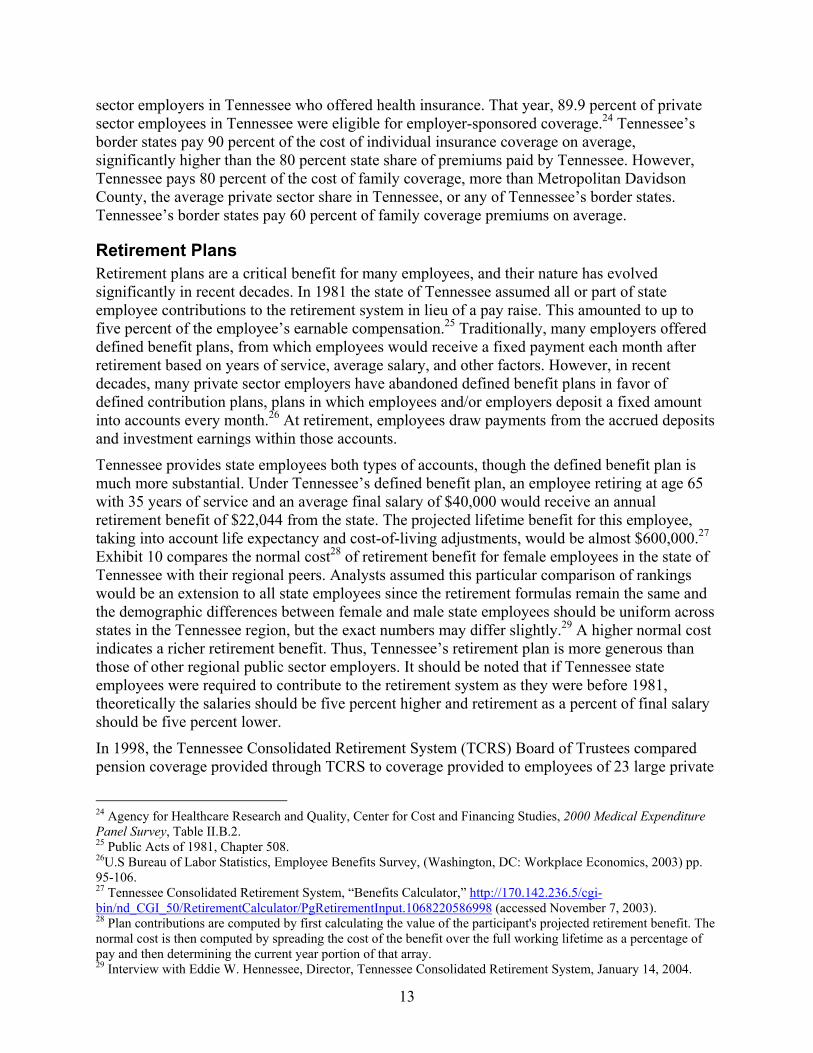
Tennessee provides state employees both types of accounts, though the defined benefit plan is much more substantial. Under Tennessee’s defined benefit plan, an employee retiring at age 65 with 35 years of service and an average final salary of $40,000 would receive an annual retirement benefit of $22,044 from the state. The projected lifetime benefit for this employee, taking into account life expectancy and cost-of-living adjustments, would be almost $600,000.27 Exhibit 10 compares the normal cost28 of retirement benefit for female employees in the state of Tennessee with their regional peers. Analysts assumed this particular comparison of rankings would be an extension to all state employees since the retirement formulas remain the same and the demographic differences between female and male state employees should be uniform across states in the Tennessee region, but the exact numbers may differ slightly.29 A higher normal cost indicates a richer retirement benefit. Thus, Tennessee’s retirement plan is more generous than those of other regional public sector employers. It should be noted that if Tennessee state employees were required to contribute to the retirement system as they were before 1981, theoretically the salaries should be five percent higher and retirement as a percent of final salary should be five percent lower.
In 1998, the Tennessee Consolidated Retirement System (TCRS) Board of Trustees compared pension coverage provided through TCRS to coverage provided to employees of 23 large private
24 Agency for Healthcare Research and Quality, Center for Cost and Financing Studies, 2000 Medical Expenditure Panel Survey, Table II.B.2. 25 Public Acts of 1981, Chapter 508. 26U.S Bureau of Labor Statistics, Employee Benefits Survey, (Washington, DC: Workplace Economics, 2003) pp. 95-106. 27 Tennessee Consolidated Retirement System, “Benefits Calculator,” http://170.142.236.5/cgi-bin/nd_CGI_50/RetirementCalculator/PgRetirementInput.1068220586998 (accessed November 7, 2003). 28 Plan contributions are computed by first calculating the value of the participant's projected retirement benefit. The normal cost is then computed by spreading the cost of the benefit over the full working lifetime as a percentage of pay and then determining the current year portion of that array. 29 Interview with Eddie W. Hennessee, Director, Tennessee Consolidated Retirement System, January 14, 2004.
14
sector companies with major operations in Tennessee. In 10 different models with various years of service, retirement ages, and final salaries, TCRS provided one of the four richest retirement benefits in each case.30
Every state government except Michigan and Nebraska offers a traditional defined benefit pension plan like that provided for Tennessee employees through TCRS.31 Currently, however, Nebraska is considering offering a hybrid plan because of the differential between its defined contribution plan and the previous defined benefit plan. A hybrid plan allows employees to contribute to a defined contribution fund which they can invest as they please, while their employers contribute to a defined benefit fund, thereby guaranteeing a defined benefit upon retirement.32 In 2000 only 22 percent of full-time workers in the private sector qualified for defined benefit plans while 42 percent qualified for defined contribution plans.33 One approach to defined contribution plans is to allow employees to contribute to deferred compensation accounts and/or provide some type of employer match.
Exhibit 10: Employer Cost of Defined Benefit Retirement Plans as Percent of Final Salary, 2003
0.00%
5.00%
10.00%
15.00%
20.00%
25.00%
Arkans
as
Florida
Georgi
a
Kentuc
ky
Louis
iana
Mississ
ippi
Missou
ri
North C
arolin
a
South
Carolin
a
Tenne
ssee
Texas
Virgini
a
West V
irgini
a
Metro N
ashv
ille
SE Ave
rage
Nor
mal
Cos
t as
a Pe
rcen
tage
of F
inal
Sal
ary
Source: Correspondence from Tony Johnston, Principal, Bryan, Pendleton, Swats & McAllister, LLC, October 13, 2003.
In June 2003, over 25,000 Tennessee state employees, 58 percent of the state’s full-time workforce, made deferred compensation contributions. All states provide deferred compensation 30 TCRS Board of Trustees, Administrative and Legislative Committee, Review of TCRS, June 5, 1998, Chapter 9, pp. 1-10. 31 Workplace Economics, 2003 State Employee Benefits Survey, (Washington, DC: Workplace Economics, 2003) pp. 95-106. 32 Anya Sostek, “Pension Pendulum,” Governing, March 2004, pp. 28-30. 33 U.S. Bureau of Labor Statistics, Employee Benefits Survey, Series ID: EBUDBINCFT0000AP and EBUDCINCFT0000AP, http://data.bls.gov/cgi-bin/dsrv (accessed August 13, 2003).
15
as an option for state employees, but Tennessee is one of only 13 states that match a portion of employee contributions to a 401(k) plan. Tennessee will match 100 percent of the first $20 contributed by employees each month, less than most other states that match employee contributions. 34
Private employers frequently provide fixed and/or variable matches for employee contributions. The most common fixed employer match in 401(k) plans is 50 percent of the first six percent of employees’ salaries they choose to contribute.35 Based on average salaries for fiscal year 2003, if Tennessee offered a 50 percent match of the first six percent of employees’ salaries, the average full-time employee would qualify for a $952 annual match, far more than the $240 annual match Tennessee government currently provides. However, unlike the state of Tennessee, most private employers offering such a large match provide it in lieu of rather than in addition to a defined benefit plan. Private companies that match employee 401(k) contributions also frequently vary match rates based on corporate profitability or other outcome measures, but no state government offers varying match rates.36
It is not apparent how many employees would prefer to place their savings in a defined-contribution plan rather than a defined-benefit plan. When Florida enacted its defined contribution option in 2000, officials expected 30 percent of the state’s eligible workforce to switch into it; however, only three percent have opted into the defined contribution plan as of March 2004. Further, when Michigan introduced its defined contribution plan in 1997 only six percent of state employees opted to switch from the defined benefit plan to the defined contribution plan.37
Other Benefits Though 22 states offer on-site childcare facilities to state employees, Virginia is the only state bordering Tennessee to do so. None of Tennessee’s border states provides a subsidy for off-site daycare.38 The state of Tennessee no longer provides on-site daycare facilities, but it contracts for discounted daycare for a few state employees. Rates are on a sliding scale based on family income.39 However, the facility can serve only 70 children. In 2003, four percent of workers in the private sector in the four states in Tennessee’s region40 had access to employer-provided on-site or off-site care and another four percent work for employers who provide funds for
34 Workplace Economics, 2003 State Employee Benefits Survey, (Washington, DC: Workplace Economics, 2003), pp. 108-111. 35 Benefit Plans Plus, LLC, “How Does Your 401k Plan Compare with the ‘Typical’ 401k?” http://www.bpp401k.com/default.asp?pagenumber=39 (accessed August 13, 2003); Judy Diamond, “How Does Your 401(k) Plan Compare,” http://www.b4-u-buy.com/08c4523.htm (accessed August 13, 2003); Suzanne Thompson, “How to Use Your 401(k) Plan as a True Employee Motivational Tool,” http://www.media3pub.com/usbank/articles/401k.html (accessed August 13, 2003). 36 Benefit Plans Plus, LLC, “How Does Your 401k Plan Compare with the ‘Typical’ 401k?” http://www.bpp401k.com/default.asp?pagenumber=39 (accessed August 13, 2003); Suzanne Thompson, “How to Use Your 401(k) Plan as a True Employee Motivational Tool,” http://www.media3pub.com/usbank/articles/401k.html (accessed August 13, 2003). 37 Sostek, p. 30. 38 Workplace Economics, 2003 State Employee Benefits Survey, (Washington, DC: Workplace Economics, 2003), pp. 44-48. 39 Correspondence from Gina Lodge, Commissioner, Tennessee Department of Human Services, January 5, 2004. 40 Alabama, Kentucky, Mississippi, and Tennessee. These states comprise the East South Central Region according to the U.S. Bureau of Labor Statistics. Data at the state level was unavailable.
16
employees to purchase child care.41 Large employers are more likely to offer child care benefits than small employers, and the percent of employers offering child care is increasing. In 1996, only four percent of private sector employees in the South qualified for employer-sponsored child care.42
Tennessee government also offers tuition waivers and discounts for state employees and their dependents. Tennessee state employees are eligible for a tuition fee waiver for one class per semester at state colleges and universities; dependents of state employees can receive a 25 percent discount at those institutions.43 Some private sector employers offer scholarships to qualified dependents of their employees. Others will pay for specific higher education courses for their employees, though they generally require employees using this benefit to remain with that employer for a fixed amount of time after completing coursework. Tennessee’s state government also sometimes pays for specific higher education courses for its employees. Unfortunately, data are not available on the prevalence of these benefits in the private sector or among public sector employers.
The state of Tennessee also spent approximately $2.8 million on life insurance for state employees in FY03.44
Flexible Benefits Many private employers have begun offering cafeteria-style or flexible benefit plans. Established under Section 125 of the Internal Revenue Code, these plans allow employees to choose from a range of benefit options using pre-tax earnings. The most basic plans allow employees to select their medical and dental coverage of choice. More complex plans, which require sophisticated software to administer, allow employees to choose from multiple versions of health, dental, and life insurance, accidental death and dismemberment coverage, leave time, and childcare.
Under a flexible benefits plan, an employer generally gives employees a fixed number of credits to use for any of the benefits provided through the plan. Providing benefits through the plan offers tax advantages to both employees and the employer because funds used to provide benefits through the plans are not subject to federal, state, or local income and payroll taxes. They appeal to employees by allowing them to tailor their benefits packages to meet their specific needs and preferences. Employees who do not use all of their credit on benefits may take the remainder as cash, though taxes are applied to these cash payments.45
Tennessee state government provides a limited flexible benefits plan to state employees, though it is not a true cafeteria plan. Employees may contribute to deferred compensation plans with pre-tax earnings. Employee health insurance premiums also come from pre-tax dollars, but the 41 U.S. Bureau of Labor Statistics, “Employee Benefits in Private Industry, 2003,” September 17, 2003, USDL: 03-489, p. 6. 42 U.S. Bureau of Labor Statistics, “Employer-Sponsored Childcare Benefits,” Issues in Labor Statistics, August 1998, Summary 98-9. 43 Correspondence from Will Burns, Associate Executive Director for Legal and Regulatory Affairs, Tennessee Higher Education Commission, October 28, 2003. 44 Information provided by Keith Athow, Department of Finance and Administration, Division of Insurance Administration, August 29, 2003. 45 Michael Schrage, “Cafeteria Benefits? Ha! You Deserve a Richer Banquet,” Fortune, April 3, 2000, p. 274; Johnson County, Kansas, Office of Financial Management, “Cafeteria Plan: FAQs,” January 30, 2003, http://ofm.jocoks.com/Benefits/cafePlanFAQ.htm (accessed July 11, 2003); American Federation of State, County, and Municipal Employees, “Your Money or Your Health: Designing Benefit Options—Cafeteria Plans,” October 2001, http://www.afscme.org/wrkplace/cafe.htm (accessed July 11, 2003).
17
employee and employer premium costs vary considerably based on which plan the employee chooses. State employees may also set up reimbursement accounts to cover out-of-pocket medical expenses and childcare costs through pre-tax dollars.46
Intangible Benefits Certainly salaries and benefits are important to attract and retain employees. However, other aspects of employment also play key roles in employee satisfaction. According to research, public sector employees generally value intangible benefits and motivators more than do private sector employees. In a 1998 study, researchers asked private and public sector employees in a Midwestern city to rank 15 motivational factors in terms of their relative importance. Private sector employees ranked “high salary,” “chance to exercise leadership,” and “opportunity for advancement” as their top three motivators. In contrast, public sector employees listed “a stable and secure future,” “chance to learn new things,” and “chance to use my special abilities” as their top three motivators.47 Other research has found that individuals who value job security are more likely to desire jobs in the public sector and to actually hold government jobs.48
Researchers have also examined the extent to which the desire to help others or “make a difference” influences peoples’ decisions on where to work. One study found that individuals who valued jobs that allowed them to help others and be useful to society were more likely both to desire government jobs and to actually hold such jobs.49 Other research indicates that public sector employees generally have a greater interest in altruistic or ideological goals than their private sector counterparts.50 However, the 1998 survey cited above found that the “chance to benefit society” on the job was just as important to private sector supervisors as to public sector supervisors and was more important to public sector non-supervisors than their private sector counterparts.51
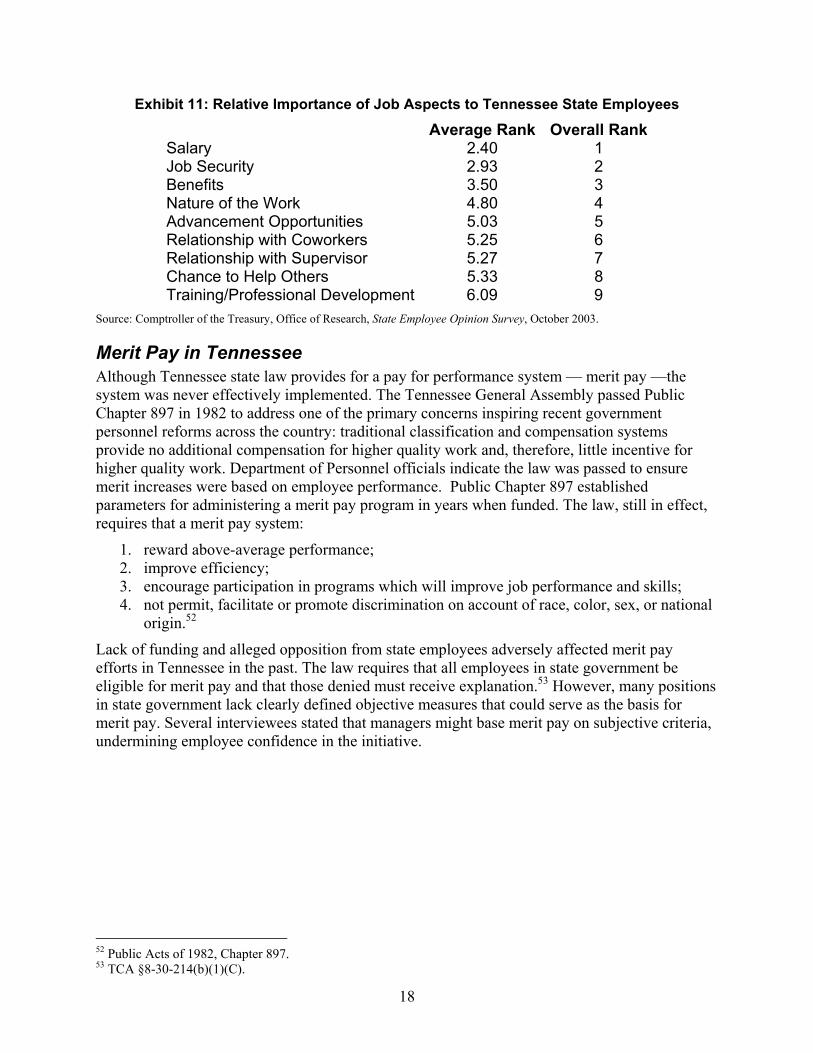
The Comptroller’s Office of Research State Employee Opinion Survey asked Tennessee employees to rank nine job aspects in terms of their relative importance. Exhibit 11 shows average ranks for each. Tennessee employees rated compensation-oriented aspects highly: salary first, benefits third, and advancement opportunities fifth. However, they also ranked some intangible benefits highly: job security second and nature of the work fourth. Notably, the chance to help others was relatively unimportant for state employees as a whole, though some groups of employees generally valued it more. For example, employees involved in social, human, or employment services ranked it fourth on average.
46 Tennessee Treasury Department, “State of Tennessee: Flexible Benefits,” September 2000. 47 Carole Jurkiewicz, Tom Massey, and Roger Brown, “Motivation in Public and Private Organizations,” Public Productivity and Management Review, March 1998, pp. 234-235. 48 Gregory Lewis and Sue Frank, “Who Wants to Work for the Government?” Public Administration Review, July/August 2002, pp. 398-399. 49 Ibid, pp. 397-400. 50 Philip Crewson, “Public-Service Motivation: Building Empirical Evidence of Incidence and Effect,” Journal of Public Administration Research and Theory, October 1997, pp. 499-518. 51 Carole Jurkiewicz, Tom Massey, Jr., and Roger Brown, “Motivation in Public and Private Organizations: A Comparative Study,” Public Productivity and Management Review, March 1998, pp. 230-250.
18
Exhibit 11: Relative Importance of Job Aspects to Tennessee State Employees
Average Rank Overall Rank Salary 2.40 1 Job Security 2.93 2 Benefits 3.50 3 Nature of the Work 4.80 4 Advancement Opportunities 5.03 5 Relationship with Coworkers 5.25 6 Relationship with Supervisor 5.27 7 Chance to Help Others 5.33 8 Training/Professional Development 6.09 9
Source: Comptroller of the Treasury, Office of Research, State Employee Opinion Survey, October 2003.
Merit Pay in Tennessee Although Tennessee state law provides for a pay for performance system — merit pay —the system was never effectively implemented. The Tennessee General Assembly passed Public Chapter 897 in 1982 to address one of the primary concerns inspiring recent government personnel reforms across the country: traditional classification and compensation systems provide no additional compensation for higher quality work and, therefore, little incentive for higher quality work. Department of Personnel officials indicate the law was passed to ensure merit increases were based on employee performance. Public Chapter 897 established parameters for administering a merit pay program in years when funded. The law, still in effect, requires that a merit pay system:
1. reward above-average performance; 2. improve efficiency; 3. encourage participation in programs which will improve job performance and skills; 4. not permit, facilitate or promote discrimination on account of race, color, sex, or national
origin.52
Lack of funding and alleged opposition from state employees adversely affected merit pay efforts in Tennessee in the past. The law requires that all employees in state government be eligible for merit pay and that those denied must receive explanation.53 However, many positions in state government lack clearly defined objective measures that could serve as the basis for merit pay. Several interviewees stated that managers might base merit pay on subjective criteria, undermining employee confidence in the initiative.
52 Public Acts of 1982, Chapter 897. 53 TCA §8-30-214(b)(1)(C).
19
Analysis and Conclusions Salaries for many state positions are below salaries for comparable positions at other public and private sector employers. In addition, state employee salaries may not be highly correlated with the value of employees’ labor. Tennessee last conducted a comprehensive study with accompanying overhaul of the state employees’ compensation and classification system in 1984. In that study, the Department of Personnel created a customized instrument to establish 43 salary grades and assign all state job classes to the appropriate grades. Since then, the General Assembly has provided raises for state employees most years, but these raises have generally been based on funding ability. In many cases, pay increases in state government have failed to keep pace with the market. Average salaries for some positions are in line with the greater labor market, but salaries for other positions are 30 to 40 percent below market rates. (See Exhibit 6.)
Other employers base pay increases on measured increases in the cost of living, changes in education and experience within the workforce, corporate profitability, comparability with other employers, or some combination of these factors. The Department of Personnel has contracted with consultants to provide estimates of what other employers in the Tennessee labor market pay for employees similar to those in state government, most recently in 1996. Since that time, the Department of Personnel has obtained copies of similar reports provided by consultants to Metropolitan Nashville-Davidson County. Using these reports and turnover rate data, the Department of Personnel has allocated money appropriated by the General Assembly for pay increases for hard-to-staff positions. However, salaries for many positions are below typical market rates and appear to be falling further behind.
A well-structured pay plan is based on the relative value of positions to the employer (demand) and salaries paid for similar work in the labor market (supply).54 Employers who pay below market rates have difficulty finding qualified applicants or, in severe cases, any applicants. Turnover may also be high. Paying above market rates can also be costly for an employer. For example, paying 50 percent above the market median is not likely to produce a substantially better talent pool than paying 20 percent above the market rate. The additional compensation would thus be wasted. Demand factors are also critical. If a certain job class is a key piece of what an employer does, the employer may need to pay employees in this class more because of the value of their work. In contrast, employees whose work is less vital may be paid lower salaries with fewer consequences.
Tennessee government’s compensation structure lacks explicit provisions to reward performance. Tennessee’s overall approach to human resource management may inadvertently discourage improved performance. Well-structured pay plans take into account that more productive employees are more valuable to their employers. To encourage productivity, employers provide high-performing employees additional compensation through raises, bonuses, promotions, or perks. Research has demonstrated that tying compensation to performance increases employee motivation and output.55
54 Robert Carow, et. al., “The Future of Salary Management,” Compensation and Benefits Review, July/August 2001. 55 Rajiv Banker, et. al., “An Empirical Analysis of Continuing Improvements Following the Implementation of a Performance-Based Compensation Plan,” Journal of Accounting and Economics, Vol. 30, 2001, pp. 315-350.
20
However, Tennessee government generally lacks such motivators. State government does not have a pay for performance system and, based on the State Employee Opinion Survey, over 70 percent of state employees believe: “It is hard for good state employees to get promoted.” Not surprisingly, less than seven percent of state employees surveyed believe state employees have strong financial incentives to work hard.
Although Tennessee government lacks explicit mechanisms to reward performance, it ties compensation to other factors. Most notably, employees with longer tenure (work experience in state government) receive higher compensation. Employees with dependents have the option for greater health insurance benefits. These mechanisms divert state resources from compensation strategies designed to reward performance.
Longevity pay, annual leave, and retirement benefits all become more generous as employee tenure increases. Work experience usually generates increased competence, and these forms of compensation can be viewed as compensation for that experience. However, employees who achieve increased competence more quickly do not receive such increased compensation. Likewise, these mechanisms do not reward employees who bring significant experience with them from other employers. Finally, employees receive additional compensation through these mechanisms once they achieve the established service tenure, whether or not competence has improved. These factors reward longevity rather than performance. To the extent that employees with longer service perform better than other employees, these are efficient compensation methods, but they become inefficient and even harmful when performance does not match longevity.
Tennessee also provides employees different levels of compensation through health insurance. As shown in Exhibit 9, Tennessee pays a smaller share of individual health insurance coverage and a larger share of family health insurance coverage than many competing employers. This has the net effect of making state government more attractive to employees with families and less attractive to single people. That phenomenon is potentially costly for state government. For example, if two applicants with identical credentials apply both with state government and a private company, one single and one with a family, the one with the family may be more likely to work for state government. Assuming that both employers make identical job offers to both applicants with one exception: Tennessee will pay 80 percent of health insurance premiums for both employees while the private company will pay a higher share for single coverage and a lower share for family coverage. As a result, the applicant with the family is more likely to accept the state government offer, while the single applicant accepts the private sector offer.
In such a case, the state appears to make identical offers to both candidates, but in reality makes a more generous offer to the applicant with a family. The annual cost of the employer share of individual health insurance is $3,791.56 The cost to the state for family coverage is $9,466. Thus, the state offered $5,674 more in compensation to the applicant with a family. Over time, if applicants with families gravitate to state government and applicants without families (or without the need for family coverage) choose other employers, compensation costs for the state of Tennessee increase without increases in salary or worker quality. However, to the extent that this policy encourages some talented, young employees to remain in state employment as they mature and start families, the state may benefit.
56 Preferred Provider Option, effective January 1, 2004.
21
State officials created longevity pay, retirement, annual leave, and group health insurance to better compensate employees and, in part, to encourage longevity. However, they may indirectly discourage performance and reduce longevity for high-quality employees. Because financial resources do not change with compensation strategies in state government, state employee compensation is a “zero-sum game,” where money spent on one form of compensation is money that cannot be spent on another form. These forms of compensation encouraging longevity divert limited financial resources from other compensation strategies, such as targeted salary increases, that could be based on employee performance and the value of employee labor.
Pay for performance has long been common in the private sector. The most widely known method of pay for performance is the commission, where employees are paid a certain amount per task completed. Retailers often pay employees a commission that is a percent of the value of merchandise sold by those employees.
Pay for performance plans are widely accepted to be cost-effective, and research supports this belief. A study of a pay for performance plan at a Fortune 500 retail company found that implementation of a pay for performance plan dramatically improved sales. Researchers concluded that the plan increased worker productivity in two ways: first, by encouraging employees to put more effort into their work and, second, by increasing the company’s ability to attract and retain quality employees. Talented and motivated workers tended to gravitate to the firm seeking the higher wages since pay was tied to performance, while less productive employees left, theoretically to find jobs where compensation was not tied to performance.57
Compensation experts differ over what “pay” should be used to reward performance. Many suggest that bonuses are more effective motivators than permanent salary increases. When employees receive bonuses, they must continue to exert additional effort or produce additional output to maintain their level of compensation going forward. However, once a raise is given, it is seldom retracted even if worker effort or output diminishes.58 Some compensation experts have suggested that bonuses smaller than five percent of employee salaries are ineffective.59 Finally, compensation experts differ over whether employees should receive cash or non-cash performance bonuses. Some research has suggested that non-cash rewards are more cost-effective than cash bonuses. Employees frequently save cash bonuses or use the money to pay off bills. In contrast, employees must use free trips or gift certificates to “treat themselves.” This can enhance the motivational impact of the reward.60
Pay for performance plans have largely been unsuccessful in the public sector. Most programs, like Tennessee’s merit pay system, apparently were perceived by employees as subjective and offered too little extra compensation to be effective. However, some public sector employers have had success with pay for performance. Officials at the Hamilton County, Ohio Department of Jobs and Family Services, for example, credit their pay for performance plan with reducing attrition among employees by 35 percent and improving morale in most job classifications. Their
57 Rajiv Banker, et. al., “An Empirical Analysis of Continuing Improvements Following the Implementation of a Performance-Based Compensation Plan,” Journal of Accounting and Economics, Vol. 30, 2001, pp. 315-350. 58 Steve Kerr, “Organizational Rewards: Practical, Cost Neutral Alternatives that You may Know, but Don’t Practice,” Organizational Dynamics, July 1999, pp. 61-70. 59 David Osborne, “Paying for Results,” Government Executive, February 2001, pp. 65-66. 60 Darryl Hutson, “New Incentives are on the Rise,” Compensation and Benefits Review, September/October 2000, pp. 40-46.
22
pay for performance plan was negotiated with the unions in 1996 and the performance appraisal process was designed jointly by labor and management.61
Team-Based Rewards In addition to or in lieu of traditional pay for performance, many private sector employers provide team-based rewards. The broadest of these is “profit sharing,” providing higher pay to employees when company profits increase. Several companies include profit sharing as part of every employee’s compensation. One mechanism for profit sharing is to distribute company stock or stock options to employees. As the profitability and value of the company increases, the value of the stock increases. Stock options become valuable only once the price of a company’s stock reaches a certain level.
Scanlon-type plans, named for Joe Scanlon, a cost accountant and local union official of the United Steelworkers in the 1930s, are gainsharing plans that provide bonuses to employees as a group based on productivity increases resulting from employee suggestions.62 For example, if an employee figures out a way to produce a product more efficiently, all employees involved in that stage of production would receive a pay increase when the innovation is implemented. An examination of Scanlon-type compensation plans at six facilities found that the plans produced significant cost savings in every case, as well as numerous other benefits for both management and employees.63 Other research found that implementing a Scanlon-type compensation plan dramatically reduced employee grievances and absenteeism.64 However, Scanlon-type plans have traditionally been used in manufacturing facilities rather than the service or public sector.
As with traditional pay for performance, public sector employers have had limited success with team-based incentives. Global incentives based on profitability, common in the private sector, are impossible for governments since they don’t produce profits. State governments are also unable to offer company stock or stock options. Scanlon-type compensation plans are difficult, as well, since government outputs are seldom sold in the market and therefore lack a clearly defined value.
Despite these challenges, some public employers have improved productivity through team-based incentives. As part of a broader labor-management partnership, the city of Indianapolis allowed municipal workers to bid for city contracts against private firms. If workers win the bid and provide services below the bid price, they receive 25 percent of the savings as incentive payments. In 1994, workers in the Department of Public Works received an average of $1,750 in incentive payments per worker.65 Many observers have credited the new approach with simultaneously reducing costs and improving services.
Nonmonetary Rewards Although research has demonstrated that pay for performance plans can improve employee productivity, less costly motivators can also produce productivity gains. One recent study found 61 Robert Lavigna, Human Resource Management: Best Practices in Human Services, The Annie E. Casey Foundation and CPS Human Resource Services, April 21, 2003, pp.17-18. 62 Denis Collins, Gainsharing and Power, (Ithaca, NY: Cornell University Press, 1998) pp. 10-11. 63 Ibid, p. 217. 64 Jeffrey Arthur and Gregory Jelf, “The Effects of Gainsharing on Grievance Rates and Absenteeism over Time,” Journal of Labor Research, Winter 1999, pp. 133-145. 65 Barry Rubin and Richard Rubin, “Labor-Management Partnerships: A New Approach to Collaborative Management,” Human Capital 2002, Mark Abramson and Nicole Gardner, eds. (New York: Rowman and Littlefield Publishers, 2002) pp. 330-335.
23
that when managers were trained in their implementation, social recognition and performance feedback significantly improved employee performance over a one-month trial period. These strategies were less effective than a pay for performance plan implemented in the same period but were also less costly.66 A 1999 survey by American Express Incentive Services asked workers: “Suppose your employer wants to reward your work performance by giving you a trip valued at $2,000. What would be the greatest benefit of an employer-sponsored trip to you personally?” The largest group, 25 percent, said feeling appreciated and recognized by their employers. Only one percent cited the trip itself as the greatest benefit.67 Clearly, communication from managers to employees can have a significant impact on employee morale and performance. Some compensation experts argue that managers frequently underestimate the power of non-financial rewards such as newsletter stories, flowers, plaques, and public recognition.68
Implementation Challenges Although research and history have shown that pay for performance can be effective, many pay for performance plans have proven unsuccessful. A truism of business is that whatever is measured, especially if it is rewarded, will increase. However, this has limits. Pay for performance requires some quantitative measure of performance. Yet, most jobs include many aspects that either are difficult or impossible to measure. Employees may focus on the outputs that are measured and devote less time and energy to parts of their jobs that, though important, are not easily measured and are not covered by pay for performance. Workers may also increase the quantity of output while the quality suffers.69 Furthermore, pay for performance incentives may create a disincentive for collaboration among coworkers who compete for a finite pay for performance bonus, particularly in the public sector where doing a job well typically will not create additional revenues that can be distributed to employees.
However, implementing pay for performance does not necessarily yield these negative outcomes. Researchers from Temple University measured what they called Organizational Citizenship Behavior (OCB) among workers at public utilities with pay for performance plans. The researchers defined OCB as “employee behavior that goes above and beyond the call of duty, that is discretionary and not explicitly recognized by the employing organization’s formal reward system, and that contributes to organizational effectiveness.” In other words, OCB is doing what is best for the employer even though it won’t be rewarded through pay for performance. The researchers found that if employees believed there was a strong connection between performance and pay, they were less likely to engage in OCB, but only if they were not committed to the values of their employer. In fact, those employees who were both highly committed to organizational values and believed there was a strong link between performance and pay were
66 Alexander Stajkovic and Fred Luthans, “Differential Effects of Incentive Motivators on Work Performance,” Academy of Management Journal, June 2001, pp. 580-590. 67 Darryl Hutson, “New Incentives are on the Rise,” Compensation and Benefits Review, September/October 2000, p. 41. 68 David Osborne, “Paying for Results,” Government Executive, February 2001, p. 64; Steve Kerr, “Organizational Rewards: Practical, Cost Neutral Alternatives that You May Know, but Don’t Practice,” Organizational Dynamics, July 1999, pp. 61-70. 69 Maurice Holt, “Performance Pay for Teachers: The Standards Movement’s Last Stand?” Phi Delta Kappan, December 2001, pp. 312-317.
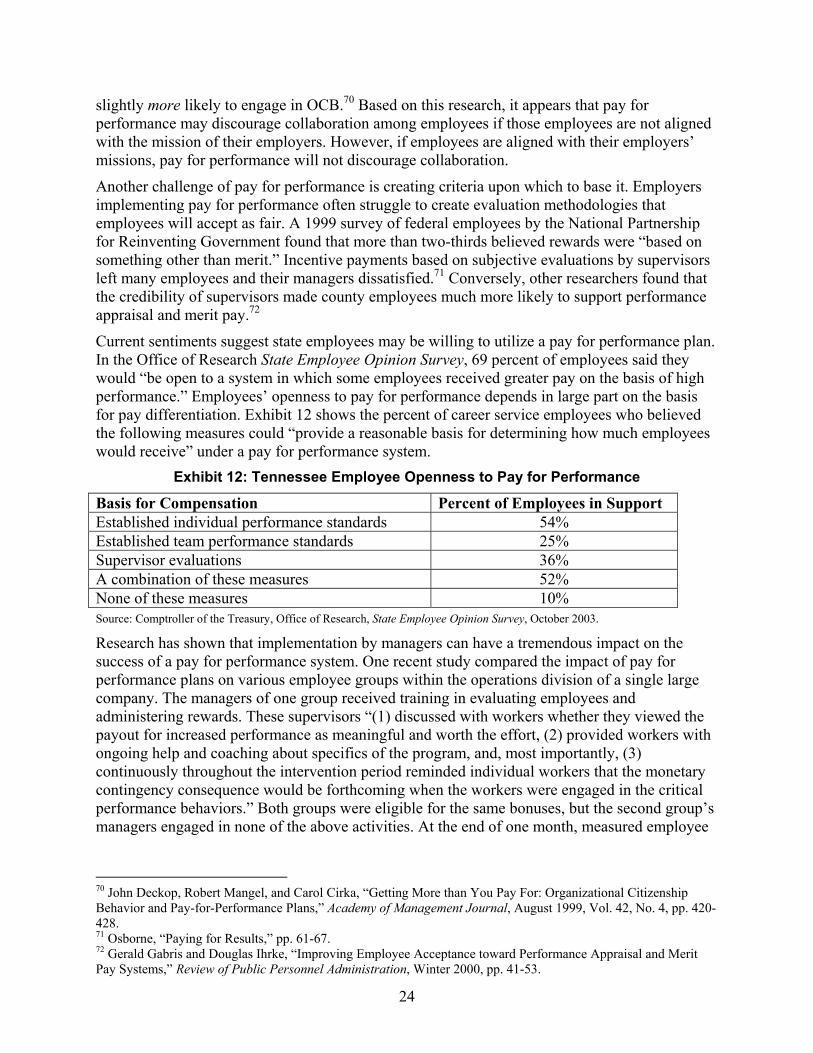
24
slightly more likely to engage in OCB.70 Based on this research, it appears that pay for performance may discourage collaboration among employees if those employees are not aligned with the mission of their employers. However, if employees are aligned with their employers’ missions, pay for performance will not discourage collaboration.
Another challenge of pay for performance is creating criteria upon which to base it. Employers implementing pay for performance often struggle to create evaluation methodologies that employees will accept as fair. A 1999 survey of federal employees by the National Partnership for Reinventing Government found that more than two-thirds believed rewards were “based on something other than merit.” Incentive payments based on subjective evaluations by supervisors left many employees and their managers dissatisfied.71 Conversely, other researchers found that the credibility of supervisors made county employees much more likely to support performance appraisal and merit pay.72
Current sentiments suggest state employees may be willing to utilize a pay for performance plan. In the Office of Research State Employee Opinion Survey, 69 percent of employees said they would “be open to a system in which some employees received greater pay on the basis of high performance.” Employees’ openness to pay for performance depends in large part on the basis for pay differentiation. Exhibit 12 shows the percent of career service employees who believed the following measures could “provide a reasonable basis for determining how much employees would receive” under a pay for performance system.
Exhibit 12: Tennessee Employee Openness to Pay for Performance
Basis for Compensation Percent of Employees in Support Established individual performance standards 54% Established team performance standards 25% Supervisor evaluations 36% A combination of these measures 52% None of these measures 10% Source: Comptroller of the Treasury, Office of Research, State Employee Opinion Survey, October 2003.
Research has shown that implementation by managers can have a tremendous impact on the success of a pay for performance system. One recent study compared the impact of pay for performance plans on various employee groups within the operations division of a single large company. The managers of one group received training in evaluating employees and administering rewards. These supervisors “(1) discussed with workers whether they viewed the payout for increased performance as meaningful and worth the effort, (2) provided workers with ongoing help and coaching about specifics of the program, and, most importantly, (3) continuously throughout the intervention period reminded individual workers that the monetary contingency consequence would be forthcoming when the workers were engaged in the critical performance behaviors.” Both groups were eligible for the same bonuses, but the second group’s managers engaged in none of the above activities. At the end of one month, measured employee
70 John Deckop, Robert Mangel, and Carol Cirka, “Getting More than You Pay For: Organizational Citizenship Behavior and Pay-for-Performance Plans,” Academy of Management Journal, August 1999, Vol. 42, No. 4, pp. 420-428. 71 Osborne, “Paying for Results,” pp. 61-67. 72 Gerald Gabris and Douglas Ihrke, “Improving Employee Acceptance toward Performance Appraisal and Merit Pay Systems,” Review of Public Personnel Administration, Winter 2000, pp. 41-53.
25
performance increased 31.7 percent in the first group but only 11.1 percent in the second group.73 Clearly, in both cases, financial incentives were an important motivator, but this study reveals that implementation is as important as the incentives themselves.
Lessons in Pay for Performance Although most Tennessee state employees would be open to a system of pay for performance, many remain skeptical. According to survey data, most would prefer either a cost-of-living adjustment or a pay structure with guaranteed annual steps based on training and experience. In this environment, both the pros and cons of any potential pay for performance system must be viewed carefully.
• Pay for performance can improve employee productivity. Employers using pay for performance find productivity gains two ways:
o employees work harder to achieve performance bonuses and
o the employer attracts highly capable and motivated employees who believe their work will be rewarded. Conversely, less productive employees often resign and potential applicants who view themselves as less productive are less likely to apply for jobs.
• Employees distrust pay for performance programs that seem to be based on subjective determinations of performance. Implementers of pay for performance systems should:
o train managers in measuring and implementing pay for performance programs,
o implement programs to increase trust among managers and subordinates,
o strive to define measurable outputs for all employees,
o provide team-based rewards for employees who work in teams that produce measurable outputs but for whom individual outputs are more difficult to measure, and
o avoid criteria and rewards that cause all employees to get the same reward regardless of performance.
• The type and size of a reward can influence its impact as an employee motivator. Implementers of pay for performance systems should evaluate:
o the relative advantages of one-time bonuses and increases in base pay,
o the relative advantages of cash incentives and non-cash incentives, and
o the relative advantages of low-cost options such as plaques, special parking spaces, and gift certificates.
• Pay for performance is not a panacea. Pay for performance is only one way to increase employee motivation. Many managers have found praise and public recognition to have a positive impact on employee performance. Furthermore, numerous interviewees and readings cited the importance of communication between managers and employees, both in the absence and presence of pay for performance. To maximize employee performance, managers must clearly convey expectations, the extent to which employees are meeting those expectations, and avenues for improvement on an ongoing basis.
73 Alexander Stajkovic and Fred Luthans, “Differential Effects of Incentive Motivators on Work Performance,” Academy of Management Journal, June 2001, pp. 580-590.
26
Department of Personnel officials contend that salaries should reflect their market value for pay for performance to work effectively. In addition, they indicate that any kind of rewards program is difficult to implement unless employees feel that basic pay is adequate and that all employees are eligible.74
Broadbanding Some state governments have moved to a system of broadbanding that allows managers greater flexibility to reward top performers. In general terms, broadbanding involves collapsing multiple job classes into a single job category. For example, an Accountant 1, Accountant 2, and Accountant 3 could all be assigned to the general class of “Accountant.” Some broadbanding initiatives have gone even further, grouping similar occupations into a common group even if the type of work is slightly different.
Several state governments have moved to a broadbanding approach. Iowa was one of the earliest states to do so.75 Wisconsin followed suit in the 1990s, and managers there contend that increased flexibility contributed to lower turnover rates in state government.76 Washington passed legislation in 2002 that will substantially reduce the number of job classifications by 2005.77 In 1984, Tennessee reduced the number of career service classifications from 2,175 to 1,233, but still has numerous job groups with multiple levels. Broadbanding may offer state governments a new method to attract and retain valuable employees. Still, it has some fundamental weaknesses. Organized labor groups have traditionally been opposed to broadbanding because they fear that the increased flexibility given managers will provide greater opportunities for favoritism and corruption. Some states have found that broadbanding can contribute to inter-agency “arms races” where agencies compete against one another and bid up the salaries of some valuable employees.
Its culture and compensation structure may make Tennessee state government unattractive to many potential employees. State government lacks explicit incentives to reward high performance. Research has shown that performance incentives tend to attract talented and highly motivated employees.78 To the extent that other employers provide performance-based pay while Tennessee does not, talented and motivated employees may choose not to work for state government.
The compensation strategies described above (longevity pay, annual leave, retirement, and health insurance) can be viewed as a package worth about $9,000 a year and certainly reduce turnover for some employees. However, many high-quality employees can likely receive greater compensation outside Tennessee government in the form of higher salaries, more opportunities for advancement, and pay for performance. Some will leave. In contrast those who believe themselves to be average performers may choose Tennessee government employment for a career because the compensation rewards are not dependent on performance.
74 Interview with Department of Personnel officials, March 8, 2004 75 Telephone interview with Jonathan Walters, Staff Correspondent, Governing, October 30, 2003. 76 Human Resource Management: Innovation in Selected Jurisdictions, The Center for the Study of Social Policy, June 2002, p. 71. 77 Tina VanderWal, “Civil Service Reform Act Overhauls 30-year-old System,” The Olympian, October 14, 2002. 78 Rajiv Banker, et. al., “An Empirical Analysis of Continuing Improvements Following the Implementation of a Performance-Based Compensation Plan,” Journal of Accounting and Economics, Vol. 30, 2001, pp. 315-350.
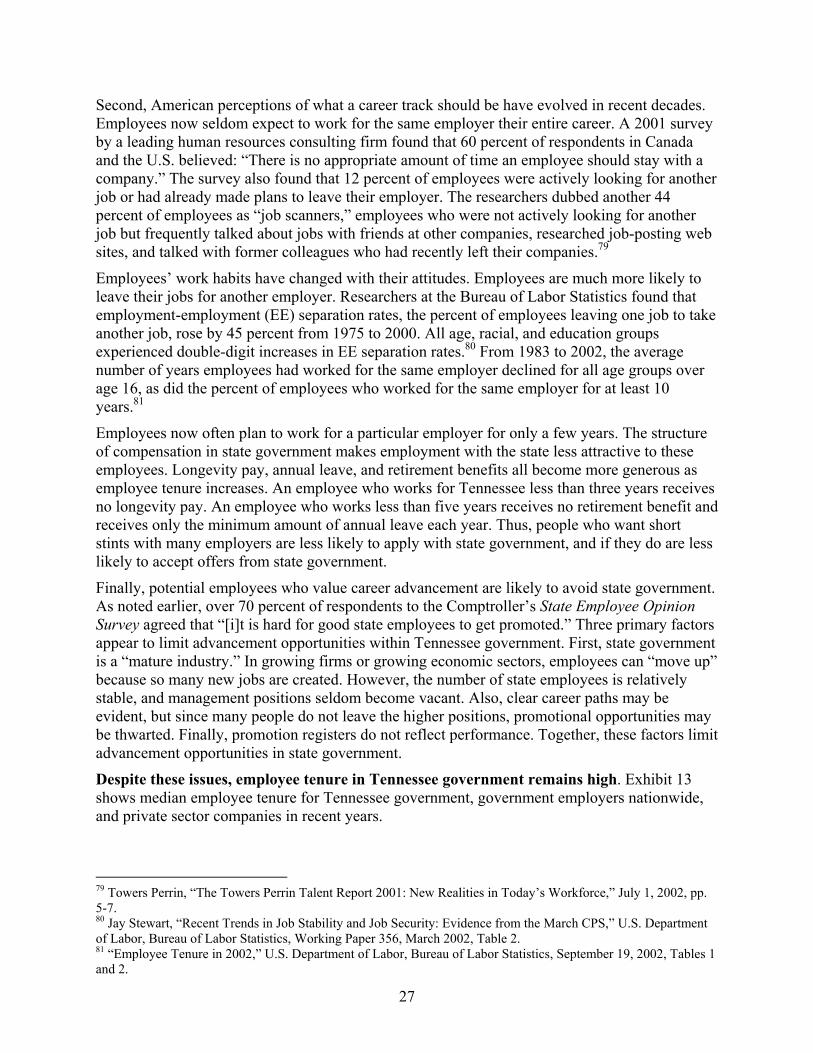
27
Second, American perceptions of what a career track should be have evolved in recent decades. Employees now seldom expect to work for the same employer their entire career. A 2001 survey by a leading human resources consulting firm found that 60 percent of respondents in Canada and the U.S. believed: “There is no appropriate amount of time an employee should stay with a company.” The survey also found that 12 percent of employees were actively looking for another job or had already made plans to leave their employer. The researchers dubbed another 44 percent of employees as “job scanners,” employees who were not actively looking for another job but frequently talked about jobs with friends at other companies, researched job-posting web sites, and talked with former colleagues who had recently left their companies.79
Employees’ work habits have changed with their attitudes. Employees are much more likely to leave their jobs for another employer. Researchers at the Bureau of Labor Statistics found that employment-employment (EE) separation rates, the percent of employees leaving one job to take another job, rose by 45 percent from 1975 to 2000. All age, racial, and education groups experienced double-digit increases in EE separation rates.80 From 1983 to 2002, the average number of years employees had worked for the same employer declined for all age groups over age 16, as did the percent of employees who worked for the same employer for at least 10 years.81
Employees now often plan to work for a particular employer for only a few years. The structure of compensation in state government makes employment with the state less attractive to these employees. Longevity pay, annual leave, and retirement benefits all become more generous as employee tenure increases. An employee who works for Tennessee less than three years receives no longevity pay. An employee who works less than five years receives no retirement benefit and receives only the minimum amount of annual leave each year. Thus, people who want short stints with many employers are less likely to apply with state government, and if they do are less likely to accept offers from state government.
Finally, potential employees who value career advancement are likely to avoid state government. As noted earlier, over 70 percent of respondents to the Comptroller’s State Employee Opinion Survey agreed that “[i]t is hard for good state employees to get promoted.” Three primary factors appear to limit advancement opportunities within Tennessee government. First, state government is a “mature industry.” In growing firms or growing economic sectors, employees can “move up” because so many new jobs are created. However, the number of state employees is relatively stable, and management positions seldom become vacant. Also, clear career paths may be evident, but since many people do not leave the higher positions, promotional opportunities may be thwarted. Finally, promotion registers do not reflect performance. Together, these factors limit advancement opportunities in state government.
Despite these issues, employee tenure in Tennessee government remains high. Exhibit 13 shows median employee tenure for Tennessee government, government employers nationwide, and private sector companies in recent years.
79 Towers Perrin, “The Towers Perrin Talent Report 2001: New Realities in Today’s Workforce,” July 1, 2002, pp. 5-7. 80 Jay Stewart, “Recent Trends in Job Stability and Job Security: Evidence from the March CPS,” U.S. Department of Labor, Bureau of Labor Statistics, Working Paper 356, March 2002, Table 2. 81 “Employee Tenure in 2002,” U.S. Department of Labor, Bureau of Labor Statistics, September 19, 2002, Tables 1 and 2.
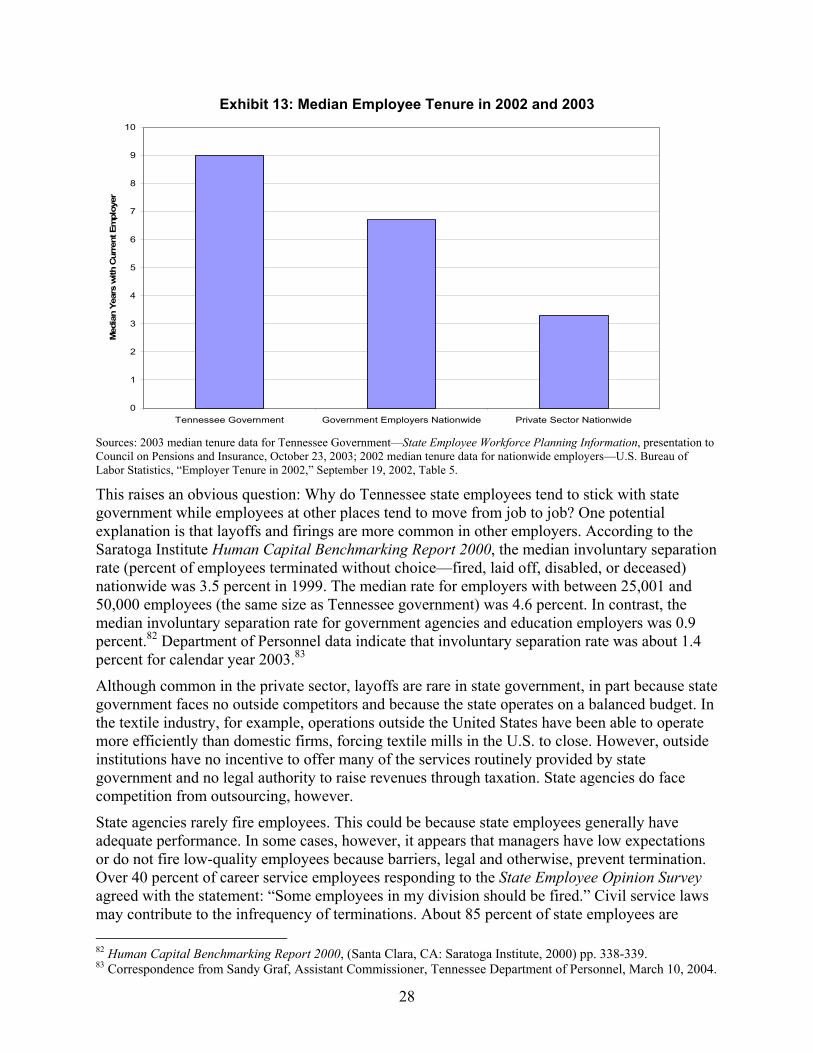
28
Exhibit 13: Median Employee Tenure in 2002 and 2003
0
1
2
3
4
5
6
7
8
9
10
Tennessee Government Government Employers Nationwide Private Sector Nationwide
Med
ian
Year
s w
ith C
urre
nt E
mpl
oyer
Sources: 2003 median tenure data for Tennessee Government—State Employee Workforce Planning Information, presentation to Council on Pensions and Insurance, October 23, 2003; 2002 median tenure data for nationwide employers—U.S. Bureau of Labor Statistics, “Employer Tenure in 2002,” September 19, 2002, Table 5.
This raises an obvious question: Why do Tennessee state employees tend to stick with state government while employees at other places tend to move from job to job? One potential explanation is that layoffs and firings are more common in other employers. According to the Saratoga Institute Human Capital Benchmarking Report 2000, the median involuntary separation rate (percent of employees terminated without choice—fired, laid off, disabled, or deceased) nationwide was 3.5 percent in 1999. The median rate for employers with between 25,001 and 50,000 employees (the same size as Tennessee government) was 4.6 percent. In contrast, the median involuntary separation rate for government agencies and education employers was 0.9 percent.82 Department of Personnel data indicate that involuntary separation rate was about 1.4 percent for calendar year 2003.83
Although common in the private sector, layoffs are rare in state government, in part because state government faces no outside competitors and because the state operates on a balanced budget. In the textile industry, for example, operations outside the United States have been able to operate more efficiently than domestic firms, forcing textile mills in the U.S. to close. However, outside institutions have no incentive to offer many of the services routinely provided by state government and no legal authority to raise revenues through taxation. State agencies do face competition from outsourcing, however.
State agencies rarely fire employees. This could be because state employees generally have adequate performance. In some cases, however, it appears that managers have low expectations or do not fire low-quality employees because barriers, legal and otherwise, prevent termination. Over 40 percent of career service employees responding to the State Employee Opinion Survey agreed with the statement: “Some employees in my division should be fired.” Civil service laws may contribute to the infrequency of terminations. About 85 percent of state employees are 82 Human Capital Benchmarking Report 2000, (Santa Clara, CA: Saratoga Institute, 2000) pp. 338-339. 83 Correspondence from Sandy Graf, Assistant Commissioner, Tennessee Department of Personnel, March 10, 2004.
29
covered by civil service protections. These laws require managers to engage in progressive discipline before terminating career service employees and provide a formal grievance process for employees to appeal a termination.84 Although implemented to assure employees are treated fairly, several interviewees noted that agencies sometimes must take back employees whose grievances are successful because of technicalities in the process. This can make managers reluctant to consider terminating underperforming employees. If employees perceive reluctance on the part of managers to fire ineffective employees, some may respond by putting forth only minimal effort. Data from the State Employee Opinion Survey appears to support this hypothesis; managers in the career service were more likely than managers in the executive service to agree with the statement: “I have difficulty motivating the people I supervise.”
Of course, there are other reasons why state employees choose to remain with state government rather than seek out other employers. According to the State Employee Opinion Survey, less than 45 percent of state employees have applied for a job outside state government in spite of the fact that over three-fourths believe they “could make more money doing similar work in the private sector” and more than half believe they “could make more money doing similar work for other public sector employers.” Of those who applied in other places, the most frequently cited reasons for remaining with state government were (1) other job required a move out of town, (2) preferred the stability of the state, (3) state job provided better benefits, and (4) did not receive another job offer. Another possible explanation is that some state employees developed expertise in jobs that have no private sector counterpart.
Turnover data also support the hypothesis that state employees are less likely than those in other places to change employers. Exhibit 14 shows turnover rates in Tennessee government for the 1999-2000 fiscal year and voluntary turnover rates for the 1999 calendar year for U.S. employers of comparable size. Though comparable data were unavailable, Tennessee’s overall turnover rate was lower for every age group than the voluntary turnover rate of the comparison group. If voluntary turnover data for Tennessee government were available, the difference would have been even larger. The differences are particularly large in percentage terms for employees with one to three years of experience and those with over five years.
84 TCA §8-30-326 through §8-30-331.
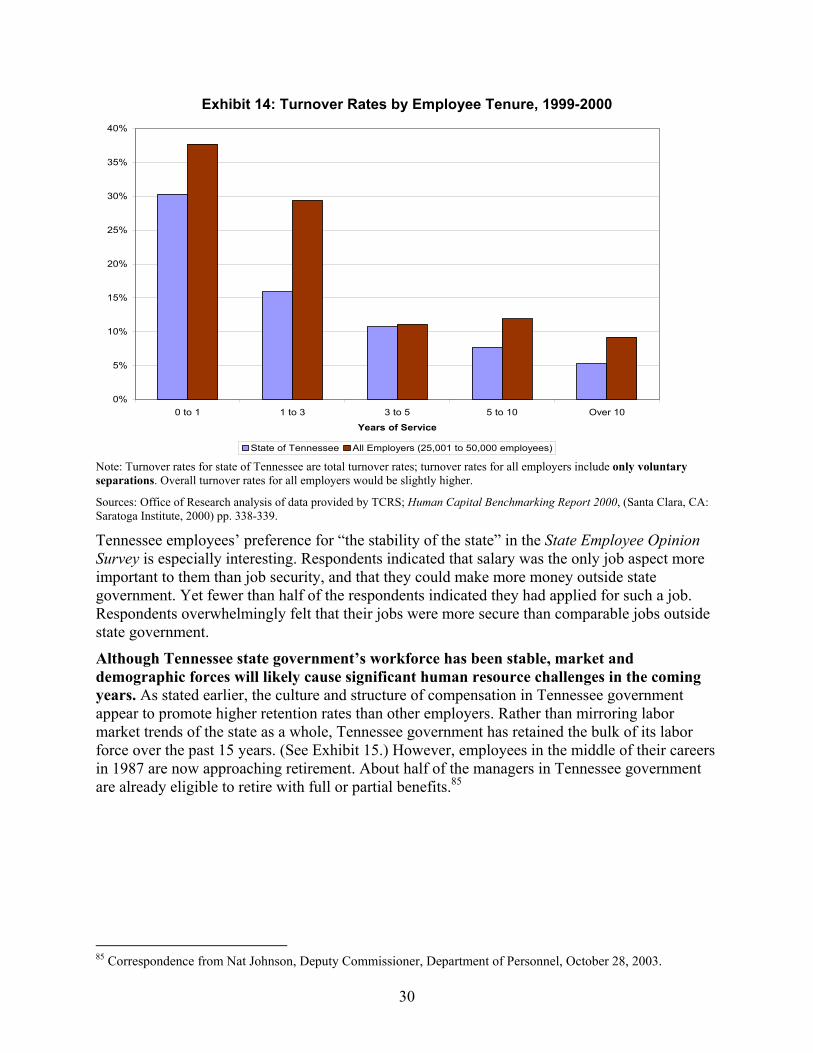
30
Exhibit 14: Turnover Rates by Employee Tenure, 1999-2000
0%
5%
10%
15%
20%
25%
30%
35%
40%
0 to 1 1 to 3 3 to 5 5 to 10 Over 10
Years of Service
State of Tennessee All Employers (25,001 to 50,000 employees) Note: Turnover rates for state of Tennessee are total turnover rates; turnover rates for all employers include only voluntary separations. Overall turnover rates for all employers would be slightly higher.
Sources: Office of Research analysis of data provided by TCRS; Human Capital Benchmarking Report 2000, (Santa Clara, CA: Saratoga Institute, 2000) pp. 338-339.
Tennessee employees’ preference for “the stability of the state” in the State Employee Opinion Survey is especially interesting. Respondents indicated that salary was the only job aspect more important to them than job security, and that they could make more money outside state government. Yet fewer than half of the respondents indicated they had applied for such a job. Respondents overwhelmingly felt that their jobs were more secure than comparable jobs outside state government.
Although Tennessee state government’s workforce has been stable, market and demographic forces will likely cause significant human resource challenges in the coming years. As stated earlier, the culture and structure of compensation in Tennessee government appear to promote higher retention rates than other employers. Rather than mirroring labor market trends of the state as a whole, Tennessee government has retained the bulk of its labor force over the past 15 years. (See Exhibit 15.) However, employees in the middle of their careers in 1987 are now approaching retirement. About half of the managers in Tennessee government are already eligible to retire with full or partial benefits.85
85 Correspondence from Nat Johnson, Deputy Commissioner, Department of Personnel, October 28, 2003.
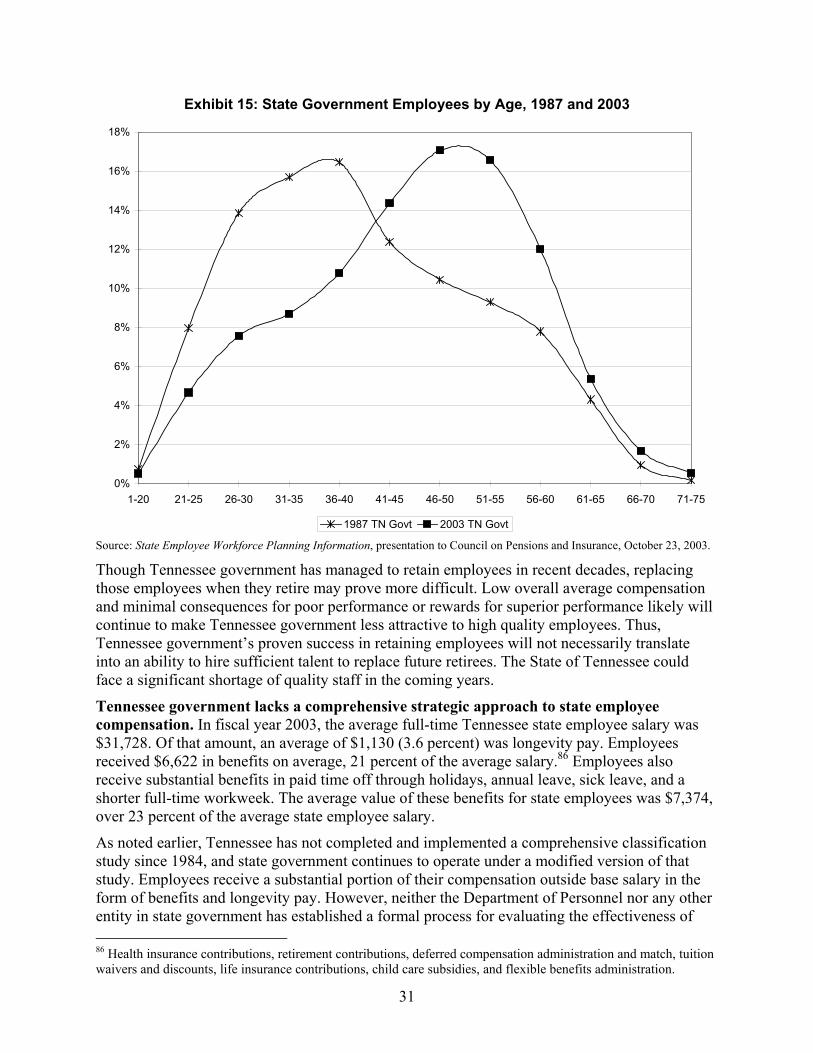
31
Exhibit 15: State Government Employees by Age, 1987 and 2003
0%
2%
4%
6%
8%
10%
12%
14%
16%
18%
1-20 21-25 26-30 31-35 36-40 41-45 46-50 51-55 56-60 61-65 66-70 71-75
1987 TN Govt 2003 TN Govt Source: State Employee Workforce Planning Information, presentation to Council on Pensions and Insurance, October 23, 2003.
Though Tennessee government has managed to retain employees in recent decades, replacing those employees when they retire may prove more difficult. Low overall average compensation and minimal consequences for poor performance or rewards for superior performance likely will continue to make Tennessee government less attractive to high quality employees. Thus, Tennessee government’s proven success in retaining employees will not necessarily translate into an ability to hire sufficient talent to replace future retirees. The State of Tennessee could face a significant shortage of quality staff in the coming years.
Tennessee government lacks a comprehensive strategic approach to state employee compensation. In fiscal year 2003, the average full-time Tennessee state employee salary was $31,728. Of that amount, an average of $1,130 (3.6 percent) was longevity pay. Employees received $6,622 in benefits on average, 21 percent of the average salary.86 Employees also receive substantial benefits in paid time off through holidays, annual leave, sick leave, and a shorter full-time workweek. The average value of these benefits for state employees was $7,374, over 23 percent of the average state employee salary.
As noted earlier, Tennessee has not completed and implemented a comprehensive classification study since 1984, and state government continues to operate under a modified version of that study. Employees receive a substantial portion of their compensation outside base salary in the form of benefits and longevity pay. However, neither the Department of Personnel nor any other entity in state government has established a formal process for evaluating the effectiveness of 86 Health insurance contributions, retirement contributions, deferred compensation administration and match, tuition waivers and discounts, life insurance contributions, child care subsidies, and flexible benefits administration.
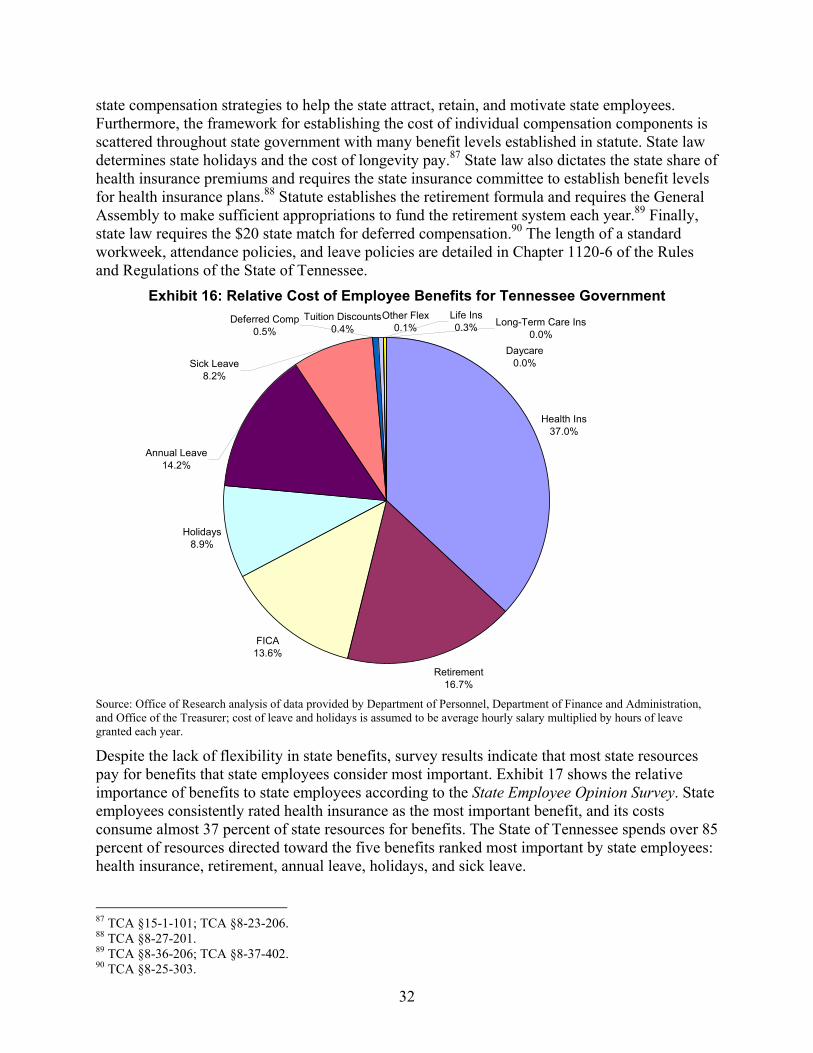
32
state compensation strategies to help the state attract, retain, and motivate state employees. Furthermore, the framework for establishing the cost of individual compensation components is scattered throughout state government with many benefit levels established in statute. State law determines state holidays and the cost of longevity pay.87 State law also dictates the state share of health insurance premiums and requires the state insurance committee to establish benefit levels for health insurance plans.88 Statute establishes the retirement formula and requires the General Assembly to make sufficient appropriations to fund the retirement system each year.89 Finally, state law requires the $20 state match for deferred compensation.90 The length of a standard workweek, attendance policies, and leave policies are detailed in Chapter 1120-6 of the Rules and Regulations of the State of Tennessee.
Exhibit 16: Relative Cost of Employee Benefits for Tennessee Government
Health Ins37.0%
Holidays8.9%
FICA13.6%
Other Flex0.1%
Retirement16.7%
Daycare0.0%
Annual Leave14.2%
Life Ins0.3%
Deferred Comp0.5%
Long-Term Care Ins0.0%
Tuition Discounts0.4%
Sick Leave8.2%
Source: Office of Research analysis of data provided by Department of Personnel, Department of Finance and Administration, and Office of the Treasurer; cost of leave and holidays is assumed to be average hourly salary multiplied by hours of leave granted each year.
Despite the lack of flexibility in state benefits, survey results indicate that most state resources pay for benefits that state employees consider most important. Exhibit 17 shows the relative importance of benefits to state employees according to the State Employee Opinion Survey. State employees consistently rated health insurance as the most important benefit, and its costs consume almost 37 percent of state resources for benefits. The State of Tennessee spends over 85 percent of resources directed toward the five benefits ranked most important by state employees: health insurance, retirement, annual leave, holidays, and sick leave.
87 TCA §15-1-101; TCA §8-23-206. 88 TCA §8-27-201. 89 TCA §8-36-206; TCA §8-37-402. 90 TCA §8-25-303.
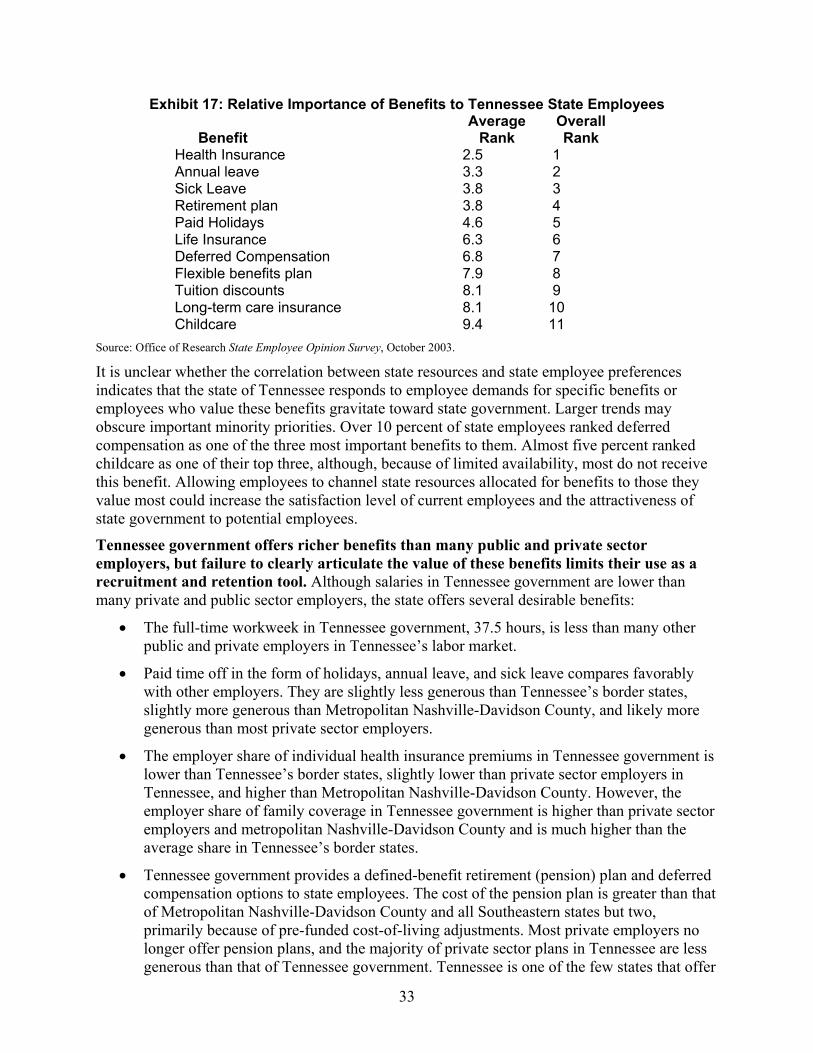
33
Exhibit 17: Relative Importance of Benefits to Tennessee State Employees
Benefit Average
Rank Overall Rank
Health Insurance 2.5 1 Annual leave 3.3 2 Sick Leave 3.8 3 Retirement plan 3.8 4 Paid Holidays 4.6 5 Life Insurance 6.3 6 Deferred Compensation 6.8 7 Flexible benefits plan 7.9 8 Tuition discounts 8.1 9 Long-term care insurance 8.1 10 Childcare 9.4 11
Source: Office of Research State Employee Opinion Survey, October 2003.
It is unclear whether the correlation between state resources and state employee preferences indicates that the state of Tennessee responds to employee demands for specific benefits or employees who value these benefits gravitate toward state government. Larger trends may obscure important minority priorities. Over 10 percent of state employees ranked deferred compensation as one of the three most important benefits to them. Almost five percent ranked childcare as one of their top three, although, because of limited availability, most do not receive this benefit. Allowing employees to channel state resources allocated for benefits to those they value most could increase the satisfaction level of current employees and the attractiveness of state government to potential employees.
Tennessee government offers richer benefits than many public and private sector employers, but failure to clearly articulate the value of these benefits limits their use as a recruitment and retention tool. Although salaries in Tennessee government are lower than many private and public sector employers, the state offers several desirable benefits:
• The full-time workweek in Tennessee government, 37.5 hours, is less than many other public and private employers in Tennessee’s labor market.
• Paid time off in the form of holidays, annual leave, and sick leave compares favorably with other employers. They are slightly less generous than Tennessee’s border states, slightly more generous than Metropolitan Nashville-Davidson County, and likely more generous than most private sector employers.
• The employer share of individual health insurance premiums in Tennessee government is lower than Tennessee’s border states, slightly lower than private sector employers in Tennessee, and higher than Metropolitan Nashville-Davidson County. However, the employer share of family coverage in Tennessee government is higher than private sector employers and metropolitan Nashville-Davidson County and is much higher than the average share in Tennessee’s border states.
• Tennessee government provides a defined-benefit retirement (pension) plan and deferred compensation options to state employees. The cost of the pension plan is greater than that of Metropolitan Nashville-Davidson County and all Southeastern states but two, primarily because of pre-funded cost-of-living adjustments. Most private employers no longer offer pension plans, and the majority of private sector plans in Tennessee are less generous than that of Tennessee government. Tennessee is one of the few states that offer
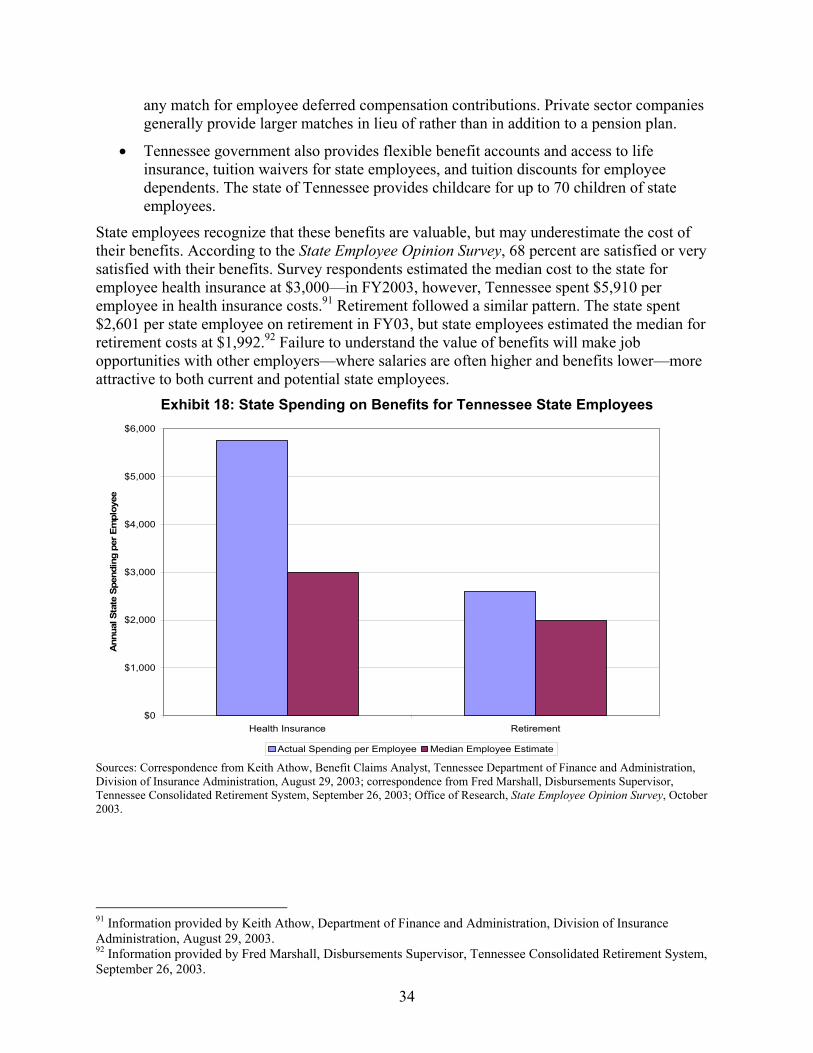
34
any match for employee deferred compensation contributions. Private sector companies generally provide larger matches in lieu of rather than in addition to a pension plan.
• Tennessee government also provides flexible benefit accounts and access to life insurance, tuition waivers for state employees, and tuition discounts for employee dependents. The state of Tennessee provides childcare for up to 70 children of state employees.
State employees recognize that these benefits are valuable, but may underestimate the cost of their benefits. According to the State Employee Opinion Survey, 68 percent are satisfied or very satisfied with their benefits. Survey respondents estimated the median cost to the state for employee health insurance at $3,000—in FY2003, however, Tennessee spent $5,910 per employee in health insurance costs.91 Retirement followed a similar pattern. The state spent $2,601 per state employee on retirement in FY03, but state employees estimated the median for retirement costs at $1,992.92 Failure to understand the value of benefits will make job opportunities with other employers—where salaries are often higher and benefits lower—more attractive to both current and potential state employees.
Exhibit 18: State Spending on Benefits for Tennessee State Employees
$0
$1,000
$2,000
$3,000
$4,000
$5,000
$6,000
Health Insurance Retirement
Ann
ual S
tate
Spe
ndin
g pe
r Em
ploy
ee
Actual Spending per Employee Median Employee Estimate Sources: Correspondence from Keith Athow, Benefit Claims Analyst, Tennessee Department of Finance and Administration, Division of Insurance Administration, August 29, 2003; correspondence from Fred Marshall, Disbursements Supervisor, Tennessee Consolidated Retirement System, September 26, 2003; Office of Research, State Employee Opinion Survey, October 2003.
91 Information provided by Keith Athow, Department of Finance and Administration, Division of Insurance Administration, August 29, 2003. 92 Information provided by Fred Marshall, Disbursements Supervisor, Tennessee Consolidated Retirement System, September 26, 2003.
35
Tennessee’s civil service laws likely impede the hiring and promotion of some high-quality applicants and employees. Though compensation is a key component of efforts to attract, retain, and motivate quality employees, other aspects of state employment also play a large role. One of the most prominent aspects of state employment is Tennessee’s civil service selection system. Of Tennessee government’s 44,000 state employees, over 37,000 are within career service, traditionally known as civil service. The executive service includes high-level positions in the executive branch and all positions outside the executive branch. The career service includes all other state employees.93 State law requires the Department of Personnel to maintain employment lists and promotion lists based on scores from competitive examinations for job openings within career service. These examinations may include tests that are often based on education and experience. A promotion list includes candidates with the three highest scores, and an employment list (for new hires) includes candidates with the five highest scores.94 Agencies must hire from these lists for career service positions.95 In contrast, agencies may establish their own processes for hiring executive service employees. Once hired, these employees serve “at the pleasure of the appointing authority” and may be terminated at any time.
Critics of civil service have argued that employment and promotion lists limit access to some quality applicants. They contend that those at the top of registers and who thus appear on the lists are sometimes of lower quality than those below them on the register. This can happen many ways. Department of Personnel officials indicate that examinations do not cover some vital aspects of particular jobs. Potential employees who have completed more rigorous education programs or have higher grade point averages do not generally receive additional credit for those accomplishments. Some personal traits like communication skills and adaptability are nearly impossible to quantify and thus are not generally included in civil service exams. Several states have moved to zone scoring to allow managers to choose from a larger applicant pool, and some have abandoned employment lists altogether. These strategies can increase the likelihood that state managers will have the legal authority to hire the most qualified candidates.
Civil service hiring practices appear to contribute significant challenges to potential employees. In the State Employee Opinion Survey, managers throughout state government expressed concern about a limited applicant pool. However, managers in the executive service were twice as likely (22 percent) as managers in the career service (11 percent) to agree that they had “enough quality applicants from which to hire new employees.” This may indicate that civil service requirements limit access to quality applicants. Multiple interviewees suggested that civil service registers limit access to quality applicants for some job classes. In some job classes, low-quality candidates can “clog” registers for years. One interviewee noted a perennial job applicant who has been known to fall asleep in interviews. However, the applicant has a long work history that garners a high score and frequently places him/her on agency employment lists.
Civil service practices do not appear to be a significant constraint on promotions. Managers in the career service were actually slightly less likely than managers in the executive service to agree with the statement “I have difficulty promoting good employees” in the State Employee Opinion Survey. Interviewees also generally agreed that the “rule of three” governing promotions is less cumbersome than the “rule of five” governing new hires.
93 TCA §8-30-208. 94 TCA §8-30-309(a)(2). 95 TCA §8-30-309(a)(1).
36
Many state managers fail to provide sufficient feedback and direction to employees through regular communication and evaluations. Few things are more critical to the success of state government than communication between management and staff. Managers inform workers what their duties are and how those duties support the goals of the broader organization. Effective performance evaluations show employees how well they are performing those duties and what steps they can take to improve their performance. Unfortunately, many public and private managers view evaluations as a chore that provides no real benefit.96 The State of Washington launched a complete overhaul of its evaluation system in 1998 after 93 percent of state employees disapproved of the old performance evaluation program.97
Tennessee appears to have a typical, largely unsuccessful approach to employee evaluations. Multiple interviewees noted that many state managers fail to communicate effectively with their subordinates. One interviewee stated that managers frequently use the “psychic management” approach, where they expect employees to know what they want even without communicating those expectations to the employee. State regulations require “periodic reviews of job performance” including “a formal written assessment of the employee’s performance” for all career service employees.98 However, interviewees noted that employee evaluations are generally infrequent and often contain little useful information on employee performance. Finally, interviewees commented that many managers consistently give employees positive evaluations to “keep the peace,” even if employees are performing poorly. In such cases, if a manager eventually decides that an employee should be terminated based on poor performance, those positive evaluations provide evidence against termination in appeals.
96 Jonathan Walters, “I Have to Talk to You about Your Job…,” Governing, March 2001. 97 “State of Washington: Meaningful Performance Appraisal,” Human Resource Management: Innovation in Selected Jurisdictions, The Center for the Study of Social Policy, June 2002, p.62. 98 Rules of the Tennessee Department of Personnel, 1120-5-.05.
37
Recommendations Legislative The General Assembly may wish to mandate a new comprehensive pay plan and adjust state employee salaries to reflect it. Tennessee has not made major revisions in its personnel system since the completion of a 1984 study. The Department of Personnel spent over two years developing a pay plan based on that study. Though the Department subsequently has used internal data and analyses from private consultants to guide changes to the plan, salaries for many positions are no longer appropriate. Salaries for many positions in state government are well below those of comparable positions with both private and other public sector employers.
Effective salary plans are based on the value of employee labor and salaries paid for comparable work by other employers. Salaries within a pay plan should evolve with changes in the value of employee labor and salaries outside state government. Including factors such as automatic step increases in a pay system can distort these factors.
The General Assembly may wish to amend some sections of TCA §8-30-214 to allow state agencies to implement pay for performance pilot programs. TCA §8-30-214 establishes parameters for merit pay programs in Tennessee. Existing law requires that all state employees are eligible for merit pay if funds are allocated for that purpose. Amending TCA §8-30-214 would allow state agencies to determine how performance measures could be established for various types of jobs.
As the first group of departments implement performance based budgeting standards in FY 2005, all departmental employers need to evaluate how each employee fits into their organizational structure. Department officials should evaluate pay scales to discern whether or not they accurately reflect the positions and amount of work required.
Pay for performance programs could work for any positions where performance can be measured objectively. For example, a system for accountants could reward indicators such as speed in completing assignments, quality of work, supervisory skills, or identifying fraud and waste.
If the pilots were successful, policymakers might wish to expand to all state agencies. Department of Personnel officials believe such a program cannot work in the public sector unless all employees are eligible to compete for bonuses. However, rewards should not become entitlements.
The General Assembly may wish to amend some sections of TCA, Title 8, Chapter 30, to give state managers greater flexibility in personnel matters. A number of states have pursued civil service reform in recent years, and many interviewees cited the civil service system in Tennessee as an impediment to effective human resource management. The aspect of civil service most often cited as cumbersome and inefficient was the requirement that agencies hire only from among the top five candidates on employment registers required by TCA §8-30-309. Interviewees also frequently cited the elaborate process to terminate employees contained in TCA §8-30-326 through TCA §8-30-331 and, to a lesser extent, the requirement that agencies promote only from among the top three candidates on employment registers in TCA §8-30-309.
Increased managerial discretion could also increase opportunities for corruption and favoritism. However, states that have implemented civil service reform have not experienced noticeable increases in improper practices. Performance accountability, audits, and maintenance of some
38
process requirements can significantly reduce the likelihood of corruption when revising civil service requirements.
The General Assembly may wish to consider allowing bonuses for meeting certain performance goals at increments during an employee’s first five years. Such a plan might help retain employees during the time when they are most likely to leave state government.
Administrative The State Treasurer’s Office should determine the feasibility of expanding the flexible benefits plan to allow state employees more choices. Tennessee currently offers employees access to three health insurance plans, an array of paid time off, a pension for those who work at least five years, and other benefits. State employees may also open “dependent daycare reimbursement accounts” or “medical expense reimbursement accounts” to cover those expenses with pre-tax dollars. However, state employees have limited flexibility to choose how to receive their compensation. For example, they cannot opt out of the state group insurance plans without losing access to funds allocated for the state’s 80 percent share of insurance premiums. Employees without families have no access to the larger amount (in dollar terms) of the state share of family coverage. Employees receive no retirement benefit if they leave state government before five years of service, and employees who qualify must retire before they receive the benefit. Employees who do not participate in deferred compensation do not receive the $20 state match.
Unless all state employees would choose to allocate resources for their compensation exactly as the state does, employees might benefit by having more choices. For example, state officials might want to consider allowing a hybrid retirement option, in addition to the defined benefit plan, that could allow some portability. In addition, officials might consider allowing vesting at fewer years of service. Also, since many employees indicate that they value their 401K contribution, perhaps it could be enhanced or allow employees to choose to give up some other benefit for a greater contribution to the 401K. Allowing greater flexibility might encourage newer employees to stay longer.
State government could also consider maintaining a more limited health insurance plan in addition to current insurance offerings. For both retirement and health insurance, employees could choose not to take the benefits and receive funding that would have gone toward them as higher salary. Tennessee could even allow employees to choose various amounts of annual leave and receive varied salary amounts accordingly. Creating options like these might allow state employees to choose compensation forms that are most valuable to them rather than being forced to receive compensation in a predetermined package. However, implementing a true cafeteria plan would require a significant increase in technology infrastructure to administer. In addition, any cost increases to the state and other participants would need to be weighed.
The Department of Personnel, working with the State Treasurer’s Office should consider requiring training for all new employees about various retirement investment strategies and issues they need to consider. Many state employees would benefit from the availability of choices, but with choices comes responsibility. Employees may not otherwise take the time necessary to evaluate the consequences and benefits of their actions.
The Department of Personnel should review the present evaluation system, particularly training provided to managers. Communication from managers to employees, both informal and through employee evaluations, is critical to establish expectations for employees, determine
39
and convey whether or not those expectations have been met, and shape strategies to improve employee performance. Unfortunately, several interviewees contended that most managers in Tennessee government do not effectively communicate expectations to employees or give them adequate feedback, possibly because of the lack of effective rewards and sanctions. Several noted that, in response to budget pressures in recent years, agencies have cut funding for management training. Restoring funding to train managers and mandating some types of training could improve management communication and thereby improve employee performance.
The Department of Personnel, in consultation with other relevant departments, may wish to consider ways to better market state government employment, including the value of various benefits. A more effective marketing strategy geared toward accentuating state government’s compensation strengths would better educate the labor market and may help recruit and retain highly talented and motivated employees.
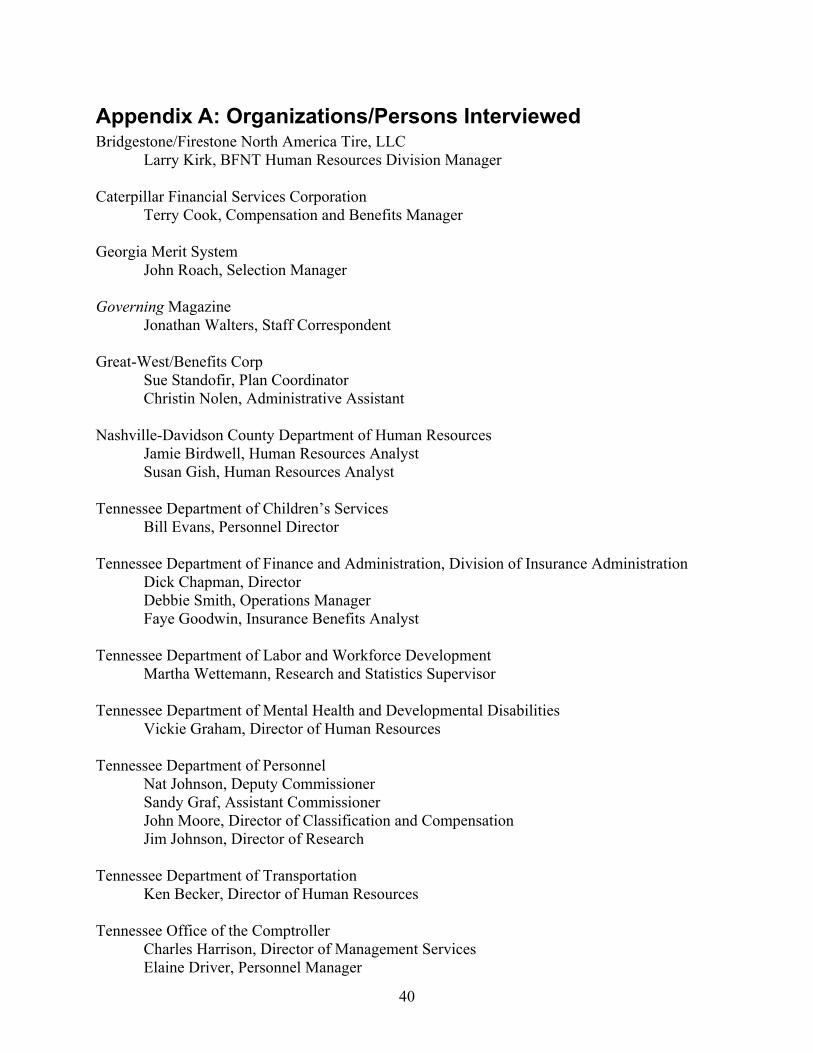
40
Appendix A: Organizations/Persons Interviewed Bridgestone/Firestone North America Tire, LLC Larry Kirk, BFNT Human Resources Division Manager Caterpillar Financial Services Corporation Terry Cook, Compensation and Benefits Manager Georgia Merit System John Roach, Selection Manager Governing Magazine Jonathan Walters, Staff Correspondent Great-West/Benefits Corp Sue Standofir, Plan Coordinator Christin Nolen, Administrative Assistant Nashville-Davidson County Department of Human Resources Jamie Birdwell, Human Resources Analyst Susan Gish, Human Resources Analyst Tennessee Department of Children’s Services Bill Evans, Personnel Director Tennessee Department of Finance and Administration, Division of Insurance Administration Dick Chapman, Director Debbie Smith, Operations Manager Faye Goodwin, Insurance Benefits Analyst Tennessee Department of Labor and Workforce Development Martha Wettemann, Research and Statistics Supervisor Tennessee Department of Mental Health and Developmental Disabilities Vickie Graham, Director of Human Resources Tennessee Department of Personnel Nat Johnson, Deputy Commissioner Sandy Graf, Assistant Commissioner John Moore, Director of Classification and Compensation Jim Johnson, Director of Research Tennessee Department of Transportation Ken Becker, Director of Human Resources Tennessee Office of the Comptroller Charles Harrison, Director of Management Services Elaine Driver, Personnel Manager
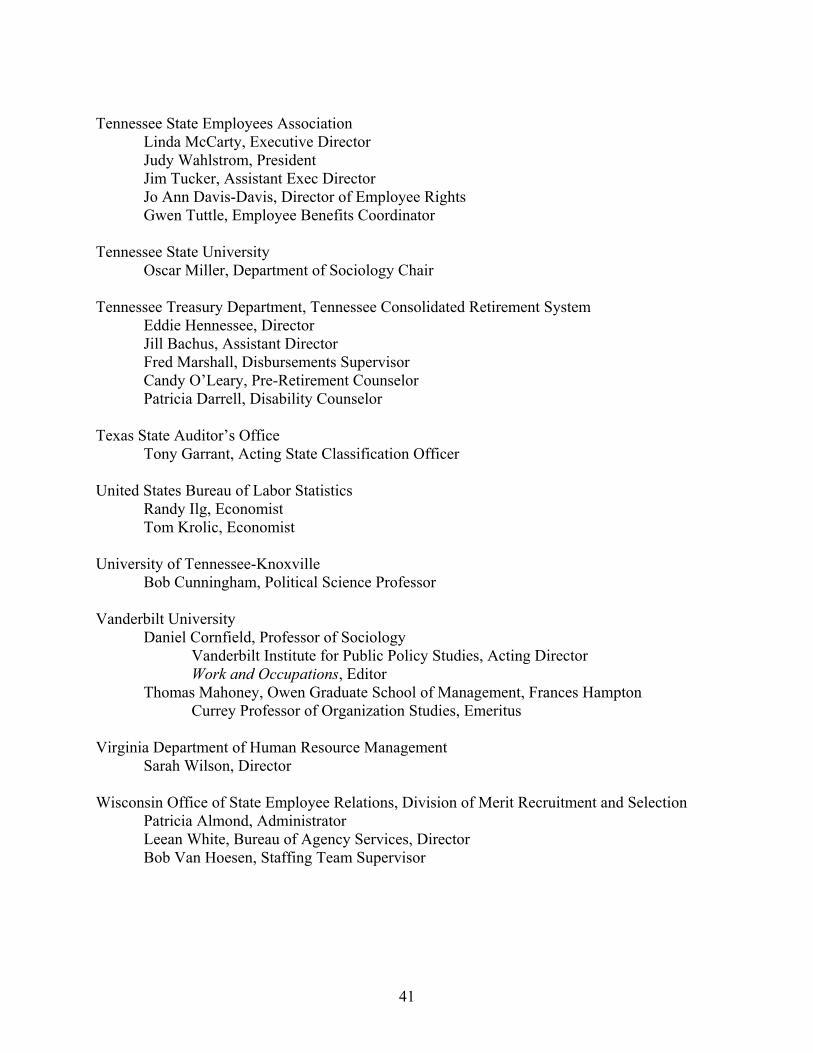
41
Tennessee State Employees Association Linda McCarty, Executive Director Judy Wahlstrom, President
Jim Tucker, Assistant Exec Director Jo Ann Davis-Davis, Director of Employee Rights Gwen Tuttle, Employee Benefits Coordinator
Tennessee State University Oscar Miller, Department of Sociology Chair Tennessee Treasury Department, Tennessee Consolidated Retirement System Eddie Hennessee, Director Jill Bachus, Assistant Director Fred Marshall, Disbursements Supervisor Candy O’Leary, Pre-Retirement Counselor Patricia Darrell, Disability Counselor Texas State Auditor’s Office Tony Garrant, Acting State Classification Officer United States Bureau of Labor Statistics Randy Ilg, Economist Tom Krolic, Economist University of Tennessee-Knoxville Bob Cunningham, Political Science Professor Vanderbilt University Daniel Cornfield, Professor of Sociology
Vanderbilt Institute for Public Policy Studies, Acting Director Work and Occupations, Editor
Thomas Mahoney, Owen Graduate School of Management, Frances Hampton Currey Professor of Organization Studies, Emeritus
Virginia Department of Human Resource Management Sarah Wilson, Director Wisconsin Office of State Employee Relations, Division of Merit Recruitment and Selection Patricia Almond, Administrator Leean White, Bureau of Agency Services, Director Bob Van Hoesen, Staffing Team Supervisor
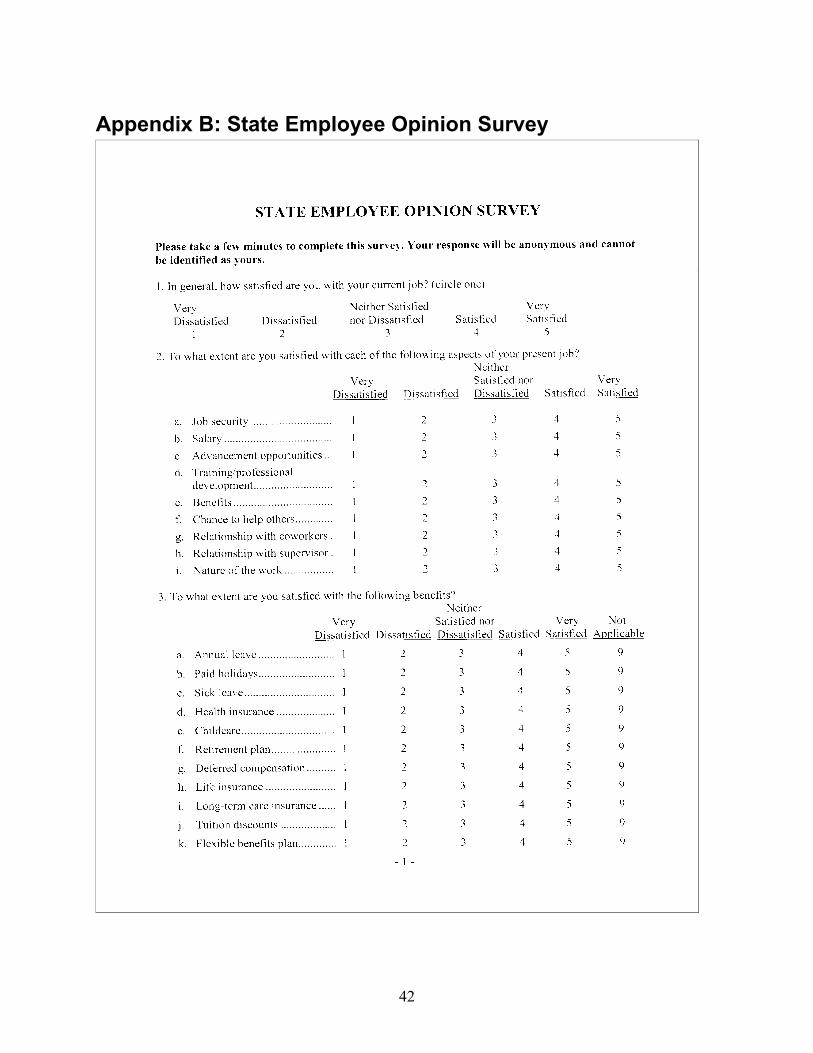
42
Appendix B: State Employee Opinion Survey
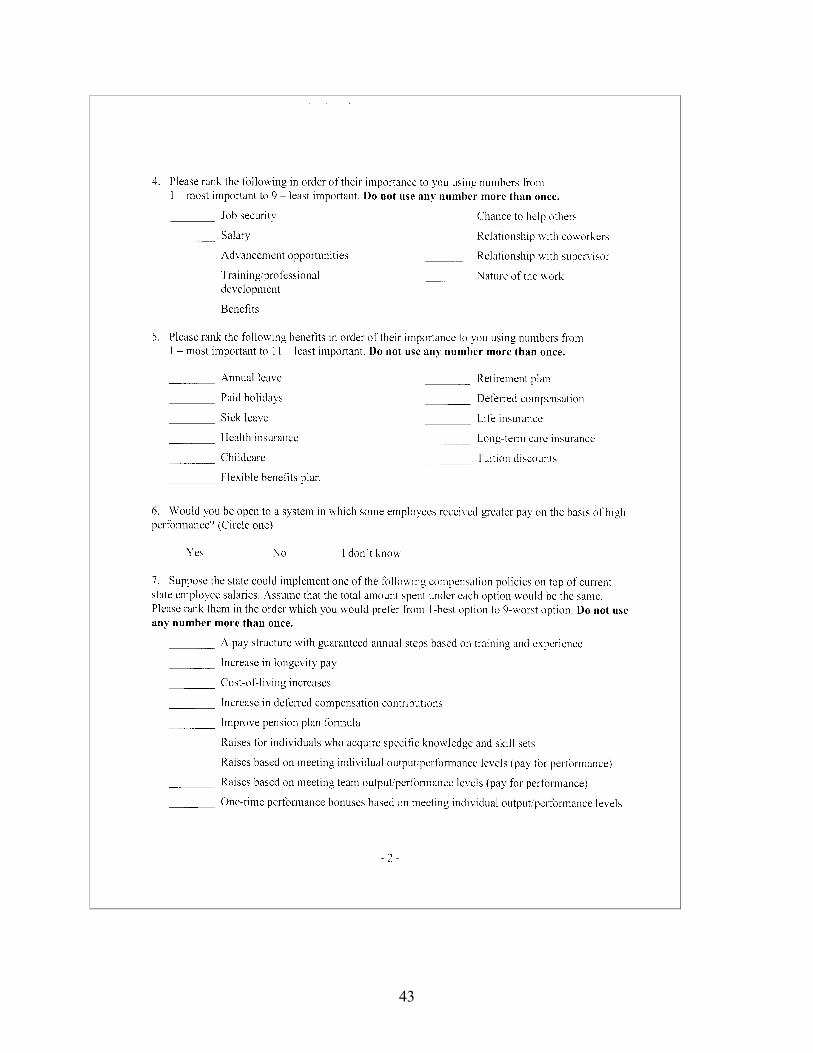
43
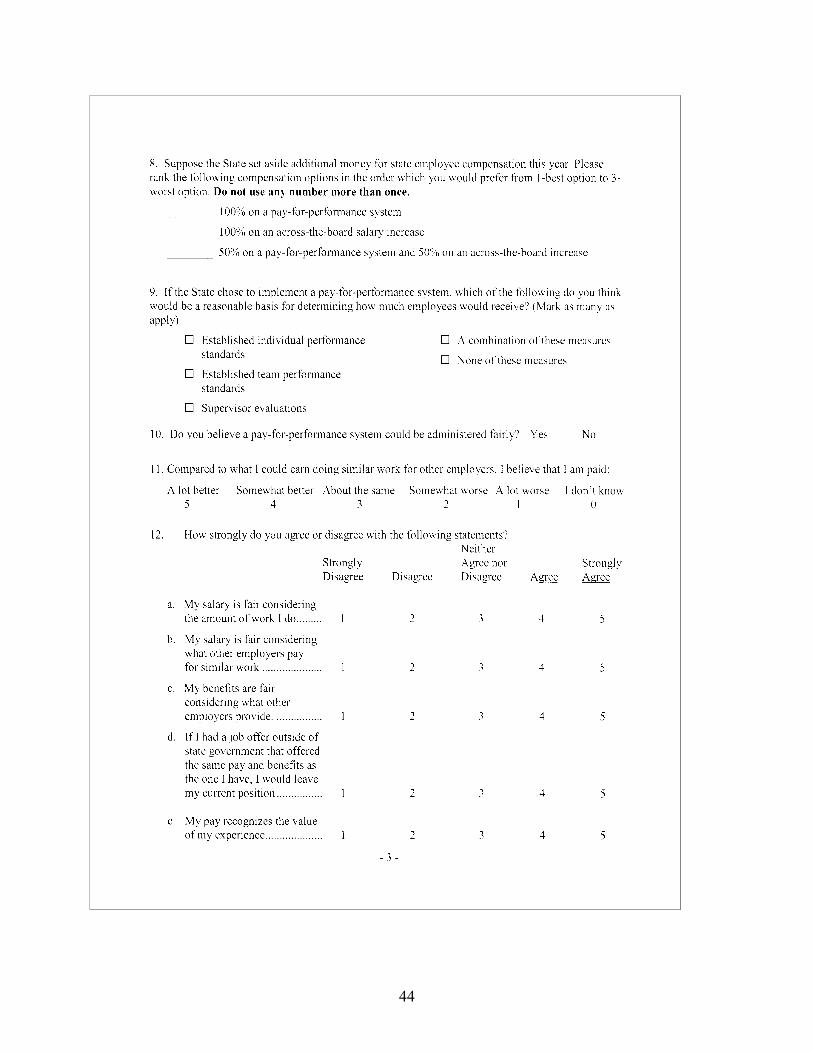
44
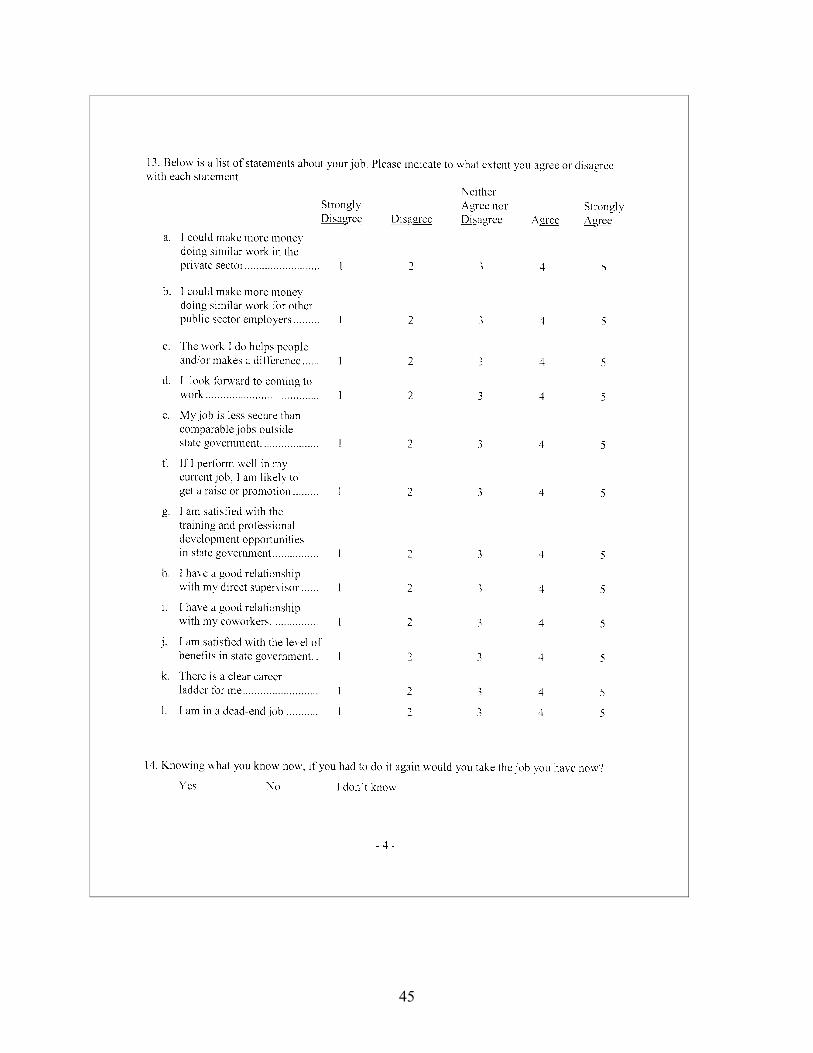
45
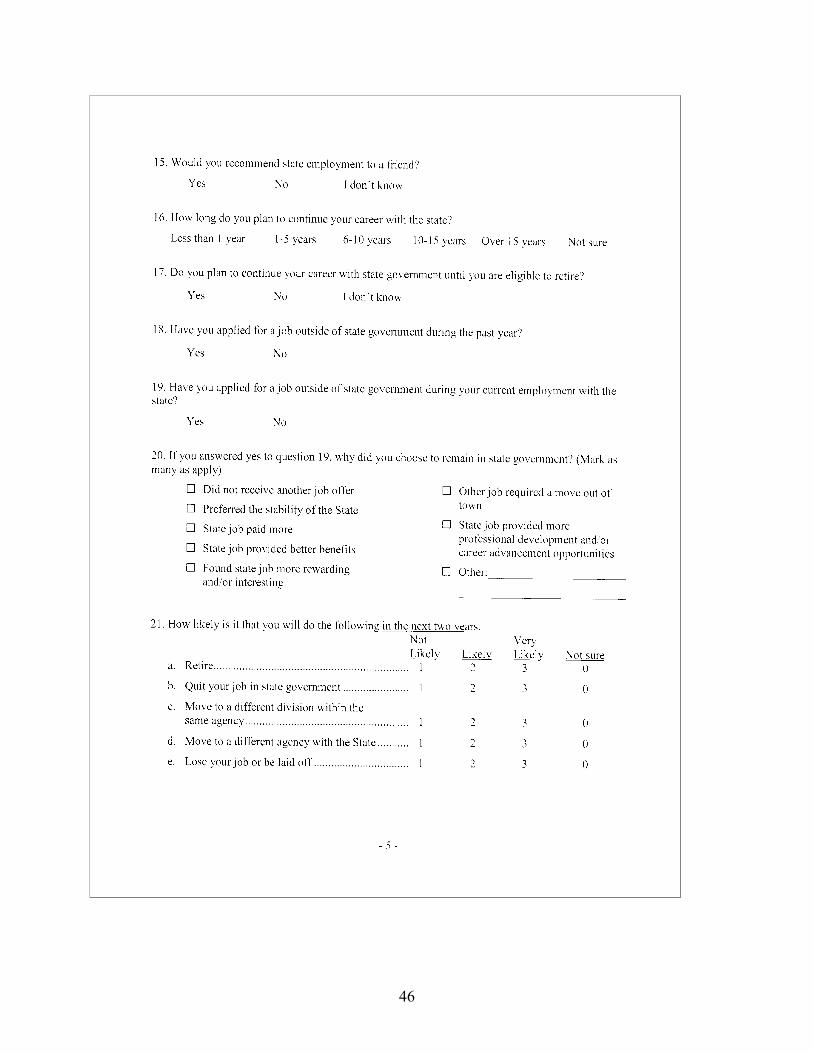
46
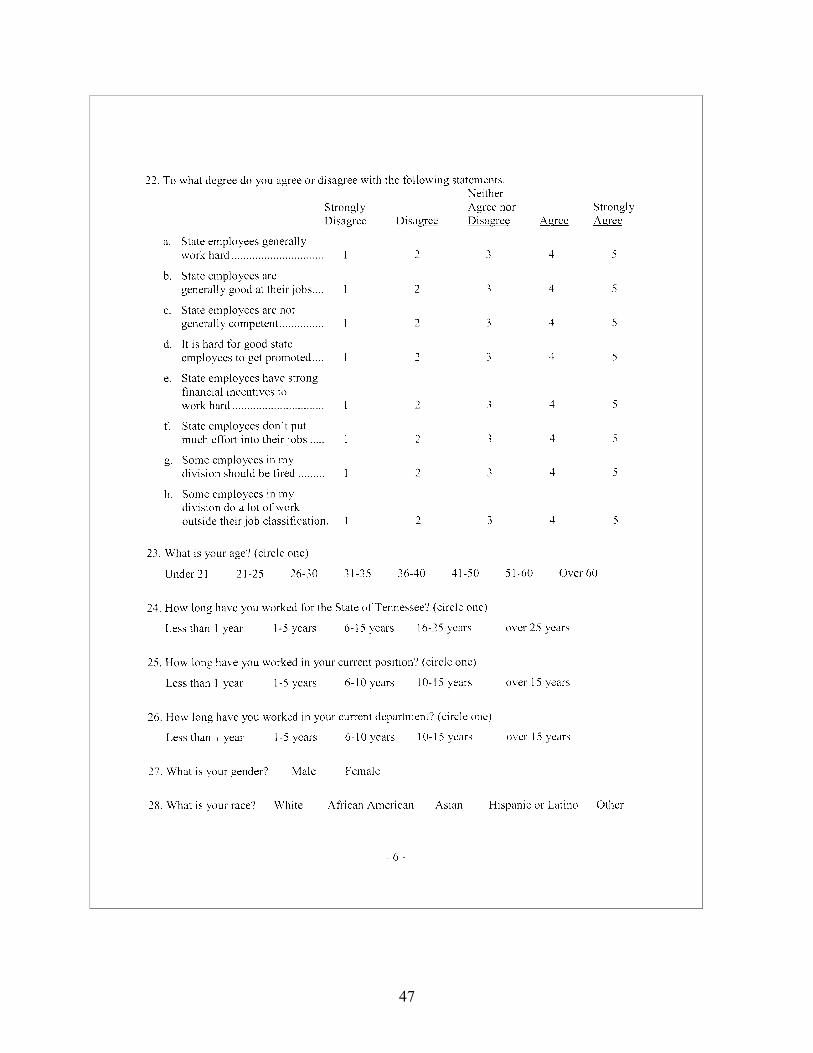
47
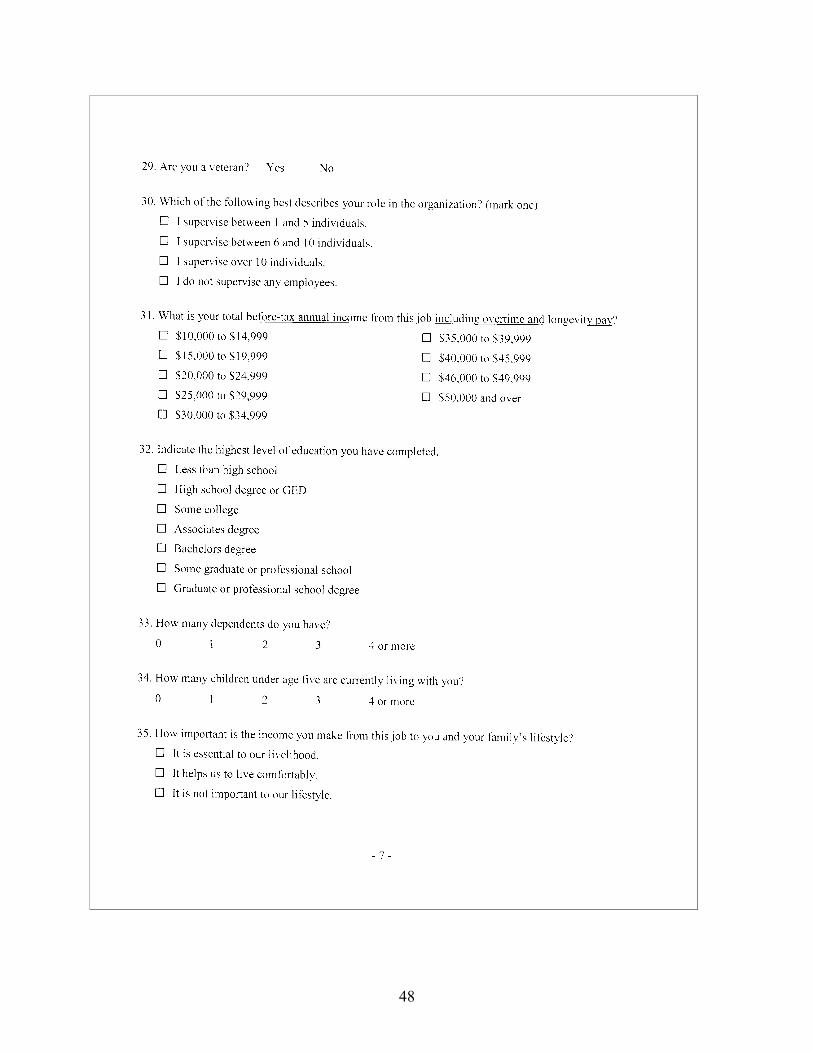
48
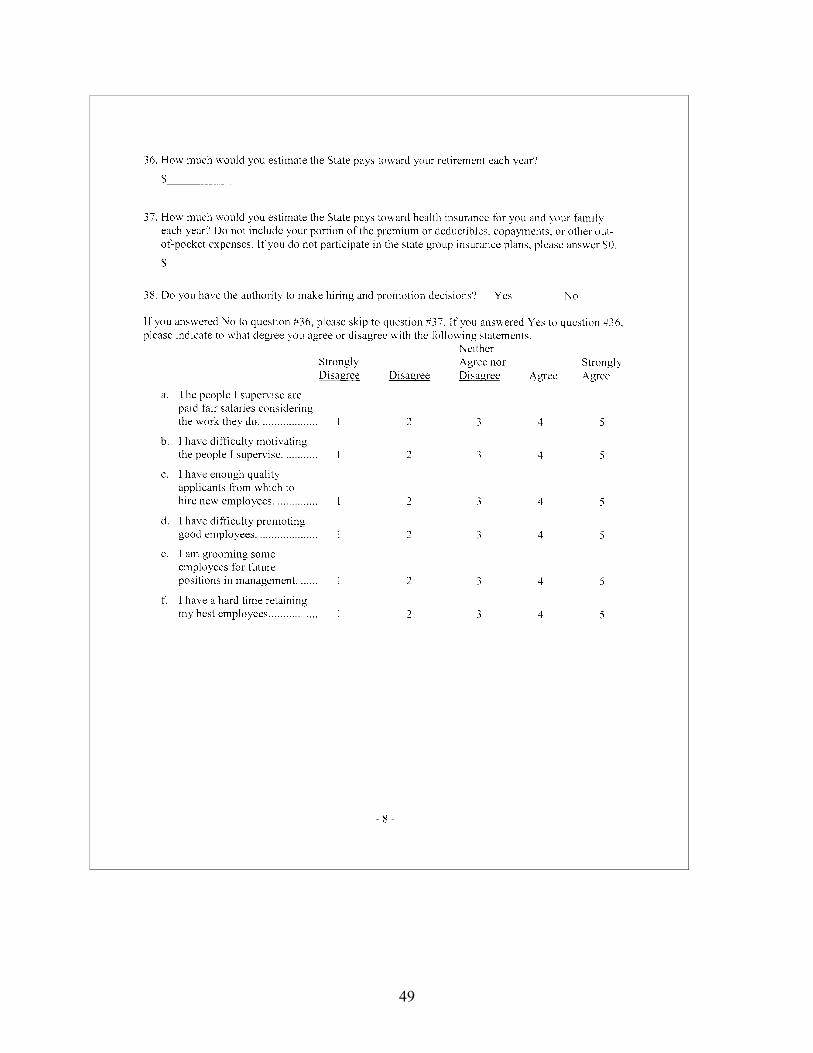
49
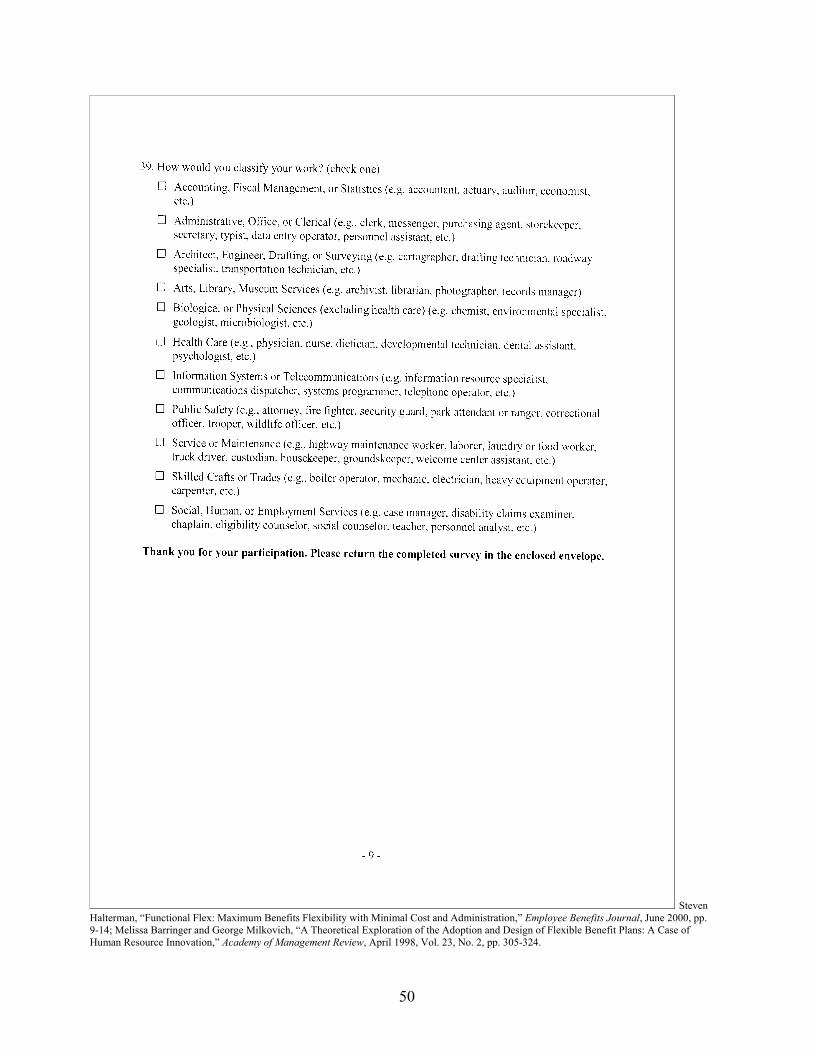
50
Steven Halterman, “Functional Flex: Maximum Benefits Flexibility with Minimal Cost and Administration,” Employee Benefits Journal, June 2000, pp. 9-14; Melissa Barringer and George Milkovich, “A Theoretical Exploration of the Adoption and Design of Flexible Benefit Plans: A Case of Human Resource Innovation,” Academy of Management Review, April 1998, Vol. 23, No. 2, pp. 305-324.
51
Appendix C: Public Chapter 208, 2003
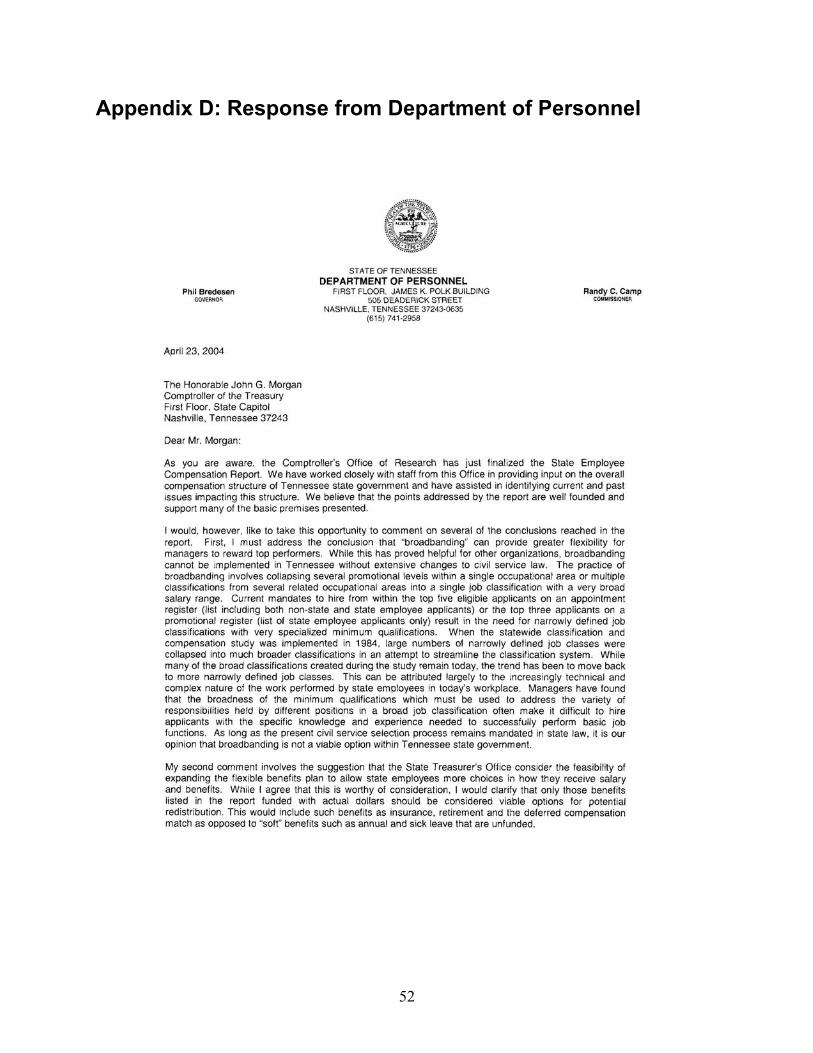
52
Appendix D: Response from Department of Personnel
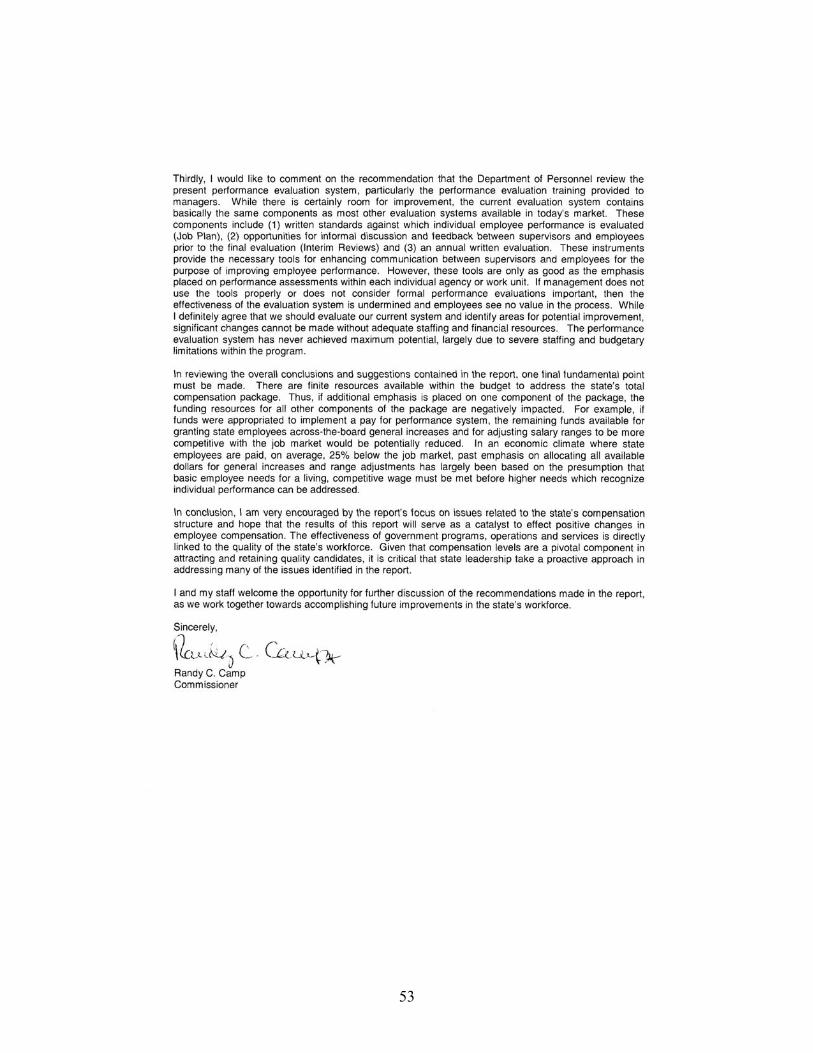
53
Offices of Research and Education Accountability Staff
Director ◆ Ethel Detch
Assistant Director (Research)
◆ Douglas Wright
Assistant Director (Education Accountability)
Jason Walton
Principal Legislative Research Analysts Phillip Doss ◆ Kim Potts
Senior Legislative Research Analysts Denise Denton
◆ Richard Gurley Margaret Rose
Melissa J. Smith Greg Spradley Emily Wilson
Associate Legislative Research Analysts Bonnie Adamson
Brian Doss ◆ Kevin Krushenski
Russell Moore Bintou Njie
◆ Alisa Palmisano Sonya Phillips
Executive Secretary ◆ Sherrill Murrell
◆ indicates staff who assisted with this project