Embed Size (px)
Citation preview

P R O V I D E R S ' I N C E N T I V E S
Paying For Quality: Providers'Incentives For QualityImprovementAn assessment of recent efforts to align providers' incentives with thequality improvement agenda.
by Meredith B. Rosenthal, Rushika Fernandopulie, HyunSook Ryu Song,and Bruce Landon
ABSTRACT: Paying health care providers to meet quality goals is an idea with widespreadappeai, given the common perception that quality of care in the United States remains un-acceptably iow despite a decade of benchmarking and public reporting. There has been lit-tle critical analysis of the design of the current generation of quality incentive programs. Inthis paper we examine public reports of paying for quality over the past five years and as-sess each of the identified programs in terms of key design features, including the marketshare of payers, the structure of the reward system, the amount of revenue at stake, andthe targeted domains of health care quality.
DELIVERING HIGH-QUALITY CARE in the Current U.S. health Care systemdoes not always pay.' In the case of many aspects of clinical quality, thewidespread use of fee-for-service payment fails to promote or even dis-
courages optimal treatment. For example, an effective chronic care managementprogram may lead to lower revenues for providers, since quality improvement ac-tivities are not billable and acute care visits are reduced as a result. Increasingly,however, individual purchasers and coalitions as well as health plans have imple-mented pay-for-performance systems to reward providers for delivering high-quality care and to motivate quality improvement.
To understand the importance of these incipient "pay-for-performance" efforts,we describe the prevalence and structure of these initiatives as they are now beingadopted in the U.S. health care system. We focus on specific design elements iden-tified using key lessons from the literature on the impact of financial incentives onbehavior and quality improvement.^ These include the market leverage of spon-
Mcrcdith Rosenthal ([email protected]) is an assistant professor in thc Department of Health Policyand Management, Harvard School of Puhlic Health, in Boston, Massachusetts. Rushika Fernandopulle is executivedirector of the Harvard Interfaculty Program for Health Systems Improvement in Cambridge, Massachusetts.HyunSook Ryu Song is the assistant director of that program. Bruce Landon is an assistant professor in theDepartment of Health Care Policy, Harvard Medical School, in Boston.
HEALTH AFFAIRS - Volume 23, Number 2 127
DOI 10.1377/hkhaff.23.2.127 ©2004 Pmjea HOPE-The Pcople-to-Peopk Health Foundation, inc.

P U R S U I T O F Q U A L I T Y
sors, the magnitude of rewards, the use of competitive versus noncompetitivemodels of incentives, the targeted dimensions of health care quality, and whetherquality improvement (change) is explicitly part of the bonus calculation. Exam-ining current initiatives according to these design principles yields predictionsabout the likely short- and long-run effects of these payment systems. The discus-sion highlights broad themes among the programs we describe and suggests direc-tions for the next generation of pay-for-performance systems and key questionsfor health services research.
Why Pay For Performance?One of the principal messages of the Institute of Medicine's (IOM's) 2001 Re-
port, Crossing thc Quality Chasm, is that U.S. health care quality falls short of estab-lished benchmarks based on the best available evidence.̂ A recent study docu-ments this shortfall across a broad range of measures for appropriate preventive,acute, and chronic care.'' Benchmarking of this type has repeatedly shown notonly that performance is low relative to accepted standards on average, but alsothat adherence to recommended treatment patterns is extremely variable acrossregions and providers. This variation suggests that improvement is possible.
To date, purchasers and health plans have focused their efforts on profiling pro-viders and publicly reporting information on their quality. This appeals to profes-sionahsm or organizational pride to drive quality improvement and also to the de-mand mechanism—in theory, consumers will "vote with their feet" and select thehighest-quahty providers. Despite major advances in quality measurement and re-porting, studies of consumers' choices of health plans and hospitals continue tofind that consumers fail to use available information on quality to inform theirchoices, even when quality measures appear to be highly salient.^ More recently,purchasers have also begun tying consumers' financial incentives to measures ofquality—for example, by varying health plan contributions or copayments ac-cording to quality ratings.
While these consumer-centered approaches continue to evolve, it is widely per-ceived that consumer choice alone will not provide sufficient impetus for provid-ers to improve the quality of care. This is particularly the case in markets wherethe perceived high-quahty providers are already inundated with patients.
Data Sources And Study ApproachWe sought descriptive information on paying for health care quahty in the
United States in the past five years. Because of current policy interest in making abusiness case for quality to providers of health care, we focused on payments byhealth plans or purchasers (largely employers) to physicians and hospitals. Thisapproach puts performance contracting between purchasers and health plans andmedical group payments to individual physicians beyond the scope of our review.While we began with the scientific literature (using the MEDLINE online data-
128 M a r c h / A p r i l 2004

P R O V I D E R S ' I N C E N T I V E S
1
base of peer-reviewed articles), only one recent paper has examined a detailed ex-ample of this type of payment arrangement.^ In fact, only five other evaluations ap-pear in the health services research literature on paying for quahty during the pastfifteen years, and these generally describe very small-scale interventions, such asnominal payments to increase immunization rates, which are unlikely to begeneralizable to the broader efforts now envisioned.^ The one exception is U.S.Healthcare's (now Aetna's) more comprehensive Quahty Care Compensation Sys-tem, which was introduced in 1987 and has been described elsewhere.^
We obtained information on the extent and characteristics of plans' and em-ployers' efforts to pay for quahty from several sources. Eirst, we used Lexis/Nexisto search all major U.S. newspapers from January 1998 to September 2003, usingcombinations of the following keywords: physician, hospital, health plans, pay forperformance, pay for quality improvement, financial incentive, bonus, reward,quahty initiative, provider payment, and performance improvement. Once weidentified potential cases to include in our review, we conducted further researchon each one through either Internet searches or phone calls. We supplementedthese data with a general Internet search using the Google search engine. Einally,we compared our information to previously released reports compiled by the Na-tional Health Care Purchasing Institute (NHCPI) and the American Medical As-sociation (AMA).̂ Using this approach, we identified thirty-seven separate incen-tive plans representing thirty-one different payers (some payers had both ahospital and a physician quality incentive, which we counted separately). We ex-cluded a small number of pubhcized interventions that were still in the formativestages and thus difficult to characterize (two notable examples are the nascent ef-forts associated with the Massachusetts HealthCare Quahty Partnership's Re-warding Results grant and the Central Elorida Health Care Coahtion's plans totier fees based on quality).
To draw conclusions about the nature and likely impact of the interventions,we focused on five main features. The first two, sponsor leverage and incrementalrevenue, address the idea that the larger the magnitude of the reward, the more re-sponsive providers will be to incentives. We measured sponsor leverage as itsshare of the insured population in the state in which the program operates unlessthe plan or program was exphcitly limited to a subset of counties or markets. Insuch cases, we used the insured population of the smaller area as the denominatorfor the share calculation. Eor health plans, we used 2001 InterStudy data as thesource of enrollment data; for other types of sponsors, we rehed on self-reports.'°Ideally, we would have captured the share of the average targeted provider's busi-ness that is represented by the payer in question. Our market-share measure al-most certainly understates payers' leverage, because it assumes that covered livesare spread out evenly across providers in a state, whereas many networks (espe-cially health maintenance organizations, or HMOs) are more concentrated.
A third feature was targeted dimensions of quality, using the classic "structure.
10
HEALTH AFFAIRS - Volume 23, Number 2 129

P U R S U I T O F Q U A L I T Y
process, outcome" taxonomy because of the implications for selection, gaming,and innovation." This taxonomy distinguishes among the resources assembled todeliver care, including personnel, facilities, and materials (structure); the comple-tion of specific tasks or recommended treatments (process); and the ultimate re-sults of care, including patients' experience and health status (outcome). Payingfor the adoption of structural measures of quality has the advantage of being freeof case-mix influence, but it might not lead to desired outcomes if the structuresare not used effectively. Process measures leave more discretion for alternative ap-proaches to achieve the desired activity (for example, making sure that chronicallyill patients are monitored regularly) but may be affected by patients' preferencesor health status and thus could create fairness and selection concerns. Outcomemeasures are, of course, more directly what payers are attempting to improve butare influenced by many factors beyond the provider's control, including case-mix.The unpredictable elements of this variation will impose sizable risk on providers,while the predictable elements, unless adequate risk adjustment is used, will bethe basis for selection. Among outcome measures, we distinguish between clinicaloutcomes and patient-experience measures, which may be differentially valued bysponsors.
The final two features influence how rewards are allocated across providers:whether or not providers compete for bonuses, with winners and losers, andwhether targets are based on improvement or just good performance. Competitivebonus programs, also known as tournaments in the incentive literature, arethought to provide a stronger incentive to improve performance because eventhose with high baseline performance face the threat of not being rewarded if oth-ers improve and they do not. Noncompetitive programs, in which all providershave the opportunity to reach a fixed target or implement structural quality mea-sures to obtain a share of the reward pool, may provide less of an incentive to im-prove quality. Targets based on quality improvement rather than absolute qualityprovide greater incentives for those with low baseline quality; if there are dimin-ishing returns to quality improvement activities, it may actually be less costly for aprovider at a low baseline level of performance than for one at a high level to im-prove quality.
ResultsBefore characterizing the programs as a group, we describe three prototypical
examples to provide context for the summary analyses.• Three examples. Centers for Medicare andMcdicaid Services (CMS) and Premier Inc. In
July 2003 the CMS and Premier Inc., a nationwide organization of not-for-profithospitals, armounced a demonstration project to provide quality bonuses for hospi-tals based on performance related to treatment in five clinical areas that are criticalfor Medicare's elderly population: heart attack, heart failure, pneumonia, coronaryartery bypass graft (CABG) surgery, and hip and knee replacements. Performance
130 M a r c h / A p r i l 2004

P R O V I D E R S ' I N C E N T I V E S
measures include both process and outcome measures. Eor example, the proposedset of measures for CABG includes rates of aspirin prescribed at discharge, inpatientmortality, and postoperative hemorrhage or hematoma. Hospitals are to be scoredand ranked by condition, and any hospital in the top 10 percent for a given conditionwill receive a 2 percent bonus on its Medicare payments; hospitals in the next decilewill receive a bonus of 1 percent. In the third and final year of the demonstration,hospitals with the worst performance will be financially penalized.
PacifiCare of California (PCC) Quality Incentive Program ($IP). PCC is one of the sevenparticipating health plans in the Integrated Healthcare Association (IHA) initia-tive that has aligned a large part of the health plan market in California behind acommon set of measures to reward medical-group quahty. The ten IHA domains(for 2003) are cervical cancer screening, mammography, childhood immuniza-tions, diabetic hemoglobin Ale testing, screening of patients with coronary arterydisease for elevated LDL cholesterol, satisfaction with medical group, satisfactionwith primary care physician (PCP), satisfaction with referral process, satisfactionwith specialist, and effective PCP communication.
The QIP builds on a series of efforts to use quality information to spur improve-ment, including sharing quarterly performance profiles with its network of physi-cian organizations since 1995 and releasing medical group report cards since 1998.In July 2003 PCC began paying quarterly bonuses of up to $2 per PCC member permonth for meeting or exceeding fixed targets for the ten common measures agreedupon by IHA members plus six measures of quality and patient safety for the hos-pital to which the group admits the majority of its patients.
Bridges to Excellence (BTE). BTE is a multilateral effort backed by a group of largeemployers to offer new financial incentives for physicians to improve health carequality in several target markets (Boston, Cincinnati/Louisville, and Albany/Schenectady). Three distinct initiatives have been launched by BTE, including theDiabetes Care Link, the Physician Office Link, and the Cardiac Care Link. Each"link" comprises a broad set of measures, each of which is accorded points towardan overall score. Eor example, the Physician Office Link sets standards for clinicalinformation systems, patient education and support, and care management. Un-der this link, physicians can receive prorated bonuses for partial achievement ofgoals and may earn up to $55 per eligible patient. Under the Diabetes Care Link,the entire award ($100 per diabetic patient) is tied to participation in a recogni-tion program sponsored by the American Diabetes Association and the NationalCommittee for Quality Assurance (NCQA).
• Summary analysis. Exhibit 1 hsts the thirty-seven payment-for-quahty pro-grams that our search identified and reports sponsor leverage and targeted domainsfor each physician and hospital quahty bonus program.
Sponsor leverage. Eourteen of the thirty-one sponsors whose programs we de-scribe either were themselves a coalition or participated (for example, by adoptingrecommended measures as the basis of payment) in multilateral efforts related to
HEALTH AFFAIRS - Volume 23. Number 2 131

P U R S U I T O F Q U A L I T Y
EXHIBIT 1Summary Of Payment-For-Quality Strategies
Sponsor
Aetna (CA)Anthem Blue Cross Blue Shield of NHAnthem Blue Cross Blue Shield
Midwest (OH, IN, KY)
Anthem Blue Cross Blue Shield of VA(formerly Trigon)
Blue Cross Blue Shield of ILBlue Cross Blue Shield of MA
Blue Cross Blue Shield of MNBlue Cross Blue Shield of MlBlue Cross Blue Shield of MO
Blue Cross Blue Shield of Rochester(Excellus) and Rochester IPA (NY)
Blue Cross of CABlue Shield of CA
Bridges to Excellence
Buyers Health Care Action GroupCenters for Medicare and Medicaid
Services (CMS) and Premier inc.
CiGNA (CA)CIGNA and Promina (GA)Empire Blue Cross and Leapfrog
employers
Employer Coalition on HealthHarvard Pilgrim Health Care (MA)Hawaii Medical Service Association
(Blue Cross Blue Shield of HI)
HeaithGuard (PA)Health NetHealthPartners (MN)
Highmark Blue Cross Blue Shield (PA)Independence Blue Cross (PA)Independent Health (NY)
Integrated Healthcare Association(IHA) Local Initiative RewardingResults (CA)
PacifiCare (CA)
Tri-River Healthcare Coalition (OH)Western Health Advantage (CA)
Coalition"
Yes (IHA)No
No
NoYes (Bridges, Leapfrog)No
NoYes (Leapfrog)No
NoYes (i HA)Yes (IHA)
Yes (Bridges)
_C
No
Yes (IHA)No
Yes (Leapfrog)
_c
No
No
NoYes (IHA)No
NoNoNo
NoYes (IHA, Leapfrog)
- C
Yes (IHA)
Percent of Insuredpopulation coveredby sponsor**
46
3
69
19
574
402111
3 Boston10 Cincinnati-Louisville6 Albany-Schenectady
15
40
31
4
135
13
41225
52630
610
154
Physicianprogram(N = 28)
0-PE, P, SP
aPE, PE (for OH)
0-PE, PPaPE, P
S
aPE, p
0-PE, P0-PE, P0-PE, P, S
P,S
P,S
0-PE, P, SaPE, p
pP, S
0-PE, P
paPE, pp
0, 0-PE, P0-PE, P, SaPE, p
paPE, p, s
P, S0-PE, P, S
Hospitalprogram(N = 9)
0-CM, aPE, P
0-PE, PO-PE,S
P.S
0-CM, P
O<;M, aPE, p
s
0-CM, 0-PE, P, S
O-CM,S
SOURCE: Authors' analysis of publicly reported program descriptions.
NOTES: P = program focuses on process measures, such as Health Plan Employer Data and Information Set (HEDIS) diabetesor mammogram screening. 0-PE = program focuses on patient-experience measures. 0-CM = program focuses on clinicaloutcome measures, such as complications or mortality. S = program focuses on structure measures, such as Leapfrogmeasures for hospitals or information systems to track chronically ill patients. IHA is Integrated Healthcare Association.
'Sponsor participates in a coalition. Note that some sponsors also have efforts outside of the coalitions.
"In most cases, this measure refiects statewide share of insured lives covered by the plan or employer, based on 2001 IntetStudydata. Where plans or programs were explicitly limited to a limited number of counties or metropolitan areas within a state (BlueCross Blue Shield of Rochester, Bridges to Excellence, Empire Blue Cross/Leapfrog, Employer Coalition on Health, HeaithGuard,PacifiCare, and Tri-River Healthcare Coalition), the figure reflects the share of insured people in those areas.
"These are coalitions themselves, not payers that are part of the named coalitions.
132 March/April 2004
P R O V I D E R S ' I N C E N T I V E S
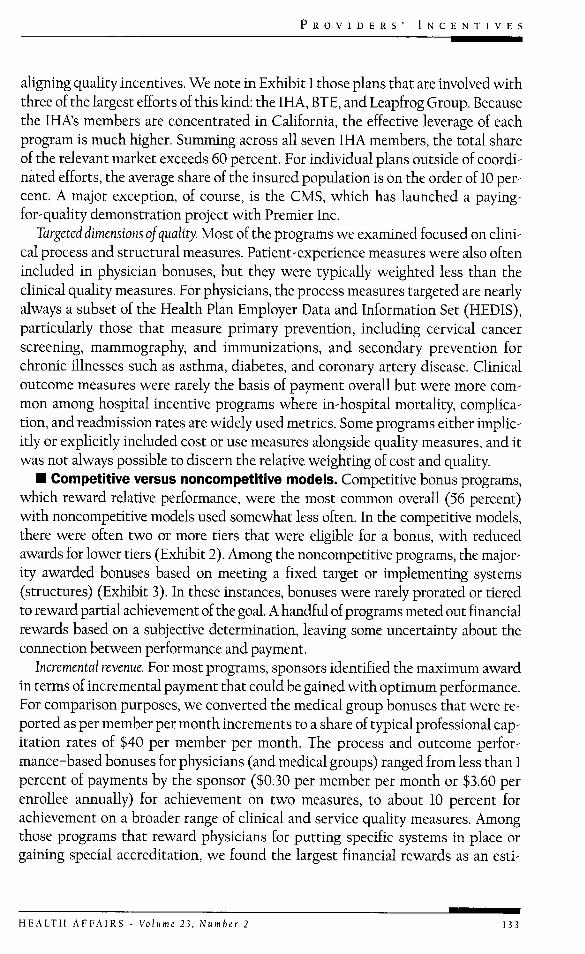
aligning quality incentives. We note in Exhibit 1 those plans that are involved withthree of the largest efforts of this kind: the IHA, BTE, and Leapfrog Group. Becausethe IHA's members are concentrated in California, the effective leverage of eachprogram is much higher. Summing across all seven IHA members, the total shareof the relevant market exceeds 60 percent. For individual plans outside of coordi-nated efforts, the average share of the insured population is on the order of 10 per-cent. A major exception, of course, is the CMS, which has launched a paying-for-quality demonstration project with Premier Inc.
Targeted dimensions of quality. Most of the programs we examined focused on clini-cal process and structural measures. Patient-experience measures were also oftenincluded in physician bonuses, but they were typically weighted less than theclinical quality measures. For physicians, the process measures targeted are nearlyalways a subset of the Health Plan Employer Data and Information Set (HEDIS),particularly those that measure primary prevention, including cervical cancerscreening, mammography, and immunizations, and secondary prevention forchronic illnesses such as asthma, diabetes, and coronary artery disease. Clinicaloutcome measures were rarely the basis of payment overall but were more com-mon among hospital incentive programs where in-hospital mortality, complica-tion, and readmission rates are widely used metrics. Some programs either implic-itly or explicitly included cost or use measures alongside quality measures, and itwas not always possible to discern the relative weighting of cost and quality.
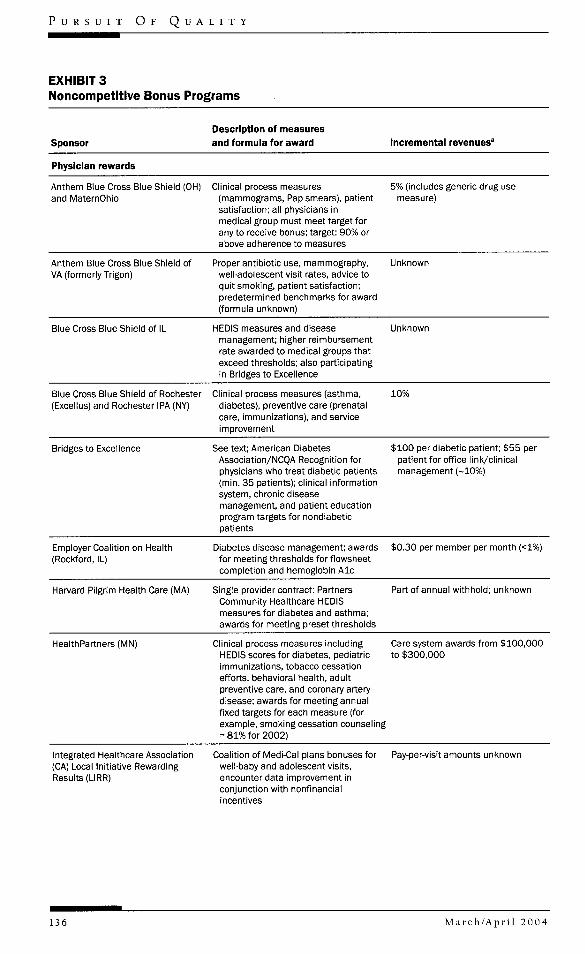
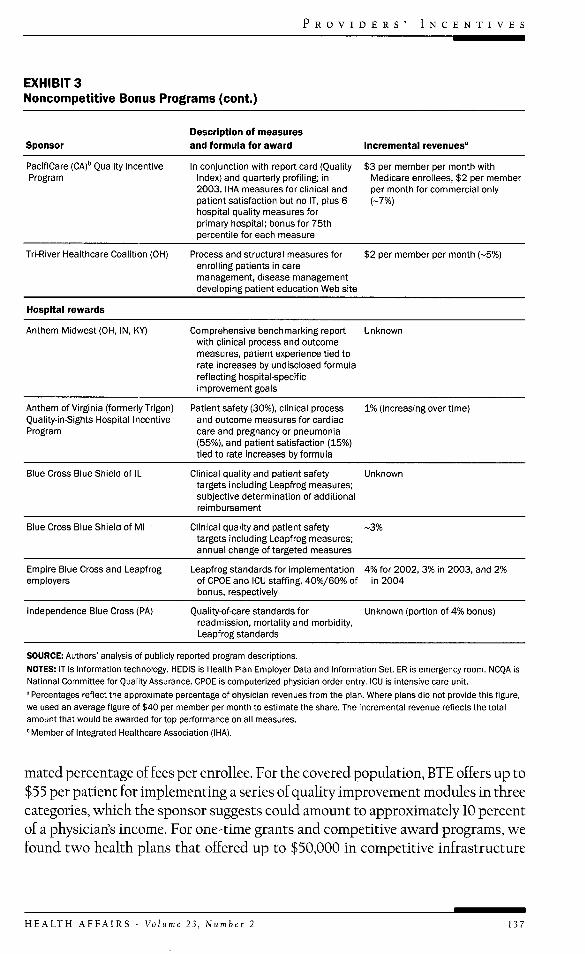
• Competitive versus noncompetitive modeis. Competitive bonus programs,which reward relative performance, were the most common overall (56 percent)with noncompetitive models used somewhat less often. In the competitive models,there were often two or more tiers that were ehgible for a bonus, with reducedawards for lower tiers (Exhibit 2). Among the noncompetitive programs, the major-ity awarded bonuses based on meeting a fixed target or implementing systems(structures) (Exhibit 3). In these instances, bonuses were rarely prorated or tieredto reward partial achievement of the goal. A handful of programs meted out financialrewards based on a subjective determination, leaving some uncertainty about theconnection between performance and payment.
Incremental revenue. Eor most programs, sponsors identified the maximum awardin terms of incremental payment that could be gained with optimum performance.Eor comparison purposes, we converted the medical group bonuses that were re-ported as per member per month increments to a share of typical professional cap-itation rates of $40 per member per month. The process and outcome perfor-mance-based bonuses for physicians (and medical groups) ranged from less than 1percent of payments by the sponsor ($0.30 per member per month or $3.60 perenroUee annually) for achievement on two measures, to about 10 percent forachievement on a broader range of clinical and service quality measures. Amongthose programs that reward physicians for putting specific systems in place orgaining special accreditation, we found the largest financial rewards as an esti-
HEALTH AFFAIRS - Volume 23, Number 2 133

P U R S U I T O F Q U A L I T Y
EXHIBIT 2Competitive Bonus Programs
SponsorDescription of measuresand formula for award Incremental revenues"
Physician rewards
Aetna (CA)" IHA measures (see Exhibit 1): 6ciinicai process, 4 patientsatisfaction, and 2 iT capabilitymeasures; awarded to top 25% ofmedicai groups for each measure
3.5%
Anthem Biue Cross Blue Shield of NH Clinical process measures anddisease management structures;awarded to top two quartiles ofprimary care physicians for eachclinical process measure
$20 per member per year (-5%) topquartile; $10 per member per yearfor 3rd quartile; $20 per memberper year for participating in diseasemanagement
Blue Cross of California" PhysicianQuality Incentive Program (PQIP)
Subset of IHA measures;mammograms. Pap smear, asthmameasures, and patient satisfaction;increasing payment for 20th, 40th,60th, and 80th percentiles
$4.50 per member per month (~10%)
Blue Cross Blue Shield of MA 8 HEDIS (clinical process) measuresand 10 patient satisfactionmeasures
Unknown portion of 15% annualwithhold
Blue Cross Blue Shield of MN Competitive grants for qualityimprovement projects with technicalassistance from care managers
Up to $50,000
Blue Cross Blue Shield of MO HEDIS (clinical process) measures;cholesterol screening, asthma,mammography, diabetes, childimmunization, patient satisfaction;target; increasing bonus for 5 strataof performance
Blue Shield of CA" IHA measures (see Exhibit 1);payments for 30th/50th/75thpercentiles for clinical processmeasures and 50% of patientsatisfaction award for average,100% for above average; 50% of ITaward for 1 IT activity and 100%for 2
$2 per member per month: $1 forciinicai, $0.80 for patientsatisfaction, and $0.20 for IT (-5%)
Buyers Health Care Action Group Annual awards for patient safety andclinical quality projects, specificquality areas vary by year; appiicantsmust meet thresholds for preventivecare
2001; 2 awards of $100,000 and 2of $50,000
CIGNA (CA)" Provider GroupRewards Program
IHA measures (see Exhibit 1); 50% ofbonus for clinical measures, 40%patient satisfaction, 10% IT; 50thpercentile or above receive award(increasing payment for higherscore)
$1.60 per member per month (-4%)
CIGNA and Promina (GA) HEDIS measures; diabetes. Papsmear, mammogram; patientsatisfaction; 3 tiers of fees basedon scoring
5% differential between tiers
134 M a r c h / A p r i l 2 0 0 4

P R O V I D E R S ' I N C E N T I V E S
EXHIBIT 2Competitive Bonus Programs (cont.)
Sponsor
Physician rewards
Harvard Pilgrim Heaith Care (MA)
Hawaii Medicai Service Association(Biue Cross/Blue Shieid of Hi)Provider Quaiity and ServiceRecognition (PQSR)
HeaithGuard (PA)
HeaitiiNetiCA)"
Description of measuresand formula for award
Competitive grants for quaiityimprovement programs avaiiabie formedicai groups/ciinics
Ciinicai and service quaiity measures
HEDiS measures: diabetes, asthma,hypertension; award to top-ratedphysicians (unspecified percentiie)
IHA measures (see Exhibit 1); 50% ofbonus for ciinicai measures, 40%patient satisfaction, 10% iT
Incremental revenues'
$50,000 per grant
$13,600 per physician (for quaiityportion) (~5.5% of overaii saiary)
~$1 per member per month (2.5%)
$2.25 per member per month plusadditionai bonus for groups withindividuai physician bonus pian(-5.5%)
Highmark Biue Cross Biue 'Shieid (PA)
HEDIS measures for beta-bioci^ertreatment, cancer screening,choiesteroi screening, diabetes;patient satisfaction; eiectronicconnectivity; and member access;award to top 50%
1% bonus for 50th-59th percentiie;2% for 60th-69th; 4% for 70th-84th; 5% for 85th-100th
independence Biue Cross (PA)Practice Quaiity AssessmentProgram (PQAS) and Quaiityincentive Payment System (QiPS)
11 ciinicai process measures (50% ofscore) and satisfaction (50% ofscore); increasing awards across 16performance strata
$2.30 per member per month (-5.5%)
independent Heaith (NY) Mammography, colorectai cancerscreening, ER use, patientsatisfaction, access
$1.50 per member per month (-4%)
Western Heaith Advantage (CA)" iHA measures (see Exhibit 1) Unknown
Hospital rewards
CMS and Premier Inc.demonstration program
Ciinicai process measures reiatedto heart attack, heart faiiure, CABG,hip/knee repiacement, pneumonia;awards to top 20%
Top 10% for each measure receive a2% bonus; second 10% receive a1% bonus
CIGNA and Promina (GA) individuai hospitai performance;readmission rates, patientsatisfaction score, other measures;top performers within heaith systemeligibie; award structure unspecified
Unknown
Hawaii iVledicai Service Association(Blue Cross/Biue Shieid of Hi)Provider Quaiity and ServiceRecognition (PQSR)
Ciinicai metrics; compiications,patient satisfaction, best practices,and readmissions; top performerseiigibie; award structure unspecified
$1.1 miiiion
SOURCE: Authors' analysis of publicly reported program descriptions.
NOTES: iT is information technology. HEOIS is Heaith Pian Employer Data and Information Set. ER is emergency room. CMS isCenters for Medicare and Medicaid Services. CABG is coronary artery bypass graft.
"Percentages reflect the approximate percentage of physician revenues from the plan. Where plans did not provide this figure,we used an average figure of $40 per member per month to estimate the share. The incremental revenue reflects the totalamount that would be awarded for top performance on all measures.
"Member of Integrated Healthcare Association (IHA).
H E A L T H A F F A I R S - V o l u m e 2 1 , N u m b e r 2 135
P U R S U I T O F Q U A L I T Y
EXHIBIT 3Noncompetitive Bonus Programs
Sponsor
Description of measures
and formula for award Incremental revenues'
Physician rewards
Anthem Blue Cross Blue Shieid (OiH)and MaternOhio
Ciinicai process measures(mammograms. Pap smears), patientsatisfaction; all physicians inmedicai group must meet target forany to receive bonus; target; 90% orabove adherence to measures
5% (inciudes generic drug usemeasure)
Anthem Biue Cross Blue Shieid ofVA (formeriy Trigon)
Proper antibiotic use, mammography,weii-adolescent visit rates, advice toquit smoking, patient satisfaction;predetermined benchmarks for award(formula unknown)
Unknown
Blue Cross Biue Shieid of iL HEDIS measures and diseasemanagement; higher reimbursementrate awarded to medicai groups thatexceed threshoids; aiso participatingin Bridges to Exceilence
Unknown
Blue Cross Blue Shield of Rochester(Excellus) and Rochester IPA (NY)
Clinical process measures (asthma,diabetes), preventive care (prenataicare, immunizations), and serviceimprovement
10%
Bridges to Excellence See text; American DiabetesAssociation/NCQA Recognition forphysicians who treat diabetic patients(min. 35 patients); ciinicai informationsystem, chronic diseasemanagement, and patient educationprogram targets for nondiabeticpatients
$100 per diabetic patient; $55 perpatient for office link/ciinicaimanagement (~10%)
Empioyer Coaiition on Health(Rockford, IL)
Diabetes disease management; awardsfor meeting threshoids for fiowsheetcompietion and hemogiobin Ale
$0.30 per member per month (<1%)
Harvard Piigrim Health Care (MA) Single provider contract; PartnersCommunity Heaithcare HEDiSmeasures for diabetes and asthma;awards for meeting preset threshoids
Part of annuai withhoid; unknown
HeaithPartners (MN) Ciinicai process measures inciudingHEDiS scores for diabetes, pediatricimmunizations, tobacco cessationefforts, behavioral heaith, aduitpreventive care, and coronary arterydisease; awards for meeting annuaifixed targets for each measure (forexampie, smoking cessation counseiing= 81% for 2002)
Care system awards from $100,000to $300,000
integrated Heaithcare Association(CA) Locai Initiative RewardingResuits(URR)
Coaiition of Medi-Cai pians bonuses forweil-baby and adolescent visits,encounter data improvement inconjunction with nonfinancialincentives
Pay-per-visit amounts unknown
136 March/April 2004
P R O V I D E R S ' I N C E N T I V E S
EXHIBIT 3Noncompetitive Bonus Programs (cont.)
SponsorDescription of measuresand formuia for award incrementai revenues*
PacifiCare (CA)'' Quality IncentiveProgram
in conjunction with report card (Quaiity $3 per member per month withindex) and quarteriy profiiing; in2003, iiHA measures for ciinicai andpatient satisfaction but no iT, plus 6hospitai quaiity measures forprimary hospitai; bonus for 75thpercentiie for each measure
iViedicare enroliees, $2 per memberper month for commerciai oniy
Tri-River Healthcare Coalition (OiH) Process and structurai measures forenroliing patients in caremanagement, disease managementdeveioping patient education Web site
$2 per member per month (-5%)
Hospital rewards
Anthem iVIidwest (OH, iN, KY) Comprehensive benchmarking report Unknownwith ciinicai process and outcomemeasures, patient experience tied torate increases by undisciosed formuiarefiecting hospitai-specificimprovement goals
Anthem of Virginia (formeriy Trigon)Quality-in-Sights Hospitai incentiveProgram
Patient safety (30%), ciinicai processand outcome measures for cardiaccare and pregnancy or pneumonia(55%), and patient satisfaction (15%)tied to rate increases by formula
1% (increasing over time)
Biue Cross Biue Shield of iL Ciinicai quaiity and patient safetytargets inciuding Leapfrog measures;subjective determination of additionaireimbursement
Unknown
Blue Cross Blue Shieid of Mi Ciinicai quality and patient safetytargets inciuding Leapfrog measures;annual change of targeted measures
Empire Biue Cross and Leapfrogempioyers
Leapfrog standards for impiementation 4% for 2002, 3% in 2003, and 2%of CPOE and iCU staffing, 40%/60% of in 2004bonus, respectiveiy
Independence Biue Cross (PA) Quaiity-of-care standards forreadmission, mortality and morbidity.Leapfrog standards
Unknown (portion of 4% bonus)
SOURCE: Authors' anaiysis of publicly reported program descriptions.
NOTES: IT is information technology. HEDIS is Health Plan Employer Data and Information Set. ER is emergency room. NCQA isNational Committee for Quality Assurance. CPOE is computerized physician order entry. iCU is intensive care unit.
• Percentages reflect the approximate percentage of physician revenues from the plan. Where pians did not provide this figure,we used an average figure of $40 per member per month to estimate the share. The incrementai revenue refiects the totaiamount that wouid be awarded for top performance on aii measures.
" Member of integrated Heaithcare Association (IHA).
mated percentage of fees per enrollee. For the covered population, BTE offers up to$55 per patient for implementing a series of quality improvement modules in threecategories, which the sponsor suggests could amount to approximately 10 percentof a physician's income. For one-time grants and competitive award programs, wefound two health plans that offered up to $50,000 in competitive infrastructure
HEALTH AFFAIRS - Volume 23, Number 2 137

P U R S U I T O F Q U A L I T Y
'Tcrhaps it is agood thing to use payment arrangements to enforcequality competition, since the market has heen unable to do so.''
grants (along with technical assistance) and one program that gave awards of$100,000 and $50,000 to selected providers.
Rewarding quality improvement. We were surprised to find almost no emphasis onquality improvement in the payment arrangements we reviewed. In one case. Har-vard Pilgrim Health Care, the quality bonus was offered to a single hospital net-work/health system and was couched in terms of improvement relative to base-line. In this case, however, there is no operational difference between a qualityimprovement target and a fixed target (since there is only a single provider). Therewere no other programs in which quahty improvement was explicitly mentionedas the basis for computing awards.
DiscussionIn our search for examples of paying for quality, we found thirty-one separate
sponsors of such arrangements, covering more than twenty million enrollees. Be-cause of our focus on programs that were publicized in the press or on theInternet, there are probably other similar programs that we have not described.Because of the high degree of homogeneity we found, however, it would be sur-prising if the addition of a few other cases altered our conclusions much.
There is much commonality in the basic structure of these programs. The vastmajority of incentive arrangements target a mix of process and structural mea-sures with a smaller role for patient experience measures, and the sponsor nearlyalways rewards good performance rather than improvement. This puts physiciansor hospitals that have already figured out how to deliver good quality health carealong the targeted dimensions at an advantage. These providers deserve to be re-warded for past efforts, undertaken in an environment less supportive of high-quality health care delivery. This rewarding of historical investments in quality,however, strikes us as not altogether consistent with the stated goals of most ofthe programs: to improve quality for all enrollees/beneficiaries.
Physicians and hospitals that have a long way to go in terms of meeting absolutetargets or are ranked low among their peers are less likely to find it worthwhile tostrive for these bonuses. Moreover, because many programs use competitive mod-els, with explicit winners and losers, these systems likely will result in redistribu-tion of reimbursement from "low-quality" to "high-quality" providers and maybethe demise of some "low-quality" providers. Perhaps it is a good thing to use pay-ment arrangements to enforce quality competition, since the market has been un-able to do so. But one could argue that low-quality providers are precisely the onesthat need increased resources to improve their quality. In this view, if bonuses can-not be explicitly structured around quality improvement, then grants or incen-
138 M a r c h / A p r i l 2004

P R O V I D E R S ' I N C E N T I V E S
tives related to structural measures of quality might be better suited to simulta-neously bringing up average quality and reducing variance across providers.
The few published evaluations of quality incentives describe programs in whicha single clinical area or measure was targeted; this generation of paying for qualitytakes aim at a multidimensional notion of quality, including patients' experience.Incorporating a broad array of quality measures in an incentive program, as manyof the examples we found do, appears to be an attempt to deal with what econo-mists refer to as the "multitasking" problem. That is, if providers face a number oftasks and resources are limited, then effort will be allocated toward those tasksthat are explicitly rewarded, taking resources away from other activities. Bychoosing to attach financial rewards to a larger set of tasks, payers can elevate andprotect key priorities from these negative spillover effects. Inevitably, however,the dimensions of care that will receive the most attention will be those that aremost easily measured and not necessarily those that are most valued. In addition,the focus on individual measures may discourage more unified quality improve-ment efforts that ultimately could prove more effective or efficient. For example,attaching rewards to secondary prevention for specific conditions such as diabe-tes or asthma may encourage condition-specific care management when inte-grated care management might be most efficient, because of high rates of comor-bidity Similarly, financial rewards for improving childhood immunization ratesmight lead to interventions that are narrowly targeted for this population insteadof systems for tracking and assuring appropriate preventive care more generally.
A rough approximation suggests that payers have put aside more than $200million for these programs in 2004 (of course actual payouts may be much less). Atthe same time, we wonder if the incremental rewards for quality for any one pro-vider will be sufficient to motivate the kind of change that is needed. Most pro-grams put 5 percent or less of compensation at risk for performance on quality,and many simultaneously target ten or more separate clinical areas. Moreover, be-cause few sponsors command a large share of the average provider's business, thequality incentive is further diluted by competing incentives.
Improving quality of care in the U.S. health care system has some elements of apublic-good problem: Investments by one payer accrue benefits to other payersbecause of nonexclusive contracting (overlapping networks), and by corollary noindividual payer will invest enough in trying to bridge the quality chasm. Pur-chasing coalitions and other multilateral entities such as the IHA, BTE, and Leap-frog have emerged to overcome this problem in part, but our data suggest thatmost paying-for-quality initiatives are relatively small in scale.
Looi<ing Aheadwhile no systematic evaluations have yet been conducted with regard to either
the intended or unintended consequences of paying for quality, the current level ofenthusiasm for these programs suggests to us that their diffusion will continue.
HEALTH AFFAIRS - Volume 23. Number 2 139

P U R S U I T O F Q U A L I T Y
Aligning providers' financial incentives with quality goals may be a necessary pre-cursor to improvement, but it is probably not sufficient. Rather, quality-incentiveprograms should be viewed as part of a broader strategy of promoting health carequality through measuring and reporting performance, providing technical assis-tance and evidence-based guidelines, and, increasingly, giving consumers incen-tives to select higher-quality providers and proactively manage their own health.
Much uncertainty exists as to precisely how and how much providers will re-spond to the new payment incentives, but our review suggests some early predic-tions. Based on the design features of the programs in the aggregate, we expectthat, at least initially, paying for quality will entail compensating historicallyhigh-quality providers, with less emphasis on overall quality improvement in thesystem. Some lower-quality providers may be sufficiently motivated to make theinvestments necessary to reach for bonuses, but many may find that the costs ex-ceed the modest financial benefits from doing so. Over time, however, the pro-grams may begin to reward quality improvement more directly, particularly if theyfind that the same providers receive bonuses every year.
These pay-for-performance initiatives are still in their infancy, and we expectmany changes as they evolve. By using price as well as volume as a lever, they repre-sent a new phase in the effort to improve quality of care. Despite good intentions,however, there are a number of concerns with their design, including whethertheir size and scope are sufficient to motivate and support the necessary struc-tural investment and behavioral change, if they will raise quality in those alreadyperforming well or across the board, and whether they will lead to selectionagainst sicker or less adherent patients. For all of these reasons, we believe that itis crucial for timely evaluation to be an integral part of the design of these experi-ments and for these results to help improve the next generation of programs.
In the near term, evaluations of paying-for-quality interventions should focuson whether and by how much bonuses accelerate quality improvement in targetedareas (generally care processes) and to what extent these gains come at the cost oflosing ground in other quality areas. To be informative, this research will bedata-intensive, requiring time-series data on targeted and other measures for theintervention group and a credible comparison group. As we suggested earlier, dis-tributional effects (for example, which groups of targeted providers receive bo-nuses or achieve accelerated improvement) also should be tracked because of thepossibility that some programs may exacerbate existing quality differentialsacross providers (and thus consumers). Finally, paying for quality will entail fi-nancial costs to the system, so these programs should be judged based on some no-tion of value or cost-effectiveness relative to alternative interventions for improv-ing health care quality.
140 M a r c h / A p r i l 2004

P R O V I D E R S ' I N C E N T I V E S
Meredith Rosenthal and Bruce Landon acknowledge funding from Agency for Healthcare Research and Quality(AHR5) Grant no. P0J-HSJ0803-0J. Rosenthal's work was also supported by the Harvard lnterfaculty Programfor Health Systems Improvement. The authors aregrateful to Pranav Kotharifor his help with initial research oncatalogingpay-for-performanceefforts.
NOTES1. J.P. Newhouse, "Why Is There a Quality Chasm?" Health Affairs Ouly/Aug 2002): 13-25; and S. Leatherman
et al., "The Business Case for Quality: Case Studies and an Analysis," Health Affairs (Mar/Apr 2003): 17-30.2. See, for example, C. Prendergast, "The Provision of Ineentives in Firms," Journal of Economic Literature 37, no.
1 (1999): 7-63; A. Donabedian, The Definition of Quality and Approaches to Its Assessment, Volume I: Explorations inQuality Assessment and Monitoring (Ann Arbor, Mich.: Health Administration Press, 1980); O. Hart and B.Hohnstrom, "The Theory of Contracts," in Advances in Economic Theory: Fifth World Congress, ed. T.F. Bewley(Cambridge: Cambridge University Press, 1987); and TG. McGuire and M.V. Pauly "Physician Responseto Fee Changes with Multiple Payers," journal of Health Economics 10, no. 4 (1991): 385-410.
3. Institute of Medicine, Crossing the Quality Chasm: A New Health System for the Twenty-first Century (Washington:National Academies Press, 2001).
4. F.A. McGlynn et al., "The Quality of Health Care Dehvered to Adults in the United States," New Englandjournal ofMedieine 348, no. 26 (2003): 2635-2645.
5. F.C. Schneider and A.M. Epstein, "Use of Public Performance Reports: A Survey of Cardiac Surgery Pa-tients," Journal of t/ie American Medical Association 279, no. 20 (1998): 1638-1642; N.D. Beauheu, "Quality Ixifor-mation and Consumer Health Plan Choice," journal of Health Econon^ics 21, no. 1 (2002): 43-63; D.P. Scanlonet al., "Health Plan Report Cards: Exploring Differences in Plan Ratings," Joint Commission Journal on QualityImprovement 24, no. 1 (1998): 5-20; and M. Chernew and D.P. Scanlon, "Health Plan Report Cards and In-surance Choice." Inquiry 35, no. 1 (1998): 9-22.
6. G. Amundson et al., "Paying for Quality Improvement: Comphance with Tobacco Cessation Guidelines,"joint Commission journal on Quality and Safety 29, no. 2 (2003): 59-65.
7. A.L. Hillman et al., "The Use of Physician Financial Incentives and Feedback to Improve Pediatric Preven-tive Care in Medicaid Managed Care," Pediatrics 104, no. 4 (1999): 931-935; A.L. Hillman et al., "PhysicianFinancial Incentives and Feedback: Failure to Increase Cancer Screening in Medicaid Managed Care,"American journal of Puhlic Health 104, no. 4 (1998): 1699-1701; G. Fairbrother et al., "The Impact of PhysicianBonuses, Enhanced Fees, and Feedback on CMdhood Immunization Coverage Rates," American journal ofPublic Health 89, no. 2 (1999): 171-175; R.W Kouides et al., "Performance-Based Physician Reimbursementand Influenza Immunization Rates in the Elderly The Primary-Care Physicians of Monroe County" Amer-ican journal of Preventive Medicine 14, no. 2 (1998): 89-95; and S.M. Geron, "Regulating the Behavior ofNursing Homes through Positive Incentives: An Analysis of Illinois' Quality Incentive Program (QUIP),"Caontologist 31, no. 3 (1991): 292-301.
8. See, for example, N.A. Hanchak, N. Schlackman, and S. Harmon-Weiss, "U.S. Healthcare's Quahty-BasedCompensation Model," Health CareEinandngReview 17, no. 3 (1996): 143-159.
9. National Health Care Purchasing Institute, "Profiles of Organizations Using Quahty Incentives," 2003,www.nhcpi.net/pdf/profiles.pdf (30 August 2003).
10. InterStudy, The Competitive Edge Datahase (St. Paul: InterStudy 1998).11. Donabedian, The Definition of Quality.
HEALTH AFFAIRS - Volume 23, Number 2 141