Embed Size (px)
Citation preview

P.B. Flemings (1), I. Song (2,3) and D.M. Saffer (3)P.B. Flemings (1), I. Song (2,3) and D.M. Saffer (3)
(1) Jackson School of Geosciences, University of Texas, (1) Jackson School of Geosciences, University of Texas, Austin, USAAustin, USA
(2) Korea Institute of Geoscience and Mineral Resources, (2) Korea Institute of Geoscience and Mineral Resources, KoreaKorea
(3) Department of Geosciences, Pennsylvania State (3) Department of Geosciences, Pennsylvania State University, USAUniversity, USA
Laboratory investigation of coupled Laboratory investigation of coupled deformation and fluid flow in deformation and fluid flow in
mudrock: implications for slope mudrock: implications for slope stability stability
in the Ursa Basin, Gulf of Mexicoin the Ursa Basin, Gulf of Mexico

Location of Ursa Basin, Location of Ursa Basin, GOMGOM
Gulf of MexicoGulf of Mexico

Seismic Profile: IODP Exp. Seismic Profile: IODP Exp. 308308
Mud/clay
MTDs
(Flemings et al., 2005)

ObjectivesObjectives
Characterization of consolidation and Characterization of consolidation and shear behaviors of core samples from shear behaviors of core samples from IODP Sites U1324 in the Ursa Basin, GOMIODP Sites U1324 in the Ursa Basin, GOM
Estimation of the in situ state of stress and Estimation of the in situ state of stress and pressure during sedimentationpressure during sedimentation
Analysis of slope stability in the continental Analysis of slope stability in the continental slope at passive margin in the Ursa Basin, slope at passive margin in the Ursa Basin, GOMGOM

Description of the Description of the sedimentary basin at Site sedimentary basin at Site U1324U1324 Sample depth: 30 ~ 160mbsfSample depth: 30 ~ 160mbsf Clay content: 40 ~ 60%Clay content: 40 ~ 60% Consolidation coefficient: Consolidation coefficient:
~2.2 x 10~2.2 x 10⁻⁸-8 mm22/sec/sec
Sedimentation rate: >10mm/y.Sedimentation rate: >10mm/y. Slope: ~2Slope: ~2ºº

Stress pathStress path
2
)''(' hvp
2
)( hvq
p’q
active failure line
passive failure line
K0 line
sedimentationunloadin
g
reloading
shear

Triaxial Pressure Triaxial Pressure SystemSystem Load signal
Oil Brine
GD
S p
ump
GD
S p
ump
vacu
um
vacu
um
vacuum
Axial force
Base pressure
Pore pressureConfining pressure
loadcell
sample

Electric DevicesElectric Devices
load cell
load signal
axial LVDTs
radial LVDT
radial caliper
LVDT signals
temperature signal
base pedestal
pressure vessel base

Test Record: Test Record: Uniaxial ConsolidationUniaxial Consolidation
h’ v’
'
'0
v
hK

KK00 values during values during consolidationconsolidation

Determination of Determination of preconsolidation pressure preconsolidation pressure PPcc’’

StressStressConditionCondition
'' 0 vh K
'vvu
dzzgv )(
'' cv P

1-D flow analysis1-D flow analysis

Test Record: Test Record: Undrained triaxial Undrained triaxial compressioncompression

Shear induced pore Shear induced pore pressurepressure

Mohr-Coulomb failure Mohr-Coulomb failure criterioncriterion
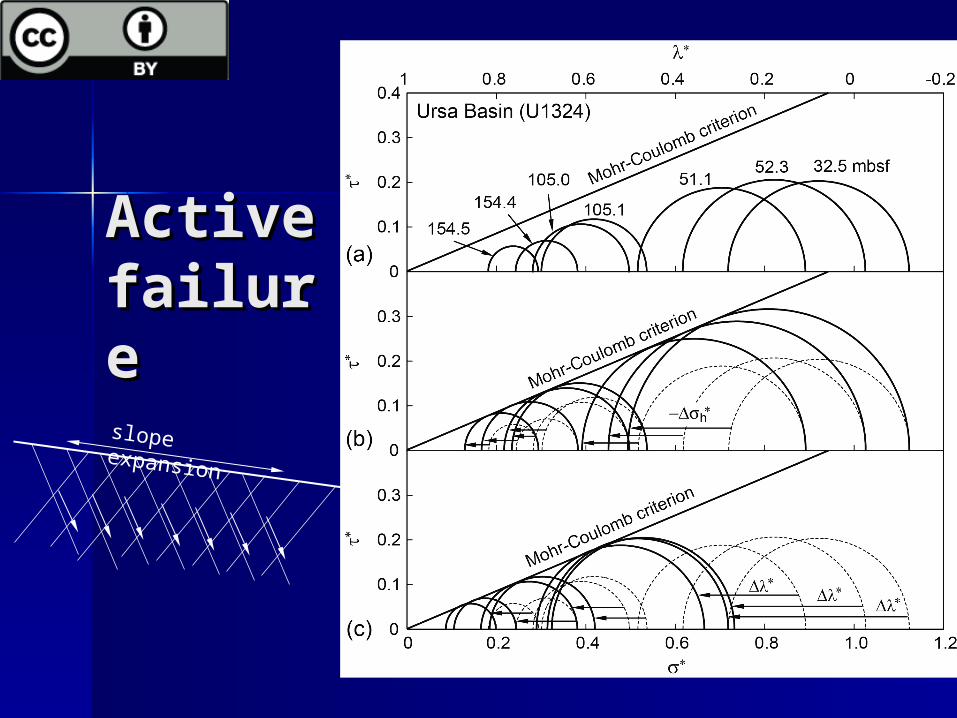
slope expansion
Active Active failurefailure

Slope stability analysisSlope stability analysis
'*
vh
u
ii
is cossin
cosFS
*2
FS: Safety Factors: Sliding friction coefficienti: Slope angle (~2º)*: normalized over pressure
• Overpressure given by tests;
• Sliding friction coefficient s; 0.03~0.12 (s = 1.7 ~ 6.8º)
• Assuming that s = 0.424;
• Normalized overpressure *: 0.92
i'

Stress Stress condition condition for active for active failure &failure &LandslideLandslidess

ii cossin*
*2* cos i
*
*
*
** s
*1
*2/45
slope expansion
slip
line
slip line
*
(a)
(b)
(c)
slope surface
failureinitiation
*1
i
i
2/45
MTD

Research SummaryResearch Summary
Experimental simulations of sedimentation:Experimental simulations of sedimentation:– Ratio of Ratio of hh’/’/vv’: ~0.6’: ~0.6– Overpressure: Overpressure: **= -0.27 ~ 0.707 increasing = -0.27 ~ 0.707 increasing
with depthwith depth– Shear failure criterion: Shear failure criterion: = = tan(23º)tan(23º)– Shear strain may cause additional pore Shear strain may cause additional pore
pressure to increasepressure to increase The slope area is stable during The slope area is stable during
sedimentationsedimentation Slope stability analysis reveals that the Slope stability analysis reveals that the
instability of the continental slope is more instability of the continental slope is more sensitive to active failure than landslidessensitive to active failure than landslides