Embed Size (px)
Citation preview
A Lead Fluoride Calorimeter for Hall A
Kathy McCormick1 and Sirish Nanda2
1Rutgers, The State University of New Jersey, Piscataway, NJ 088552Thomas Je�erson National Accelerator Facility, Newport News, VA 23606
1 Introduction
A nine-cell prototype calorimeter of lead uoride (PbF2) has been constructed and tested inHall A. The calorimeter was placed in the focal plane of the left HRS, in the usual positionof the gas �Cerenkov detector. Electrons elastically scattered from the liquid H2 target wereincident on the calorimeter, and a resolution of 1.6% � 3.6%/
pE was measured, for electron
energies from 1 to 4 GeV.
2 Calorimeter Construction
The material lead uoride is a �Cerenkov radiator which was �rst seriously investigated asa possible electromagnetic calorimeter material around 1989 [1]. The properties of PbF2
compared to other common calorimeter materials are shown in Table 1. It is very dense(� = 7.66 g/cm3) in comparison to \old-style" lead glass calorimeter materials such as SF{5,and on par with new calorimeter materials like lead tungstate (PbWO4). Lead Fluoride hasa short radiation length (X0 = 0.95 cm) and small Moli�ere radius (rM = 2.22 cm), whichallows it to be built into a compact calorimeter. Its index of refraction varies from 1.937 at300 nm to 1.749 at 800 nm. It has no need of temperature stabilization, excepting the factthat it is very fragile and can crack if handled outside of room temperature. The samples oflead uoride that we tested began to transmit around 250 nm and leveled-out at about 80 {90% transmission around 400 nm (see Fig. 1).
The blocks used for the 9-cell prototype were manufactured by Shanghai SICCAS HighTechnology Corporation in China. A photo of one of the blocks is shown in Fig. 2. Eachblock was 150 mm long. The blocks were tapered from a 26 mm2 front face to a 30 mm2
rear face. Each block was viewed by a round, 28 mm diameter Photonis XP2972 PMT. Thehigh voltage for the PMT was supplied by a LeCroy high voltage crate via LeCroy 1461Nhigh voltage cards.
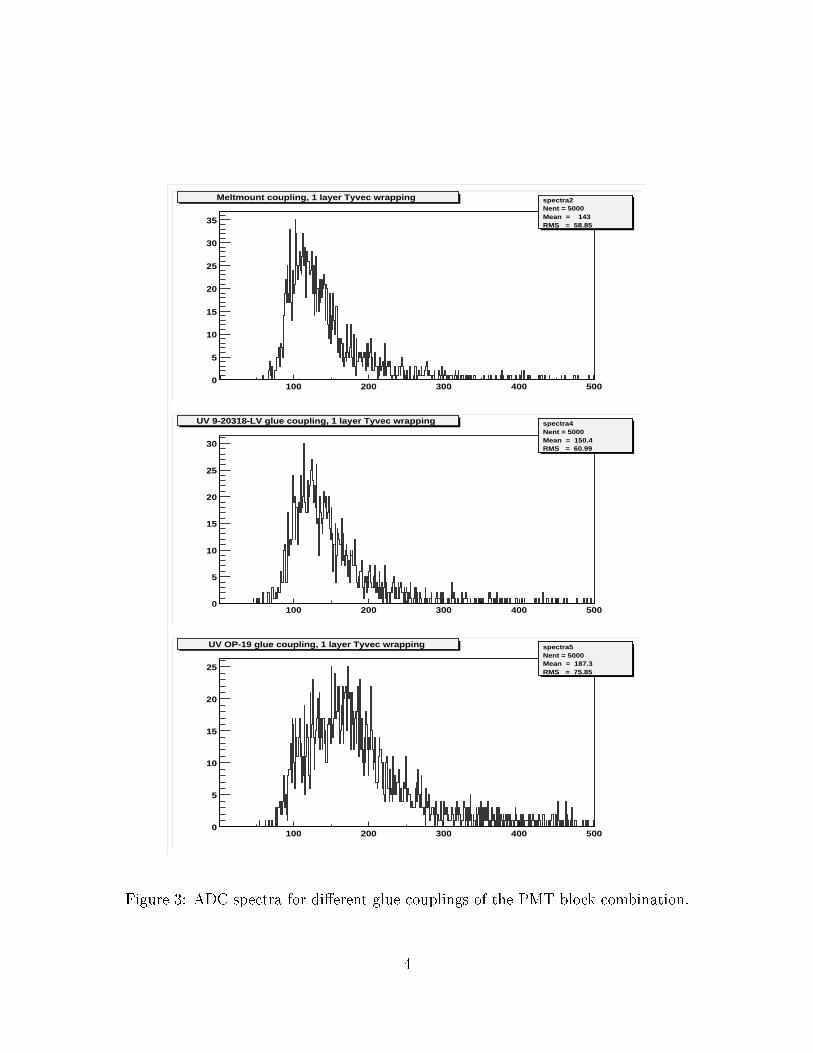
Several types of wrapping and coupling of PMTs to the rear (30 mm2) block face weretested. Di�erent glues were tested �rst. An approximately three inch long block of PbF2 wasused for the di�erent coupling tests. The block was �rst wrapped in one layer of Tyvec paper(�80 �m thick), then a test PMT was successively coupled to the block with two di�erenttypes of UV glues (DYMAX OP-19 and DYMAX 9-20318-LV) and a type of organic glue
1
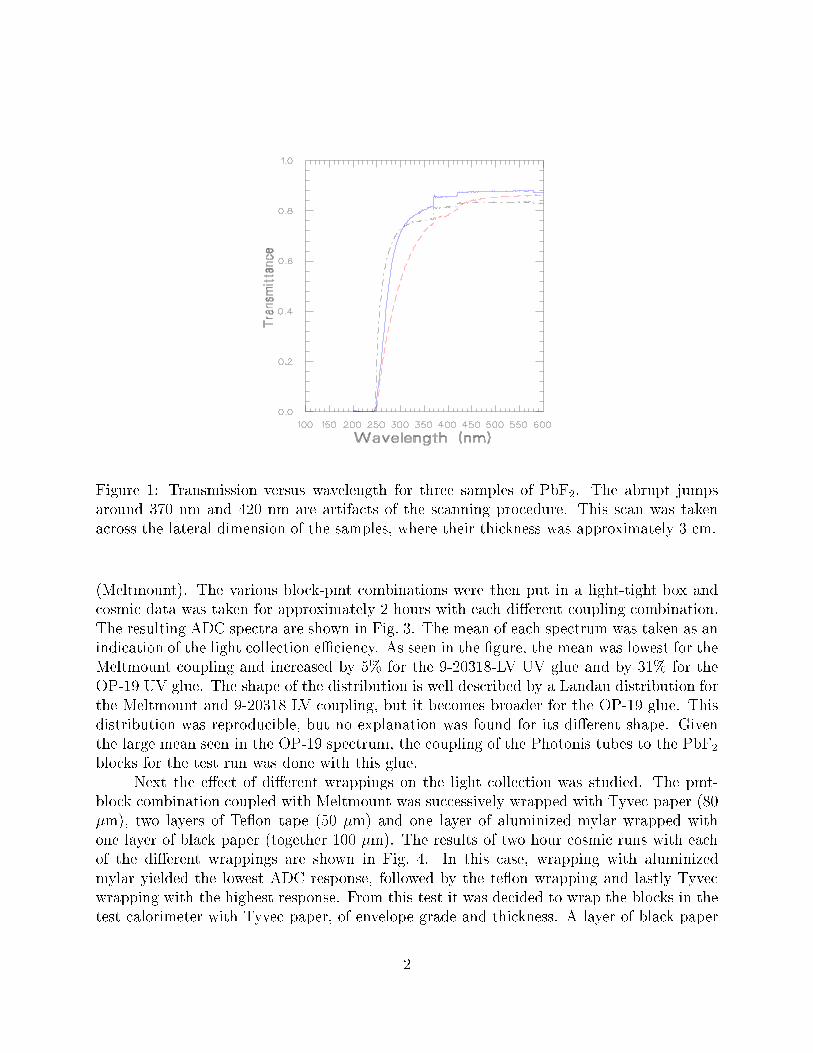
Figure 1: Transmission versus wavelength for three samples of PbF2. The abrupt jumpsaround 370 nm and 420 nm are artifacts of the scanning procedure. This scan was takenacross the lateral dimension of the samples, where their thickness was approximately 3 cm.
(Meltmount). The various block-pmt combinations were then put in a light-tight box andcosmic data was taken for approximately 2 hours with each di�erent coupling combination.The resulting ADC spectra are shown in Fig. 3. The mean of each spectrum was taken as anindication of the light collection eÆciency. As seen in the �gure, the mean was lowest for theMeltmount coupling and increased by 5% for the 9-20318-LV UV glue and by 31% for theOP-19 UV glue. The shape of the distribution is well described by a Landau distribution forthe Meltmount and 9-20318 LV coupling, but it becomes broader for the OP-19 glue. Thisdistribution was reproducible, but no explanation was found for its di�erent shape. Giventhe large mean seen in the OP-19 spectrum, the coupling of the Photonis tubes to the PbF2
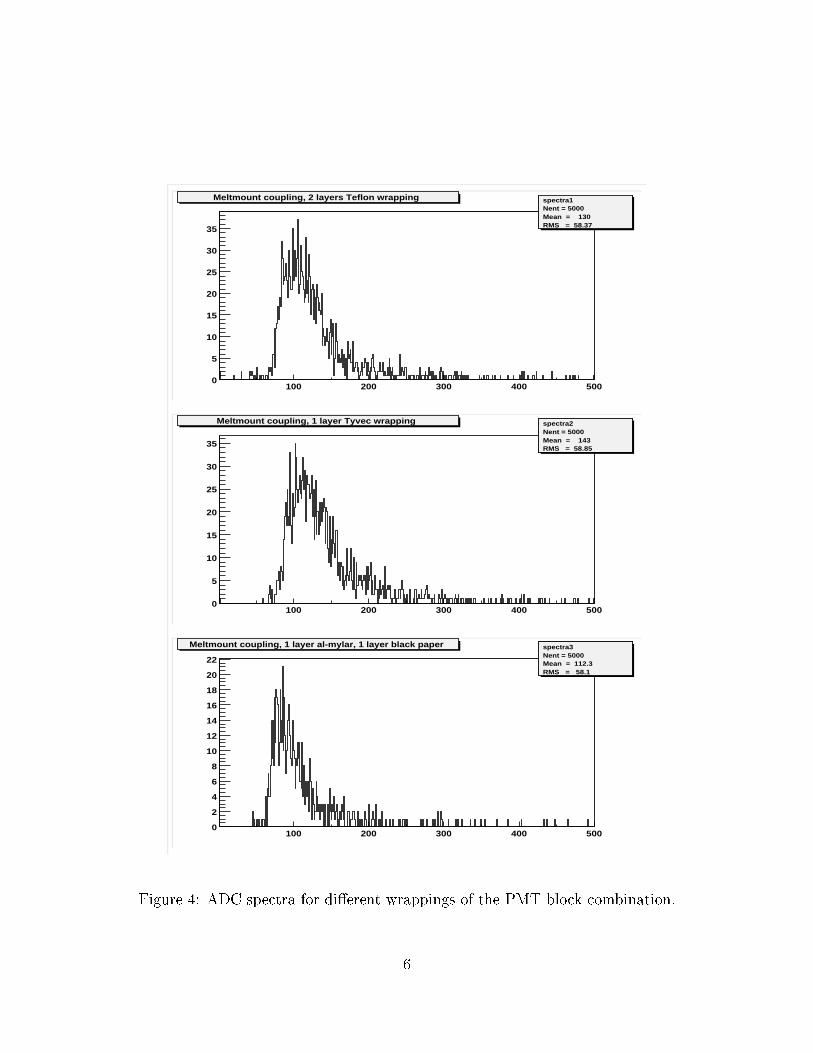
blocks for the test run was done with this glue.Next the e�ect of di�erent wrappings on the light collection was studied. The pmt-
block combination coupled with Meltmount was successively wrapped with Tyvec paper (80�m), two layers of Te on tape (50 �m) and one layer of aluminized mylar wrapped withone layer of black paper (together 100 �m). The results of two hour cosmic runs with eachof the di�erent wrappings are shown in Fig. 4. In this case, wrapping with aluminizedmylar yielded the lowest ADC response, followed by the te on wrapping and lastly Tyvecwrapping with the highest response. From this test it was decided to wrap the blocks in thetest calorimeter with Tyvec paper, of envelope grade and thickness. A layer of black paper
2
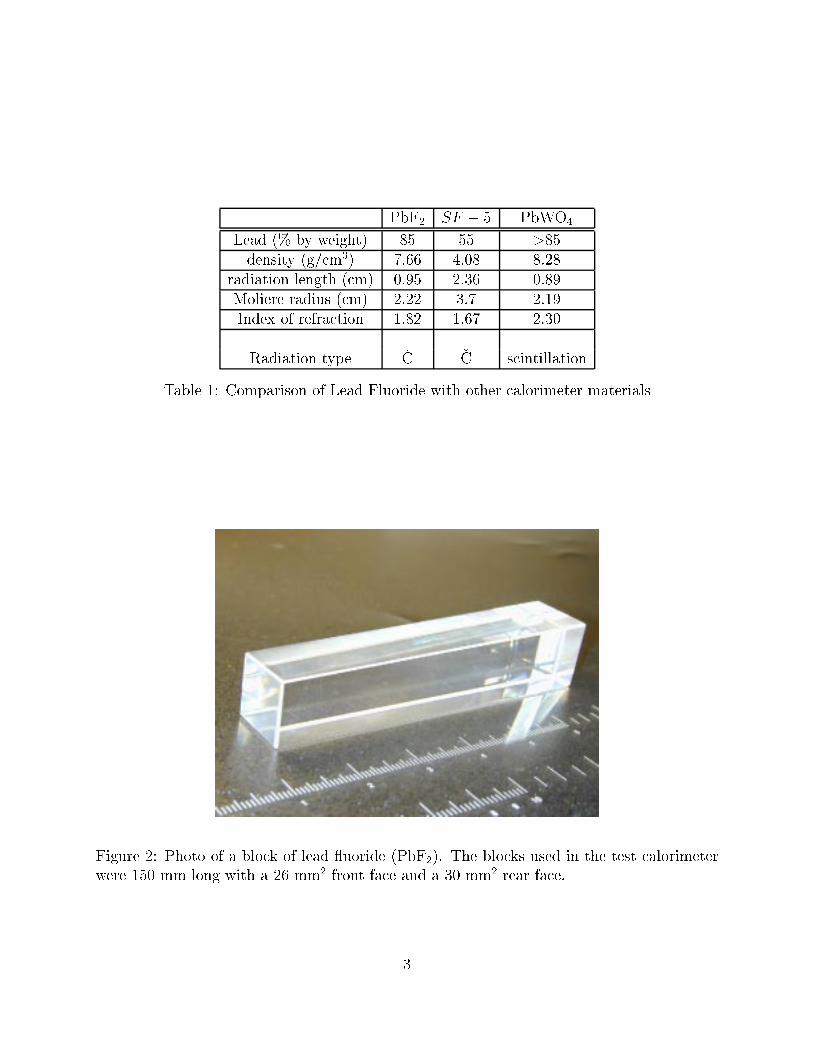
PbF2 SF � 5 PbWO4
Lead (% by weight) 85 55 >85density (g/cm3) 7.66 4.08 8.28
radiation length (cm) 0.95 2.36 0.89Moliere radius (cm) 2.22 3.7 2.19Index of refraction 1.82 1.67 2.30
Radiation type �C �C scintillation
Table 1: Comparison of Lead Fluoride with other calorimeter materials
Figure 2: Photo of a block of lead uoride (PbF2). The blocks used in the test calorimeterwere 150 mm long with a 26 mm2 front face and a 30 mm2 rear face.
3
100 200 300 400 5000
5
10
15
20
25
30
35
spectra2Nent = 5000 Mean = 143RMS = 58.85
Meltmount coupling, 1 layer Tyvec wrapping spectra2Nent = 5000 Mean = 143RMS = 58.85
100 200 300 400 5000
5
10
15
20
25
30
spectra4Nent = 5000 Mean = 150.4RMS = 60.99
UV 9-20318-LV glue coupling, 1 layer Tyvec wrapping spectra4Nent = 5000 Mean = 150.4RMS = 60.99
100 200 300 400 5000
5
10
15
20
25
spectra5Nent = 5000 Mean = 187.3RMS = 75.85
UV OP-19 glue coupling, 1 layer Tyvec wrapping spectra5Nent = 5000 Mean = 187.3RMS = 75.85
Figure 3: ADC spectra for di�erent glue couplings of the PMT-block combination.
4
was also added to the test calorimeter blocks to make sure they were light-tight. The �nalblock+pmt assembly for the test run is seen in Fig. 5.
Before the calorimeter was put into the focal plane, a rough gain matching betweenthe blocks was performed using a blue LED. The LED was placed on the front of each blockand the ADC response was recorded as a function of high voltage on the PMT. For two ofthe blocks, this calibration was found to be about 7% o� once the calorimeter was installedin the focal plane, while the high-voltage for the rest of the calorimeter blocks was withinabout 2% of the calibrated value. The change was probably caused by mis-positioning ormis-alignment of the LED during the initial calibration where the LED was placed manuallyon the face of each block.
3 Beam Test
The calorimeter (and a subset of the DVCS proton array detectors) was tested with beamMarch 3-6, 2002. The calorimeter was placed in the left HRS detector stack, in the usualposition of the gas �Cerenkov (i.e. between S1 and S2). S0 was in the detector stack,positioned before S1. Several triggers were available during the calorimeter testing: T1 wasthe OR of the 9 calorimeter blocks, T3 was the AND of the two S0 PMTs, T4 was the ANDof S0 and S1, T5 was the AND of T1 and T3 and T8 was a 1024 Hz pulser.
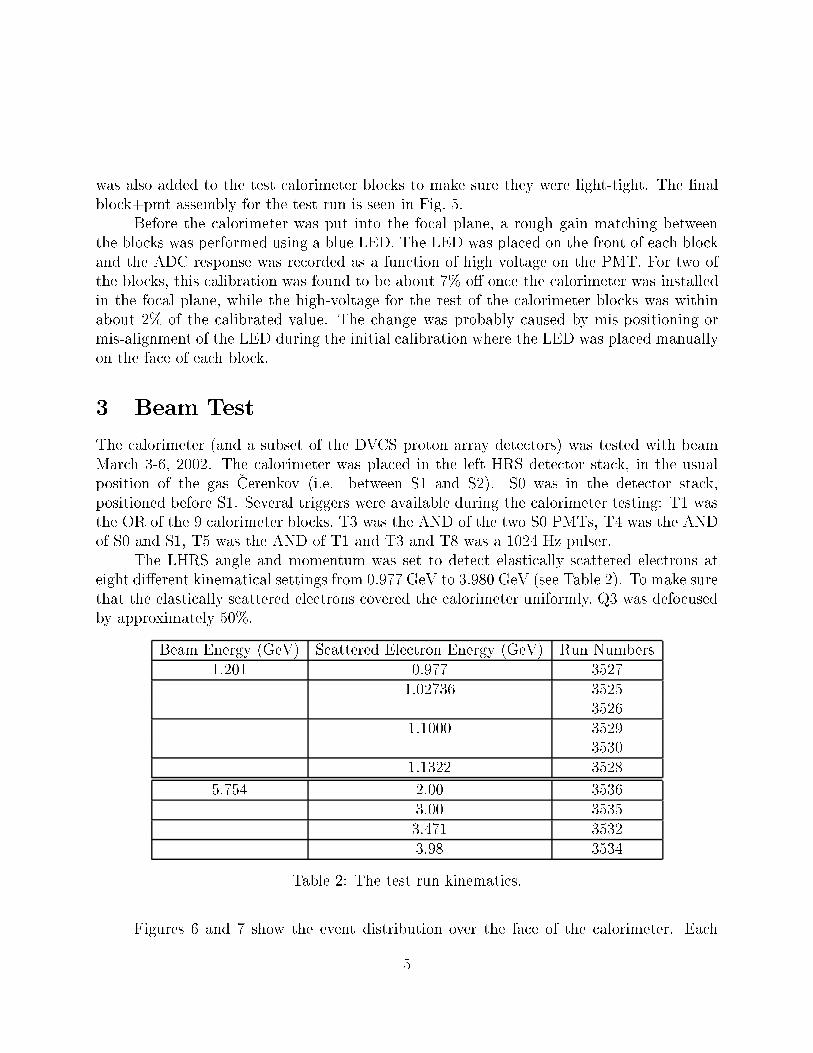
The LHRS angle and momentum was set to detect elastically scattered electrons ateight di�erent kinematical settings from 0.977 GeV to 3.980 GeV (see Table 2). To make surethat the elastically scattered electrons covered the calorimeter uniformly, Q3 was defocusedby approximately 50%.
Beam Energy (GeV) Scattered Electron Energy (GeV) Run Numbers1.201 0.977 3527
1.02736 35253526
1.1000 35293530
1.1322 3528
5.754 2.00 35363.00 35353.471 35323.98 3534
Table 2: The test run kinematics.
Figures 6 and 7 show the event distribution over the face of the calorimeter. Each
5
100 200 300 400 5000
5
10
15
20
25
30
35
spectra1Nent = 5000 Mean = 130RMS = 58.37
Meltmount coupling, 2 layers Teflon wrapping spectra1Nent = 5000 Mean = 130RMS = 58.37
100 200 300 400 5000
5
10
15
20
25
30
35
spectra2Nent = 5000 Mean = 143RMS = 58.85
Meltmount coupling, 1 layer Tyvec wrapping spectra2Nent = 5000 Mean = 143RMS = 58.85
100 200 300 400 5000
2
4
6
8
10
12
14
16
18
20
22
spectra3Nent = 5000 Mean = 112.3RMS = 58.1
Meltmount coupling, 1 layer al-mylar, 1 layer black paper spectra3Nent = 5000 Mean = 112.3RMS = 58.1
Figure 4: ADC spectra for di�erent wrappings of the PMT-block combination.
6
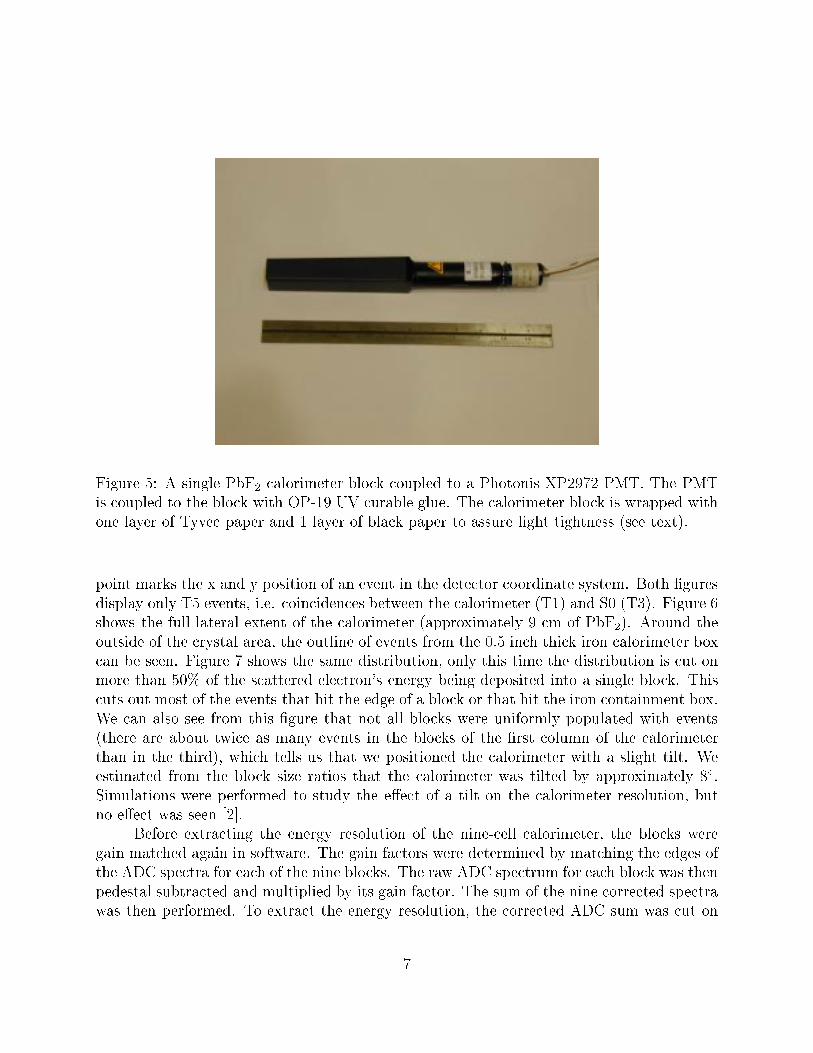
Figure 5: A single PbF2 calorimeter block coupled to a Photonis XP2972 PMT. The PMTis coupled to the block with OP-19 UV curable glue. The calorimeter block is wrapped withone layer of Tyvec paper and 1 layer of black paper to assure light tightness (see text).
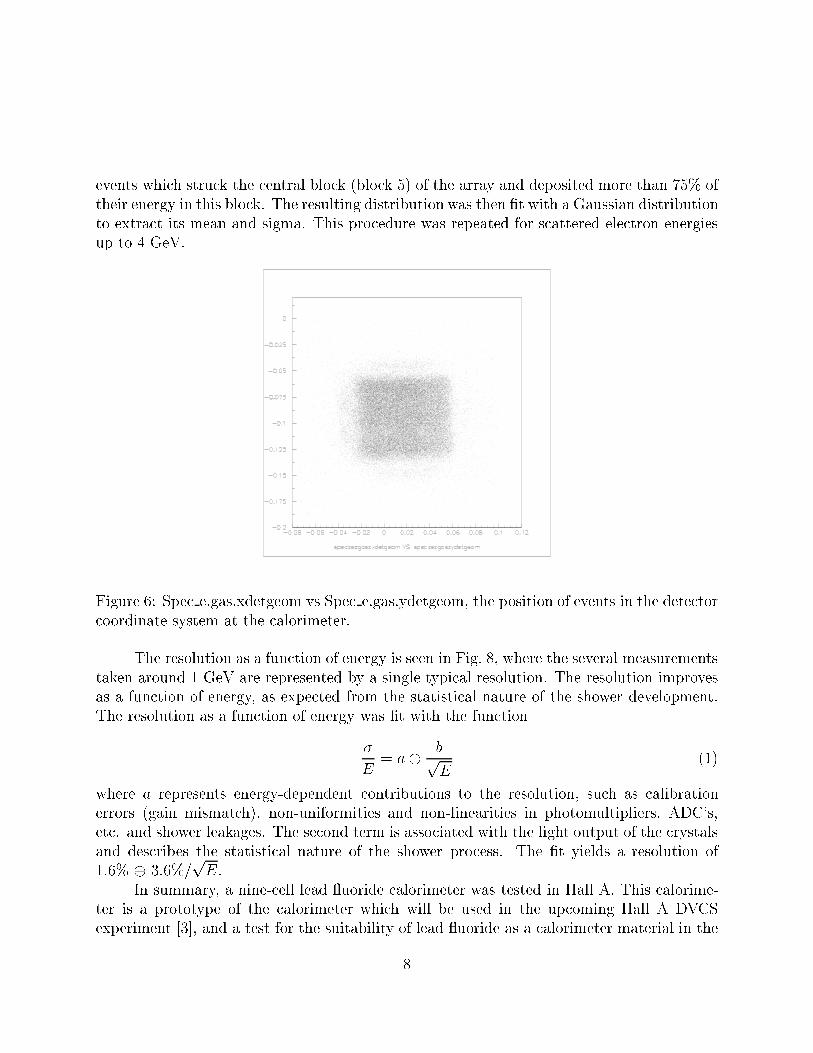
point marks the x and y position of an event in the detector coordinate system. Both �guresdisplay only T5 events, i.e. coincidences between the calorimeter (T1) and S0 (T3). Figure 6shows the full lateral extent of the calorimeter (approximately 9 cm of PbF2). Around theoutside of the crystal area, the outline of events from the 0.5 inch thick iron calorimeter boxcan be seen. Figure 7 shows the same distribution, only this time the distribution is cut onmore than 50% of the scattered electron's energy being deposited into a single block. Thiscuts out most of the events that hit the edge of a block or that hit the iron containment box.We can also see from this �gure that not all blocks were uniformly populated with events(there are about twice as many events in the blocks of the �rst column of the calorimeterthan in the third), which tells us that we positioned the calorimeter with a slight tilt. Weestimated from the block size ratios that the calorimeter was tilted by approximately 8Æ.Simulations were performed to study the e�ect of a tilt on the calorimeter resolution, butno e�ect was seen [2].
Before extracting the energy resolution of the nine-cell calorimeter, the blocks weregain matched again in software. The gain factors were determined by matching the edges ofthe ADC spectra for each of the nine blocks. The raw ADC spectrum for each block was thenpedestal subtracted and multiplied by its gain factor. The sum of the nine corrected spectrawas then performed. To extract the energy resolution, the corrected ADC sum was cut on
7
events which struck the central block (block 5) of the array and deposited more than 75% oftheir energy in this block. The resulting distribution was then �t with a Gaussian distributionto extract its mean and sigma. This procedure was repeated for scattered electron energiesup to 4 GeV.
Figure 6: Spec e.gas.xdetgeom vs Spec e.gas.ydetgeom, the position of events in the detectorcoordinate system at the calorimeter.
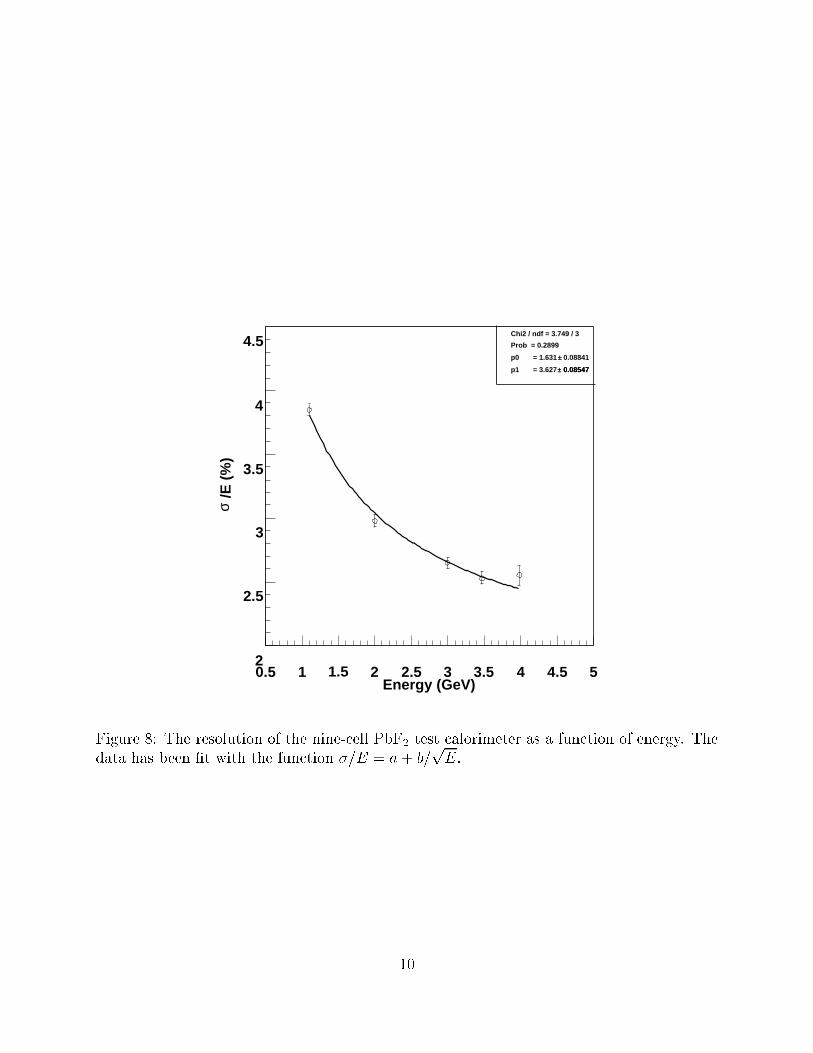
The resolution as a function of energy is seen in Fig. 8, where the several measurementstaken around 1 GeV are represented by a single typical resolution. The resolution improvesas a function of energy, as expected from the statistical nature of the shower development.The resolution as a function of energy was �t with the function
�
E= a� bp
E(1)
where a represents energy-dependent contributions to the resolution, such as calibrationerrors (gain mismatch), non-uniformities and non-linearities in photomultipliers, ADC's,etc. and shower leakages. The second term is associated with the light output of the crystalsand describes the statistical nature of the shower process. The �t yields a resolution of1.6% � 3.6%/
pE.
In summary, a nine-cell lead uoride calorimeter was tested in Hall A. This calorime-ter is a prototype of the calorimeter which will be used in the upcoming Hall A DVCSexperiment [3], and a test for the suitability of lead uoride as a calorimeter material in the
8
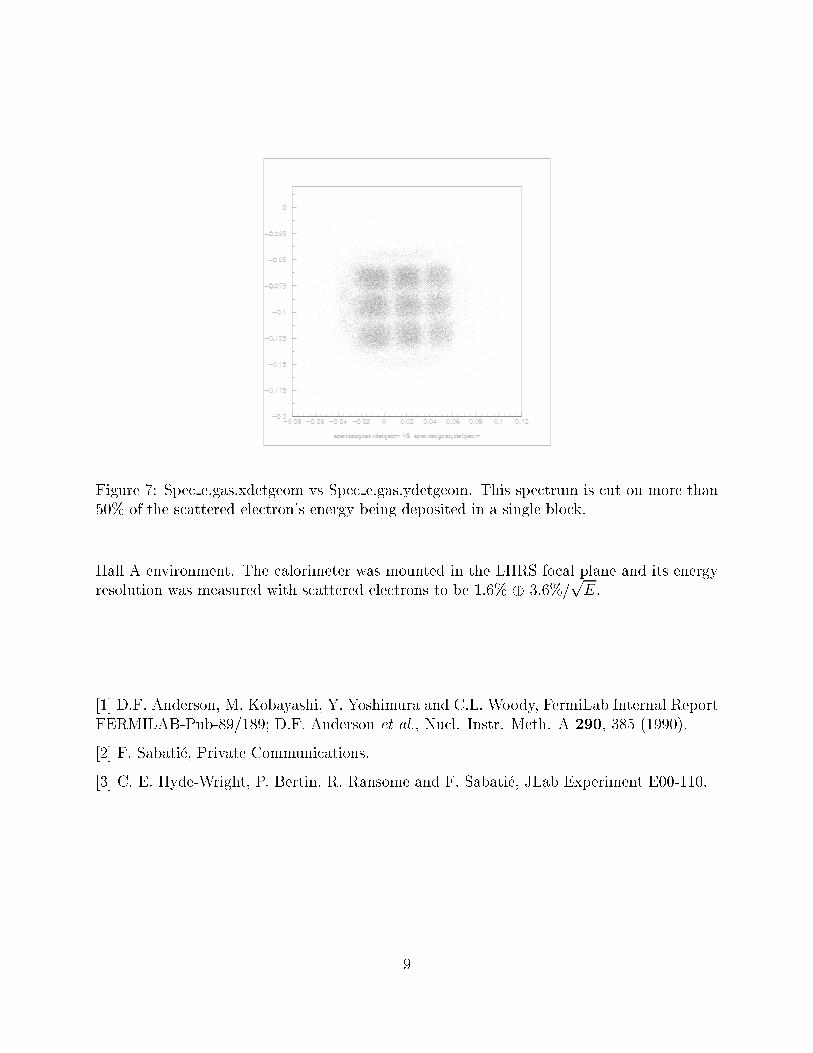
Figure 7: Spec e.gas.xdetgeom vs Spec e.gas.ydetgeom. This spectrum is cut on more than50% of the scattered electron's energy being deposited in a single block.
Hall A environment. The calorimeter was mounted in the LHRS focal plane and its energyresolution was measured with scattered electrons to be 1.6% � 3.6%/
pE.
[1] D.F. Anderson, M. Kobayashi, Y. Yoshimura and C.L. Woody, FermiLab Internal ReportFERMILAB-Pub-89/189; D.F. Anderson et al., Nucl. Instr. Meth. A 290, 385 (1990).
[2] F. Sabati�e, Private Communications.
[3] C. E. Hyde-Wright, P. Bertin, R. Ransome and F. Sabati�e, JLab Experiment E00-110.
9
Energy (GeV)0.5 1 1.5 2 2.5 3 3.5 4 4.5 5
/E (
%)
σ
2
2.5
3
3.5
4
4.5Chi2 / ndf = 3.749 / 3
Prob = 0.2899
0.08841 ±p0 = 1.631
0.08547 ±p1 = 3.627
±
0.08547 ±
Figure 8: The resolution of the nine-cell PbF2 test calorimeter as a function of energy. Thedata has been �t with the function �=E = a + b=
pE.
10