Embed Size (px)
Citation preview

PBPK Modeling and Simulations of Oral Drug Absorption/Food Effect/PPI /PBIVIVC:
Opportunities and ChallengesDissolution and Translational Modeling Strategies Enabling Patient-Centric Product Development
University of Maryland's Center of Excellence in Regulatory Science and Innovation (M‐CERSI)May 15th - May 17th 2017
www.pharmacy.umaryland.edu/dissolution2017
Tycho Heimbach, Marc Laisney, Tanay Samant, Mohamed Elmeliegy, Fan Wu, Imad Hanna, Wen Lin, Jin Zhang, Stefanie Dodd, Anh-Thu Nguyen-Trung, Hung Tian, Barbara Vogg, Stefania Beato, Sudhakar Garad, Somesh Choudhury, Xiao Ren, Martin Mueller-Zsigmondy, Heidi Einolf, Kenichi Umehara, Florence Hourcade-Potelleret, Handan He
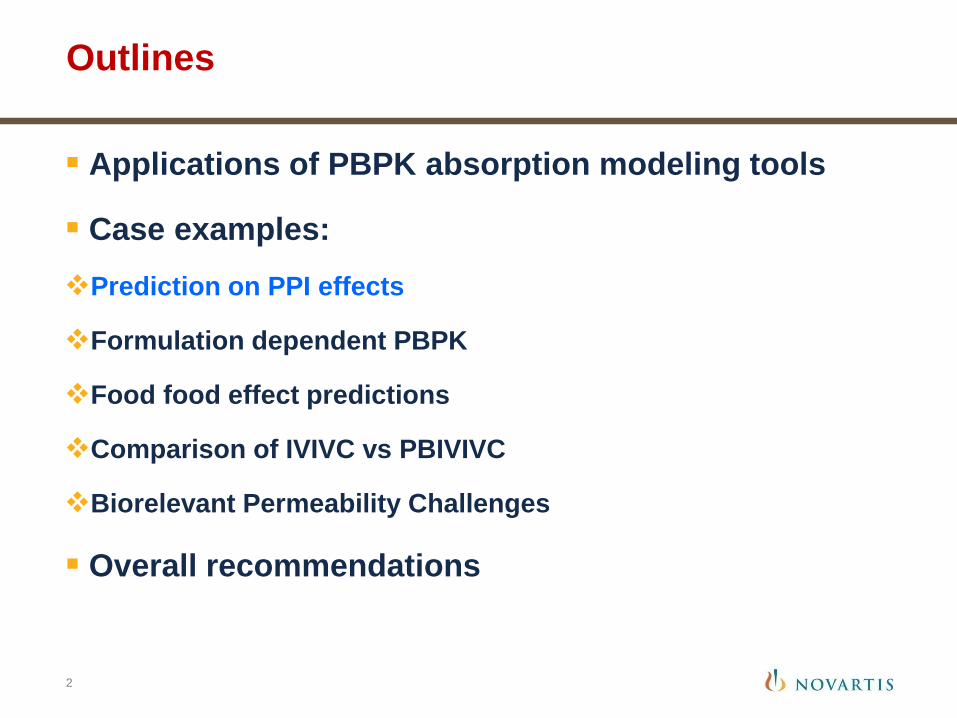
Outlines
Applications of PBPK absorption modeling tools
Case examples: Prediction on PPI effects
Formulation dependent PBPK
Food food effect predictions
Comparison of IVIVC vs PBIVIVC
Biorelevant Permeability Challenges
Overall recommendations
2

PBPK, Translational Biopharmaceutics
Dissolution Profile
Multiple pH?
Biorelevant Solubility
Drug Substance’ Formulation Solubility,
pKa, etc.
PrecipitationTime
Caco-2 or MDCK Papp
GI transporter
Jmax, Km
Biorelevant Permeability
Adsorption/Recovery
In vitro-In vivo
Scaling
PBPK G+ Absorption
ModelDog -> Human
Human -> Human
SolubilityBile salt conc.In vivo solubilityPrecipitation rate
Permeability:Log P,
Inhibition of Efflux or Uptake Transporters
Fasted/Fed
Systemic PK (CL, Vd),
PBPK Model
Predicted Effect
B(DD)CS II
Low ConfidenceB(DD)CS IV
B(DD)CS I
Discovery BCS/
BDDCSClass
GI physiology:Population
Stomach pH?Stomachemptying time?Intestinal pH
GI blood flow
3
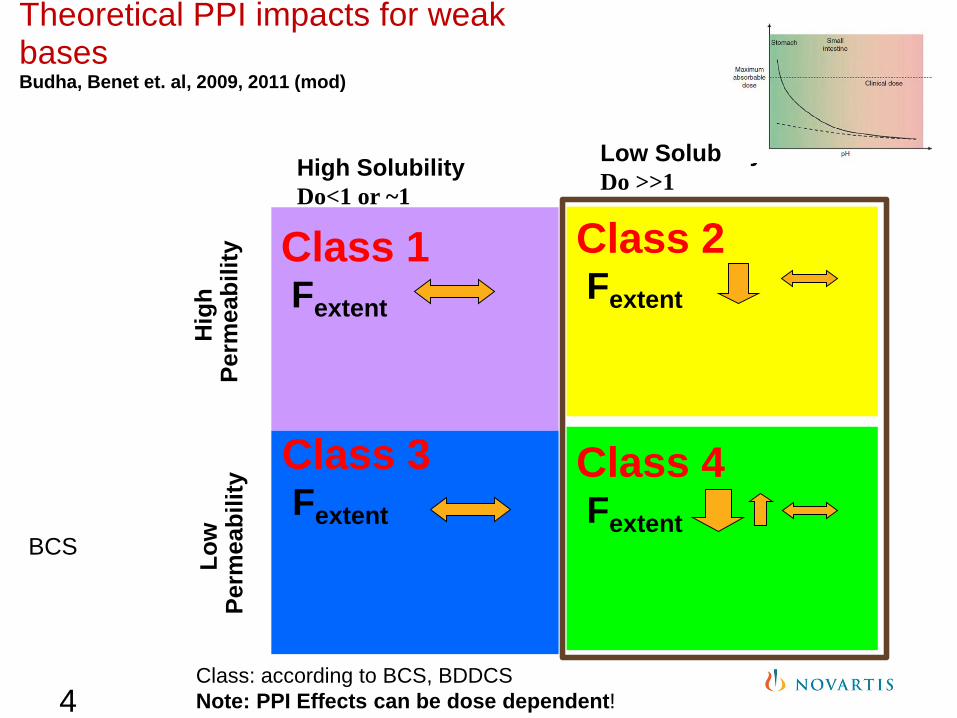
Class 2Fextent
High SolubilityDo<1 or ~1
Low SolubilityDo >>1
Hig
h Pe
rmea
bilit
yLo
w
Perm
eabi
lity
Class 1Fextent
Class 3Fextent
Class 4Fextent
Theoretical PPI impacts for weakbasesBudha, Benet et. al, 2009, 2011 (mod)
Class: according to BCS, BDDCSNote: PPI Effects can be dose dependent!
BCS
4

Successful PBPK models on PPI prediction and Label lmpact
Farydak has pH dependent solubility (BCS II). However, solubility is relatively high.
Q: Will Proton Pump Inhibitors (PPI) impact Farydak Exposure?
Should a Clinical PPI study be run?
5
http://www.accessdata.fda.gov/scripts/cder/drugsatfda/index.cfmhttp://www.accessdata.fda.gov/drugsatfda_docs/nda/2015/205353Orig1s000TOC.cfm
Public domain:
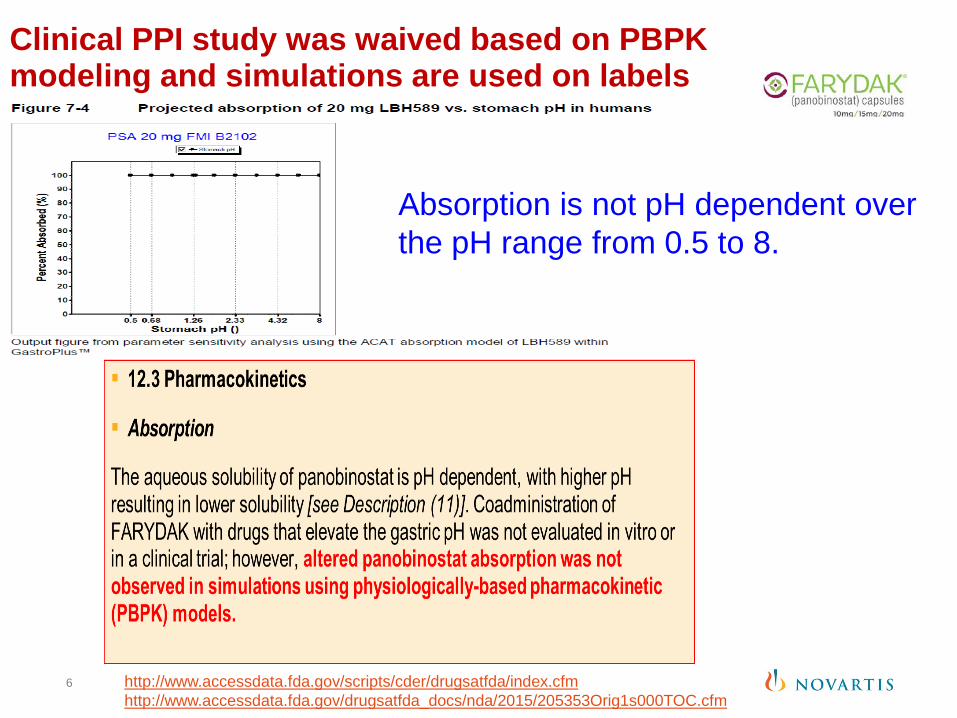
Clinical PPI study was waived based on PBPK modeling and simulations are used on labels
6
Absorption is not pH dependent over the pH range from 0.5 to 8.
http://www.accessdata.fda.gov/scripts/cder/drugsatfda/index.cfmhttp://www.accessdata.fda.gov/drugsatfda_docs/nda/2015/205353Orig1s000TOC.cfm

Outline
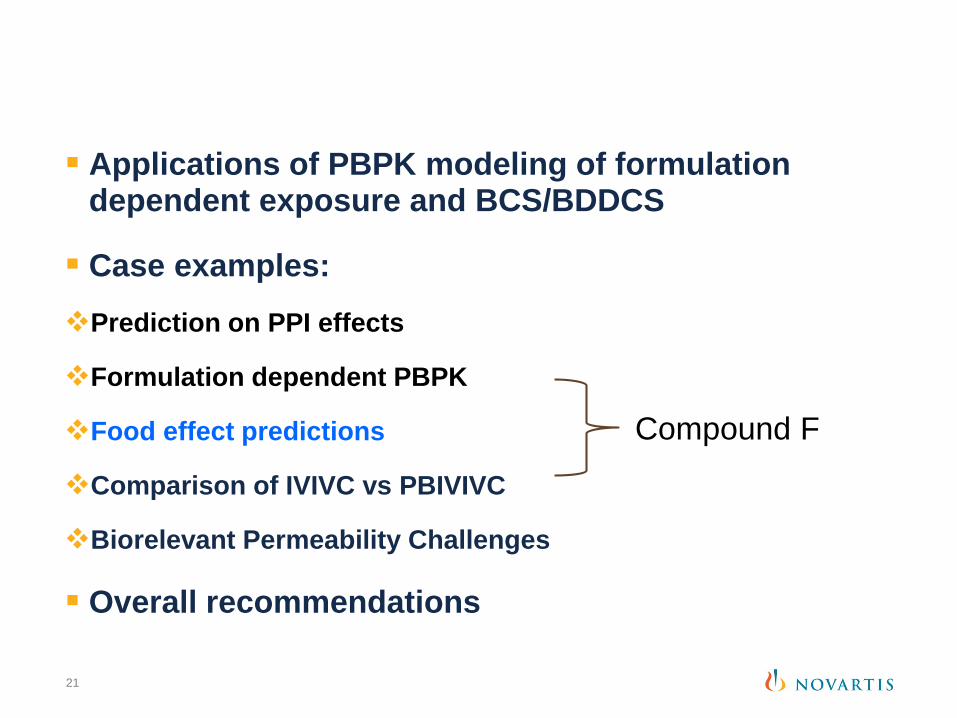
Applications of PBPK modeling of formulation dependent exposure and BCS/BDDCS
Case examples: Prediction on PPI effects
Formulation dependent PBPK
Food effect predictions
Comparison of IVIVC vs PBIVIVC
Biorelevant Permeability Challenges
Overall recommendations
7
Compound E

Compound E Absorption Modeling Modeling objectives
1. To assess BE equivalence/in-equivalence a priori knowing in vitro dissolution differences between early human CSF (capsule) and late development FMI (tablet)
Q: Will FMI formulation be equivalent to CSF?
2. To assess impact of stomach pH on Compound E absorption(e.g. possible effect of co-administered PPI)
Q: Will GI pH impact the extent of absorption?
8

In vitro dataNo significant change in solubility with pH in bio-relevant media
Slight pH-dependent solubility observed• High solubility at low pH (>2.4 mg/mL at pH 2 and 4.5)• ~3-fold decrease in solubility at pH 6.8 (0.8 mg/mL)• Solubility in bio-relevant media (FaSSIF) at pH 6.5 is equivalent to solubility at
lower pH
Solvent pH Solubility at 37°C (mg/mL)a
HCl/KCl buffer 2.0 > 2.4 mg/mLAcetate buffer 4.5 > 2.4 mg/mL
Phosphate buffer 6.8 0.8 mg/mLPhosphate buffer 7.5 0.3 mg/mL
FaSSIF 6.5 > 2.4 mg/mLFeSSIF 5.0 > 2.2 mg/mL
a

pH-Dependent Solubility
10
Low Clinical Relevance of pH-Dependent Solubility based on Low Dose Number
Drug(Max Dose)
pKa Solubility pH-dependent solubility
BCS / BDDCSclass
Dose number (max dose/250mL / lowest solubility)
Clinical relevance (AUC / Cmax)
Dasatinib(100 mg)
3.1, 6.8, 10.8
18 mg/mL at pH 2.6 to <0.001 mg/mL at pH 7.0 at 24 °C
Yes II 560 43% / 42%
Nilotinib(400 mg)
2.1, 5.4 Slightly soluble (1–10 mg/mL) at pH 1.0, very slightly soluble (0.1–1 mg/mL) in water, at pH 2.0 and pH 3.0, and practically insoluble (<0.1 mg/mL) in buffer solutions of pH ≥ 4.5
Yes IV / II 160 34% / 27%
Axitinib(5 mg)
4.8 Solubility decreases from 1.8 mg/mL at pH 1.1 to 0.0002 mg/mL at 7.8
Probably not clinically applicable
II 100 15% / 40%
Imatinib(400 mg)
7.7 Freely soluble (100–1,000 mg/mL) up to pH 5.5, the solubility reduces at higher pH; lowest solubility 1 mg/mL
Yes II 1.6 No effect
Everolimus(10 mg)
NA Solubility in aqueous media is <0.01% (0.1 mg/mL) across the pH range 2–10
No III / I 0.4 No study conducted
Ceritinib(750 mg)
4.1, 9.7 Highly soluble at pH 1 (11.9 mg/mL) and 2 (5.5 mg/mL); solubility decreases to 0.01 mg/mL at pH 6.0
Yes IV 1000 76% / 79%
Palbociclib(125 mg)
NA Slightly soluble (1.135 mg/mL) at pH 1 and 1.205 mg/mL at pH 4. Solubility decreases to 0.026 mg/mL at pH 6.8
Yes NA 19.23 62% / 80% (Fasted)13% / 41% (Fed)
Comp. E 5.5, 8.6 Highly soluble at pH 2.0 and 4.5; solubilitydecreases to 0.8 mg/mL at pH 6.8
Yes IV 3-8 Unknown(Expected to below based on dose number)
Adapted from Budha et al., (2012) CPT 92(2):203-213. Palbociclib solubility data obtained from Sandoz.

PBPK Absorption Model
11

Z-factor dissolution (Takano) Enable to consider the change of Compound E drug
product dissolution rate vs pH during the drug transitin the gut
12
Z-factor vs pH for capsule Z-factor vs pH for tablets

PBPK model built in GastroPlus™ PK was fitted with a 2 comp model using PKPlus
• default gut physiology for humans at fasted state (Human – Physiological – Fasted) and the Absorption Scaling Factors (ASF) model named OptlogD Model SA/V 6.1
• Johnson dissolution model
13
Fitting with2 comp model Optimization of Vc and K12 to improve the fit
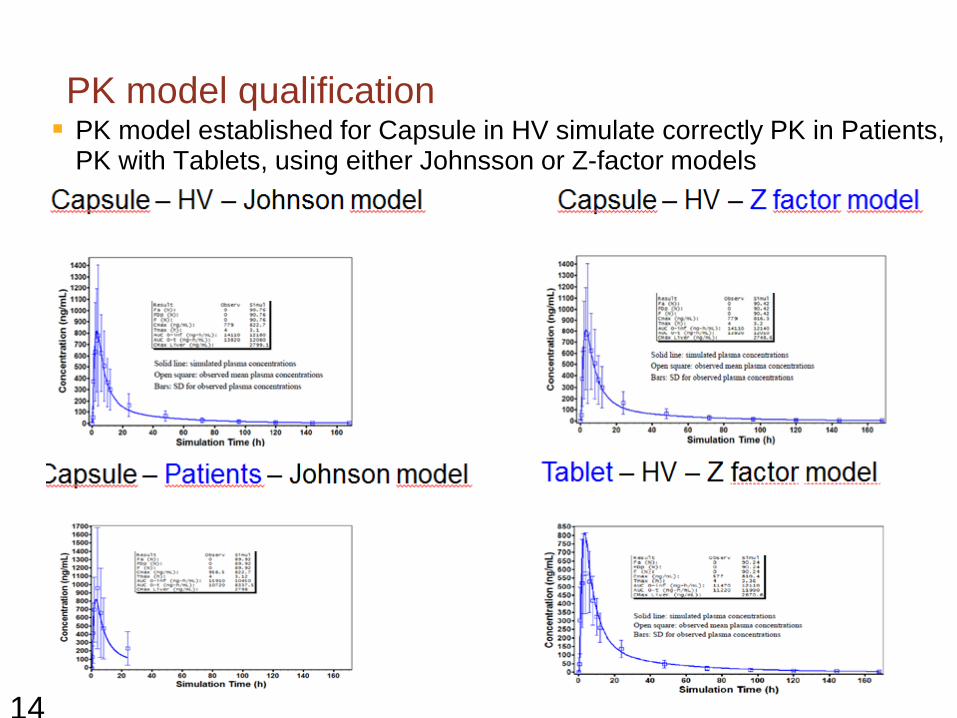
PK model qualification PK model established for Capsule in HV simulate correctly PK in Patients,
PK with Tablets, using either Johnsson or Z-factor models
14

Absorption Kinetics – Diagnostic Plots
15
Dissolution controlled or permeability controlled?
Compound E: permeability-controlled absorption
• Example: dissolution-controlled absorption
Dissolution
Absorption
DissolutionAbsorption
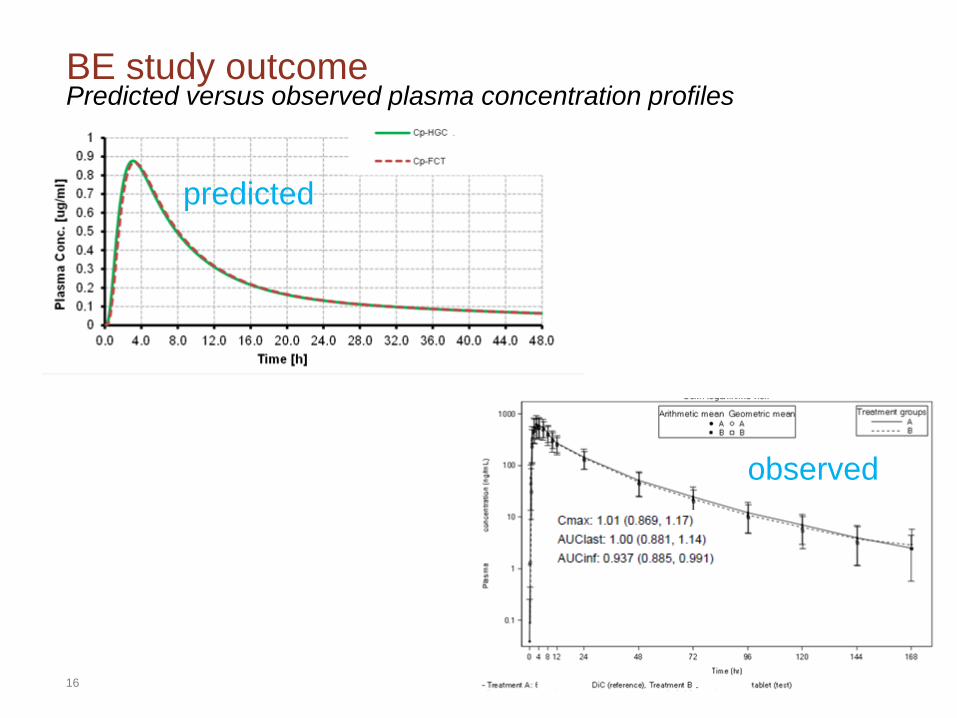
BE study outcome
16
Predicted versus observed plasma concentration profiles
observed
predicted

Change of stomach pH has no impact on drug absorption(rate and extent)
Consequently, no predicted effect on PK
PBPK PSAInfluence of stomach pH on Compound E absorption
17
GastroPlus SimCYP
Stomach pH Stomach pHFrac
tion
abso
rbed
(% d
ose)
Frac
tion
abso
rbed
(% d
ose)

PK model qualification PK model established for Capsule in HV simulate correctly PK in Patients,
PK with Tablets, using either Johnsson or Z-factor models
18
Model ofinterest toPredictFood effect

Prediction of Food effect, Compound ESimulation Fasted State Simulation Fed State
High and similar solubility measured in FaSSIFv1 and FeSSIFv1

Prediction of Food effect, Compound E
20
Food Effect prediction
Cmax (ng/mL)
AUC0-168h (ng.h/mL)
Fasted 823.23 12090Fed 764.29 12130% change -7 0.3
It was predicted that Food would not affect PK, with:- Only slight decrease on Cmax- No change in AUC0-168h
Compound E showed no clinicallysignificant food effect
Applications of PBPK modeling of formulation dependent exposure and BCS/BDDCS
Case examples: Prediction on PPI effects
Formulation dependent PBPK
Food effect predictions
Comparison of IVIVC vs PBIVIVC
Biorelevant Permeability Challenges
Overall recommendations
21
Compound F

Compound F - Food Effect
High Solubility, > 10 mg/mL, Do < 1
High Absorption > 80%, F > 80%, Fa > 80%• Caco-2 low, no pgp involvement
High Metabolism – mainly metabolized
Rat BDDCS I• No biliary excretion (Rat)
No Adsorption/complexation issues
Q: Can Food effect be predicted?
No Food effect expected – Predictable Outcome!

Predicted vs Observed Food Effect, BCS I Drug in Human
FaSSIFpH 6.5 solubility 3.6 mg/ml
FeSSIFpH 5 solubility 4.2 mg/ml
Food Effect Can be predicted via ACAT model23 | Heimbach, He
fedFasted

BCS I: Predicted vs Observed Food Effect in Human
0
100
200
300
400
500
600
0 2 4 6 8 10 12 14 16 18 20 22 24
Plas
ma
Conc
entr
atio
n (n
g/m
l)
Time (h)
Observed fastedObserved fedPredicted fastedPredicted fed
Human Fed PK
Human observed Fasted PK
Predict
ParameterFED Vs FASTED
Geometricmean ratio
90% CI
Cmax (ng/mL)
AUC(0-t)
(ng.hr/mL)AUC0-∞ (ng.hr/mL)
0.81
0.89
0.90
0.75, 0.87
0.85, 0.94
0.86, 0.94

90% Probability
Human PBPK model
Fasted
Fed

Applications of PBPK modeling of formulation dependent exposure and BCS/BDDCS
Case examples: Prediction on PPI effects
Formulation dependent PBPK
Food effect predictions
Comparison of IVIVC vs PBIVIVC
Biorelevant Permeability Challenges
Overall recommendations
26 |Handan He AAPS 2016
Compound NVS6

PBPK model for immediately release vs. slow release vs. fast release
Cmax ng/mL AUC0-24hng.h/mL
F%
IR 3280 8060 100FR (fast ER) 1350 5340 66SR (slow ER) 715 3860 46
PB-IVIVC example NVS6 (BCS I): PK predictions in dogs by PB-IVIVC
IR FR
IR FR SR
AAPS 2016

PB-IVIVC example NVS6: In vitro and in vivo dissolution profiles in dogs
HPMC (fast and slow release)
water, baskets @ 50 rpm
0
20
40
60
80
100
0 4 8 12 16 20 24Hours
Pe
rc
en
t R
ele
as
ed
100mg "slow" HPMC
200mg "slow" HPMC
100 mg "fast"HPMC
200 mg "fast"HPMC
100 mg IR
Dissolution In vivo Dog PK
IRFast
slow
1
10
100
1000
10000
0 2 4 6 8
IRfast MR
slow MR
Slow
IRFast
AAPS 2016

PB-IVIVC example NVS6: Regional absorption by PB-IVIVC
Reginal absorption: Immediately release vs. slow release vs. fast release
Immediately release Fast release
Slow releaseUpper GI absorption
vs.Lower GI absorption
Conclusion: Slow release showed more colonic absorption
29 AAPS 2016

PB-IVIVC example NVS6: Comparisons of conventional IVIVC vs PB-IVIVC
|Handan He AAPS 2016
PB-IVIVC showed better prediction compared to conventional IVIVC
30
Conventional IVIVC
Conventional IVIVC PB-IVIVC
AAPS 2016
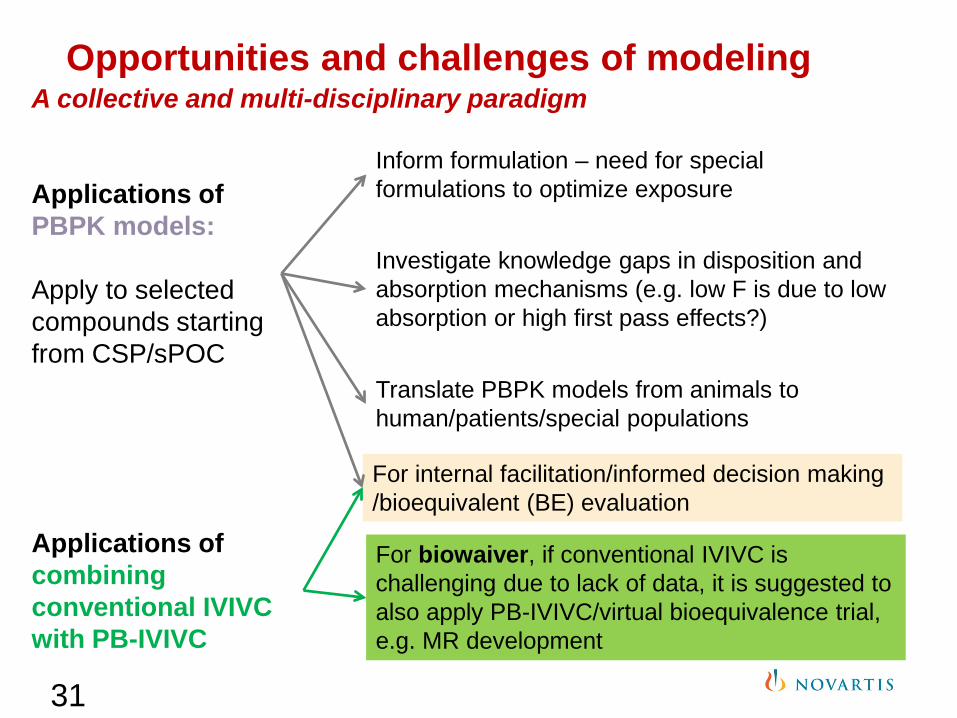
Opportunities and challenges of modeling
Inform formulation – need for special formulations to optimize exposure
Investigate knowledge gaps in disposition and absorption mechanisms (e.g. low F is due to low absorption or high first pass effects?)
Translate PBPK models from animals to human/patients/special populations
For internal facilitation/informed decision making /bioequivalent (BE) evaluation
For biowaiver, if conventional IVIVC is challenging due to lack of data, it is suggested to also apply PB-IVIVC/virtual bioequivalence trial, e.g. MR development
A collective and multi-disciplinary paradigm
Applications of PBPK models:
Apply to selected compounds starting from CSP/sPOC
Applications of combining conventional IVIVC with PB-IVIVC
31

Applications of PBPK modeling of formulation dependent exposure and BCS/BDDCS
Case examples: Prediction on PPI effects
Formulation dependent PBPK
Food effect predictions
Comparison of IVIVC vs PBIVIVC
Biorelevant Permeability Challenges
Overall recommendations
32 |Handan He AAPS 2016
Drug U, Compound X

Biorelevant Permeability – Negative Food Effect Can Be Well Predicted Using PBPK Modeling
0
50
100
150
200
250
300
350
400
450
500
0 12 24 36 48 60 72 84 96 108 120
Sys
tem
ic C
once
ntra
tion
(ng/
mL)
Time (h)
Negative Food Effect in Human
Sim_FastedSim_FedObs_FedObs_Fasted
Fasted
Fed
Predicted Nonegative Food
Effect For FIH with Conventional Caco2 Papp!
=> incorrect!
PBPK model: Use Fed Papp= 1/8 Fasted
=> Reduced Drug U exposure described!
8 x lower PermeabilityCustom Caco-2 assay
Negative
Food effect
33 |Handan He AAPS 2016

Control FaSSIF FeSSIF
pH 6.5 Apical/pH 7.4 Basolateral
Incubation at 37°C, 3 hours
Absorptive permeability estimated as indicated below:Papp = ∆Q/(∆t×C0×Area)
HBSS: Hank’s-buffered salt solutionHSA: human serum albumin (non-specific binding reduction)SIF: simulated gastric fluid (lecitin, taurocholate, others)
Biorelevant PermeabilityModified from Dressman et al., (2000) EJPS, 11: S73-80
34
HBSS0.1% HSA
HBSS0.1% HSA
HBSS 0.1% HSA, 3.0 mM Taurocholate
0.75 mM Lecitin(pH 6.5)
HBSS0.1% HSA
HBSS 0.1% HSA, 15 mM Taurocholate
3.75 mM Lecitin(pH 5.0 →6.5)
HBSS0.1% HSA

Compound XPhysicochemical and BDDCS data
| Marbach Castle 201635
PropertyMelting point high
logP / logD6.8 > 4
Thermo. solubility [mg/mL]:pH 1pH 6.8pH 7.4
0.003n/a
Sim. fluids stability (8 h, 37°C) and solubility [mg/mL]:FassifFessif
Stable0.0090.262
Permeability:(1) log PAMPA.
ModPred. FA = 40 %
BCS, BDDCS Class II, IV
Compound XRat BDDCS 4 ~60% intact Fabs < 65%

Control FaSSIF FeSSIF
pH 6.5 Apical/pH 7.4 Basolateral
Incubation at 37°C, 3 hours
Absorptive permeability estimated as indicated below:Papp = ∆Q/(∆t×C0×Area)
HBSS: Hank’s-buffered salt solutionHSA: human serum albumin (non-specific binding reduction)SIF: simulated gastric fluid (lecitin, taurocholate, others)
Biorelevant PermeabilityModified from Dressman et al., (2000) EJPS, 11: S73-80
36
HBSS0.1% HSA
HBSS0.1% HSA
HBSS 0.1% HSA, 3.0 mM Taurocholate
0.75 mM Lecitin(pH 6.5)
HBSS0.1% HSA
HBSS 0.1% HSA, 15 mM Taurocholate
3.75 mM Lecitin(pH 5.0 →6.5)
HBSS0.1% HSA

Compounds in Biorelevant Permeability Assay
| Marbach Castle 201637
Assessment for micellar complexation
0 1 2 3 4 5 6 7 8 9 10 11 12 13 14 15
-FE Cpd x, 100 µM-FE Cpd x,75 µM-FE Cpd x, 50 µM-FE Cpd x, 25 µM- FE cpd 14, 11.6 µM- FE cpd, 13, 11.6 µM
- FE cpd 13, 26.6 µM
Compound 1
FaSSIF/FeSSIF ratio
Compound 3 Compound 4 Compound 5
Compound 8 Compound 9 Compound 10 Compound 11 Compound 12
-FE Cpd y, 15 -FE Cpd z, 16
Compound 2
Compound 6 Compound 7
Negative food effect possible
• Class IV compounds were tested at concentrations in the soluble range as unformulated API
• An arbitrary cut-off value of ~3 for the FaSSIF/FeSSIFpermeability ratio is proposed to differentiate compounds likely to experience negative food effects from non-susceptible ones

IDAS Biorelevant Flux Data, Compound X
| Marbach Castle 201638
Faster dissolution in fed state media, but permeation is low

39
Fasted Fed
• PBPK model utilized in vitro biorelevent permeability data • Negative food effect was simulated with reduced in vivo
permeability input
PBPK simulations food effect for Compound XUsing permeability difference of ~4-6 (FaSSIF vs. FeSSIF) in C2BBe1 cells
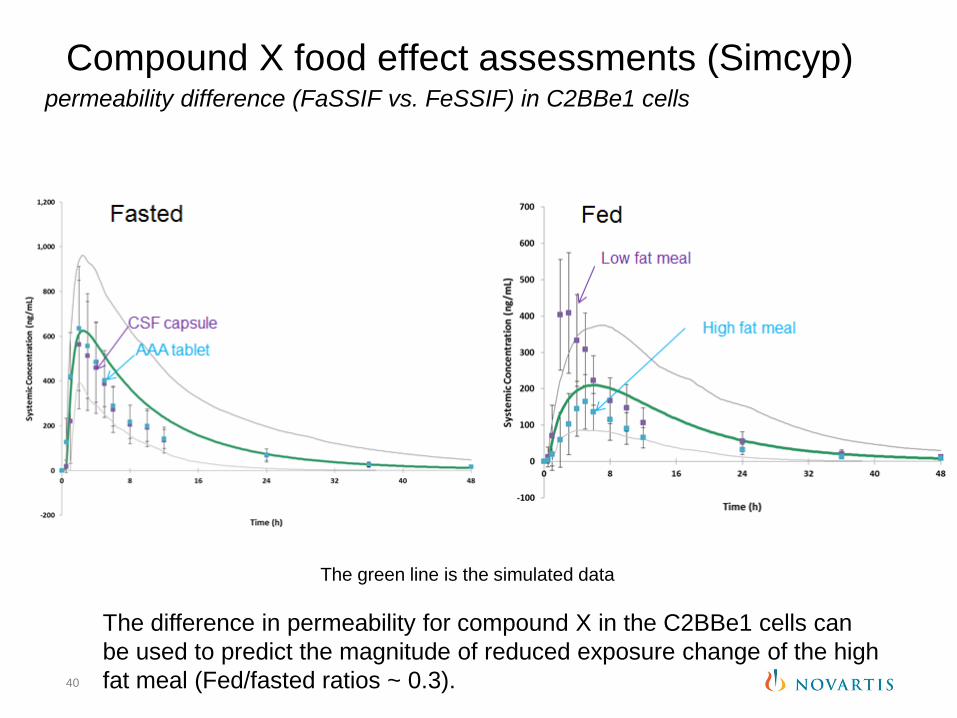
40
Compound X food effect assessments (Simcyp) permeability difference (FaSSIF vs. FeSSIF) in C2BBe1 cells
The green line is the simulated data
The difference in permeability for compound X in the C2BBe1 cells can be used to predict the magnitude of reduced exposure change of the high fat meal (Fed/fasted ratios ~ 0.3).

| Presentation Title | Presenter Name | Date | Subject | Business Use Only41
For PBPK absorption models, conduct PSA for critical parameters
Evaluate absorption kinetics diagnostic plots
Takano z-factor model allows multiple pH dissolution profile data and can be included in exposure predictions, when profiles are available
Food effect can be predicted for well characterized BCS/BDDCS I/II compounds, especially when human fasted date
Biorelevant Permeability with Fassif/Fessif can identify potential for potential bile acid complexation
Biorelevant Permeability, biorelevant solubility are important as PBPK inputs
42
Discussions Points
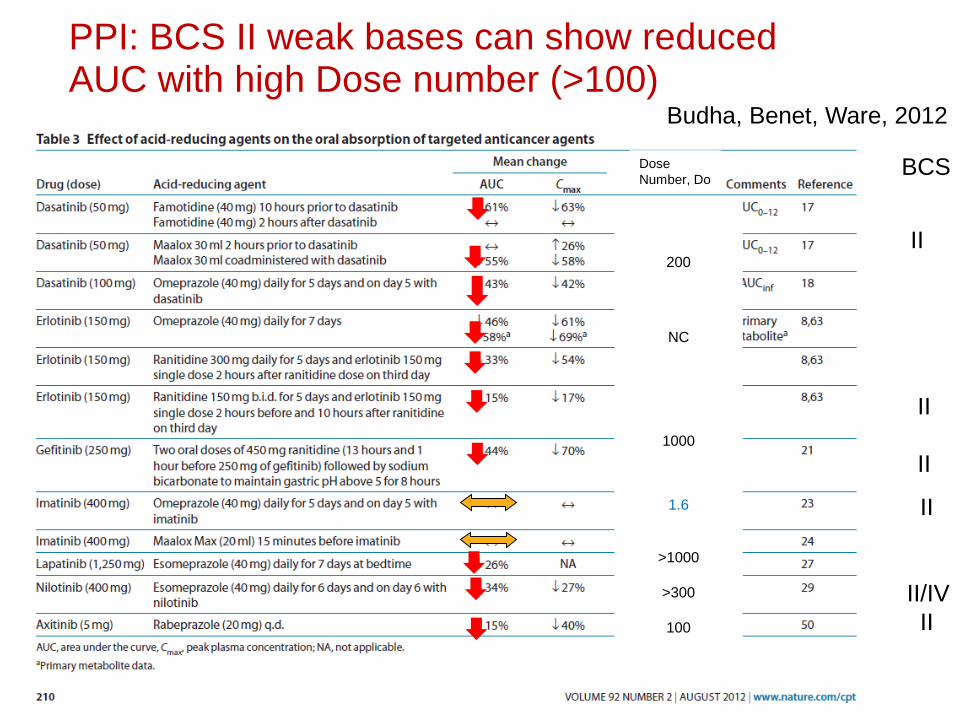
PPI: BCS II weak bases can show reduced AUC with high Dose number (>100)
BCS
II
II/IVII
II
II
II200
NC
1000
1.6
>1000
>300
100
DoseNumber, Do
Budha, Benet, Ware, 2012

44