Embed Size (px)
Citation preview
P.C.S. Traoré & al. © ICRISAT-IPR-IER-CIRAD-U. Florida, 2005WMO CLIMAG workshop, May 2005
In a theater near you…
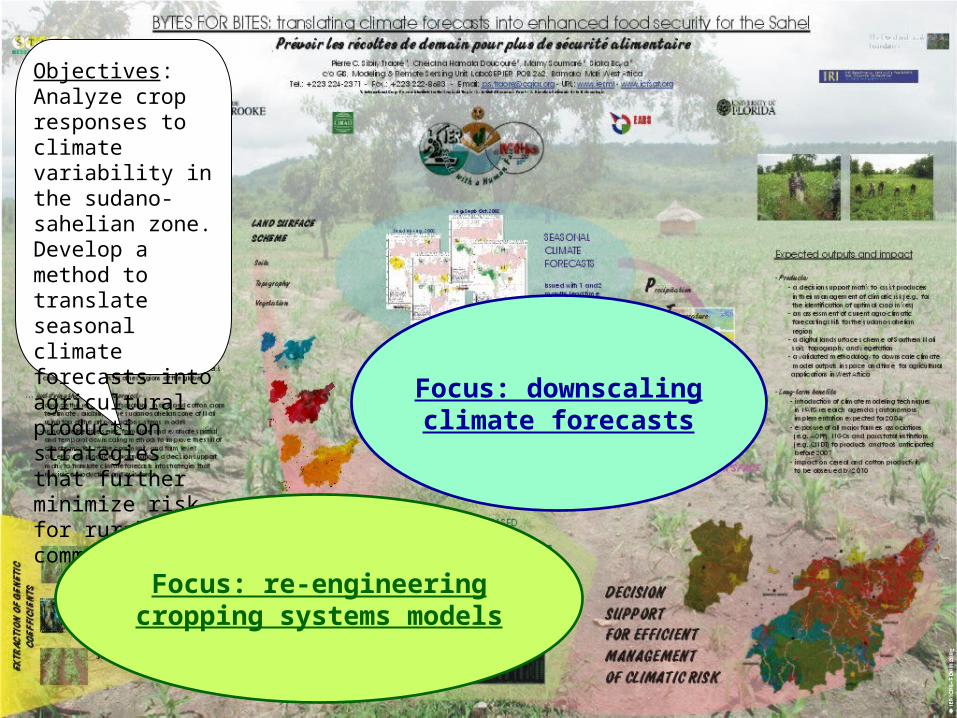
Objectives: Analyze crop responses to climate variability in the sudano-sahelian zone. Develop a method to translate seasonal climate forecasts into agricultural production strategies that further minimize risk for rural communities
Focus: downscalingclimate forecasts
Focus: re-engineeringcropping systems models
P.C.S. Traoré & al. © ICRISAT-IPR-IER-CIRAD-U. Florida, 2005WMO CLIMAG workshop, May 2005
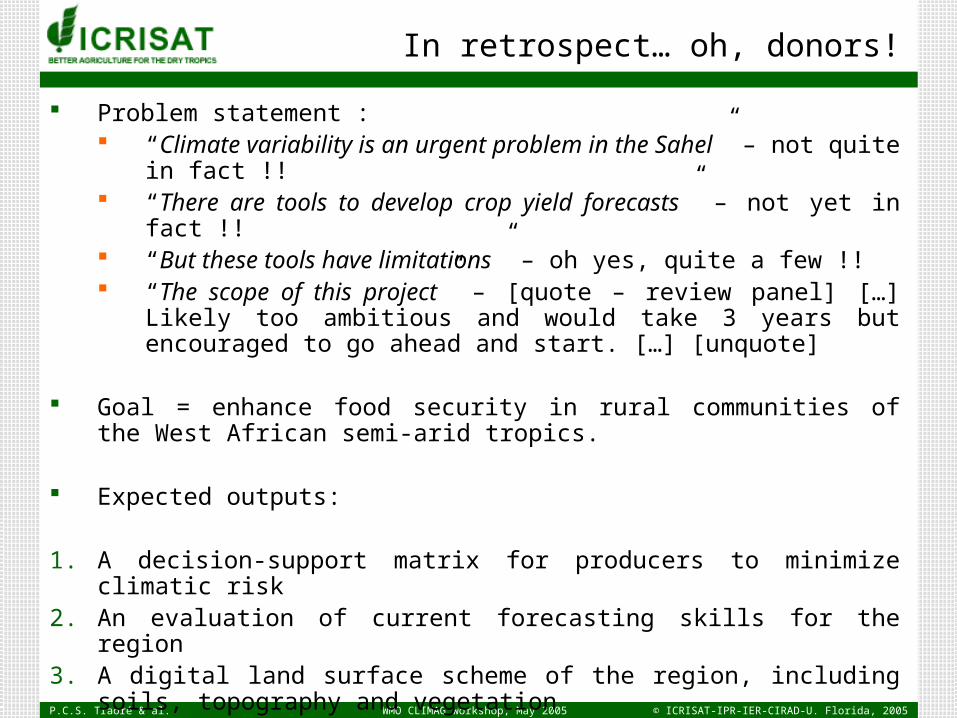
In retrospect… oh, donors!
Problem statement : “Climate variability is an urgent problem in the Sahel” – not quite in fact !! “There are tools to develop crop yield forecasts” – not yet in fact !! “But these tools have limitations” – oh yes, quite a few !! “The scope of this project” – [quote – review panel] […] Likely too ambitious and would
take 3 years but encouraged to go ahead and start. […] [unquote]
Goal = enhance food security in rural communities of the West African semi-arid tropics.
Expected outputs:
1. A decision-support matrix for producers to minimize climatic risk2. An evaluation of current forecasting skills for the region3. A digital land surface scheme of the region, including soils, topography and vegetation4. A method to downscale and apply climate forecasts to identify production options in sudano-
sahelian agriculture.
Sahel = another buzzword promoted by climate science?
P.C.S. Traoré & al. © ICRISAT-IPR-IER-CIRAD-U. Florida, 2005WMO CLIMAG workshop, May 2005
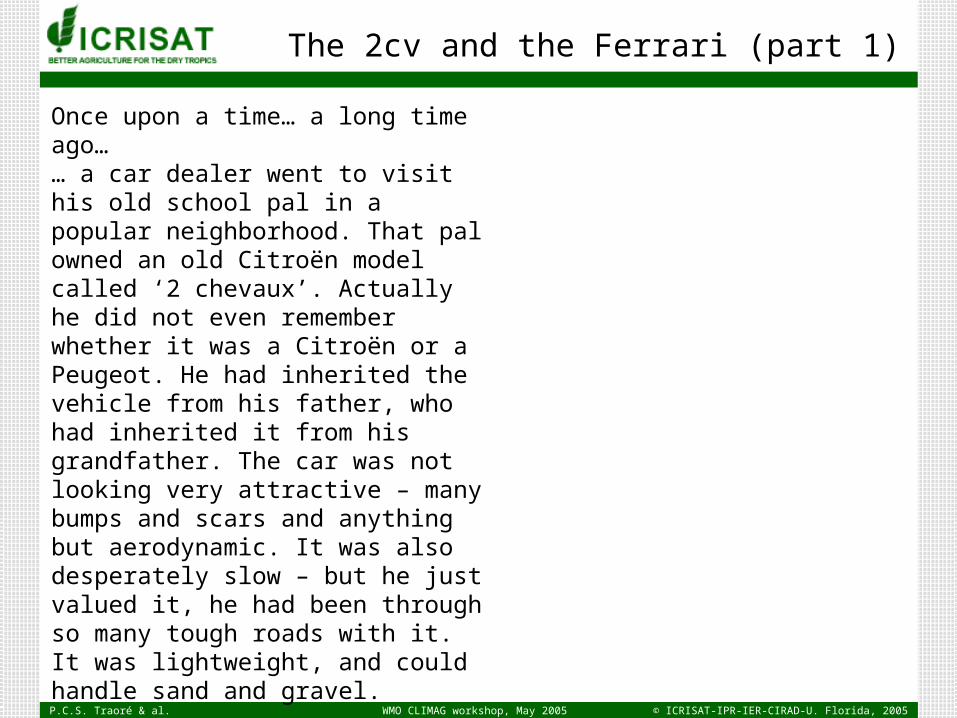
The 2cv and the Ferrari (part 1)
Once upon a time… a long time ago…… a car dealer went to visit his old school pal in a popular neighborhood. That pal owned an old Citroën model called ‘2 chevaux’. Actually he did not even remember whether it was a Citroën or a Peugeot. He had inherited the vehicle from his father, who had inherited it from his grandfather. The car was not looking very attractive – many bumps and scars and anything but aerodynamic. It was also desperately slow – but he just valued it, he had been through so many tough roads with it. It was lightweight, and could handle sand and gravel.
The car dealer was determined to help his friend experience more comfort, more speed, more exhilaration, even more security. Actually, he was committed to changing his friend’s life. He was (maybe unconsciously) motivated by the prospect of a pay rise promised by his boss if he could secure a quick sale.
P.C.S. Traoré & al. © ICRISAT-IPR-IER-CIRAD-U. Florida, 2005WMO CLIMAG workshop, May 2005
The 2cv and the Ferrari (part 2)
So said the car dealer: “Look at this Ferrari Testarossa… there has not been any car like this one for years: it can reach 200mph within seconds, yet it is non-polluting. It can make you the most admired man in town!”
The neighbor was visibly impressed. So he asked his friend – “can I have a free ride?” “Sure”, replied the car dealer (he knew that in a competitive economy there was no such thing as consumer’s confidence).
The same day the friend tried the car. The test occurred at a period when executives in the country were less concerned about the nation’s communication infrastructure, its economy and more about their own political future. Potholes proved the car was too low, spare parts were too scarce, and the Ferrari Testarossa eventually ran out of gas…
P.C.S. Traoré & al. © ICRISAT-IPR-IER-CIRAD-U. Florida, 2005WMO CLIMAG workshop, May 2005
The 2cv and the Ferrari revisited (part 1)
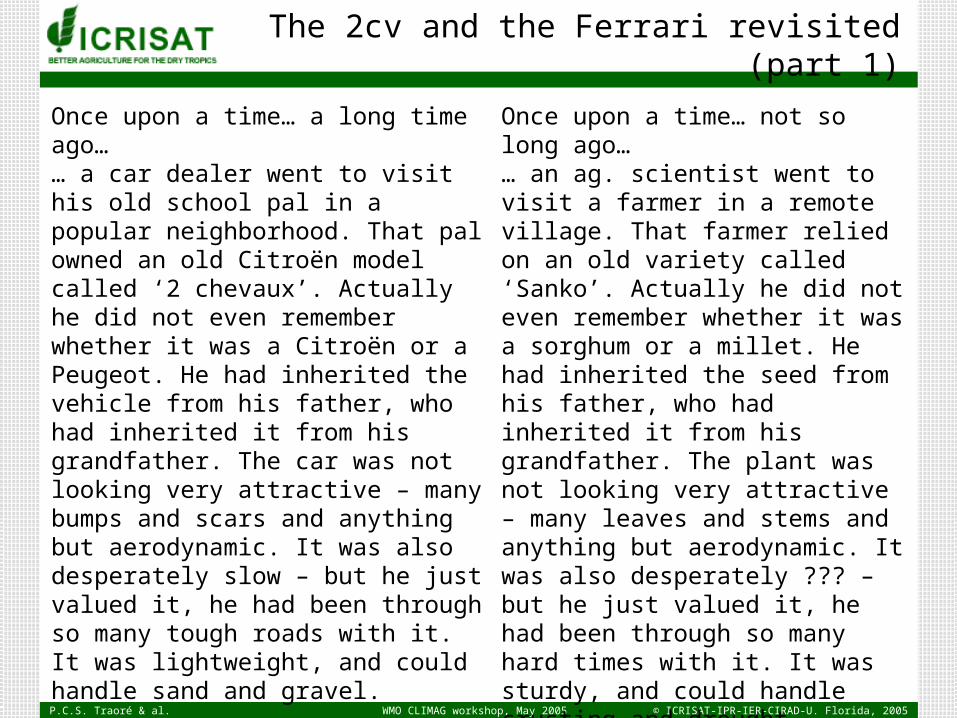
Once upon a time… a long time ago…… a car dealer went to visit his old school pal in a popular neighborhood. That pal owned an old Citroën model called ‘2 chevaux’. Actually he did not even remember whether it was a Citroën or a Peugeot. He had inherited the vehicle from his father, who had inherited it from his grandfather. The car was not looking very attractive – many bumps and scars and anything but aerodynamic. It was also desperately slow – but he just valued it, he had been through so many tough roads with it. It was lightweight, and could handle sand and gravel.
The car dealer was determined to help his friend experience more comfort, more speed, more exhilaration, even more security. Actually, he was committed to changing his friend’s life. He was (maybe unconsciously) motivated by the prospect of a pay rise promised by his boss if he could secure a quick sale.
Once upon a time… not so long ago…… an ag. scientist went to visit a farmer in a remote village. That farmer relied on an old variety called ‘Sanko’. Actually he did not even remember whether it was a sorghum or a millet. He had inherited the seed from his father, who had inherited it from his grandfather. The plant was not looking very attractive – many leaves and stems and anything but aerodynamic. It was also desperately ??? – but he just valued it, he had been through so many hard times with it. It was sturdy, and could handle crusting and drought.
The scientist was determined to help the farmer experience more nutrients, more yield, more satiety, all in all more food security. Actually, he was committed to changing the farmer’s life. He was (maybe unconsciously) motivated by the prospect of a grant proposed by a donor if he could write an encouraging report.
P.C.S. Traoré & al. © ICRISAT-IPR-IER-CIRAD-U. Florida, 2005WMO CLIMAG workshop, May 2005
The 2cv and the Ferrari revisited (part 2)
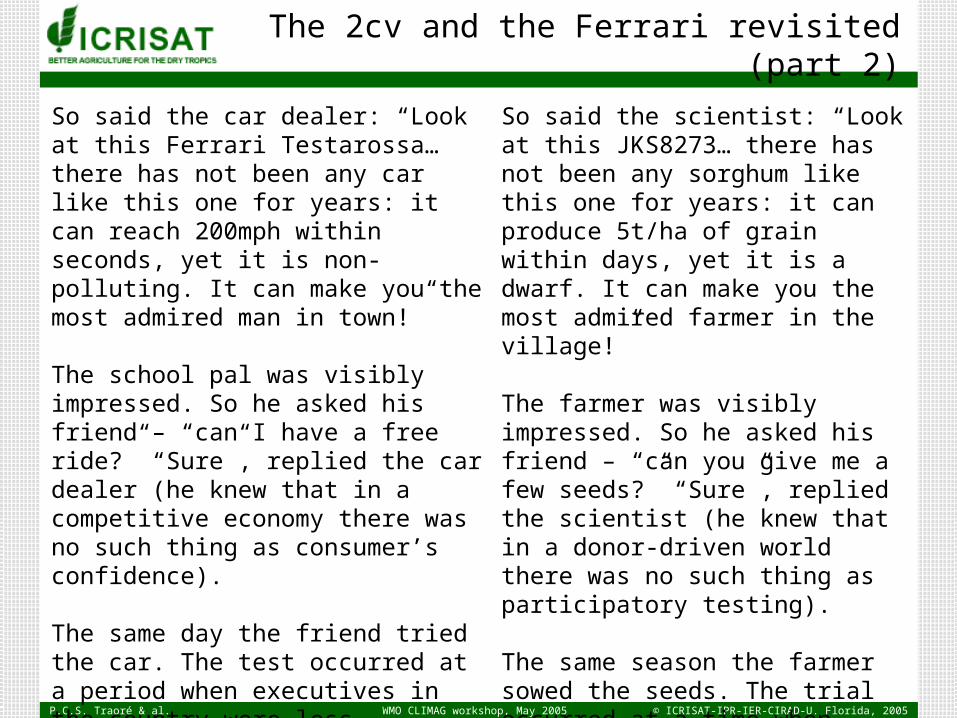
So said the car dealer: “Look at this Ferrari Testarossa… there has not been any car like this one for years: it can reach 200mph within seconds, yet it is non-polluting. It can make you the most admired man in town!”
The school pal was visibly impressed. So he asked his friend – “can I have a free ride?” “Sure”, replied the car dealer (he knew that in a competitive economy there was no such thing as consumer’s confidence).
The same day the friend tried the car. The test occurred at a period when executives in the country were less concerned about the nation’s communication infrastructure, its economy and more about their own political future. The Ferrari Testarossa soon ran out of (expensive) gas. By then potholes had proved the car was too low, spare parts were too scarce, and rust took good care of the remaining
So said the scientist: “Look at this JKS8273… there has not been any sorghum like this one for years: it can produce 5t/ha of grain within days, yet it is a dwarf. It can make you the most admired farmer in the village!”
The farmer was visibly impressed. So he asked his friend – “can you give me a few seeds?” “Sure”, replied the scientist (he knew that in a donor-driven world there was no such thing as participatory testing).
The same season the farmer sowed the seeds. The trial occurred at a time when climate modelers had forgotten about demand-driven research, agricultural applications and were heavily involved in data crunching. JKS8273 soon suffered from water shortage. Later birds proved the plant was too early, as alternate feed was too scarce, and grain mold took good care of remaining panicles…

P.C.S. Traoré & al. © ICRISAT-IPR-IER-CIRAD-U. Florida, 2005WMO CLIMAG workshop, May 2005
Croprotation21st Century XXX Oops !!Corporation presents…
P.C.S. Traoré & al. © ICRISAT-IPR-IER-CIRAD-U. Florida, 2005WMO CLIMAG workshop, May 2005
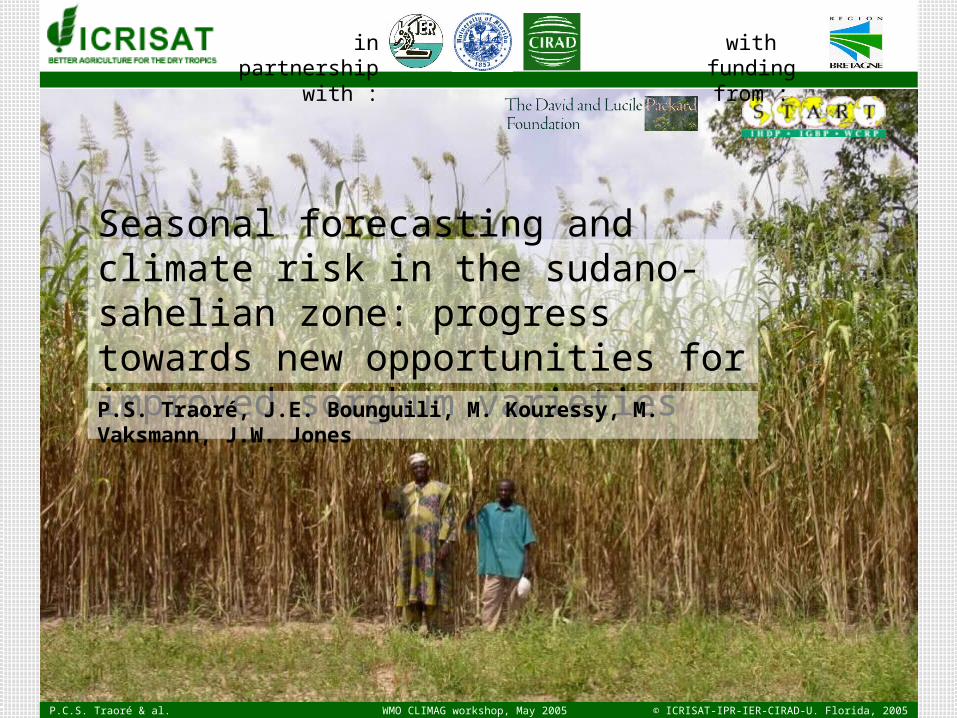
Seasonal forecasting and climate risk in the sudano-sahelian zone: progress towards new opportunities for improved sorghum varietiesP.S. Traoré, J.E. Bounguili, M. Kouressy, M. Vaksmann, J.W. Jones
in partnership with : with funding from :
P.C.S. Traoré & al. © ICRISAT-IPR-IER-CIRAD-U. Florida, 2005WMO CLIMAG workshop, May 2005
Outline
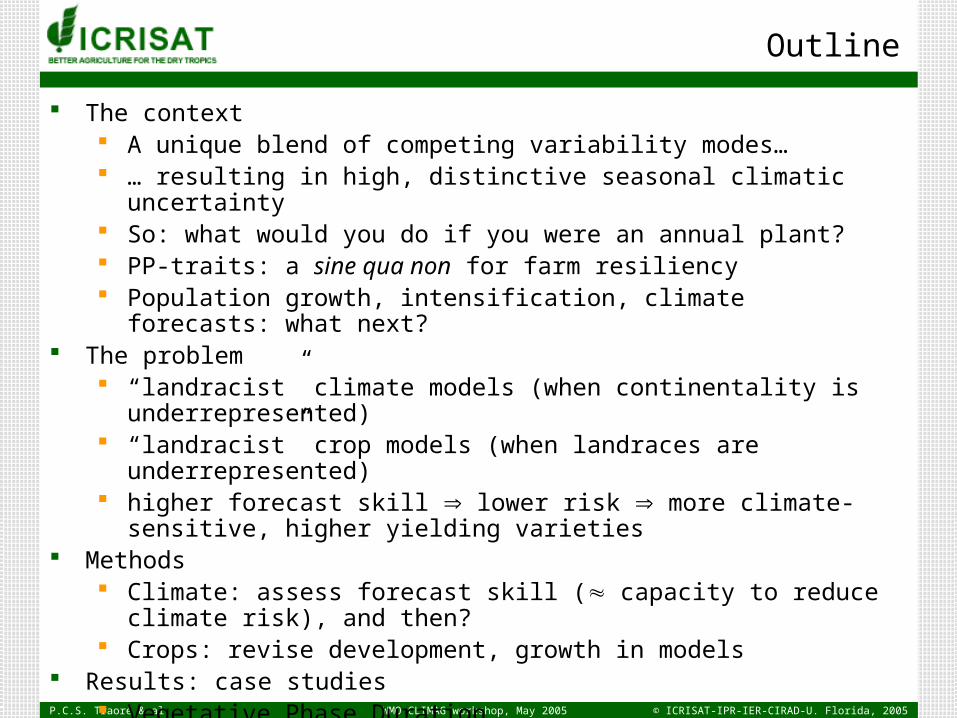
The context A unique blend of competing variability modes… … resulting in high, distinctive seasonal climatic uncertainty So: what would you do if you were an annual plant? PP-traits: a sine qua non for farm resiliency Population growth, intensification, climate forecasts: what next?
The problem “landracist” climate models (when continentality is underrepresented) “landracist” crop models (when landraces are underrepresented) higher forecast skill lower risk more climate-sensitive, higher yielding varieties
Methods Climate: assess forecast skill ( capacity to reduce climate risk), and then? Crops: revise development, growth in models
Results: case studies Vegetative Phase Duration Biomass Production
Discussion: advances, challenges and the way forward

P.C.S. Traoré & al. © ICRISAT-IPR-IER-CIRAD-U. Florida, 2005WMO CLIMAG workshop, May 2005
The context
P.C.S. Traoré & al. © ICRISAT-IPR-IER-CIRAD-U. Florida, 2005WMO CLIMAG workshop, May 2005
Climate: what is different about West Africa?
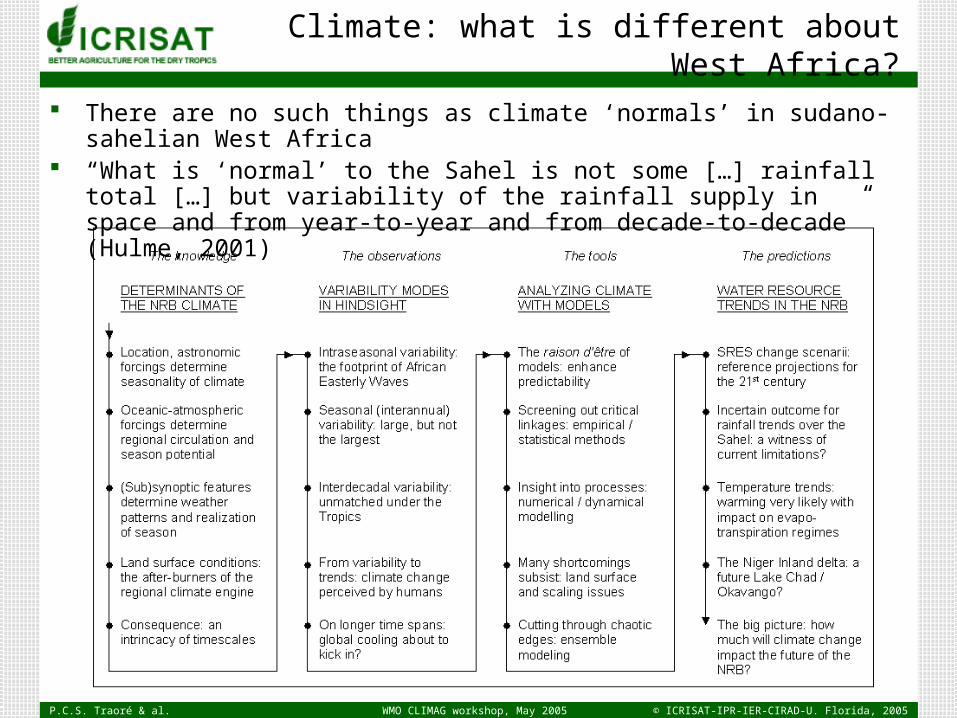
There are no such things as climate ‘normals’ in sudano-sahelian West Africa “What is ‘normal’ to the Sahel is not some […] rainfall total […] but variability of the rainfall
supply in space and from year-to-year and from decade-to-decade” (Hulme, 2001)
P.C.S. Traoré & al. © ICRISAT-IPR-IER-CIRAD-U. Florida, 2005WMO CLIMAG workshop, May 2005
Climate: what is different about West Africa?
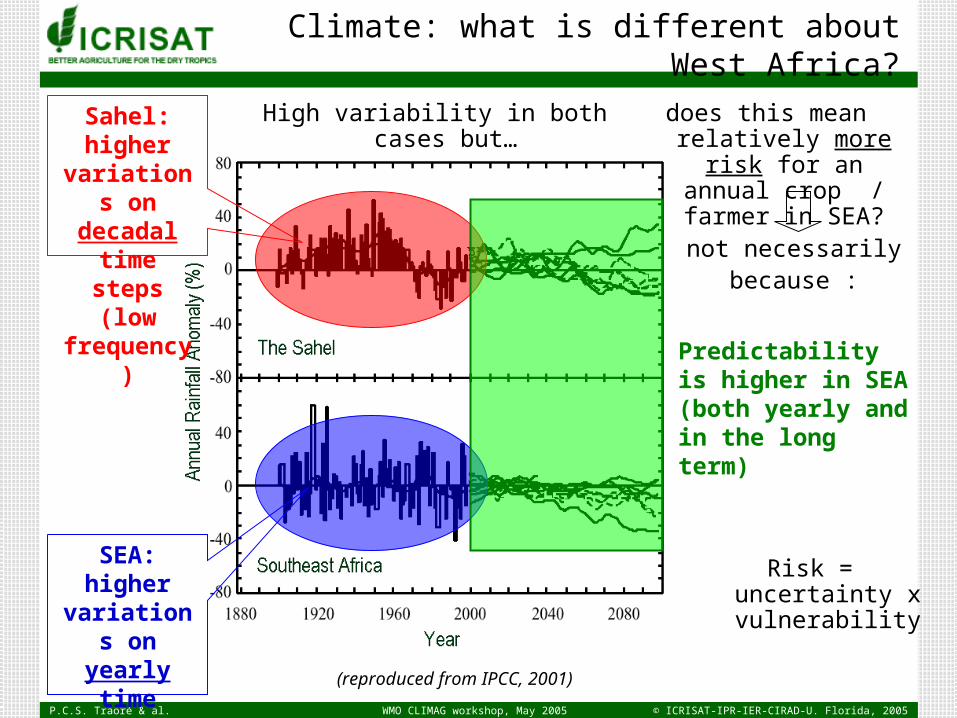
High variability in both cases but…
(reproduced from IPCC, 2001)
Sahel: higher variations on decadal time
steps (low frequency)
SEA: higher variations on yearly time steps (high frequency)
does this mean relatively more risk for an annual crop /
farmer in SEA?
not necessarilybecause :
Predictability is higher in SEA (both yearly and in the long term)
Risk = uncertainty x vulnerability
P.C.S. Traoré & al. © ICRISAT-IPR-IER-CIRAD-U. Florida, 2005WMO CLIMAG workshop, May 2005
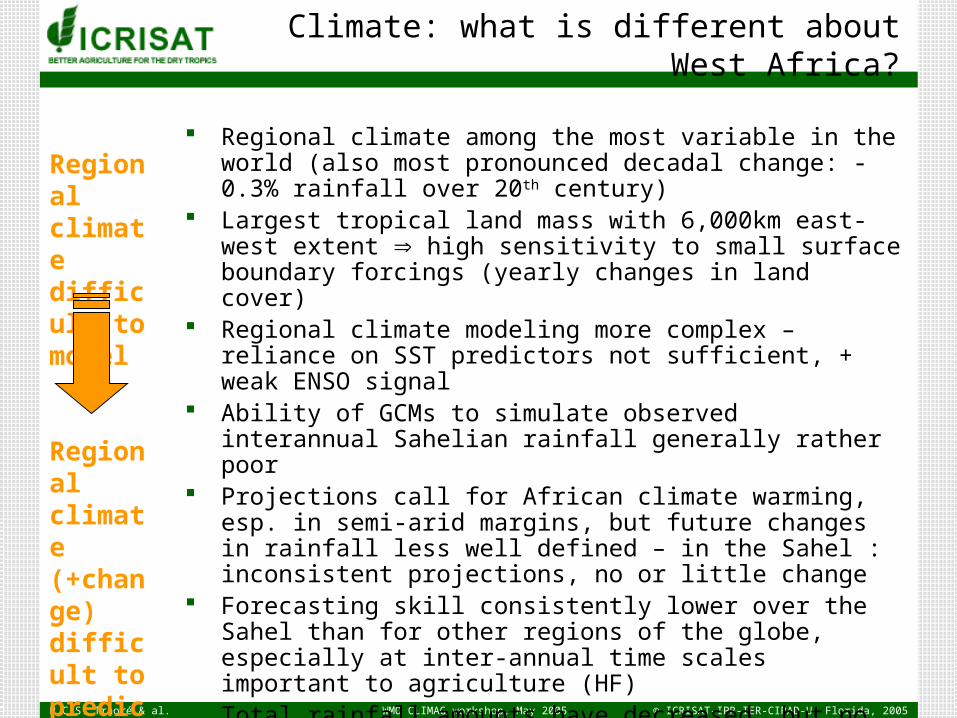
Regional climate among the most variable in the world (also most pronounced decadal change: -0.3% rainfall over 20th century)
Largest tropical land mass with 6,000km east-west extent high sensitivity to small surface boundary forcings (yearly changes in land cover)
Regional climate modeling more complex – reliance on SST predictors not sufficient, + weak ENSO signal
Ability of GCMs to simulate observed interannual Sahelian rainfall generally rather poor
Projections call for African climate warming, esp. in semi-arid margins, but future changes in rainfall less well defined – in the Sahel : inconsistent projections, no or little change
Forecasting skill consistently lower over the Sahel than for other regions of the globe, especially at inter-annual time scales important to agriculture (HF)
Total rainfall amounts have decreased, but no significant change in LGP Under SRES scenarii, precipitation may decrease during the growing season
and may increase at other times of the year Date of rains onset and distribution much more critical to farmers than total
amount, but rarely in the set of predictands
Regional climate difficult to model
Regional climate (+change) difficult to predict
Climate: what is different about West Africa?
P.C.S. Traoré & al. © ICRISAT-IPR-IER-CIRAD-U. Florida, 2005WMO CLIMAG workshop, May 2005
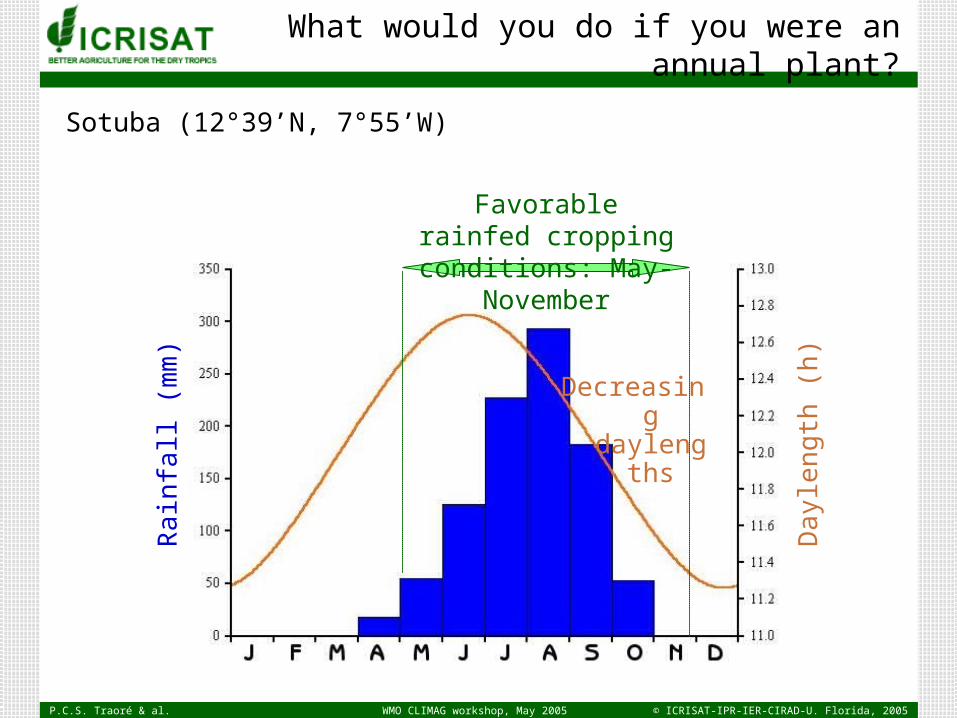
What would you do if you were an annual plant?
Favorable rainfed cropping conditions: May-November
Decreasing daylengths
Dayle
ngth
(h)
Rain
fall (
mm
)
Sotuba (12°39’N, 7°55’W)
P.C.S. Traoré & al. © ICRISAT-IPR-IER-CIRAD-U. Florida, 2005WMO CLIMAG workshop, May 2005
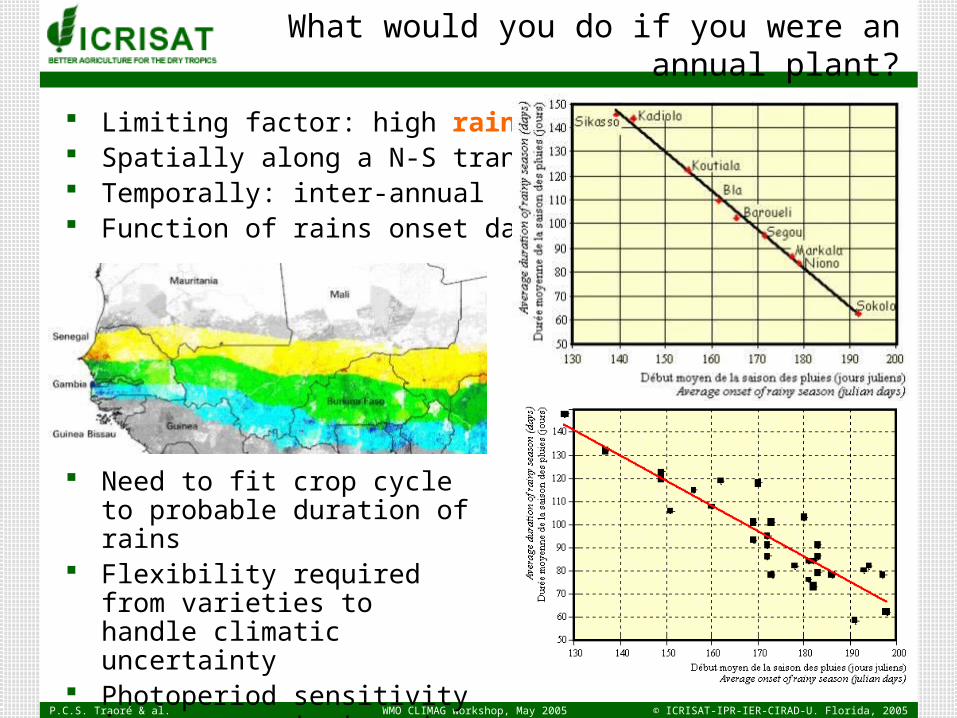
Limiting factor: high rainfall variability Spatially along a N-S transect Temporally: inter-annual Function of rains onset date
Need to fit crop cycle to probable duration of rains
Flexibility required from varieties to handle climatic uncertainty
Photoperiod sensitivity in crops = strategy to avoid climatic risk
What would you do if you were an annual plant?
P.C.S. Traoré & al. © ICRISAT-IPR-IER-CIRAD-U. Florida, 2005WMO CLIMAG workshop, May 2005
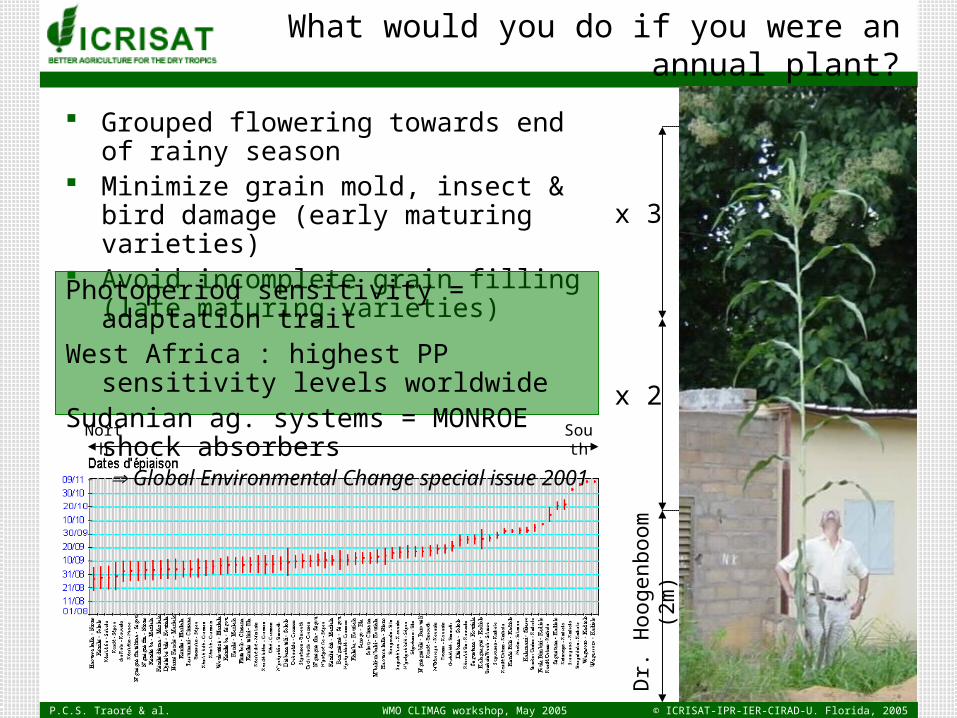
Grouped flowering towards end of rainy season Minimize grain mold, insect & bird damage (early
maturing varieties) Avoid incomplete grain filling (late maturing
varieties)
Dr. H
ooge
nboo
m (2
m)
x 2
x 3
North South
What would you do if you were an annual plant?
Photoperiod sensitivity = adaptation traitWest Africa : highest PP sensitivity levels worldwideSudanian ag. systems = MONROE shock absorbers
Global Environmental Change special issue 2001
P.C.S. Traoré & al. © ICRISAT-IPR-IER-CIRAD-U. Florida, 2005WMO CLIMAG workshop, May 2005
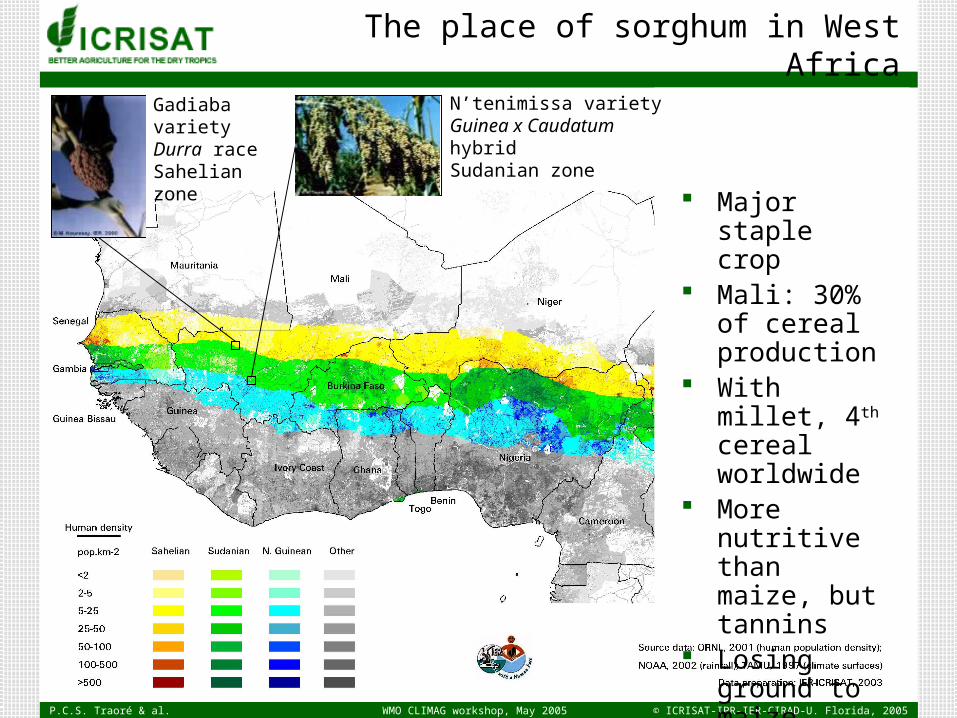
The place of sorghum in West Africa
Gadiaba varietyDurra raceSahelian zone
N’tenimissa varietyGuinea x Caudatum hybridSudanian zone
Major staple crop Mali: 30% of
cereal production With millet, 4th
cereal worldwide More nutritive
than maize, but tannins
Losing ground to maize
P.C.S. Traoré & al. © ICRISAT-IPR-IER-CIRAD-U. Florida, 2005WMO CLIMAG workshop, May 2005
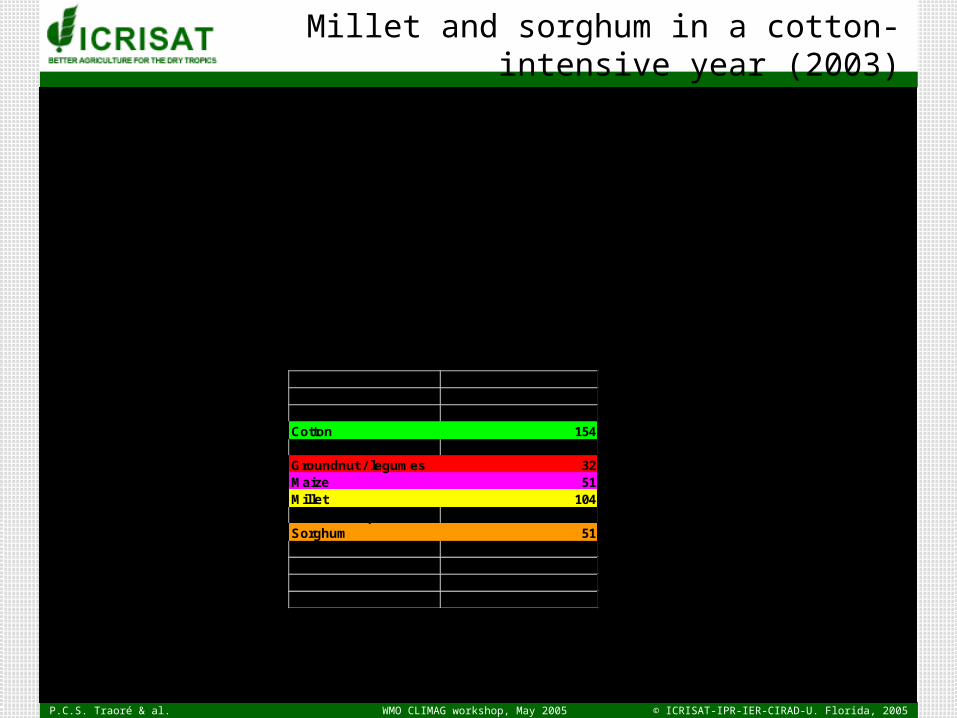
Millet and sorghum in a cotton-intensive year (2003)
Class Number of samples
Bare Soil 10Cotton 154Grass + pasture + fallow 32Groundnut / legumes 32Maize 51Millet 104Rock Outcrops 2Sorghum 51Wetland + ponds 15Wild vegetation 21
total 472
P.C.S. Traoré & al. © ICRISAT-IPR-IER-CIRAD-U. Florida, 2005WMO CLIMAG workshop, May 2005
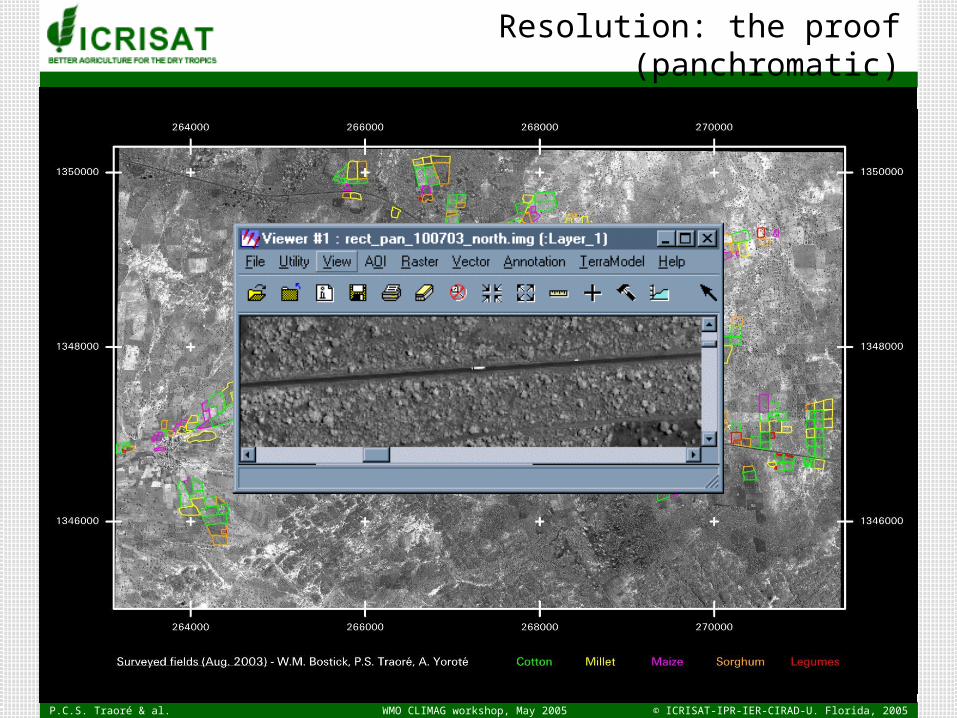
Resolution: the proof (panchromatic)
P.C.S. Traoré & al. © ICRISAT-IPR-IER-CIRAD-U. Florida, 2005WMO CLIMAG workshop, May 2005
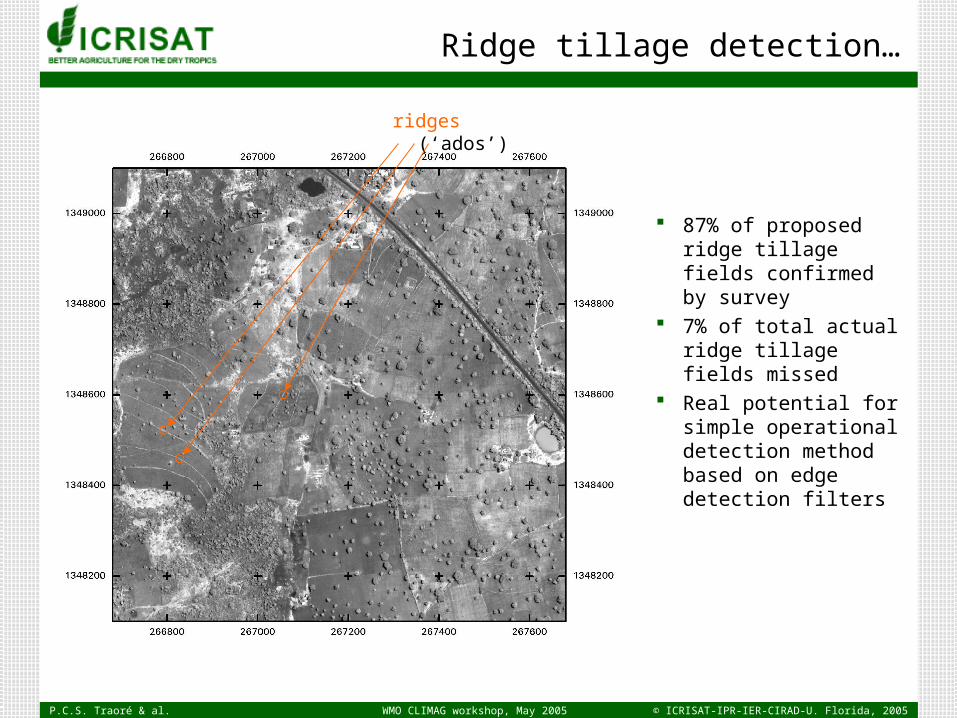
Ridge tillage detection…
ridges (‘ados’)
87% of proposed ridge tillage fields confirmed by survey
7% of total actual ridge tillage fields missed
Real potential for simple operational detection method based on edge detection filters

P.C.S. Traoré & al. © ICRISAT-IPR-IER-CIRAD-U. Florida, 2005WMO CLIMAG workshop, May 2005
The problem
P.C.S. Traoré & al. © ICRISAT-IPR-IER-CIRAD-U. Florida, 2005WMO CLIMAG workshop, May 2005
Flashback on the car thing…
Rephrased question: how do you bring a specialist in risk avoidance (also fatalist at times) to consider investing in risk management?
better have very good arguments!! Like…
Reliable supply systems (for spare parts and the like) = seed systems, fertilizer / market accessibility…
Good paved road network infrastructure (reducing uncertainties linked to potholes (= typhoons), unexpected Desert Storms / gas shortages (= forecasting skill)
Affordable insurance policies (to supplement prayers after accidents)
P.C.S. Traoré & al. © ICRISAT-IPR-IER-CIRAD-U. Florida, 2005WMO CLIMAG workshop, May 2005
climate
soilplant
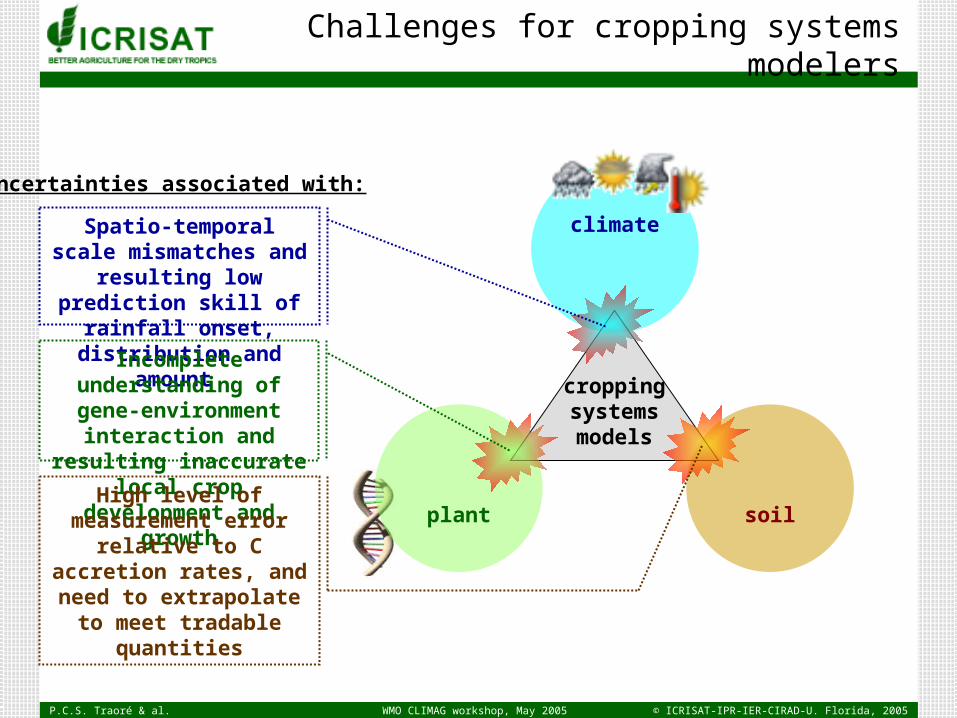
Challenges for cropping systems modelers
Uncertainties associated with:
croppingsystemsmodels
Spatio-temporal scale mismatches and resulting low
prediction skill of rainfall onset, distribution and amount
Incomplete understanding of gene-environment interaction and resulting inaccurate local crop development and growth
High level of measurement error relative to C accretion
rates, and need to extrapolate to meet tradable quantities
P.C.S. Traoré & al. © ICRISAT-IPR-IER-CIRAD-U. Florida, 2005WMO CLIMAG workshop, May 2005
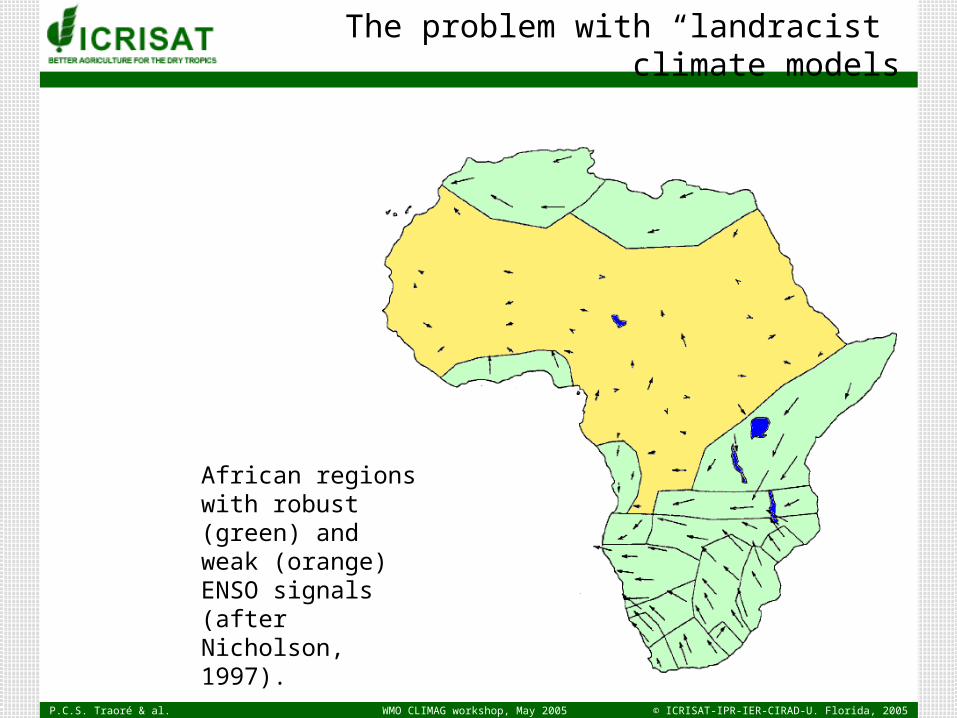
African regions with robust (green) and weak (orange) ENSO signals (after Nicholson, 1997).
The problem with “landracist” climate models
P.C.S. Traoré & al. © ICRISAT-IPR-IER-CIRAD-U. Florida, 2005WMO CLIMAG workshop, May 2005
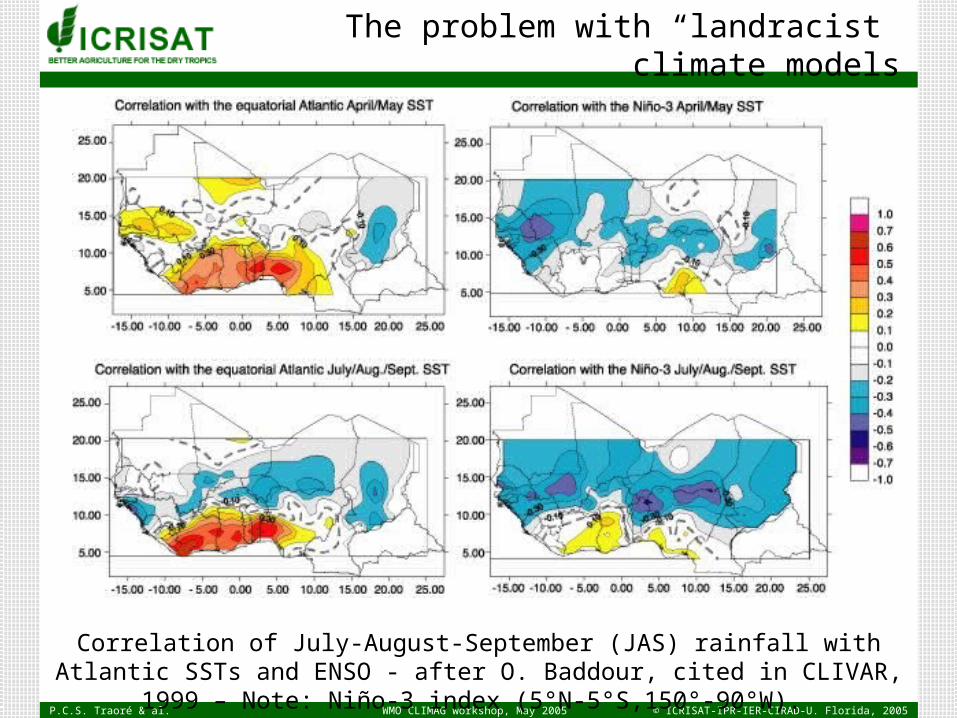
Correlation of July-August-September (JAS) rainfall with Atlantic SSTs and ENSO - after O. Baddour, cited in CLIVAR, 1999 – Note: Niño-3 index (5°N-5°S,150°-90°W).
The problem with “landracist” climate models
P.C.S. Traoré & al. © ICRISAT-IPR-IER-CIRAD-U. Florida, 2005WMO CLIMAG workshop, May 2005
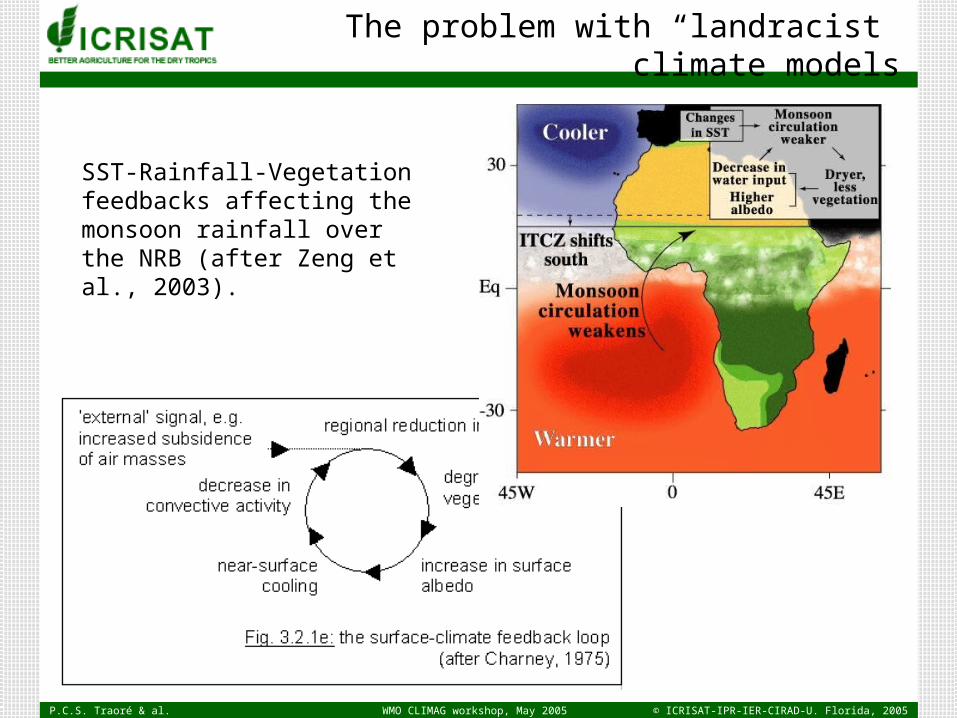
SST-Rainfall-Vegetation feedbacks affecting the monsoon rainfall over the NRB (after Zeng et al., 2003).
The problem with “landracist” climate models
P.C.S. Traoré & al. © ICRISAT-IPR-IER-CIRAD-U. Florida, 2005WMO CLIMAG workshop, May 2005
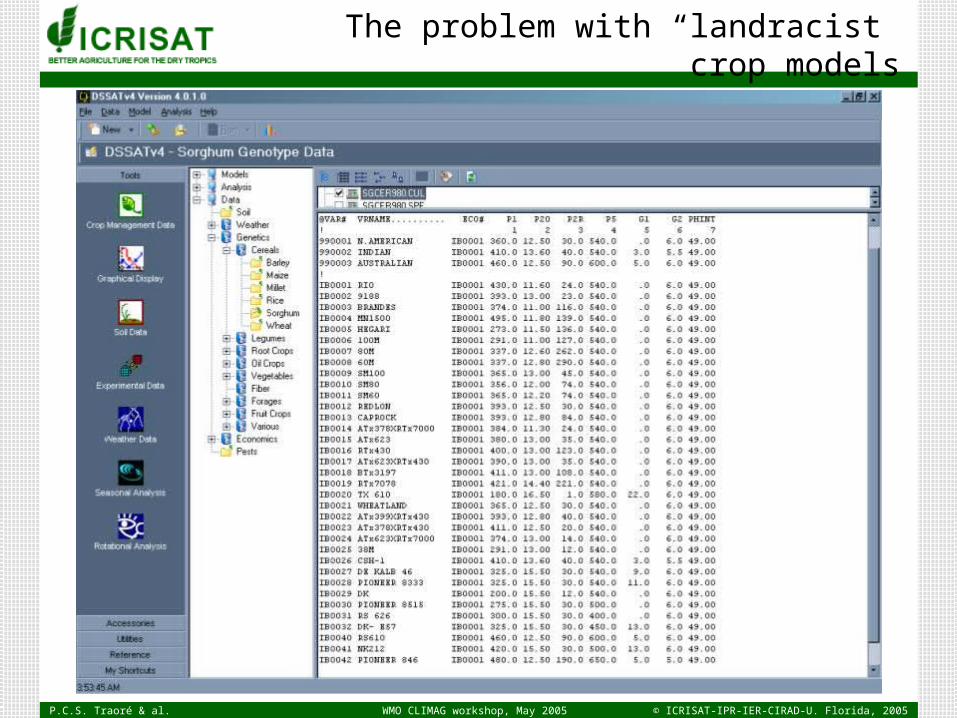
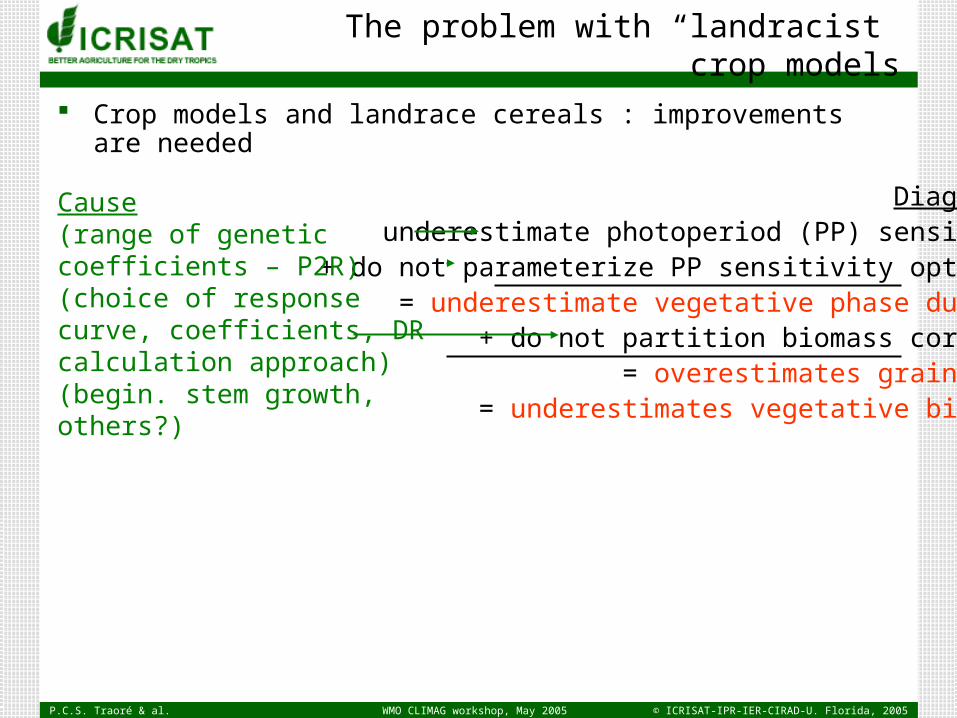
The problem with “landracist” crop models
P.C.S. Traoré & al. © ICRISAT-IPR-IER-CIRAD-U. Florida, 2005WMO CLIMAG workshop, May 2005
Diagnosticunderestimate photoperiod (PP) sensitivity
+ do not parameterize PP sensitivity optimally= underestimate vegetative phase duration
+ do not partition biomass correctly= overestimates grain yield
= underestimates vegetative biomass
The problem with “landracist” crop models
Crop models and landrace cereals : improvements are needed
Cause(range of genetic coefficients – P2R)(choice of response curve, coefficients, DR calculation approach)(begin. stem growth, others?)
P.C.S. Traoré & al. © ICRISAT-IPR-IER-CIRAD-U. Florida, 2005WMO CLIMAG workshop, May 2005
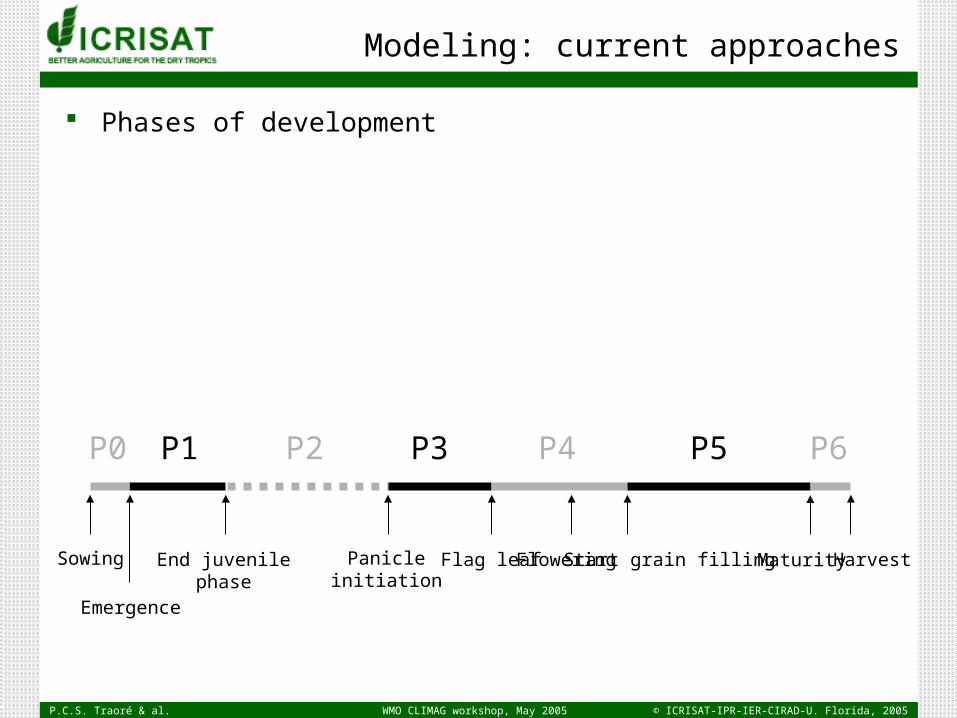
Modeling: current approaches
Phases of development
P1 P2 P3 P4 P5 P6
Emergence
Flag leafPanicleinitiation
End juvenilephase
Flowering Maturity Harvest
P0
Start grain fillingSowing
P.C.S. Traoré & al. © ICRISAT-IPR-IER-CIRAD-U. Florida, 2005WMO CLIMAG workshop, May 2005
Modeling: current approaches
Phases of development
P1 P2 P3 P4 P5 P6
Emergence
Flag leafPanicleinitiation
End juvenilephase
Flowering Maturity Harvest
P0
Start grain fillingSowing
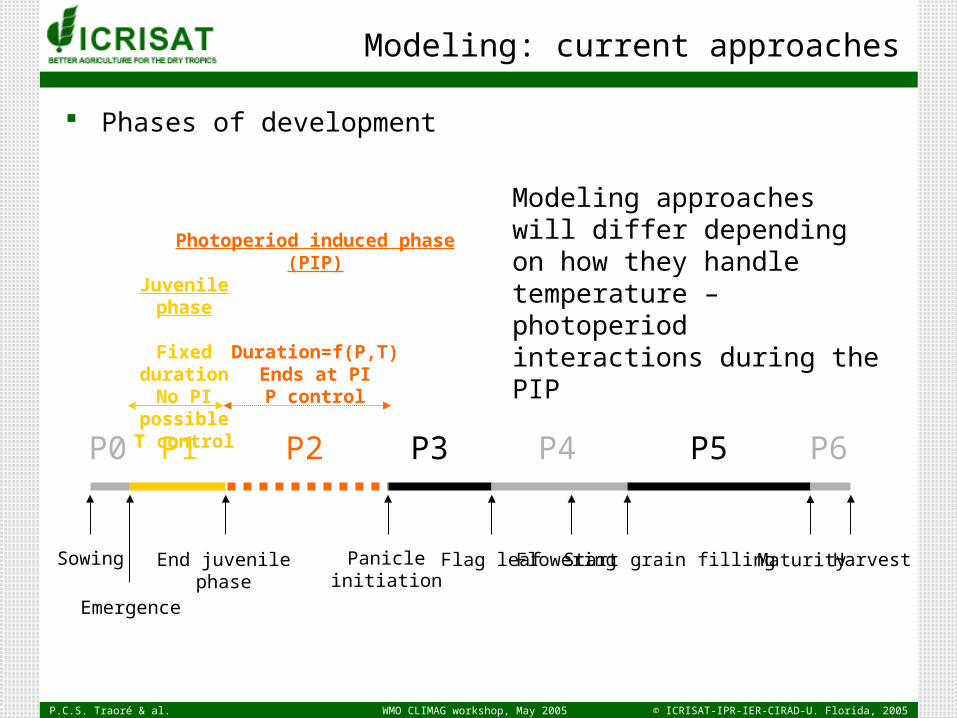
Juvenile phase
Fixed durationNo PI possible
T control
Photoperiod induced phase (PIP)
Duration=f(P,T)Ends at PIP control
Modeling approaches will differ depending on how they handle temperature – photoperiodinteractions during the PIP
P.C.S. Traoré & al. © ICRISAT-IPR-IER-CIRAD-U. Florida, 2005WMO CLIMAG workshop, May 2005
Recap… in a nutshell
Assumption 1 farmers lack critical information about upcoming climate and their current coping strategies
would gain from incorporating modern science climate forecasts to adapt to possible increases in climate risk hmmmmm (yes and no!)
Assumption 2 there is a capacity to generate seasonal forecasts of local climate that meet farmers interest in
additional information hmmmmm (I still have doubts!)
Assumption 3 selected process-based models can simulate conditions actually encountered by farmers, and
they can be driven by downscaled climate forecasts hmmmmm (not always!)

P.C.S. Traoré & al. © ICRISAT-IPR-IER-CIRAD-U. Florida, 2005WMO CLIMAG workshop, May 2005
Approach
P.C.S. Traoré & al. © ICRISAT-IPR-IER-CIRAD-U. Florida, 2005WMO CLIMAG workshop, May 2005
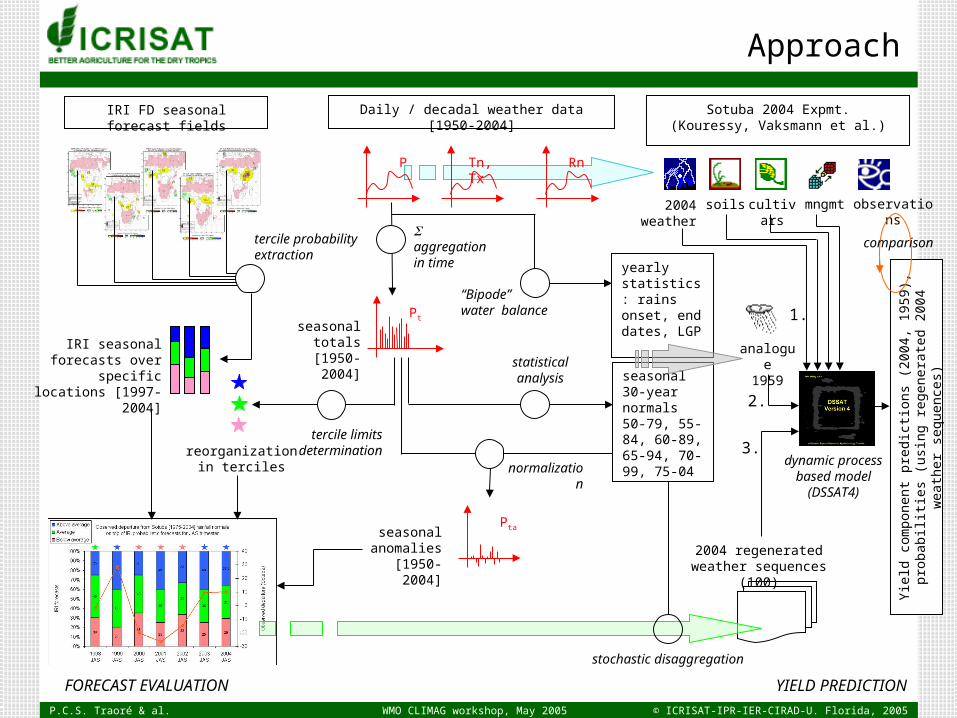
Approach
FORECAST EVALUATION YIELD PREDICTION
IRI FD seasonal forecast fields
tercile probabilityextraction
aggregation in time
Ptseasonal
totals[1950-2004]
IRI seasonal forecasts over specific locations
[1997-2004]statistical analysis
normalization
seasonal anomalies
[1950-2004]
Pta
tercile limits determinationreorganization
in terciles
Daily / decadal weather data [1950-2004]
P Tn, Tx Rn
Sotuba 2004 Expmt.(Kouressy, Vaksmann et al.)
2004 weather
soils cultivars mngmt observations
“Bipode”water balance
yearly statistics: rains onset, end dates, LGP
analogue1959
2004 regenerated weather sequences (100)
stochastic disaggregation
1.
2.
3.dynamic process
based model (DSSAT4)
Yie
ld c
ompo
nent
pre
dict
ions
(20
04, 1
959)
,pr
obab
ilitie
s (u
sing
reg
ener
ated
200
4 w
eath
er
sequ
ence
s)
comparison
seasonal 30-year normals 50-79, 55-84, 60-89, 65-94, 70-99, 75-04
P.C.S. Traoré & al. © ICRISAT-IPR-IER-CIRAD-U. Florida, 2005WMO CLIMAG workshop, May 2005
Hansen&al, 2004
“This convention [expressing operational seasonal climate forecasts as climatic anomalies or tercile probability shifts averaged in space… and time] maximizes prediction skill by reducing the ‘noise’ associated with weather variability in time and space that can mask predictable seasonal climatic variations.”
P.C.S. Traoré & al. © ICRISAT-IPR-IER-CIRAD-U. Florida, 2005WMO CLIMAG workshop, May 2005
Results
P.C.S. Traoré & al. © ICRISAT-IPR-IER-CIRAD-U. Florida, 2005WMO CLIMAG workshop, May 2005
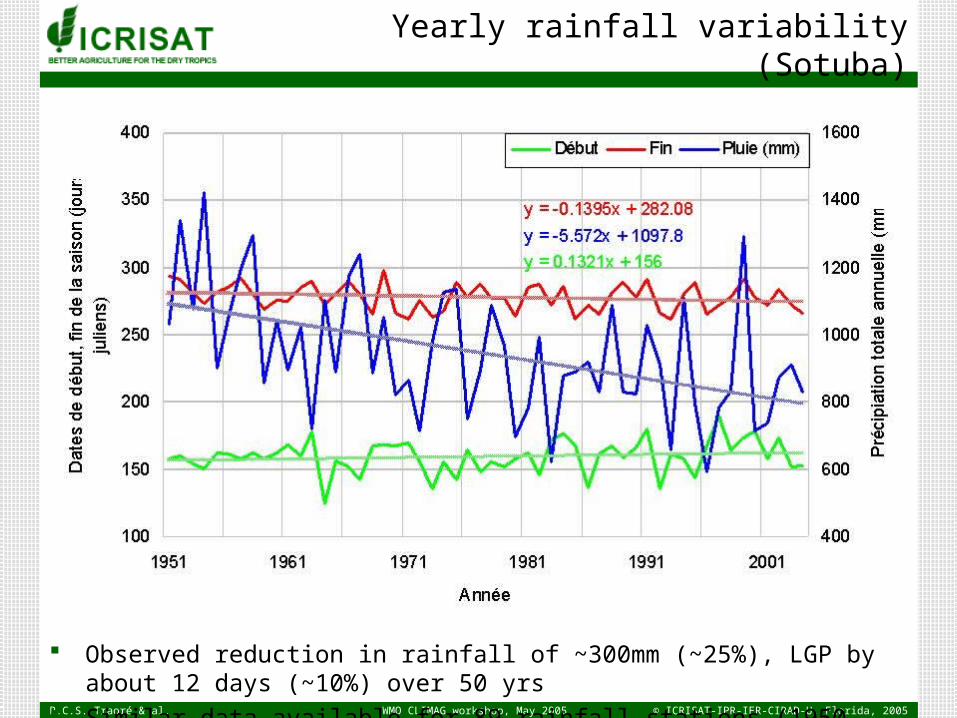
Yearly rainfall variability (Sotuba)
Observed reduction in rainfall of ~300mm (~25%), LGP by about 12 days (~10%) over 50 yrs Similar data available for 89 rainfall stations (1950-2004), + satellite
P.C.S. Traoré & al. © ICRISAT-IPR-IER-CIRAD-U. Florida, 2005WMO CLIMAG workshop, May 2005
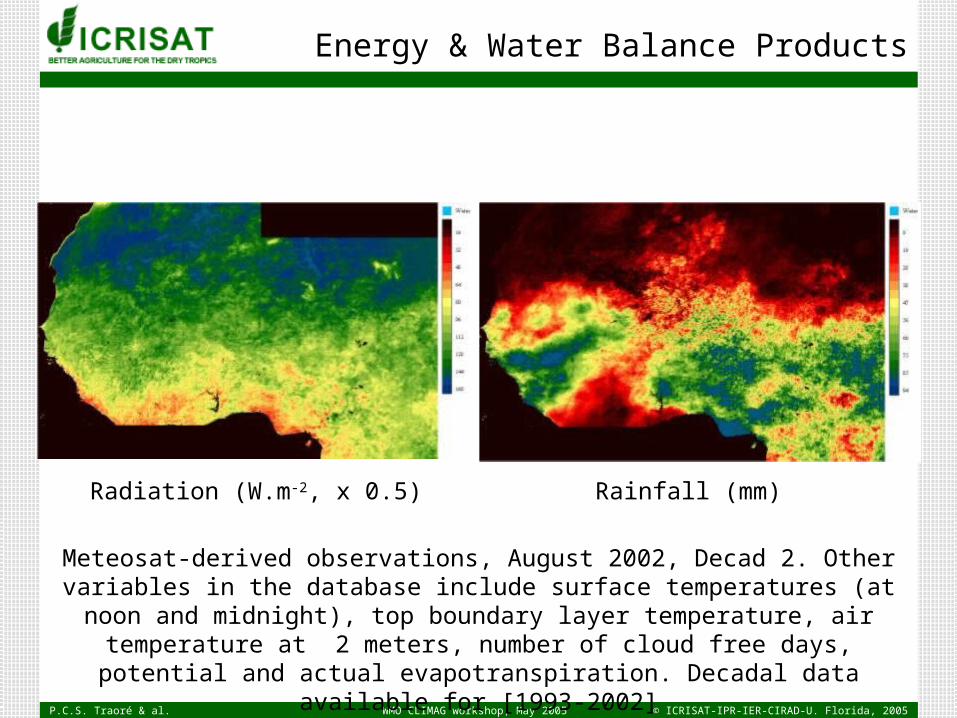
Energy & Water Balance Products
Radiation (W.m-2, x 0.5) Rainfall (mm)
Meteosat-derived observations, August 2002, Decad 2. Other variables in the database include surface temperatures (at noon and midnight), top boundary layer temperature, air temperature at 2 meters, number of cloud free days, potential and actual evapotranspiration. Decadal data available
for [1993-2002]
P.C.S. Traoré & al. © ICRISAT-IPR-IER-CIRAD-U. Florida, 2005WMO CLIMAG workshop, May 2005
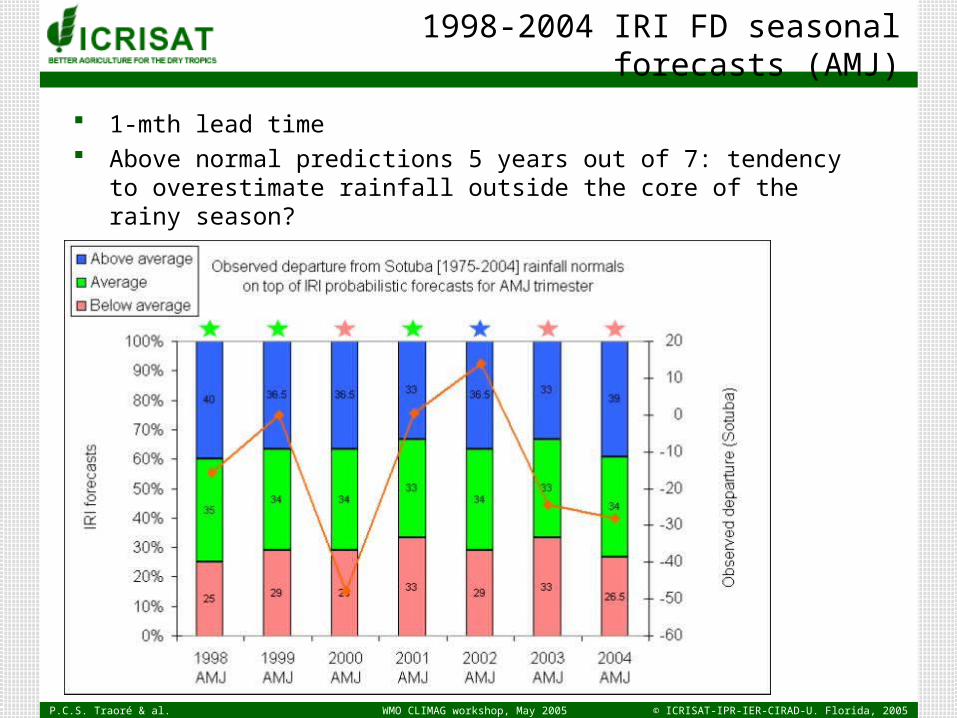
1998-2004 IRI FD seasonal forecasts (AMJ)
1-mth lead time Above normal predictions 5 years out of 7: tendency to overestimate rainfall outside the
core of the rainy season? Which reference period for IRI normals?
P.C.S. Traoré & al. © ICRISAT-IPR-IER-CIRAD-U. Florida, 2005WMO CLIMAG workshop, May 2005
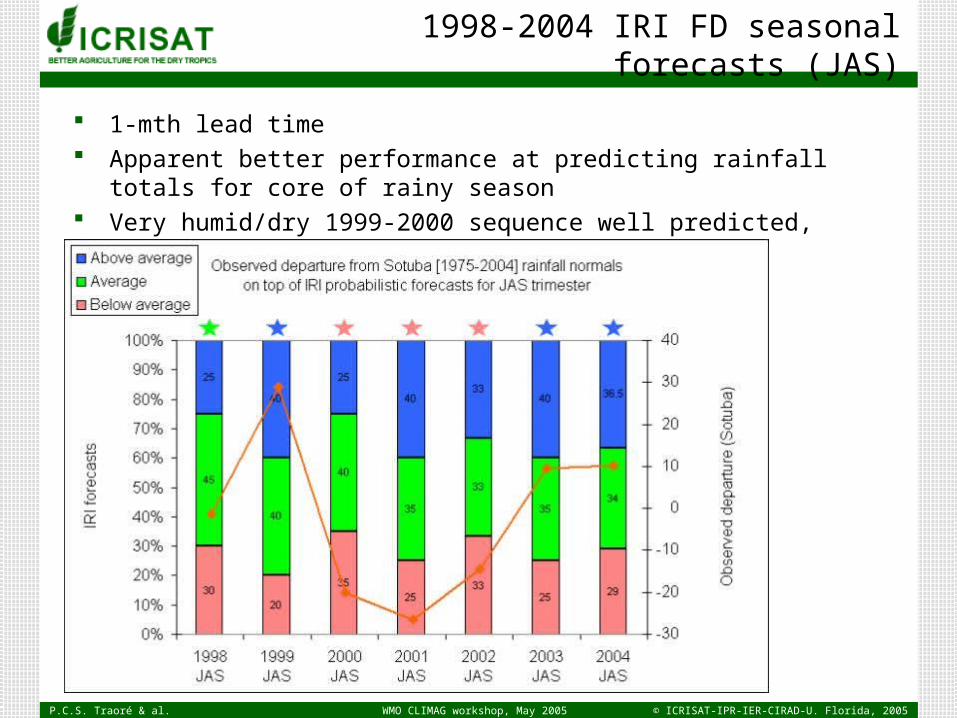
1998-2004 IRI FD seasonal forecasts (JAS)
1-mth lead time Apparent better performance at predicting rainfall totals for core of rainy season Very humid/dry 1999-2000 sequence well predicted, but not 2001
P.C.S. Traoré & al. © ICRISAT-IPR-IER-CIRAD-U. Florida, 2005WMO CLIMAG workshop, May 2005
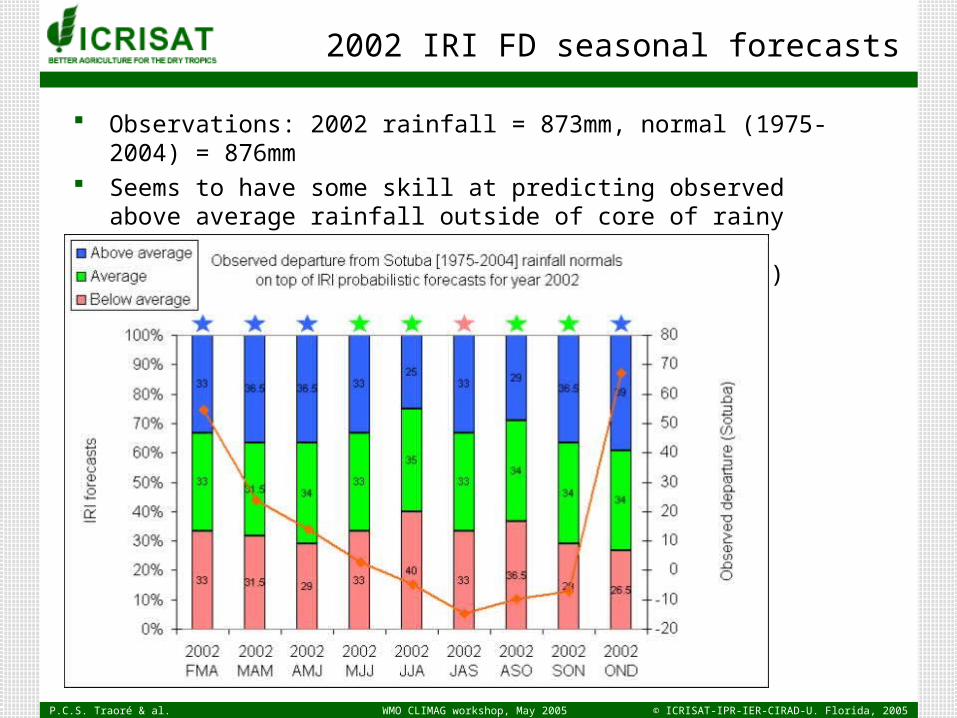
2002 IRI FD seasonal forecasts
Observations: 2002 rainfall = 873mm, normal (1975-2004) = 876mm Seems to have some skill at predicting observed above average rainfall outside of core
of rainy season (obs: 84mm, normal: 68mm) and relative dryness during core (obs: 562mm, normal: 658mm)
P.C.S. Traoré & al. © ICRISAT-IPR-IER-CIRAD-U. Florida, 2005WMO CLIMAG workshop, May 2005
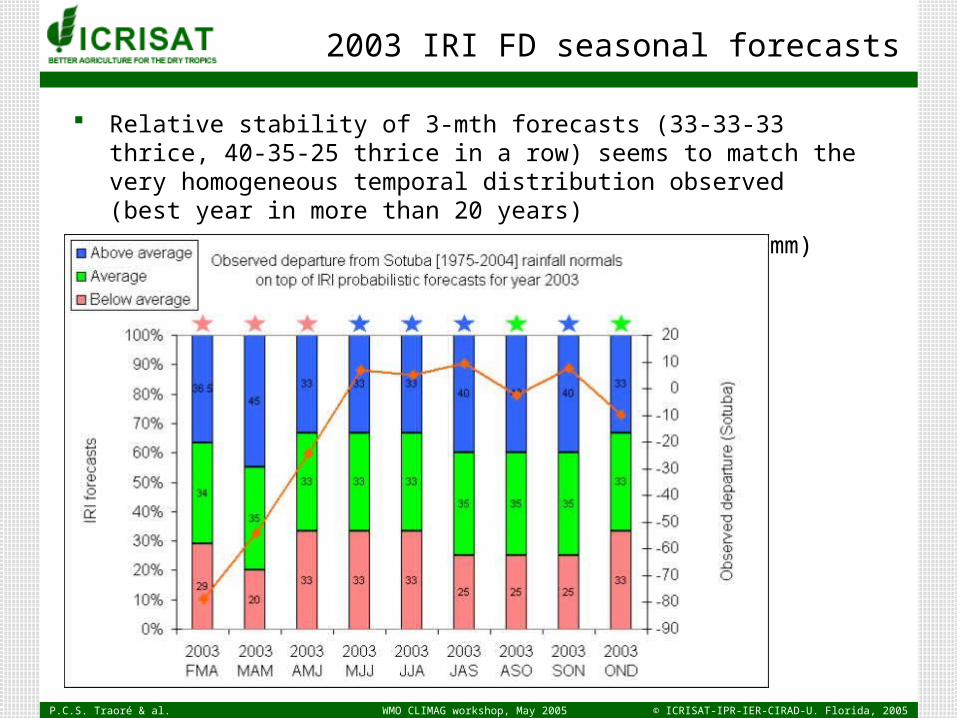
2003 IRI FD seasonal forecasts
Relative stability of 3-mth forecasts (33-33-33 thrice, 40-35-25 thrice in a row) seems to match the very homogeneous temporal distribution observed (best year in more than 20 years)
Observed annual rainfall = 912mmm (normal: 873mm)
P.C.S. Traoré & al. © ICRISAT-IPR-IER-CIRAD-U. Florida, 2005WMO CLIMAG workshop, May 2005
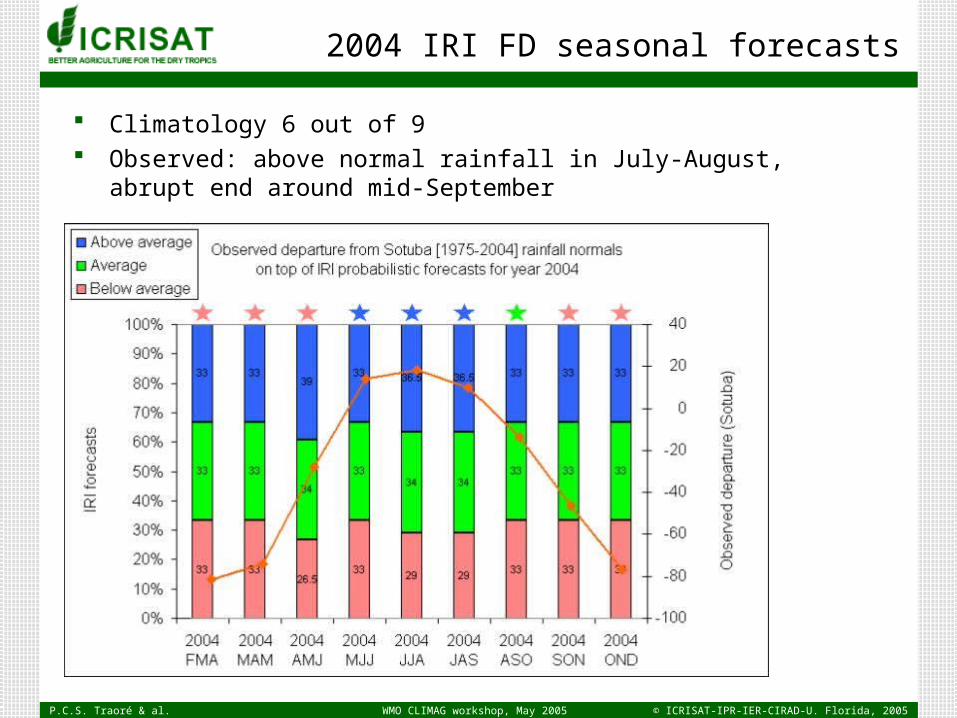
2004 IRI FD seasonal forecasts
Climatology 6 out of 9 Observed: above normal rainfall in July-August, abrupt end around mid-September
P.C.S. Traoré & al. © ICRISAT-IPR-IER-CIRAD-U. Florida, 2005WMO CLIMAG workshop, May 2005
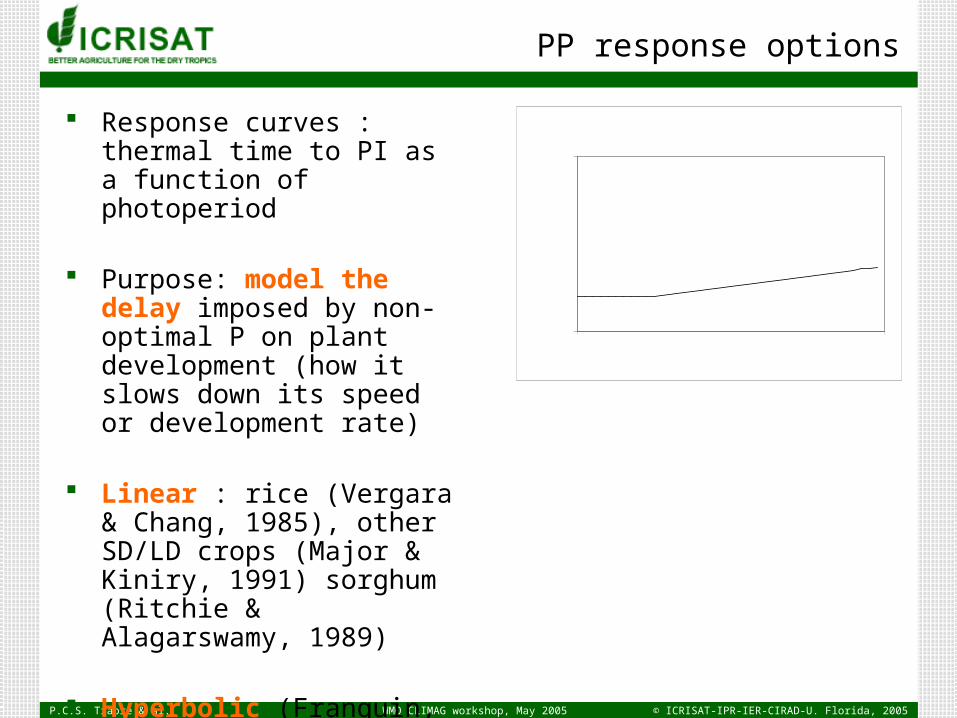
PP response options
Response curves : thermal time to PI as a function of photoperiod
Purpose: model the delay imposed by non-optimal P on plant development (how it slows down its speed or development rate)
Linear : rice (Vergara & Chang, 1985), other SD/LD crops (Major & Kiniry, 1991) sorghum (Ritchie & Alagarswamy, 1989)
Hyperbolic (Franquin, 1976; Hadley, 1983; Hammer, 1989; Brisson, 2002)
P200
2500
Photoperiod (h)
TT
PI (°
Cd)
P2R
P1
0
2500
Photoperiod (h)
TT
PI (°
Cd)
Psat
P1
Pbase Consequences for ‘qualitative’ plants
OPPRPPPf ii 22 1
basei
basesati PP
PPPPf 1
PI will eventually occur
PI may not occur
P.C.S. Traoré & al. © ICRISAT-IPR-IER-CIRAD-U. Florida, 2005WMO CLIMAG workshop, May 2005
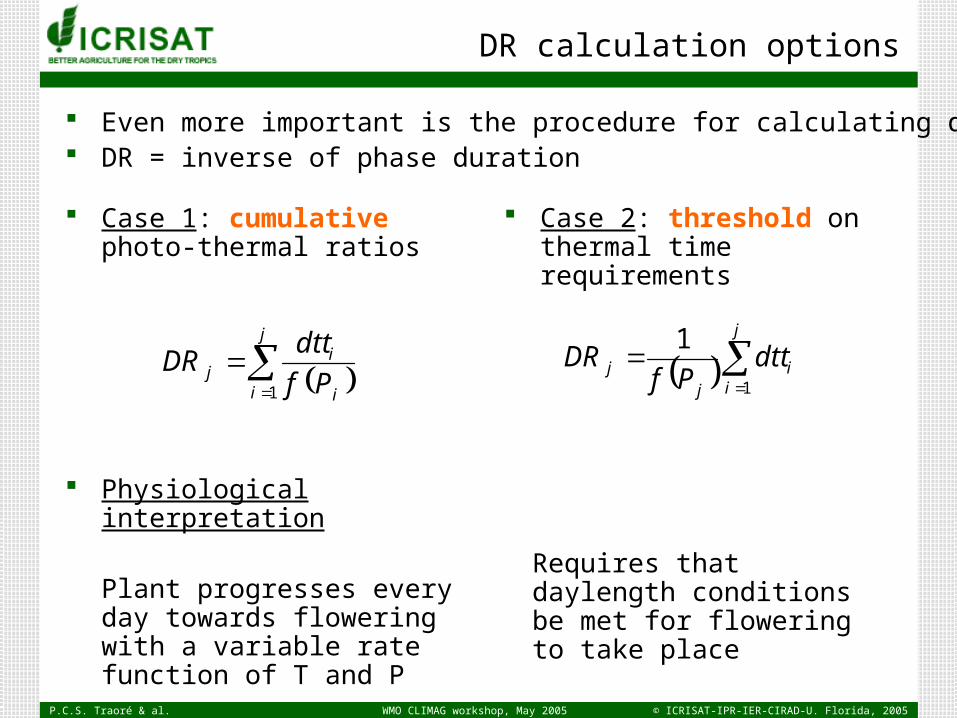
DR calculation options
Even more important is the procedure for calculating development rates (DR) DR = inverse of phase duration
j
i i
ij Pf
dttDR
1
j
ii
jj dtt
PfDR
1
1
Case 1: cumulative photo-thermal ratios
Case 2: threshold on thermal time requirements
Physiological interpretation
Plant progresses every day towards flowering with a variable rate function of T and P
Requires that daylength conditions be met for flowering to take place
P.C.S. Traoré & al. © ICRISAT-IPR-IER-CIRAD-U. Florida, 2005WMO CLIMAG workshop, May 2005
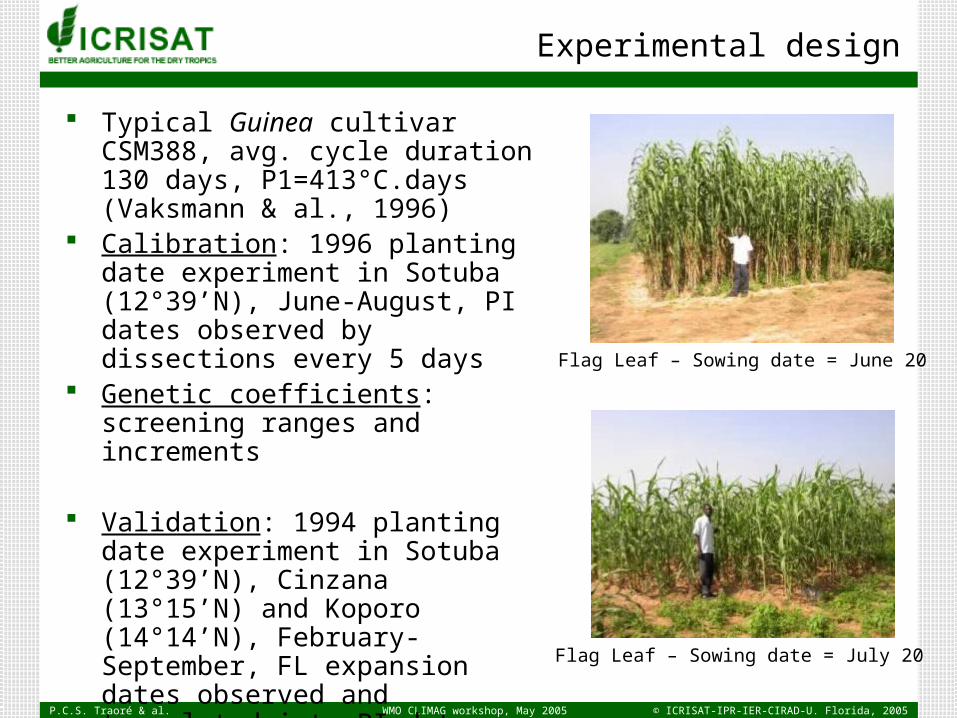
Experimental design
Typical Guinea cultivar CSM388, avg. cycle duration 130 days, P1=413°C.days (Vaksmann & al., 1996)
Calibration: 1996 planting date experiment in Sotuba (12°39’N), June-August, PI dates observed by dissections every 5 days
Genetic coefficients: screening ranges and increments
Validation: 1994 planting date experiment in Sotuba (12°39’N), Cinzana (13°15’N) and Koporo (14°14’N), February-September, FL expansion dates observed and translated into PI dates
Flag Leaf – Sowing date = June 20
Flag Leaf – Sowing date = July 20
P.C.S. Traoré & al. © ICRISAT-IPR-IER-CIRAD-U. Florida, 2005WMO CLIMAG workshop, May 2005
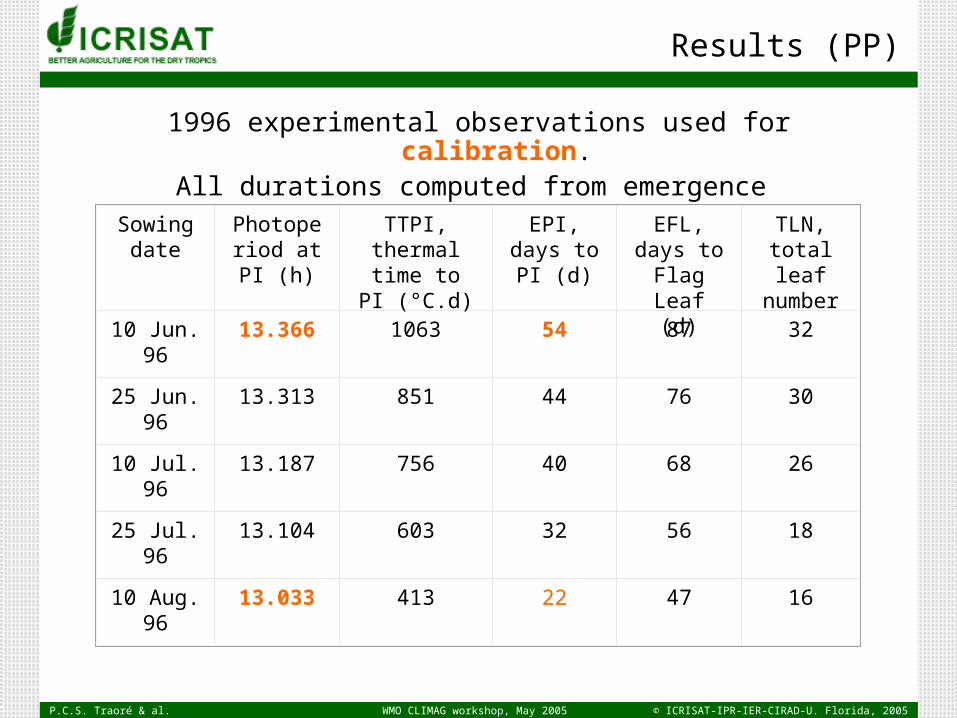
Sowing date
Photoperiod at PI (h)
TTPI, thermal time to PI
(°C.d)
EPI, days to PI (d)
EFL, days to Flag Leaf
(d)
TLN, total leaf
number
10 Jun. 96 13.366 1063 54 87 32
25 Jun. 96 13.313 851 44 76 30
10 Jul. 96 13.187 756 40 68 26
25 Jul. 96 13.104 603 32 56 18
10 Aug. 96 13.033 413 22 47 16
Results (PP)
1996 experimental observations used for calibration.All durations computed from emergence
P.C.S. Traoré & al. © ICRISAT-IPR-IER-CIRAD-U. Florida, 2005WMO CLIMAG workshop, May 2005
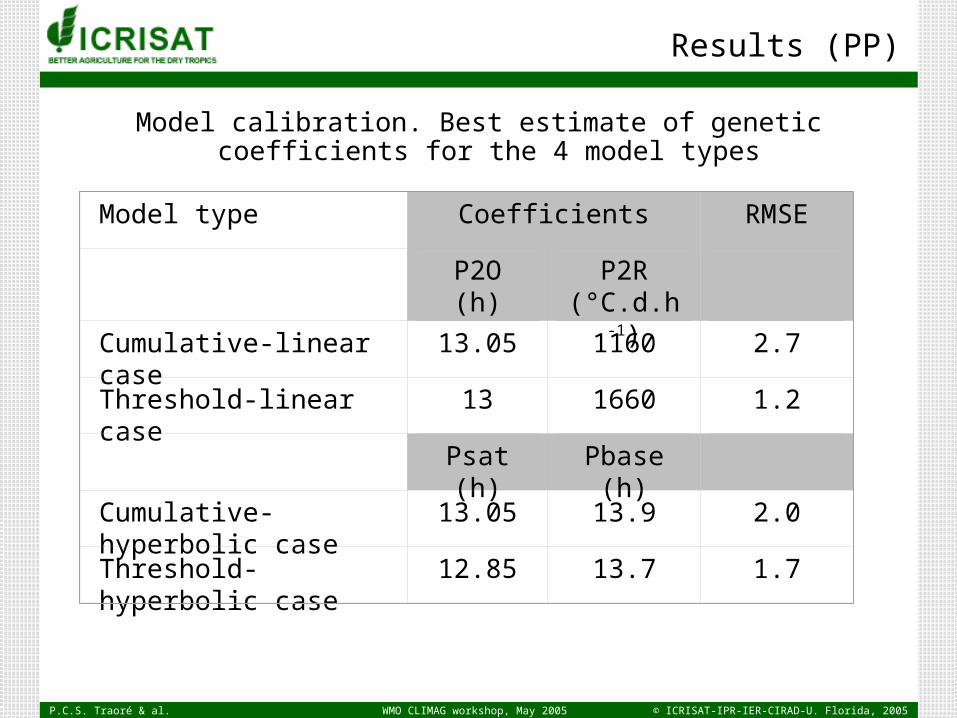
Results (PP)
Model calibration. Best estimate of genetic coefficients for the 4 model types
Model type Coefficients RMSE
P2O (h) P2R (°C.d.h-1)
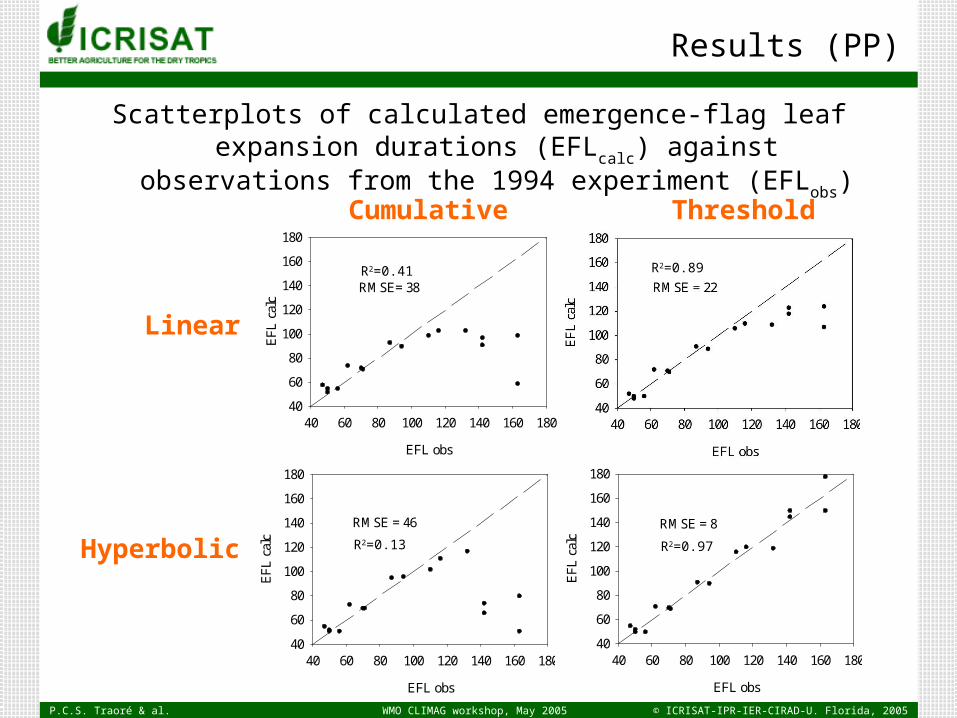
Cumulative-linear case 13.05 1160 2.7
Threshold-linear case 13 1660 1.2
Psat (h) Pbase (h)
Cumulative-hyperbolic case 13.05 13.9 2.0
Threshold-hyperbolic case 12.85 13.7 1.7
P.C.S. Traoré & al. © ICRISAT-IPR-IER-CIRAD-U. Florida, 2005WMO CLIMAG workshop, May 2005
Results (PP)
Cumulative Threshold
EFL obs
40 60 80 100 120 140 160 180
EF
L c
alc
40
60
80
100
120
140
160
180
RMSE= 38
EFL obs
40 60 80 100 120 140 160 180
EF
L c
alc
40
60
80
100
120
140
160
180
RMSE = 46
EFL obs
40 60 80 100 120 140 160 180
EF
L c
alc
40
60
80
100
120
140
160
180
RMSE = 8
Linear
Hyperbolic
R2=0.41 R2=0.89
R2=0.13 R2=0.97
Scatterplots of calculated emergence-flag leaf expansion durations (EFLcalc) against observations from the 1994 experiment (EFLobs)
P.C.S. Traoré & al. © ICRISAT-IPR-IER-CIRAD-U. Florida, 2005WMO CLIMAG workshop, May 2005
Results (PP)
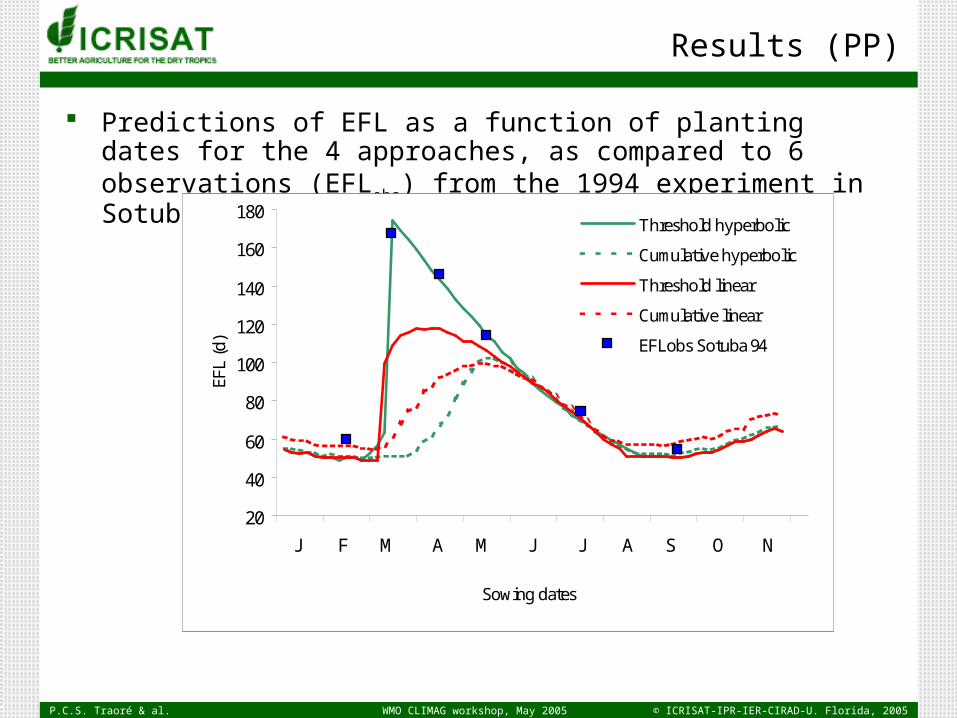
Predictions of EFL as a function of planting dates for the 4 approaches, as compared to 6 observations (EFLobs) from the 1994 experiment in Sotuba, Mali
20
40
60
80
100
120
140
160
180
1/1/1996
1/31/1996
3/1/1996
3/31/1996
4/30/1996
5/30/1996
6/29/1996
7/29/1996
8/28/1996
9/27/1996
10/27/1996
11/26/1996
Sowing dates
EFL
(d)
Threshold hyperbolic
Cumulative hyperbolic
Threshold linear
Cumulative linear
EFLobs Sotuba 94
J F M A M J J A S O N
P.C.S. Traoré & al. © ICRISAT-IPR-IER-CIRAD-U. Florida, 2005WMO CLIMAG workshop, May 2005
Growth = quantitative, development = qualitative
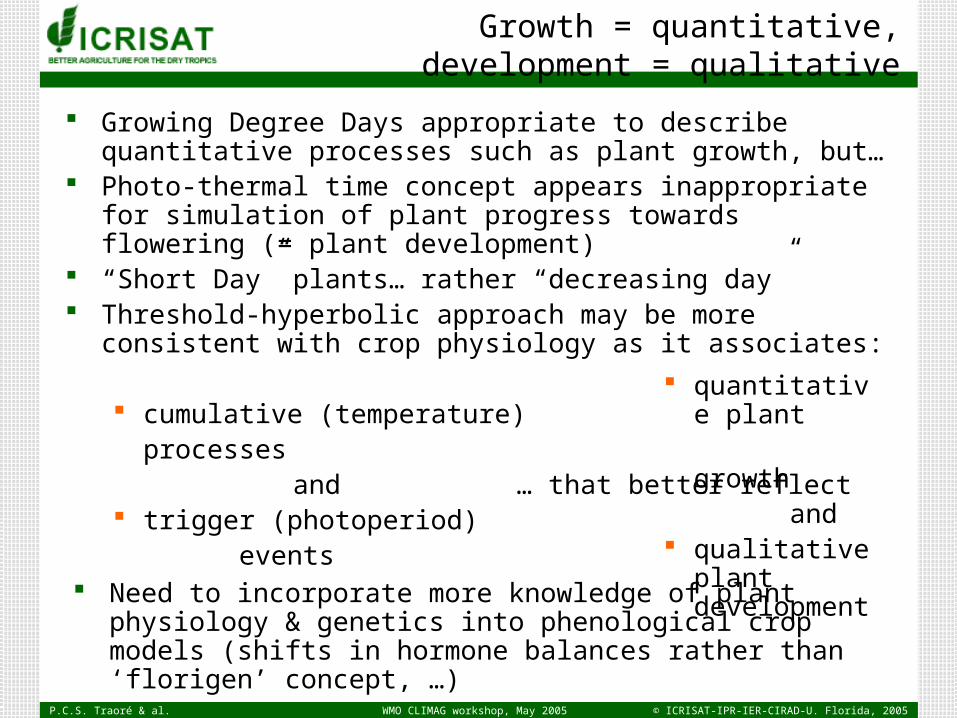
Growing Degree Days appropriate to describe quantitative processes such as plant growth, but…
Photo-thermal time concept appears inappropriate for simulation of plant progress towards flowering (= plant development)
“Short Day” plants… rather “decreasing day” Threshold-hyperbolic approach may be more consistent with crop physiology as it
associates:
cumulative (temperature) processes
and … that better reflect trigger (photoperiod)
events
quantitative plantgrowthand
qualitative plant development
Need to incorporate more knowledge of plant physiology & genetics into phenological crop models (shifts in hormone balances rather than ‘florigen’ concept, …)
P.C.S. Traoré & al. © ICRISAT-IPR-IER-CIRAD-U. Florida, 2005WMO CLIMAG workshop, May 2005
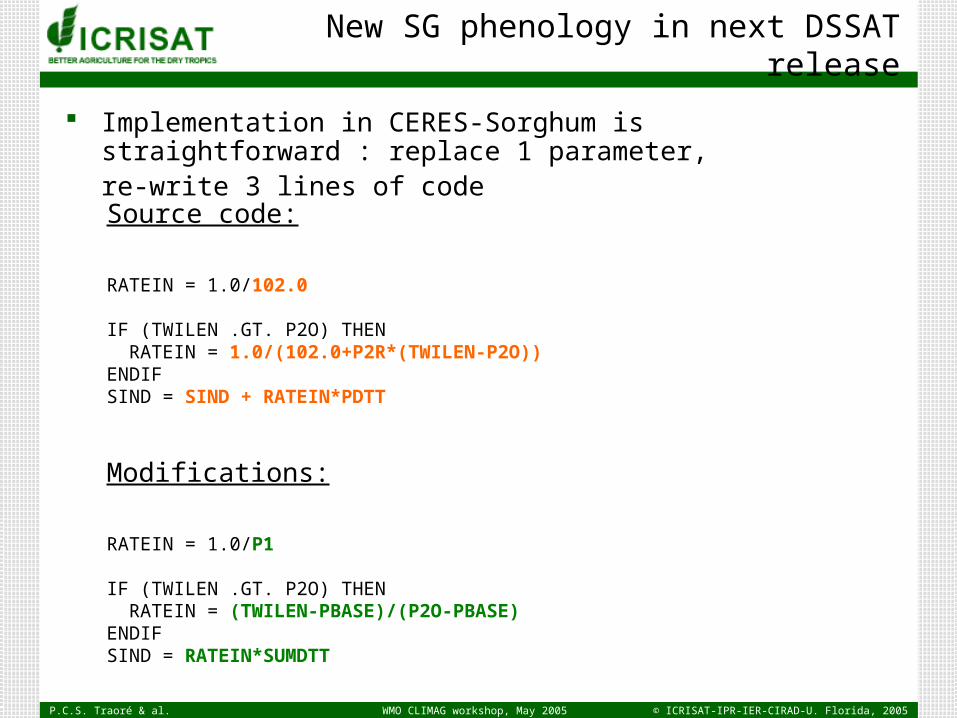
Source code:
RATEIN = 1.0/102.0
IF (TWILEN .GT. P2O) THEN RATEIN = 1.0/(102.0+P2R*(TWILEN-P2O))ENDIFSIND = SIND + RATEIN*PDTT
New SG phenology in next DSSAT release
Implementation in CERES-Sorghum is straightforward : replace 1 parameter,re-write 3 lines of code
Modifications:
RATEIN = 1.0/P1
IF (TWILEN .GT. P2O) THEN RATEIN = (TWILEN-PBASE)/(P2O-PBASE)ENDIFSIND = RATEIN*SUMDTT
P.C.S. Traoré & al. © ICRISAT-IPR-IER-CIRAD-U. Florida, 2005WMO CLIMAG workshop, May 2005
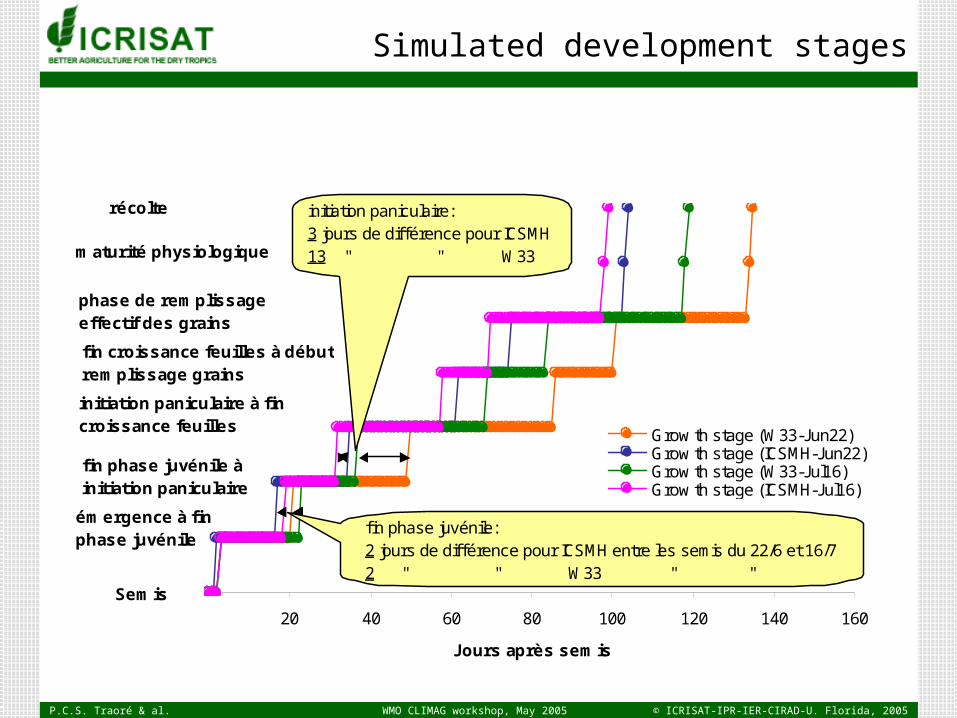
Simulated development stages
20 40 60 80 100 120 140 160
Jours après semis
Grow th stage (W33-Jun22)Grow th stage (ICSMH-Jun22)Grow th stage (W33-Jul16)Grow th stage (ICSMH-Jul16)
Semis
émergence à finphase juvénile
fin phase juvénile àinitiation paniculaire
initiation paniculaire à fincroissance feuilles
fin croissance feuilles à débutremplissage grains
phase de remplissageeffectif des grains
maturité physiologique
récolte
f in phase juvénile:2 jours de différence pour ICSMH entre les semis du 22/6 et 16/72 " " W33 " "
initiation paniculaire:3 jours de différence pour ICSMH13 " " W33
P.C.S. Traoré & al. © ICRISAT-IPR-IER-CIRAD-U. Florida, 2005WMO CLIMAG workshop, May 2005
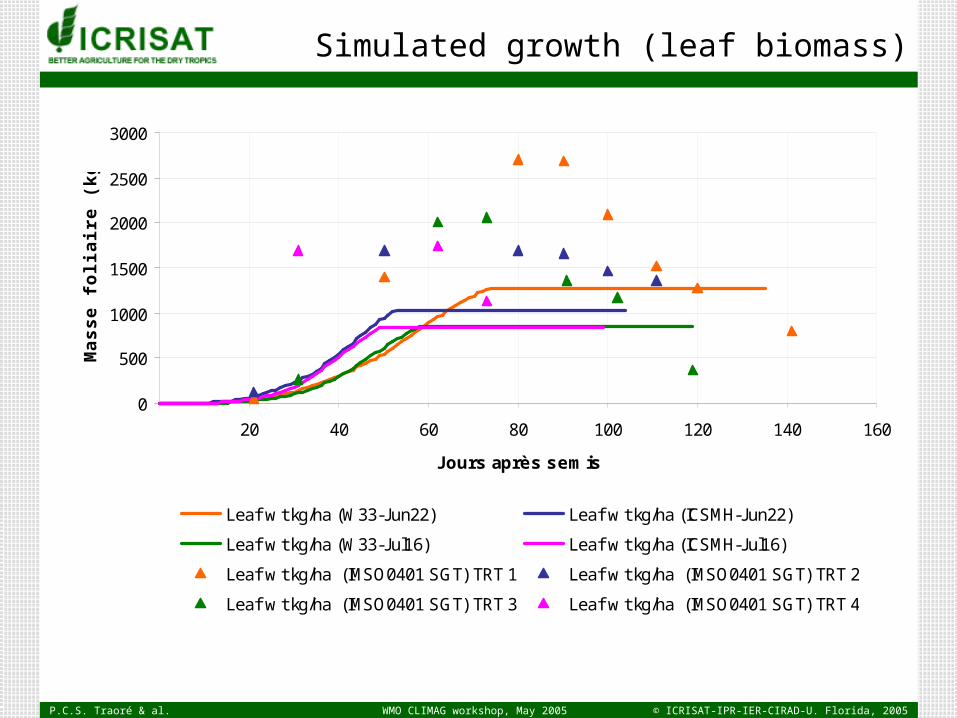
Simulated growth (leaf biomass)
0
500
1000
1500
2000
2500
3000
20 40 60 80 100 120 140 160
Jours après semis
Mas
se f
olia
ire
(kg
/ha)
Leaf w t kg/ha (W33-Jun22) Leaf w t kg/ha (ICSMH-Jun22)
Leaf w t kg/ha (W33-Jul16) Leaf w t kg/ha (ICSMH-Jul16)
Leaf w t kg/ha (IMSO0401 SGT) TRT 1 Leaf w t kg/ha (IMSO0401 SGT) TRT 2
Leaf w t kg/ha (IMSO0401 SGT) TRT 3 Leaf w t kg/ha (IMSO0401 SGT) TRT 4

P.C.S. Traoré & al. © ICRISAT-IPR-IER-CIRAD-U. Florida, 2005WMO CLIMAG workshop, May 2005
Simulated growth (stem biomass)
0
2000
4000
6000
8000
10000
12000
14000
16000
20 40 60 80 100 120 140 160
Jours après semis
Mas
se d
es t
iges
(kg
/ha)
Stem w t kg/ha (W33-Jun22) Stem w t kg/ha (ICSMH-Jun22)
Stem w t kg/ha (W33-Jul16) Stem w t kg/ha (ICSMH-Jul16)
Stem w t kg/ha (IMSO0401 SGT) TRT 1 Stem w t kg/ha (IMSO0401 SGT) TRT 2
Stem w t kg/ha (IMSO0401 SGT) TRT 3 Stem w t kg/ha (IMSO0401 SGT) TRT 4

P.C.S. Traoré & al. © ICRISAT-IPR-IER-CIRAD-U. Florida, 2005WMO CLIMAG workshop, May 2005
Publications
Folliard A., P.C.S. Traoré, M. Vaksmann, M. Kouressy, 2004. Modeling of sorghum response to photoperiod: a threshold-hyperbolic approach, Field Crops Research 89:1, 59-70Traoré, P.C.S., A. Folliard, M. Vaksmann, C. Porter, M. Kouressy, J.W. Jones, 2004. Enhanced photoperiod response modeling for improved biomass simulation in a Sudanian carbon accounting framework, NASA Scientific Workshop on Land Management and Carbon Sequestration in West Africa (SW-LMCS), Bamako, Mali, 26-28 February 2004Traoré, P.C.S., N. Sakana, M.D. Doumbia, R.S. Yost, 2004. Accuracy assessment of ASTER digital elevation models for topography extraction at field and watershed levels, Mali Symposium on Applied Science (MSAS’2004), Bamako, Mali, 2-5 Aug. 2004Soumaré, M., M. Vaksmann, P.C.S. Traoré, M. Kouressy, 2004. Recent evolution of climate and consequences on adaptation for sorghum varieties in Mali (in French), MSAS’2004Traoré, P.C.S., 2005. The legacy of climate variability management in sudano-sahelian cropping systems: what prospects for the future? 6th Open Meeting of the Human Dimensions of Global Environmental Change Research Community, U. Bonn, Oct. 9-13, 2005 (also accepted for publication in Dovie, D.B.K., Chipanshi, A.C., Eds., Reframing sustainability issues in response to global governance and environmental change in Africa)Traoré, P.C.S., Vaksmann, M., Kouressy, M., Porter, C.H., 2005. Modeling of sorghum and millet development: simple phenotyping for photoperiod sensitivity assessment, to be submitted to Field Crops ResearchTraoré, P.C.S., Kouressy, M., Vaksmann, M., Bostick, W.M., 2005. Modeling biomass partitioning in West African sorghum landraces, in preparationBounguili, J.-E., 2004. Seasonal climate forecasting and agricultural risk in sudanian regions: what opportunities for improved sorghum varieties? The case of Sotuba, Mali. Ing. Degree dissertation (in French), Institut Polytechnique Rural de Katibougou, Univ. Bamako.Traoré, P.C.S., 2004. Current knowledge and explanatory models of climatic trends in the Niger River Basin. Contribution to Chapter 3 of the Expert Panel on the Future of the Niger River Basin, Institut de Recherche pour le Développement, IRD, Paris (in revision).Tabo, R., Bationo, A., Kandji, S., Traoré, P.C.S., 2005, Effects of global change on food systems in Africa, Chap. 7 in L. Otter et al. (Eds), Global Change and Africa (in preparation).

P.C.S. Traoré & al. © ICRISAT-IPR-IER-CIRAD-U. Florida, 2005WMO CLIMAG workshop, May 2005
Where are we now?
Advances: mostly on the crop modeling side Adapted “landrace-friendly” models for phenology (SG, ML) – in theory, more
consistent with short-day plant physiology and have more universal applicability Increasing # of parameterized landraces (as of today: 13) through simple
phenotyping method for PP sensitivity – in practice, change of 1 genetic coefficient requires re-computation of crop genetic sets in DSSAT-Century
impact on simulation of VPD using a modified PP response most important for crop cycles of 120+ days (ie, applicable to sudanian and northern guinean AEZ)
Ongoing work on biomass partitioning will further improve the simulation of yield components in landraces (e.g. stem growth before flowering)
Better prepared for future climate modeling breakthroughs? (AMMA,…) Strong interest from cotton parastatal CMDT (crop yield forecasting) – probably a
better entry point into smallholder livelihoods than staple cereals

P.C.S. Traoré & al. © ICRISAT-IPR-IER-CIRAD-U. Florida, 2005WMO CLIMAG workshop, May 2005
Where are we now? (continued)
Challenges: mostly on the climate modeling side From a risk-adverse farmer standpoint, skill remains modest at best (performance
of total rainfall prediction, relevance of predictands) Needed: a task force on rains onset prediction! Upfront model improvement – how can we help? (dynamic boundary conditions –
land surface, dynamical downscaling) – comparative advantages? Climate Prediction Tool?
Lack of communication between climate modelers, agricultural scientists, physiologists – e.g. CLIMAG-WA, AMMA…
Needed: improved access to RCM outputs – little usefulness of satellite-derived agro-meteorological surfaces for forecast validation from very coarse grids
Problem with .LAN formats in IRI online data library?

P.C.S. Traoré & al. © ICRISAT-IPR-IER-CIRAD-U. Florida, 2005WMO CLIMAG workshop, May 2005
Trailer section…

P.C.S. Traoré & al. © ICRISAT-IPR-IER-CIRAD-U. Florida, 2005WMO CLIMAG workshop, May 2005
Thank you to…
1. ATI participants !! – we need to thinkof ways to “institutionalize” this group !!
2. ATI sponsors and organizers – for their patience in bearing with a “ghost” trainee – I will improve I promise !
3. Hawa and Seyni – for the same reasons (they now qualify to start working for… START)


![Projet[Methode d_'Analyse Comparée][Barro Drissa et Traoré Ibrahim]](https://img.pdfslide.net/doc/110x75/5572001f49795991699ed6bb/projetmethode-danalyse-compareebarro-drissa-et-traore-ibrahim.jpg)