Embed Size (px)
Citation preview
A&A 570, L9 (2014)DOI: 10.1051/0004-6361/201424630c© ESO 2014
Astronomy&
Astrophysics
Letter to the Editor
Constraints on photoevaporation models from (lack of) radioemission in the Corona Australis protoplanetary disks�
Roberto Galván-Madrid1,2, Hauyu Baobab Liu3, Carlo Felice Manara1, Jan Forbrich4, Ilaria Pascucci5,Carlos Carrasco-González2, Ciriaco Goddi6, Yasuhiro Hasegawa3, Michihiro Takami3, and Leonardo Testi1,7,8
1 European Southern Observatory, Karl-Schwarzschild-Str. 2, 85748 Garching, Germanye-mail: [email protected]; [email protected]
2 Centro de Radioastronomía y Astrofísica, Universidad Nacional Autónoma de México, 58090 Morelia, Mexico3 Academia Sinica, Institute of Astronomy and Astrophysics, PO Box 23-141, Taipei 106, Taiwan4 Department of Astrophysics, University of Vienna, Türkenschanzstraße 17, 1180 Vienna, Austria5 Lunar and Planetary Laboratory, University of Arizona, Tucson, AZ 85721, USA6 Joint Institute for VLBI in Europe, Postbus 2, 7990 AA Dwingeloo, The Netherlands7 INAF-Osservatorio Astrofisico di Arcetri, Largo E. Fermi, 50125 Firenze, Italy8 Excellence Cluster Universe, Boltzmannstr. 2, 85748 Garching, Germany
Received 18 July 2014 / Accepted 24 September 2014
ABSTRACT
Photoevaporation due to high-energy stellar photons is thought to be one of the main drivers of protoplanetary disk dispersal. Thefully or partially ionized disk surface is expected to produce free-free continuum emission at centimeter (cm) wavelengths that can beroutinely detected with interferometers such as the upgraded Very Large Array (VLA). We use deep (rms noise down to 8 μJy beam−1
in the field of view center) 3.5 cm maps of the nearby (130 pc) Corona Australis (CrA) star formation (SF) region to constraindisk photoevaporation models. We find that the radio emission from disk sources in CrA is surprisingly faint. Only three out of tensources within the field of view are detected, with flux densities of about 102 μJy. However, a significant fraction of their emission isnonthermal. Typical upper limits for nondetections are 3σ ∼ 60 μJy beam−1. Assuming analytic expressions for the free-free emissionfrom extreme-UV (EUV) irradiation, we derive stringent upper limits to the ionizing photon luminosity that impinges on the disksurface ΦEUV < 1−4 × 1041 s−1. These limits constrain ΦEUV to the low end of the values needed by EUV-driven photoevaporationmodels to clear protoplanetary disks within the observed few Myr timescale. Therefore, at least in CrA, EUV-driven photoevaporationis unlikely to be the main agent of disk dispersal. We also compare the observed X-ray luminosities LX of disk sources with models inwhich photoevaporation is driven by such photons. Although predictions are less specific than for the EUV case, most of the observedfluxes (upper limits) are roughly consistent with the (scaled) predictions. Deeper observations, as well as predictions spanning a widerparameter space, are needed to properly test X-ray driven photoevaporation.
Key words. protoplanetary disks – stars: formation – stars: pre-main sequence
1. Introduction
The mechanisms that drive the dispersal of disks around youngstars are not well understood. Photoevaporation of the diskdriven by high-energy radiation from the central star is thoughtto act in concert with viscous accretion and the planet forma-tion. A recent review of the topic is presented by Alexanderet al. (2014). Several models have been put forward to describedisk photoevaporation, including analytical flow solutions (e.g.,Hollenbach et al. 1994; Gorti & Hollenbach 2009) and hydrody-namical simulations (e.g., Alexander et al. 2006; Owen et al.2010). Mid-infrared forbidden lines such as the [Ne II] havebeen used to infer the presence of photoevaporative flows (e.g.,Pascucci & Sterzik 2009) from disks around low-mass youngstellar objects (YSOs).
Pascucci et al. (2012) and Owen et al. (2013, hereafterPascucci12 and Owen13, respectively) published predictions forthe radio-continuum emission from (partially) ionized disk sur-faces around low-mass YSOs that may be photoevaporating.Pascucci12 showed that free-free emission from the disk surface
� Appendix A is available in electronic form athttp://www.aanda.org
is directly proportional to the ionizing stellar radiation1 thatreaches the disk. If the photoevaporation is driven by X-rays(hν > 0.1 keV), the interaction of photons with matter is morecomplex and the resulting gas temperatures and ionization frac-tion can depart considerably from the ∼104 K and ∼1 char-acteristic of the EUV case. The effects of far-UV radiation(6 < hν < 13.6 eV) add to the chemical complexity (Gorti &Hollenbach 2009), but this type of radiation is relevant even inphotoevaporation models dominated by X-ray heating since itregulates the destruction of molecular coolants. Deep radio ob-servations of many protoplanetary disks are needed to better con-strain photoevaporation models. Recently, Pascucci et al. (2014)analyzed the cm emission from 14 circumstellar disks and foundEUV photon luminosities (ΦEUV) lower than 1 × 1042 s−1 forsources with no jets and lower than 5 × 1040 s−1 for three oldersystems in their sample, thus placing a tight constraint on pho-toevaporation models.
In this Letter we analyze the 8.5 GHz (3.5 cm) continuumemission of the ten protoplanetary disks within our VLA field ofview toward the central part of the Corona Australis (hereafterCrA) star formation region. This nearby region has been studiedin the past at all wavelengths from the cm radio to the X-rays
1 The extreme-UV (EUV) radiation, with 13.6 < hν < 100 eV.
Article published by EDP Sciences L9, page 1 of 5
A&A 570, L9 (2014)
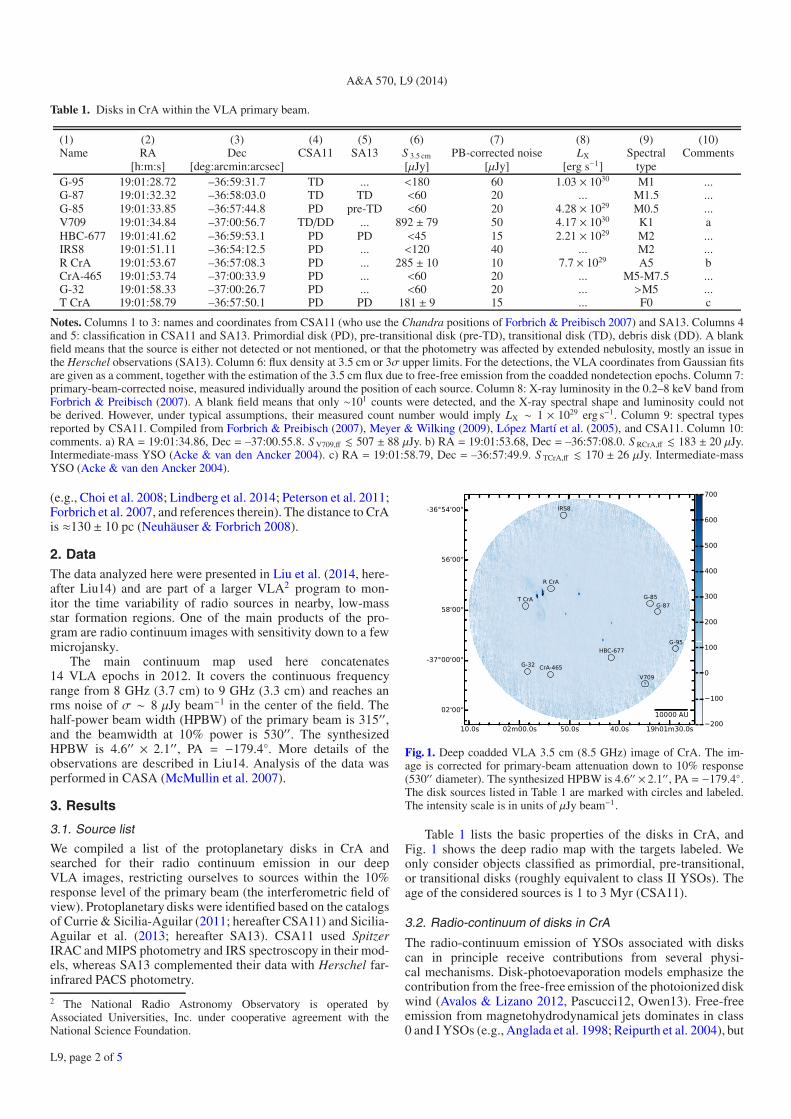
Table 1. Disks in CrA within the VLA primary beam.
(1) (2) (3) (4) (5) (6) (7) (8) (9) (10)Name RA Dec CSA11 SA13 S 3.5 cm PB-corrected noise LX Spectral Comments
[h:m:s] [deg:arcmin:arcsec] [μJy] [μJy] [erg s−1] typeG-95 19:01:28.72 –36:59:31.7 TD ... <180 60 1.03 × 1030 M1 ...G-87 19:01:32.32 –36:58:03.0 TD TD <60 20 ... M1.5 ...G-85 19:01:33.85 –36:57:44.8 PD pre-TD <60 20 4.28 × 1029 M0.5 ...V709 19:01:34.84 –37:00:56.7 TD/DD ... 892 ± 79 50 4.17 × 1030 K1 aHBC-677 19:01:41.62 –36:59:53.1 PD PD <45 15 2.21 × 1029 M2 ...IRS8 19:01:51.11 –36:54:12.5 PD ... <120 40 ... M2 ...R CrA 19:01:53.67 –36:57:08.3 PD ... 285 ± 10 10 7.7 × 1029 A5 bCrA-465 19:01:53.74 –37:00:33.9 PD ... <60 20 ... M5-M7.5 ...G-32 19:01:58.33 –37:00:26.7 PD ... <60 20 ... >M5 ...T CrA 19:01:58.79 –36:57:50.1 PD PD 181 ± 9 15 ... F0 c
Notes. Columns 1 to 3: names and coordinates from CSA11 (who use the Chandra positions of Forbrich & Preibisch 2007) and SA13. Columns 4and 5: classification in CSA11 and SA13. Primordial disk (PD), pre-transitional disk (pre-TD), transitional disk (TD), debris disk (DD). A blankfield means that the source is either not detected or not mentioned, or that the photometry was affected by extended nebulosity, mostly an issue inthe Herschel observations (SA13). Column 6: flux density at 3.5 cm or 3σ upper limits. For the detections, the VLA coordinates from Gaussian fitsare given as a comment, together with the estimation of the 3.5 cm flux due to free-free emission from the coadded nondetection epochs. Column 7:primary-beam-corrected noise, measured individually around the position of each source. Column 8: X-ray luminosity in the 0.2–8 keV band fromForbrich & Preibisch (2007). A blank field means that only ∼101 counts were detected, and the X-ray spectral shape and luminosity could notbe derived. However, under typical assumptions, their measured count number would imply LX ∼ 1 × 1029 erg s−1. Column 9: spectral typesreported by CSA11. Compiled from Forbrich & Preibisch (2007), Meyer & Wilking (2009), López Martí et al. (2005), and CSA11. Column 10:comments. a) RA = 19:01:34.86, Dec = –37:00.55.8. S V709,ff � 507 ± 88 μJy. b) RA = 19:01:53.68, Dec = –36:57:08.0. S RCrA,ff � 183 ± 20 μJy.Intermediate-mass YSO (Acke & van den Ancker 2004). c) RA = 19:01:58.79, Dec = –36:57:49.9. S TCrA,ff � 170 ± 26 μJy. Intermediate-massYSO (Acke & van den Ancker 2004).
(e.g., Choi et al. 2008; Lindberg et al. 2014; Peterson et al. 2011;Forbrich et al. 2007, and references therein). The distance to CrAis ≈130 ± 10 pc (Neuhäuser & Forbrich 2008).
2. DataThe data analyzed here were presented in Liu et al. (2014, here-after Liu14) and are part of a larger VLA2 program to mon-itor the time variability of radio sources in nearby, low-massstar formation regions. One of the main products of the pro-gram are radio continuum images with sensitivity down to a fewmicrojansky.
The main continuum map used here concatenates14 VLA epochs in 2012. It covers the continuous frequencyrange from 8 GHz (3.7 cm) to 9 GHz (3.3 cm) and reaches anrms noise of σ ∼ 8 μJy beam−1 in the center of the field. Thehalf-power beam width (HPBW) of the primary beam is 315′′,and the beamwidth at 10% power is 530′′. The synthesizedHPBW is 4.6′′ × 2.1′′, PA = −179.4◦. More details of theobservations are described in Liu14. Analysis of the data wasperformed in CASA (McMullin et al. 2007).
3. Results
3.1. Source list
We compiled a list of the protoplanetary disks in CrA andsearched for their radio continuum emission in our deepVLA images, restricting ourselves to sources within the 10%response level of the primary beam (the interferometric field ofview). Protoplanetary disks were identified based on the catalogsof Currie & Sicilia-Aguilar (2011; hereafter CSA11) and Sicilia-Aguilar et al. (2013; hereafter SA13). CSA11 used SpitzerIRAC and MIPS photometry and IRS spectroscopy in their mod-els, whereas SA13 complemented their data with Herschel far-infrared PACS photometry.
2 The National Radio Astronomy Observatory is operated byAssociated Universities, Inc. under cooperative agreement with theNational Science Foundation.
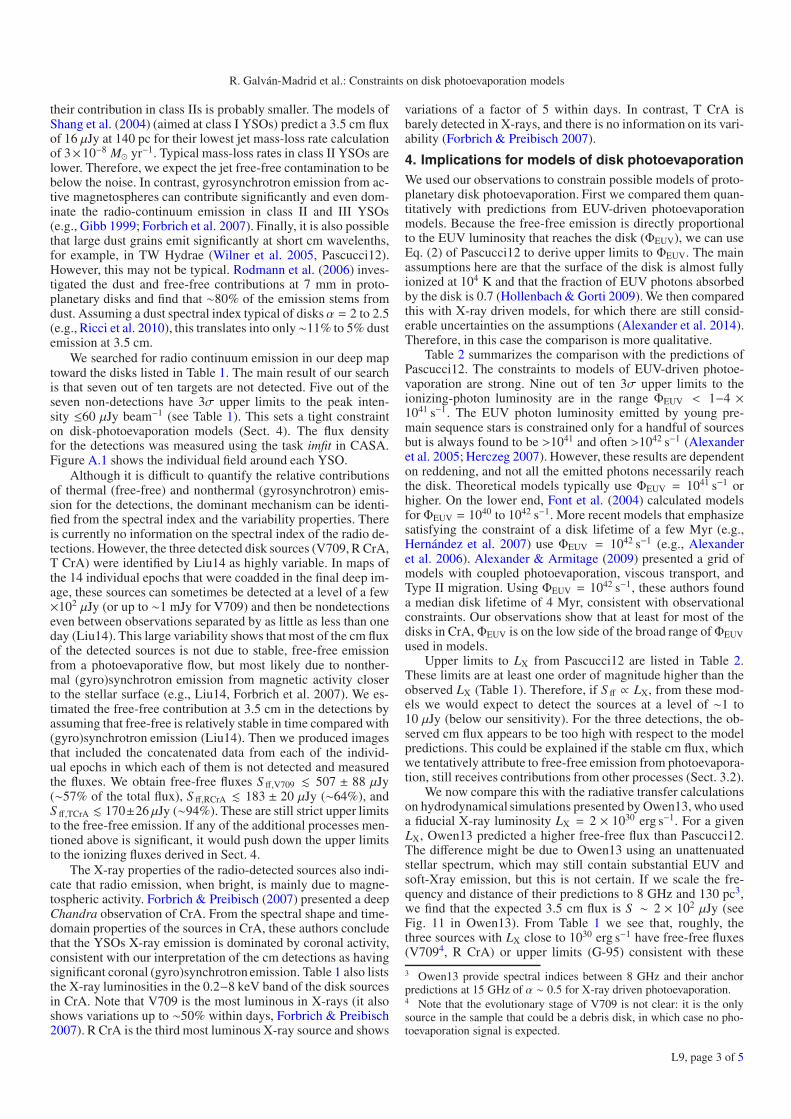
Fig. 1. Deep coadded VLA 3.5 cm (8.5 GHz) image of CrA. The im-age is corrected for primary-beam attenuation down to 10% response(530′′ diameter). The synthesized HPBW is 4.6′′ × 2.1′′, PA = −179.4◦.The disk sources listed in Table 1 are marked with circles and labeled.The intensity scale is in units of μJy beam−1.
Table 1 lists the basic properties of the disks in CrA, andFig. 1 shows the deep radio map with the targets labeled. Weonly consider objects classified as primordial, pre-transitional,or transitional disks (roughly equivalent to class II YSOs). Theage of the considered sources is 1 to 3 Myr (CSA11).
3.2. Radio-continuum of disks in CrA
The radio-continuum emission of YSOs associated with diskscan in principle receive contributions from several physi-cal mechanisms. Disk-photoevaporation models emphasize thecontribution from the free-free emission of the photoionized diskwind (Avalos & Lizano 2012, Pascucci12, Owen13). Free-freeemission from magnetohydrodynamical jets dominates in class0 and I YSOs (e.g., Anglada et al. 1998; Reipurth et al. 2004), but
L9, page 2 of 5
R. Galván-Madrid et al.: Constraints on disk photoevaporation models
their contribution in class IIs is probably smaller. The models ofShang et al. (2004) (aimed at class I YSOs) predict a 3.5 cm fluxof 16 μJy at 140 pc for their lowest jet mass-loss rate calculationof 3×10⁻⁸ M� yr−1. Typical mass-loss rates in class II YSOs arelower. Therefore, we expect the jet free-free contamination to bebelow the noise. In contrast, gyrosynchrotron emission from ac-tive magnetospheres can contribute significantly and even dom-inate the radio-continuum emission in class II and III YSOs(e.g., Gibb 1999; Forbrich et al. 2007). Finally, it is also possiblethat large dust grains emit significantly at short cm wavelenths,for example, in TW Hydrae (Wilner et al. 2005, Pascucci12).However, this may not be typical. Rodmann et al. (2006) inves-tigated the dust and free-free contributions at 7 mm in proto-planetary disks and find that ∼80% of the emission stems fromdust. Assuming a dust spectral index typical of disks α = 2 to 2.5(e.g., Ricci et al. 2010), this translates into only∼11% to 5% dustemission at 3.5 cm.
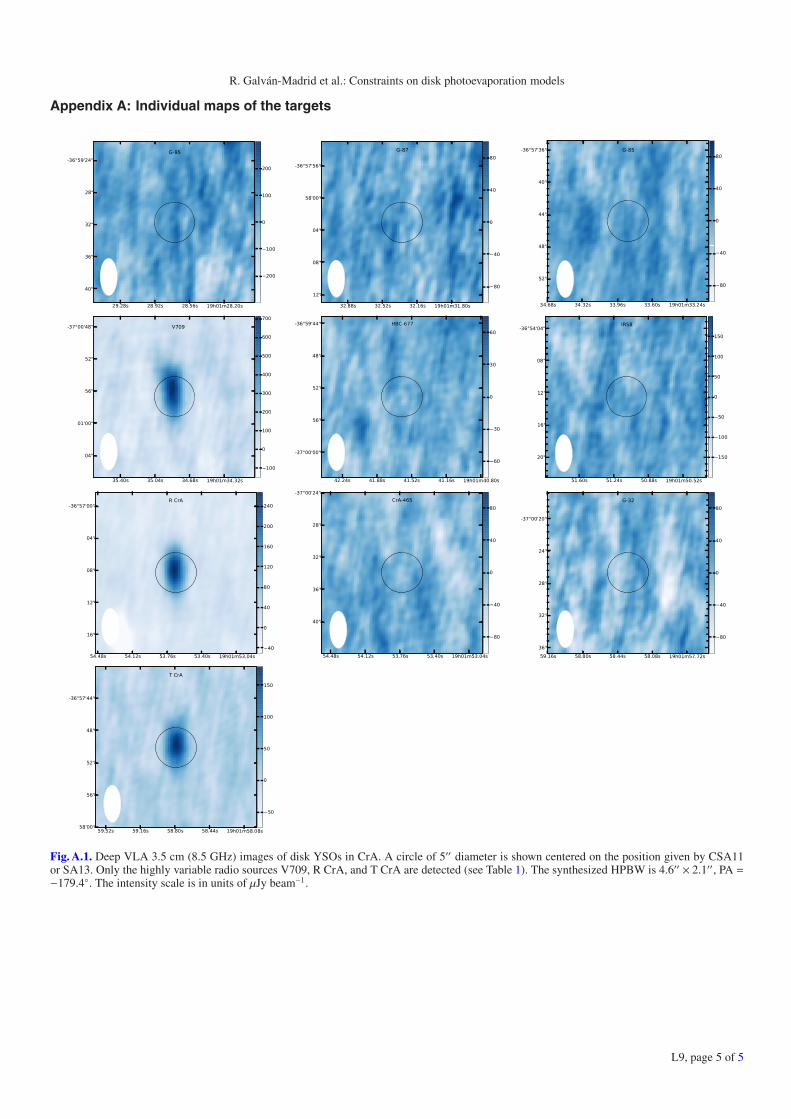
We searched for radio continuum emission in our deep maptoward the disks listed in Table 1. The main result of our searchis that seven out of ten targets are not detected. Five out of theseven non-detections have 3σ upper limits to the peak inten-sity ≤60 μJy beam−1 (see Table 1). This sets a tight constrainton disk-photoevaporation models (Sect. 4). The flux densityfor the detections was measured using the task imfit in CASA.Figure A.1 shows the individual field around each YSO.
Although it is difficult to quantify the relative contributionsof thermal (free-free) and nonthermal (gyrosynchrotron) emis-sion for the detections, the dominant mechanism can be identi-fied from the spectral index and the variability properties. Thereis currently no information on the spectral index of the radio de-tections. However, the three detected disk sources (V709, R CrA,T CrA) were identified by Liu14 as highly variable. In maps ofthe 14 individual epochs that were coadded in the final deep im-age, these sources can sometimes be detected at a level of a few×102 μJy (or up to ∼1 mJy for V709) and then be nondetectionseven between observations separated by as little as less than oneday (Liu14). This large variability shows that most of the cm fluxof the detected sources is not due to stable, free-free emissionfrom a photoevaporative flow, but most likely due to nonther-mal (gyro)synchrotron emission from magnetic activity closerto the stellar surface (e.g., Liu14, Forbrich et al. 2007). We es-timated the free-free contribution at 3.5 cm in the detections byassuming that free-free is relatively stable in time compared with(gyro)synchrotron emission (Liu14). Then we produced imagesthat included the concatenated data from each of the individ-ual epochs in which each of them is not detected and measuredthe fluxes. We obtain free-free fluxes S ff,V709 � 507 ± 88 μJy(∼57% of the total flux), S ff,RCrA � 183 ± 20 μJy (∼64%), andS ff,TCrA � 170±26 μJy (∼94%). These are still strict upper limitsto the free-free emission. If any of the additional processes men-tioned above is significant, it would push down the upper limitsto the ionizing fluxes derived in Sect. 4.
The X-ray properties of the radio-detected sources also indi-cate that radio emission, when bright, is mainly due to magne-tospheric activity. Forbrich & Preibisch (2007) presented a deepChandra observation of CrA. From the spectral shape and time-domain properties of the sources in CrA, these authors concludethat the YSOs X-ray emission is dominated by coronal activity,consistent with our interpretation of the cm detections as havingsignificant coronal (gyro)synchrotron emission. Table 1 also liststhe X-ray luminosities in the 0.2−8 keV band of the disk sourcesin CrA. Note that V709 is the most luminous in X-rays (it alsoshows variations up to ∼50% within days, Forbrich & Preibisch2007). R CrA is the third most luminous X-ray source and shows
variations of a factor of 5 within days. In contrast, T CrA isbarely detected in X-rays, and there is no information on its vari-ability (Forbrich & Preibisch 2007).
4. Implications for models of disk photoevaporationWe used our observations to constrain possible models of proto-planetary disk photoevaporation. First we compared them quan-titatively with predictions from EUV-driven photoevaporationmodels. Because the free-free emission is directly proportionalto the EUV luminosity that reaches the disk (ΦEUV), we can useEq. (2) of Pascucci12 to derive upper limits to ΦEUV. The mainassumptions here are that the surface of the disk is almost fullyionized at 104 K and that the fraction of EUV photons absorbedby the disk is 0.7 (Hollenbach & Gorti 2009). We then comparedthis with X-ray driven models, for which there are still consid-erable uncertainties on the assumptions (Alexander et al. 2014).Therefore, in this case the comparison is more qualitative.
Table 2 summarizes the comparison with the predictions ofPascucci12. The constraints to models of EUV-driven photoe-vaporation are strong. Nine out of ten 3σ upper limits to theionizing-photon luminosity are in the range ΦEUV < 1−4 ×1041 s−1. The EUV photon luminosity emitted by young pre-main sequence stars is constrained only for a handful of sourcesbut is always found to be >1041 and often >1042 s−1 (Alexanderet al. 2005; Herczeg 2007). However, these results are dependenton reddening, and not all the emitted photons necessarily reachthe disk. Theoretical models typically use ΦEUV = 1041 s−1 orhigher. On the lower end, Font et al. (2004) calculated modelsfor ΦEUV = 1040 to 1042 s−1. More recent models that emphasizesatisfying the constraint of a disk lifetime of a few Myr (e.g.,Hernández et al. 2007) use ΦEUV = 1042 s−1 (e.g., Alexanderet al. 2006). Alexander & Armitage (2009) presented a grid ofmodels with coupled photoevaporation, viscous transport, andType II migration. Using ΦEUV = 1042 s−1, these authors founda median disk lifetime of 4 Myr, consistent with observationalconstraints. Our observations show that at least for most of thedisks in CrA, ΦEUV is on the low side of the broad range ofΦEUVused in models.
Upper limits to LX from Pascucci12 are listed in Table 2.These limits are at least one order of magnitude higher than theobserved LX (Table 1). Therefore, if S ff ∝ LX, from these mod-els we would expect to detect the sources at a level of ∼1 to10 μJy (below our sensitivity). For the three detections, the ob-served cm flux appears to be too high with respect to the modelpredictions. This could be explained if the stable cm flux, whichwe tentatively attribute to free-free emission from photoevapora-tion, still receives contributions from other processes (Sect. 3.2).
We now compare this with the radiative transfer calculationson hydrodynamical simulations presented by Owen13, who useda fiducial X-ray luminosity LX = 2 × 1030 erg s−1. For a givenLX, Owen13 predicted a higher free-free flux than Pascucci12.The difference might be due to Owen13 using an unattenuatedstellar spectrum, which may still contain substantial EUV andsoft-Xray emission, but this is not certain. If we scale the fre-quency and distance of their predictions to 8 GHz and 130 pc3,we find that the expected 3.5 cm flux is S ∼ 2 × 10² μJy (seeFig. 11 in Owen13). From Table 1 we see that, roughly, thethree sources with LX close to 1030 erg s−1 have free-free fluxes(V7094, R CrA) or upper limits (G-95) consistent with these
3 Owen13 provide spectral indices between 8 GHz and their anchorpredictions at 15 GHz of α ∼ 0.5 for X-ray driven photoevaporation.4 Note that the evolutionary stage of V709 is not clear: it is the onlysource in the sample that could be a debris disk, in which case no pho-toevaporation signal is expected.
L9, page 3 of 5
A&A 570, L9 (2014)
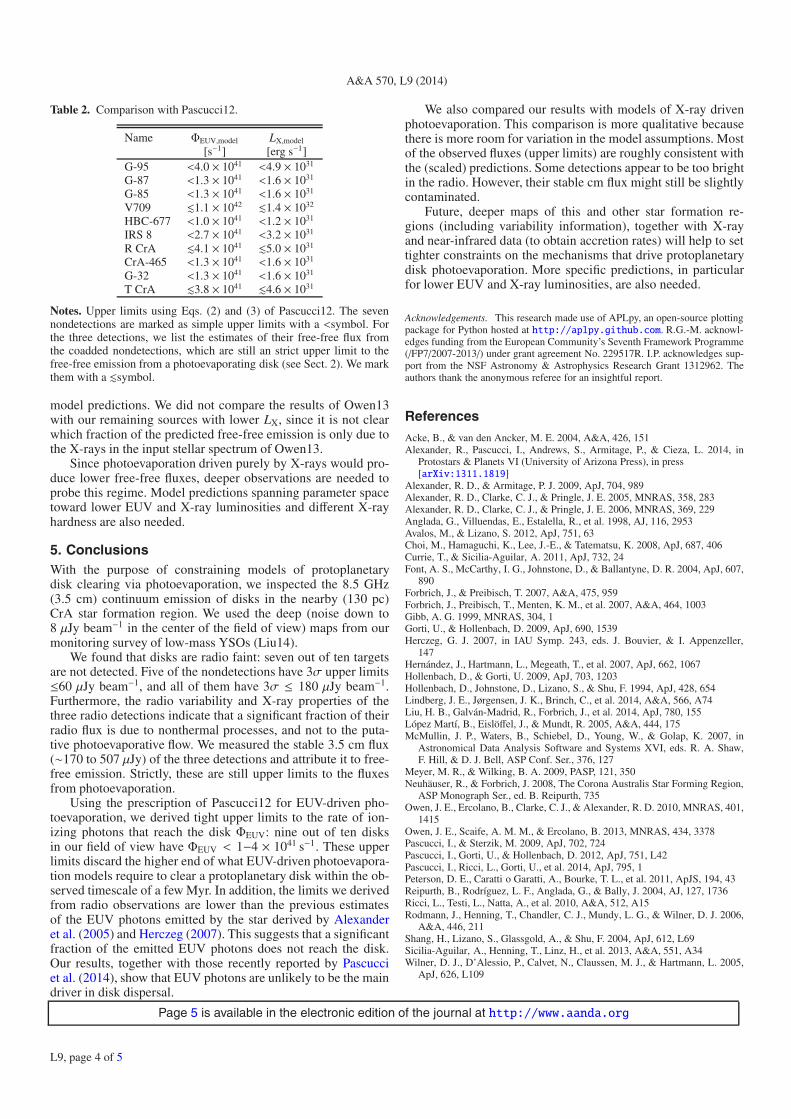
Table 2. Comparison with Pascucci12.
Name ΦEUV,model LX,model
[s−1] [erg s−1]G-95 <4.0 × 1041 <4.9 × 1031
G-87 <1.3 × 1041 <1.6 × 1031
G-85 <1.3 × 1041 <1.6 × 1031
V709 �1.1 × 1042 �1.4 × 1032
HBC-677 <1.0 × 1041 <1.2 × 1031
IRS 8 <2.7 × 1041 <3.2 × 1031
R CrA �4.1 × 1041 �5.0 × 1031
CrA-465 <1.3 × 1041 <1.6 × 1031
G-32 <1.3 × 1041 <1.6 × 1031
T CrA �3.8 × 1041 �4.6 × 1031
Notes. Upper limits using Eqs. (2) and (3) of Pascucci12. The sevennondetections are marked as simple upper limits with a <symbol. Forthe three detections, we list the estimates of their free-free flux fromthe coadded nondetections, which are still an strict upper limit to thefree-free emission from a photoevaporating disk (see Sect. 2). We markthem with a �symbol.
model predictions. We did not compare the results of Owen13with our remaining sources with lower LX, since it is not clearwhich fraction of the predicted free-free emission is only due tothe X-rays in the input stellar spectrum of Owen13.
Since photoevaporation driven purely by X-rays would pro-duce lower free-free fluxes, deeper observations are needed toprobe this regime. Model predictions spanning parameter spacetoward lower EUV and X-ray luminosities and different X-rayhardness are also needed.
5. ConclusionsWith the purpose of constraining models of protoplanetarydisk clearing via photoevaporation, we inspected the 8.5 GHz(3.5 cm) continuum emission of disks in the nearby (130 pc)CrA star formation region. We used the deep (noise down to8 μJy beam−1 in the center of the field of view) maps from ourmonitoring survey of low-mass YSOs (Liu14).
We found that disks are radio faint: seven out of ten targetsare not detected. Five of the nondetections have 3σ upper limits≤60 μJy beam−1, and all of them have 3σ ≤ 180 μJy beam−1.Furthermore, the radio variability and X-ray properties of thethree radio detections indicate that a significant fraction of theirradio flux is due to nonthermal processes, and not to the puta-tive photoevaporative flow. We measured the stable 3.5 cm flux(∼170 to 507 μJy) of the three detections and attribute it to free-free emission. Strictly, these are still upper limits to the fluxesfrom photoevaporation.
Using the prescription of Pascucci12 for EUV-driven pho-toevaporation, we derived tight upper limits to the rate of ion-izing photons that reach the disk ΦEUV: nine out of ten disksin our field of view have ΦEUV < 1−4 × 1041 s−1. These upperlimits discard the higher end of what EUV-driven photoevapora-tion models require to clear a protoplanetary disk within the ob-served timescale of a few Myr. In addition, the limits we derivedfrom radio observations are lower than the previous estimatesof the EUV photons emitted by the star derived by Alexanderet al. (2005) and Herczeg (2007). This suggests that a significantfraction of the emitted EUV photons does not reach the disk.Our results, together with those recently reported by Pascucciet al. (2014), show that EUV photons are unlikely to be the maindriver in disk dispersal.
We also compared our results with models of X-ray drivenphotoevaporation. This comparison is more qualitative becausethere is more room for variation in the model assumptions. Mostof the observed fluxes (upper limits) are roughly consistent withthe (scaled) predictions. Some detections appear to be too brightin the radio. However, their stable cm flux might still be slightlycontaminated.
Future, deeper maps of this and other star formation re-gions (including variability information), together with X-rayand near-infrared data (to obtain accretion rates) will help to settighter constraints on the mechanisms that drive protoplanetarydisk photoevaporation. More specific predictions, in particularfor lower EUV and X-ray luminosities, are also needed.
Acknowledgements. This research made use of APLpy, an open-source plottingpackage for Python hosted at http://aplpy.github.com. R.G.-M. acknowl-edges funding from the European Community’s Seventh Framework Programme(/FP7/2007-2013/) under grant agreement No. 229517R. I.P. acknowledges sup-port from the NSF Astronomy & Astrophysics Research Grant 1312962. Theauthors thank the anonymous referee for an insightful report.
ReferencesAcke, B., & van den Ancker, M. E. 2004, A&A, 426, 151Alexander, R., Pascucci, I., Andrews, S., Armitage, P., & Cieza, L. 2014, in
Protostars & Planets VI (University of Arizona Press), in press[arXiv:1311.1819]
Alexander, R. D., & Armitage, P. J. 2009, ApJ, 704, 989Alexander, R. D., Clarke, C. J., & Pringle, J. E. 2005, MNRAS, 358, 283Alexander, R. D., Clarke, C. J., & Pringle, J. E. 2006, MNRAS, 369, 229Anglada, G., Villuendas, E., Estalella, R., et al. 1998, AJ, 116, 2953Avalos, M., & Lizano, S. 2012, ApJ, 751, 63Choi, M., Hamaguchi, K., Lee, J.-E., & Tatematsu, K. 2008, ApJ, 687, 406Currie, T., & Sicilia-Aguilar, A. 2011, ApJ, 732, 24Font, A. S., McCarthy, I. G., Johnstone, D., & Ballantyne, D. R. 2004, ApJ, 607,
890Forbrich, J., & Preibisch, T. 2007, A&A, 475, 959Forbrich, J., Preibisch, T., Menten, K. M., et al. 2007, A&A, 464, 1003Gibb, A. G. 1999, MNRAS, 304, 1Gorti, U., & Hollenbach, D. 2009, ApJ, 690, 1539Herczeg, G. J. 2007, in IAU Symp. 243, eds. J. Bouvier, & I. Appenzeller,
147Hernández, J., Hartmann, L., Megeath, T., et al. 2007, ApJ, 662, 1067Hollenbach, D., & Gorti, U. 2009, ApJ, 703, 1203Hollenbach, D., Johnstone, D., Lizano, S., & Shu, F. 1994, ApJ, 428, 654Lindberg, J. E., Jørgensen, J. K., Brinch, C., et al. 2014, A&A, 566, A74Liu, H. B., Galván-Madrid, R., Forbrich, J., et al. 2014, ApJ, 780, 155López Martí, B., Eislöffel, J., & Mundt, R. 2005, A&A, 444, 175McMullin, J. P., Waters, B., Schiebel, D., Young, W., & Golap, K. 2007, in
Astronomical Data Analysis Software and Systems XVI, eds. R. A. Shaw,F. Hill, & D. J. Bell, ASP Conf. Ser., 376, 127
Meyer, M. R., & Wilking, B. A. 2009, PASP, 121, 350Neuhäuser, R., & Forbrich, J. 2008, The Corona Australis Star Forming Region,
ASP Monograph Ser., ed. B. Reipurth, 735Owen, J. E., Ercolano, B., Clarke, C. J., & Alexander, R. D. 2010, MNRAS, 401,
1415Owen, J. E., Scaife, A. M. M., & Ercolano, B. 2013, MNRAS, 434, 3378Pascucci, I., & Sterzik, M. 2009, ApJ, 702, 724Pascucci, I., Gorti, U., & Hollenbach, D. 2012, ApJ, 751, L42Pascucci, I., Ricci, L., Gorti, U., et al. 2014, ApJ, 795, 1Peterson, D. E., Caratti o Garatti, A., Bourke, T. L., et al. 2011, ApJS, 194, 43Reipurth, B., Rodríguez, L. F., Anglada, G., & Bally, J. 2004, AJ, 127, 1736Ricci, L., Testi, L., Natta, A., et al. 2010, A&A, 512, A15Rodmann, J., Henning, T., Chandler, C. J., Mundy, L. G., & Wilner, D. J. 2006,
A&A, 446, 211Shang, H., Lizano, S., Glassgold, A., & Shu, F. 2004, ApJ, 612, L69Sicilia-Aguilar, A., Henning, T., Linz, H., et al. 2013, A&A, 551, A34Wilner, D. J., D’Alessio, P., Calvet, N., Claussen, M. J., & Hartmann, L. 2005,
ApJ, 626, L109
Page 5 is available in the electronic edition of the journal at http://www.aanda.org
L9, page 4 of 5
R. Galván-Madrid et al.: Constraints on disk photoevaporation models
Appendix A: Individual maps of the targets
Fig. A.1. Deep VLA 3.5 cm (8.5 GHz) images of disk YSOs in CrA. A circle of 5′′ diameter is shown centered on the position given by CSA11or SA13. Only the highly variable radio sources V709, R CrA, and T CrA are detected (see Table 1). The synthesized HPBW is 4.6′′ × 2.1′′, PA =−179.4◦. The intensity scale is in units of μJy beam−1.
L9, page 5 of 5