Embed Size (px)
Citation preview

NBER WORKING PAPER SERIES
WHY DID THE DEMOCRATS LOSE THE SOUTH? BRINGING NEW DATA TOAN OLD DEBATE
Ilyana KuziemkoEbonya Washington
Working Paper 21703http://www.nber.org/papers/w21703
NATIONAL BUREAU OF ECONOMIC RESEARCH1050 Massachusetts Avenue
Cambridge, MA 02138November 2015
We thank Frank Newport and Jeff Jones for answering our questions about the Gallup data. We aregrateful to Alberto Alesina, Daron Acemoglu, Bill Collins, Marvin Danielson, Claudia Goldin, MattGentzkow, Alex Mas, Adrian Matray, Suresh Naidu, Jesse Shapiro, Seth Stephens-Davidowitz, GavinWright and seminar participants at Middlebury, NBER Summer Institute's Political Economy Workshop,NYU, Pomona, Princeton, Stanford SITE, Toronto, UBC, UCLA and Yale's CSAP Summer conference,particularly discussants Georgia Kernell and Nolan McCarthy, for valuable comments and feedback.Khurram Ali, Jimmy Charité, Joséphine Gantois, Keith Gladstone, Meredith Levine, Chitra Marti,Jenny Shen and Timothy Toh provided truly exceptional research assistance. The views expressedherein are those of the authors and do not necessarily reflect the views of the National Bureau of EconomicResearch.
NBER working papers are circulated for discussion and comment purposes. They have not been peer-reviewed or been subject to the review by the NBER Board of Directors that accompanies officialNBER publications.
© 2015 by Ilyana Kuziemko and Ebonya Washington. All rights reserved. Short sections of text, notto exceed two paragraphs, may be quoted without explicit permission provided that full credit, including© notice, is given to the source.

Why did the Democrats Lose the South? Bringing New Data to an Old DebateIlyana Kuziemko and Ebonya WashingtonNBER Working Paper No. 21703November 2015JEL No. D72,H23,J15,N92
ABSTRACT
After generations of loyalty, Southern whites left the Democratic party en masse in the second half ofthe twentieth century. To what extent did Democrats' 1960s Civil Rights initiatives trigger this exodus,versus Southern economic development, rising political polarization or other trends that made theparty unattractive to Southern whites? The lack of data on racial attitudes and political preferencesspanning the 1960s Civil Rights era has hampered research on this central question of American politicaleconomy. We uncover and employ such data, drawn from Gallup surveys dating back to 1958. From1958 to 1961, conservative racial views strongly predict Democratic identification among Southernwhites, a correlation that disappears after President Kennedy introduces sweeping Civil Rights legislationin 1963. We find that defection among racially conservative whites explains all (three-fourths) of thedecline in relative white Southern Democratic identification between 1958 and 1980 (2000). We offercorroborating quantitative analysis—drawn from sources such as Gallup questions on presidentialapproval and hypothetical presidential match-ups as well as textual analysis of newspapers—for thecentral role of racial views in explaining white Southern dealignment from the Democrats as far backas the 1940s.
Ilyana KuziemkoDepartment of EconomicsPrinceton University322 Wallace HallPrinceton, NJ 08544and [email protected]
Ebonya WashingtonYale UniversityBox 826437 Hillhouse, Room 36New Haven, CT 06520and [email protected]

1 Introduction
After generations of loyalty and despite the general stability of Americans’ party identi-
fication in adulthood, Southern whites left the Democratic party en masse in the second
half of the twentieth century.1 As illustrated in Figure 1, at mid-century white Southerners
(defined throughout as residents of the eleven states of the former Confederacy) were 25
percentage points more likely to identify as Democrats than were other whites, a gap that
disappeared by the mid 1980s and has since flipped in sign.2 Despite the massive, concurrent
enfranchisement of Southern blacks, who overwhelmingly favored the Democrats from 1964
onward, the resulting shifts in aggregate Southern political outcomes were stark: to take but
one example, in 1960, all U.S. senators from the South were Democrats, whereas today all
but three (of 22) are Republican.
This paper explores why this political shift occurred and in particular what share of it
was driven by racially conservative Southern whites’ reaction to the Democrats’ 1960s Civil
Rights initiatives, as opposed to other changes during the period (e.g., economic development
in the South). This central question of American political economy remains unresolved.
On one side are researchers who rely on more qualitative sources (interviews, speeches,
party platforms, correspondence and other historical sources) and conclude that Civil Rights
was the prime cause. While the Democratic party had been unequivocally associated with
segregationist Jim Crow policies from the end of Reconstruction until the middle of the
twentieth century, as early as the 1940s the Northern wing of the party began to support some
pro-Civil Rights positions. These scholars argue that Democratic presidents’ introduction and
signing of the Civil Rights (1964) and Voting Rights (1965) Acts—outlawing, respectively,
segregation in public accommodations and racial barriers to voting, both of which in practice
occurred primarily in the South—trigger the permanent exodus of many white Southerners
from the party.
On the other side are scholars whose more quantitative methods (correlations using re-
peated cross-sectional data, most typically the cumulative file of the ANES, the American
National Election Surveys) point to factors other than Civil Rights and race. These scholars
1Political scientists have found partisanship, like religion or ethnicity, to be a stable part ofan adult’s identity. The canonical reference is Campbell et al. (1966), with a more quantitativetreatment by Green et al. (2004).
2Authors’ calculation using Gallup micro data (more information on this data source is providedin Section 3). The eleven states of the former Confederacy are Alabama, Arkansas, Florida, Georgia,Louisiana, Mississippi, North Carolina, South Carolina, Tennessee, Texas and Virginia.
1

most often argue that economic development in the South made the redistributive policies of
the Democrats increasingly unattractive. Indeed, the a priori case for factors besides Civil
Rights is compelling. Southern dealignment, though much accelerated during the 1960s, was
(and perhaps still is) a slow moving trend.3 As we detail in Section 4, voters viewed Civil
Rights as the most important issue facing the country for a fleeting two to three year period,
undermining the case that it could be the underlying cause of a fifty-year trend. Moreover,
Southern dealignment coincides with massive economic catch-up in the region—from 1940 to
1980, per capita income in the South rose from 60 to 89 percent of the U.S. average—which
would predict a movement away from the more redistributive party.4 Beyond economic catch-
up, demographic change (driven by both Northern Republican migrants and younger voters
coming into the age of majority post-Jim Crow) and the liberalization of the Democratic
party on other issues such as abortion and welfare may have pushed whites in the region out
of the party.5
That disagreement could remain on the cause of this historic realignment may seem
surprising, but data limitations have severely hampered research on this question. Until
recently, consistently worded survey questions on racial attitudes from before and after the
major Civil Rights victories of the 1960s, have not been widely available. For example, as
we review in the next section, those authors using the cumulative ANES to address the role
of racial views on party alignment typically begin their analysis in the 1970s, well after the
Civil Rights and Voting Rights Acts.
In this paper, we employ a little used data source that allows us to analyze political iden-
tification and racial attitudes back to the 1950s. Beginning in 1958, Gallup asks respondents
“Between now and ..[election]... there will be much discussion about the qualifications of
presidential candidates. If your party nominated a well-qualified man for president, would
you vote for him if he happened to be a Negro?” Fortunately for our purposes, the wording
has remained consistent and the question has been asked repeatedly since that date.6 We
refer to those who do not answer in the affirmative as having “racially conservative views.”7
Having identified our measure of racial attitudes, we then define the pre- and post-periods
3We use the term “dealignment” instead of “realignment” in this paper as we focus on South-erners leaving the Democratic party—whether to join the Republicans, adopt independent status,or support third-party candidates such as Strom Thurmond or George Wallace.
4Authors’ calculation, Statistical Abstracts, various years.5We detail each of these arguments in the next Section.6Changes are very minor and are discussed in detail in Section 3.7We borrow this terminology from Feinstein and Schickler (2008).
2

by determining the moment at which the Democratic Party is first seen as actively pursuing
a more liberal Civil Rights agenda than the Republican Party. Conventional wisdom of the
race-as-cause view states that President Johnson famously “lost the South” with his signing
of the Civil Rights Act of 1964. However, marshaling contemporaneous media sources, survey
questions on respondents’ views on issue importance and parties’ positions on racial equality,
we identify instead the Spring of 1963—when John F. Kennedy first proposed legislation
barring discrimination in public accommodations—as the critical moment when Civil Rights
is, for the first time, an issue of great importance to the majority of Americans and an issue
clearly associated with the Democratic Party.
The central part of our exploration of the role of racial views in explaining white Southern
dealignment focuses on a triple-difference analysis: how much of the pre- versus post-period
decrease in Democratic party identification among Southern versus other whites is explained
by the differential decline among those Southerners with conservative racial attitudes? We
find that racial attitudes have little if any explanatory power for non-Southern whites’ party
identification in either period. In the South, conservative racial views strongly predict Demo-
cratic identification in the pre-period, but this correlation is wiped out between August 1961
and August 1963 (the last poll of the pre- and the first poll of the post-period, respectively).
Most important to the question at hand, the entire 17 percentage-point decline in Demo-
cratic party identification between 1958 and 1980 is explained by the 19 percentage point
decline among Southern whites with conservative racial views. Extending the post-period
through 2000, 77% of the 20 percentage-point drop is explained by the differential drop
among Southern whites with conservative racial views. This pattern of results is robust to
controlling flexibly for socioeconomic status measures included in the Gallup data and is
highly evident in event-time graphical analysis as well.
We complement this main result with a variety of additional evidence corroborating the
central role of racial views in the decline of the white Southern Democrat. Whereas Gallup
only asks the black president question every one to two years, it asks its signature “pres-
idential approval” question roughly once a month during our sample period. We can thus
perform a high-frequency analysis surrounding our key moment of Spring of 1963 by corre-
lating presidential approval for the Democratic president (John F. Kennedy) in the South
versus the non-South, with the daily count of newspaper articles that include the President’s
name along with terms related to Civil Rights. The most striking result is the 35 percentage
point drop in his support among whites in the South (compared to no change among other
3

whites and a rise among all blacks) between the April 6th and June 23rd 1963 Gallup polls
(which correspond to a surge of articles covering Kennedy’s support of protesters during
Martin Luther King’s Birmingham campaign in May and the president’s televised proposal
of the Civil Rights Bill on June 11th). Smaller Civil Rights moments (e.g., the integration of
Ole Miss in September 1962) also match up to significant dips in Kennedy’s relative approval
among Southern whites. Even when we flexibly control for the influence of other events and
issues—allowing Southerners to have different reactions to news regarding Cuba, the So-
viet Union, Social Security, etc.—Civil Rights retains its overwhelming explanatory power
in predicting divergence in his popularity among Southern whites relative to other whites.
The 1960s not only witnessed watershed moments for Civil Rights, but also other im-
portant political and social changes. However, we find little role for coincident trends in
explaining white Southern dealignment from the Democratic party. For example, recent
work argues the 1960s marks the end of a period of political consensus between Democrats
and Republicans, especially on economic and redistributive issues (McCarty et al., 2006). If
white Southerners were always more conservative, then rising polarization may explain why
they differentially begin to leave the Democrats in the 1960s. Yet we find that—except for
issues involving racial integration and discrimination—whites in the South and elsewhere
have indistinguishable preferences on both domestic and foreign policy in the 1950s. More-
over, while the 1960s also saw the political organization of women and other minority groups,
we find no evidence that white Southerners who have negative views of women, Catholics
or Jews differentially leave the Democratic party in 1963—the exodus is specific to those
who are racially conservative. Finally, we find no role for Southern economic development
in explaining dealignment—no matter how flexibly we control for income, suburbanization
or other proxies, economic development can explain essentially none of the relative decline
in white Southern Democratic identification.
Finally, we make some progress on quantifying the role of racial attitudes in party identi-
fication during earlier decades. While our central data source begins in 1958, the evolution of
the Democratic Party on Civil Rights has a longer history. As is evident in Figure 1, Southern
whites begin to leave the Democrats before our main analysis period begins, especially in the
late 1940s and early 1950s. While our data from this earlier period is decidedly more limited
and thus results should be viewed more cautiously, we again find that racial conservatives
lead the exit. We show that white support of Democrat Harry Truman’s 1948 candidacy in
the South versus elsewhere is inversely related to media mentions of his name alongside Civil
4

Rights terms (and in particular takes a nosedive after he introduces Civil Rights legislation
in February of 1948). In a 1952 cross-section, we show that Southerners who had left the
Democratic party by that date were more likely to have racially conservative views than
those who remain. We again find no role for income growth in explaining this earlier period
of dealignment.
Our work speaks to the large literature on whether political and policy preferences in the
US are motivated by class versus racial or ethnic identification. We find that, consistent with
work that argues that racial fractionalization helps explain “American exceptionalism” in
terms of limited redistribution (Alesina and Glaeser, 2004; Lee and Roemer, 2006; Luttmer,
2001), that during this key period racial attitudes and not other policy preferences explain
the entire white Southern shift away from the Democrats.
Our findings further shed light on redistributive patterns within the US. First, race-based
dealignment offers an explanation for why the poorest part of the country now serves as the
base for the Republicans, the party less supportive of redistribution.8 Second, our findings
provide a potential explanation for why—in stark contrast to the median voter model’s
prediction (Meltzer and Richard, 1981)— redistribution in the US has receded since the
1970s, even as income inequality has risen. Our results suggest that a large voting bloc left
the more redistributive political party over largely non-economic issues, reducing political
support for redistributive policies just when theory would predict that they should begin to
become more popular.
The paper proceeds as follows. In Section 2, we review the debate between the more
qualitative “Civil-Rights-as-cause” and more quantitative “other-trends-as-cause” sides of
the literature. In Section 3, we introduce the Gallup micro data, and in particular our key
question on racial attitudes. In Section 4, we justify our use of the Spring of 1963 as the
key moment that separates the “pre-” and “post-periods.” In Section 5, we present results
both from the triple-differences analysis as well as the high-frequency analysis on Kennedy’s
approval. In Section 6, we more directly address the remaining arguments of the research
arguing for causes besides Civil Rights. In Section 7 we offer some concluding thoughts and
ideas for future work.
8A recent policy manifestation of this pattern is the refusal of almost all Southern states toexpand Medicaid coverage to poor adults under the Affordable Care Act, despite the fact thatthe South remains the poorest region of the country, even when considering only whites (authors’calculation using 2013 ACS).
5

2 Debate Over the Role of Race in Southern Dealignment
The literature on the role of race in Southern politics is vast, and our attempts to summarize
it here cannot do it proper justice. Almost all reviews start with V.O Key’s Southern Politics
in State and Nation. Key memorably wrote, “[w]hatever phase of the southern political
process one seeks to understand, sooner or later the trail of inquiry leads to the Negro”
(Key Jr, 1949). Drawing on hundreds of interviews with Southern politicians and journalists,
the book provides a state-by-state analysis of how race influenced Southern politics, but given
its 1949 publication cannot directly speak to the coming large-scale 1960s dealignment.
Carmines and Stimson (1989) is a modern update on this seminal work, using historical
material (e.g., interviews, party platforms, and speech transcripts) as well as some survey
tabulations to argue that race was the motivating factor in the dealignment, as “racially
conservative white southerners felt betrayed” when President Lyndon Johnson, a Texan,
navigated the passage of the 1964 Civil Rights Act (CRA).
Those who argue against Civil Rights as the main cause of dealignment emphasize the lack
of quantitative backing for the race claim. Shafer and Johnston (2009) are quite emphatic in
this regard: “Yet if these propositions [our quantitative approach] appear almost elementary
as an analytic strategy, they bump up against an established literature of Southern politics—
charming and richly contextualized, but also unsystematic and deeply inbred.” But even on
the more quantitative side of the debate, few if any authors perform formal econometric
decompositions of the share of dealignment that can be explained by racial attitudes versus
other factors. The authors more typically employ the cumulative file of the ANES (and to a
somewhat lesser extent the General Social Survey) to offer a variety of evidence (often cross
tabulations) relating to the question.
While some papers in the quantitative literature argue for the primacy of racial attitudes
in explaining dealignment, the majority argue that the role of Civil Rights and race has been
vastly overstated.9 We group their arguments into four main categories.
Economic development in the South. Shafer and Johnston (2009) argue that in-
come growth in the South was the key driver of dealignment (and in fact contend that Civil
9Quantitative papers that conclude that racial views are key to dealignment include Valentinoand Sears (2005), who use the GSS and cumulative ANES to show that, in the South relativeto elsewhere, whites report more racially conservative views and that racial views have greaterpredictive power for whites’ party identification. McVeigh et al. (2014) use county-level data toshow that the presence of a Ku Klux Klan chapter in 1960 predicts higher vote shares for Goldwater(in 1964), George Wallace (in 1968), and more generally for Republicans in the elections since.
6

Rights, by introducing a strongly Democratic black voting bloc to the South, on net slowed
the natural process of dealignment). They show via cross tabulations that, relative to the
1950s, in more recent decades it is economically conservative Southern whites who identify as
Republican (they generally do not compare this trend to that among non-Southern whites).10
Also using the ANES cumulative file, Brewer and Stonecash (2001) run a regression “horser-
ace” between racial issues and income in predicting party identification and presidential and
House support, again focusing on Southern whites in isolation. They find a larger coefficient
on income, though given the limited ANES questions on race, their regression analysis starts
in the 1970s.11
Interestingly, economists who have studied Southern economic development lay out a re-
verse chain of events, arguing that both major Civil Rights victories and large-scale dealign-
ment preceded major economic catch-up in the region. Wright (2013) contends that employ-
ment and public accommodations desegregation in fact caused economic growth, by allowing
businesses to, respectively, hire from larger pools of workers and serve larger pools of cus-
tomers. Besley et al. (2010) argues that political competition brought on by the Voting
Rights Act made the region’s politicians propose more pro-growth economic policies.12
Changing selection into the South. The South experienced net in-migration after
1960. Given the large Democratic advantage in the South during much of the 20th century, in-
migrants from the non-South would tend to be more Republican (Gimpel and Schuknecht,
2001 and Trende, 2012). However, Stanley (1988) uses ANES data to show that the vast
majority of the overall decline is accounted for by native Southern whites, as the migrant
population is simply too small to drive the effect. Age has also been considered as a dimension
of dealignment that weakens the race case: Wattenberg (1991) argues that Southern whites
who came of age since Jim Crow have in fact driven the dealignment, though Osborne et al.
(2011) finds that the shift has taken place among all cohorts.
10In a wide-ranging critique of Shafer and Johnston, Kousser (2010) argues that growing socialdesirability of progressive racial views may mean that in more recent years racially conservativewhites merely adapt the language of economic conservatism.
11Note that they are not decomposing what share of the change is explained by income versusracial views, but instead estimating which factor has greater explanatory power, separately bydecade.
12In related work, Alston and Ferrie (1993) argue that certain aspects of Southern economicdevelopment should have made Democratic policies more attractive to whites in the region. Inparticular, the mechanization of cotton production in the 1960s meant that Southern elites nolonger needed a large labor force whose loyalty they once ensured in part by informally providingblack workers with public goods such as medical care and protection from violent whites and werethus more open to Democratic public safety net programs.
7

Issues other than Civil Rights. Did Southern whites leave the Democratic Party,
or did the Democratic Party leave Southern whites, by taking more liberal positions on
redistribution, free speech, abortion and issues other than Civil Rights? Abramowitz and
Saunders (1998) argue the latter view using the ANES to demonstrate that in the post-
Civil Rights period ideology (how liberal or conservative the respondent is), as well as views
on social welfare and security, are better predictors than racial views of Southern white
partisanship.
The timing of dealignment. Trende (2012) argues that the slow-moving nature of
Southern dealignment undermines the argument that Civil Rights was the prime trigger,
given that Congress passed the major pieces of Civil Rights legislation in a concentrated
period in the mid-1960s. He concludes that “the gradual realignment of the South had
been going for nearly forty years by 1964 and continued at a glacial pace after that.” He
points to the 1960 election as a key piece of evidence for secular causes: “That [Republican
Richard] Nixon could do so well in the South while part of an administration that had
finished desegregating Washington, argued that segregation was unconstitutional before the
Supreme Court ... implemented [desegregation] with a show of force in Little Rock, and
pushed through the Civil Rights Acts of 1957 and 1960 seems astonishing, until you realize
that economics, rather than race, was primarily driving the development of Southern politics
at the time.” Section 6.3 analyzes the timing of dealignment in detail.
Although both large and contentious, the literature on the cause of dealignment has a
clear gap: Due to the limitations of standard data sets, existing quantitative work is unable
to examine racial attitudes before Civil Rights was a key political issue (and often not until
several years after that). Even Shafer and Johnston, the authors perhaps most associated
with the argument that economic development triggered dealignment, write: “Introducing
racial attitudes...will prove more difficult....because there is less substantive consistency in
the opinion items asked by the [A]NES in the realm of race policy for the full postwar period.”
Due to this limitation, a standard econometric decomposition of the share of dealignment
accounted for by those with conservative racial views has not been possible.
As we describe in the following section, we have identified a consistent measure of racial
attitudes dating back to 1958 by turning to a data source little used by social scientists.
8
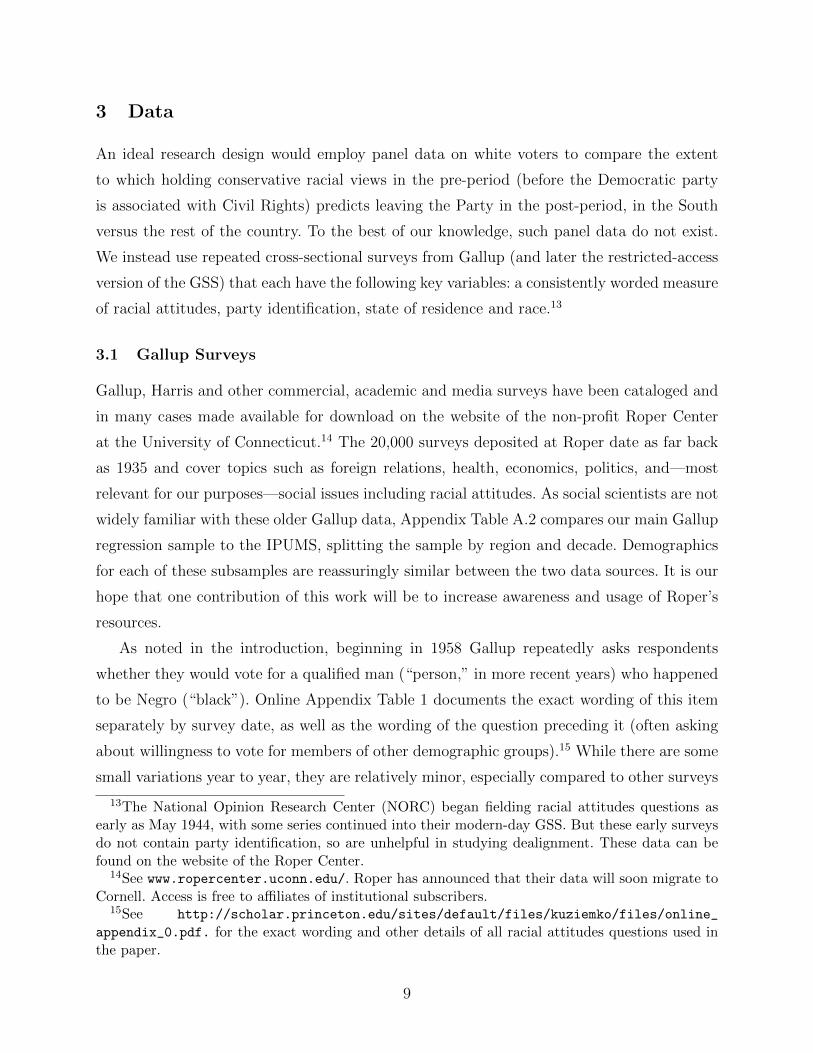
3 Data
An ideal research design would employ panel data on white voters to compare the extent
to which holding conservative racial views in the pre-period (before the Democratic party
is associated with Civil Rights) predicts leaving the Party in the post-period, in the South
versus the rest of the country. To the best of our knowledge, such panel data do not exist.
We instead use repeated cross-sectional surveys from Gallup (and later the restricted-access
version of the GSS) that each have the following key variables: a consistently worded measure
of racial attitudes, party identification, state of residence and race.13
3.1 Gallup Surveys
Gallup, Harris and other commercial, academic and media surveys have been cataloged and
in many cases made available for download on the website of the non-profit Roper Center
at the University of Connecticut.14 The 20,000 surveys deposited at Roper date as far back
as 1935 and cover topics such as foreign relations, health, economics, politics, and—most
relevant for our purposes—social issues including racial attitudes. As social scientists are not
widely familiar with these older Gallup data, Appendix Table A.2 compares our main Gallup
regression sample to the IPUMS, splitting the sample by region and decade. Demographics
for each of these subsamples are reassuringly similar between the two data sources. It is our
hope that one contribution of this work will be to increase awareness and usage of Roper’s
resources.
As noted in the introduction, beginning in 1958 Gallup repeatedly asks respondents
whether they would vote for a qualified man (“person,” in more recent years) who happened
to be Negro (“black”). Online Appendix Table 1 documents the exact wording of this item
separately by survey date, as well as the wording of the question preceding it (often asking
about willingness to vote for members of other demographic groups).15 While there are some
small variations year to year, they are relatively minor, especially compared to other surveys
13The National Opinion Research Center (NORC) began fielding racial attitudes questions asearly as May 1944, with some series continued into their modern-day GSS. But these early surveysdo not contain party identification, so are unhelpful in studying dealignment. These data can befound on the website of the Roper Center.
14See www.ropercenter.uconn.edu/. Roper has announced that their data will soon migrate toCornell. Access is free to affiliates of institutional subscribers.
15See http://scholar.princeton.edu/sites/default/files/kuziemko/files/online_
appendix_0.pdf. for the exact wording and other details of all racial attitudes questions used inthe paper.
9

during this time (we detail the deficiencies of the ANES in this regard in Appendix B). For
ease of exposition, we refer to this survey item as the “black president question.”
In addition to consistency, a second advantage of the black president item is that Gallup
fielded it quite frequently during our key sample period. The question is asked in nine
separate surveys between 1958 and 1972. While the question is asked less frequently after
1972, we are fortunate that beginning in 1974 we can include the geo-coded restricted-use
version of the GSS (see Online Appendix Table 2 for exact wording and preceding question
in the GSS). As such, between 1958 and 1980 (2000), the black president item (as well as
the other variables we need for the analysis) was collected by either Gallup or GSS on 14
(29) separate occasions.16
A final strength of the black president item is its specificity: it refers to a single, hypo-
thetical (at least during our key sample period) concept. For example, the GSS has, since
1972, asked whether the government should “help” blacks, which is not only vague but also
might be interpreted differently in 1972 than in 2000. Similarly, Gallup also queries white
respondents—much less frequently than they do about a black president—about whether
they would move if blacks came to reside next door or in their neighborhoods in great num-
bers.17 But responses to these questions will vary not only by feelings about racial equality
but also by the actual integration of one’s present neighborhood, not to mention housing
density (“next door” is a different concept in an apartment building versus a farm). The
black president question suffers from no such contextual bias: it should be interpreted simi-
larly for Southerners and non-Southerners, rich and poor, urban and rural. Nonetheless, as
we demonstrate in Appendix Table A.1, views toward a black president are highly correlated
with other GSS measures of racial attitudes, including questions on interracial socializing,
school integration, government aid to blacks, and blacks “pushing” themselves into places
they are not wanted.
While we believe the Gallup data have allowed us to make an important step forward
in answering the question at hand, they are not without their limitations. The most impor-
tant given our context is limited control variables for income and place of birth (given the
arguments that Southern income growth and Northern migrants played key roles in dealign-
16The GSS fields this question in 1972 as well, but only beginning in 1974 are state identifiersavailable.
17Gallup also poses, again less frequently than the black president question, questions on schoolintegration, but unfortunately only to parents of school-aged children, greatly reducing samplesizes.
10

ment). To rule out income and migration as alternative hypotheses we turn to alternative
data sources, most frequently the ANES, a nationally representative repeated cross-sectional
survey of the political and social opinions of voting-age Americans conducted in the fall of
most midterm and all presidential election years.18
3.2 Summary statistics
Table 1 provides summary statistics for our basic Gallup analysis sample (whites age 21
and above who live in the continental US) from 1958 to 1980 (our standard sample period,
though we demonstrate robustness to various endpoints), by pre-and post-period.19 We once
again see the large decline in Southern Democratic Party affiliation across the two time
periods. Not surprisingly, we also see a concurrent increase in education and urbanicity in
both regions. Table 1 also describes our ANES sample—while levels occasionally differ from
Gallup due, in part, to different variable definitions, we see the same trends over time and
region.
In Appendix Figure A.1 we graph the responses to the black president over time in the
combined GSS and Gallup samples, denoting the data set from which each point is drawn.
Note that this figure includes non-whites, whereas unless noted all of the analysis that follows
does not. In years where we have both GSS and Gallup data, the shares willing to vote for
a black president are nearly identical, suggesting that both surveys are collecting data from
very similar (presumably representative) universes. The series as a whole depicts a marked
increase in stated views on racial equality, at least as measured by this question.20
While Appendix Figure A.1 is interesting in demonstrating the rapid change that occurred
in attitudes toward race relations nationally, Figure 2 introduces the views of our analysis
18The ANES does not include state identifiers until 1952, so we cannot use earlier years in ouranalysis.
19Both Gallup and GSS claim to be nationally representative surveys of adult Americans. Weuse the provided survey weights—the GSS for all years and Gallup for 1968 forward—to adjustfor sampling error. We are indebted to Jeff Jones at Gallup for his instructions on weighting olderGallup surveys. To establish a stable sample of voters, we exclude those under age 21 as well asAlaskans and Hawaiians, as they were not eligible to vote in early years of our sample period.
20In 1958 fewer than forty percent say they would be willing to vote for an equally qualified blackcandidate, where by 1975 that share is just over eighty percent, a rate of change more rapid thanthe more recent evolution on same-sex marriage. Over the seventeen-year period between 1996 and2013, support for gay marriage in Gallup polls rose from 27 to 54 percent, a slightly slower pacein both absolute and proportional terms. See http://www.gallup.com/poll/1651/gay-lesbian-
rights.aspx.
11

sample, separately for the South and non-South.21 While only about ten percent of white
Southerners are willing to vote for a black person at the series’ beginning (versus just under
forty percent of whites elsewhere), whites in both regions increase at the same (rapid) rate
through about 1970, after which point there is more rapid (though never complete) Southern
catch-up.
For completeness, in Appendix Figure A.2 (a) and (b) we graph for all available years
the other two Gallup survey questions on racial attitudes: the questions that ask whether
the respondent would move if a black person moved next door or if blacks moved into the
neighborhood in great numbers. The same pattern of substantial (but incomplete) Southern
convergence holds.
4 Methodological Approach
4.1 Defining pre- and post-periods
Before 1958, we do not have any consistent, repeated measure of racial attitudes, and thus
our main analysis is restricted to 1958 and beyond (we return in detail but with poorer
data to earlier episodes of dealignment in Section 6.3). To define pre- and post-periods for
our main analysis sample, we need to identify the moment during this period when voters’
views of the parties’ Civil Rights positions undergoes its most substantial change. A useful
benchmark for attitudes toward the parties at the beginning of the period comes from an
April 1960 Gallup survey in which voters did not discern meaningful differences between the
parties on this issue. The plurality of voters (28%) said the Republican Party was “doing the
most for Negroes,” 25% said the Democrats, with 19% saying there was no difference and
the remainder saying they had no opinion.22 Nor did American elites appear to view Civil
Rights as a pressing issue at the time. For example, in all four presidential debates of 1960,
only a single question on the issue was asked.
Evidence from the ANES: The shift occurs between 1960 and 1964. To pin
down the point during our sample period when views on the parties’ positions most sig-
nificantly shift, we would ideally employ a consistent repeated survey question that asks
respondents which party they believe will do more to promote equality between whites and
21In this focal sample we have roughly 2,000 observations per survey in the Gallup data and1,200 observations per survey in the GSS data.
22Summary statistics from Gallup survey fielded March 30 to April 4, 1960, accessed online viaipoll. Dataset ID: 1960-0626.
12

blacks. Unfortunately we were unable to find such a question. We come close, however. Us-
ing the individual-year files of the ANES, we can compare a 1960 item asking “which party
is more likely to stay out of the question of whether white and colored children go to the
same schools” with 1964 and 1968 items asking which party is more likely to “see to it that
white and Negro children go to the same schools.” Figure 3 shows that in 1960, only 13%
of Southern whites see the Democrats as the party pushing for school integration, 22% say
Republicans, and the rest see no difference. Non-Southern whites see essentially no difference
between the parties on this issue in 1960.
A dramatic shift occurs sometime between 1960 and 1964. By 1964, 45% of Southern
whites now see the Democrats as more aggressive on promoting school integration, whereas
the share seeing Republicans as more aggressive has fallen to 16%. Non-Southerners’ assess-
ment shifts similarly. The large gap in voters’ perception of the parties on school integration
that emerges in 1964 holds steady in 1968.23
Evidence from newspapers: The shift occurs in Spring of 1963. The ANES cannot
tell us at what point between 1960 and 1964 the Democrats are first viewed by voters as the
party of Civil Rights. To further pinpoint that moment, we use higher-frequency data, but
these data admittedly provide less direct evidence.
The leader of the Democratic party during most of the 1960 to 1964 period was President
John F. Kennedy. Kennedy was not a consistent supporter of Civil Rights throughout his
presidency. Just as his Republican predecessor Eisenhower sent federal troops to forcibly inte-
grate Little Rock Central High School, Kennedy intervened to end the violence against both
the “freedom riders,”—the protesters who organized to integrate interstate bus service—
in 1961, and James Meredith, who integrated the University of Mississippi in 1962. But
Kennedy also disappointed movement leaders with his inaction, including a January 1962
press conference pledging not to move ahead of public opinion on Civil Rights and his ap-
pointment of segregationist federal judges in the South. Thus, it is unlikely that voters would
have predicted his June 1963 proposal of sweeping Civil Rights legislation, even a few months
before that date.
Unfortunately we do not have polling data that directly speaks to the evolution of voters’
perception of Kennedy’s commitment to the issue. Instead we turn to the New York Times
23ANES also asks a question related to employment and housing discrimination in the same threesurveys. While we prefer the school integration question because it is worded more consistently,we find an essentially identical pattern (whites recognizing a major shift in the party’s relativepositions between 1960 and 1964). Results available upon request.
13

to track his progression on the issue, employing both a more narrow and a broader search to
address Type I and Type II error concerns. Specifically, in Figure 4 we tally daily counts of
articles in which (1) “President” and “Kennedy” and “civil rights” appear or (2) “President”
and “Kennedy” and any of the following terms: “civil rights,” “integrat*”, “segregat*,” where
the asterisk is a “wildcard.”24 The two series tell similar stories. Outside of two short-lived
spikes—when the administration intervenes on behalf of the freedom riders (Spring 1961)
and James Meredith (fall 1962)—the first two years of Kennedy’s administration see few
mentions of his name alongside civil rights terms.
However, the number of articles begins a steep incline in May 1963, when the nation’s
attention turned to Birmingham. Local black activists had organized a shopping boycott
of the city’s segregated stores in the weeks leading up to Easter. By early April, Martin
Luther King arrived in Birmingham and the movement grew into a series of marches and
sit-ins aimed at filling the local jails to force the city into negotiations to end segregation in
employment and public accommodations. By early May, the Birmingham police responded
with beatings, water hoses and dogs, attacks that did not spare even young children and that
were captured live for a television audience. These images drew Robert Kennedy and other
administration officials to Birmingham, a move interpreted by local whites as intervention
on behalf of the protesters.25
The number of articles reaches its pinnacle the following month when President Kennedy
enters the Civil Rights conversation with a televised proposal of legislation to end segregation
(“The events in Birmingham and elsewhere have so increased the cries for equality that no
city, or State, or legislative body can prudently choose to ignore them”). And while the
number of articles drops slightly from that mid-June high it remains elevated above pre-May
1963 levels throughout the remainder of his presidency. Thus the NYT evidence points to
spring 1963 as the moment when the leader of the Democratic party becomes firmly linked
with Civil Rights.
Further corroborating evidence. The NYT data may reflect the views of a narrow,
elite group of East Coast editors and may not reach, much less reflect the views of, average
voters. In Appendix Figures A.3 we tally the number of articles with the term “civil rights”
for the two Southern papers for which we can do textual analysis, the Dallas Morning News
24We searched for words “President” and “Kennedy” to exclude articles that only mention RobertKennedy, though in practice there is little difference.
25See, e.g., a contemporaneous summary of the events in Birmingham, “The Birmingham Story,”NYT, May 26, 1963.
14

and the New Orleans Times-Picayune. Again, we see Spring (in particular June) of 1963 as
the moment when articles including “civil rights” and “President Kennedy” skyrocket.
A related concern is that newspapers, regardless of their regional focus, reflect the deci-
sions of editors, not the sentiment of the general public. We thus complement our newspaper
analysis with polling data. In the years 1950-1980, Gallup asks over 100 times “What do you
think is the most important problem facing this country today?” Unfortunately, as we detail
in the figure notes (Appendix Figure A.4), there are inconsistencies with the coding from
one survey to the next, so we are cautious in interpreting these data points. Nonetheless the
figure demonstrates that 1963 marks the beginning of a great (but temporary) swell in the
share of American’s calling civil rights the country’s most important issue.
In summary, the ANES data show that views on the parties’ racial policies shift dramat-
ically between 1960 and 1964. Media coverage of the issue during this period was mostly flat
until a dramatic and sustained increase beginning in the Spring of 1963, and we thus con-
clude that this moment was the key turning point when voters would first see the Democrats
as the party on the more liberal side of the Civil Rights issue.
4.2 Estimating equations
Having defined a pre- and post-period for our 1958 to 1980 sample period, the empirical
strategy for our main set of results is straightforward. We first estimate the total amount of
decline from the pre- to post-period in Democratic identification among white Southerners
relative to other whites via the following regression:
Dist = β1Souths × Aftt + γXist + λs + µt + εist, (1)
where Dist is an indicator for person i identifying as a Democrat, Souths is an indicator for
residency in a Southern state, Aftt is an indicator for being observed after April 1963, Xist
includes controls (which we will vary in robustness checks), and λs and µt are state and year
fixed effects, respectively.26
We then estimate a companion regression:
Dist = β̃1Souths × Aftt + β̃2Souths × Aftt ×NoBlackPrezi + γ̃X̃ist + λs + µt + εist. (2)
26As we are interested in dealignment from the Democratic Party, we code Democrats as 1 andRepublicans, independents and other responses to party identification as 0.
15

In equation (2), the Souths × Aftt interaction is now interacted with NoBlackPrezi, an
indicator variable for being unwilling to vote for a black president.27 The vector X̃ now
includes all lower-order terms of this triple interaction and the remaining notation follows
that in (1). The estimate of β̃2 reflects the dealignment coming from those with conservative
racial views, and comparing the estimate of β1 in (1) with that of β̃1 in (2) allows us to
measure the share of Southern dealignment accounted for by those with conservative racial
views.
5 Results
We first present the main results from estimating equations (1) and (2) and then provide
corroborating evidence using other Gallup data.
5.1 Results using the “black president” question
Regression results. Table 2 presents the main results of the paper. For completeness
and to provide a baseline, col. (1) replaces state fixed effects with a South dummy and uses
only Gallup (as opposed to adding GSS) data from 1958 to 1980. Whereas Democrats enjoy
a 23-percentage-point pre-period advantage among whites in the South relative to the rest
of the country, that advantage falls by 65% in the post-period. In col. (2), we show that the
South×Aft coefficient falls by 99% once the triple interaction term is added, which is itself
highly significant and negative, indicating that essentially all the pre- vs. post-period decline
in Democratic identification among white Southerners comes from those with conservative
racial views leaving just as the national Democratic Party’s policies seek to end de jure
segregation in the region.
The lower-order terms of the triple interaction are of interest in their own right. The
positive, significant coefficient on South×NoBlack Prez highlights the strongly conservative
racial views that characterize the pre-period Southern Democratic party. Note also that
the insignificant coefficient on NoBlack Prez indicates that in the pre-period racial views
were not predictive of party identification among whites outside the South; the insignificant
coefficient on NoBlack Prez × After indicates that the limited predictive power of racial
views outside the South continues in the post-period. Readers, of course, should note take
this “non-result” to mean that race, racial views, or integration policy did not have political
27In practice we code both “no” and “don’t know” as 1 for this measure. In no year do morethan ten percent of respondents answer “don’t know.”
16

repercussions outside of the South. Civil Rights progress outside the South often came via
different branches of government and was scattered across localities and time and is in fact
the subject of a concurrent project.
In the remainder of Table 2 we explore the robustness of this result. In cols. (3) and (4)
as well as all remaining columns we add state fixed effects. The comparison of South×Afteracross specifications is even more striking: in col (3) the coefficient is larger in magnitude
than in col (1), but the inclusion in col. (4) of NoBlackPrez and its interactions actually
makes the South × After coefficient flip signs (though its magnitude is tiny). The result-
ing point estimates suggest that the 18.6 percentage-point decline among Southerners with
conservative racial views (very) slightly overpredicts the 16.7 percentage-point relative de-
cline among white Southerners. In Cols. (5) and (6) we add basic controls: fixed effects for
gender, age (in ten-year bins), city-size (twelve categories) , and educational attainment (six
categories), which barely moves the coefficients of interest.
Col. (7) adds interactions of South × Aft with age, a high school completion dummy,
and a city size (categorical) variable (as well as all lower-order terms of these triple inter-
actions). This specification tests whether the strong, negative coefficient on South× Aft×NoBlackPrez is merely picking up differential trends in the South along these other dimen-
sions. For example, we might worry that, say, rural Southerners differentially turn against
the Democrats in the post-period for reasons independent of Civil Rights. If rural Southerns
happen to have more conservative racial views, we would estimate a negative coefficient on
South × NoBlack Prez × Aft even absent any true reaction to Civil Rights. In fact, even
after allowing age, education and urbanicity to have different effects in the South, different
effects in the post-period, and different effects in the South in the post-period, the coef-
ficient on South × Aft × NoBlackPrez barely changes (note that adding the additional
triple interactions means that the coefficient on South × Aft no longer has any natural
interpretation).
In the remaining columns, we add the GSS data (as control variables are not consistent
across the two datasets, we do not include them). Comparing cols. (8) and (9) to cols. (3)
and (4) shows that the results are nearly identical in this larger, pooled dataset. In the
final two columns we keep the GSS data and extend the series to 2000. The point estimates
suggest that the decline in Democratic identification among those with conservative racial
views explains three-fourths of the 19.5 point relative decline in the South over this longer
17

period.28
Graphical results. Figure 5 shows the variation underlying our regression results in an
event-time figure. Specifically, for each survey date, we present the coefficient from regress-
ing our Democratic identification indicator variable on NoBlackPrez, separately for Southern
and non-Southern whites. As we would expect, the figure echoes the regression results (con-
servative racial views strongly predict Democratic party identification in the South in the
pre-period, an association that is wiped out in the post-period) but unlike those results can
show the shift is better described as a one-time decline—occurring sometime between the
1961 and 1963 survey dates—and not a secular trend. While the decline between the last pre-
and first post-period surveys are dramatic, the shape of the figure is noisy and certainly not
a perfect step function as our model would have literally predicted. In particular, it appears
there may have been some over-reaction in the first post-period survey in August of 1963
(perhaps due to its timing just two months after Kennedy’s June 11th televised introduction
of Civil Rights legislation) and a bit of a rebound by the next poll in 1965. But despite some
noise, a clear break emerges at some point between August of 1961 and August of 1963.
We note two things about this “break” from the Democratic Party among racially conser-
vative Southerners. First, it did not lead to the extinction of the Southern white Democrat.
Some racially conservative whites remained in the party and moreover over time fewer white
Southerners identified as racially conservative (and indeed some racially liberal Southern
Democratic politicians such as Jimmy Carter successfully engineered winning black-white
coalitions in the region). Second, the break does not imply a simultaneous one-for-one em-
brace of the Republicans, as moves to Independent and other parties are captured in the null
of our Democratic identification dummy. In fact, as we demonstrate in Appendix Table A.3
the Southern increase in Republican identification, while still highly significant, is less than
half the decrease in Democratic Party adherence over our sample period, as many former
Democrats initially claimed independent status. Nonetheless, the results do indicate that a
significant number of racially conservative Southern Democrats left the party just at the
moment its national leaders proposed sweeping Civil Rights laws.
Robustness checks. Perhaps the key concern about our approach so far is that while
28We conclude our analysis period in 2000. After Illinois State Senator Barack Obama’s 2004Democratic convention speech, heightened talk of his Presidential bid may have transformed theblack president item from a hypothetical question to a referendum on a particular individual. Tothe extent Jesse Jackson’s less successful Democratic primary bids in 1984 and 1988 had a similareffect, they offer another reason we favor the 1958-1980 sample period.
18
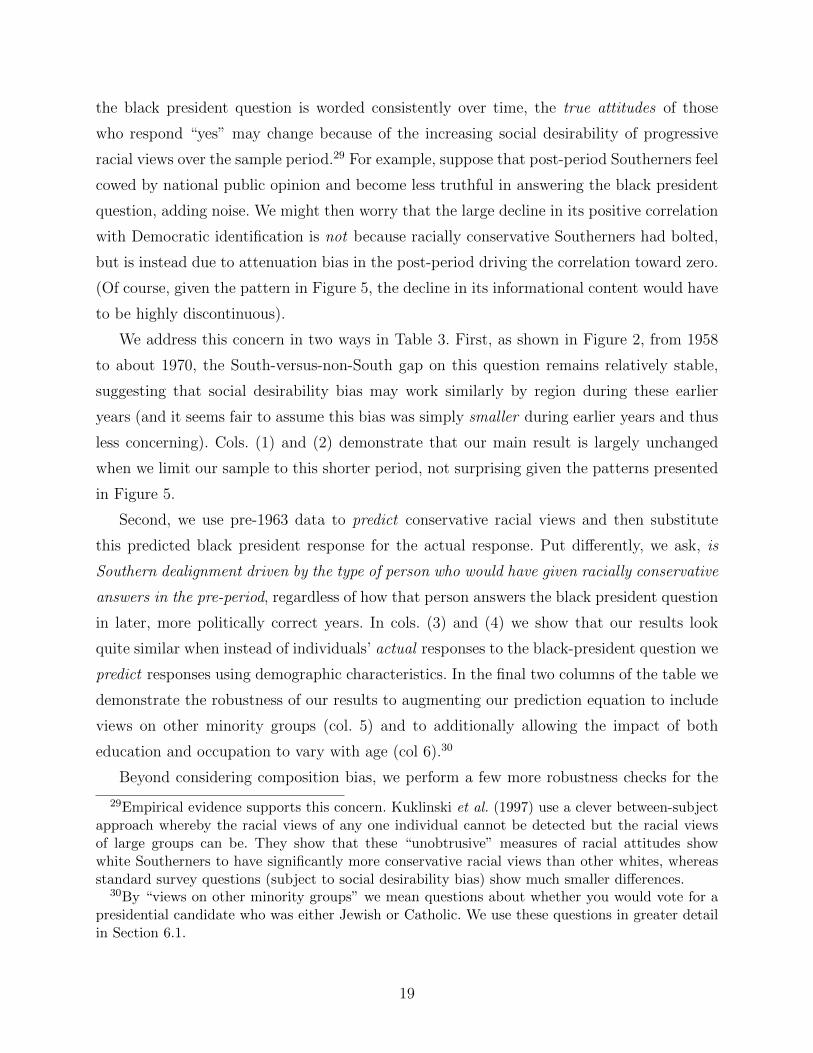
the black president question is worded consistently over time, the true attitudes of those
who respond “yes” may change because of the increasing social desirability of progressive
racial views over the sample period.29 For example, suppose that post-period Southerners feel
cowed by national public opinion and become less truthful in answering the black president
question, adding noise. We might then worry that the large decline in its positive correlation
with Democratic identification is not because racially conservative Southerners had bolted,
but is instead due to attenuation bias in the post-period driving the correlation toward zero.
(Of course, given the pattern in Figure 5, the decline in its informational content would have
to be highly discontinuous).
We address this concern in two ways in Table 3. First, as shown in Figure 2, from 1958
to about 1970, the South-versus-non-South gap on this question remains relatively stable,
suggesting that social desirability bias may work similarly by region during these earlier
years (and it seems fair to assume this bias was simply smaller during earlier years and thus
less concerning). Cols. (1) and (2) demonstrate that our main result is largely unchanged
when we limit our sample to this shorter period, not surprising given the patterns presented
in Figure 5.
Second, we use pre-1963 data to predict conservative racial views and then substitute
this predicted black president response for the actual response. Put differently, we ask, is
Southern dealignment driven by the type of person who would have given racially conservative
answers in the pre-period, regardless of how that person answers the black president question
in later, more politically correct years. In cols. (3) and (4) we show that our results look
quite similar when instead of individuals’ actual responses to the black-president question we
predict responses using demographic characteristics. In the final two columns of the table we
demonstrate the robustness of our results to augmenting our prediction equation to include
views on other minority groups (col. 5) and to additionally allowing the impact of both
education and occupation to vary with age (col 6).30
Beyond considering composition bias, we perform a few more robustness checks for the
29Empirical evidence supports this concern. Kuklinski et al. (1997) use a clever between-subjectapproach whereby the racial views of any one individual cannot be detected but the racial viewsof large groups can be. They show that these “unobtrusive” measures of racial attitudes showwhite Southerners to have significantly more conservative racial views than other whites, whereasstandard survey questions (subject to social desirability bias) show much smaller differences.
30By “views on other minority groups” we mean questions about whether you would vote for apresidential candidate who was either Jewish or Catholic. We use these questions in greater detailin Section 6.1.
19

main Table 2 results in Appendix Table A.3. While we use linear probability models for ease
of interpretation, our results hold using probit instead. We vary the group of non-Southern
states that serve as our control and in fact find that our results hold regardless of which
region of the country we compare to the South. We also use Republican identification as
our outcome (again, the existence of independents means these results may differ from those
in Table 2). As noted, it took some time before former Southern Democrats moved from
Independent status to embrace a new party, but, again, all of this (smaller) shift occurs
among whites with conservative racial views. In Appendix Table A.4 we show that results
are qualitatively similar for older and younger respondents, as well as men and women.
5.2 Higher-frequency results from Gallup
The results of Figure 5 point to a sharp decline in the association of conservative racial at-
titudes and white Southern identification with the Democratic Party between the summers
of 1961 and 1963, the last pre-period and first post-period surveys that include the black
president question, respectively. Gallup does not ask the black president question at a suffi-
ciently high frequency that we can pin the key shift to the Spring of 1963, the moment when,
we earlier argued, voters first firmly connect the Democrats to Civil Rights. We now turn
to alternative Gallup questions and a modified empirical strategy to more finely pinpoint
the transition moment of white Southern Democratic allegiance. We lose the ability to strat-
ify the analysis by racial attitudes, but we gain higher-frequency measures of Americans’
responses to political news.
Presidential approval. During the 1960s, Gallup asked the following question roughly
every month: “Do you approve or disapprove of the way President is handling his job
as President?”31 We find 25 usable surveys that ask Kennedy approval, a question we use to
examine how Southern white approval (relative to non-Southern white approval) responds
to presidential Civil Rights news.
Figure 6 tracks Kennedy’s approval among whites, separately for the South and non-
South, as well as the difference. The most striking element of the figure is the more than 35
percentage point drop in Southern approval between the April 5 and June 23 surveys in 1963,
more than half of which occurs between the two polls (May 25 and June 23) that surround
Kennedy’s televised June 11 Civil Rights address.32 During this period, non-Southern white
31In most surveys the possible valid responses are only approve or disapprove.32We define “survey date” as the midpoint of the period the survey is in the field, or the day
20

approval is flat and black approval (Appendix Figure A.5) is increasing. Thus this high fre-
quency data provides evidence to pinpoint spring 1963 as a critical moment for dealignment.
Note, however, that even the smaller events in the Civil Rights timeline noted earlier (the
Freedom Riders and James Meredith) create wobbles in Kennedy’s relative popularity in the
South.
We formalize the analysis of Figure 6 in the regression analysis of Table 4. We regress
approval among Gallup respondents on the average number of articles per day linking the
president and Civil Rights during the week of the survey, allowing the effect to differ for
Southerners and non-Southerners.33 We begin with the more narrow, “Civil Rights” classi-
fication. The negative coefficient on articles mentioning “Civil Rights” in col. (1) indicates
that Kennedy’s approval falls in both regions the more his name is mentioned alongside the
issue. However, the interaction term indicates that the decrease is nearly four times larger
for Southerners. The point estimates suggest that, if a week were to average an additional
article per day that mentions Kennedy and civil rights than some baseline period, we should
expect non-Southern white approval to fall by 1.53 percentage points and white Southern
approval to fall by 7.13 percentage points relative to their baseline levels.
In col. (2) we add survey date fixed effects and an interaction between South and article
counts of Kennedy alongside several “placebo” issues (the main effects of these placebo issue
article counts as well as the Civil Rights article count are absorbed by the survey-date fixed
effects). There are few issues that create significantly divergent reactions for whites in the
South versus elsewhere. While Southern whites appear to react positively to news about the
USSR, they react negatively on Cuba, making it hard to discern a consistent pattern. They
react positively to news linking Kennedy and agricultural policy (perhaps not a surprise given
its differential importance in the South), but the coefficient is less than one-third the size
of our Civil Rights interaction. These coefficients echo results we present in Section 6.1 that
in the pre-period, whites in the South had few policy disagreements with whites elsewhere
except for Civil Rights. More important to the question at hand, adding these controls in
fact only increases the magnitude of the coefficient on the interaction between South and
Civil Rights articles. In col. (3) we repeat the col. (2) analysis using the more expanded
“Civil Rights terms” search. The interaction term remains negative and significant, though
preceding the theoretical midpoint in the case of an even number of days in the field.33The modal survey is in the field for six days. However, we do not know on which day each
respondent is interviewed. We match the midpoint of the survey date to the number of hits duringthe period three days before through three days after the midpoint.
21
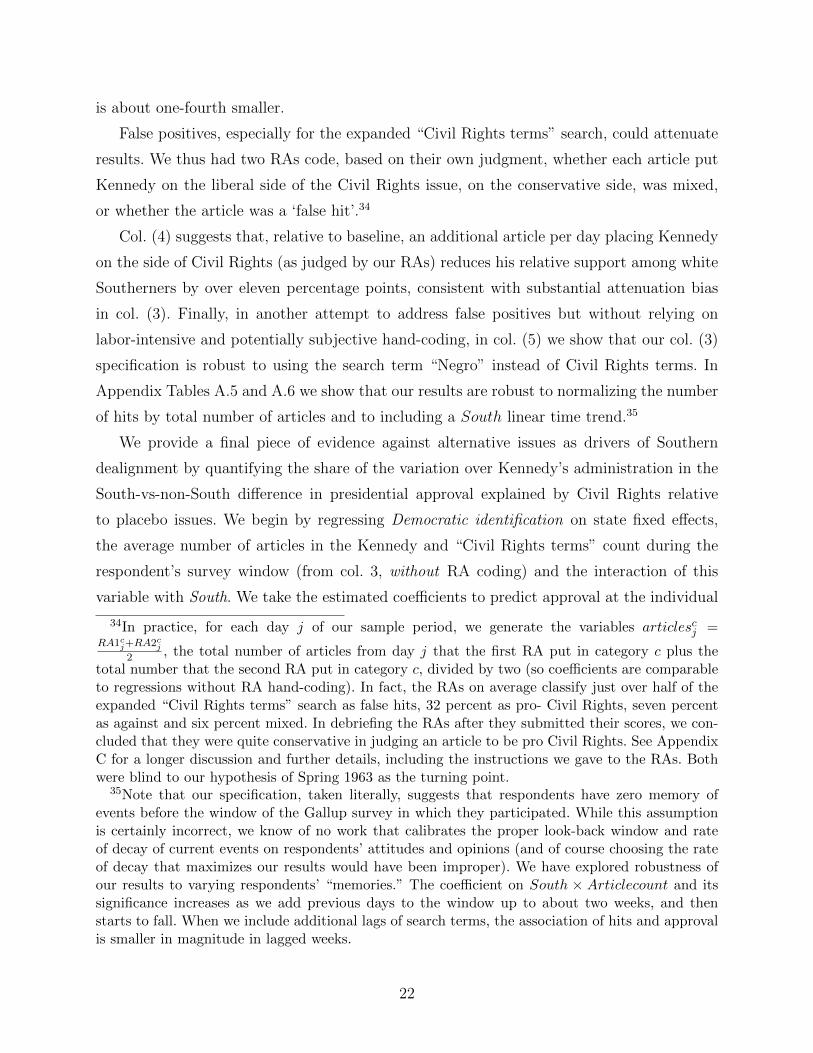
is about one-fourth smaller.
False positives, especially for the expanded “Civil Rights terms” search, could attenuate
results. We thus had two RAs code, based on their own judgment, whether each article put
Kennedy on the liberal side of the Civil Rights issue, on the conservative side, was mixed,
or whether the article was a ‘false hit’.34
Col. (4) suggests that, relative to baseline, an additional article per day placing Kennedy
on the side of Civil Rights (as judged by our RAs) reduces his relative support among white
Southerners by over eleven percentage points, consistent with substantial attenuation bias
in col. (3). Finally, in another attempt to address false positives but without relying on
labor-intensive and potentially subjective hand-coding, in col. (5) we show that our col. (3)
specification is robust to using the search term “Negro” instead of Civil Rights terms. In
Appendix Tables A.5 and A.6 we show that our results are robust to normalizing the number
of hits by total number of articles and to including a South linear time trend.35
We provide a final piece of evidence against alternative issues as drivers of Southern
dealignment by quantifying the share of the variation over Kennedy’s administration in the
South-vs-non-South difference in presidential approval explained by Civil Rights relative
to placebo issues. We begin by regressing Democratic identification on state fixed effects,
the average number of articles in the Kennedy and “Civil Rights terms” count during the
respondent’s survey window (from col. 3, without RA coding) and the interaction of this
variable with South. We take the estimated coefficients to predict approval at the individual
34In practice, for each day j of our sample period, we generate the variables articlescj =RA1cj+RA2cj
2 , the total number of articles from day j that the first RA put in category c plus thetotal number that the second RA put in category c, divided by two (so coefficients are comparableto regressions without RA hand-coding). In fact, the RAs on average classify just over half of theexpanded “Civil Rights terms” search as false hits, 32 percent as pro- Civil Rights, seven percentas against and six percent mixed. In debriefing the RAs after they submitted their scores, we con-cluded that they were quite conservative in judging an article to be pro Civil Rights. See AppendixC for a longer discussion and further details, including the instructions we gave to the RAs. Bothwere blind to our hypothesis of Spring 1963 as the turning point.
35Note that our specification, taken literally, suggests that respondents have zero memory ofevents before the window of the Gallup survey in which they participated. While this assumptionis certainly incorrect, we know of no work that calibrates the proper look-back window and rateof decay of current events on respondents’ attitudes and opinions (and of course choosing the rateof decay that maximizes our results would have been improper). We have explored robustness ofour results to varying respondents’ “memories.” The coefficient on South × Articlecount and itssignificance increases as we add previous days to the window up to about two weeks, and thenstarts to fall. When we include additional lags of search terms, the association of hits and approvalis smaller in magnitude in lagged weeks.
22

level and then collapse both the predicted and actual approval to South × survey date cells.
Figure 7 shows the actual South-non-South approval differences (already depicted in Figure
6) as well as our predicted differences, generated from the parsimonious regression described
above. The series line up quite well and in fact our predicted series explains 51% of the total
variation in the actual South-non-South difference over time.36 Consistent with the results
in Table 4, when we use the RA-coded version of the broad search in the same prediction
exercise, the relationship appears even tighter (the third series of Figure 7) and now explains
56% of the variation.
We repeat this exercise for the number of hits for each placebo issue (each without
any hand-coding). The best performing placebo issue (social security and safety net issues)
explains only 20% (see Appendix Figure A.6) and completely misses the huge decline in
relative approval in the Spring of 1963. In fact seven of nine placebo issues explain under
five percent of the South-nonSouth variation over time. The overwhelming predictive power
of Civil Rights in explaining regional differences in approval for Kennedy undercuts the
argument that other issues were triggering dealignment during this key period.
Hypothetical presidential match-ups. Another familiar Gallup question asks voters
whom they would prefer in hypothetical election match-ups. We examine how Kennedy fairs
in these match-ups against Barry Goldwater, the Republican candidate most identified with
Civil Rights opposition. Gallup asks this question roughly monthly beginning in February
1963, with the final poll less than two weeks before Kennedy’s assassination.
Figure 8 shows Goldwater’s support among white Southerners at around 30% through the
first week of March. Goldwater then enjoys a steady increase in support through the Spring of
1963, reaching a plateau of around 60% in July. During our key period of the Spring of 1963,
Kennedy goes from having a healthy, thirty percentage point lead over Goldwater to being
thirty points behind him. White non-Southerners remain rather aloof toward Goldwater.
Over the same February to July period when Kennedy’s support plummets in the South,
in the non-South it falls modestly from 65 to 60%, while support for Goldwater shows a
similarly small gain from 28 to 33%.
The result from the presidential match-ups suggests that Kennedy’s decline in approval
documented in the previous subsection did not reflect mere short term annoyance. Within
months of Kennedy’s association with Civil Rights, half of his Southern white supporters
36When we instead use the more narrow “Civil Rights” search in our prediction exercise, it alsoexplains 51%. The “Negro” search explains 54%.
23

shifted their backing to a candidate who was from a party they had shunned for a century but
who was not believed to support Civil Rights. As noted in the introduction, those arguing
for Civil Rights as the trigger for Southern dealignment typically point to Johnson as the
catalyst—our results suggest that Kennedy has been given too little credit (or blame?) for
losing the South for his party.
6 Addressing alternative hypotheses
In the previous section we made our “positive case” for Civil Rights as the prime mover of
Southern whites out of the Democratic Party. In this section, we more directly address the
most commonly raised alternative hypotheses.
6.1 Rising party polarization
Over the past fifty years, the Democratic and Republican parties have moved further apart on
most issues, in particular redistribution and social insurance (McCarty et al., 2006). As just
one example, roughly half of Republican legislators voted to establish Medicare and Medicaid
in 1965, whereas their opposition to the 2010 Affordable Care Act was literally unanimous. If
Southern whites have always been more conservative—especially economically—than other
whites, then rising polarization could lead to differential exodus of Southern whites from the
increasingly more liberal party. Moreover, if our “black president” question is merely acting
as a proxy for general conservatism, then our results could be an artifact of polarization that
we mistakenly attribute to reaction to Civil Rights. We investigate both of these claims.
Have white Southerners always been more conservative? We focus on the 1956
ANES, which asks more than a dozen policy questions (some are repeated in 1960 and in
those cases we pool the two surveys) scored on a scale from 1 to 5 (strongly agree to strongly
disagree). The first panel of Appendix Table A.7 focuses on economic policy preferences,
providing both means and the fraction agreeing or strongly agreeing for each of seven ques-
tions. In matters of economic policy, there was remarkable consensus among whites in the
South and elsewhere. We find no significant differences by region on job guarantees, tax
cuts, the appropriate influence of big business and (somewhat surprising to us, given South-
ern legislators’ support for the 1947 Taft-Hartley Act) labor unions, and the regulation of
housing and utilities.37 Southern whites actually supported government provision of afford-
37Katznelson (2013) argues that while Southern legislators supported the pro-Union Wagner Act
24

able medical care at significantly higher rates, but were significantly less likely to support
federal financing of local school construction. In comparison, there are similarly few—in fact
only one—significant regional difference on foreign policy preferences during this era (second
panel), but large and significant differences, as expected, on Civil Rights (third panel).
This analysis paints a picture of broad pre-period regional consensus (among whites)
on policy issues outside of civil rights. In Appendix Table A.8 we further demonstrate that
racially conservative views (measured using the two civil rights items in the previous table)
do not systematically predict economic views within either region, nor—most importantly
for our triple difference strategy—differentially across region. We emphasize that the above
analysis is not to deny that Southern whites became more conservative (especially econom-
ically) in the post-period, but as scholars have pointed out (see, e.g., Kousser, 2010 and
Lee and Roemer, 2006) this trend can potentially be explained by Civil Rights itself, which
gave blacks access to the federal social safety net even in Southern states and would thus
presumably reduce support for these programs among some racially conservative whites.38
Is “no black president” merely proxying for conservatism? Until now we have
been interpreting our black president question as a measure of racial views, and indeed we
showed earlier it is highly correlated with standard questions on racial equality. There are at
least two complications to address. First, as until 1960 all U.S. presidents had been white,
Protestant men, being against electing a black president may simply be proxying for social
or cultural conservatism—a desire to adhere to past norms—not opposition to racial equality
per se. Second, recall that the question specifies that “your party” nominates a black man—
a white Southerner would surely have assumed that had the Democrats nominated a black
man, he would have been from the Northern, liberal wing of the party. As such, a white
Southerner may have feared a black president would have been dismissive of regional issues
beyond segregation (e.g., agricultural policy).
In many surveys in which Gallup asks the black president question, it also asks whether
respondents would refuse to vote for a female, Catholic or Jewish nominee from their party.
In the 1960s, a president from any of these groups would have been a large break from
tradition and thus refusal should correlate with social conservatism (perhaps especially for
in 1935, they then supported the anti-union Taft-Hartley Act in 1947 because in the interim periodthe labor movement had become more associated with Civil Rights.
38For historical treatment of this question, see Katznelson (2013), who argues that Southernpoliticians were among the most ardent supporters of redistribution during the New Deal, as NewDeal legislation tended to exclude traditionally black occupations and moreover ceded administra-tive authority to local agencies and thus did not challenge Southern racial norms.
25

a female candidate). Moreover, had the Democratic party nominated a Jewish or Catholic
candidate during this period, Southern whites could be very sure he would come from the
Northern wing of the party. If our black president is merely proxying for social conservatism
or regionalism, then our coefficient of interest should be quite sensitive to simultaneously
controlling for views toward these three groups.
For each of these groups, Table 5 shows the results from four regression specifications
(ignore the final two columns of the table for the moment). We begin by estimating our
standard equation (1) on the subsample of observations that include the “black president
question” as well as the “president” question for the group in question, to estimate total
pre- versus post-period white Southern dealignment for these respondents (in all cases, the
estimate is very similar to that of the baseline estimate in col. 3 of Table 2). In the second
column, we then estimate a version of equation (2) where we instead measure the share
of total dealignment accounted for by white Southerners opposed to a candidate from the
group in question. The third specification is our usual “black president” triple-interaction
equation on the subsample that includes the president question for the given group. The
final specification performs a “horserace” to see if the decline is better explained by those
Southerners against voting for blacks or those against voting for the other group.
The results of these exercises are very similar regardless of whether women, Jews or
Catholics are the group of interest. Comparing the first and second specifications for each
group shows that almost none of the total Southern dealignment is explained by differential
movement among Southerners unwilling to vote for members of these other groups. Dealign-
ment among racially conservative white Southerners remains large for all three subsamples
that also include the “president” question for the group in question (the third specification).
Moreover, comparing the third and fourth specifications, when we simultaneously control for
views toward blacks and views toward the other group (our “horserace” specification), the
coefficients on our racial conservatism variables retain their statistical significance and in
fact barely move. As such, Southern dealignment during the post-period is driven by those
with conservative views on racial equality, even after we control for (highly correlated) views
toward women and religious minorities.39
39Correlations between the black president question and, respectively, the female, Jewish andCatholic president questions are 0.447, 0.402, and 0.455.
26

6.2 Can economic development or changing demographics explain dealignment?
Even conditional on self-reported ideology, income is a negative predictor of Democratic
identification. During our study period, the South and non-South exhibited differential eco-
nomic growth rates. While we showed in Table 2 that our main results were robust to flexibly
controlling for education, age and urbanicity, it is possible that they are confounded by in-
sufficient controls for income. Therefore we explore the alternative hypothesis of income as
the cause of dealignment in this section.
As noted, only six of the ten Gallup surveys from 1958 through 1980 include an income
control, and in fact only one of the six is from the pre-period. Given the limitations of income
measures in Gallup, our main approach to addressing this concern is to return to the ANES,
the dataset authors tend to use in support of the income argument.40 From 1952 onward,
the ANES has the needed state identifiers as well as a consistent income measure: grouping
households by where they fall in the U.S. income distribution (bottom 16 percent, between
the 17 and 33 percentiles, the middle third, between the 67th and 95th percentiles, or the
top five percent).
As noted in Section 2, most of the work that finds evidence of income as a driver actually
uses cross tabulations and does not, in a regression sense, partial out what share of the total
dealignment is explained by differential income growth in the South. We perform this exercise
in Table 6, as usual using our Spring 1963 pivot point (so, 1964 is the first post-period year
in the ANES) and otherwise following the specification in equation (1).
To establish a baseline, col. (1) Panel A shows the results with no controls except year and
state fixed effects, and we find a 14 percentage-point relative decline in Southern Democratic
identification (similar, as we would expect, to the analogous results from Gallup, col. 3 of
Table 2).41 Col. (2) shows that this estimate is robust to adding fixed effects for each of the
ANES income categories. Those arguing for economic development as the prime mover often
refer not only to income growth per se, but also the decline in the rural share of the Southern
population. Col. (3) adds fixed effects for the three urbanicity categories in the ANES and,
if anything, the coefficient of interest grows slightly in magnitude. Finally, Col. (4) allows
40When we perform our standard analysis on the subsample of Gallup surveys that include theincome variable, the coefficient of interest on our triple interaction term is not affected by whetherincome is included as a control.
41All results in Table 6 are robust to using “voted for the Democratic nominee in most recentpresidential election” as the outcome instead of Democratic identification. Results available uponrequest.
27

urbanicity and income to have different effects in the South and in the post-period (i.e.,
fully interacting dummies for each of the urbanicity and income categories with both South
and After). The magnitude of the coefficient on South × After doesn’t move. In short, we
find no role for economic development—even broadly and flexibly defined—in explaining the
differential decline in Democratic allegiance among Southern whites after 1963.
As detailed in Section 2, other authors argue that Northern migrants and younger
cohorts—two groups which should have little natural loyalty to Jim Crow—drive dealign-
ment. In col. (5) we introduce a “restricted sample”: we drop all respondents (in the South
and non-South) born after 1941 as well as all respondents living in the South at the time
of the survey but born elsewhere. Relative to the baseline in col. (1), our restricted sample
shows a post-period drop in Southern Democratic attachment that is 92% of the size of the
drop in the full sample. The estimated dealignment in fact grows in size when in col. (6) we
add the flexible controls for income and urbanicity included in col. (4).
The regressions in Panel A of Table 6 impose our preferred turning point of 1963 and
address whether Southern economic development is likely biasing the coefficients on our key
triple interaction term in Table 2. A distinct question is whether economic development
can explain dealignment more generally. Panel B shows that, just as with South × After,
almost none of the Southern dealignment linear time trend (roughly one percentage point
per year on average during our sample period) is explained by any of the specification checks
described above.42
6.3 Does timing of dealignment undermine Civil Rights as the cause?
As Figure 1 shows, while white Southerners continue to trickle out of the Democratic party
after 2000, much of the damage to the party was complete by 1970. Between 1960 and 1970,
Democrats lost on average over two percentage points per year among white Southerners
relative to other whites, whereas there was no additional loss between 1970 and 1980 and the
aggregate 1970-2004 rate was below 0.4 percentage points per year. This pattern is broadly
consistent with the shock of the Democrats’ 1960s Civil Rights engagement leading many
racially conservative Southern whites to switch immediately and some amount of inertia that
led others to switch later or to die out and be replaced by future non-Democrats.
What is, at first glance, less consistent with our story of 1963 as the turning point is
42In fact, not only does economic development not explain overall Southern dealignment, butricher and non-rural Southerners (the so-called “New South”) did not drive dealignment (see Ap-pendix Table A.9).
28

the earlier evolution of party identification. We address two key questions. First, why did
Kennedy’s weakness in the South pre-date his 1963 Civil Rights moves? Second, what caused
the (slower, but certainly substantial) pre-1960 dealignment among white Southerners?43
Kennedy’s weakness in the South pre-dates Civil Rights. As noted in Section 2,
some authors have argued that Kennedy’s poor performance in the South in the 1960 election
undermines the claim that Civil Rights was the key driver of dealignment, as Kennedy’s Civil
Rights agenda was viewed as cautious until 1963 (Trende, 2012). Indeed, in his razor-thin
1960 election victory, Kennedy captures roughly fifty percent of voters in both the South
and elsewhere, compared to a roughly twenty percentage point Southern advantage enjoyed
by most previous Democratic candidates in the twentieth century (Appendix Figure A.7).
Below we provide a variety of quantitative evidence pointing to the significant role of his
Catholicism in both depressing his support in the South and raising it elsewhere.44
In a 1958 Gallup poll, 48 percent of Southern whites state unwillingness to vote for a
Catholic president, compared to only 22 percent of whites elsewhere. In the 1960 post-election
portion of the ANES, 29 percent of whites in the South said the most important reason they
did not vote for Kennedy was his Catholicism, compared to 15 percent elsewhere. These
percentages include (in the denominator) all those who did vote for him, suggesting anti-
Catholic sentiment was a major factor in the election, especially in the South.45 While similar
survey data do not exist from 1928, the only other time before 1960 that Democrats fielded
a Catholic candidate (Al Smith), Democrats lost six Southern states that election, five of
which had not voted Republican since Reconstruction (see Appendix Figure A.7 for the
sharp 1928 drop in the Democrats’ popular vote advantage in the South).
On the other hand, Catholic voters (94% of whom lived outside the South) mobilized
in support of Kennedy, further shrinking the South-versus-non-South advantage Kennedy
received relative to non-Catholic Democratic nominees.46 While in the other presidential
elections from 1952 to 2000, white Catholics, relative to other whites, favor Democrats by
43It is worth noting that despite the earlier dealignment—which we analyze in detail in thissubsection—in a regression with Democratic identification as the outcome variable, our South ×After coefficient is still significant when we simultaneously control for state fixed effects, year fixedeffects and a linear South time trend (results available upon request).
44Southern opposition to a Catholic president during this era was so substantial that Kennedydelivered a now-famous speech to Southern ministers committing himself to secular government(see http://www.npr.org/templates/story/story.php?storyId=16920600 for the transcript).
45We tabulate only the “most important reason” (respondents can give up to five) and combinethose who say “he’s a Catholic” and “Catholic church would control him.”
46State residence of Catholic voters is based on authors’ calculation from the 1960 ANES.
29
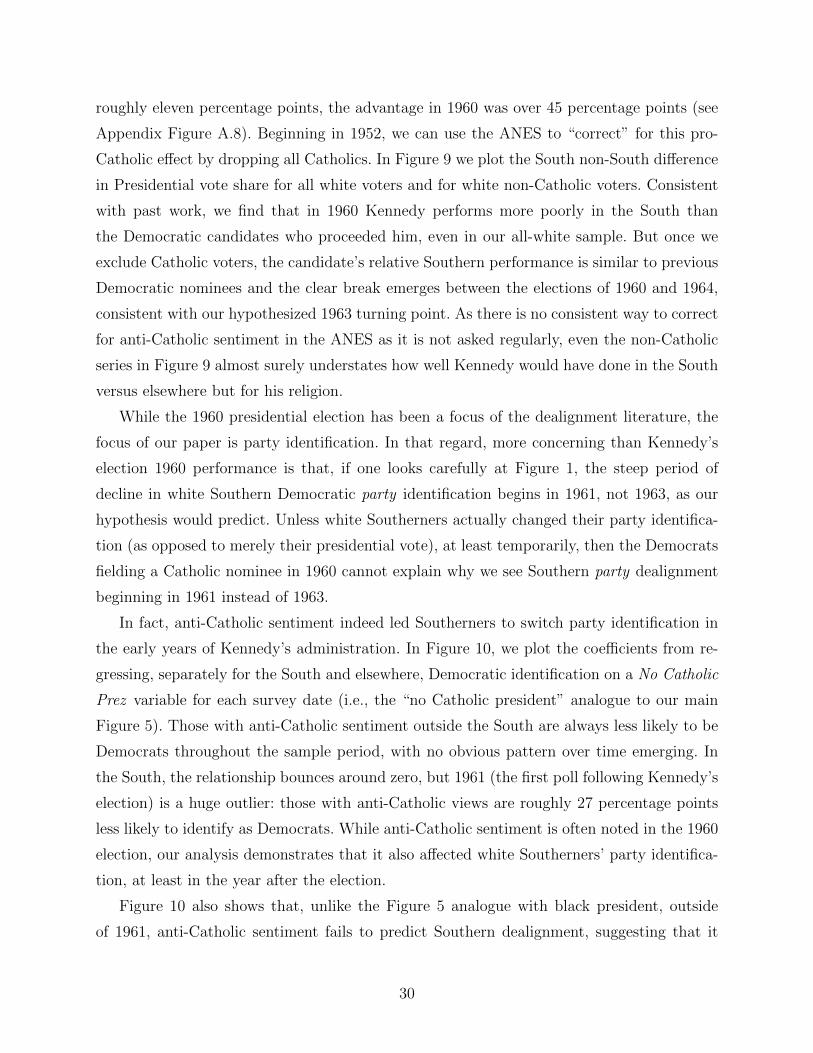
roughly eleven percentage points, the advantage in 1960 was over 45 percentage points (see
Appendix Figure A.8). Beginning in 1952, we can use the ANES to “correct” for this pro-
Catholic effect by dropping all Catholics. In Figure 9 we plot the South non-South difference
in Presidential vote share for all white voters and for white non-Catholic voters. Consistent
with past work, we find that in 1960 Kennedy performs more poorly in the South than
the Democratic candidates who proceeded him, even in our all-white sample. But once we
exclude Catholic voters, the candidate’s relative Southern performance is similar to previous
Democratic nominees and the clear break emerges between the elections of 1960 and 1964,
consistent with our hypothesized 1963 turning point. As there is no consistent way to correct
for anti-Catholic sentiment in the ANES as it is not asked regularly, even the non-Catholic
series in Figure 9 almost surely understates how well Kennedy would have done in the South
versus elsewhere but for his religion.
While the 1960 presidential election has been a focus of the dealignment literature, the
focus of our paper is party identification. In that regard, more concerning than Kennedy’s
election 1960 performance is that, if one looks carefully at Figure 1, the steep period of
decline in white Southern Democratic party identification begins in 1961, not 1963, as our
hypothesis would predict. Unless white Southerners actually changed their party identifica-
tion (as opposed to merely their presidential vote), at least temporarily, then the Democrats
fielding a Catholic nominee in 1960 cannot explain why we see Southern party dealignment
beginning in 1961 instead of 1963.
In fact, anti-Catholic sentiment indeed led Southerners to switch party identification in
the early years of Kennedy’s administration. In Figure 10, we plot the coefficients from re-
gressing, separately for the South and elsewhere, Democratic identification on a No Catholic
Prez variable for each survey date (i.e., the “no Catholic president” analogue to our main
Figure 5). Those with anti-Catholic sentiment outside the South are always less likely to be
Democrats throughout the sample period, with no obvious pattern over time emerging. In
the South, the relationship bounces around zero, but 1961 (the first poll following Kennedy’s
election) is a huge outlier: those with anti-Catholic views are roughly 27 percentage points
less likely to identify as Democrats. While anti-Catholic sentiment is often noted in the 1960
election, our analysis demonstrates that it also affected white Southerners’ party identifica-
tion, at least in the year after the election.
Figure 10 also shows that, unlike the Figure 5 analogue with black president, outside
of 1961, anti-Catholic sentiment fails to predict Southern dealignment, suggesting that it
30
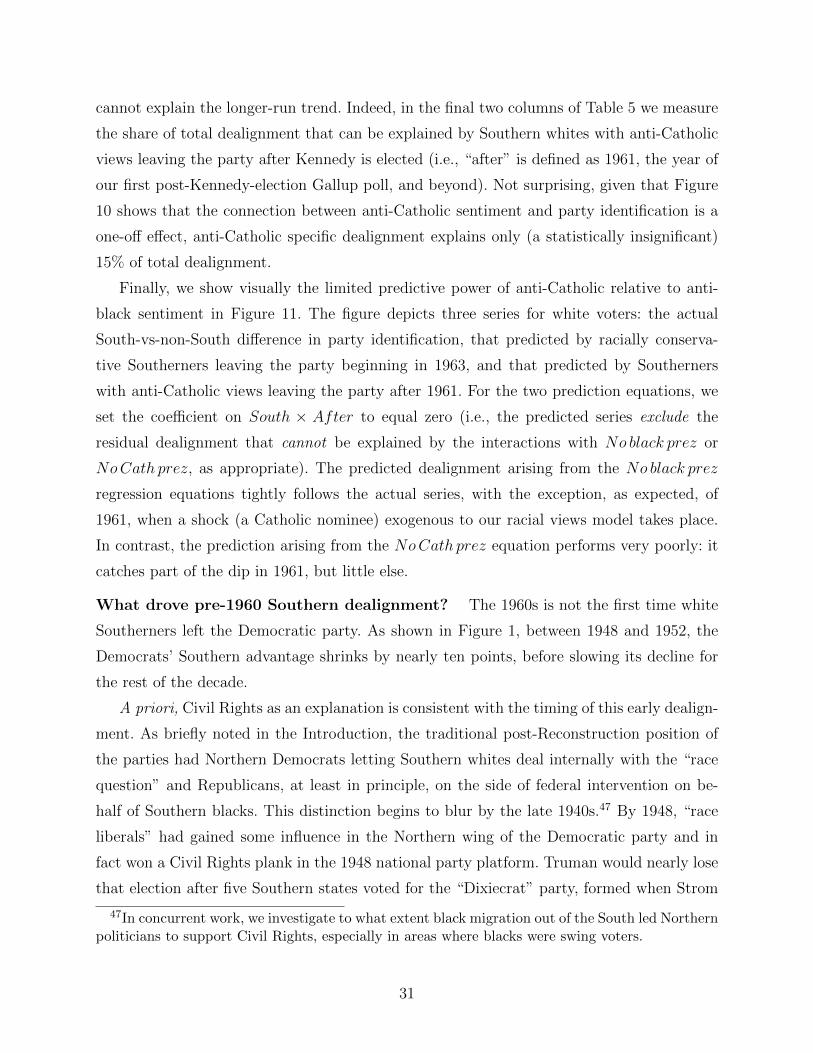
cannot explain the longer-run trend. Indeed, in the final two columns of Table 5 we measure
the share of total dealignment that can be explained by Southern whites with anti-Catholic
views leaving the party after Kennedy is elected (i.e., “after” is defined as 1961, the year of
our first post-Kennedy-election Gallup poll, and beyond). Not surprising, given that Figure
10 shows that the connection between anti-Catholic sentiment and party identification is a
one-off effect, anti-Catholic specific dealignment explains only (a statistically insignificant)
15% of total dealignment.
Finally, we show visually the limited predictive power of anti-Catholic relative to anti-
black sentiment in Figure 11. The figure depicts three series for white voters: the actual
South-vs-non-South difference in party identification, that predicted by racially conserva-
tive Southerners leaving the party beginning in 1963, and that predicted by Southerners
with anti-Catholic views leaving the party after 1961. For the two prediction equations, we
set the coefficient on South × After to equal zero (i.e., the predicted series exclude the
residual dealignment that cannot be explained by the interactions with No black prez or
NoCath prez, as appropriate). The predicted dealignment arising from the No black prez
regression equations tightly follows the actual series, with the exception, as expected, of
1961, when a shock (a Catholic nominee) exogenous to our racial views model takes place.
In contrast, the prediction arising from the NoCath prez equation performs very poorly: it
catches part of the dip in 1961, but little else.
What drove pre-1960 Southern dealignment? The 1960s is not the first time white
Southerners left the Democratic party. As shown in Figure 1, between 1948 and 1952, the
Democrats’ Southern advantage shrinks by nearly ten points, before slowing its decline for
the rest of the decade.
A priori, Civil Rights as an explanation is consistent with the timing of this early dealign-
ment. As briefly noted in the Introduction, the traditional post-Reconstruction position of
the parties had Northern Democrats letting Southern whites deal internally with the “race
question” and Republicans, at least in principle, on the side of federal intervention on be-
half of Southern blacks. This distinction begins to blur by the late 1940s.47 By 1948, “race
liberals” had gained some influence in the Northern wing of the Democratic party and in
fact won a Civil Rights plank in the 1948 national party platform. Truman would nearly lose
that election after five Southern states voted for the “Dixiecrat” party, formed when Strom
47In concurrent work, we investigate to what extent black migration out of the South led Northernpoliticians to support Civil Rights, especially in areas where blacks were swing voters.
31

Thurmond (D-SC) walked out of the Democratic convention over the Civil Rights plank. (As
shown in Appendix Figure A.7, uncharacteristically for a pre-1964 Democrat, Truman, like
Kennedy, did no better in the South than in the non-South.) Democrats tried to reassure
their Southern members by nominating in 1952 and 1956 Adlai Stevenson (a “moderate” on
Civil Rights) and in particular vice presidential nominees from the South. In the meantime,
a nascent Southern Republican party was forming in the 1950s, with candidates generally
running as strict segregationists.48
Data are far more scarce in the 1940s and early 1950s than during our main sample
period. We present below the quantitative evidence we have collected from the pre-1960
period in chronological order.
We begin with the late 1940s and, as with Kennedy, link measures of support for President
Truman to NYT articles connecting him to Civil Rights. As shown in Appendix Figure A.9,
Truman has little connection to Civil Rights until early in 1948, when we see the number
of articles linking him to the issue rise and remain high throughout the year (a year which
saw him introduce Civil Rights legislation to Congress in February and, via executive order,
desegregate the military and the federal workforce in July). Due to data limitations, we
cannot use presidential approval as we do with Kennedy in Figure 6 and instead use Gallup
data on whether a respondent plans to support Harry Truman in the 1948 presidential
election.49 We emphasize upfront that we only have five useable surveys, spanning July 1947
to early October 1948, and thus readers should view the results with some caution. Further,
the choices of candidates in the survey, as in the actual election, is evolving.50
As shown in Appendix Table A.10, while Civil Rights activity costs him (hypothetical)
votes outside the South, the effect is two to three times as large in the South.51 Appendix
48Indeed, all Southern Republicans in Congress (two in the Senate, eleven in the House) voted‘nay’ on the 1964 CRA. Among Southern Democrats, 83 (17) out of 94 (20) in the House (Senate)voted ‘nay.’
49We could not look at presidential approval because there are no usable (non-binary) Gallupsurveys on ipoll that include presidential approval between December 1947 and September 1948,a period capturing the peak of Truman’s Civil Rights engagement (see NYT article count datapresented in Appendix Figure A.9)
50See footnote to Appendix Figure A.9 for full listing of candidates in each survey. In particular,Dixiecrat Strom Thurmond is not offered as an explicit choice until September 1948. As Southern-ers are not offered an explicitly segregationist choice until September 1948 but we find our largeSouthern drop in Truman approval between November 1947 and April 1948, if anything we expectthe late addition of Thurman to create a bias against finding our results.
51The limited number of survey dates limits degrees of freedom. While our results never flipsigns, they do sometimes lose significance when we control for articles on other topics (we control
32
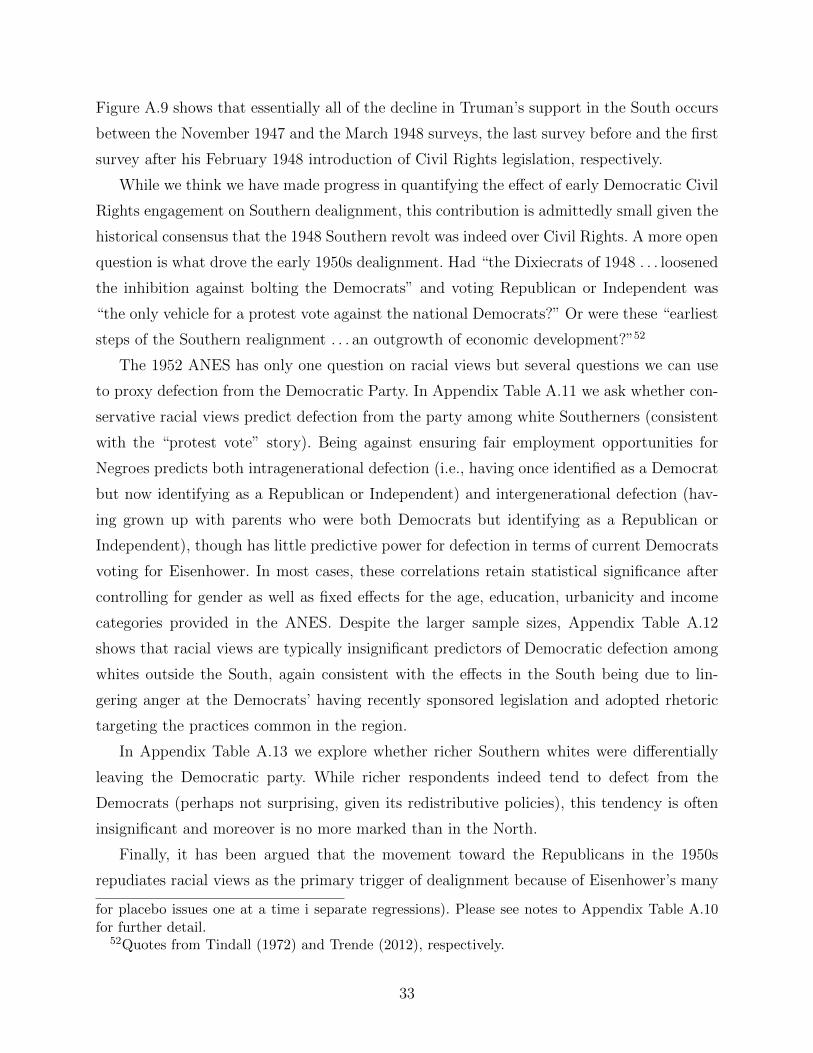
Figure A.9 shows that essentially all of the decline in Truman’s support in the South occurs
between the November 1947 and the March 1948 surveys, the last survey before and the first
survey after his February 1948 introduction of Civil Rights legislation, respectively.
While we think we have made progress in quantifying the effect of early Democratic Civil
Rights engagement on Southern dealignment, this contribution is admittedly small given the
historical consensus that the 1948 Southern revolt was indeed over Civil Rights. A more open
question is what drove the early 1950s dealignment. Had “the Dixiecrats of 1948 . . . loosened
the inhibition against bolting the Democrats” and voting Republican or Independent was
“the only vehicle for a protest vote against the national Democrats?” Or were these “earliest
steps of the Southern realignment . . . an outgrowth of economic development?”52
The 1952 ANES has only one question on racial views but several questions we can use
to proxy defection from the Democratic Party. In Appendix Table A.11 we ask whether con-
servative racial views predict defection from the party among white Southerners (consistent
with the “protest vote” story). Being against ensuring fair employment opportunities for
Negroes predicts both intragenerational defection (i.e., having once identified as a Democrat
but now identifying as a Republican or Independent) and intergenerational defection (hav-
ing grown up with parents who were both Democrats but identifying as a Republican or
Independent), though has little predictive power for defection in terms of current Democrats
voting for Eisenhower. In most cases, these correlations retain statistical significance after
controlling for gender as well as fixed effects for the age, education, urbanicity and income
categories provided in the ANES. Despite the larger sample sizes, Appendix Table A.12
shows that racial views are typically insignificant predictors of Democratic defection among
whites outside the South, again consistent with the effects in the South being due to lin-
gering anger at the Democrats’ having recently sponsored legislation and adopted rhetoric
targeting the practices common in the region.
In Appendix Table A.13 we explore whether richer Southern whites were differentially
leaving the Democratic party. While richer respondents indeed tend to defect from the
Democrats (perhaps not surprising, given its redistributive policies), this tendency is often
insignificant and moreover is no more marked than in the North.
Finally, it has been argued that the movement toward the Republicans in the 1950s
repudiates racial views as the primary trigger of dealignment because of Eisenhower’s many
for placebo issues one at a time i separate regressions). Please see notes to Appendix Table A.10for further detail.
52Quotes from Tindall (1972) and Trende (2012), respectively.
33

Civil Rights achievements. While historians have debated the actual importance of Civil
Rights initiatives under Eisenhower (e.g., the 1957 and 1960 Civil Rights Acts famously
had no federal enforcement provisions and he expressly distanced himself from the Brown v.
Board decision), we put that debate to the side and instead focus on the contemporaneous
reaction to these episodes among white Southerners relative to other whites.
Figure 12 is the Eisenhower analogue to Figure 6, tracking his relative popularity in the
South versus elsewhere against media mentions of his name alongside Civil Rights terms.
There is a clear increase in Eisenhower’s connection to Civil Rights in the fall of 1957; he
sent federal troops to enforce the court-ordered desegregation of Little Rock Central High
School on September 24th of that year. In fact, his relative approval in the South declines by
25 percentage points between the polls of September 21 and October 12. The relationship
between Civil Rights and Eisenhower approval more generally is quantified in the regression
analysis shown in Appendix Table A.14. And just like for Kennedy, we see that Eisenhower
paid an approval penalty in the South when the news made mention of him alongside Civil
Rights (regardless of the search terms we use to identify articles), contradicting the claim
that Southerners were not upset by his Civil Rights gestures.
7 Conclusion
The exodus of Southern whites from the Democratic party is one of the most transformative,
and controversial, political developments in twentieth century U.S. history. While the quali-
tative literature has tended to point to the Democratic Party’s 1960s Civil Rights initiatives
as the primary cause, more quantitative analysts have challenged this conclusion.
Gallup micro-data on racial attitudes dating back to the 1950s have allowed us to make
progress on measuring the extent to which the exodus is motivated by racial attitudes.
Using their consistent, frequent and cross-contextually relevant question on whether the
respondent would vote for a qualified black candidate for president, we find that 100% (75%)
of dealignment from 1958 to 1980 (2000) can be explained, in a regression sense, by the
movement of racially conservative whites away from the Democratic Party, after the Spring
of 1963 when the party established the clear liberal position on Civil Rights. Gallup’s higher
frequency presidential approval and presidential election match-up questions allow us to more
finely pinpoint the large drop in Southern support for President Kennedy to the timing of
his proposal of Civil Rights legislation. Using a combination of survey and media data we
find corroborating evidence for the role of Democratic Civil Rights initiatives in explaining
34

white Southern defection from the Democratic Party in the late 1940s through early 1950s.
For neither the 1960s nor this earlier period do these data sources offer any support for
the most common alternative hypotheses for Southern derailment: the liberalization of the
Democratic Party, Southern economic development or other secular, coincident trends.
While we have focused on the how whites’ partisanship evolved during the most salient
Civil Rights period, quantifying the impact of race on political and policy preferences in
other contexts is clearly important and the subject of a large literature. The surveys we have
used to measure racial attitudes may prove helpful in studying other settings as well. Perhaps
a greater challenge given the current social desirability bias against admitting conservative
racial views (see Stephens-Davidowitz, 2014, Mas and Moretti, 2009 and Greenwald et al.,
2009 on whether racism cost Barack Obama votes in his presidential elections), is to measure
to what extent racial views continue to shape U.S. political outcomes today. We leave this
important question to future work.
References
Abramowitz, A. I. and Saunders, K. L. (1998). Ideological realignment in the us elec-torate. The Journal of Politics, 60 (03), 634–652.
Alesina, A. and Glaeser, E. L. (2004). Fighting poverty in the US and Europe: A worldof difference, vol. 26. Oxford University Press Oxford.
Alston, L. J. and Ferrie, J. P. (1993). Paternalism in agricultural labor contracts in theus south: Implications for the growth of the welfare state. The American economic review,pp. 852–876.
Besley, T., Persson, T. and Sturm, D. M. (2010). Political competition, policy andgrowth: theory and evidence from the us. The Review of Economic Studies, 77 (4), 1329–1352.
Brewer, M. D. and Stonecash, J. M. (2001). Class, race issues, and declining whitesupport for the democratic party in the south. Political Behavior, 23 (2), 131–155.
Campbell, A., Converse, P. E., Miller, W. E. and Donald, E. (1966). Stokes. 1960.the american voter.
Carmines, E. G. and Stimson, J. A. (1989). Issue evolution: Race and the transformationof American politics. Princeton University Press.
Feinstein, B. D. and Schickler, E. (2008). Platforms and partners: The civil rightsrealignment reconsidered. Studies in American Political Development, 22 (1), 1.
Gaines, B. J., Kuklinski, J. H. and Quirk, P. J. (2007). The logic of the surveyexperiment reexamined. Political Analysis, 15 (1), 1–20.
Gimpel, J. G. and Schuknecht, J. E. (2001). Interstate migration and electoral politics.Journal of Politics, 63 (1), 207–231.
35

Green, D. P., Palmquist, B. and Schickler, E. (2004). Partisan hearts and minds:Political parties and the social identities of voters. Yale University Press.
Greenwald, A. G., Smith, C. T., Sriram, N., Bar-Anan, Y. and Nosek, B. A.(2009). Implicit race attitudes predicted vote in the 2008 us presidential election. Analysesof Social Issues and Public Policy, 9 (1), 241–253.
Katznelson, I. (2013). Fear itself: The new deal and the origins of our time. WW Norton& Company.
Key Jr, V. O. (1949). Southern politics. new york: Alfred a.
Kousser, J. M. (2010). The immutability of categories and the reshaping of southernpolitics. Annual Review of Political Science, 13, 365–383.
Kuklinski, J. H., Cobb, M. D. and Gilens, M. (1997). Racial attitudes and the ‘newsouth. The Journal of Politics, 59 (02), 323–349.
Lee, W. and Roemer, J. E. (2006). Racism and redistribution in the United States: Asolution to the problem of American exceptionalism. Journal of Public Economics, 90 (6),1027–1052.
Luttmer, E. (2001). Group loyalty and the taste for redistribution. Journal of PoliticalEconomy, 109 (3), 500–528.
Mas, A. and Moretti, E. (2009). Racial bias in the 2008 presidential election. The Amer-ican Economic Review, pp. 323–329.
McCarty, N., Poole, K. T. and Rosenthal, H. (2006). Polarized America: The danceof ideology and unequal riches, vol. 5.
McVeigh, R., Cunningham, D. and Farrell, J. (2014). Political polarization as a socialmovement outcome: 1960s Klan activism and its enduring impact on political realignmentin Southern counties, 1960 to 2000. American Sociological Review, p. 0003122414555885.
Meltzer, A. and Richard, S. (1981). A rational theory of the size of government. TheJournal of Political Economy, 89 (5), 914–927.
Osborne, D., Sears, D. O. and Valentino, N. A. (2011). The end of the solidly demo-cratic south: The impressionable-years hypothesis. Political Psychology, 32 (1), 81–108.
Shafer, B. E. and Johnston, R. (2009). The end of Southern exceptionalism: class, race,and partisan change in the postwar South. Harvard University Press.
Stanley, H. W. (1988). Southern partisan changes: Dealignment, realignment or both?The Journal of Politics, 50 (01), 64–88.
Stephens-Davidowitz, S. (2014). The cost of racial animus on a black candidate: Evidenceusing google search data. Journal of Public Economics, 118, 26–40.
Tindall, G. B. (1972). The Disruption of the Solid South. Athens: University of GeorgiaPress.
Trende, S. (2012). The Lost Majority: Why the Future of Government Is Up for Grabs-andWho Will Take It. Macmillan.
Valentino, N. A. and Sears, D. O. (2005). Old times there are not forgotten: Race andpartisan realignment in the contemporary south. American Journal of Political Science,49 (3), 672–688.
36

Wattenberg, M. P. (1991). The building of a republican regional base in the south theelephant crosses the mason-dixon line. Public Opinion Quarterly, 55 (3), 424–431.
Wright, G. (2013). Sharing the Prize. Harvard University Press.
37

Figure 1: Share of Democrats among whites in Southern and non-Southern States
Notes: Individual-level data from Gallup polls (accessed via ipoll), 1944-2004. South is definedthroughout as the eleven states of the former Confederacy. Throughout the paper, we restrictourselves to those ipoll surveys which were originally submitted as ascii files (as opposed to originallybinary and converted into ascii by Roper). Roper warns that unreadable characters may have arisenin the conversion process and indeed every binary file we tried to read (roughly a dozen) hadcharacters for some of our key variables that we could not decipher. We thus avoid binary files toensure data quality. For this figure, we use every non-binary file that includes state and party-idfrom 1944-1980. From 1980-2004 Gallup surveys become more frequent and we choose just one perquarter to limit the burden of reading-in raw data files.
Figure 2: Share of whites willing to vote for a black president, by region
Notes: Data come from Gallup polls 1958-2003 and GSS 1974-2010. Here and throughout the paper,we count “Don’t know” as unwilling.
38

Figure 3: Whites’ views of which party will ensure school integration, by year and region
Notes: Data are from the ANES 1960, 1964 and 1968 individual year files. Responses to the 1960question which asks “which party is more likely to stay out” of school integration are reoriented sothat answers align in party support for school integration with the later year questions which askwhich party “is more likely to want the government to see to it” that white and black children goto the same schools. “No difference between the two parties” is not plotted, but can be derived bysubtracting the sum of the Republican and Democratic shares from one. We have dropped missingobservations, so Dem + Rep + No difference sum to 100%.
Figure 4: Frequency of Articles Mentioning “President Kennedy” and Civil Rights terms inThe New York Times, 1961-1963
Notes: Data are from daily counts of New York Times articles using their online search tool andR search script. The “Civil Rights” search counts the number of articles that include the phrase“President Kennedy” and “Civil Rights.” The “Civil Rights terms” search counts articles thatinclude the phrase “President Kennedy” and any of the following: “Civil Rights,” any form of theword ‘integrate’ and any form of the word ‘segregate.’
39

Figure 5: Coefficient from regressing Democratic identification on NoBlackPrez by regionand survey date (whites only)
Notes: Circles denote that the coefficient comes from a Gallup survey and triangles denote a GSSsurvey. Democratic identification is a binary variable coded as one (here and for all other tablesand figures) if and only if the respondent identifies as Democrat. (Independent, Republican and“Don’t know” all coded zero). NoBlackPrez is coded as one if a respondent is against or unsureabout voting for a qualified black nominee from his party. The vertical line marks our ‘pre-’ and‘post-periods.’ All individuals in the sample are white.
Figure 6: Approval of Kennedy among whites by region as a function of articles with hisname alongside Civil Rights terms
Notes: Article count includes the daily number of NYT articles that include “President” and“Kennedy” and any“Civil Rights terms” (“civil rights” and any form of the word “integration” and“segregation”). So as not to clutter the graph, we suppress the axis for this variable, but it identicalto the y-axis in Figure 4. In the approval data (Gallup), “approve” is coded as one, and disapproveor no opinion (rare) is coded as zero. According to the Roper catalog, Gallup asks about Kennedyapproval 39 times, all of which are downloadable on ipoll. However only 25 were originally enteredin ASCII format and thus meet our data quality standard.
40
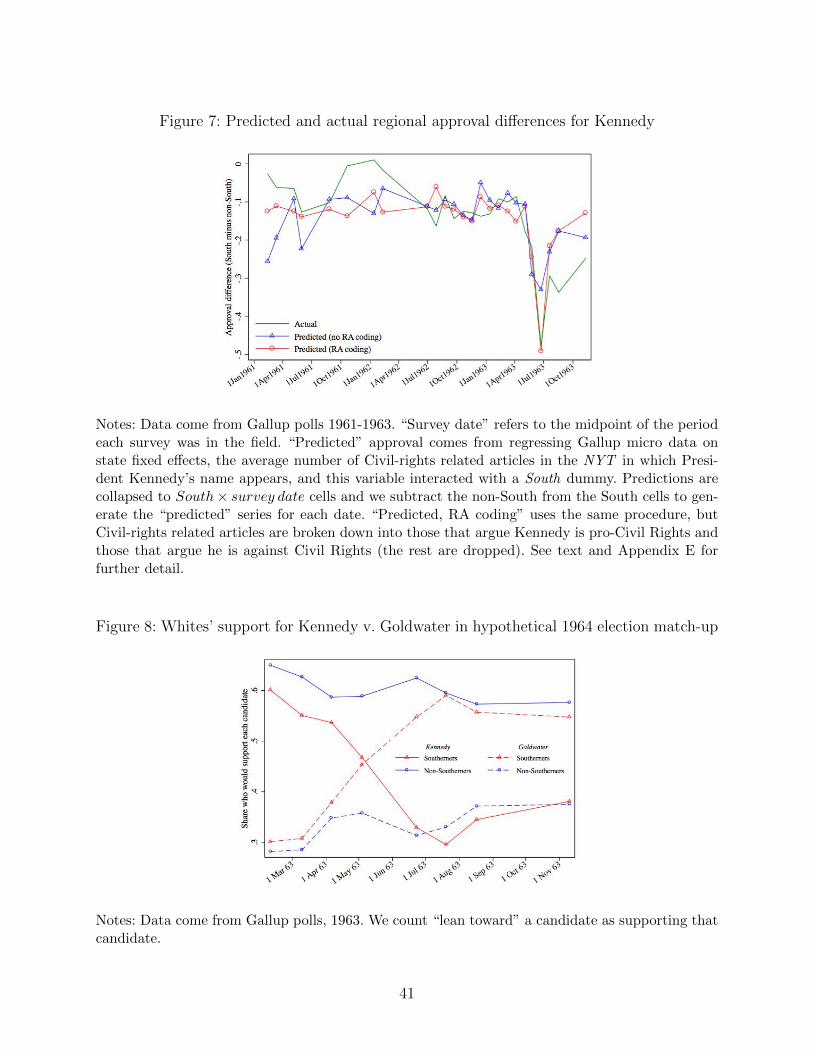
Figure 7: Predicted and actual regional approval differences for Kennedy
Notes: Data come from Gallup polls 1961-1963. “Survey date” refers to the midpoint of the periodeach survey was in the field. “Predicted” approval comes from regressing Gallup micro data onstate fixed effects, the average number of Civil-rights related articles in the NYT in which Presi-dent Kennedy’s name appears, and this variable interacted with a South dummy. Predictions arecollapsed to South× survey date cells and we subtract the non-South from the South cells to gen-erate the “predicted” series for each date. “Predicted, RA coding” uses the same procedure, butCivil-rights related articles are broken down into those that argue Kennedy is pro-Civil Rights andthose that argue he is against Civil Rights (the rest are dropped). See text and Appendix E forfurther detail.
Figure 8: Whites’ support for Kennedy v. Goldwater in hypothetical 1964 election match-up
Notes: Data come from Gallup polls, 1963. We count “lean toward” a candidate as supporting thatcandidate.
41

Figure 9: Share of Democratic votes in Presidential Elections (South minus non-South)
Notes: Data come from ANES cumulative file. Votes for the Democratic presidential candidate arecoded as one. Votes for any non-Democratic candidate (including Independents) coded as zero.
Figure 10: Coefficient from regressing Democratic identification on NoCatholicPrez ; by regionand year (whites in Gallup)
Notes: Data from Gallup 1958-1980. As with NoBlackPrez we code NoCatholicPrez as one if therespondent is unwilling to vote or unsure about voting for a qualified Catholic nominee from hisparty.
42

Figure 11: Predicted versus actual Southern Democratic advantage among whites
Notes: Gallup 1958-1980. The first series is the actual South-non-South difference in Democraticidentification among whites. The second arises from col. (4) of Table 2 after setting the residualdealignment not explained by differential dealignment among those against a black president (i.e.,the coefficient on Conf ×After) to zero. That is, the second series is predicted dealignment ifracially conservative views are the only reason individuals switched parties beginning in 1963. Thethird series instead shows the predicted South-non-South difference if the only reason individualsswitched parties were anti-Catholic sentiment beginning in 1961. See Section 6.3 for additionaldetail.
Figure 12: Frequency of Articles Mentioning “President Eisenhower” with Civil Rights termsand relative Presidential approval (whites in South versus non-South)
Notes: Data come from New York Times daily searches and Gallup approval data. According tothe Roper catalog, Gallup asks about Eisenhower approval 119 times, all of which aredownloadable. However only 52 were originally entered in ASCII format and thus meet our dataquality standard.
43
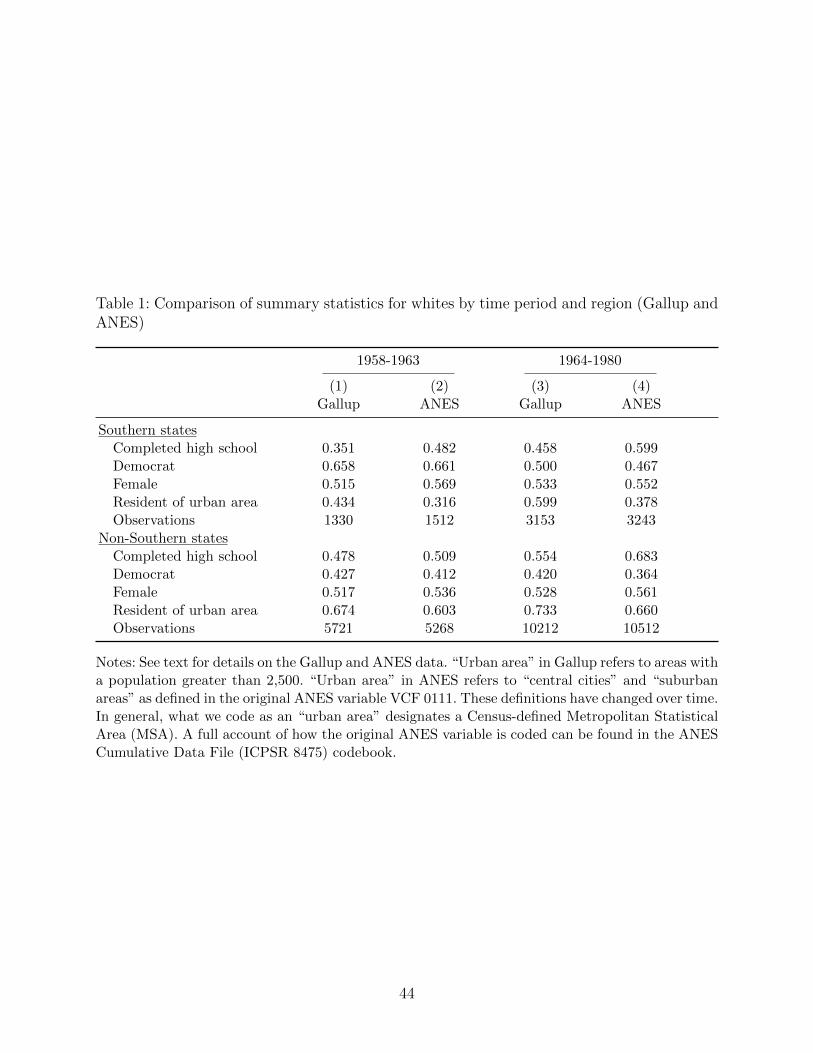
Table 1: Comparison of summary statistics for whites by time period and region (Gallup andANES)
1958-1963 1964-1980
(1) (2) (3) (4)Gallup ANES Gallup ANES
Southern statesCompleted high school 0.351 0.482 0.458 0.599Democrat 0.658 0.661 0.500 0.467Female 0.515 0.569 0.533 0.552Resident of urban area 0.434 0.316 0.599 0.378Observations 1330 1512 3153 3243
Non-Southern statesCompleted high school 0.478 0.509 0.554 0.683Democrat 0.427 0.412 0.420 0.364Female 0.517 0.536 0.528 0.561Resident of urban area 0.674 0.603 0.733 0.660Observations 5721 5268 10212 10512
Notes: See text for details on the Gallup and ANES data. “Urban area” in Gallup refers to areas witha population greater than 2,500. “Urban area” in ANES refers to “central cities” and “suburbanareas” as defined in the original ANES variable VCF 0111. These definitions have changed over time.In general, what we code as an “urban area” designates a Census-defined Metropolitan StatisticalArea (MSA). A full account of how the original ANES variable is coded can be found in the ANESCumulative Data File (ICPSR 8475) codebook.
44

Table 2: Democratic Party identification among whites as a function of region and racial views
Dep’t variable: Respondent identifies as a Democrat (all other responses coded as zero)
(1) (2) (3) (4) (5) (6) (7) (8) (9) (10) (11)
South 0.230∗∗∗ 0.0835[0.0485] [0.0684]
South x Aft -0.149∗∗ -0.00130 -0.165∗∗ 0.00264 -0.164∗∗ -0.0151 -0.153 -0.167∗∗∗ -0.00492 -0.195∗∗∗ -0.0436[0.0657] [0.0688] [0.0658] [0.0595] [0.0629] [0.0612] [0.145] [0.0624] [0.0585] [0.0519] [0.0618]
No Bl prez 0.0201 0.00671 -0.00612 0.0104 0.00798 0.00930[0.0177] [0.0158] [0.0154] [0.0157] [0.0158] [0.0158]
South x No Bl prez 0.159∗∗ 0.187∗∗∗ 0.172∗∗∗ 0.158∗∗ 0.192∗∗∗ 0.183∗∗∗
[0.0652] [0.0570] [0.0563] [0.0744] [0.0570] [0.0605]
No Bl prez x Aft -0.0216 -0.0124 -0.0164 -0.0287 -0.00668 -0.0171[0.0244] [0.0242] [0.0224] [0.0223] [0.0226] [0.0200]
South x No Bl prez x Aft -0.161∗ -0.186∗∗ -0.171∗∗ -0.158∗ -0.174∗∗ -0.147∗∗
[0.0809] [0.0745] [0.0764] [0.0923] [0.0718] [0.0716]
Mean, dep. var. 0.452 0.452 0.452 0.452 0.451 0.451 0.451 0.435 0.435 0.391 0.391State FE? No No Yes Yes Yes Yes Yes Yes Yes Yes YesControls? No No No No No Yes Yes No No No NoInteractions? No No No No No No Yes No No No NoMax year 1980 1980 1980 1980 1980 1980 1980 1980 1980 2000 2000GSS? No No No No No No No Yes Yes Yes YesObservations 20192 20192 20192 20192 19787 19787 19787 25235 25235 41588 41588
Notes: Democratic identification is a binary variable coded one (here and for all other tables and figures) if and only if the respondentidentifies as a Democrat. ( Independent, Republican and “Don’t Know” all coded zero.) Year fixed effects included in all regressions, andstate fixed effects in column (3) and beyond. Aft is an indicator variable for being surveyed after April 1963. “No Bl prez” is an indicatorvariable for reporting unwillingness to vote for a qualified black presidential candidate (“don’t know” and “no” are both coded as one).“Controls” indicate that age (in ten-year intervals), gender, education categories (six) and city-size category (twelve) fixed effects havebeen added. “Interactions” includes each of these controls as well as their interactions with South and Aft. “Max year” indicates theend point of the sample period (in all cases, the first year of the sample period is 1958) and “GSS” indicates where GSS data have beenadded to the regression. Standard errors clustered by state. ∗p < .1,∗∗ p < .05,∗∗∗ p < 0.01
45

Table 3: Testing for composition bias in main regression results
Dep’t variable: Respondent identifies as a Democrat
(1) (2) (3) (4) (5) (6)
South x Aft -0.161∗∗ 0.00485 -0.165∗∗ 0.0471 0.0574 0.00388[0.0690] [0.0644] [0.0712] [0.120] [0.110] [0.0905]
No Bl prez 0.00661[0.0158]
South x No Bl prez 0.178∗∗∗
[0.0578]
No Bl prez x Aft -0.00912[0.0279]
South x No Bl prez x Aft -0.188∗∗
[0.0758]
No Bl prez (pr.) 0.0115 0.00811 0.00105[0.0240] [0.0198] [0.0203]
South x No Bl prez (pr.) -0.0126 0.0177 0.146∗
[0.108] [0.0979] [0.0809]
No Bl prez (pr.) x Aft -0.00292 -0.0109 -0.0178[0.0244] [0.0234] [0.0240]
South x No Bl prez (pr.) -0.218∗ -0.225∗ -0.166∗
x Aft [0.125] [0.115] [0.0978]
Mean, dept. var 0.458 0.458 0.457 0.457 0.457 0.457Fixed sample? No No Yes Yes Yes YesPrediction vars:
Background N/A N/A N/A Yes Yes YesOther views N/A N/A N/A No Yes YesAge interactions N/A N/A N/A No No Yes
R-sq for prediction 0.126 0.237 0.247SEs bootstrapped? No No No Yes Yes YesObservations 17642 17642 17130 17130 17130 17130
Notes: Year and state fixed effects in all regressions. The first two columns replicate cols. (3) and(4) of Table 2 but truncates the post-period at 1969. No Bl prez (pr.) is a predicted value for NoBl prez using the pre-period sample and then projecting the estimated coefficients onto the wholesample. We perform this prediction (estimated separately by South/nonSouth) for three sets ofvariables: “background” (gender, age in deciles, education, city-size, occupation for household head,household size, and religion), “Views” (views on hypothetical Jewish or Catholic presidents), and“age interactions” (interacting occupation and education categories with age-in-decile categories).Predictors enter as separate fixed effects for each category (e.g., eight age-in-decile fixed effects,four education categories). We assign each predicted value of “No Bl prez.” to zero (one) if it isbelow (above) 0.5. The reported R2 values are based on the pre-period. “Fixed sample” excludesobservations with missing values for any variable used in the predictions. Bootstrapped standarderrors based on 500 repetitions. The sample period for all regressions is 1958-1969. Standard errorsclustered by state. ∗p < .1,∗∗ p < .05,∗∗∗ p < 0.0146

Table 4: White approval of JFK as function of Civil Rights coverage
Search terms employed: “President Kennedy” and...
“Civil rights” Civil rights terms “Negro”
(1) (2) (3) (4) (5)
Article count -0.0153∗∗
[0.00693]
Article count x South -0.0560∗∗∗ -0.0591∗∗∗ -0.0465∗∗∗ -0.114∗∗∗ -0.0587∗∗∗
[0.00743] [0.00441] [0.00484] [0.00863] [0.00743]
Conf x Placebo: Foreign 0.0101 0.0197∗∗ 0.00623 0.0162Policy, War [0.00832] [0.00816] [0.00914] [0.0121]
Conf x Placebo: Crime, -0.00720 -0.0147 0.0172 -0.0136Drugs [0.0272] [0.0354] [0.0270] [0.0249]
Conf x Placebo: USSR 0.0208∗∗∗ 0.0323∗∗∗ 0.0157∗∗ 0.0194∗∗
[0.00677] [0.00751] [0.00646] [0.00901]
Conf x Placebo: Cuba, -0.0147 -0.00849 0.00676 -0.00657Castro [0.00941] [0.00957] [0.0102] [0.0100]
Conf x Placebo: -0.00353 -0.0125∗ -0.0142 -0.00583Communism, Socialism [0.00683] [0.00662] [0.00961] [0.0129]
Conf x Placebo: Taxes, 0.0136 0.0183∗∗ -0.0125 0.0147Budget [0.00894] [0.00870] [0.0107] [0.0122]
Conf x Placebo: 0.00288 -0.0220 0.0134 -0.0172Employment [0.0120] [0.0151] [0.0126] [0.0144]
Conf x Placebo: Social -0.00576 0.00706 0.0341∗ 0.00685Security [0.0132] [0.0124] [0.0166] [0.0227]
Conf x Placebo: 0.0178∗∗ 0.0191∗∗ 0.0177∗∗ 0.0182∗
Agriculture [0.00721] [0.00731] [0.00785] [0.00964]
Mean, dept. var. 0.673 0.673 0.673 0.673 0.673Survey date FE? No Yes Yes Yes YesRA coding? No No No Yes NoObservations 81365 81365 81365 81365 81365
Notes: Data taken from all useable Gallup surveys that contain presidential approval data duringKennedy’s administration (January 1961 – November 1963). Dependent variable is a dummy codedas one if respondent approves of Kennedy’s performance. State fixed effects are included in all regres-sions. “Civil Rights” denotes frequency of NYT articles containing “President Kennedy” and“civilrights.” “Civil Rights Terms” denotes frequency of articles containing “President Kennedy” and“civil rights” or any form of the word “segregate” or “integrate”. “Negro” refers to the frequencyof articles containing “President Kennedy” and“negro”. Placebo searches are articles containing“President Kennedy” and variations of the terms summarized in the coefficient labels (see Ap-pendix E for details). We average this daily count over seven days centered on the midpoint of thetime (typically six days) the survey is in the field.. Standard errors clustered by survey date (25clusters). ∗p < 0.1,∗∗ p < 0.05,∗∗∗ p < 0.01
47

Table 5: Do negative views toward other minority groups explain white Southern dealignment?
Female Jewish Catholic Cath (Aft=1961)
(1) (2) (3) (4) (5) (6) (7) (8) (9) (10) (11) (12) (13) (14)
South x Aft -0.188∗∗∗ -0.166∗∗ -0.0295 -0.0167 -0.173∗∗ -0.179∗∗ -0.00395 -0.0107 -0.173∗∗ -0.166∗∗ -0.00782 -0.00751 -0.184∗∗∗ -0.156∗∗∗
[0.0662] [0.0673] [0.0799] [0.0782] [0.0664] [0.0670] [0.0615] [0.0580] [0.0661] [0.0716] [0.0625] [0.0548] [0.0450] [0.0528]
No prez -0.0391 -0.0434 -0.0185 -0.0253 -0.158∗∗∗ -0.167∗∗∗ -0.132∗∗∗
[0.0243] [0.0259] [0.0165] [0.0184] [0.0237] [0.0249] [0.0191]
South x No 0.00749 -0.00248 0.0305 0.00531 0.125∗∗ 0.110∗ 0.134∗∗
prez [0.0527] [0.0554] [0.0330] [0.0368] [0.0538] [0.0577] [0.0502]
No prez x 0.0488 0.0525∗ -0.0173 -0.0118 -0.0636∗∗ -0.0664∗ -0.104∗∗∗
Aft [0.0295] [0.0296] [0.0180] [0.0223] [0.0297] [0.0342] [0.0190]
South x No -0.0595 -0.0482 0.0459 0.0864 0.0699 0.100∗ 0.0387prez x Aft [0.0708] [0.0745] [0.0483] [0.0582] [0.0505] [0.0587] [0.0519]
No Bl prez 0.0144 0.0228 0.00720 0.0161 0.00719 0.0379∗∗
[0.0209] [0.0224] [0.0160] [0.0178] [0.0157] [0.0169]
South x No Bl 0.162∗∗ 0.163∗∗ 0.185∗∗∗ 0.184∗∗∗ 0.181∗∗∗ 0.164∗∗
prez [0.0686] [0.0708] [0.0594] [0.0674] [0.0615] [0.0736]
No Bl prez x -0.00934 -0.0198 -0.0132 -0.0128 -0.0133 -0.00777Aft [0.0278] [0.0281] [0.0250] [0.0283] [0.0247] [0.0267]
South x No Bl -0.182∗ -0.171∗ -0.189∗∗ -0.219∗∗ -0.185∗∗ -0.198∗∗
prez x Aft [0.0922] [0.0945] [0.0790] [0.0843] [0.0808] [0.0904]
Mean, d. var. 0.447 0.447 0.447 0.447 0.456 0.456 0.456 0.456 0.456 0.456 0.456 0.456 0.456 0.456Observations 11693 11693 11693 11693 18883 18883 18883 18883 18884 18884 18884 18884 20361 20361
Notes: Dependent variable is a dummy variable for Democratic identification. State and year FE included; the sample period used runsfrom 1958 to 1980, with 1963 as the first year of the ’after’ period Gallup dataset, except in columns (13) and (14), where the firstperiod of the after period is 1961. Analysis in columns (1) through(12) was conducted only on Gallup poll data for which both the “noto black president” and the no to other president questions were present. Together with the “no black president” question: the “noCatholic president” question was asked in Gallup polls from 1958, 1959, 1961, 1963, 1965, 1967, 1969, and 1978; the “no Jewishpresident” question was asked in 1958, 1959, 1961, 1963, 1965, 1967, 1969, and 1978; the “no woman president” question was asked in1958, 1959, 1963, 1967, 1969, and 1978. For columns (13) and (14), the sample was expanded to Gallup poll data for which the “noCatholic president” question was asked. Standard errors clustered by state in parenthesis. ∗p < 0.1,∗∗ p < 0.05,∗∗∗ p < 0.01
48

Table 6: Explanatory power of income and urbanicity in explaining white Southern dealign-ment (ANES, 1952-1980)
Dep’t variable: Respondent identifies as a Democrat
(1) (2) (3) (4) (5) (6)
Panel A (Diff-in-diff spec.)
South x After -0.142∗∗∗ -0.141∗∗∗ -0.150∗∗∗ -0.150∗∗∗ -0.130∗∗ -0.155∗∗∗
[0.0425] [0.0408] [0.0434] [0.0377] [0.0528] [0.0477]Panel B (Diff. trend spec.)
South x (Year/100) -0.967∗∗∗ -0.950∗∗∗ -1.000∗∗∗ -0.964∗∗∗ -0.816∗∗∗ -0.886∗∗∗
[0.179] [0.171] [0.184] [0.166] [0.230] [0.211]
Dept. var mean 0.416 0.416 0.416 0.416 0.442 0.442Income FE? No Yes Yes Yes No YesCity-size FE? No No Yes Yes No YesInteractions? No No No Yes No YesRestricted sample? No No No No Yes YesObservations 19543 19543 19543 19543 13523 13523
Notes: The twelve coefficients above are each from a separate regression. The first panel take theform Demits = βSouth × After + γXits + µs + ηt + eits and the second panel take the formDemits = βSouth×Y ear+ γXits +µs + ηt + eits, where South×After is an indicator variable forbeing surveyed after April 1963 and residing in one of the eleven Southern states at the time of thesurvey, South ·Y ear is a South-specific linear time trend, µs are state fixed effects, ηt are year fixedeffects, and Xits is a vector of controls that we vary to test robustness. Income (five categories)and city-type (three categories) fixed effects are included where specified in the table footer. Where“Interactions” are specified, income and city-type fixed effects have each been interacted with Southand (separately) with After (when South×After is the explanatory variable of interest) or Y ear(when South × Y ear is the explanatory variable of interest). The “Restricted” sample used incolumns 5 and 6 excludes those younger than 21 years in 1963 and current Southern residents whowere not born in the South. (These specifications, therefore, exclude those with missing values forplace of birth). Standard errors clustered by state. ∗p < 0.1,∗∗ p < 0.05,∗∗∗ p < 0.01
49

Appendix A. Supplementary figures and tables noted in the text
Appendix Figure A.1: Would vote for a black president (including non-white respondents)
Notes: Data from Gallup polls 1958-2003 and GSS surveys 1974-2010.
Appendix Figure A.2: Share of whites who would not move if....
(a) Black family moved next door(b) Neighborhood became halfblack
Notes: For both subfigures data are taken from Gallup polls 1958-1978.
Appendix Figure A.3: “Civil Rights” articles by month, Southern papers (1963)
(a) Dallas Morning News (b) N. Orleans Times-Picayune
Notes: We could articles that include the phrase “Civil Rights.” For both subfigures we performedarticle searches in the summer of 2014 using Library of Congress state newspapers as well as YaleUniversity subscriptions to ProQuest Historical Newspapers and 20th Century AmericanNewspapers.
50

Appendix Figure A.4: Share of respondents identifying Civil Rights as the most importantproblem
Notes: Gallup polls 1950-1979. This item has at least four limitations to note. First, it is notasked on a regular schedule. The question is fielded six times in 1962 but only once in the keyyear of 1963. Second, we are unable to produce analysis by race and region. In order to retain asmany data points as possible, we graph the frequencies using the website Gallup Brain ratherthan reading in the data ourselves, which would mean losing those surveys without usable data onipoll. Third, in some surveys Gallup allows individuals to provide more than one response to themost important problem question, which adds noise to our analysis. Finally, Gallup does not codethe responses consistently from survey to survey. In some surveys the frequency responding “civilrights” is reported alone. In other surveys “civil rights” responses are grouped with, “racialproblems, discrimination and states rights,” in other surveys with “integration,” and in stillothers with “demonstrations.” For each survey, we graph the frequency responding to thecategory that includes “civil rights,” so inconsistencies arise year-to-year.
Given these data limitations, we cannot replicate the analysis for all surveys by race and region,but below we do so for four key surveys: two from the low-importance early 1960s and two fromthe high-importance mid-1960s.
Pre-period Post-period
Feb. 1961 June-July 1962 Apr. 1964 June 1964
Whites, South .095 .140 .400 .510Blacks, South .310 .270 .640 .730Whites, Non-South .036 .058 .380 .420Blacks, Non-South .170 .230 .650 .670
The levels differ in the expected manner. Southern whites rate Civil Rights as more importantthan non-Southern whites, consistent with the targets of proposed Civil Rightslegislation—discrimination in public accommodations and voting—existing only in the South andthus only Southern whites being affected. Not surprisingly, blacks care more about the issue thanwhites, regardless of region.
51

Appendix Figure A.5: Approval of JFK among black Gallup respondents, 1961-1963
Notes: Data are from Gallup surveys. We plot approval by survey date, which we calculate as themidpoint of the window that each survey was in the field.
Appendix Figure A.6: Predicted and actual regional approval differences for JFK amongwhites (Social Security and safety net issues)
Notes: Data come from Gallup polls 1961-1963. “Predicted” approval comes from regressing Gallupmicro data on state fixed effects, the average number of Social Security and safety net articles inthe NYT in which President Kennedy’s name appears during the survey window, and this variableinteracted with a South dummy. Predictions are collapsed to South × survey date cells and wesubtract the non-South from the South cells to generate the “predicted” series for each date. Seetext for further detail.
Appendix Figure A.7: Democratic share of votes in presidential elections
Notes: Data are from U.S. election returns data as tabulated at the state-election-year level byDavid Leip, 1900-2012. Data available for purchase here: http://uselectionatlas.org/.
52

Appendix Figure A.8: Democrats’ advantage among Catholics in presidential elections
Notes: Data are from the cumulative ANES, 1952-2008, only white respondents. Respondents re-porting support for the Democratic candidate are coded as one, and all other responses (Republican,Independent, “don’t know”) are coded as zero.
Appendix Figure A.9: Share of whites who plan to vote for Truman in 1948 election as afunction of NYT articles containing his name alongside Civil Rights terms
Notes: Hypothetical vote data are from the five readable Gallup surveys on iPoll that ask aboutplanned votes in the 1948 election. Our first two surveys (July and November/December 1947 ) pitTruman against Governor Thomas Dewey (R-NY), our second two (March and September, 1948)also include Henry Wallace, the Progressive party nominee and a staunch integrationist challengerand our final survey (in late September/early October 1948) includes, for Southern respondents only,the segregationist Strom Thurmond (D-SC), the Dixiecrat nominee on the ballot only in Southernstates. Respondents planning to support Truman are coded as one and all other responses (“don’tknow,” Thomas Dewey (R-NY), Henry Wallace (Independent) and Strom Thurmond (Dixiecrat-SC)) as zero. Newspaper article counts are based on NYT searches. The first counts articles thatinclude the terms “President Truman” and “Civil Rights” anywhere in the article. The secondcounts articles with “President Truman” and any of the following terms: “Civil Rights,” “lynching,”any form of the word “segregate” and any form of the word “integrate.”
53

Appendix Table A.1: Whites’ opinions on race-related questions, by response to black pres-ident question (GSS, 1972-1980)
Would vote for a Would not vote fora black president a black president
Strongly agree that blacks shouldn’t push .3671737 .6797642themselves where they are not wanted [N=2827] [N=1018]
Agree that government does too much to .2325276 .4933712improve condition of blacks [N=3806] [N=1056]
Against busing of black and white school .8347466 .9147287children from one district to another [N=4835] [N=1548]
Agree that white and black children should .0562566 .3559557go to separate schools [N=1902] [N=722]
Object to sending children to a school where .0278278 .1737747a few of the children are black? [N=4995] [N=1571]
Favors laws against marriages between blacks .2575914 .640031and whites [N=3886] [N=1289]
Would object to family member bringing black .1835052 .561245friend for dinner [N=2910] [N=996]
Notes: Gallup survey weights (variable wtss) used in all summary statistics. We chose GSS racialattitude variables based on the number of observations during our main sample period.
Appendix Table A.2: Comparison of demographics of main Gallup analysis sample to IPUMS
1960 1970
(1) (2) (3) (4)Gallup IPUMS Gallup IPUMS
Southern statesCompleted high school 0.351 0.418 0.497 0.516Female 0.515 0.516 0.533 0.524Resident of urban area 0.434 0.603 0.572 0.652Observations 1330 199391 673 244145
Non-Southern statesCompleted high school 0.478 0.458 0.579 0.586Female 0.517 0.517 0.530 0.527Resident of urban area 0.674 0.687 0.743 0.708Observations 5721 772823 2116 848060
Notes: Gallup weights and IPUMS person-weights used in all summary statistics. Gallup statisticsreported above are limited to surveys that include the black president question and fall within twoyears of the given Census year. In particular, for 1960, we have two surveys from 1958 and oneeach from 1959 and 1961. For 1970 we have one each from 1969 and1971. Our earlier Gallupsurveys tended to have larger samples.
54

Appendix Table A.3: Robustness of main triple-interaction results to estimating model, control group and outcome variable
Dependent variable: Respondent identifies as a....
Democrat Republican
(1) (2) (3) (4) (5) (6) (7) (8) (9) (10) (11) (12)
South x Aft -0.432∗∗ 0.00673 -0.178∗∗ -0.00260 -0.152∗∗ -0.0146 -0.162∗∗ 0.00166 -0.148∗ 0.0690 0.0774∗∗ 0.00668[0.179] [0.153] [0.0697] [0.0735] [0.0680] [0.0614] [0.0687] [0.0632] [0.0727] [0.0796] [0.0311] [0.0729]
No Bl prez 0.0173 -0.0235 0.0450 0.0164 -0.0757 0.0479∗∗∗
[0.0414] [0.0344] [0.0398] [0.0220] [0.0696] [0.0151]South x No Bl 0.494∗∗∗ 0.210∗∗∗ 0.137∗ 0.180∗∗∗ 0.250∗∗ -0.130∗∗
prez [0.153] [0.0690] [0.0745] [0.0595] [0.0909] [0.0572]No Bl prez x -0.0326 0.0198 -0.0523 -0.0319 0.0862∗ 0.0121Aft [0.0630] [0.0690] [0.0324] [0.0199] [0.0442] [0.0237]South x No Bl -0.492∗∗ -0.210∗ -0.132 -0.177∗∗ -0.262∗∗∗ 0.0606prez x Aft [0.198] [0.107] [0.0808] [0.0718] [0.0884] [0.0784]
Observations 20192 20192 9660 9660 7651 7651 10639 10639 5511 5511 20192 20192Control Group All All Northeast Northeast West West Midwest Midwest Other South Other South All AllModel Probit Probit OLS OLS OLS OLS OLS OLS OLS OLS OLS OLSMean 0.452 0.452 0.478 0.478 0.504 0.504 0.459 0.459 0.565 0.565 0.296 0.296
Notes: These specifications replicate cols. (3) and (4) of Table 2 (i.e., year and State FE are included; the sample period starts in 1958,with 1963 as the first year of the ‘after’ period, and continues through 1980). Probit specifications report marginal effects. Controlsgroups in cols. (3) through (10) are based on U.S. Census definition of region (“other South” referring to states in the “South” Censusregion but not meeting this paper’s definition of “South,” the eleven states of the former Confederacy). Standard errors clustered bystate in brackets. ∗p < 0.1,∗∗ p < 0.05,∗∗∗ p < 0.01
55

Appendix Table A.4: Robustness of main triple-interaction results in samples restricted by age and gender
Age Gender
(1) (2) (3) (4) (5) (6) (7) (8)
South x Aft -0.159∗ 0.000311 -0.167∗∗ -0.00629 -0.183∗∗ 0.00483 -0.149∗∗ 0.0117[0.0865] [0.0633] [0.0637] [0.107] [0.0712] [0.0757] [0.0643] [0.0604]
No Bl prez 0.0244 0.00154 0.0112 0.00126[0.0199] [0.0239] [0.0172] [0.0219]
South x No Bl 0.164∗∗∗ 0.166∗ 0.199∗∗∗ 0.186∗∗
prez [0.0514] [0.0921] [0.0558] [0.0864]No Bl prez x -0.0249 -0.0104 0.0245 -0.0402Aft [0.0304] [0.0297] [0.0313] [0.0323]South x No Bl -0.188∗∗ -0.178 -0.223∗∗ -0.169∗∗
prez x Aft [0.0705] [0.116] [0.0876] [0.0818]
Observations 7789 7789 12403 12403 9685 9685 10507 10507Age 40 and under 40 and under Over 40 Over 40 – – – –Gender – – – – Male Male Female FemaleMean 0.441 0.441 0.459 0.459 0.437 0.437 0.465 0.465
Notes: These specifications replicate cols. (3) and (4) of Table 2 (i.e., year and State FE are included; the sample period starts in 1958,with 1963 as the first year of the ‘after’ period, and continues through 1980). Standard errors clustered by state in parenthesis.∗p < 0.1,∗∗ p < 0.05,∗∗∗ p < 0.01
56

Appendix Table A.5: White approval of JFK as function of Civil Rights coverage (as fractionof total daily article count)
(1) (2) (3)
South x Civil Rights share of articles -21.66∗∗∗
[3.050]
South x Civil rights terms share of articles -15.51∗∗∗
[3.571]
South x Negro share of articles -21.09∗∗∗
[5.234]
Observations 81365 81365 81365Mean 0.673 0.673 0.673
Notes: State and survey date fixed effects and “placebo” interactions with South (see Table 4) areincluded in all regressions but not reported in the interest of space. The “Civil Rights,” “CivilRights Terms” and “Negro” variables are identical to those in Table 4 except that we divide bythe total number of NYT articles during the window. So, the variables are now the share ofarticles during the survey window comprised by each search. Standard errors clustered by surveydate (25 clusters). ∗p < 0.1,∗∗ p < 0.05,∗∗∗ p < 0.01
Appendix Table A.6: White approval of JFK as function of Civil Rights coverage, controllingfor South linear time trend
(1) (2) (3)
South x Civil Rights articles -0.0434∗∗∗
[0.00756]
South x Civil Rights terms articles -0.0340∗∗∗
[0.00716]
South x Negro articles -0.0391∗∗
[0.0144]
South x Linear date -0.000189∗∗∗ -0.000185∗∗ -0.000185∗
[0.0000640] [0.0000674] [0.000105]
Observations 81365 81365 81365Mean 0.673 0.673 0.673
Notes: This table is identical to Appendix Table A.5 except that we do not divide thearticle-count variables by the total number of articles (so, they are in their usual form, as in Table4) and we add a South-specific linear time trend. ∗p < 0.1,∗∗ p < 0.05,∗∗∗ p < 0.01
57

Appendix Table A.7: Pre-period policy differences between whites in South and non-South(ANES)
South N Non-South N Diff
—Economic policyGov’t should guarantee jobs 3.63 483 3.57 1914 0.067
Agree that gov’t should guarantee jobs 0.56 547 0.55 2116 0.0094Gov’t sd not cut taxes if causes cuts elsewhere 3.47 267 3.49 1063 -0.018
Agree gov’t should not cut taxes 0.46 326 0.48 1282 -0.020Gov’t sd help ppl get medical care at low cost 3.64 501 3.53 1885 0.11
Agree gov’t sd help with medical care 0.59 547 0.53 2115 0.058∗∗
Gov’t sd limit pol. influ. of big business 4.00 241 3.84 954 0.16Agree that gov’t should limit infl. of business 0.54 327 0.51 1280 0.024
Gov’t sd. *not* limit pol. influ. of unions 2.23 241 2.20 1002 0.028Agree gov’t sd. *not* limit infl. of unions 0.19 326 0.20 1276 -0.0035
Gov’t sd *not* leave utilities, housing to priv. biz. 2.46 404 2.41 1623 0.046Agree that gov’t sd *not* leave...to priv biz. 0.22 546 0.23 2114 -0.0045
Fed gov’t sd help finance local school construction 3.63 500 3.79 1906 -0.16∗∗
Agree fed gov’t sd help finance schools 0.59 547 0.61 2114 -0.026
—Foreign policy, communismGov’t cannot fire suspected communists 3.71 285 3.78 1111 -0.069
Agree gov’t cannot fire susp. communists 0.57 327 0.59 1279 -0.021Keep soldiers abroad to help countries fight comm. 4.14 456 4.05 1772 0.090
Agree we sd keep soldiers abroad.... 0.65 547 0.63 2112 0.012We sd give aid to poor countries even if can’t pay back 3.28 479 3.40 1829 -0.12
Agree we sd. give aid to poor countries 0.46 546 0.48 2110 -0.015Give for. aid even if country not anti-communist 2.74 247 2.85 954 -0.10
Agree give for. aid even if country... 0.28 327 0.30 1279 -0.020Best way to deal with commun. countries is get tough 4.04 255 4.15 1078 -0.11
Agree best way is to get tough 0.58 326 0.65 1278 -0.067∗∗
—Civil rightsGov’t sd enforce fair jobs/housing for Negroes 3.33 477 3.86 1832 -0.53∗∗∗
Agree that gov’t schould enforce fair... 0.51 546 0.62 2111 -0.11∗∗∗
Fed gov’t sd. get involved in sch. integration 2.15 305 2.99 1118 -0.84∗∗∗
Agree that fed gov’t sd get involved... 0.25 325 0.41 1277 -0.15∗∗∗
Notes: All questions taken from the 1956 and 1960 ANES. If the ideological orientation of thequestion is obvious, we reorient the question if needed so that answers are increasing in the liberalposition. The wording we use to label each question has been lightly edited to limit totalcharacters while retaining the meaning of the question. Each question is presented in two ways:first, as continuous agreement with the statement from one to five (“don’t know” is dropped) andsecond, as a binary variable indicating agreement or strong agreement (“don’t know” is included).Sample sizes vary because while all questions appear in 1956, but only some are repeated in 1960.∗p < 0.1,∗∗ p < 0.05,∗∗∗ p < 0.01
58

Appendix Table A.8: Do racially conservative views differentially predict policy preferences in the South v. elsewhere?
Expl. var: No fair jobs/housing Expl. var: No school integration
Dependent variable South x Continuous South x Binary South x Continuous South x Binary
Govt should guarantee jobs 0.0753 -0.0262 0.0685 0.116Agree that govt sd. guarantee jobs 0.0189 0.0101 0.0234 0.0662
Govt sd *not* cut taxes if causes cuts elsewhere -0.0379 -0.0958 -0.00592 0.0514Agree govt sd. *not* cut taxes... -0.0537∗∗ -0.114∗ 0.00279 0.0557
Govt sd help ppl get medical care at low cost 0.00266 -0.0262 0.0600 0.184Agree govt sd help with medical care -0.0208 -0.0315 0.0181 0.0882
Govt sd limit pol. influ. of big business 0.129∗ 0.195 0.0247 0.207Agree govt sd. limit infl. of business 0.0244 0.0244 0.0286 0.138∗∗
Govt sd. *not* limit pol. influ. of unions -0.117 -0.224 0.00293 0.146Agree govt sd. *not* limit infl. of unions -0.0260 -0.0348 0.0134 0.108∗
Govt sd *not* leave utilities, housing to priv. biz. 0.0325 0.0320 0.0348 0.168Agree that govt sd *not* leave...to priv biz. 0.00435 0.0192 0.0235 0.0970
Fed govt sd help finance local school construction 0.000666 -0.0123 0.110∗∗ 0.357∗
Agree fed govt sd help finance schools -0.00669 -0.00954 0.0257 0.104Govt cannot fire suspected communists -0.0906 -0.223 -0.0235 -0.136
Agree govt cannot fire susp. communists -0.0325 -0.0666 -0.00135 0.0246Keep soldiers abroad to help countries fight comm. -0.0538 -0.0308 0.0308 0.0420
Agree we sd keep soldiears abroad... -0.0263∗ -0.00972 -0.000784 -0.00747Sd give aid to poor countries even if cant pay back -0.00693 -0.00640 0.00800 -0.0227
Agree we sd give aid to poor countries... -0.00278 0.0187 0.0232 0.109Give for. aid even if country not anti-communist -0.0557 -0.264 0.0716 0.185
Agree give for. aid even if country... -0.0131 -0.0488 0.0386∗∗ 0.142∗∗
Best to get tough with commun. countries 0.135∗∗ 0.189 0.0668 0.238Agree best to get tough... 0.0488∗∗ 0.135∗∗ 0.0345∗ 0.130∗
Notes: We estimate 96 regressions of the form yis = β1Souths ×Xi + β2Xi + ηs + eis, where y is the policy preference listed in each row,X is the racial attitude question listed in the columns, South is a dummy for residence in the South, and ηs are state fixed effects. Eachentry in the table is the estimate for β1. “No fair jobs/housing” is short-hand for being against the idea that the government shouldenforce fair treatment for negroes in jobs and housing, and is measured both continuously and as a binary (agree/disagree) variable.“No school integration” is short-hand for agreeing that the federal government should stay out of the question of whether white andcolored children attend the same schools. Average N for the 96 regressions is 1459 (min. N is 1175, max. N is 1601).∗p < 0.1,∗∗ p < 0.05,∗∗∗ p < 0.01
59

Appendix Table A.9: Did richer and non-rural whites drive Southern dealignment?
Dept. variable: Respondent identifies as a Democrat
(1) (2) (3) (4) (5) (6) (7) (8)
Rich x South x Aft -0.0187 -0.0968[0.0478] [0.0709]
Rich x South x Year -0.00123 -0.00496[0.00217] [0.00351]
Nonrural x South x Aft 0.0299 -0.104[0.0805] [0.0746]
Nonrural x South x Year 0.00213 -0.00273[0.00403] [0.00397]
South x After -0.138∗∗∗ -0.106 -0.157∗∗∗ -0.110∗
[0.0496] [0.0648] [0.0535] [0.0623]
South x Year -0.923∗∗∗ -0.694∗∗ -1.022∗∗∗ -0.730∗∗
[0.196] [0.276] [0.241] [0.283]
Mean, dept. var. 0.416 0.442 0.416 0.442 0.413 0.439 0.413 0.439Restricted? No Yes No Yes No Yes No YesObservations 19543 13523 19543 13523 20594 14180 20594 14180
Notes: Data are from 1952-1980 cumulative ANES. State and year FE and all lower-order termsof any triple interactions are included in all regressions. “Rich” is defined as self-reported incomein the top third of the U.S. household income distribution (this variable provided by ANES).“Nonrural” defined as living in a city or suburb. The “Restricted” sample excludes those youngerthan 21 years in 1963 and current Southern residents who were not born in the South. (Thesespecifications, therefore, exclude those with missing values for place of birth).∗p < 0.1,∗∗ p < 0.05,∗∗∗ p < 0.01
60

Appendix Table A.10: Whites’ support of Truman over other potential candidates in 1948election as a function of NYT articles containing his name and Civil Rights terms
(1) (2) (3)
Civil Rights -0.0528[0.0572]
South x Share -0.125∗∗
of Civil Rights [0.0631]Civil Rights -0.0592Terms [0.0452]South x Share -0.130∗∗∗
of Civil Rights Terms [0.0502]Negro -0.136∗∗∗
[0.0388]South x Share -0.246∗∗
of Negro [0.0987]
Observations 15251 15251 15251Mean 0.406 0.406 0.406
Notes: State FE are included in all regressions. The “Civil Rights,” “Civil Rights Terms” and“Negro” variables are generated in an identical manner to those in Table 4 except that weincluding the word “lynching” among our “Civil Rights Terms” search. Clustering of SEs bysurvey date in brackets. We bootstrap the standard errors to the small number of clusters (five).Given the limited number of survey dates, we cannot simultaneously control for a large number ofplacebo issues as we can for the Kennedy and Eisenhower analysis. Instead, for each specificationabove, we control one-by-one for 13 difference placebo issues (e.g., labor issues, China, Korea,Agriculture) in separate regressions (in all 3 × 13 regressions, standard errors are clustered bysurvey date and bootstrapped). For the “Civil Rights” search, the coefficient on the interactionwith South ranges from -0.147 to -0.0758 over these 13 regressions. It remains significant in six of13 regressions. For the “Civil Rights terms” regressions, coefficients range of -0.168 and -0.0754,with six of 13 estimates remaining significant. For the “Negro” regressions, coefficients range from-0.285 and -0.152 and remain significant in six of 13 regressions. ∗p < 0.1,∗∗ p < 0.05,∗∗∗ p < 0.01
61

Appendix Table A.11: Do conservative racial views predict defection from Democratic party (Southern whites, 1952 ANES)?
Explanatory vars.: Preferred gov’t role in employment discrimination
Wants anti-Negro Anti-Negro laws or Anti-Negro laws orDep’t var. (N , mean) Sample restrictions employment laws no gov’t role no Fed. gov’t role
(1) (2) (3) (4) (5) (6)
Switched from Democrats None 0.0827∗ 0.0854∗ 0.0572∗∗ 0.0572∗∗ 0.0473∗ 0.0422(N=403, µ= .0471) [0.0433] [0.0470] [0.0252] [0.0282] [0.0252] [0.0277]
(µ=0.0814) (µ=0.0814) (µ=0.371) (µ=0.371) (µ=0.590) (µ=0.590)
Switched from Democrats Ex. never-Dems 0.0942∗ 0.0979∗ 0.0727∗∗ 0.0734∗∗ 0.0571∗ 0.0607∗
(N=298, µ= .0637) [0.0538] [0.0590] [0.0313] [0.0357] [0.0312] [0.0347](µ=0.0813) (µ=0.0813) (µ=0.354) (µ=0.354) (µ=0.585) (µ=0.585)
Republican or independent Parents were Dems 0.0488 0.0610 0.136∗∗∗ 0.112∗∗ 0.0986∗ 0.103∗
(N=403, µ= .3076) [0.0910] [0.0932] [0.0525] [0.0556] [0.0528] [0.0544](µ=0.0814) (µ=0.0814) (µ=0.371) (µ=0.371) (µ=0.590) (µ=0.590)
Will vote for Eisenhower Current Dem -0.251 -0.224 -0.0412 -0.0850 0.0126 -0.0140(N=188, µ= .3085) [0.165] [0.187] [0.0779] [0.0891] [0.0780] [0.0886]
(µ=0.0520) (µ=0.0520) (µ=0.341) (µ=0.341) (µ=0.601) (µ=0.601)
Controls? No Yes No Yes No Yes
Notes: Each entry represents the results from a separate regression of the form Defectionis = βRacial viewsi + ηs + γXi + eis, whereDefection takes the various forms of leaving or voting against the Democratic party (listed in the row titles), Racial views (listed incolumn titles) are various views on government’s proper role in addressing anti-Negro employment discrimination, ηs are state fixedeffects, and X are controls (which we vary to probe robustness). For each regression we report the estimate and standard error of β andthe mean µ of Racial views. The explanatory variable for cols. (1) and (2) is coded as one iff the respondent favors government actionto enforce anti-Negro employment discrimination; the dependent var. for cols. (3) and (4) is the same except “government (federal orstate) should stay out entirely” is also coded as one; the dependent var. for cols. (5) and (6) is the same as (3) and (4) except “nationalgov’t should stay out; state gov’t can take action” is also coded as one. Even-numbered cols. include fixed effects for gender as well aseach education, urbanicity, income and age category used in the ANES. We code missing observations for these controls as a separatecategory, so the samples within each pair of columns (and in fact across an entire row) are identical. ∗p < 0.1,∗∗ p < 0.05,∗∗∗ p < 0.01
62

Appendix Table A.12: Do conservative racial views predict defection from Democratic party (non-Southern whites, 1952 ANES)?
Explanatory vars.: Preferred gov’t role in employment discrimination
Wants anti-Negro Anti-Negro laws or Anti-Negro laws orDep’t var. (N , mean) Sample restrictions employment laws no gov’t role no Fed. gov’t role
(1) (2) (3) (4) (5) (6)
Switched from Democrats None -0.0139 -0.000491 0.00864 -0.00384 0.0220 0.00134(N=1364, µ= .1422) [0.0444] [0.0453] [0.0231] [0.0235] [0.0204] [0.0210]
(µ=0.0523) (µ=0.0523) (µ=0.247) (µ=0.247) (µ=0.403) (µ=0.403)
Switched from Democrats Ex. never-Dems 0.00897 0.0624 0.0313 0.0000418 0.0760∗∗ 0.0549(N=745, µ= .2604) [0.0809] [0.0807] [0.0406] [0.0406] [0.0356] [0.0357]
(µ=0.0462) (µ=0.0462) (µ=0.234) (µ=0.234) (µ=0.367) (µ=0.367)
Republican or independent Parents were Dems 0.0438 0.0561 0.0397 0.0201 0.0944∗∗∗ 0.0692∗∗
(N=1364, µ= .5960) [0.0614] [0.0606] [0.0320] [0.0314] [0.0281] [0.0280](µ=0.0523) (µ=0.0523) (µ=0.247) (µ=0.247) (µ=0.403) (µ=0.403)
Will vote for Eisenhower Current Dem 0.0293 0.0864 -0.0540 -0.0720 0.0425 0.0286(N=470, µ= .1638) [0.0882] [0.0921] [0.0443] [0.0475] [0.0393] [0.0419]
(µ=0.0460) (µ=0.0460) (µ=0.225) (µ=0.225) (µ=0.338) (µ=0.338)
Controls? No Yes No Yes No Yes
Notes: Each entry represents the results from a separate regression of the form Defectionis = βRacial viewsi + ηs + γXi + eis, whereDefection takes the various forms of leaving or voting against the Democratic party (listed in the row titles), Racial views (listed incolumn titles) are various views on government’s proper role in addressing anti-Negro employment discrimination, ηs are state fixedeffects, and X are controls (which we vary to probe robustness). For each regression we report the estimate and standard error of β andthe mean µ of Racial views. The explanatory variable for cols. (1) and (2) is coded as one iff the respondent favors government actionto enforce anti-Negro employment discrimination; the dependent var. for cols. (3) and (4) is the same except “government (federal orstate) should stay out entirely” is also coded as one; the dependent var. for cols. (5) and (6) is the same as (3) and (4) except “nationalgov’t should stay out; state gov’t can take action” is also coded as one. Even-numbered cols. include fixed effects for gender as well aseach education, urbanicity, income and age category used in the ANES. We code missing observations for these controls as a separatecategory, so the samples within each pair of columns (and in fact across an entire row) are identical. ∗p < 0.1,∗∗ p < 0.05,∗∗∗ p < 0.01
63

Appendix Table A.13: Does income predict defection from Democratic party in early 1950s (1952 ANES)?
South Non-South
Dep’t variable Sample restrictions Top half inc. dist. Income (categorial) Top half inc. dist. Income (categorial)
(1) (2) (3) (4)
Switched from Dem None 0.0249 0.00961∗ 0.0342∗ 0.00717[0.0259] [0.00564] [0.0206] [0.00500]
Switched Ex. never-Dems 0.0315 0.0112 0.0665∗ 0.00869[0.0318] [0.00711] [0.0350] [0.00897]
Republican or Independent Parents were Dems 0.0275 -0.00215 0.0515∗ -0.00126[0.0550] [0.0120] [0.0285] [0.00692]
Will vote for Ike Current Dem 0.123 0.0335∗ 0.000286 0.00799[0.0762] [0.0182] [0.0378] [0.0103]
Controls? No No No No
Notes: Each entry represents the results from a separate regression of the form Defectionis = βIncomei+ηs+γXi+eis, where Defectiontakes the various forms of leaving or voting against the Democratic party (listed in the row titles), Income is parameterized in two ways(listed in column titles). We use either a linear measure taking the midpoints of the nine categories used in the 1952 ANES (and 0.75 and1.25 times the lowest and highest category) or a binary variable for being in the top half of the distribution. ∗p < 0.1,∗∗ p < 0.05,∗∗∗ p < 0.01
64

Appendix Table A.14: White approval of Eisenhower as a function of Civil Rights coverage
Search terms employed: “President Eisenhower” and...
“Civil rights” Civil rights terms “Negro”
(1) (2) (3) (4) (5) (6)
Article count -0.0168 -0.0187∗∗∗ -0.0145[0.0128] [0.00667] [0.0129]
South x Article -0.0225 -0.0378∗∗∗ -0.0282∗∗ -0.0293∗∗∗ -0.0586∗∗ -0.0525∗∗∗
count [0.0142] [0.0140] [0.0113] [0.00774] [0.0233] [0.0148]
South x 0.0172∗∗∗ 0.0167∗∗∗ 0.0132∗∗∗
Placebo: Foreign Policy, War [0.00568] [0.00481] [0.00449]
South x 0.0520 0.0419 0.0321Placebo: Crime, Drugs [0.0376] [0.0308] [0.0325]
South x -0.0316∗∗∗ -0.0277∗∗∗ -0.0224∗∗∗
Placebo: USSR [0.00865] [0.00719] [0.00578]
South x -0.00397 -0.00971 -0.00743Placebo: Cuba, Castro [0.00730] [0.00766] [0.00574]
South x -0.00869 -0.00483 -0.00460Placebo: Communism, Socialism [0.00934] [0.00782] [0.00679]
South x 0.00134 -0.00370 -0.00719Placebo: Taxes, Budget [0.00701] [0.00760] [0.00634]
South x -0.00289 0.00292 -0.00772Placebo: Employment [0.00980] [0.0102] [0.00981]
South x 0.00682 0.00235 0.00650Placebo: Social Security [0.0136] [0.0125] [0.0118]
South x 0.000297 0.00302 0.00153Placebo: Agriculture [0.0104] [0.00982] [0.00897]
South x 0.0111 0.00768 0.0180∗∗
Placebo: Korea [0.00940] [0.00833] [0.00777]
South x 0.0810∗ 0.0698∗ 0.0848∗∗
Placebo: Highways [0.0432] [0.0373] [0.0336]
Dept. var. mean 0.651 0.651 0.651 0.651 0.651 0.651Survey date FE? No Yes No Yes No YesObservations 83963 83963 83963 83963 83963 83963
Notes: Data taken from all useable Gallup surveys that contain presidential approval data duringEisenhower administration (Jan 1953-Jan 1961). State fixed effects included in all regressions. The“Civil Rights” variable is the number of NYT articles containing “President Eisenhower” and“civil rights” anywhere in the article. “Civil Rights Terms” is identical except articles containing“President Eisenhower” and any of a list of Civil Rights terms (“civil rights,” “integration, “seg-regated,” etc) are counted. “Negro” is the number of articles containing “President Eisenhower”and “negro.” We average this daily count over the seven day period whose midpoint includes themidpoint of the time (typically six days) the survey is in the field. Standard errors clustered bysurvey date. ∗p < 0.1,∗∗ p < 0.05,∗∗∗ p < 0.01
65

Appendix B. ANES analysis
This section is not necessary in understanding any of the analysis in the main text. Forcompleteness and for readers interested in using the ANES to further research this topic,we detail the questions that the ANES includes on racial equality during the Civil Rightsera and explore how viable they are to use in an analysis similar to that in the main textof the paper (i.e., Figure 5 and Table 2). We conclude they are not suitable for this type ofanalysis.
B.1 Questions on school integration
As noted earlier, the ANES cumulative file includes questions from its individual year files ifthose questions are deemed reasonably comparable and were repeated with sufficient frequency.The only question related to civil rights that spans our pre- and post-periods that theANES deems comparable over time asks whether the federal government should ensure schoolintegration. It covers only a single pre-period year (1962) and is then asked most years from1964 through 2000. The online appendix gives the exact wording of the question each yearit is asked (ignore 1956–1960 for the moment). Even though the ANES deems the questioncomparable from 1962 onward, non-trivial differences arise year to year. For example, in 1962supporting integration but “not by force” is an option (and coded as support), whereas in1964 that option is not offered. In 1964, the justification of it not being the “government’sbusiness” is introduced, but this wording is not included in 1962.
These caveats aside, in Appendix Table B.1 we replicate our main analysis, using oppo-sition to school integration in the same manner we used refusal to vote for a black president(those who answer “don’t know” or “unsure” are coded as being against integration). Again,we use only data from the ANES cumulative file. Col. (1) shows that the decline in Southernwhite support for the Democrats relative to other whites is smaller when we use this veryabbreviated pre-period. As noted in Section 6, Catholics (almost all of whom lived outsidethe South) reacted to JFK’s administration with unprecedented support, whereas nearly halfof white Southerners told Gallup they would never vote for a Catholic. As such, the smallcoefficient on South × After is likely an artifact of our single pre-period year being 1962(the middle of JFK’s administration).
Nonetheless, while the small sample size reduces precision, the sign and magnitude of thetriple interaction term reported in col. (2) supports the Gallup analysis. Relative to 1962,white Southerners against integration are nine percentage points less likely to identify asDemocrats in 1964-1980, compared to their non-Southern counterparts. Whereas the Gallupanalysis showed non-Southern whites with conservative racial views only slightly movingaway from the party, the effect in the ANES is larger and achieves significance. These patternsof coefficients hold when we extend the post-period to 2000 (cols. 3 and 4) or end it in 1970(cols. 5 and 6).
The key drawback to restricting ourselves to the cumulative file is that its one questionon racial attitudes that spans our two periods provides only a single pre-period year. Wethus explore the viability of adding additional data from the individual year files, eventhough ANES did not deem these questions sufficiently comparable. The closest candidate isa question asked in 1956, 1958 and 1960. As detailed in the Online Appendix , the question
66

asks for respondents’ agreement with the statement: “The government in Washington shouldstay out of the question of whether white and colored children go to the same school” andunlike the version in the cumulative file offers respondents five possible answers based on thestrength of their opinion.
Given evidence that question wording significantly affects survey answers (see, e.g.,Gaines et al., 2007) flipping the default between 1960 and 1962 is certainly not ideal (agree-ment with the pre-1962 statement would generally signal opposition to integration, whereasagreement with the 1962 and later versions would signal support of integration). Moreover,especially in 1956, it is not clear whether the government in Washington “staying out” of thequestion would signal opposition or support of school integration. In reaction to Brown, U.S.Senators and Representatives from the South drafted the Southern Manifesto in March of1956, calling on all possible legal action to circumvent Brown.53 It is thus quite possible thatSoutherners especially could interpret Washington “staying out” as in fact allowing Brownto progress.
These caveats notwithstanding, we attempt to combine these additional years, coding anydegree of agreement that the government should “stay out” as opposition to integration. Ap-pendix Figure B.1 (a) plots the share of whites against school integration by year and region.Overall, those outside the South are uniformly more in support of integration throughoutthe sample period. In 1956, the difference between regions is unusually small, consistent,perhaps, with our concern that some Southerners assume federal intervention might be onthe side of school segregation. There is a very large decline in support for segregation amongnon-Southerners in 1962, perhaps due to the change in the way the question is asked byANES.
Cols. (7) through (12) of Appendix Table B.1 replicate the analysis in the first sixcolumns, but include the three additional pre-period years from the individual year datafiles. Adding these additional years adds power as well as makes the South × After co-efficient larger in magnitude. Essentially, the results look very similar to the main Gallupanalysis.
However, examining coefficients year-by-year paints a noisier picture (Appendix FigureB.2). Perhaps because of the Southern Manifesto, 1956 appears to be an extreme outlier,where white Southerners who wanted the government to involve themselves in school integra-tion were also staunchly Democratic. Nor do we see a sharp drop in the Southern coefficientestimate between 1962 and 1964. Overall, however, we continue to see that in the pre-period,opposition to integration positively predicts Democratic identification in the South relativeto elsewhere, and that this difference for the most part disappears in the post-period.
Given that the ANES cautions against longitudinal analysis with variables they do notinclude in the cumulative file, we show these results mostly for the sake of completenessand emphasize that we prefer the Gallup given the serious issues of question consistencyhighlighted above.
53Richard Russell (D-GA) was its main author.
67

B.2 Questions on jobs and housing
The ANES cumulative file contains two questions on fair treatment of blacks in the areas ofemployment and housing (pre 1964) and employment alone (1964 and beyond), and thus inisolation we cannot use them to replicate the Gallup analysis. As the Online Appendix doc-uments, besides the inconsistent inclusion of housing, there are other non-trivial differencesbetween these two series, likely the reason why ANES does not combine them into a singlequestion in the cumulative file. First, whereas before 1964 it is left unclear as to which level(federal, state or local) “the government” refers, the “the federal government” is specifiedin 1964 and later. Second, as with the school integration question, more flexibility on thedegree of one’s agreement or disagreement are offered in the earlier years. Third, though nota fault of the question, the way that one answers is likely very different before and after theCivil Rights Bill of 1964, which in principle would have addressed many of these issues.
A final issue with this question unrelated to its consistency across time is that “fairtreatment” is vague. If one believes that blacks are innately inferior or that the races shouldnot mix, then limiting blacks to low-status jobs and segregated housing could be viewed as“fair.” Indeed, in 1958, the ANES specifically asks respondents to explain their views aboutschool integration. Among those whose views were classified by ANES as “anti-Negro,” stillonly 32% percent disagreed that government should ensure “fair treatment” for blacks inthe area of jobs and housing.54 This cross-tabulation suggests the notion of fairness in thejobs/housing question may be so vague as to be meaningless.
Indeed, Appendix Figure B.1 (b) is consistent with many of these concerns. First, regionaldifferences on this question are very small relative to those for school integration. A sizablemajority of Southerners agree that the government should guarantee “fair” treatment injobs and housing, suggesting the notion is vague enough for most people to support. Unlikethe black president question, whites in both regions become less supportive of the idea oftime, perhaps because of a presumption CRA64 took care of the problem or because theunderstanding of “fair treatment” became broader over time. In any case, whether it is theaddition of “federal government” to the wording of the question, the change in the number ofoptions given as potential answers, or the passage of the CRA that summer, the new versionof the question beginning in 1964 elicits significantly less support among whites than did theolder question.
Despite these serious reservations and ANES classifying them as incomparable ques-tions, for the sake of completeness we replicate our standard analysis by combining thesetwo jobs/housing questions in Appendix Table B.2. Not surprising given that the questionchanges just at the point when our post-period begins, we do not find that including ourtriple interaction decreases the coefficient on South×After nor is the triple interaction termitself significant.
54Authors’ calculation from 1958 ANES individual year file.
68

Appendix Figure B.1: Evolution of whites’ racial attitudes (ANES)
(a) Share against the gov’t enforcing schoolintegration
0.2
.4.6
Diff
eren
ce
.2.4
.6.8
1Sh
are
of R
espo
nden
ts
1955 1960 1965 1970 1975 1980 1985Year of Study
Non-southSouthDifference (South - Non-south)
(b) Share against the government ensuringblacks fair treatment in jobs/housing
.1.1
5.2
.25
Diff
eren
ce
.2.4
.6.8
Shar
e of
Res
pond
ents
1955 1960 1965 1970 1975 1980 1985Year of Study
Non-southSouthDifference (South - Non-south)
Notes: For subfigure (a), data come from individual year files of the ANES for 1956, 1958 and1960 and the cumulative file for all late years. For subfigure (b), data from before 1964 come fromthe ANES cumulative file variable V CF0818 and from 1964 and later from the variableV CF9037. See Appendix Tables C.1(a) and C.1(b) for exact wording each year.
Appendix Figure B.2: Coefficient from regressing Dem on Against school integration byregion and year (whites in ANES)
Notes: Data come from ANES (cumulative file for 1964 and later, individual year files for 1956,1958 and 1960). Dem is a binary variable for identifying as a member of the Democratic party(all other responses coded as zero).
69

Appendix Table B.1: Regressing Democratic identification on views on school integration, by time and region
Cumulative File Only Cumulative File + Indiv. Year Files
(1) (2) (3) (4) (5) (6) (7) (8) (9) (10) (11) (12)
South x Aft -0.0143 0.0788 -0.0566 0.0430 0.0113 0.0938 -0.105∗∗ -0.00696 -0.142∗∗ -0.0420 -0.0704 0.00650[0.0495] [0.0824] [0.0554] [0.0810] [0.0618] [0.0578] [0.0502] [0.0524] [0.0575] [0.0676] [0.0575] [0.0665]
No school integ 0.0289 0.0288 0.0316 -0.00348 -0.00430 -0.00348[0.0280] [0.0281] [0.0281] [0.0140] [0.0140] [0.0135]
South x No 0.108 0.112 0.105 0.135∗∗∗ 0.132∗∗∗ 0.131∗∗∗
school integ [0.0943] [0.0990] [0.0971] [0.0419] [0.0425] [0.0424]
No school integ -0.0654∗ -0.0914∗∗∗ -0.0779∗ -0.0330 -0.0579∗∗∗ -0.0444∗
x Aft [0.0358] [0.0335] [0.0421] [0.0203] [0.0174] [0.0248]
South x No -0.0896 -0.0952 -0.0693 -0.114∗∗∗ -0.115∗∗∗ -0.0805∗
school integ x Aft [0.118] [0.109] [0.101] [0.0358] [0.0350] [0.0472]
Observations 11396 11396 17190 17190 5583 5583 15255 15255 21049 21049 9442 9442Max Year 1980 1980 2000 2000 1970 1970 1980 1980 2000 2000 1970 1970Mean 0.404 0.404 0.374 0.374 0.449 0.449 0.422 0.422 0.394 0.394 0.457 0.457
Notes: Year and State FE are included in all columns. “After” is 1963 and later (so, in ANES, first post-period year is 1964).∗p < 0.1,∗∗ p < 0.05,∗∗∗ p < 0.01
70
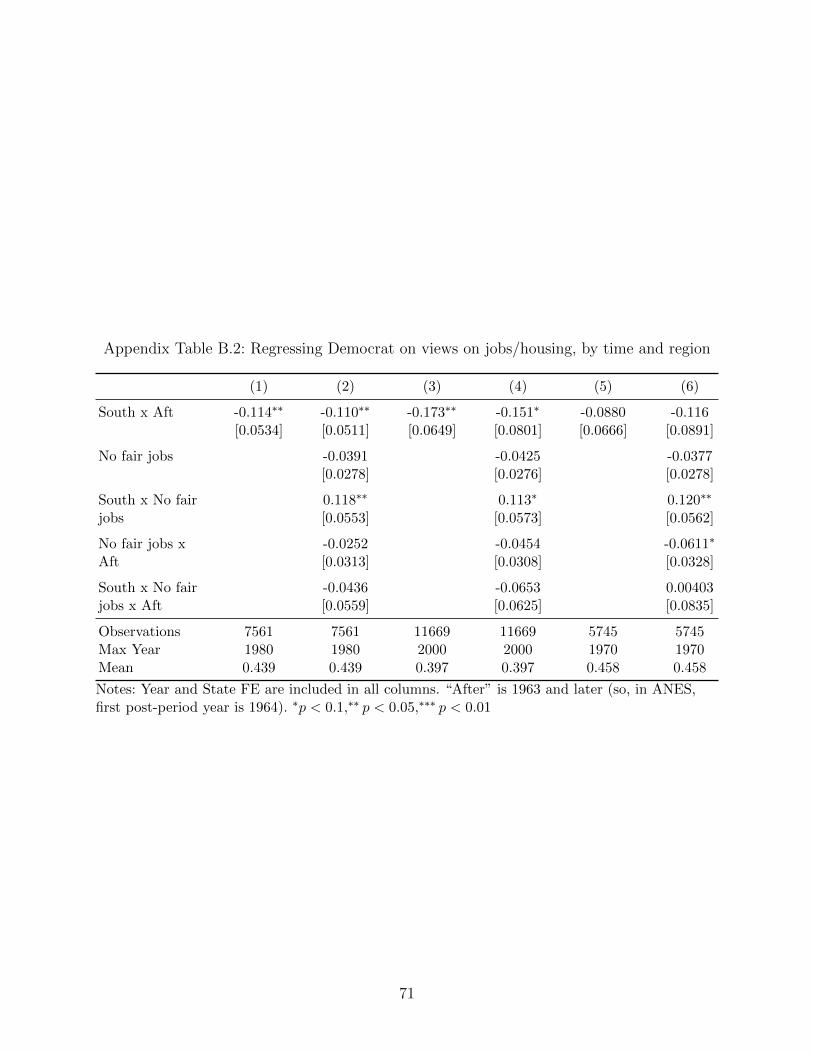
Appendix Table B.2: Regressing Democrat on views on jobs/housing, by time and region
(1) (2) (3) (4) (5) (6)
South x Aft -0.114∗∗ -0.110∗∗ -0.173∗∗ -0.151∗ -0.0880 -0.116[0.0534] [0.0511] [0.0649] [0.0801] [0.0666] [0.0891]
No fair jobs -0.0391 -0.0425 -0.0377[0.0278] [0.0276] [0.0278]
South x No fair 0.118∗∗ 0.113∗ 0.120∗∗
jobs [0.0553] [0.0573] [0.0562]
No fair jobs x -0.0252 -0.0454 -0.0611∗
Aft [0.0313] [0.0308] [0.0328]
South x No fair -0.0436 -0.0653 0.00403jobs x Aft [0.0559] [0.0625] [0.0835]
Observations 7561 7561 11669 11669 5745 5745Max Year 1980 1980 2000 2000 1970 1970Mean 0.439 0.439 0.397 0.397 0.458 0.458
Notes: Year and State FE are included in all columns. “After” is 1963 and later (so, in ANES,first post-period year is 1964). ∗p < 0.1,∗∗ p < 0.05,∗∗∗ p < 0.01
71

Appendix C. Details on media searches
C.1 NYT searches
The full code (in R) used to generate the article counts is available upon request. Table C.1provides the exact search terms used for each of the Civil Rights searches as well as thesearches for “placebo issues.” Searches were performed for each date of Kennedy’s adminis-tration.
C.2 Research assistant article coding
Each RA received a spreadsheet that included the title of the article and its link (whichthey read via the NYT TimesMachine option). Both RAs were unaware of our hypothesisof a Spring 1963 turning point in Kennedy’s position on Civil Rights. The instructions weregiven via email as follows (note that, sadly, typos indeed appear in the original):
Please skim each article. We are interested in your assessment of the article afterreading the headline, first few paragraphs, and skimming the rest.
Please categorize each article into one of the following four categories:
1. False hit (main subject of article is NOT civil rights).
2. Pro civil-rights (article suggests that Kennedy administration or Democratsmore generally are pushing toward greater racial equality, that Southernersare unhappy about JFK/Dem stance on this issue, that Southerners worrythat JFK/Dems are about to push forward on this issue, etc.)
3. Anti civil-rights (article suggests that Kennedy administration or Democratsare holding the status quo on the issue of racial equality, that Southernersare NOT worried or are even pleased about JFK/Dems on this issue relativeto Republicans, etc. )
4. Mixed (article suggests that JFK/Dem efforts on issue of racial equality aremixed or unclear)
Note that there many articles will probably offer at east some “on the onehand....on the other” analysis, but when possible try to decide if it is generalmore “pro” or “anti” (though certainly if you feel it is truly mixed, you shouldcategorize it as such).
Excel instructions:
1. For “false hit” enter “F”
2. For “pro civil rights” enter “P”
3. For “anti civil rights” enter “A”
4. For “mixed” enter “M”
Thank you!
72

A basic summary of the RAs’ coding outcomes is presented in Table C.2.After their task was complete, we asked the RAs for feedback on how they went about
their task. Our biggest ex-post regret is that we did not make clearer that articles not literallyabout Civil Rights but that nonetheless would have made racially conservative Southernersworried about Kennedy’s loyalty should have been coded as “pro” Civil Rights and insteadwere coded as false hits (not about Civil Rights). For example, RA1 wrote: “I was moderatelyliteral in interpreting the instructions—in the case of a black artist visiting [the White House]I probably would have marked that as false [hit] unless the article said something like ‘thisis a step forward re: civil rights.’ ” As such, it is not surprising that Southern whites reactnegatively to articles that our RAs coded as false hits (Appendix Table C.3).
Appendix Table C.1: Details on NYT article searches
Category Search terms
“Civil Rights” (narrow) “Civil Rights”
Civil Rights terms (broad) “civil rights,” “segregation,” “segregate,” “segregated,”“integration,” “integrate,” “integrated”
Negro “Negro”
Foreign Policy, War “war”,“peace”,“atomic”,“security”,“defense”,“foreign policy”,“international relations”,“international tensions”
Crime, Drugs “crime”,“juvenile delinquency”,“narcotics”
USSR “russia”,“soviet”,“soviets”,“russian”,“ussr”
Cuba, Castro “cuban”,“cuba”,“castro”
Communism, Socialism “communism”,“socialism”,“communist”,“socialist”
Taxes, Budget “tax”,“taxes”,“budget
Employment “Employment”,“recession”,“unemployment”,“cost of living”,“wages”,“inflation”
Social Security “Social security”,“social services”,“welfare”,“old age”
Agriculture “farm”,“agriculture”,“agricultural”
For each search, “President” and “Kennedy” was also appended. Full code available upon request.Searches are not case-sensitive.
73

Appendix Table C.2: Statistics from RA hand-coding of NYT article content
Daily Average (RA1) Daily Average (RA2) Total
Anti 0.0821 0.218 0.150False positive 1.121 1.238 1.179Mixed 0.165 0.105 0.135Pro 0.786 0.593 0.690
Notes: Results from RA hand-coding of 2,290 articles over the 1,036 days of the Kennedyadministration (roughly 2.15 per day).
Appendix Table C.3: Predicting approval of JFK using RA’s article codes
RA1 RA2
(1) (2) (3) (4) (5)
Anti -0.103 -0.103 0.0316 0.0626 -0.0333[0.0797] [0.0811] [0.0487] [0.0538] [0.0699]
False Positive -0.0358∗ -0.0708∗∗∗ -0.0369∗∗ -0.0435∗∗∗ -0.0734∗∗∗
[0.0200] [0.00945] [0.0144] [0.0133] [0.0171]
Mixed 0.0426 0.0823 -0.00777 -0.0546 0.000518[0.0608] [0.0506] [0.0379] [0.0595] [0.0520]
Pro -0.00988 -0.00782 -0.00734 -0.00610 0.00800[0.00761] [0.00674] [0.00985] [0.0123] [0.0203]
South × 0.0519 0.0288 0.147∗∗ 0.165∗∗ 0.0182Anti [0.109] [0.0959] [0.0633] [0.0753] [0.123]
South × -0.0480∗∗ -0.0901∗∗∗ -0.0687∗∗∗ -0.0726∗∗∗ -0.0681∗∗
False Positive [0.0198] [0.0219] [0.0166] [0.0133] [0.0325]
South × 0.138∗ 0.250∗∗∗ 0.0894 0.110 -0.107Mixed [0.0730] [0.0669] [0.0711] [0.0732] [0.131]
South × -0.0836∗∗∗ -0.100∗∗∗ -0.109∗∗∗ -0.150∗∗∗ -0.0766∗∗
Pro [0.00693] [0.00635] [0.0127] [0.0137] [0.0347]
Observations 81365 81365 81365 81365 81365Search Civil Rights Terms Civil Rights Civil Rights Terms Civil Rights NegroMean 0.673 0.673 0.673 0.673 0.673
Notes: Each RA classified an article as: suggesting that Kennedy was against Civil Rights(“anti”), unrelated to Civil Rights (“false hit”), suggesting that Kennedy was giving mixedsignals on Civil Rights (“mixed”) or that Kennedy was moving in favor of Civil Rights (“pro”).RA1 had already been informed of the hypothesis by the time that we decided to classify allarticles from the “Negro” search, so only RA2 performed that classification. Regressions use allGallup surveys that contain presidential approval question between January 1961 and November1963. Standard errors clustered by survey date. ∗p < 0.1,∗∗ p < 0.05,∗∗∗ p < 0.01
74