Embed Size (px)
Citation preview

Federal Financial Institutions Examination Council
A User’s Guide for the Uniform Bank Performance Report
December 2008
Board of Governors of the Federal Reserve System, Federal Deposit Insurance Corporation, Office of the Comptroller of the Currency

December 2008 Prepared by: Federal Financial Institutions Examination Council 3501 Fairfax Drive, Room D8073a Arlington, VA 22226
Send comments to: UBPR Coordinator Phone: 703-516-5732 Fax: 703-562-6446 Via regular mail to above address
For questions regarding content of the UBPR products, or UBPR data on DVD please call John Smullen at: Phone: 1-703-516-5732 E-Mail: [email protected]
UBPR User’s Guide • December 2008 ii

Table of Contents
iv Introduction
v Summary of Changes
Section I: Using the Uniform Bank Performance Report for Financial Analysis
Section II: Technical Information
Section III: Defi nitions of UBPR Items
III-1 General III-2 Introductory Page III-3 Summary Ratios—UBPR Page 01 III-7 Income Statement—Revenues and Expenses ($000)—UBPR Page 02 III-10 Noninterest Income and Expenses ($000) and Yields—UBPR Page 03 III-14 Balance Sheet—Assets, Liabilities and Capital ($000)—UBPR Page 04 III-18 Off-Balance Sheet Items and Derivatives Analysis—UBPR Page 05 III-20 Off-Balance Sheet Items and Derivatives Analysis—UBPR Page 05A III-24 Off-Balance Sheet Items and Derivatives Analysis—UBPR Page 05B III-28 Balance Sheet—Percentage Composition of Assets and Liabilities—UBPR Page 06 III-31 Analysis of Credit Allowance and Loan Mix—UBPR Page 07 III-34 Analysis of Loan and Lease Allowance and Loan Mix—UBPR Page 07A III-37 Analysis of Concentrations of Credit—UBPR Page 07B III-40 Analysis of Past Due, Nonaccrual and Restructured Loans and Leases—UBPR Page 08 III-43 Analysis of Past Due, Nonaccrual & Restructured Loans & Leases—UBPR Page 08A III-46 Interest Rate Risk Analysis as a Percent of Assets—UBPR Page 09 III-49 Liquidity and Investment Portfolio—UBPR Page 10 III-53 Capital Analysis—UBPR Page 11 III-56 Capital Analysis—UBPR Page 11A III-61 One Quarter Annualized Income Analysis—UBPR Page 12 III-65 Securitization and Asset Sale Activities—UBPR Page 13 III-69 Securitization and Asset Sale Activities—UBPR Page 13A III-73 Securitization and Asset Sale Activities—UBPR Page 13B III-78 Summary Information for Banks—UBPR Page STAVG III-81 Fiduciary and Related Services—Trust Page 1 III-85 Fiduciary and Related Services—Trust Page 1A
Appendix A: Tax-Equivalency Worksheet
Appendix B: UBPR Data Ordering Information
UBPR User’s Guide • December 2008 iii

Introduction
The Uniform Bank Performance Report (UBPR) is an analytical tool created for bank supervisory, exam- ination, and bank management purposes. In a concise format, it shows the impact of management decisions and economic conditions on a bank's performance and balance-sheet composition. The performance and composition data contained in the report can be used as an aid in evaluating the adequacy of earnings, liquidity, capital, asset and liability management, and growth management. Bankers and examiners alike can use this report to further their understanding of a bank's financial condition and through such understanding perform their duties more effectively.
The UBPR is now available online at no charge at WWW.FFIEC.GOV. A UBPR for any bank in the country may be viewed online, printed or downloaded. The site includes 5 years of history including all intermediate quarters.
A UBPR is produced for each commercial bank in the United States that is supervised by the Board of Governors of the Federal Reserve System,
Federal Deposit Insurance Corporation, or the Office of the Comptroller of the Currency. UBPRs are produced for FDIC insured savings banks also. The report is computer-generated from a data base derived from public and nonpublic sources. It contains several years’ worth of data, which are updated quarterly. Those data are presented in the form of ratios, percentages, and dollar amounts computed mainly from Reports of Condition and Income submitted by the bank. Each UBPR also contains corresponding average data for the bank's peer group and percentile rankings for most ratios. The UBPR therefore permits evaluation of a bank's current condition, trends in its financial performance, and comparisons with the performance of its peer group.
In addition to the individual bank report, the following is also available:
• A Peer Group report, which presents all peer averages.
• A List of Banks in Peer Group, which presents a list of banks within each peer group.
• A State Average Report, which presents ratio, averages within States.
• A Distribution report is also produced using the peer groupings in the state average and peer group average reports. Selected percentile values are displayed for individual ratios to provide additional insight into the range of bank performance that comprises an average.
• UBPR data, which present all types of UBPR information in bulk format on dvd.
This user's guide contains basic guidelines for using the UBPR, including a suggested method of analyzing the report, technical information, and ratio definitions. The UBPR, related statistical reports and the User’s Guide are available online, free of change, at www.ffiec.gov. Questions relating to details in this guide may be addressed to the Coordinator for Uniform Performance Reports, Federal Financial Institutions Examination Council, Arlington, VA. See the Title Page for the complete address.
UBPR User’s Guide • December 2008 iv
Summary of Changes to the 2008 UBPR
This information describes changes included in the June 30, 2008 UBPR.
Delivery of the User's Guide
The User's Guide will continue to be made available to all users through the FFIEC website http://www. ffiec. gov/ubprguide.htm as a series of PDF fi les.
UBPR Available Online
The UBPR will continue to be made available to bankers and the general public at no charge. The UBPR portion of the FFIEC website provides several other analytical tools to support the UBPR including Peer Group Data Report, Peer Distribution Report and a List of Banks by Peer group. Bankers and others may also use the Custom Peer facility to re-compute UBPR peer group statistics based on a custom or user defined group of banks. Please see
http://www.ffiec.gov/UBPR.htm for details.
UBPR Page Layouts
Replaced all UBPR sample pages. See section III for details.
Changes
Several additions were made to the Uniform Bank Performance Report through March 2008. To the extent possible these changes were made retroactively.
Page 7.
Added: Detail on construction loans and loans secured by nonfarm nonresidential properties.
Page 7a.
Added: Detail on construction loans and loans secured by nonfarm residential properties.
Added: Loans Held For Sale and Loans Not Held For Sale to the Balance Sheet Assets and Liabilities and Capital ($000) page.
Page 7b.
Revised: Concentration of credit ratios are computed using total capital from RC-R.
Added: Detail on Construction loans and loans secured by nonfarm nonresidential properties.
Added: Five ratios to the Supplemental section.
Page 8 & 8a.
Added: Current 1–5 Family Restructured Loans, Loans Secured by 1–4 Family Real Estate in Foreclosure, detail on Construction Loan delinquencies, detail on Loans secured by nonfarm residential properties.
UBPR User’s Guide • December 2008 v

Section I: Using the Uniform Bank Performance Report for Financial Analysis
Summary
The Uniform Bank Performance Report is designed to be used by bank examiners and bank management evaluating the fi nancial condition of banks. By analyzing the data contained in the UBPR, the user can obtain an overall picture of the bank’s financial health and can discover conditions that might require further analysis and investigation. The UBPR is not designed to replace on-site examination or investigations but to supplement present examination procedures. It also functions as a common point of fi nancial analysis between regulator and banker and can be useful as a part of a bank’s own internal bank process. The UBPR presents three types of data for use in the financial analysis of a bank: (1) the bank’s data, (2) data for a peer group of banks similar in size and economic environment, and (3) percentile rankings. A thorough understanding of those data groups and their interrelationships and limitations is essential in order to use the UBPR effectively. As a general rule, any analysis should compare the bank to its peer group, consider the bank’s trends over time, and also be aware of trends and changes in peer group averages. This user's guide does not present detailed in-depth instructions on ratio analysis, nor does it assign particular value to individual ratios or groups of ratios. Rather, it simply summarizes one way of using the UBPR for analysis; other approaches may be equally effective. Its primary purpose is to explain the calculations of individual ratios.
Availability
All Uniform Bank Performance Reports and related information are distributed online through the FFIEC website www.ffi ec.gov. First
select Uniform Bank Performance Reports (UBPR) under Quick Links on the FFIEC website. Please review the Schedule for the Online UBPR for information on when the current UBPR will be available.
Uniform Bank Performance Reports —
Select Search for a Uniform Bank Performance Report
To identify a bank enter the FDIC certificate number OR enter the name of one or more of the geographic criteria. For example just entering Los Angeles and California will return a list of all banks in Los Angeles, California.
All Statistical Reports—
Select All Statistical Reports
This section lists all reports available in the online UBPR system. Then choose from the following list of special reports.
Uniform Bank Performance Report—See above.
Bank List Report—This report provides a list of banks by peer group. The list includes core information such as location, assets and net income and it may be resorted by several criteria. An individual bank’s UBPR may be accessed directly from the list by clicking on the certifi cate number.
Peer Group Data Report—This report displays all UBPR ratios averaged by peer group in UBPR format. All peer groups are available.
Peer Group Distribution Report—This report provides a distribution or range of values for all ratios that appear in the UBPR by peer group.
This report can provide valuable insight into the population of banks that are used to calculate peer average data that appears in the UBPR. For example the UBPR calculates a trimmed average ROA for the peer group 9 of 1.18%. Peer group nine is made up of 339 banks with net income to average assets (ROA) that ranges from –2.24% at the fi rst percentile to 5.51% at the 99th percentile. The report displays ratio distribution data in UBPR page format.
State Average Report—Provides summary UBPR ratio data and selected aggregate information averaged by state. A further breakdown of average statistical data is provided by asset size. The information is provided for all states and territories in UBPR format.
State Distribution Report—This report provides a distribution or range of values for all ratios that appear in the state average report. As with the peer group distribution report this report can provide valuable insight into the population of banks used to calculate state average data.
Custom Peer Group Report—This report allows a selected bank to be compared with the composite performance of a user defined peer group of banks. UBPR peer statistics are recomputed based on a user defi ned group of banks and displayed along with individual bank data in UBPR page format. Banks may be identifi ed as peers by either entering FDIC certificate numbers or using the built-in search engine.
Analytical Considerations
Effective use of the UBPR entails consideration of the level and trend of individual ratios and the interrelationship among related ratios. No single ratio, percentile ranking, or trend is indicative of a bank’s condi-
UBPR User’s Guide • December 2008 I-1

tion. Each bank has its own unique operating characteristics that affect both its balance-sheet composition and its income stream. A given bank may be above or below the peer group average for a given ratio, however that information must be considered in combination with other related facts including other UBPR data before its importance can be determined.
For example, if a bank’s net interest income (TE) to average assets (UBPR page 01) is 3.03 percent compared with the peer group average of 3.96 percent, placing it in the 15th percentile, the bank may appear to be having profit-margin difficulties. However, if the bank’s temporary invest ments (UBPR page 10) are 49 percent of average assets compared with the peer-group average of 17 percent and its volatile liabilities are 43 percent of average assets compared with 19 percent for the peer group, it can be concluded that the bank’s assets and liability composition is substantially different from that of its peers. Thus, a lower net interest income (TE) to average assets ratio may be normal and proper, as would be a lower overhead expense to average assets ratio. Dependence on large time deposits and federal-funds purchased in short-term investments normally produces narrower profi t margins and does not require as large a building, staff, or operating budget as engaging more heavily in retail activities.
However, overhead expenses that are not well below the peer group mean for such a bank could be cause for concern, because of the potential effect on earnings. As the above example demonstrates, differences in assets and liability composition must be taken into consideration in order to properly interpret percentile rankings and ratio variations between the bank and its peer group. By employing percentile rankings and peer-group data as general guides or points of reference, rather than as strict bench marks, and by being aware of the interrelationship between the bank’s balance sheet
and its income statement, analysis may focus on those areas of a bank’s operation that merit concern, thus providing a more complete understanding of the entire bank.
Method of Review
The introductory page of the UBPR describes the bank’s current peer group and the name and address of its holding company, if applicable. The primary financial analysis begins on UBPR page 01 with a review of summary ratios.
The Summary Ratios page (Page 01) presents the bank’s average assets and net income in dollars; performance ratios, asset and liability management data, capital ratios, and growth rates. It also shows percentile rankings and peer-group averages. This page provides direction for analysis of the other sections of the report. After the summary ratios section has been analyzed, the bank’s earnings section can be evaluated using a “Decision Tree” analysis approach. Note that the UBPR is organized so that ratios on page one are supported by details on subsequent pages. This approach is an attempt to explore how ratios are interrelated and how one ratio can affect other ratios, thus allowing the analyst to trace the source of a particular performance characteristic to its root cause.
For example, the interplay of rates earned on assets or paid on liabilities and the volume or mix of such assets and liabilities is segregated in the decision tree analysis.
Each component of a ratio and of each succeeding ratio can be determined by referring to Section III, where the method of calculating each ratio is explained. Exhibit I-1 charts the systematic process a user might follow in analyzing a bank’s net income to average assets ratio.
Rather than trace each earning component separately, the analyst may review the earnings page in sequence to analyze the trend and interrela
tionships of these components while tracing their causes. Concurrently, the analyst may identify conditions that may be cause for concern and fi nd corroborative evidence of conditions noted during the review of the summary ratios. This method allows for an orderly progression of thought and helps the analyst develop a perception of the bank as a whole.
This method of page-by-page review may be extended to the other sections of the UBPR. After completing the review of the last page of the report, the user should have a relatively comprehensive overview of the bank’s financial condition and, possibly, a list of causes for concern that warrant further inquiry.
Using Peer Group, State Average and Distribution Reports
The UBPR Peer Group Report and State Average Report present ratio averages for peer groups and States, respectively. These reports are used to analyze conditions and trends in these banking industry groups. The grouped averages do not constitute supervisory targets or ideal values. Rather, they are intended to provide some insight into the performance of similarly sized and situated banks across the country. While individual peer averages may be thought of as representing the composite performance of a group of banks, those values may or may not be an appropriate goal for a given bank. Only a full analysis of all financial data including historical trend analysis and comparison to peer group averages can provide that answer. Additionally, the peer distribution reports, which show several percentiles values for UBPR ratios are designed to show the range of values that compose a given average. As such, they provide additional support to the argument that the averages represent a middle point and that most banks will fall on either side of that average. See Section II for technical considerations regarding averages.
UBPR User’s Guide • December 2008 I-2

Net income (to average assets)
Provision for loan & lease losses (to average assets)
Realized G/L held-to-maturity sec
Realized G/L available-for-sale sec
Net extraordinary items (to average assets)
Noninterest expense (to average assets)
Noninterest income (to average assets)
Net interest income (TE) (to average assets)
Fiduciary activities (income) (if available)
Net from trading fees & comms (if avaliable)
Foreign exchange trading (if available)
Personnel expense (to average assets)
Occupancy expense (to average assets)
Other operating expense (to average assets)
Average assets per employee—$MM
Average personnel expense per equiv employee—$M
Premises, fi xed assets (to average assets)
Average assets per domestic offi ce
Other noninterest income
Deposit service charges
Applicable inc tax (TE) (to average assets)
Interest income (TE) (to average assets)
Interest income (TE) (to avg earning assets)
Total loans & leases (TE) (yield on)
Real estate loans (yield on)
Commercial & industrial loans (yield on)
Loans to individuals (yield on)
Agricultural loans (yield on)
Average earning assets (to average assets)
Investment securities (TE) (yield on)
US Treasury & agency securities (yield on)
Mortgage backed securities (yield on)
All other securities (yield on)
Net loans & leases (to average assets)
Interest-bearing bank balances (to average assets)
Federal funds sold & resold (to average assets)
Trading account assets (to average assets)
I.O. strips and other equity securities (to average assets)
Interest-bearing bank balances (yield on)
Federal funds sold & repos (yield on)
Securities (AFS + HTM) (to average assets)
Interest expense (to average assets)
Interest-bearing funds (to average assets)
Interest-bearing non trans accounts (to average assets)
Interest-bearing tranaction accounts (to average assets)
Federal funds & repos (to average assets)
Foreign offi ce deposits (to average assets)
Other borrowings (to average assets)
Subord rates & debentures (to average assets)
Federal funds purchase & repos (cost of)
Other borrowings (cost of)
Subord notes & debentures (cost of)
All other time deposits (cost of)
Transaction accounts (cost of)
Other savings & deposits (cost of)
Time deps over $100M (cost of)
Total interest-bearing deposits (cost of)
Interest expense (to avg earning assets)
Foreign offi ce deposits (cost of)
Other interest income
UBPR User’s Guide • December 2008 1-3

Section II: Technical Information
Banks Covered
The Uniform Bank Performance Report covers all insured commercial banks and FDIC-Supervised Savings Banks, which may be categorized according to their charter types and primary regulatory agencies:
• National banks, which are regulated by the Office of the Comptroller of the Currency
• State-chartered banks, which are members of the Federal Reserve System, regulated by the Federal Reserve Board
• State-chartered banks, which are not members of the Federal Reserve System, and are regulated by the Federal Deposit Insurance Corporation
• FDIC-Supervised savings banks, which are regulated by the FDIC.
Sources of UBPR Data
The source of all bank fi nancial data in the UBPR is the Report of Condition and Report of Income, (Call Reports), and filed quarterly by each insured bank. These Call Reports differ somewhat between banks in amount of detail, depending on the characteristics of the banks. The following “report type” designations refer to the FFIEC form numbers on different Call Reports:
From March 31, 2001 forward:
• 031 Reporters: all banks with domestic and foreign offi ces
• 041 Reporters: all banks with domestic offi ces
From December 31, 2000 back:
• 031 Reporters: all banks with domestic and foreign offi ces
• 032 Reporters: all banks with
domestic offices only with assets of $300 million or more
• 033 Reporters: all banks with domestic offices only and with assets of $100 million or more but less than $300 million
• 034 Reporters: all banks with domestic offices only and with assets of less than $100 million.
The UBPR also uses various items of bank “structure” data from agency files, to categorize banks or to gather additional information. Such items of information include:
• bank name and address
• number of offi ces
• established date
• whether located in a Metropolitan Statistical Area
• holding company identifi cation
• occurrences of bank mergers.
Format and Content
Each Uniform Bank Performance Report presents pages of bank fi nancial data organized into: (1) summary ratios, (2) income information and (3) balance sheet information. These different formats are illustrated in Appendix A of this user guide. Also, the source items and calculations used for some UBPR items may vary depending on Call Report type, bank class, or other factors. The items and calculations are discussed in Section III.
Primmary Peer Group Criteria
Banks are assigned to one primary peer group to permit average ratios to be calculated. Most banks are assigned to one of the primary insured commercial bank peer groups. In addition several primary
line-of-business peer groups have been established because of the unique operating characteristics of some institutions. Those groups include Savings Bank, Credit Card Specialty, and Bankers Bank peer groups. Peer-group data are included in the UBPR to show the average performance of a group of banks with similar characteristics. This information can be used as a benchmark against which an individual bank’s asset and liability structure and earnings may be measured. Users should note that primary peer group data appears on pages 1, 3, 5, 6, 7, 8, 9, 10, 11, 12, and 13. See section III for definitions of individual ratios.
Insured Commercial Bank Peer Groups
Over 7,800 banks are assigned to one of 15 asset-based primary insured commercial bank peer groups. Peer groups are defined by up to three criteria as described in the table below. Banks are first grouped by asset size using 90-day average assets from call report schedule RC-K. This asset-based grouping applies to all peer groups and is reviewed quarterly. Smaller asset groups are sub-divided by the number of full service branches. The number of full service branches is gathered from the annual Summary of Deposits filed with the FDIC. Those groupings are subdivided again by whether a bank is located in a metropolitan area or not. A metropolitan area is a Metropolitan Statistical Area (MSA) as defined by a federal agency, the Office of Management and Budget (OMB). De Novo, or newly chartered insured commercial banks are compared to other banks that opened in the same year for a period of fi ve years. For example banks that were chartered in the year 2006 will be placed in peer group number 2006
UBPR User’s Guide • December 2008 II-1

and compared to one another for five years. After five years, banks will be placed in one of the asset-based peer groups. The UBPR will include DeNovo peer groups from 2001 forward.
This structure is used to developaverage or composite ratios by peer
,
group. Because similar sized banksoperating under similar conditions are compared, the peer groupratios provide a useful benchmarkof performance. Consistent differences in peer group performance areapparent over time. For example, theaverage non-branch bank in a non-metropolitan area tends to have loweroverhead, lower noninterest incomehigher profitability and highercapital ratios than similar sizedbranch banks located in metropolitanareas.
Insured Commercial Bank Peer Group Descriptions
Peer Group Number Average Assets for Latest Quarter
Number of Banking Offi ces Location
1
23456789
10111213141 5
De Novo
In excess of $3 billion - Between $1 billion and $3 billion - Between $300 million and $1 billion - Between $100 million and $300 million 3 or more Metropolitan area Between $100 million and $300 million 3 or more Non-metropolitan area Between $100 million and $300 million 2 or fewer Metropolitan area Between $100 million and $300 million 2 or fewer Non-metropolitan area Between $50 million and $100 million 3 or more Metropolitan area Between $50 million and $100 million 3 or more Non-metropolitan area Between $50 million and $100 million 2 or fewer Metropolitan area Between $50 million and $100 million 2 or fewer Non-metropolitan area Less than $50 million 2 or more Metropolitan area Less than $50 million 2 or more Non-metropolitan area Less than $50 million 1 Metropolitan area Less than $50 million 1 Non-metropolitan area Less than $750 million. Each De Novo bank is grouped by the year of opening with other De
Novo banks for period of five years subject to the asset limitation. Each De Novo peer group is described by it's year, e.g. 2002, 2003, 2004, 2005, 2006.
FDIC Insured Savings Banks
Over 500 FDIC Insured Savings banks are assigned to one of four primary asset based peer groups as defi ned in the table below. Banks are grouped by asset size using 90 day average assets from call report schedule RC-K. This asset-based grouping applies to all peer groups and is reviewed quarterly. Savings banks continue to exhibit consistent differences in performance when compared to insured commercial banks. As a consequence
this peer group comparison has proved to be useful.
FDIC Insured Savings Banks Peer Group Descriptions (Includes FDIC insured savings banks with the following characteristics:)
Peer Group Number Assets*
101 In excess of $1 billion 102 Between $300 million and
$1 billion 103 Between $100 million and
$300 million 104 Less than $100 million
*Asset fi gure used is latest quarterly average assets (from the FFIEC call report Schedule RC-K).
Credit Card Specialty Banks
Approximately 39 banks are assigned to one of three primary credit card specialty peer groups based on asset size. Banks are grouped by asset size using 90 day average assets from call report schedule RC-K. This asset-based grouping applies to all peer groups and is reviewed quarterly. Banks that exhibit both of the following characteristics are considered to be a specialized credit card lender.
1. Credit Card Loans plus Securitized and Sold Credit Cards divided by Total Loans plus Securitized and Sold Credit Cards exceeds 50%.
2. Total Loans plus Securitized and Sold Credit Card divided by Total Assets plus Securitized and Sold Credit Cards exceeds 50%.
Credit card specialty banks are by defi nition focused on one type of lending. As a consequence many appear as outliers when compared to traditional benchmarks of performance. Credit card specialty banks exhibit very high noninterest income, noninterest expense, interest margins, loan loss provisions and profi tability when compared to traditional commercial or savings banks. As a consequence this specialized peer group analysis has proven to be especially useful as a benchmark for reviewing such banks.
Credit Card Specialty Banks (Includes insured commercial and savings banks with the following characteristics:)
Peer Group Number Assets*
201 In excess of $5 billion 202 Between $1 billion and $5 billion 203 Less than $1 billion
* Asset fi gure used is latest quarterly average assets (from the FFIEC call report Schedule RC-K).
Bankers Banks
Twenty banks have been assigned to the primary bankers bank peer group. Bankers banks are a unique type of financial institution that pr ovide services to other banks, bankers and bank directors. They do not provide any banking services to the general public. Because bankers banks are highly specialized institutions, many appear as outliers when compared to traditional measures of balance sheet structure and other forms of comparison. As a consequence the bankers bank peer group data has proven to be an especially useful as a tool for analyzing bankers banks.
Bankers Banks Peer Group Description
Peer Group Number
301 All Bankers Banks
UBPR User’s Guide • December 2008 II-2

Supplemental Peer Groups
The UBPR also groups banks into two separate supplemental peer
groups. Selected ratios are then averaged. This analysis is provided as anenhancement to the primary peergroup analysis available for allbanks.
Fiduciary Peer Groups
Trust pages 1 and 1A include peer group average data for banks engaged in fi duciary activities. For the purposes of these two pages, banks are compared to peer group data that is computed using supplemental peer group defi nitions. Banks continue to be compared to a primary peer group on all other pages of the UBPR.
Over 1,800 Commercial and FDIC Insured Savings Banks engaged in fiduciary activities have been assigned to one of six supplemental trust peer groups. Banks are grouped by total fi duciary assets(managed and non-managed) as reported on schedule RC-T. This grouping is reviewed quarterly.
Data from schedule RC-T is available from December 31, 2001 forward, however several reporting limitations apply. Depending on asset size and the percentage of trust and related revenue to total income, an individual institution may be
required to report certain items quarterly, annually or not at all. As a consequence peer group data for interim quarters may be based on a much smaller population of banks than year-end data. Please see instructions for the report of condition and income on www.ffi ec.gov for details. Because information on fiduciary income and expense is considered confi dential, only peer group data for those items will appear on the public UBPR website. See section III for defi nitions of individual ratios.
Fidcuciary Peer Group Descriptions Applies only to data shown on trust pages. (Includes insured commercial and savings banks with the following characteristics:)
Peer Group Number Total Fiduciary Assets*
TRST301 TRST302
TRST303 Between $1 billion and
$10 billion TRST304 TRST305
TRST306
In excess of $100 billionBetween $10 billion and
$100 billion
Between $500 million and $1 billion Between $100 million and $500 million Less than $100 million
*Asset figure used are latest total for managed and non-managed fiduciary assets from the
FFIEC call report Schedule RC-T.
State Average Peer Groups
The State Average Page (STAVG) is displayed for all banks as a part of the online UBPR. While it does not display individual bank data, it does provide averages of selected performance and balance sheet data for banks within in the state. Additionally, the same performance and balance sheet data is sub-divided into three asset categories. The state average page is provided as a supplement to the primary peer group data discussed above.
Computing Peer-Group Averages
Peer group averages shown in the UBPR are a trimmed average of the ratios for individual banks. The peer group average for a given ratio is trimmed or adjusted to eliminate the effect of outliers or banks above the 95th and below the 5th percentile. The resulting average in most cases is very close to the median or mid-point value for a given group of banks. Thus the peer group average could be thought of as representing the performance of the-bank-inthe-middle for a specific ratio. It should be noted that the group of banks averaged for one ratio will differ from that used in other ratios. This occurs because the top and bottom 5% of banks designated as outliers will change from ratio to ratio. Consequently averages for separate ratios cannot be added or otherwise combined. The resulting
peer group ratios are very stable over time and are not infl uenced by outlier banks.
As an example the trimmed average Return on Assets (ROA) for peer group 3 was 1.26%. The 180 banks in peer 3 have an ROA that ranges from –1.60% to 6.35%. After sorting the banks from highest to lowest ROA, eighteen banks were identifi ed as being in the top and bottom 5% and excluded from the group of banks to be averaged.
When an item is reported by only a small group of banks within a peer group, an insufficient number of valid observations can distort peer-group data. To minimize this problem, a floor has been set for the minimum number of ratio values that may be used to calculate the peer-group average. If fewer than five ratio values are available to compute the peer-group figure, a double number sign (##) is displayed rather than the value.
Percentile Rankings
Percentile rankings (PCT) are presented to the right of most of the individual and peer group ratios. The percentile ranking is the position or ranking of one bank relative to all others within the peer group for a given ratio. Thus, if a bank is at the 80th percentile for the tier one leverage ratio, it may be said that 20% of the banks in the peer group have a leverage ratio that is higher and 80% have a lower ratio. A high or low percentile ranking is a simple statement of statistical fact; it does not imply a good, bad, satisfactory, or unsatisfactory condition. However, when analyzed within the context of other related data, an opinion can be formed about the potential relevance of a high or low percentile ranking to an individual bank’s fi nancial condition and performance.
Please note that unlike the peer group average methodology discussed above, all banks within the peer group are included in the percentile ranking.
UBPR User’s Guide • December 2008 II-3

Computations and Adjustments
Calculating Asset and Liability Averages
The UBPR uses three different methodologies for calculating averages.
The first type of average is a cumulative or year-to-date average of the one quarter averages for assets and liabilities reported in call schedule RC-K. The resulting year-to-date averages are used as the denominator in earnings ratios, yield and rate calculations found on pages 1 and 3 of the UBPR. As an example, the average assets used for page 1 earnings analysis in the September 30th UBPR would reflect an average of the quarterly average assets reported in March, June and September of the current year.
The second type of average is a cumulative or year-to-date average of end-of-period balances reported on Schedules RC, RC-B, RC-C and RC-E from the beginning of the year forward. To provide an accurate average, the asset or liability balance at the prior year-end is also included. Averages calculated in this manner are used to determine the percentage composition of assets and liabilities on page 6 as well as selected ratios on page 7.
For example, the September 30th year-to-date average total loans is composed of the spot balances for total loans from call schedule RC-C for the prior December, and current March, June and September divided by 4.
The final type of average uses one quarter average data from schedule RC-K. These averages are as the denominator in the one-quarterannualized-income-analysis on page 12.
Thus, average assets used in the September 30 UBPR analysis of net income on page 12 would include the quarterly average assets from schedule RC-K for September. That average is divided into the annualized one quarter income or expense item.
Annualization of Ratios Using Interim-Period Report-of-Income-Data
The dollar amounts displayed for most income and expense items in the UBPR are shown for the year-todate period. However, to allow comparison of ratios between quarters, income and expense and related data used in ratios on pages 1, 3 and 7 and 11 are annualized for interim reporting periods. Thus, the income or expense item is multiplied by the indicated factor listed below before dividing it by the corresponding asset or liability. All income and expense ratios on page 12 are computed from income or expense data for one quarter and are annualized by a factor of 4.
Income and expense information reported on the December 31 call report is not annualized. Since the year-end UBPR represents a full fi scal year, that data does not have to be annualized. The UBPR annuali zation factors are:
March 4.0 June 2.0 September 1.3333
Special Annualization for De Novo Banks and Banks Reporting Pushdown Accounting
The annualization algorithm refl ects the actual number of days a De Novo bank has been open in its fi rst year of operation or the number of days that have elapsed since a push down transaction was reported. The algorithm divides the number of days in the year by the number days a De Novo Bank has been open or by the number of days since a push down transaction was reported. For affected banks the revised annualization factor will replace the standard annualization factor in the effected year.
Missing Data or Extreme Ratio Values
When data is missing from an indi
vidual calculation the UBPR will display NA.
When a ratio exceeds 999 or is less than -999 then + ## or - ## will be displayed respectively.
If there is an insuffi cient number of banks (observations) to permit calcu lation of a valid average ratio for peer group analysis, NA will appear.
Subchapter S Adjustments
For banks that elect Subchapter S status for income taxes, the UBPR adjusts after tax earnings used in Net Income as % of Average Assets (ROA). This adjustment is performed to improve the comparability of those income between banks that are taxed at the corporation level (non S Corp. banks) and those that have shifted income taxation to the shareholder level (S Corp. Banks). Dollar data displayed in the UBPR is not adjusted. In essence an estimated tax is substituted for any reported taxes then deducted from income.
After tax earnings are adjusted as follows:
Estimated income taxes: Federal income tax rates are applied to net income before extraordinary items and taxes plus non-deductible interest expense to carry tax-exempt securities less tax-exempt income from securities issued by states and political subdivisions, less tax-exempt income from leases, less tax-exempt income from other obligations of states and political subdivisions. (See appendix A-3 for tax table)
Net Income adjusted for Subchapter S: Net Income plus applicable income taxes less estimated income taxes.
Tax-Equivalency
Virtually all banks have some income that is exempt from federal or state taxes. The tax benefit derived from this tax-exempt income is a signifi cant element in determining the true
UBPR User’s Guide • December 2008 II-4

return on investment. Banks may differ both in the amount of tax-exempt assets held and in their ability to use tax-exempt income. In order to reduce distortions and allow meaningful comparisons of different banks’ income (and of a single bank’s income at different times), the tax benefit is added to book operating income so that pretax income fi gures for all banks are presented on a tax-equivalent basis. The tax benefi ts from municipal loans, leases, and municipal securities are used in the UBPR to compute the tax-equivalent income. Because interest income from these obligations is normally the largest component of tax-exempt income for commercial banks, the adjustments made using this data normally produce a close approximation of the true tax-equivalent position. In essence the UBPR tax equivalent adjustment “grosses up” tax-exempt income so that it approximates taxable income.
The tax-equivalency adjustment in the UBPR follows this general procedure:
• Determine the amount of tax-exempt income available for tax benefit: If pretax taxable income exceeds tax-exempt income, then all of the tax-exempt income results in tax benefit. In all other cases, taxable income and tax credits may be used to determine what amount, if any, of the tax-exempt income produces tax benefi t.
• Estimate the tax benefi t: Income tax rates are used to determine what proportion of the available
tax-exempt income is to be used as the estimated tax benefi t.
• Apply tax benefit to earnings: The total tax benefit is allocated to securities and loans & leases. These estimated tax benefits are then added to pretax income for UBPR purposes.
The computed tax-equivalent adjustment is also added to applicable income taxes to balance the UBPR’s income and expenses presentation.
For purposes of the UBPR income and expense presentation, the tax-equivalency adjustment is divided into two portions: (1) the amount of currently usable tax benefi t (current tax-equivalent adjustment) and (2) the amount derived from carrying back losses to prior years (other tax-equivalent adjustments).
By adding the tax benefit on tax-exempt assets to both book operating income and applicable income taxes, the net (after-tax) income reported by the bank remains unaffected. Adding the tax-equivalent adjustments to income makes the pretax income figures for all banks comparable.
A Tax-Equivalency Worksheet is provided in appendix A of this guide to enable the user to replicate the UBPR tax-equivalent adjustment.
Mergers
Merger activity occurs frequently among insured commercial banks. The UBPR does not attempt to make
a historical adjustment to restate information prior to the date of a merger.
The UBPR does attempt to minimize the effects of a merger on year-to-date profitability, yield and rate calculations (pages 1 and 3) after a signifi cant merger. A significant merger is one where asset growth exceeds 25%. When a significant merger is encountered all profi tability, yield and rate calculations are adjusted to include only average assets and liabilities reported after the merger. Pre-merger asset data is ignored in the year of the merger. However, income and expense data is used as reported without adjustment.
The UBPR adjusts 1 quarter annualized earnings ratios on page 12 when pushdown accounting is indicated. The adjustment applies only to income and expense data. Average asset and liability data is not adjusted because it applies only to one quarter. When pushdown accounting is indicated the UBPR does not subtract prior from current income or expense items to develop data for one quarter. Instead the income or expense item is annualized as reported.
Finally, the UBPR will flag the occurrence of a merger with a footnote on page 1.
UBPR User’s Guide • December 2008 II-5

Section III: Definitions of UBPR Items
General
This section describes the derivation of each of the items on each UBPR page.
Some UBPR pages have more than one set of items, depending on the type of Call Report filed by the bank
for the latest period. See Section II for a summary of Call reporter types.
Such UBPR page versions differ in the amount of detail reported by the bank and presented in the UBPR. Also, some page versions differ in the manner of categorizing loans. In addition, some items do not appear
on the public version of the UBPR, compared to the bank and regulatory version. Such items involve Call Report data that are deemed to be confidential. This section specifi es all of these distinctions between UBPR page versions.
UBPR User’s Guide • December 2008 III-1
UBPR Introductory Page
The Introductory Page specifies the edition date of the UBPR being presented, identifies the subject bank, provides a table of contents, and presents other notes and information.
Bank Identifi cation
The information presented on the first two lines is repeated on all subsequent UBPR pages. These items are:
• Cert#: bank’s FDIC insurance certifi cate number
• DSB#: bank’s Federal Reserve district-state-bank member
• Bank Name
• City and State
• Charter #: For national banks, bank’s OCC charter number
This page also provides the bank’s mailing address, the name and loca
tion of bank’s holding company if any, and the name of the bank’s primary federal regulatory agency.
The Introductory Page also specifi es the banks’ current UBPR peer group number and the criteria for that peer group. See Section II of this guide for specification of all peer group criteria.
Note that each UBPR is addressed to the chief executive officer by title, not name.
UBPR User’s Guide • December 2008 III-2

CERT # CHARTER #
DIST/RSSD COUNTY SUMMARY RATIOS PAGE 01
06/30/2008 06/30/2007 12/31/2007 12/31/2006 12/31/2005 AVERAGE ASSETS ($000) 169,798,208 177,365,349 173,640,242 178,783,017 158,323,556 NET INCOME ($000) 860,897 1,171,705 1,871,083 2,125,292 2,032,286 NUMBER OF BANKS IN PEER GROUP 187 193 190 185 183
EARNINGS AND PROFITABILITY BANK PG 1 PCT BANK PG 1 PCT BANK PG 1 PCT BANK PG 1 BANK PG 1 PERCENT OF AVERAGE ASSETS INTEREST INCOME (TE) 5.07 5.39 26 5.80 6.16 28 5.84 6.16 30 5.56 5.95 4.93 5.15 - INTEREST EXPENSE 2.20 2.25 48 3.00 3.00 52 2.96 2.98 52 2.83 2.72 1.90 1.89 NET INTEREST INCOME (TE) 2.88 3.12 32 2.81 3.15 26 2.87 3.16 31 2.73 3.20 3.03 3.25 + NONINTEREST INCOME 1.91 1.20 80 1.63 1.28 70 1.70 1.23 74 1.62 1.26 1.65 1.49 - NONINTEREST EXPENSE 2.72 2.65 55 2.53 2.56 48 2.72 2.63 56 2.43 2.54 2.66 2.70 - PROVISION LOAN&LEASE LOSSES 1.19 0.79 78 0.18 0.16 64 0.38 0.28 72 0.15 0.13 0.11 0.13 = PRETAX OPERATING INCOME (TE) 0.88 0.95 39 1.73 1.76 46 1.46 1.53 45 1.78 1.90 1.90 1.98 + REALIZED GAINS/LOSSES SEC 0.58 0.01 98 0.27 0.00 99 0.14 -0.01 98 -0.05 -0.01 0.00 0.00 = PRETAX NET OPERATING INC (TE) 1.46 0.91 64 1.99 1.75 62 1.60 1.49 54 1.72 1.89 1.90 1.97 NET OPERATING INCOME 1.01 0.60 66 1.32 1.13 65 1.08 0.97 57 1.19 1.23 1.28 1.27 ADJUSTED NET OPERATING INCOME 1.47 0.99 78 1.33 1.17 65 1.22 1.07 63 1.20 1.24 1.27 1.29 NET INCOME ADJUSTED SUB S 0.60 N/A 1.13 N/A 0.96 N/A 1.23 1.28 NET INCOME 1.01 0.60 66 1.32 1.13 65 1.08 0.96 57 1.19 1.23 1.28 1.28
MARGIN ANALYSIS AVG EARNING ASSETS TO AVG ASSETS 90.10 91.69 36 90.32 92.06 28 90.00 91.66 33 90.24 91.92 90.49 91.80 AVG INT-BEARING FUNDS TO AVG AST 77.67 82.22 25 78.60 81.68 28 78.12 81.70 27 76.44 81.67 75.72 80.89 INT INC (TE) TO AVG EARN ASSETS 5.63 5.90 28 6.42 6.71 32 6.48 6.73 34 6.17 6.47 5.45 5.63 INT EXPENSE TO AVG EARN ASSETS 2.44 2.46 47 3.32 3.28 53 3.29 3.26 53 3.14 2.98 2.10 2.07 NET INT INC-TE TO AVG EARN ASSET 3.19 3.42 36 3.11 3.45 28 3.19 3.48 33 3.03 3.51 3.35 3.55
LOAN & LEASE ANALYSIS NET LOSS TO AVERAGE TOTAL LN&LS 0.95 0.57 77 0.23 0.20 68 0.32 0.28 67 0.19 0.16 0.18 0.20 EARNINGS COVERAGE OF NET LOSS(X) 2.75 8.62 28 10.72 36.52 34 7.23 17.37 32 13.62 32.42 15.63 35.22 LN&LS ALLOWANCE TO NET LOSSES(X) 1.35 4.18 19 3.47 11.12 24 3.03 7.24 28 4.24 10.82 5.17 10.50 LN&LS ALLOW TO LN&LS NOT HFS 1.33 1.43 51 0.88 1.13 20 1.04 1.22 31 0.86 1.13 0.89 1.17 LN&LS ALLOWANCE TO TOTAL LN&LS 1.28 1.41 48 0.80 1.09 19 0.97 1.20 23 0.78 1.09 0.80 1.13 NON-CUR LN&LS TO GROSS LN&LS 2.50 1.60 77 0.90 0.62 75 1.54 0.91 80 0.64 0.51 0.50 0.52
LIQUIDITY NET NONCORE FUND DEPENDENCE 37.48 38.13 50 42.33 32.73 71 38.62 34.74 59 39.34 33.66 37.91 33.16 NET LOANS & LEASES TO ASSETS 74.96 67.33 72 73.66 65.32 72 74.83 65.83 75 72.47 63.60 71.95 62.05
CAPITALIZATION TIER ONE LEVERAGE CAPITAL 7.72 8.04 46 7.70 8.17 44 7.56 8.02 39 7.35 8.15 7.04 7.87 CASH DIVIDENDS TO NET INCOME 74.34 40.17 73 54.62 58.39 48 95.13 62.41 69 49.88 46.72 65.15 47.33 RETAIN EARNS TO AVG TOTAL EQUITY 2.25 0.98 51 5.50 3.67 59 0.47 2.12 36 5.66 5.65 4.74 6.21 RESTR+NONAC+RE ACQ TO EQCAP+ALLL 14.02 10.25 73 4.22 3.50 68 7.80 5.34 73 2.84 2.71 1.60 2.83
GROWTH RATES ASSETS -3.14 15.68 12 -2.41 10.48 15 -4.10 13.08 7 3.02 13.27 35.52 12.92 TIER ONE CAPITAL -3.47 11.72 14 5.52 10.94 42 -3.84 10.16 17 9.53 14.32 27.86 12.62 NET LOANS & LEASES -1.43 17.58 9 0.36 12.97 17 -0.98 15.59 9 3.77 13.77 38.27 15.82 SHORT TERM INVESTMENTS 32.95 23.07 67 -61.58 97.25 10 -52.47 38.05 22 39.31 173.78 -36.93 61.14 SHORT TERM NONCORE FUNDING -16.23 29.59 8 -8.23 10.33 26 -16.90 24.85 6 10.53 23.46 70.10 22.31 ##ONE OR MORE MERGERS, CONSOLIDATIONS OR PURCHASES HAVE OCCURRED DURING THE PERIOD.
12/31/2005
UBPR User’s Guide • December 2008 III-3

UBPR Page 01
Summary Ratios
The earnings and balance sheet ratios and other information presented on this page provide a synopsis of the bank’s condition and serve as a guide to more detailed data presented elsewhere in the UBPR. Ratios using after tax income and dividends have been adjusted for assumed tax rates. See Section II Technical Information.
Average Assets ($000)
A year-to-date average of the average assets reported in the Report of Condition Schedule RC-K. Thus for the first quarter of the year the average assets from Call Schedule RC-K quarter will appear, while at the endof-year, assets for all four quarters would be averaged.
Net Income ($000)
The year-to-date amount of net income shown in the Report of Income after applicable taxes, net securities gains or losses, and net extraordinary items.
# Banks in Peer Group
Total number of banks in the bank’s peer group.
Earnings and Profi tability
% of Average Assets
Interest Income (TE)
All income from earning assets plus the tax benefit on tax-exempt loans, leases, and municipal securities, divided by average assets.
Interest Expense
Total interest expense divided by average assets.
Net Interest Income (TE)
Total interest income, plus the tax benefit on tax-exempt income, less total interest expense, divided by average assets.
Noninterest Income
Income derived from bank services and sources other than interest-bearing assets, divided by average assets.
Noninterest Expense
Salaries and employee benefits, expenses of premises and fixed assets and other Noninterest expense divided by average assets.
Provision—Loan/Lease Losses
Provision for loan and lease receivables losses divided by average assets.
Pretax Operating Income (TE)
Net interest income on a tax-equivalent basis plus Noninterest income, less noninterest expenses, the provision for loan and lease-financing receivables losses and the provision for allocated transfer risk, divided by average assets.
Realized Gain/Loss Secs
Pretax net gains or losses from the sale, exchange, retirement, or redemption of securities not held in trading accounts divided by average assets. After December 31, 1993 includes available-for-sale and held-tomaturity transactions.
Pretax Net Operating Income (TE)
Pretax operating income, plus securities gains or losses divided by average assets.
Net Operating Income
After tax net operating income, including securities gains or losses, (which does not include extraordinary gains or losses), divided by average assets.
Adjusted Net Oper Income
Net operating income after taxes and securities gains or losses, plus the
provision for possible loan and lease losses, less net loan and lease losses, divided by average assets.
Net Income Adjusted Sub S
Net income after securities gains or losses, extraordinary gains or losses, and applicable taxes, adjusted for sub chapter S status divided by average assets. Estimated income taxes is substituted for any reported applicable income taxes for banks that indicate sub chapter S status. Estimated income taxes: Federal income tax rates are applied to net income before extraordinary items and taxes plus non-deductible interest expense to carry tax-exempt securities less tax-exempt income from securities issued by states and political subdivisions, less tax-exempt income from leases, less tax-exempt income from other obligations of states and political subdivisions. (See appendix A-3 for tax table)
Please note that this ratio will only be displayed for banks that elect subchapter S status.
Net Income
Net income after securities gains or losses, extraordinary gains or losses, and applicable taxes divided by average assets.
Margin Analysis
Average Earning Assets/Average Assets
Year-to-date average of average total loans (net of unearned income) in domestic and foreign offi ces, lease-financing receivables, U.S. Treasury, Agency and Corporation obligations, mortgage backed securities, other securities, assets held in trading accounts, interest-bearing balances due from depository institutions, and federal funds sold and securities purchased under agreements to resell, plus a five period average of Interest Only Strips (Mortgage loans and
UBPR User’s Guide • December 2008 III-4

Other) and Equity Securities divided by average assets.
Average Interest-Bearing Funds/ Average Assets
Average interest-bearing domestic and foreign office deposits, federal funds purchased and securities sold under agreements to repurchase, other borrowed money, and notes and debentures subordinated to deposits, divided by average assets.
Interest Income (TE)/Average Assets
Total interest income on a tax-equivalent basis divided by the average of the respective asset accounts involved in generating that income.
Interest Expense/Average Assets
Total interest expense divided by the average of the respective asset accounts involved in generating interest income.
Net Interest Income (TE) (Percent of Avg Earning Assets)
Total interest income on a tax-equivalent basis, less total interest expense, divided by the average of the respective asset accounts involved in generating interest income.
Loan & Lease Analysis
Net Loss to Average Loan & Leases
Gross loan and lease charge-off, less gross recoveries (includes allocated transfer risk reserve charge-off and recoveries), divided by average total loans and leases.
Earnings Coverage of Net Loss (X)
Net operating income before taxes, securities gains or losses, and extraordinary items, plus the provision for possible loan and lease-financing receivable losses divided by net loan and lease losses.
Loan & Lease Allowance Net Losses (X)
Ending balance of the allowance for
possible loan and lease-financing receivable losses divided by net loan and lease losses. If gross recoveries exceed gross losses, NA is shown at this caption.
Loan & Lease Allowance to Loans & Leases Not Held For Sale
Ending balance of the allowance for possible loan and lease losses divided by total loans and lease-fi nancing receivables not held for sale. Available from March 31, 2001 forward.
Loan & Lease Allowance to Total Loans & Lease
Ending balance of the allowance for possible loan and lease losses divided by total loans and lease-fi nancing receivables.
Noncurrent Loans & Leases to Gross Loans and Lease
The sum of loans and lease-fi nancing receivables past due at least 90 days, plus those in nonaccrual status, divided by gross loans and lease-financing receivables outstanding.
Liquidity
Net Noncore Funding Dependence
Noncore liabilities, less short term investments divided by long term assets. See definition on UBPR page 10.
Net Loans & Leases to Assets
Loans and lease-fi nancing receivables net of unearned income and the allowance for possible loans and lease financing receivable losses divided by total assets.
Capitalization
Tier One Leverage Capital
Tier one capital divided by adjusted average assets. See the description of UBPR Page 11A for defi nitions of tier one capital and adjusted average assets.
Cash Dividends to Net Income
Total of all cash dividends declared year-to-date divided by net income year-to-date. If net income is less than or equal to zero, NA is shown at this caption.
Retain Earns to Average Total Equity
Net income, less cash dividends declared, divided by average equity capital.
Restructured + Nonaccrual + RE ACQ to EQCAP, ALLL
The sum of loans and leases which are on nonaccrual, restructured but 30–89 days past due, restructured but over 90 days past due, restructured and in compliance with modifi ed terms and non-investment other real estate owned divided by the sum of total equity capital plus the allowance for possible loan and lease losses.
Growth Rates
Growth rates on UBPR page 01 are calculated for a 12-month period. The percentage is determined by subtracting the account balance as of the corresponding reporting period in the previous year from the current period account balance and dividing the result by the previous year balance. The following growth rates are displayed:
Assets
Tier One Capital
Net Loans & Leases
Short Term Investments
See UBPR page 10 for defi nition.
Short Term Noncore Funding
See UBPR page 10 for defi nition.
Footnotes
Footnotes are printed on UBPR page 01 to indicate the occurrence of certain events.
UBPR User’s Guide • December 2008 III-5

(***)Bank has elected sub chapter S tax treatment. NOTE: Ratio Net Income Adjusted for Sub S on page 1 and 12.
**A transaction using push-down accounting as of mm/dd/yyyy was reported.
# # One or more mergers occurred during the period.
This comment appears when a merger or consolidation is reported during the period.
UBPR User’s Guide • December 2008 III-6

CERT # CHARTER #
DIST/RSSD COUNTY INCOME STATEMENT - REVENUE AND EXPENSES ($000) PAGE 02
06/30/2008 06/30/2007 12/31/2007 12/31/2006 12/31/2005 PERCENT CHANGE
1 YEAR INTEREST AND FEES ON LOANS 3,617,836 4,234,706 8,412,569 8,221,475 6,295,301 -14.57 INCOME FROM LEASE FINANCING 120,694 108,300 234,451 187,195 148,246 11.44
TAX-EXEMPT 90,177 124,135 253,641 148,251 149,272 -27.36ESTIMATED TAX BENEFIT 46,161 63,263 129,992 74,113 76,050
INCOME ON LOANS & LEASES (TE) 3,784,691 4,406,269 8,777,012 8,482,783 6,519,597 -14.11
U S TREAS & AGENCY (EXCL MBS) 9,615 5,719 12,850 109,943 91,235 68.12 MORTGAGE BACKED SECURITIES 278,666 193,203 470,439 785,781 773,509 44.23 ESTIMATED TAX BENEFIT 8 818 8 606 17 397 15 586 15 247 ALL OTHER SECURITIES 51,538 47,545 92,868 176,821 201,176 8.40 TAX-EXEMPT SECURITIES INCOME 17,227 16,88 33,946 31,177 29,928 2.01 INVESTMT INTEREST INCOME (TE) 348,637 255,073 593,554 1,088,131 1,081,167 36.68
INTEREST ON DUE FROM BANKS 130 467 774 837 561 -72.16 INT ON FED FUNDS SOLD & RESALES 26,725 94,190 138,214 245,736 127,483 -71.63 TRADING ACCOUNT INCOME 119,677 362,593 567,954 72,407 34,050 -66.99 OTHER INTEREST INCOME 28,539 26,913 55,343 57,971 48,474 6.04
TOTAL INTEREST INCOME (TE) 4,308,399 5,145,505 10,132,852 9,947,864 7,811,332 -16.27
INT ON DEPOSITS IN FOREIGN OFF 75,878 254,560 405,748 536,098 251,895 -70.19 INTEREST ON TIME DEP OVER $100M 474,085 766,876 1,447,511 1,373,345 593,198 -38.18 INTEREST ON ALL OTHER DEPOSITS 794,238 924,480 1,916,049 1,636,040 1,019,672 -14.09 INT ON FED FUNDS PURCH & REPOS 97 784 327 966 518 755 723 402 391 619 -70.18 INT TRAD LIAB & OTH BORROWINGS 413,112 354,766 810,220 570,021 603,068 16.45 INT ON MORTGAGES & LEASES NA NA NA NA NA NA INT ON SUB NOTES & DEBENTURES 9,725 28,039 46,753 224,104 149,673 -65.32
TOTAL INTEREST EXPENSE 1,864,822 2,656,687 5,145,036 5,063,010 3,009,125 -29.81
NET INTEREST INCOME (TE) 2,443,577 2,488,818 4,987,816 4,884,854 4,802,207 -1.82NONINTEREST INCOME 1 624 102 1 445 925 2 944 258 2 901 587 2 606 212 12.32
ADJUSTED OPERATING INCOME (TE) 4,067,679 3,934,743 7,932,074 7,786,441 7,408,419 3.38
NONINTEREST EXPENSE 2,311,178 2,242,279 4,729,242 4,345,095 4,216,410 3.07PROVISION LOAN & LEASE LOSSES 1,007,212 161,121 664,922 262,536 176,886 25.13 PRETAX OPERATING INCOME (TE) 749,289 1,531,343 2,537,910 3,178,810 3,015,123 51.07
REALIZED G/L HLD-TO-MATURITY SEC 0 0 0 0 0 NAREALIZED G/L AVAIL-FOR SALE SEC 489,209 236,440 243,124 -98,231 -5,713 06.91 PRETAX NET OPERATING INC (TE) 1,238,498 1,767,783 2,781,034 3,080,579 3,009,410 29.94
APPLICABLE INCOME TAXES 322 622 524 209 762 561 865 589 885 827CURRENT TAX EQUIV ADJUSTMENT 54,979 71,869 147,390 89,698 91,297OTHER TAX EQUIV ADJUSTMENTS 0 0 0 0 0 APPLICABLE INCOME TAXES(TE) 377,601 596,078 909,951 955,287 977,124
NET OPERATING INCOME 860,897 1,171,705 1,871,083 2,125,292 2,032,286 26.53
NET EXTRAORDINARY ITEMS 0 0 0 0 0NET INCOME 860,897 1,171,705 1,871,083 2,125,292 2,032,286 26.53
CASH DIVIDENDS DECLARED 640,000 640,000 1,780,000 1,060,000 1,324,000 0.00 RETAINED EARNINGS 220,897 531,705 91,083 1,065,292 708,286 58.45 MEMO NET INTERNATIONAL INCOME 0 0 0 0 0
UBPR User’s Guide • December 2008 III-7

UBPR Page 02
Income Statement Revenues & Expenses ($000)
This page presents a summary of the bank's year to date Report of Income. The major categories of income and expense reported on this page are expanded on subsequent pages of the UBPR. The tax benefi t associated with tax-exempt income has been estimated and added to total interest income and applicable income taxes. The estimated tax benefit is allocated to municipal securities and to municipal loans and leases. This adjustment improves the comparability of interest income among different banks and among different time periods. Net income is shown as reported. Please note that certain income items noted below are available only from March 31, 2001 forward.
One year growth rates for the various categories on this page are shown in the right most column.
Interest and Fee on Loans
Year to date interest and fee on loans.
Income from Lease Financing
Year to date income from lease fi nancing receivables.
Tax-Exempt
Year to date income on loan obligations of states and political subdivisions and tax-exempt income from direct lease fi nancing.
Estimated Tax Benefi t
The estimated tax benefi t resulting from having tax-exempt loan and lease financing receivables income. See Section II, Technical Information, or Appendix B, Tax-Equivalency Work sheet, for a discussion of the method used to calculate this item.
Income on Loans & Leases (TE)
Year to date income on loans and lease financing receivables plus the estimated tax benefi t.
US Treasury & Agency (Excl MBS)
Year to date interest on U.S. Treasury securities and on other U.S. government agencies excluding mortgage backed securities. This item is available from March 31, 2001 forward.
Mortgage Backed Securities
Year to date interest Mortgage Backed Securities. This item is available from March 31, 2001 forward.
Estimated Tax Benefi t
The estimated tax benefi t resulting from having tax-exempt municipal securities income. See Section II, Technical Information, for a discussion of the method used to calculate this item.
All Other Securities
Year to date income on all other securities not held in trading accounts, including taxable and tax-exempt securities issued by states and local subdivisions.
Tax-Exempt Securities Income
Year-to-date interest on securities issued by states and political subdivisions in the United States.
Investment Interest Income (TE)
Sum of U.S. Treasury and agencies securities income, municipal securities income, the tax benefi t on municipal securities income, and other securities income.
Interest on Due From Banks
Year to date interest on balances due from depository institutions.
Interest on Federal Funds Sold/Resales
Year to date income on federal funds sold and securities purchased under agreements to resell.
Trading Account Income
Year to date interest income on
assets held in trading accounts (excluding gains, losses, commissions, and fees).
Other Interest Income
Year to date other interest income. This item is available from March 31, 2001 forward.
Total Interest Income (TE)
Sum of income on loans and leases on a tax equivalent basis plus investment income on a tax equivalent basis plus interest on interest bearing bank balances plus interest on federal funds sold and security resales plus interest on trading account assets.
Interest on Deposits in Foreign Offi ces
Year to date interest expense on deposits in Foreign Offi ces. Reported by banks filing 031 call form.
Interest on Time Dep over $100M
Year to date interest expense on time certificates of deposit of $100 thousand or more.
Interest on All Other Deposits
Year to date interest expense on all deposits except time certifi cates of deposit of $100 thousand or more and deposits held in foreign offi ces, if applicable.
Interest on Federal Funds Purchased & Repos
Year to date expense of federal funds purchased and securities sold under agreements to repurchase.
Interest on Trading Liabilities and Other Borrowings
Year to date interest on trading liabilities, demand notes (note balances) issued to the U.S. Treasury and on other borrowed money (including Federal Home Loan Bank).
Interest on Mortgages & Leases
Year to date interest on mortgage
UBPR User’s Guide • December 2008 III-8

indebtedness and capitalized leases on banking premises, fi xed assets, and other real estate owned.
Interest on Subordinated Notes & Debentures
Year to date interest on subordinated notes and debentures.
Total Interest Expense
Sum of all interest expenses listed previously.
Net Interest Income (TE)
Total interest income on a tax equivalent basis less total interest expense.
Noninterest Income
Year to date income from fi duciary activities (when available), service charges on deposits, gains or losses and commissions and fees on assets held in trading accounts, foreign exchange trading gains or losses, other foreign transactions, and other Noninterest income.
Adjusted Operating Income (TE)
Net interest income plus noninterest income.
Noninterest Expense
Year to date salaries and employee benefits, expenses of premises and fixed assets (net of rental income), amortization of intangibles and other noninterest operating expense.
Provision for Loan/Lease Losses
The year to date provision for possible loan and lease fi nancing receivable losses.
Pretax Operating Income (TE)
The sum of year to date total tax equivalent interest income plus Non-interest income less interest expense, noninterest expense, provision for possible loan and lease fi nancing
receivables losses, and provision for allocated transfer risk.
Realized G/L Hld to Maturity Sec
Year to date pretax net gains or losses on the sale, exchange, redemption, or retirement of securities excluding those held in trading or available-for-sale account. Prior to March 31, 1994, gains/losses on all securities are displayed here. For March 31, 1994 and subsequent quarters only gains/losses from held-to-maturity securities are shown.
Realized G/L Avail for Sale Sec
Year to date pretax net gains or losses on the sale, exchange, redemption, or retirement of securities recorded as available-for-sale. Available only for March 31, 1994 and subsequent quarters.
Pretax Net Operating Income (TE)
The sum of year to date pretax operating income on a tax-equivalent basis plus net pretax securities gains or losses.
Applicable Income Taxes
The total estimated federal, state, local, and foreign (if applicable) income taxes applicable to operating income, including securities gains or losses.
Current Tax-Equivalent Adjustment
Reverses the current part of the tax benefit included in interest income on loans and leases and securities. The current tax-equivalent adjustment is an estimate of that portion of the tax benefit that is attributable to current period income.
Other Tax-Equivalent Adjustments
Reverses the remainder of the tax-equivalent adjustment included in interest income on loans and leases and securities. The other tax-
equivalent adjustment is an estimate of that portion of the tax benefit that is attributable to tax loss carry backs.
Applicable Income Taxes (TE)
Applicable income taxes plus the tax benefit on tax-exempt income; current tax-equivalent adjustment plus other tax-equivalent adjustments.
Net Operating Income
Year to date income after securities gains or losses and applicable taxes but before extraordinary gains or losses.
Net Extraordinary Items
Extraordinary gains or losses less applicable taxes.
Net Income
The year to date net income after securities gains or losses, extraordinary gains or losses, and applicable taxes.
Cash Dividends Declared
All cash dividends declared on common and preferred stock year to date.
Retained Earnings
Net income minus cash dividends declared year to date.
Memo: Net International Income
Estimated net income attributable to international operations. Available for banks filing call form 031 only.
Footnotes:
Footnotes are printed at the bottom of Page 2 to indicate the occurrence of certain events.
Note: Bank has elected sub chapter “S” treatment for taxes.
This footnote appears when bank indicates sub chapter “S” treatment on call report.
UBPR User’s Guide • December 2008 III-9

CERT # CHARTER #
DIST/RSSD COUNTY
NONINTEREST INCOME AND EXPENSES ($000) AND YIELDS PAGE 03
06/30/2008 06/30/2007 12/31/2007 12/31/2006 12/31/2005 NONINTEREST INCOME & EXPENSES FIDUCIARY ACTIVITIES 221,938 225,389 461,969 465,619 474,354 DEPOSIT SERVICE CHARGES 441,531 386,091 822,493 764,363 773,128 TRADING,VENT CAP,SECURTZ INC -155,631 48,758 -180,082 86,589 94,256 INV BANKING,ADVISORY INC 36,449 30,770 74,571 38,660 63,854 INSURANCE COMM & FEES 32,206 17,965 39,747 30,115 28,512 NET SERVICING FEES 63,658 69,280 144,200 55,455 317,728 LOAN & LSE NET GAIN/LOSS -180,474 -274,487 -585,341 -284,916 -222,714 OTHER NET GAINS/LOSSES 5,370 12,337 160,314 70,735 -2,957 OTHER NONINTEREST INCOME 1,159,055 929,822 2,006,387 1,674,967 1,080,051 NONINTEREST INCOME 1 624 102 1 445 925 2 944 258 2 901 587 2 606 212 PERSONNEL EXPENSE 1,187,176 1,170,066 2,263,414 2,220,616 2,050,328 OCCUPANCY EXPENSE 273,875 272,652 553,800 527,979 511,584 GOODWILLL IMPAIRMENT 0 0 0 0 0 OTHER INTANGIBLE AMORTIZ 31 907 39 777 76 435 91 691 107 421 OTHER OPER EXP(INCL INTANGIBLES) 818,220 759,784 1,835,593 1,504,809 1,547,077 TOTAL OVERHEAD EXPENSE 2,311,178 2,242,279 4,729,242 4,345,095 4,216,410 DOMESTIC BANKING OFFICES(#) 1,695 1,711 1,708 1,732 1,688 FOREIGN BRANCHES (#) 5 5 5 5 5 ASSETS PER DOMESTIC OFFICE 101,180 103,487 102,521 105,420 104,994
PERCENT OF AVERAGE ASSETS BANK PG 1 PCT BANK PG 1 PCT BANK PG 1 PCT BANK PG 1 BANK PG 1 PERSONNEL EXPENSE 1.40 1.23 64 1.32 1.27 54 1.30 1.25 56 1.24 1.26 1.30 1.32 OCCUPANCY EXPENSE 0.32 0.33 45 0.31 0.34 38 0.32 0.34 41 0.30 0.33 0.32 0.35 OTHER OPER EXP(INCL INTANGIBLES) 1.00 1.02 57 0.90 0.90 56 1.10 0.98 68 0.89 0.90 1.05 0.98
TOTAL OVERHEAD EXPENSE 2.72 2.65 55 2.53 2.56 48 2.72 2.63 56 2.43 2.54 2.66 2.70 OVERHEAD LESS NONINT INC 0.81 1.32 20 0.90 1.20 28 1.03 1.33 27 0.81 1.18 1.02 1.13 OTHER INCOME & EXPENSE RATIOS EFFICIENCY RATIO 56.82 58.30 42 56.99 56.13 48 59.62 57.71 56 55.80 55.30 56.91 55.45 AVG PERSONNEL EXP PER EMPL($000) 82.72 72.96 71 76.48 74.74 64 76.28 71.64 66 71.92 71.45 66.89 66.61 ASSETS PER EMPLOYEE ($MILLION) 5.97 9.75 55 5.79 11.56 58 5.90 10.50 58 5.91 10.74 5.78 6.72
YIELD ON OR COST OF TOTAL LOANS & LEASES (TE) 5.81 6.31 21 6.67 7.30 20 6.71 7.32 18 6.50 7.15 5.76 6.24 LOANS IN DOMESTIC OFFICES 5.79 6.30 19 6.63 7.30 19 6.67 7.31 18 6.50 7.14 5.73 6.24 REAL ESTATE 5.98 6.28 25 6.79 7.21 30 6.83 7.21 29 6.68 7.06 5.94 6.21
SECURED BY 1-4 FAM. RESI PROP 6.06 6.18 45 N/A N/A N/A N/A N/A N/A N/A N/A N/A N/A ALL OTHER LOANS SEC. REAL ESTATE 5.80 6.34 20 N/A N/A N/A N/A N/A N/A N/A N/A N/A N/A
COMMERCIAL & INDUSTRIAL 4.55 6.26 6 4.94 7.84 2 4.93 7.67 3 4.97 7.64 4.30 6.48 INDIVIDUAL 5.91 7.46 15 6.39 7.99 16 6.46 8.11 19 6.14 7.77 5.67 7.01 CREDIT CARD 8.40 10.25 26 5.85 11.64 12 3.09 10.40 10 N/A 11.41 N/A 9.77 AGRICULTURAL 4.96 6.43 5 7.23 7.91 24 7.17 7.87 26 6.90 7.77 5.54 6.68 LOANS IN FOREIGN OFFICES N/A 5.64 N/A N/A 6.52 N/A N/A 6.43 N/A N/A 5.88 N/A 5.08 TOTAL INVESTMENT SECURITIES(TE) 5.91 4.98 92 5.77 5.07 91 5.82 5.11 90 4.72 4.82 4.64 4.35 TOTAL INVESTMENT SECURITES(BOOK) 5.76 4.78 94 5.58 4.88 90 5.65 4.92 92 4.65 4.65 4.58 4.18
U S TREAS & AGENCY (EXCL MBS) 4.58 4.43 56 4.20 4.72 22 4.59 4.74 40 4.55 4.40 4.09 3.63 MORTGAGE BACKED SECURITIES 5.77 5.02 90 5.50 4.97 84 5.61 4.98 88 4.54 4.75 4.57 4.34 ALL OTHER SECURITIES 5.98 4.51 89 6.16 4.86 88 6.07 4.89 85 5.27 4.74 4.86 4.48 INTEREST-BEARING BANK BALANCES 4.13 2.74 81 6.03 4.70 87 6.16 4.58 91 3.52 4.24 2.82 3.05 FEDERAL FUNDS SOLD & RESALES 2.34 2.72 19 5.33 5.30 71 5.10 5.21 46 5.00 5.01 2.75 3.24 TOTAL-INT BEARING DEPOSITS 2.64 2.58 54 3.60 3.43 61 3.59 3.41 60 3.33 3.04 2.11 2.03 TRANSACTION ACCOUNTS 1.50 1.20 67 2.36 1.87 64 2.36 1.83 67 1.79 1.71 1.00 1.23 OTHER SAVINGS DEPOSITS 1.59 1.45 62 2.12 2.35 42 2.20 2.32 49 1.96 2.03 1.26 1.29 TIME DEPS OVER $100M 4.09 4.00 51 5.12 4.81 78 5.14 4.79 79 4.81 4.38 3.48 3.20 ALL OTHER TIME DEPOSITS 4.23 3.97 65 4.47 4.50 44 4.56 4.57 51 3.99 3.98 3.21 2.92 FOREIGN OFFICE DEPOSITS 2.52 2.59 45 5.25 4.52 93 5.09 4.35 90 5.17 4.21 3.47 2.83
FEDERAL FUNDS PURCHASED & REPOS 2.16 2.77 17 4.99 4.74 62 4.74 4.58 55 4.79 4.48 3.06 3.03 OTHER BORROWED MONEY 4.71 3.76 85 4.83 5.00 41 4.98 4.91 51 5.03 4.74 3.87 3.85 SUBORD NOTES & DEBENTURES 0.57 5.47 3 1.63 6.09 5 1.38 5.99 7 6.23 5.74 4.75 5.15 ALL INTEREST-BEARING FUNDS 2.83 2.76 56 3.81 3.71 54 3.79 3.68 54 3.70 3.36 2.51 2.36
UBPR User’s Guide • December 2008 III-10

UBPR Page 03
Noninterest Income and Expenses ($000) and Yields
This page presents most of the dollar figures that are components of Noninterest income and overhead expense as reported in the Report of Income, together with related information such as number of offi ces and employees. Key overhead items are also presented as percent of average assets, together with other related ratios. The lower portion of the page presents information relating earning assets, the return or yield on specifi c earning-asset categories, and the cost of funds. All yields and costs (rates) are annualized.
For more information concerning the methods used to calculate averages for asset yields and liability costs, see Section II, Technical Information.
Noninterest Income and Expenses ($000)
The dollar amounts, in thousands, for Noninterest income and expenses as reported in the Report of Income.
Fiduciary Activities
Year-to-date income from fi duciary activities. Available for all banks from March 31, 2001 forward. Not available prior to March 31, 2001 for banks fi ling 034 call form.
Deposit Service Charges
Year-to-date service charges on deposit accounts.
Trading, Venture Capital, Securitization Income
From March 31, 2001 includes information from schedule RI Trading Revenue (RIADA220) plus Venture Capital Revenue (RIADB491) plus Securitization Income (RIADB493). For prior quarters includes Trading Revenue (RIADA220) for banks fi ling call forms 031, 032 or 033.
Investment Banking, Advisory Income
From March 31, 2001 forward includes information from schedule RI Investment Banking, Advisory, Underwriting, Brokerage Fees and Commissions (RIADB490).
Insurance Commissions and Fees
From March 31, 2001 through December 31, 2002 includes information from schedule RI Insurance Commissions and Fees (RIADB494). From March 31, 2003 forward includes Insurance and Reinsurance Underwriting Income (RIADC386) plus Income From Other Insurance Activities (RIADC387).
Net Servicing Fees
From March 31, 2001 forward includes information from schedule RI Net Servicing Fees (RIADB492).
Loan and Lease Net Gain/Loss
From March 31, 2001 forward includes information from schedule RI Net Gains (Losses) from Sale of Loans and Leases (RIAD5416).
Other Net Gains/Losses
From March 31, 2001 forward includes information from RI Net Gains (Losses) on the Sale of Other Real Estate Owned (RIAD5415) plus Net Gains (Losses) On the Sale of Other Assets (RIADB496).
Other Noninterest Income
From March 31, 2001 forward includes information from schedule RI Other Noninterest Income (RIADB497). For prior quarters inc ludes Other Fee Income (RIAD5407) plus Other Noninterest Income (RIAD5408). Note title no longer includes the description: (Inc Intangibles).
Noninterest Income
Year-to-date total of Noninterest income.
Personnel Expense
Year-to-date Salar ies and Employee Benefits, from sched - ule RI (RIAD4135).
Occupancy Expense
Year-to-date expenses of Premises and Fixed assets (net of rental income), from schedule RI (RIAD4217).
Goodwill Impairment
From March 31, 2002 forward includes information from schedule RI Goodwill Impairment Losses (RIADC216).
Other Intangible Amortization
From March 31, 2002 forward includes information from schedule RI Amortization Expense and Impairment Losses for Other Intangible Assets (RIADC232).
Other Operating Expense
From March 31, 2002 forward includes information from schedule RI Other Noninterest Expense (RIAD4092). From March 31, 2001 to December 31, 2001 includes Amortization of Intangible Assets (RIAD4531) and Other Noninterest Expense (RIAD4092). From December 31, 2001 and prior includes Other Noninterest Expense (RIAD4092). Note that for those quarters Amortization of Intangible Assets was reported as a part of Other Noninterest Expense.
Total Overhead Expense
Sum of personnel, occupancy, goodwill impairment, other intangible amortization and other operating expense.
Domestic Banking Offi ces (#)
The number of domestic banking
UBPR User’s Guide • December 2008 III-11

offices (including the “main” offi ce) in operation on the reporting date.
Foreign Branches (#)
NA appears at this caption for banks that do not have foreign offices, International banking facilities (IBFs) are not included in this item.
Assets per Domestic Offi ce
Average domestic assets divided by the number of domestic banking offices, expressed in thousands of dollars per offi ce.
Percent of Average Assets
Noninterest expenses as reported in the Report of Income divided by year-to-date average assets. See previous section for individual Noninterest expense item definitions. Ratios in this section are annualized for interim periods. See Section II, Technical Information for further information.
Personnel Expense
Occupancy Expense
Other Oper Exp (Including Intangibles)
Total Overhead Expense
Overhead Less Noninterest Income
Other Income/Expense Ratios
These ratios present an additional analysis on a per employee base and the marginal tax rate (RIADB496).
Effi ciency Ratio
Total Overhead Expense expressed as a percentage of Net Interest Income (TE) plus Noninterest Income. See definitions on UBPR page 2 for specifi c components.
Average Personnel Expense per Employee (Thousand$)
The average salary (including benefits) per employee expressed in
thousands of dollars ($). For example, 21.35=$21,350 average salary (including benefits) per employee per year.
Average Assets per Employee (Millions$)
Average assets divided by the number of full-time equivalent employee on the payroll at the end of the period. Result is shown in millions of dollars.
Yield On or Cost of:
This section presents yield or cost ratios for various assets and liabilities. Note that all yields and rates are annualized and those averages are year-to-date averages. See Section II for descriptions of annualizing and averaging methods. Yields on individual loan categories are not calculated for banks with assets below $25M because of data limitations. Yields and costs (rates) use averages from Report of Condition, Schedule RC-K whenever the data is reported.
Total Loans & Lease (TE)
Interest and fees on loans and income on direct lease-financing receivables, plus the tax benefi t on tax-exempt loan and lease income, divided by average total loans and lease-financing receivables. See Appendix B regarding the calculation of tax benefi ts.
Total Loans or Loans in Domestic Offi ces
Interest and fees on loans held in domestic offices divided by average domestic offi ce loans.
Real Estate Loans
Interest and fees on domestic offi ce loans secured primarily by real estate, divided by average domestic real estate loans.
Loans Secured by 1–4 Family Residential Property
Interest and fees on loans secured by 1–4 family real estate divided by
average loans secured by 1–4 family real estate.
All Other Loans Secured By Real Estate
Interest and fees on all other loans secured real estate divided by average loans secured by real estate.
Commercial & Industrial Loans
Interest and fees on domestic offi ce commercial and industrial loans, divided by average domestic commercial and industrial loans.
Individual Loans
Interest and fees on domestic offi ce loans to individuals for household, family and other personal expenditures, divided by average domestic loans to individuals for household, family, and other personal expenditures.
Credit Card
Interest and fees on credit card plans divided by average credit card and related plans.
Agricultural Loans
Interest and fees on domestic offi ce loans to finance agricultural production divided by average domestic loans to finance agricultural production.
Loans in Foreign Offi ces
Interest and fees on loans in foreign offices divided by average loans in foreign offices. Available for banks filing call form 031.
Total Investment Securities (TE)
Income on securities not held in trading accounts, plus the estimated tax benefit on tax-exempt municipal securities income, divided by average U.S. Treasury and U.S. government agency securities, state and political subdivisions, and other debt and equity securities.
Total Investment Securities(Book)
Income on securities not held in trad-
UBPR User’s Guide • December 2008 III-12

ing accounts, divided by average U.S. Treasury and U.S. government agency securities, state and political subdivisions, and other debt and equity securities.
US Treasury & Agency (Excluding MBS)
Income on U.S. Treasury securities and U.S. government agency obligations divided by average U. S. Treasury securities and U.S. government agency obligations. Excludes mortgage backed securities. Available from March 31, 2001 forward.
Mortgage Backed Securities
Income on mortgage backed securities divided by the average for those securities.
All Other Securities
Income on all other securities divided by the average for those securities. Includes taxable and tax-exempt obligations issued by state and local subdivisions.
Interest-Bearing Bank Balances
Interest on balances due from depository institutions divided by the average of interest-bearing balances due from depository institutions carried in domestic and foreign offi ce.
Federal Funds Sold & Resales
Income on federal funds sold and securities purchased under agreements to resell divided by the average of federal funds sold and securities purchased under agreements to resell.
Total Interest-Bearing Deposits
Interest on all interest-bearing time
and savings deposits in domestic and foreign offices divided by average interest-bearing time and savings deposits in domestic and foreign offi ces.
Transaction Accounts
Interest on transaction accounts (NOW accounts, ATS accounts, and telephone and preauthorized transfer accounts) divided by the average balance of such deposits.
Other Savings Deposits
For quarters from March 31 2001 forward includes interest on other savings deposits (all nontransaction accounts and time deposits) divided by the average of such deposits. For quarters prior to March 31, 2001 excludes MMDA’s.
Time Dep of $100M or More
Interest on time certificates of deposit of $100 thousand or more issued by domestic offices divided by the average of domestic time certifi cates of deposit of $100 thousand or more. From March 31, 1997, time deposits open accounts; are included.
All Other Time Deposits
Interest on all domestic time deposits of less than $100,000 and open-account time deposits of $100,000 or more, divided by the average of such deposits. From March 31, 1997 forward, time deposit open accounts not included.
Foreign Offi ce Deposits
Interest on deposits in foreign offi ces, Edge and Agreement subsidiaries and IBF’s divided by the average for such deposits. Available for banks fi ling call form 031.
Federal Funds Purchased & Repos
The expense of federal funds purchased and securities sold under agreements to repurchase divided by the average of federal funds purchased and securities sold under agreements to repurchase.
Other Borrowed Money
Interest on demand notes (note balances) issued to the U.S. Treasury and on other borrowed money divided by the average of interest-bearing demand notes (note balances) issued to the U.S. Treasury and other liabilities for borrowed money.
Subordinated Notes & Debentures
Interest on notes and debentures subordinated to deposits divided by the average of notes and debentures subordinated to deposits.
All Interest-Bearing Funds
Interest on all interest-bearing deposits in domestic offices, interest-bearing foreign office deposits, demand notes (note balances) issued to the U.S. Treasury, other borrowed money, subordinated notes and debentures, and expense on federal funds purchased and securities sold under agreements to repurchase, interest expense on mortgage and capitalized leases divided by the average of the liabilities or funds that generated those expenses.
UBPR User’s Guide • December 2008 III-13

CERT # CHARTER #
DIST/RSSD COUNTY BALANCE SHEET - ASSETS, LIABILITIES AND CAPITAL ($000) PAGE 04
PERCENT CHANGE 06/30/2008 06/30/2007 12/31/2007 12/31/2006 12/31/2005 1 QTR 1 YEAR
ASSETS REAL ESTATE LOANS 77,578,050 83,807,911 81,546,155 84,680,338 78,452,819 -3.09 -7.43 COMMERCIAL LOANS 30,093,522 25,696,946 26,211,424 27,108,340 25,473,574 6.29 17.11 INDIVIDUAL LOANS 12,820,677 12,569,323 12,923,881 12,973,537 15,250,527 1.38 2.00 AGRICULTURAL LOANS 91,702 99,283 107,248 118,107 118,338 -13.92 -7.64 OTHER LN&LS IN DOMESTIC OFFICES 9,634,403 9,296,265 11,520,740 8,486,200 9,241,436 -4.06 3.64 LN&LS IN FOREIGN OFFICES 0 0 0 0 0 N/A N/A LOANS HELD FOR SALE 5,186,141 12,356,706 8,750,379 11,659,728 13,695,613 -24.39 -58.03 LOANS NOT HELD FOR SALE 125,032,213 119,113,022 123,559,069 121,706,794 114,841,081 0.59 4.97
LN&LS ALLOWANCE 1 668 775 1 049 117 1 281 213 1 043 245 1 026 834 8.07 59.06 NET LOANS & LEASES 128,549,579 130,420,611 131,028,235 132,323,277 127,509,860 -0.82 -1.43 U S TREASURY & AGENCY SECURITIES 9,684,218 9,596,175 9,564,863 15,683,563 16,877,470 1.24 0.92 MUNICIPAL SECURITIES 969,854 971,933 1,006,845 971,882 881,719 -15.86 -0.21 FOREIGN DEBT SECURITIES 4 800 4 800 4 800 4 800 4 800 0.00 0.00 ALL OTHER SECURITIES 2,076,558 1,852,254 3,092,593 6,181,593 6,283,409 -19.86 12.11 INTEREST-BEARING BANK BALANCES 5,410 13,643 9,916 11,658 8,805 -7.49 -60.35 FEDERAL FUNDS SOLD & RESALES 2,810,477 2,098,597 2,567,769 5,303,335 3,552,318 TRADING ACCOUNT ASSETS 7 586 997 12 012 798 7 199 765 1 735 068 1 660 730 -3.81 -36.84 TOTAL INVESTMENTS 23,138,314 26,550,200 23,446,551 29,891,899 29,269,251 TOTAL EARNING ASSETS 151,687,893 156,970,811 154,474,786 162,215,176 156,779,111
NONINT CASH & DUE FROM BANKS 3 527 809 4 256 467 4 272 366 4 486 422 4 977 493 -12.95 -17.12 PREMISES, FIX ASSTS, CAP LEASES 1,291,265 1,716,159 1,379,680 1,760,028 1,617,839 -0.25 -24.76 OTHER REAL ESTATE OWNED 358,453 160,557 242,063 97,892 38,043 12.76 123.26 INV IN UNCONSOLIDATED SUBS 3,627 0 3,666 0 0 ACCEPTANCES & OTH ASSETS 14,631,806 13,963,152 14,734,965 14,028,638 13,818,804 -7.19 4.79 TOTAL ASSETS 171,500,853 177,067,146 175,107,526 182,588,156 177,231,290 -1.84 -3.14 AVERAGE ASSETS DURING QUARTER 168,682,848 175,010,458 169,674,500 181,124,691 172,962,613 -1.31 -3.62
LIABILITIES DEMAND DEPOSITS 9,466,361 9,472,361 9,501,787 10,166,559 10,643,400 -1.04 -0.06 ALL NOW & ATS ACCOUNTS 2,182,323 1,657,925 1,921,197 1,476,750 1,653,918 -2.79 31.63 MONEY MARKET DEPOSIT ACCOUNTS 58,220,524 53,771,242 57,395,718 54,656,968 57,926,598 -1.52 8.27 OTHER SAVINGS DEPOSITS 3,966,450 4,698,516 3,917,099 5,198,980 5,423,878 -0.59 -15.58 TIME DEP UNDER $100M 15 931 309 16 568 240 17 097 331 16 642 446 13 225 322 -4.62 -3.84 CORE DEPOSITS 89,766,967 86,168,284 89,833,132 88,141,703 88,873,116 -2.03 4.18 TIME DEP OF $100M OR MORE 24,509,150 28,411,225 24,239,495 30,412,961 24,756,238 5.92 -13.73 DEPOSITS IN FOREIGN OFFICES 6,604,586 10,546,491 5,675,306 8,016,517 9,995,269 71.30 -37.38 TOTAL DEPOSITS 120 880 703 125 126 000 119 747 933 126 571 181 123 624 623 1.91 -3.39 FEDERAL FUNDS PURCH & RESALE 8,620,190 10,470,385 10,408,376 16,095,806 12,691,947 FED HOME LOAN BOR MAT < 1 YR 634,874 1,248,770 1,629,769 100,630 825,286 -59.40 -49.16 FED HOME LOAN BOR MAT > 1 YR 7,791,546 6,272,543 8,057,404 7,791,863 8,349,578 -1.60 24.22 OTH BORROWING MAT < 1 YR 405 543 500 690 500 350 0 3 093 039 -18.93 -19.00 OTH BORROWING MAT > 1 YR 6,819,215 6,618,949 6,938,843 5,412,990 2,627,290 -12.07 3.03 ACCEPTANCES & OTHER LIABILITIES 3,711,471 4,103,573 4,858,999 3,838,700 4,057,502 -19.67 -9.56 TOTAL LIABILITIES (INCL MORTG) 148,863,542 154,340,910 152,141,674 159,811,170 155,269,265 -1.55 -3.55 SUBORD NOTES AND DEBENTURES 3 334 741 3 391 247 3 312 078 3 446 917 3 696 687 -6.75 -1.67 ALL COMMON & PREFERRED CAPITAL 19,302,570 19,334,989 19,653,774 19,330,069 18,265,338 -3.17 -0.17 TOTAL LIBILITIES & CAPITAL 171,500,853 177,067,146 175,107,526 182,588,156 177,231,290 -1.84 -3.14 MEMORANDA OFFICER, SHAREHOLDER LOANS (#) 10 13 12 14 12 OFFICER, SHAREHOLDER LOANS ($) 89,161 167,178 170,044 282,038 331,871 -46.72 -46.67 NON-INVESTMENT ORE 308,897 124,388 204,020 75,022 38,043 13.03 148.33 HELD-TO-MATURITY SECURITIES 0 0 0 0 0 N/A N/A AVAILABLE-FOR-SALE-SECURITIES 12,735,430 12,425,162 13,669,101 22,841,838 24,047,398 -4.35 2.50 ALL BROKERED DEPOSITS 15,301,426 16,659,978 14,661,667 18,150,059 15,644,932 8.89 -8.15
UBPR User’s Guide • December 2008 III-14

UBPR Page 04
Balance Sheet—Assets, Liabilities and Capital ($000)
This page presents end-of-period figures to facilitate comparison of asset and liability composition from period to period. The major components of total assets have been aligned into earning and nonearning asset categories to facilitate earning asset analysis.
Annual and one-quarter percentage changes are provided for most of the data presented on this page. The annual changes are the percent change from the prior year comparable quarter to the current quarter. One quarter change is the percent change from the immediate prior quarter to the current quarter.
Data on this page comes from Report of Condition schedules RC, RC-B, RC-C, RC-D and RC-E.
There is a single version of this page for all banks.
Assets
Real Estate Loans
Total of domestic-office loans secured by real estate.
Commercial Loans
Total of domestic-offi ce commercial and industrial loans, loans to depository institutions, acceptances of other banks, and obligations (other than securities) of states and political subdivisions.
Individual Loans
Domestic-offi ce loans to individuals for household, family and other personal expenditures.
Agricultural Loans
Total domestic-office loans to fi nance agricultural production and other loans to farmers.
Other Loans and Leases in Domestic Offi ces
All other loans, and all lease-financing receivables, in domestic offi ces.
Loans and Leases in Foreign Offi ces
All loans and leases in foreign offices. NA appears for banks without foreign offi ces.
Loans Held For Sale
Loans and leases held for sale as reported on schedule RC is available from Mach 31, 2001 forward.
Loans Not Held For Sale
Loans and leases not held for sale as reported on schedule RC is available from March 31, 2001 forward. For prior quarters total loans and leases are displayed.
Less: Loan and Lease Allowance
The allowance for loan and lease losses.
Net Loans and Leases
Gross loans and leases, less allowance and reserve and unearned income. Note that this fi gure includes loans held for sale as reported on schedule RC.
Memo: Unearned Income
Unearned income, and the total of loan and lease loss reserves and transfer risk reserves, are subtracted from Gross Loans and Leases.
U.S. Treasury and Agency Securities
Total of U.S. Treasury securities and U.S. Government agency and corporation obligations.
Municipal Securities
Securities issued by states and political subdivisions in the U.S.
Foreign Securities
All debt and equity foreign securities.
All Other Securities
All other domestic securities, including holdings of private certifi cates of participation in pools of residential mortgages.
Interest-Bearing Bank Balances
Interest-bearing balances due from depository institutions.
Federal Funds Sold and Resales
Federal funds sold and securities purchased under agreements to resell.
Trading Account Assets
Total assets held in trading accounts.
Total Investments
Sum of all securities, interest-bearing bank balances, federal funds sold, and trading account assets.
Total Earning Assets
Sum of Net Loans and Leases and Total Investments.
Noninterest-Bearing Cash and Due From Banks
Total currency, coin, and noninterest-bearing balances due from depository institutions.
Premises, Fixed Assets and Capitalized Leases
All premises and fixed assets, including capitalized leases.
Other Real Estate Owned
Includes investment and non-investment other real estate owned.
Investment in Unconsolidated Subsidiaries
Bank’s investment in unconsoli-
UBPR User’s Guide • December 2008 III-15

dated subsidiaries and associated companies.
Acceptances and Other Assets
From schedule RC combines Customers Liability to This Bank on Acceptances (RCFD2155) with Other Assets (RCFD2160) and Intangible Assets (RCFD2143) for all quarters.
Total Assets
Average Assets During Quarter
Average assets for one quarter from Schedule RC-K.
Liabilities
Demand Deposits
Total demand deposits from Schedule RC-E.
All NOW & ATS Accounts
Total transaction accounts minus total demand deposits. This consists of all NOW accounts (including Super NOWs), plus other transaction accounts such as ATS accounts and certain accounts (other than MMDAs) that permit third party payments from RC-E.
MoneyMarket Deposit Accounts (MMDAs)
The amount of MMDAs reported from RC-E.
Other Savings Deposits
Reported total savings deposits, less MMDAs. This comprises all savings deposits other than MMDAs, and includes regular passbook accounts and overdraft protection plan accounts from RC-E.
Time Deposits Under $100 Thousand
Total time deposits of less than $100 Thousand from RC-E.
Core Deposits
The sum of demand deposits, all NOW and ATS accounts, MMDA savings, other savings deposits, and time deposits under $100 thousand.
Time Deposits of $100M or More
Time certificates of deposit of $100 thousand or more plus open-account time deposits of $100 thousand or more from RC-E.
Deposits in Foreign Offi ces
Total deposits in foreign offi ces and Edge and agreement subsidiaries and IBFs.
Total Deposits
Total of all deposit categories previously detailed.
Federal Funds Purchased & Resales
Federal Funds purchased and securities sold under agreements to repurchase.
Federal Home Loan Bank Borrowing Maturing Under 1 Year
From March 31, 2001 forward includes information from schedule RC-M Federal Home Loan Bank Advances with a Remaining Maturity of One Year or Less (RCFD2651).
Federal Home Loan Bank Borrowing Maturing Over 1 Year
From March 31, 2001 forward includes information from schedule RC-M Federal Home Loan Bank Advances with a Remaining Maturity of One to Three Years (RCFDB565) plus Federal Home Loan Bank Advances with a Remaining Maturity of Over Three Years (RCFDB566).
Other Borrowing Maturing Under 1 Year
From March 31, 2001 forward includes information from schedule RC-M Other Borrowed Money with a Remaining Maturity of One Year or Less (RCFDB571) For prior quarters includes Other Borrowed Money with a Remaining Maturity One Year or Less (RCFD2332).
Other Borrowing Maturing Over 1 Year
From March 31, 2001 forward
includes information from schedule RC-M Other Borrowed Money with a Remaining Maturity of One to Three Years (RCFDB567) plus Other Borrowed Money with Remaining Maturity of Over Three Years (RCFDB568) For prior quarters includes Other Borrowed Money with a Remaining Maturity of One to Three years (RCDA547) plus Other Borrowed Money With Remaining Maturity of Over Three Years (RCFDA548).
Acceptances & Other Liabilities
The sum of the bank’s liability on acceptances executed and outstanding, mortgage indebtedness and liability for capitalized leases, and all other liabilities not included above.
Total Liabilities (Including Mortgages)
Total Liabilities (excluding notes and debentures subordinated to deposits).
Subordinated Notes & Debentures
Notes and debentures subordinated to deposits.
All Common & Preferred Capital
All preferred and common stock, surplus, undivided profits and capital reserves, and cumulative foreign currency translation adjustments.
Total Liabilities & Capital
The total of the various liability and capital items listed above.
Memoranda
Officer, Shareholder Loans (#)
The aggregate number officers, directors, principal shareholders and related interests with extensions of credit exceeding $500,000 or 5% of total capital.
Officer, Shareholder Loans ($)
The aggregate amount of loans to officers, directors, principal shareholders and related interests.
UBPR User’s Guide • December 2008 III-16

Non-Investment ORE
All other real estate owned. Excludes direct and indirect investment in real estate ventures. Reported for savings banks only.
Held-To-Maturity Securities
Held-to-maturity securities reported at cost beginning March 31, 1994. This caption reflects total investment securities excluding trading assets for prior periods.
Available-For-Sale Securities
Securities available-for-sale reported at fair value beginning March 31, 1994.
All Brokered Deposits
Total brokered deposits from schedule RC-E.
UBPR User’s Guide • December 2008 III-17

CERT # CHARTER #
DIST/RSSD COUNTY OFF-BALANCE SHEET ITEMS & DERIVATIVES ANALYSIS PAGE 05
PERCENT CHANGE 06/30/2008 06/30/2007 12/31/2007 12/31/2006 12/31/2005 1 QTR 1 YEAR
OUTSTANDING ($000) HOME EQUITY (1-4 FAMILY) 20,146,280 20,258,308 20,424,891 18,959,843 15,712,324 -1.45 -0.55 CREDIT CARD 1 866 073 1 695 432 1 808 527 1 519 682 1 165 686 1.5 10.06 COMMERCIAL RE SECURED BY RE 4,357,215 6,629,272 5,501,284 6,451,700 6,051,264 -6.23 -34.27
1-4 FAMILY RESIDENTIAL 1,971,152 4,100,054 2,968,814 N/A N/A -16.04 -51.92 COMML RE, OTH CONST & LAND 2,386,063 2,529,218 2,532,470 N/A N/A 3.78 -5.66
COMMERCIAL RE NOT SECURED BY RE 832 821 663 074 726 867 735 254 766 754 3.86 25.6 ALL OTHER 56,497,337 54,358,145 54,936,245 71,131,017 66,031,890 -1.51 3.94 SECURITIES UNDERWRITING 0 0 0 0 0 MEMO UNUSED COMMIT W/MAT GT 1 YR 36,599,569 38,569,453 36,634,005 38,356,222 37,633,546 2.06 -5.11
STANDBY LETTERS OF CREDIT 17,968,799 15,690,967 15,838,741 13,042,308 13,594,551 11.13 14.52 AMOUNT CONVEYED TO OTHERS 3,960,962 3,474,666 3,268,146 167,731 261,431 18.38 14 COMMERCIAL LETTERS OF CREDIT 131 248 170 457 132 270 123 408 177 260 -9.98 -23
ASSETS SECURITIZED OR SOLD W REC 123,748,341 104,109,136 112,601,626 89,188,715 69,765,105 4.01 18.86 AMOUNT OF RECOURSE EXPOSURE 135,513 138,713 139,473 96,219 53,469 -14.28 -2.31
CREDIT DERIVS BANK AS GTR 1,297,509 302,260 358,012 344,772 664,267 50.76 329.27 CREDIT DERIVS BANK AS BENEF 1,806,222 662,419 819,437 634,419 902,947 39.27 172.67
ALL OTH OFF-BALANCE SHEET ITEMS 0 112 928 0 5 325 6 629 -100 -100
OFF-BALANCE SHEET ITEMS 228,651,845 204,652,398 213,147,900 202,136,443 174,838,677 2.74 11.73
OUTSTANDING (% OF TOTAL) BANK PG 1 PCT BANK PG 1 PCT BANK PG 1 PCT BANK PG 1 BANK PG 1 HOME EQUITY (1-4 FAMILY) 11.75 3.28 94 11.44 3.51 90 11.66 3.32 94 10.38 3.48 8.87 3.46 CREDIT CARD 1.09 1.13 75 0.96 1.12 72 1.03 1.09 72 0.83 1.10 0.66 1.18 COMMERCIAL RE SECURED BY RE 2.54 3.69 38 3.74 4.36 47 3.14 4.13 43 3.53 4.18 3.41 3.93
1-4 FAMILY RESIDENTIAL 1.15 0.91 65 2.32 1.19 79 1.70 1.09 71 N/A N/A N/A N/A COMML RE, OTH CONST & LAND 1.39 2.60 30 1.43 2.93 30 1.45 2.80 31 N/A N/A N/A N/A
COMMERCIAL RE NOT SECURED BY RE 0.49 0.16 85 0.37 0.19 79 0.42 0.17 81 0.40 0.17 0.43 0.08 ALL OTHER 32.94 11.59 94 30.70 12.61 88 31.37 12.16 92 38.96 12.27 37.26 11.74
TOTAL LN&LS COMMITMENTS 48.80 23.35 92 47.22 25.70 88 47.63 24.16 91 54.11 25.02 50.63 24.62 SECURITIES UNDERWRITING 0.00 N/A 97 0.00 N/A 96 0.00 N/A 96 0.00 N/A 0.00 N/A
STANDBY LETTERS OF CREDIT 10.48 2.18 95 8.86 2.26 93 9.05 2.12 94 7.14 2.27 7.67 2.14 AMOUNT CONVEYED TO OTHERS 2.31 0.14 96 1.96 0.16 94 1.87 0.16 94 0.09 0.16 0.15 0.15 COMMERCIAL LETTERS OF CREDIT 0.08 0.09 68 0.10 0.08 71 0.08 0.07 69 0.07 0.08 0.10 0.09
ASSETS SECURITIZED OR SOLD W REC 72.16 0.85 98 58.80 0.80 98 64.30 0.92 97 48.85 0.84 39.36 1.08 AMOUNT OF RECOURSE EXPOSURE 0.08 0.12 74 0.08 0.12 75 0.08 0.14 73 0.05 0.11 0.03 0.11 CREDIT DERIVS BANK AS GTR 0.76 0.04 93 0.17 0.01 92 0.20 0.03 91 0.19 0.02 0.37 0.01 CREDIT DERIVS BANK AS BENEF 1.05 0.11 92 0.37 0.07 91 0.47 0.10 90 0.35 0.07 0.51 0.07
ALL OTH OFF-BALANCE SHEET ITEMS 0.00 0.56 75 0.06 0.80 80 0.00 0.55 78 0.00 0.69 0.00 0.55
OFF-BALANCE SHEET ITEMS 133.32 35.66 92 115.58 38.44 91 121.72 37.04 91 110.71 37.05 98.65 38.13
UBPR User’s Guide • December 2008 III-18

UBPR Page 05
Off-Balance Sheet Items
The top part of this page presents the amounts of various selected commitments, contingencies, contracts and other items reported in Report of Condition Schedule RC-L (Commitments and Contingencies) that are not reported as part of the balance sheet of the Report of Condition. Refer to the instructions for the Report of Condition Schedule RC-L for more detailed explanations of the captions appearing on UBPR page 05.
Annual and one-quarter percentage changes are provided for data displayed in dollars presented on this page. The annual changes are the percent change from the prior year comparable quarter to the current quarter. One quarter change is the percent change from the immediate prior quarter to the current quarter.
Page five displays the same captioned items in two different formats. Defi nitions apply to both sections. The top half displays information in dollar format. The bottom half displays the items as a percent of total assets.
Outstanding
Unused commitments on the following categories of loans and securities.
Home Equity (1-4 Family)
Credit Card
Commercial RE Secured by RE
1–4 Family Residential
Commercial Real Estate, Other Construction & Land
Commercial RE Not Secured by RE
All Other
Securities Underwriting
Memo: Unused Commit W/Mat Gt 1 YR
Unused commitments reported the previous 6 categories with an original maturity beyond one year.
Standby Letters of Credit
The amount of outstanding and used standby letters of credit issued by the bank.
Amount Conveyed to Others
The amount of standby letters of credit conveyed to others.
Commercial Letters of Credit
Assets Securitized or Sold W/ Recourse
Recourse exposure for above mortgage pools.
Amount of Recourse Exposure
Principal balance of FNMA, FHLMC, Private and Farmer Mac mortgage pools transferred with recourse.
Credit Derivs Bank as Guarantor
Credit Derivatives on which the bank is guarantor, available from June 30, 1997 forward.
Credit Derivs Bank as Benefi ciary
Credit Derivatives on which the bank is beneficiary, available from June 30, 1997 forward.
All Other Off-Balance Sheet Items
Contracts on other commodities and equities, all other off-balance sheet liabilities, participation in acceptances conveyed and acquired, securities borrowed, securities lent, commitments to purchase and sell when-issued securities.
Off-Balance Sheet Items
Sum of all off-balance sheet items listed above.
UBPR User’s Guide • December 2008 III-19

CERT # CHARTER #
DIST/RSSD COUNTY OFF-BALANCE SHEET ITEMS & DERIVATIVES ANALYSIS PAGE 05A
06/30/2008 06/30/2007 12/31/2007 12/31/2006 12/31/2005 NOTIONAL AMOUNT ($000) DERIVATIVE CONTRACTS 265,717,847 198,258,129 201,860,361 145,738,252 114,768,701 INTEREST RATE CONTRACTS 244,082,644 179,453,027 184,509,853 127,820,337 99,678,730 FOREIGN EXCHANGE CONTRACTS 9,236,749 8,128,363 7,055,862 6,282,242 5,435,343 EQUITY, COMM & OTH CONTRACTS 12,398,454 10,676,739 10,294,646 11,635,673 9,654,628
DERIVATIVES POSITION FUTURES AND FORWARDS 69,599,512 65,206,190 52,699,227 30,725,865 21,196,149 WRITTEN OPTIONS 35,265,984 17,531,663 19,186,876 18,228,064 12,772,871
EXCHANGE TRADED 14,731,690 770,485 2,563,844 943,303 206,000 OVER-THE-COUNTER 20 534 294 16 761 178 16 623 032 17 284 761 12 566 871
PURCHASED OPTIONS 30,465,550 17,020,068 13,435,642 15,673,894 8,932,359 EXCHANGE TRADED 15,514,372 1,031,055 3,153,228 1,335,023 391,000 OVER-THE-COUNTER 14,951,178 15,989,013 10,282,414 14,338,871 8,541,359
SWAPS 130 386 801 98 500 208 116 538 616 81 110 429 71 867 322
HELD-FOR-TRADING 218,809,593 114,895,282 146,370,116 100,062,186 79,632,039 INTEREST RATE CONTRACTS 200,321,199 98,288,851 131,312,767 83,504,363 64,728,016 FOREIGN EXCHANGE CONTRACTS 6 822 838 5 929 692 4 762 703 4 922 150 5 249 395 EQUITY, COMM & OTH CONTRACTS 11,665,556 10,676,739 10,294,646 11,635,673 9,654,628 NON-TRADED 46,908,254 83,362,847 55,490,245 45,676,066 35,136,662 INTEREST RATE CONTRACTS 43,761,445 81,164,176 53,197,086 44,315,974 34,950,714 FOREIGN EXCHANGE CONTRACTS 2 413 911 2 198 671 2 293 159 1 360 092 185 948 EQUITY, COMM & OTH CONTRACTS 732,898 0 0 0 0 MEMO MARKED-TO-MARKET 46,908,254 83,362,847 55,490,245 45,676,066 35,136,662
DERIVATIVE CONTRACTS (RBC DEF ) 175,837,321 143,389,945 154,720,064 115,572,003 97,598,092 ONE YEAR OR LESS 54,892,018 51,321,439 47,188,078 38,427,006 30,827,893 OVER 1 YEAR TO 5 YEARS 83,967,409 61,135,459 72,271,487 44,939,269 37,083,610 OVER 5 YEARS 36 977 894 30 933 047 35 260 499 32 205 728 29 686 589
GROSS NEGATIVE FAIR VALUE 2,302,025 2,592,586 2,897,797 1,863,111 1,657,778 GROSS POSTIVE FAIR VALUE 3,167,705 2,280,962 3,240,733 1,578,880 1,637,033 HELD-FOR-TRADING 2 433 782 2 044 516 2 638 387 1 454 670 1 535 733 NON-TRADED 733,923 236,446 602,346 124,210 101,300 MEMO MARKED-TO-MARKET 733,923 236,446 602,346 124,210 101,300 CURR CREDIT EXP ON RBC DERIV CONTR 1,528,166 2,280,962 3,240,733 1,578,880 1,637,033 CREDIT LOSSES OFF-BS DERIVS 0 0 0 0 120
PAST DUE DERIV INSTRUMENTS FAIR VALUE CARRIED AS ASSETS 0 0 0 0 0
IMPACT NONTRADED DERIV CONTRACTS INCREASE (DECR) IN INTEREST INC N/A N/A N/A N/A -18,653 INCREASE (DECR) IN INTEREST EXP N/A N/A N/A N/A -47,793
INCREADE (DECR) IN NONINT ALLOC N/A N/A N/A N/A 0 INCREASE (DECR) IN NET INCOME N/A N/A N/A N/A -66,446
UBPR User’s Guide • December 2008 III-20

UBPR Page 05A
Derivative Instruments
This page presents the amounts of derivatives and related information in thousands of dollars. The information comes mostly from call schedule RC-L Off-Balance Sheet Items, but also from schedules RC-M Memoranda, RC-N Past Due and Nonac crual Loans Leases and Other Assets, RC-R Regulatory Capital and the RI report of income memoranda section. Derivatives are summarized in several ways using the position indicators in the RC-L matrix. Data on this page is available from the March 31, 1995 call report forward unless otherwise noted.
Notional Amount ($000)
Derivative Contracts
From March 31, 2001 forward the sum of RC-L items 12 and 13.a, all columns. From March 31, 2001 and prior the total of all derivative contracts, or the sum of RC-L items 15 and 16.a and 16.b, columns A through D. All interest rate, foreign exchange, equity, commodity and other contracts are combined.
Interest Rate Contracts
For quarters from March 31, 2001 forward the sum of RC-L items 14.a through e, column A. For quarters prior to March 31, 2001 total interest rate contracts, or the sum of RC-L items 14.a through e, column A.
Foreign Exchange Contracts
For quarters from March 31, 2001 forward total foreign exchange contracts, or the sum of RC-L items 11.a through e., column B. For prior quarters total foreign exchange contracts, or the sum of RC-L items 14.a through e, column B.
Equity, Commodity & Other Contracts
For quarters from March 31, 2001 forward total equity, commodity and
other contracts, or the sum of RC-L items 11.a through e, columns C. and D. For prior quarter’s total equity, commodity and other contracts, or the sum of RC-L items 14.a through e, columns C and D.
Derivatives Position
Futures and Forwards
For quarters from March 31, 2001 forward total futures and forward contracts, or the sum of RC-L items 11.a and 11.b, columns A through D. For prior quarters total futures and forward contracts, or the sum of RC-L items 14.a and 14.b, columns A through D.
Written Options
For quarters from March 31, 2001 forward total written options both exchange traded and over-thecounter, or the sum of RC-L items 11.c.1 and 11.d.1, columns A through D. For prior quarters total written options both exchange traded and over-the-counter, or the sum of RC-L items 14.c.1 and 14.d.1, columns A through D.
Exchange Traded
For quarters from March 31, 2001 forward total written options which are exchange traded, or the sum of RC-L items 11.c.1, columns A through D. For prior quarters total written options which are exchange traded, or the sum of RC-L items 14.c.1, columns A through D.
Over-The-Counter
For quarters from March 31, 2001 forward total written options which are traded over-the-counter, or the sum of RC-L items 11.d.1, columns A through D. For prior quarters total written options which are traded over-the-counter, or the sum of RC-L items 14.d.1, columns A through D.
Purchased Options
For quarters from March 31, 2001
forward total purchased options both exchange traded and over-thecounter, or the sum of RC-L items 11.c.2 and 11.d.2, columns A through D. For quarters prior total purchased options both exchange traded and over-the-counter, or the sum of RC-L items 14.c.2 and 14.d.2, columns A through D.
Exchange Traded
For quarters from March 31, 2001 forward total purchased options which are exchange traded, or the sum of RC-L items 11.c.2 columns A through D. For quarters prior total purchased options which are exchange traded, or the sum of RC-L items 14.c.2 columns A through D.
Over-The-Counter
For quarters from March 31, 2001 forward total purchased options which are traded over-the-counter, or the sum of RC-L items 11.d.2 columns A through D. For prior quarters total purchased options which are traded over-the-counter, or the sum of RC-L items 14.d.2 columns A through D.
Swaps
For quarters from March 31, 2001 forward total swaps, or the sum of RC-L items 11.e, columns A through D. For prior quarters total swaps, or the sum of RC-L items 14.e, columns A through D.
Held-For-Trading
For quarters from March 31, 2001 forward total derivative contracts held for trading, or the sum of RC-L item 12, columns A through D. For prior quarters total derivative contracts held for trading, or the sum of RC-L item 15, columns A through D.
Interest Rate Contracts
For quarters from March 31, 2001 forward total interest rate contracts or RC-L item 12, column A. For prior
UBPR User’s Guide • December 2008 III-21

quarters total interest rate contracts or RC-L item 15, column A.
Foreign Exchange Contracts
For quarters from March 31, 2001 forward total foreign exchange contracts, or RC-L item 12, column B. For prior quarters total foreign exchange contracts, or RC-L item 15, column B.
Equity, Commodity and Other Contracts
For quarters from March 31, 2001 forward total equity, commodity and other contracts or the sum of RC-L items 12, columns C and D. For prior quarter’s total equity, commodity and other contracts or the sum of RC-L items 15, columns C and D.
Non-Traded
From March 31, 2001 forward total non-traded derivatives, or the sum of RC-L item 13, columns A through D. For quarter’s prior total non-traded derivatives, or the sum of RC-L items 16.a and b, columns A through D.
Interest Rate Contracts
For quarters from March 31, 2001 forward total non-traded interest rate contracts, or the sum of RC-L item 13, column A. For prior quarters total non-traded interest rate contracts, or the sum of RC-L items 16.a and b, column A.
Foreign Exchange Contracts
For quarters from March 31, 2001 forward total non-traded foreign exchange contracts, or the sum of RC-L item 13, column B. For prior quarters total non-traded foreign exchange contracts, or the sum of RC-L items 16.a and b, column B.
Equity, Commodity and Other Contracts
For quarters from March 31, 2001 forward total non-traded equity, commodity and other contracts, or the sum of RC-L item 13, columns A
and B. For prior quarters total non-traded equity, commodity and other contracts, or the sum of RC-L items 16.a and b, columns A and B.
Memo: Marked-to-Market
For quarters from March 31, 2001 forward total non-traded contracts that are marked-to-market, or the sum of RC-L item 13, columns A through D. For prior quarters total non-traded contracts that are marked-to-market, or the sum of RC-L items 16.a, columns A through D.
Derivative Contracts (RBC Def.)
Total derivative contracts as defi ned for risk-based capital purposes, or the sum of RC-R items 2.a through f, columns A, B and C. For quarters prior to March 31, 2001 this item is available only for banks that answer “yes” to RC-R item 1 or have assets greater then $1 billion or otherwise complete all of RC-R.
One Year or Less
Total derivative contracts maturing one year or less as defined for risk- based capital purposes, or the sum of RC-R memoranda items 2.a through f, column A. For quarters prior to March 31, 2001 this item is available only for banks that answer “yes” to RC-R item 1 or have assets greater then $1 billion or otherwise complete all of RC-R.
Over 1 Year to 5 Years
Total derivative contracts maturing one to five years as defined for risk- based capital purposes, or the sum of RC-R memoranda items 2.a through f, column B. For quarters prior to March 31, 2001 this item is available only for banks that answer “yes” to RC-R item 1 or have assets greater then $1 billion or otherwise complete all of RC-R.
Over 5 Years
Total derivative contracts maturing over five years as defined for risk- based capital purposes, or the sum of RC-R memoranda items 2.a through
f, column C. For Quarters prior to March 31, 2001 this item is available only for banks that answer “yes” to RC-R item 1 or have assets greater then $1 billion or otherwise complete all of RC-R.
Gross Negative Fair Value
For quarters from March 31, 2001 forward total of all derivative contracts with a negative fair value, or the sum of RC-L items 14.a.2, b.2 and c.2, columns A through D. For prior quarters total of all derivative contracts with a negative fair value, or the sum of RC-L items 17.a.2, b.2 and c.2, columns A through D. Not available for banks filing FFIEC 034.
Gross Positive Fair Value
For quarters from March 31, 2001 forward total of all derivative contracts with a positive fair value, or the sum of RC-L items 14.a.1, b.1 and c.1, columns A through D. For prior quarters total of all derivative contracts with a positive fair value, or the sum of RC-L items 17.a.1, b.1 and c.1, columns A through D. Not available for banks filing FFIEC 034.
Held-For-Trading
For quarters from March 31, 2001 forward total of all derivative contracts held-for-trading with a positive fair value, or the sum of RC-L items14. a.1, columns A through D. For prior quarters total of all derivative contracts held-for-trading with a positive fair value, or the sum of RC-L items17. a.1, columns A through D. Not available for banks filing FFIEC 034.
Non-Traded
For quarters from March 31, 2001 forward total of all derivative contracts not held for trading purposes with a positive fair value, or the sum of RC-L items 14.b.1, columns A through D. For prior quarters total of all derivative contracts not held for trading purposes with a positive fair value, or the sum of RC-L items 17. b.1 and c.1, columns A through D. Not available for banks fi ling FFIEC 034.
UBPR User’s Guide • December 2008 III-22

Memo: Marked-to-Market
For quarters from March 31, 2001 forward total of all derivative contracts not held for trading purposes that are marked to market and have a positive fair value, or the sum of RC-L items 14.b.1, columns A through D. For prior quarters total of all derivative contracts not held for trading purposes that are marked to market and have a positive fair value, or the sum of RC-L items 17.b.1, columns A through D. Not available for banks filing FFIEC 034.
Current Credit Exposure on RBC Derivative Contracts
Current credit exposure across all off-balance sheet contracts covered by the risk-based capital standards, or RC-R, memoranda item 1. For quarters prior to March 31, 2001 this item is available only for banks that answer “yes” to RC-R item 1 or have assets greater then $1 billion or otherwise complete all of RC-R.
Credit Losses Off-Balance Sheet Derivatives
Credit losses on off-balance sheet derivatives, or RI, memoranda sec
tion, item 10. For quarters prior to March 31, 2001 this item is available only for banks filing FFIEC call form 031 and 032 from March 31, 1996 forward.
Past Due Derivative Instruments:
Fair Value Carries as Assets 90 Days PD
For quarters prior to March 31, 2001 book value of amounts carried as assets of interest rate, foreign exchange, commodity and other contracts past due 90 days or more, from RC-N memoranda. From March 31, 2001 forward fair value is used.
Impact of Non-traded Derivative Contracts:
Increase (Decrease) in Interest Income
Impact of off-balance sheet derivatives held for purposes other than trading on interest income, or RI memoranda item 9.a. For quarters prior to March 31, 2001 item not available for banks filing FFIEC 034.
Increase (Decrease) in Interest Expense
Impact of off-balance sheet deriva
tives held for purposes other than trading on interest expense or RI memoranda item 9.b. For quarters prior to March 31, 2001 item not available for banks filing FFIEC 034.
Increase (Decrease) in Other Noninterest Allocations
Impact of off-balance sheet derivatives held purposes other than trading on other noninterest allocations or RI memoranda item 9.b. For quarters prior to March 31, 2001 item not available for banks filing FFIEC 034.
Increase (Decrease) in Net Income
Impact of off-balance sheet derivatives held for purposes other than trading on net income or the sum of RI memoranda items 9.a, b & c. For quarters prior to March 31, 2001 not available for banks filing FFIEC 034.
UBPR User’s Guide • December 2008 III-23

CERT # DIST/RSSD OFF-BALANCE SHEET ITEMS & DERIVATIVES ANALYSIS PAGE 05B CHARTER # COUNTY06/30/2008 06/30/2007 12/31/2007 12/31/2006 12/31/2005
PERCENT OF NOTIONAL AMOUNT BANK PG 1 PCT BANK PG 1INTEREST RATE CONTRACTS 91.86 80.59 25 90.51 69.60 28 70.89 27 87.71 68.67 73.25 FOREIGN EXCHANGE CONTRACTS 3.48 4.05 73 3.50 5.93 71 4.74 6.34 EQUITY, COMM, & OTHER CONTR 4.67 1.24 88 5.10 1.48 88 8.41 0.78
BANK PG 1 PCT BANK PG 1 PCT BANK PG 1 91.40 86.85
4.10 6.52 74 4.31 6.54 5.39 1.20 88 7.98 1.23
FUTURES AND FORWARDS 26.19 12.87 77 32.89 18.62 74 26.11 17.65 71 21.08 18.03 18.47 17.54 WRITTEN OPTIONS 13.27 7.37 79 8.84 7.00 68 9.51 7.24 69 12.51 6.37 11.13 7.21 EXCHANGE TRADED 5.54 0.03 97 0.39 0.04 91 1.27 0.04 94 0.65 0.07 0.18 0.01 OVER-THE-COUNTER 7.73 7.01 73 8.45 6.52 71 8.23 6.83 72 11.86 5.60 10.95 6.81 PURCHASED OPTIONS 11.47 4.46 80 8.58 5.29 72 6.66 6.04 68 10.75 5.02 7.78 4.97 EXCHANGE TRADED 5.84 0.05 98 0.52 0.05 90 1.56 0.06 94 0.92 0.09 0.34 0.03 OVER-THE-COUNTER 5.63 4.09 70 8.06 4.84 74 5.09 5.38 67 9.84 4.47 7.44 4.56 SWAPS 49.07 53.44 31 49.68 47.46 39 57.73 50.38 41 55.65 47.97 62.62 51.87
HELD-FOR-TRADING 82.35 34.35 71 57.95 29.70 68 72.51 33.90 70 68.66 28.80 69.38 25.31 INTEREST RATE CONTRACTS 75.39 28.15 78 49.58 20.51 76 65.05 25.34 79 57.30 21.48 56.40 18.29 FOREIGN EXCHANGE CONTRACTS 2.57 1.78 79 2.99 2.72 79 2.36 2.84 75 3.38 3.40 4.57 3.06 EQUITY, COMM & OTH CONTRACTS 4.39 0.26 93 5.39 0.32 93 5.10 0.39 92 7.98 0.30 8.41 0.17 NON-TRADED 17.65 28.35 28 42.05 39.83 31 27.49 32.77 29 31.34 35.34 30.62 38.95 INTEREST RATE CONTRACTS 16.47 33.48 32 40.94 43.17 36 26.35 35.20 35 30.41 38.64 30.45 42.95 FOREIGN EXCHANGE CONTRACTS 0.91 0.24 87 1.11 0.43 86 1.14 0.31 87 0.93 0.43 0.16 0.34 EQUITY, COMM & OTH CONTRACTS 0.28 0.11 89 0.00 0.07 87 0.00 0.11 87 0.00 0.09 0.00 0.14 MEMO MARKED-TO-MARKET 17.65 28.35 28 42.05 39.83 31 27.49 32.77 29 31.34 35.34 30.62 38.95
DERIVATIVE CONTRACTS (RBC DEF ) 66.17 76.15 24 72.32 78.56 24 76.65 80.44 26 79.30 80.04 85.04 81.80 ONE YEAR OR LESS 20.66 19.58 59 25.89 23.17 60 23.38 24.27 55 26.37 22.73 26.86 26.23 OVER 1 YEAR TO 5 YEARS 31.60 31.84 50 30.84 29.96 52 35.80 31.20 53 30.84 29.11 32.31 29.54 OVER 5 YEARS 13.92 16.85 51 15.60 16.82 53 17.47 17.20 55 22.10 19.02 25.87 18.04 GROSS NEGATIVE FAIR VALUE 0.87 1.09 40 1.31 0.63 85 1.44 1.05 72 1.28 0.64 1.44 0.80 GROSS POSTIVE FAIR VALUE 1.19 1.21 54 1.15 0.80 76 1.61 1.17 66 1.08 0.75 1.43 0.67
0.20 0.02 92 0.15 0.02 0.18 0.02 92 0.12 0.02 8.86 1.27 91 7.80 1.28 6.43 0.96 92 3.56 1.06 6.43 0.96 92 3.56 1.06 0.18 0.02 92 0.12 0.02 0.00 N/A 97 0.00 N/A
0.00 N/A 98 0.00 N/A
1.43 0.17 92 0.98 0.19 0.00 N/A 97 0.00 N/A
N/A N/A N/A N/A N/A N/A N/A N/A N/A N/A N/A N/A N/A N/A N/A N/A N/A N/A N/A N/A
BY TIER ONE CAPITAL GROSS NEGATIVE FAIR VALUE (X) 0.18 0.04 89 0.23 0.03 92 0.14 0.02 GROSS POSTIVE FAIR VALUE (X) 0.25 0.04 91 0.26 0.03 92 0.14 0.02
HELD-FOR-TRADING (X) 17.48 1.44 92 11.86 1.29 92 6.80 1.00 NON TRADED (X) 3.75 0.74 92 4.50 0.77 93 3.00 1.11 NON-TRADED MARKED-TO-MKT(X) 3.75 0.74 92 4.50 0.77 93 3.00 1.11
CURR CREDIT EXPOSURE (X) 0.12 0.03 88 0.26 0.03 92 0.14 0.02 CREDIT LOSSES ON DERIVATIVES 0.00 N/A 95 0.00 N/A 97 0.00 N/A PAST DUE DERIVATIVE INSTRUMENTS FAIR VALUE CARRIED AS ASSETS 0.00 N/A 98 0.00 N/A 97 0.00 N/A
OTHER RATIOS CUR CREDIT EXPOSURE/ RISK WT AST 0.94 0.32 86 2.00 0.28 92 1.05 0.18 CREDIT LOSSES ON DERIVS /CR ALLOW 0.00 N/A 95 0.00 0.00 94 0.01 N/A IMPACT OF NONTRADED DERIV CONTRACTS INCR(DEC) INTEREST INC/NET INC N/A N/A N/A N/A N/A N/A -0.92 -0.03 INCR(DEC) INTEREST EXP/NET INC N/A N/A N/A N/A N/A N/A -2.35 0.25 INCR(DEC) NONINT ALLOC/NET INC N/A N/A N/A N/A N/A N/A 0.00 0.02 INCR(DEC) NET INCOME/NET INC N/A N/A N/A N/A N/A N/A -3.27 0.07
UBPR User’s Guide • December 2008 III-24

UBPR Page 05B
Derivatives Analysis
This page presents the amounts of derivatives and related information in percentage format, generally in comparison to total derivatives. The information comes mostly from call schedule RC-L Off-Balance Sheet Items, but also from schedules RC-M Memoranda, RC-N Past Due and Nonac crual Loans Leases and Other Assets, RC-R Regulatory Capital and the RI report of income memoranda section. Derivatives are summarized in several ways using the position indicators in the RC-L matrix. Data on this page is available from the March 31, 1995 call report forward unless otherwise noted. Please refer to page 5a for specific line item defi nitions.
Percent of Notional Amount
Total Derivative Contracts
The total of all derivative contracts, all interest rate, foreign exchange, equity, commodity and other contracts are combined. This item does not appear on page 5B, but is used in computations below.
Interest Rate Contracts
Total interest rate contracts as a percent of total derivative contracts.
Foreign Exchange Contracts
Total foreign exchange contracts as a percent of total derivative contracts.
Equity, Commodity & Other Contracts
Total equity, commodity and other contracts as a percent of total derivative contracts.
Derivatives Position
Futures and Forwards
Total futures and forward contracts as a percent of total derivative contracts.
Written Options
Total written options both exchange traded and over-the-counter as a percent of total derivative contracts.
Exchange Traded
Total written options which are exchange traded as a percent of total derivative contracts.
Over-The-Counter
Total written options which are traded over-the-counter as a percent of total derivative contracts.
Purchased Options
Total purchased options both exchange traded and over-thecounter as a percent of total derivative contracts.
Exchange Traded
Total purchased options which are exchange traded as a percent of total derivative contracts.
Over-The-Counter
Total purchased options which are traded over-the-counter as a percent of total derivative contracts.
Swaps
Total swaps as a percent of total derivative contracts.
Held-For-Trading
Total derivative contracts held for trading as a percent of total derivative contracts.
Interest Rate Contracts
Total interest rate contracts as a percent of total derivative contracts.
Foreign Exchange Contracts
Total foreign exchange contracts as a percent of total derivative contracts.
Equity, Commodity and Other Contracts
Total equity, commodity and other contracts as a percent of total derivative contracts.
Non-Traded
Total non-traded derivatives as a percent of total derivative contracts.
Interest Rate Contracts
Total non-traded interest rate contracts as a percent of total derivative contracts.
Foreign Exchange Contracts
Total non-traded foreign exchange contracts as a percent of total derivative contracts.
Equity, Commodity and Other Contracts
Total non-traded equity, commodity and other contracts as a percent of total derivative contracts.
Memo: Marked-to-Market
Total non-traded contracts that are marked-to-market as a percent of total derivative contracts.
Derivative Contracts (RBC Def.)
Total derivative contracts as defi ned for risk-based capital purposes as a percent of total derivative contracts. For quarters prior to March 31, 2001 this item is computed only for banks that answer “yes” to RC-R item 1 or have assets greater then $1 billion or otherwise complete all of RC-R.
One Year or Less
Total derivative contracts maturing one year or less as defined for risk- based capital purposes as a percent of total derivative contracts. Prior to March 31, 2001 this item is computed only for banks that answer “yes” to RC-R item 1 or have assets greater
UBPR User’s Guide • December 2008 III-25

then $1 billion or otherwise complete all of RC-R.
Over 1 Year to 5 Years
Total derivative contracts maturing one to five years as defined for risk- based capital purposes as a percent of total derivative contracts. Prior to March 31, 2001 this item is computed only for banks that answer “yes” to RC-R item 1 or have assets greater then $1 billion or otherwise complete all of RC-R.
Over 5 Years
Total derivative contracts maturing over five years as defined for risk-based capital purposes as a percent of total derivative contracts. Prior to March 31, 2001 this item is computed only for banks that answer “yes” to RC-R item 1 or have assets greater then $1 billion or otherwise complete all of RC-R.
Gross Negative Fair Value
Total of all derivative contracts with a negative fair value as a percent of total derivative contracts. Prior to March 31, 2001 not computed for banks filing FFIEC 034.
Gross Positive Fair Value
Total of all derivative contracts with a positive fair value as a percent of total derivative contracts. Prior to March 31, 2001 not computed for banks fi ling FFIEC 034.
Percent of Tier One Capital:
(note that most computations involving tier one capital (X) are NOT converted to percent format)
Gross Negative Fair Value (X)
Total of all derivative contracts with a negative fair value divided by tier one capital. Prior to March 31, 2001 not computed for banks fi ling FFIEC 034.
Gross Positive Fair Value (X)
Total of all derivative contracts with a positive fair value divided by tier
one capital. Prior to March 31, 2001 not computed for banks fi ling FFIEC 034.
Held-For-Trading (X)
Total of all derivative contracts heldfor-trading with a positive fair value divided by tier one capital. Prior to March 31, 2001 not computed for banks filing FFIEC 034.
Non-Traded (X)
Total of all derivative contracts not held for trading purposes with a positive fair value divided by tier one capital. Prior to March 31, 2001 not computed for banks filing FFIEC 034.
Non Traded Marked-to-Market (X)
Total of all derivative contracts not held for trading purposes that are marked to market and that have a positive fair value divided by tier one capital. Prior to March 31, 2001 not computed for banks filing FFIEC 034.
Current Credit Exposure on RBC Derivative Contracts (X)
Current credit exposure across all off-balance sheet contracts covered by the risk-based capital standards, or RC-R, memoranda item 1 divided by tier one capital. Prior to March 31, 2001 this item is available only for banks that answer “yes” to RC-R item 1 or have assets greater then $1 billion or otherwise complete all of RC-R.
Credit Losses Off-Balance Sheet Derivatives
Credit losses on off-balance sheet derivatives, or RI, memoranda section, item 10 as a percent of tier one capital. Prior to March 31, 2001 this item is available only for banks fi ling FFIEC call form 031 and 032 from March 31, 1996 forward.
Past Due Derivative Instruments:
Fair Value Carried as Asset 90 Days PD
Prior to March 31, 2001 book value of amounts carried as assets of interest
rate, foreign exchange, commodity and other contracts past due 90 days or more, or RC-N memoranda item 4.a, column B as a percent of tier one capital. For quarters from March 31, 2001 forward fair value used.
Other Ratios:
Current Credit Exposure/ Risk-Weighted Assets
Current credit exposure across all off-balance sheet contracts covered by the risk-based capital standards, or RC-R, memoranda item 1, as a percent of total risk-weighted assets. This ratio is computed only for banks that answer “yes” to RC-R item 1 or have assets greater then $1 billion or otherwise complete all of RC-R.
Credit Losses on Derivatives/Credit Allowance
Credit losses on off-balance sheet derivatives, or RI, memoranda section, item 10 as a percent of the ending balance in the allowance for credit losses, or item RI-B.II.6. This item is calculated only for banks fi ling FFIEC call form 031 and 032 from March 31, 1996 forward.
Impact of Non-Traded Derivative Contracts:
Increase (Decrease) in Interest Income/ Net Income
Impact of off-balance sheet derivatives held for purposes other than trading on interest income, or RI memoranda item 9.a as percent of net income. Computed only for banks fi ling FFIEC call form 031 and 032.
Increase ( Decrease) in Interest Expense/ Net Income
Impact of off-balance sheet derivatives held for purposes other than trading on interest expense, or RI memoranda item 9.b as percent of net income. Computed only for banks fi ling FFIEC call form 031 and 032.
Increase (Decrease) in Other Noninterest Allocations/Net Income
Impact of off-balance sheet deriva-
UBPR User’s Guide • December 2008 III-26

tives held purposes other than trading on other noninterest allocations, or RI memoranda item 9.b as percent of net income. Computed only for banks fi ling FFIEC call form 031 and 032.
Increase (Decrease) in Net Income/Net Income
Impact of off-balance sheet derivatives held for purposes other than trading on net income or the sum of RI memoranda items 9.a, b and c as percent of net income. Computed only for banks filing FFIEC call form 031 and 032.
UBPR User’s Guide • December 2008 III-27

CERT # DIST/RSSD BALANCE SHEET - PERCENTAGE COMPOSITION OF ASSETS AND LIABILITIES PAGE 06 CHARTER # COUNTY 06/30/2008 06/30/2007 12/31/2007 12/31/2006 12/31/2005
ASSETS, PERCENT OF AVG ASSETSLOANS HELD FOR SALELOANS NOT HELD FOR SALE LESS LN&LS ALLOWANCE
NET LOANS & LEASES
INTEREST-BEARING BANK BALANCESFEDERAL FUNDS SOLD & RESALESTRADING ACCOUNT ASSETSHELD-TO-MATURITY SECURITIESAVAILABLE-FOR-SALE SECURITIES
TOTAL EARNING ASSETS
NONINT CASH & DUE FROM BANKSPREMISES, FIX ASSTS & CAP LEASESOTHER REAL ESTATE OWNEDACCEPTANCES & OTHER ASSETS
SUBTOTAL TOTAL ASSETS
STANDBY LETTERS OF CREDIT
LIABILITIES, PERCENT OF AVG ASST DEMAND DEPOSITSALL NOW & ATS ACCOUNTSMONEY MARKET DEPOSIT ACCOUNTSOTHER SAVINGS DEPOSITSTIME DEP LESS THAN $100M
CORE DEPOSITS
TIME DEP OF $100M OR MOREDEPOSITS IN FOREIGN OFFICES
TOTAL DEPOSITSFEDERAL FUNDS PURCH & REPOSTOTAL FED HOME LOAN BORROWINGSTOTAL OTH BORROWINGS MEMO SHT TER N CORE FUNDING
ACCEPTANCES & OTHER LIABILITIES TOTAL LIABILITIES (INCL MORTG)
SUBORDINATED NOTES & DEBENTURESALL COMMON & PREFERRED CAPITAL
TOTAL LIABILITIES & CAPITAL
MEMO ALL BROKERED DEPOSITS INSURED BROKERED DEP
BANK PG 1 PCT BANK PG 1 PCT BANK PG 1 PCT BANK PG 1 BANK PG 1 3.99 0.67 93 6.97 0.81 93 6.20 0.84 93 6.29 0.85 5.75 0.77
71.53 66.53 57 65.75 63.47 43 67.63 64.51 51 66.15 61.79 65.71 60.04 0.86 0.88 47 0.57 0.71 28 0.62 0.75 29 0.58 0.71 0.62 0.73
74.66 67.12 73 72.15 64.85 68 73.21 65.79 70 71.86 63.11 70.84 61.45
0.00 0.52 20 0.01 0.55 29 0.01 0.54 28 0.01 0.52 0.01 0.56 1.50 2.02 64 2.04 2.24 60 1.78 2.13 59 2.61 1.95 3.01 1.93 4.35 0.55 92 6.21 0.41 94 5.43 0.51 92 1.10 0.29 0.97 0.28 0.00 0.81 40 0.00 1.43 40 0.00 1.17 41 0.00 1.55 0.00 1.84 7.62 13.29 23 8.51 15.89 21 8.16 15.32 20 13.22 16.99 14.83 18.93
88.13 89.48 35 88.92 89.99 34 88.59 89.63 37 88.80 89.87 89.66 89.95
2.27 2.27 49 2.35 2.28 57 2.38 2.30 56 2.49 2.45 2.77 2.61 0.76 1.03 38 0.97 1.03 51 0.93 1.10 47 0.93 0.99 0.98 1.05 0.18 0.10 77 0.07 0.05 72 0.09 0.06 73 0.04 0.04 0.02 0.04 8.66 6.67 72 7.70 6.23 71 8.00 6.56 68 7.74 6.18 6.58 5.96
11.87 10.52 64 11.08 10.01 65 11.41 10.37 62 11.20 10.13 10.34 9.97 100.00 100.00 100.00 100.00 100.00 100.00 100.00 100.00 100.00 100.00
9.59 2.16 94 7.59 2.26 91 8.16 2.17 92 7.39 2.25 7.78 2.10
5.47 4.41 63 5.43 5.03 56 5.37 4.85 57 5.76 5.44 6.20 6.10 1.22 1.62 44 0.90 1.63 32 0.94 1.61 34 0.89 1.61 0.96 1.81
33.52 22.81 79 29.95 22.82 67 30.94 24.33 68 30.69 22.44 34.91 23.39 2.28 6.85 30 2.75 7.51 35 2.61 7.08 33 3.01 8.10 3.70 8.67 9.54 13.31 33 9.20 11.77 37 9.43 12.59 35 8.48 9.81 6.65 8.86
52.03 53.97 39 48.23 55.80 27 49.30 55.63 27 48.83 54.06 52.43 54.09
13.79 10.44 70 16.37 11.83 77 15.69 11.64 77 15.77 12.54 10.98 10.54 3.10 1.92 76 4.83 1.74 80 4.23 1.74 80 5.02 1.71 4.58 1.60
68.91 70.03 42 69.43 72.39 37 69.21 72.02 37 69.62 71.49 67.99 69.67 5.61 6.45 47 7.77 6.29 65 6.81 6.64 59 8.48 6.19 8.02 7.06 5.29 5.58 47 4.24 3.97 57 4.76 4.37 57 4.71 4.40 5.64 4.89 4.40 2.18 76 3.23 1.52 79 3.68 1.59 80 2.57 1.67 4.54 2.25
24.07 26.67 46 28.25 24.45 69 26.93 24.42 67 28.36 24.63 24.93 23.59
2.53 1.56 83 2.79 1.62 80 2.77 1.66 81 2.20 1.73 2.24 1.86 86.74 88.82 23 87.46 89.02 23 87.23 88.83 26 87.58 89.22 88.43 89.41
1.96 0.60 84 1.89 0.58 85 1.90 0.60 84 1.99 0.57 2.01 0.57 11.30 10.39 68 10.65 10.21 63 10.87 10.39 63 10.42 10.01 9.56 9.83
100.00 100.00 100.01 100.00 99.99 100.00 99.99 100.00 100.00 100.00
8.44 3.74 81 9.74 3.60 85 9.45 3.49 83 9.69 3.55 6.52 3.01 1.63 3.08 55 0.00 2.76 31 0.59 2.75 47 0.00 2.60 0.00 2.04
DIRECT & INDIRECT INV IN RE 0.00 0.01 79 0.00 0.01 79 0.00 0.01 78 0.00 0.01 0.00 0.01 LOANS HFS AS A % LOANS 5.28 1.04 90 9.59 1.33 92 8.40 1.35 90 8.69 1.38 8.04 1.28
UBPR User’s Guide • December 2008 III-28

UBPR Page 06
Balance Sheet—Percentage Composition of Assets and Liabilities
This page presents the major components of assets, liabilities, and capital as a percentage of total assets. Averages used on this page are a year-to-date average of end-of-period balances, including the prior yearend. Thus, for December, an average would be composed of the balance at December for the prior year, March, June, September and December of the current year. Please note that the averages used on this page are not used for earnings analysis on pages 1, 3 and 12.
Assets, Percent of Average Assets
Loans Held For Sale
Average loans and leases held for sale as reported on schedule RC-C is divided by average total assets. Avaialble from March 31, 2002 forward.
Loans Not Held For Sale
Average loans and leases not held for sale as reported on schedule RC is divided by average total assets. Loans and leases not held for sale are displayed from March 31, 2001 forward while total loans and leases are displayed for earlier quarters.
Less: Loan & Lease Allowance
Average loan and lease allowance divided by average total assets.
Net Loans & Leases
Average loans and lease-fi nancing receivables net of unearned income and loss allowances/reserves divided by average total assets.
Interest-Bearing Bank Balances
Average of all interest-bearing balances due from depository institutions divided by average total assets.
Federal Funds Sold & Resales
Average federal funds sold and securities purchased under agreements to resell divided by average total assets.
Trading Account Assets
Average trading account assets divided by average total assets.
Held-to-Maturity Securities
For March 31, 1994 and subsequent quarters, held-to-maturity securities are included. For prior periods, total securities excluding trading assets are used.
Available-for-Sale Securities
For March 31, 1994 and subsequent quarters, available-for-sale securities are shown.
Total Earning Assets
The sum of the averages for net loans and lease-financing receivables, heldto-maturity and available-for-sale securities, interest-bearing balances due from depository institutions, federal funds sold and resold, and trading-account securities, divided by average total assets.
Noninterest Cash & Due From Banks
Average Noninterest-bearing balances due from depository institutions, plus average currency and coin, divided by average total assets.
Premises, Fixed Assets & Capital Leases
Average bank premises, furniture and fixtures, equipment, and other assets representing bank premises (including capitalized leases) divided by average total assets.
Other Real Estate Owned
Average real estate owned other than bank premises divided by average total assets.
Acceptance & Other Assets
The sum of the average for customers liability to the bank on acceptances outstanding, investments in unconsolidated subsidiaries and associated companies, and all other assets not included above, divided by average total assets.
Subtotal
The amount of noninterest cash and due from depository institutions, premises, and fixed assets (including capitalized leases), other real estate owned, acceptances and other assets divided by average total assets.
Total Assets
The total of the various percentages listed above. In all instances, the fi gure should approximate 100 percent.
Standby Letters of Credit
Average standby letters of credit divided by average total assets.
Liabilities, Percent of Average Assets
Demand Deposits
Average demand deposits divided by average total assets.
All NOW and ATS Accounts
Average NOW and ATS accounts divided by average total assets. See the description of these accounts for UBPR Page 04.
Money Market Deposit Accounts
Average MMDAs divided by average total assets.
Other Savings Deposits
The average of all savings deposits other than MMDAs, divided by average total assets.
Time Deposits Under $100 Thousand
Average total time deposits of less
UBPR User’s Guide • December 2008 III-29

than $100 thousand, divided by average total assets.
Core Deposits
The average of total deposits, less time deposits of $100 thousand or more, less deposits in foreign offi ces, divided by average total assets.
Time Deposits of $100M or More
The sum of the averages for time certifi cates of deposit of $100 thousand or more and other time deposits in amounts of $100 thousand or more divided by average total assets.
Deposits in Foreign Offi ces
The average of total deposits in foreign offices (including both interest-bearing and Noninterest bearing), Edge and agreement subsidiaries, and IBFs, divided by average total assets.
Total Deposits
Sum of all deposit categories above.
Federal Funds Purch & Repos
Average federal funds purchased and securities sold under agreements to repurchase divided by average total assets.
Total Federal Home Loan Bank Borrowings
From March 31, 2001 forward includes information from schedule RC-M Five period average of Federal Home Loan Bank Borrowings with a remaining maturity of under one year
(RCFD2651) plus remaining maturity of one through 3 years (RCFDB565) plus remaining maturity of over three years (RCFDB566) expressed as a percentage of average total assets.
Total Other Borrowings
From March 31, 2001 forward includes information from schedule RC-M Five period average of Other Borrowed Money with a remaining maturity of under one year (RCFDB571) plus remaining maturity of one through 3 years (RCFDB567) plus remaining maturity of over three years (RCFDB568) expressed as a percentage of average total assets. For prior quarters includes Other Borrowed Money with a remaining maturity of under one year (RCFD2332) plus remaining maturity of one through three years (RCFDA547) plus remaining maturity of over three years (RCFDA548).
Memo: Short Term Noncore Funding
See definition on page 4 for this caption.
Acceptances & Other Liabilities
The sum of the averages for the bank’s liability on acceptances executed and outstanding, mortgage indebtedness and liability for capitalized leases, and all other liabilities not included above, divided by average total assets.
Total Liabilities (Including Mortgages)
Average total liabilities (excluding notes and debentures subordinated
to deposits) divided by average total assets.
Subordinated Notes & Debentures
Average notes and debentures subordinated to deposits divided by average total assets.
All Common & Preferred Capital
Average of all preferred and common stock, surplus, undivided profits and capital reserves, and cumulative foreign currency translation adjustments, divided by average total assets.
Total Liabilities & Capital
The total of the various percentages listed above. In all instances, this fi gure should approximate 100 percent.
Memo: All Brokered Deposits
Average total brokered deposits divided by average assets.
Insured Brokered Dep
Average Brokered deposits issued in denominations less than $100,000 or participated out in shares less than $100,000 divided by average assets.
Direct and Indirect Investment in RE
Average direct and indirect investments in real estate ventures divided by average assets.
Loans Held for Sale
Loans held for sale as reported on schedule RC divided by average gross loans.
UBPR User’s Guide • December 2008 III-30

CERT # CHARTER #
DIST/RSSD COUNTY
ANALYSIS OF CREDIT ALLOWANCE AND LOAN MIX PAGE 07
06/30/2008 06/30/2007 12/31/2007 12/31/2006 12/31/2005 CHANGE CREDIT ALLOWANCE ($000) BEGINNING BALANCE 1,281,213 1,043,245 1,043,245 1,026,834 873,107 GROSS CREDIT LOSSES 677,849 196,422 514,039 355,960 314,130
MEMO LOANS HFS WRITEDOWN 0 2,234 2,234 0 0 RECOVERIES 58 199 45 273 91 185 109 835 115 700
NET CREDIT LOSSES 619,650 151,149 422,854 246,125 198,430
PROVISION FOR CREDIT LOSS 1,007,212 161,121 664,922 262,536 176,886 OTHER ADJUSTMENTS 0 -4 100 -4 100 0 175 271
ENDING BALANCE 1,668,775 1,049,117 1,281,213 1,043,245 1,026,834
AVERAGE TOTAL LOANS & LEASES 130,256,741 132,106,959 130,878,107 130,592,332 113,257,245
ANALYSIS RATIOS BANK PG 1 PCT BANK PG 1 PCT BANK PG 1 PCT BANK PG 1 BANK PG 1 LOSS PROVISION TO AVERAGE ASSETS 1.19 0.79 78 0.18 0.16 64 0.38 0.28 72 0.15 0.13 0.11 0.13 RECOVERIES TO PRIOR CREDIT LOSS 22.64 24.78 52 25.44 37.01 39 25.62 41.22 36 34.96 38.27 39.34 37.73
NET LOSS TO AVERAGE TOTAL LN&LS 0.95 0.57 77 0.23 0.20 68 0.32 0.28 67 0.19 0.16 0.18 0.20 GROSS LOSS TO AVERAGE TOT LN&LS 1.04 0.62 77 0.30 0.26 62 0.39 0.35 64 0.27 0.23 0.28 0.28 RECOVERIES TO AVERAGE TOT LN&LS 0.09 0.07 71 0.07 0.07 59 0.07 0.07 61 0.08 0.07 0.10 0.09
LN&LS ALLOW TO LN&LS NOT HFS 1.33 1.43 51 0.88 1.13 20 1.04 1.22 31 0.86 1.13 0.89 1.17 LN&LS ALLOWANCE TO TOTAL LN&LS 1.28 1.41 48 0.80 1.09 19 0.97 1.20 23 0.78 1.09 0.80 1.13 LN&LS ALLOWANCE TO NET LOSSES (X) 1.35 4.18 19 3.47 11.12 24 3.03 7.24 28 4.24 10.82 5.17 10.50 LN&LS ALL TO NONACCURAL LN&LS (X) 0.67 1.72 1.43 3.56 0.90 2.50 2.08 4.16 3.79 3.68
EARN COVER OF NET LN&LS LOSS (X) 2.75 8.62 28 10.72 36.52 34 7.23 17.37 32 13.62 32.42 15.63 35.22
NET LOSSES BY TYPE OF LN&LS REAL ESTATE LOANS 1.22 0.48 85 0.17 0.08 81 0.28 0.13 82 0.06 0.05 0.06 0.05 LOANS TO FINANCE COMML REAL EST 0.02 0.10 79 0.00 0.02 88 0.00 0.07 80 0.00 0.00 0.00 0.00 CONTRUCTION & LAND DEV 0.87 1.07 60 0.02 0.05 61 0.08 0.21 51 0.00 0.03 0.06 0.01 1-4 FAMILY CONSTRUCTION 1.41 1.66 66 0.04 0.06 71 0.11 0.27 55 N/A N/A N/A N/A OTHER CONST & LAND 0.25 0.66 56 0.00 0.04 66 0.04 0.14 59 N/A N/A N/A N/A SECURED BY FARMLAND 0.00 0.02 85 0.00 -0.01 90 0.00 0.01 85 0.00 0.02 0.00 0.01 SINGLE & MULTI FAMILY MORTGAGE 1.54 0.34 91 0.23 0.08 86 0.38 0.12 88 0.08 0.05 0.07 0.05 HOME EQUITY LOANS 2.43 0.48 91 0.52 0.11 93 0.75 0.16 94 0.16 0.08 0.16 0.05 1-4 FAMILY NONREVOLVING 1.21 0.29 91 0.14 0.07 80 0.25 0.10 84 0.05 0.04 0.04 0.06 MULTIFAMILY LOANS 0.00 0.12 68 0.00 0.02 79 0.00 0.05 69 0.00 0.02 0.00 0.02 NONFARM NONRESIDENTIAL MTG 0.02 0.09 55 0.02 0.03 66 0.02 0.05 55 0.02 0.03 0.01 0.04 OWNER OCCUPIED NONFARM NONRESI 0.04 0.07 66 0.00 0.03 64 0.01 0.04 62 N/A N/A N/A N/A OTHER NONFARM NONRESIDENTIAL -0.01 0.09 5 0.05 0.02 81 0.02 0.04 60 N/A N/A N/A N/A RE LOANS IN FOREIGN OFFICES N/A 0.05 N/A N/A 0.03 N/A N/A 0.04 N/A N/A 0.27 N/A -0.04
AGRICULTURAL LOANS 0.00 0.02 78 0.00 0.03 78 0.00 0.06 68 0.00 0.03 0.00 0.02 COMMERCIAL AND INDUSTRIAL LOANS 0.34 0.62 37 0.25 0.27 58 0.30 0.37 55 0.46 0.30 0.13 0.28 LEASE FINANCING 0.02 0.23 50 0.32 0.16 80 0.15 0.22 65 0.02 -0.02 0.50 0.33 LOANS TO INDIVIDUALS 1.13 1.20 55 0.44 0.73 43 0.60 0.86 47 0.33 0.65 0.58 0.92 CREDIT CARD PLANS 2.81 3.37 44 -11.03 2.79 2 0.16 2.44 23 N/A 1.96 N/A 2.08
ALL OTHER LOANS & LEASES 1.01 0.37 84 0.73 0.23 86 0.89 0.34 84 0.82 0.27 0.85 0.22 LOANS TO FOREIGN GOVERNMENTS 0.00 0.06 86 0.00 -0.24 94 0.00 -0.16 94 0.00 0.00 0.00 0.01
UBPR User’s Guide • December 2008 III-31

UBPR Page 07
Analysis of Credit Allowance and Loan Mix
The top portion of this page presents data regarding the allowance for loan and lease financing receivables losses. The dollar figures provide a reconcilement of changes to the reserve from schedule RI-B, and the ratios are provided to highlight trends and permit assessment of the adequacy of the reserve.
The bottom portion of page 7 presents net loan losses by type of loan. For each type of loan, the charge off rate is annualized. Negative values for those ratios indicate net recoveries.
Page 7 A presents a detailed analysis of the loan portfolio mix.
Change: Credit Allowance ($000)
Beginning Balance
Balance of the allowance for possible loan and lease losses at the beginning of the year. From March 31, 1998 includes credit transactions. Prior periods include loan and lease activity only.
Gross Credit Losses
Gross amount of loan and lease losses year to date. From March 31, 1998 includes credit transactions. Prior periods include loan and lease activity only. Note that gross credit losses includes the writedown taken on loans held for sale. This item is added back to allow reconcilement with loan loss data by type of loan as reported on schedule RI-B, section a.
Memo: Loans Held For Sale Writedown
Writedown arising from transfer of loans to a held for sale status as reported on schedule RI-B, section b.
Recoveries
Gross amount of recoveries on previ
ously charged off loans and leases year to date.
From March 31, 1998 includes credit transactions. Prior periods include loan and lease activity only.
Net Credit Losses
Gross loan and lease losses less gross loan and lease recoveries. From March 31, 1998 includes credit transactions. Prior periods include loan and lease activity only.
Provision for Credit Losses
Bank’s provision for possible loan and lease losses charged to current operating expenses for the year to date. From March 31, 1998 includes credit transactions. Prior periods include loan and lease activity only.
Other Adjustments
Amount of other increases (decreases) in the reserve, including changes incident to mergers and absorption. From March 31, 1998 includes credit transactions. Prior periods include loan and lease activity only.
Ending Balance
Beginning balance, minus net loan and lease losses, plus the provision for credit losses and other adjustments. From March 31, 1998 includes credit transactions. Prior periods include loan and lease activity only.
Average Total Loans and Leases
Average total loans for the first reporting period of the year and for each subsequent reporting period divided by the number of reporting periods plus lease financing receivables outstanding as of the last reporting period (December 31) of the preceding year and for each reporting period during the year divided by the number of reporting periods. See Section II, Technical Information, for more information concerning the calculation of averages.
Analysis Ratios
Loss Provision to Average Assets
Provisions for possible credit losses divided by average assets. From March 31, 1998 includes credit transactions. Prior periods include loan and lease activity only.
Recoveries to Prior-Period Losses
Gross credit recoveries in the current year divided by gross credit losses of the preceding year. From March 31, 1998 includes credit transactions. Prior periods include loan and lease activity only.
Net Loss to Average Total Loan & Lease
Gross loan and lease charge offs, less gross recoveries, divided by average total loans and leases. If gross recoveries exceed gross losses, NA is shown at this caption.
Gross Loss to Average Total Loans & Leases
Gross loan and lease losses divided by average total loans and leases.
Recoveries to Average Total Loans & Leases
Gross loan and lease recoveries divided by average total loans and leases.
Loan & Lease Allowance to Loans & Leases Not Held For Sale
Ending balance of the allowance for possible loan and lease losses divided by total loans and lease-financing receivables not held for sale. Available from March 31, 2001 forward.
Loan and Lease Allowance to Total Loans & Leases
The ending balance of the allowance for loan and lease losses divided by total loans and leases.
UBPR User’s Guide • December 2008 III-32

Loan and Lease Allowance to Net Losses (X)
The ending balance of the allowance for loan and lease losses divided by net loan and lease losses. If gross loss recoveries exceed gross losses, NA is shown at this caption.
Loan and Lease Allowance to Nonaccrual Loan & Lease (X)
The ending balance of the allowance for loan and lease losses divided by the aggregate amount of nonaccrual loans and leases.
Earnings Coverage of Net Losses (X)
Net operating income before taxes, securities gains or losses, and extraordinary items, plus the provision for possible loan and lease losses divided by net loan and lease losses. If gross recoveries exceed gross losses, NA is shown at this caption.
Net Losses by Type of Loan and Lease
Each of these ratios consists of the year to date net loss (change offs less recoveries from Schedule RI-B) for that type of loan divided by the year to date average for that type of loan. Charge off rates are annualized. Negative values for these ratios indicate net recoveries. The loan defi nitions follow those used for RI-B. As a consequence averages used will come from 4 period average of schedule RC-K when available or 5 period average from schedule RC-C. Ratio definitions give source of average loans by category of loans.
Real Estate Loans
Average real estate loans from RC-K used.
Loans to Finance Commercial Real Estate
Average loans to fi nance commercial real estate from RC-C.
Construction and Land Dev
Construction and land development loans from schedule RC-C.
1–4 Family Construction
Construction loans secured by 1–4 family properties from schedule RC-C.
Other Construction
Construction loans secured by other real estate properties from RC-C.
Secured by Farmland
Real estate loans secured by farmland from RC-C.
Single and Multifamily Mortgage
One to four and fi ve or more family residential mortgages from RC-C.
Home Equity Loans
Home equity loans on 1–4 family residential mortgages from RC-C.
1–4 Family Nonrevolving
All other loans secured by 1–4 family residential properties from RC-C.
Multifamily Loans
Five or more multifamily residential mortgages from RC-C
Nonfarm Nonresidential Mtg
Nonfarm nonresidential mortgages from RC-C.
Owner Occupied Nonfarm Nonresidential
Loans secured by owner occupied nonfarm nonresidential properties from schedule RC-C.
Other Nonfarm Nonresidential
Loans secured by other nonfarm nonresidential mortgages from schedule RC-C.
RE Loans in Foreign Offi ces
Average real estate loans in foreign offices from RC-C used.
Agricultural Loans
Average agricultural loans from RC-K used.
Commercial and Industrial Loans
Average commercial and industrial loans from RC-K used.
Lease Financing
Average lease financing form RC-K used.
Loans to Individuals
Average loans to individuals from RC-K used.
Credit Card Plans
From March 31, 2001 forward average from RC-K is used for all banks. Prior to March 31, 2001 average credit card loans from RC C for FFIEC 031 and 032 fi lers and RC K for 033 and 034 fi lers.
All Other Loans and Leases
From March 31, 2001 forward for banks filing call form 041 derived from RC-K: average total loans less loans secured by real estate, commercial and industrial loans and loans to individuals. For prior quarters available for banks filing call form 031 and 032.
From March 31, 2001 forward for banks filing call form 031 derived from RC-K: average total loans less loans secured by real estate, commercial and industrial loans, loans to individuals and loans to finance agricultural production.
For quarters prior to March 31, 2001 for banks filing call form 031 or 032 derived from RC-K: average total loans less loans secured by real estate, commercial and industrial loans, loans to individuals and loans to finance agricultural production.
Loans to Foreign Governments
Average loans to foreign governments from RC-C for FFIEC 031 and 032 fi lers.
UBPR User’s Guide • December 2008 III-33

0.0 0.0 0.0 0.0 0.00
CERT # DIST/RSSD ANALYSIS OF LOAN AND LEASE ALLOWANCE AND LOAN MIX PAGE 07A CHARTER # COUNTY 06/30/2008 06/30/2007 12/31/2007 12/31/2006 12/31/2005
LOAN MIX, % AVERAGE GROSS LN&LS BANK PG 1 PCT BANK PG 1CONTRUCTION & DEVELOPMENT 10.25 11.98 48 10.73 11.06 55 9.75 9.66 7.87 1-4 FAMILY CONSTRUCTION 5.49 3.40 72 N/A N/A OTHER CONST & LAND DEVEL 4.75 8.25 35 N/A N/A 1 - 4 FAMILY RESIDENTIAL 40.63 22.59 86 40.66 27.57 HOME EQUITY LOANS 11.61 4.47 89 10.49 5.31 OTHER REAL ESTATE LOANS 9.88 23.33 18 10.10 20.91 FARMLAND 0.11 0.51 40 0.12 0.44 MULTIFAMILY 0.59 1.88 22 0.68 1.99 NONFARM NONRESIDENTIAL 9.18 19.93 18 9.30 17.62
OWNER OCCUPIED NFARM NRESID 6.14 7.38 41 N/A N/A OTHER NONFARM NONRESIDENTIAL 3.04 10.97 14 N/A N/A TOTAL REAL ESTATE 60.75 63.62 37 58.34 62.91
59.57 10.29
BANK PG 1 PCT BANK PG 1 PCT BANK PG 1 10.73 11.75 52 7.59
6.41 3.42 77 6.32 3.46 74 N/A N/A 4.42 7.37 41 4.46 7.91 39 N/A N/A
43.52 24.43 85 42.79 23.80 85 43.01 25.45 10.72 4.44 86 10.94 4.34 88 10.62 4.66 9.54 22.73 21 9.58 23.45 17 9.59 22.97 0.10 0.49 42 0.10 0.51 38 0.11 0.44 0.56 1.82 23 0.55 1.91 22 0.63 2.02 8.88 18.28 22 8.93 19.82 18 8.85 18.15 5.85 6.95 42 5.94 7.53 40 N/A N/A 3.05 10.76 18 3.01 10.82 16 N/A N/A
63.79 64.05 41 63.11 64.51 39 62.35 63.63
0.06 0.22 67 0.06 0.14 73 0.06 0.16 71 0.08 0.17 0.08 0.18 0.08 0.33 54 0.08 0.32 54 0.08 0.34 53 0.09 0.31 0.12 0.32
19.72 19.84 57 18.02 19.06 54 18.07 19.31 51 18.54 18.63 19.76 18.43 9.75 6.22 71 9.68 7.06 65 9.74 6.59 68 10.49 7.17 12.58 8.06 0.28 0.40 73 0.00 0.39 55 0.10 0.39 63 0.00 0.40 0.00 0.41 1.71 0.48 88 1.81 0.46 90 1.77 0.50 89 1.75 0.44 1.99 0.39 0.00 0.49 81 0.00 0.41 81 0.00 0.44 81 0.00 0.43 0.00 0.42 3.78 1.49 82 3.12 1.38 83 3.54 1.43 84 3.57 1.59 4.02 1.32 4.14 1.13 86 3.45 1.18 82 3.63 1.17 84 3.13 1.25 3.11 1.37
0.03 0.00 96 0.02 0.00 94 0.02 0.00 94 0.02 0.00 0.03 0.00 1.22 0.56 79 1.05 0.48 78 1.09 0.50 79 0.95 0.39 1.23 0.30
67.34 38.99 84 65.82 44.42 79 66.73 40.77 82 76.57 43.57 73.53 44.98 0.07 0.63 37 0.13 0.62 40 0.14 0.64 41 0.22 0.64 0.27 0.64 0.05 0.43 38 0.09 0.40 41 0.10 0.42 45 0.15 0.40 0.19 0.39
0.01 0.02 58 0.00 0.00 75 0.01 0.01 78 0.00 0.00 0.00 0.00 0.00 N/A 97 0.00 N/A 97 0.00 N/A 96 0.00 N/A 0.00 N/A
69
0.14 0.03 91 0.04 0.01 86 0.06 0.02 86 0.02 0.01 0.01 0.01
72 0.00 0.00 86 0.00 0.00 93 0.00 0.00 89 0.00 0.00 0.00 N/A
0.0 0.0 0.073 0.01 0.01 0.03 0.00 96 0.02 0.00 96 0.02 0.00 96 0.01 0.00 N/A N/A 0.00 N/A 95 0.00 0.00 94 0.00 N/A 95 0.00 0.00 0.00 0.00
0.18 0.09 80 0.07 0.04 79 0.09 0.05 80 0.04 0.03 0.02 0.03 0.00 0.00 88 0.00 0.00 88 0.00 0.00 88 0.00 0.00 0.00 0.00 0.18 0.10 77 0.07 0.05 72 0.09 0.06 73 0.04 0.04 0.02 0.04
0.10 0.03 85 0.12 0.05 84 0.11 0.04 84 0.14 0.09 0.18 0.08 72.02 6.16 95 63.97 6.16 96 65.33 6.68 95 49.93 6.52 59.38 6.74 0.33 1.48 61 0.35 1.09 65 0.34 1.27 62 0.36 1.01 0.01 1.03
72.45 9.56 93 64.44 9.16 93 65.78 9.97 93 50.43 9.50
FINANCIAL INSTITUTION LOANSAGRICULTURAL LOANSCOMMERCIAL & INDUSTRIAL LOANSLOANS TO INDIVIDUALSCREDIT CARD LOANSMUNICIPAL LOANSFOREIGN OFFICE LOANS & LEASESALL OTHER LOANSLEASE FINANCING RECEIVABLES
SUPPLEMENTAL LOANS TO FOREIGN GOVERNMENTSLOANS TO FINANCE COMML REAL EST
MEMORANDUM (% OF AVG TOT LOANS) LOAN & LEASE COMMITMENTS OFFICER, SHAREHOLDER LOANSOFFICER, SHAREH LOANS TO ASSETS
OTHER REAL ESTATE OWNED % ASSETS CONSTRUCTION & LAND DEVELOPMENT FARMLAND 1-4 FAMILY MULTIFAMILY NONFARM NONRESID FORECLOSED GNMA FOREIGN OFFICES
SUBTOTAL DIRECT AND INDIRECT INV
TOTAL
ASSET SERVICING % ASSETS MORTG SERV W RECOURSEMORTG SERV WO RECOURSEOTHER FINANCIAL ASSETS
TOTAL
UBPR User’s Guide • December 2008 III-34

UBPR Page 07A
Analysis of Loan and Lease Allowance and Loan Mix
Loan Mix % Average Gross Loans
Loans are distributed by category as a percent of average gross loans. Loans are averaged using the ending balance for the prior year-end plus the interim quarters for the current year. Data comes from report of condition schedule RC-C. Details on individual categories are provided only where call items are combined, otherwise report of condition defi nitions apply to individual categories of loans.
If bank has foreign offices (FFIEC 031 filer), then categories represent balances in domestic offices only, with loans booked in foreign offi ces shown as a separate category. Otherwise balances are consolidated for the bank.
Construction and Land Development
1–4 Family Construction
Construction loans secured by 1–4 family properties.
Other Construction
Construction loans secured by other real estate properties.
1–4 Family Residential
Home Equity
Also included in 1–4 family residential.
Other Real Estate Loans
Includes the following categories of loans.
Farmland
Loans secured by farmland.
Multifamily
Secured by multifamily (5 or more) residential properties.
Nonfarm Nonresidential
Owner Occupied Nonfarm Nonresidential
Loans secured by owner occupied nonfarm nonresidential properties.
Other Nonfarm Nonresidential
Loans secured by other nonfarm nonresidential mortgages.
Total Real Estate
Total of previous real estate loan categories.
Financial Institution Loans
Loans to depository institutions.
Agricultural Loans
Loans to Finance agricultural production and other loans to farmers.
Commercial and Industrial Loans
Loans to Individuals
Other loans including single payment, installment.
Credit Card Loans
Municipal Loans
Obligations other than securities to state and local political subdivisions in the U.S.
Acceptances of Other Banks
Foreign Offi ce Loans
For banks filing FFIEC 031 form. Represents the difference between consolidated bank loans and leases and loans and leases in domestic offi ces.
All Other Loans
Other loans, loans for purchasing and carrying securities and loans to foreign governments.
Lease Financing Receivables
Supplemental
The following categories of loans are included in previous loan mix captions.
Loans to Foreign Governments
Loans to foreign governments. Available for all banks from March 31, 2001 forward. Available Prior to March 31, 2001 for FFIEC 033, 032, 031 fi lers. Includes domestic and foreign offi ce loans.
Loans to Finance Commercial Real Estate
Loans to finance commercial real estate, construction and development not secured by real estate.
Memorandum (% of Average Total Loans):
Loan & Lease Commitments
Outstanding commitments to make or purchase loans or to extend credit in the form of lease-fi nancing arrangements divided by average total loans.
Officer, Shareholder Loans
Extension of credit to the bank’s executive officers, principal shareholders, and their related interest as of the report date divided by average total loans.
Officer, Shareholder Loans to Assets
Extension of credit to the bank’s executive officers, principal shareholders, and their related interest divided by total assets.
Other Real Estate Owned % Assets
Provides a distribution of other real estate owned by type property from report of condition RC-M. Average
UBPR User’s Guide • December 2008 III-35

individual categories are divided by average assets.
Construction & Land Development
Construction and land development in domestic offi ces.
Farmland
Farmland in domestic offi ces.
1–4 Family
1–4 Family residential property in domestic offi ces.
Multifamily
Multifamily (5 or more) in domestic offi ces.
Nonfarm Nonresidential
Nonfarm nonresidential properties in domestic offi ces.
Foreign Offi ces
Other real estate owned booked in foreign offices (031 fi lers only).
Forclosed GNMA
Property securing GNMA mortgages.
Subtotal
Sum of above other real estate owned.
Direct and Indirect Investments
Direct and indirect investments in other real estate ventures.
Total
Total of other real estate owned and direct and indirect investment in real estate ventures.
Asset Servicing % Assets
Provides a distribution of asset servicing by type as a percent of average assets.
Mortgages Serviced With Recourse
Available from March 31, 2001 for
ward. Principal balance of mortgages serviced with recourse or other servicer provided enhancements as percent of total assets.
Mortgages Serviced Without Recourse
Available from March 31, 2001 forward. Principal balance of mortgages serviced without recourse or other servicer provided enhancements as percent of total assets.
Other Financial Assets
Available from March 31, 2001 forward. Balance of other fi nancial assets as percent of total assets.
Total
Total of above categories as a percent of total assets.
UBPR User’s Guide • December 2008 III-36

CERT # DIST/RSSD ANALYSIS OF CONCENTRATIONS OF CREDIT PAGE 07B CHARTER # COUNTY 06/30/2008 06/30/2007 12/31/2007 12/31/2006 12/31/2005
LOAN & LSE % TOTAL CAPITALCONTRUCTION & DEVELOPMENT 1-4 FAMILY CONSTRUCTION OTHER CONST & LAND DEVEL1 - 4 FAMILY RESIDENTIAL HOME EQUITY LOANSOTHER REAL ESTATE LOANS FARMLAND MULTIFAMILY NONFARM NONRESIDENTIAL
OWNER OCCUPIED NFARM NRESID OTHER NONFARM NONRESIDENTIAL TOTAL REAL ESTATE
FINANCIAL INSTITUTION LOANSAGRICULTURAL LOANSCOMMERCIAL & INDUSTRIAL LOANSLOANS TO INDIVIDUALSCREDIT CARD LOANSMUNICIPAL LOANSFOREIGN OFFICE LOANS & LEASESALL OTHER LOANSLEASE FINANCING RECEIVABLES
SUPPLEMENTAL LOANS TO FOREIGN GOVERNMENTSLOANS TO FINANCE COMM REAL EST
NONOWNER OCC COMML RE % TOT CAPTOTAL COMML REAL ESTATE % TOT CAP
CONSTRUCTION & DEVEL % TOT LNSNONOWNER OCC COMML RE % TOT LNSTOTAL COMML REAL ESTATE % TOT LNS
BANK PG 1 PCT BANK PG 1 PCT BANK PG 1 PCT BANK PG 1 BANK PG 1 78.84 89.46 50 83.64 82.35 57 81.31 89.25 52 79.60 75.00 67.02 61.46 37.50 25.07 71 49.47 24.07 80 46.71 24.91 76 N/A N/A N/A N/A 41.33 61.43 39 34.17 54.31 42 34.60 60.86 39 N/A N/A N/A N/A
294.33 166.85 86 329.15 173.08 86 325.25 170.77 86 333.57 173.60 333.02 193.26 90.96 34.07 90 82.97 31.69 88 88.01 32.52 89 80.80 31.62 82.73 37.00 77.27 180.88 21 73.37 164.74 23 74.72 176.08 20 72.01 162.80 75.94 155.63 0.81 3.97 39 0.71 3.68 41 0.80 3.87 39 0.84 3.11 0.88 3.24 4.86 14.75 26 4.18 13.37 26 4.22 14.33 22 4.41 13.76 5.45 13.69
71.59 153.89 22 68.49 133.18 24 69.70 149.28 21 66.77 130.54 69.60 125.83 47.19 56.95 45 45.12 50.82 47 46.91 57.01 42 N/A N/A N/A N/A 24.40 85.64 17 23.36 77.30 20 22.78 80.60 18 N/A N/A N/A N/A
450.43 479.30 37 486.16 461.45 49 481.28 476.32 43 485.17 449.20 475.98 447.79
0.61 1.40 71 0.45 0.83 75 0.34 1.09 71 0.49 0.89 0.59 0.88 0.53 2.49 55 0.58 2.37 55 0.63 2.49 56 0.68 2.21 0.72 2.28
161.00 138.72 65 135.02 128.42 55 141.40 135.87 52 141.01 123.80 140.61 121.28 74.44 44.09 72 72.91 48.22 70 76.28 46.32 72 74.33 48.54 92.53 54.55 2.26 2.65 75 0.08 2.61 57 2.07 2.81 73 0.00 2.74 0.00 2.84
13.12 3.61 88 13.59 3.36 91 12.95 3.80 89 13.81 3.17 13.35 2.85 0.00 2.73 81 0.00 2.37 81 0.00 2.76 81 0.00 2.32 0.00 2.37
22.14 9.79 84 25.46 8.76 85 37.28 9.72 91 23.76 8.74 32.67 7.90 33.79 7.51 89 28.47 7.37 88 30.72 7.93 87 24.86 7.51 23.39 8.51
0.20 0.00 96 0.17 0.00 94 0.23 0.00 96 0.16 0.00 0.20 0.01 9.70 3.69 82 8.69 3.33 82 9.08 3.68 79 7.63 2.69 7.56 1.92
117.80 216.98 27 119.87 198.04 30 117.39 210.69 25 N/A N/A N/A N/A 165.00 284.30 26 164.99 259.19 30 164.30 279.17 25 N/A N/A N/A N/A
10.43 11.76 48 10.97 11.35 55 10.41 11.77 50 N/A N/A N/A N/A 15.58 28.67 23 15.72 27.42 28 15.03 28.06 21 N/A N/A N/A N/A 21.82 37.55 26 21.63 35.94 28 21.04 37.24 24 N/A N/A N/A N/A
UBPR User’s Guide • December 2008 III-37

UBPR Page 07B
Analysis of Concentrations of Credit
Loans and Leases as Percentage of Total Capital
Loans are distributed by category as a percent of tier one capital plus the allowance for loan and lease losses. Data for loans comes from call report schedule RC-C, Total Capital comes from RC-R RCFD 3792.
Construction and Land Development
Construction, land development and other land loans (RCON 1415) as a percent of Total Capital RCFD 3792.
1–4 Family Construction
Construction loans secured by 1–4 family properties as a percent of Total Capital RCFD 3792.
Other Construction
Construction loans secured by other real estate properties as a percent of Total Capital RCFD 3792.
1–4 Family Residential
Closed end loans secured by 1–4 family residential properties First liens (RCON 5367) plus Junior liens (RCON 5368) plus Revolving open end loans (RCON 1797) as a percent of Total Capital RCFD 3792.
Home Equity
Revolving open end loans (RCON 1797) as a percent of Total Capital RCFD 3792.
Other Real Estate Loans
Loans secured by farmland (RCON 1420) plus Secured by multifamily residential properties (RCON 1460) plus Secured by nonfarm nonresidential properties (RCON1480) as a percent of Total Capital RCFD 3792.
Farmland
Loans secured by farmland (RCON
1420) as a percent of Total Capital RCFD 3792.
Multifamily
Secured by multifamily residential properties (RCON 1460) as a percent of Total Capital RCFD 3792.
Nonfarm Nonresidentialial
Secured by nonfarm nonresidential properties (RCON 1480) as a percent of Total Capital RCFD 3792.
Owner Occupied Nonfarm Nonresidential
Loans secured by owner occupied nonfarm nonresidential properties as a percent of Total Capital RCFD 3792.
Other Nonfarm Nonresidential
Loans secured by other nonfarm nonresidential mortgages as a percent of Total Capital RCFD 3792.
Total Real Estate
Construction, land development and other land loans (RCON 1415) plus Closed end loans secured by 1–4 family residential properties First liens (RCON 5367) plus Junior liens (RCON 5368) plus Revolving open end loans (RCON1797) plus Loans secured by farmland (RCON 1420) plus Secured by multifamily residential properties (RCON 1460) plus Secured by nonfarm nonresidential properties (RCON 1480) as a percent of Total Capital RCFD 3792.
Financial Institution Loans
For banks filing FFIEC 041 Loans to Commercial Banks in the U.S. (RCON 1288) as a percent of Total Capital RCFD 3792.
For banks filing FFIEC 031 Commercial banks in the U.S. (RCON B531) plus Other depository institutions in the U.S. (RCON B534) plus Banks in foreign countries (RCON B535) as a percent of Total Capital RCFD 3792.
Agricultural Loans
For banks filing FFIEC 031 Loans to finance agricultural production in domestic offices (RCON 1590) as a percent of Total Capital RCFD 3792.
For banks filing FFIEC 041 Loans to finance agricultural production (RCFD 1590) as a percent of Total Capital RCFD 3792.
Commercial and Industrial Loans
For banks filing FFIEC 031 Commercial and Industrial Loans to U.S. addressees in domestic offi ces (RCON 1763) plus Commercial and industrial loans to non-U.S. addressees in domestic offices (RCON 1764) as a percent of Total Capital RCFD 3792.
For banks filing FFIEC 041 Commercial and industrial loans (RCON 1766) as a percent of Total Capital RCFD 3792.
Loans to Individuals
For banks filing FFIEC 031 Credit card plans in domestic offi ces (RCON B538) plus Other revolving credit plans in domestic offices (RCON B539) plus Other consumer loans in domestic offices (RCON 2011) as a percent of Total Capital RCFD 3792.
For banks filing FFIEC 041 Credit card plans (RCON B538) plus Other revolving credit plans (RCON B539) plus Other consumer loans (RCON 2011) as a percent of Total Capaital RCFD 3792.
Credit Card Loans
For banks filing FFIEC 031 Credit card plans in domestic offi ces (RCON B538) as a percent of Total Capital RCFD 3792.
For banks filing FFIEC 041 Credit card plans (RCON B538) as a percent of Total Capital RCFD 3792.
Municipal Loans
For banks filing FFIEC 031 Obliga-
UBPR User’s Guide • December 2008 III-38

tions of states and political subdivisions in the U.S. in domestic offi ces (RCON 2107) as a percent of Total Capital RCFD 3792.
For banks filing FFIEC 041 Obligations of states and political subdivisions in the U.S (RCON 2107) as a percent of Total Capital RCFD 3792.
Acceptances of Other Banks
For banks filing FFIEC 031 or 032 and report dates prior to March 31, 2001 Acceptances of U.S. banks in domestic offices (RCON 1756) plus Acceptances of foreign banks in U.S. offices (RCON 1757) as a percent of Total Capital RCFD 3792.
For banks filing FFIEC 033 and 034 and report dates prior to March 31, 2001 Acceptances of U.S. banks (RCON 1755) as a percent of Total Capital RCFD 3792.
Foreign Offi ce Loans
For banks filing FFIEC 031Total loans and leases consolidated bank (RCFD 2122) less Total loans and leases domestic offices (RCFD 2122) as a percent of Total Capital RCFD 3792.
All Other Loans
For banks filing FFIEC 031 Loans to foreign governments in domestic offices (RCON 2081) plus Loans for purchasing and carrying securities in domestic offices (RCON 1545) plus All other loans (RCON 1564) as a percent of Total Capital RCFD 3792.
For banks filing FFIEC 041 Loans to foreign governments in domestic offices (RCON 2081) plus All other
loans (RCON 1564) as a percent of Total Capital RCFD 3792.
Lease Financing Receivables
For banks filing FFIEC 031 Lease financing receivables in domestic offices (RCON 2165) as a percent of Total Capital RCFD 3792.
For banks filing FFIEC 041 Lease financing receivables (RCON 2165) as a percent of Total Capital 3792.
Supplemental
The following categories of loans are included in previous concentration captions.
Loans to Foreign Governments
For banks filing FFIEC 031 Loans to foreign governments in domestic offices (RCON 2081) as a percent of Total Capital RCFD 3792.
For banks filing FFIEC 041 Loans to foreign governments (RCON 2081) as a percent of Total Capital RCFD 3792.
Loans to Finance Commercial Real Estate
Loans to finance commercial real estate, construction and development not secured by real estate (RCFD 2746) as a percent of Total Capital RCFD 3792.
Construction and Land Development Loans as % of Total Risk-Based Capital
Construction & Land Development Loans (RCON 1415)/Total Risk-based Capital (RCFD or RCON 3792).
Nonowner Occupied Commercial Real Estate Loans as % of Total Risk-Based Capital
Construction & Land Development Loans (RCON 1415) + Multifamily Property Loans (RCON 1460) + Nonowner Occupied Nonfarm Nonresidential Property Loans (RCON F161) + Loans To Finance CRE not secured by Real Estate. (RCON 2746)/Total Risk-Based Capital (RCFD or RCON 3792).
Nonowner Occupied Commercial Real Estate Loans as % of Total Loans
Construction & Land Development Loans (RCON 1415) + Multifamily Loans (RCON 1460) + Other Loans Secured by Nonfarm Nonresidential Properties (RCON F161) + Loans to Finance CRE not secured by Real Estate. (RCON 2746)/Total Loans (RCFD or RCON 2122).
Total Commercial Real Estate Loans as % of Total Risk-Based Capital
Construction & Land Development Loans (RCON 1415) + Multifamily Property Loans (RCON 1460) + Nonfarm Nonresidential Property Loans (RCON 1480) + Loans to Finance CRE not secured by Real Estate. (RCON 2746)/Total Risk-Based Capital (RCFD or RCON 3792).
UBPR User’s Guide • December 2008 III-39

CERT # CHARTER #
DIST/RSSD COUNTY ANALYSIS OF PAST DUE, NONACCRUAL & RESTRUCTURED LOANS & LEASES PAGE 08
06/30/2008 06/30/2007 12/31/2007 12/31/2006 12/31/2005 NONCURRENT LN&LS ($000) 90 DAYS AND OVER PAST DUE 753,535 448,981 610,947 351,460 371,318 TOTAL NONACCRUAL LN&LS 2,499,442 735,899 1,429,242 502,600 270,796
TOTAL NONCURRENT LN&LS 3,252,977 1,184,880 2,040,189 854,060 642,114 LN&LS 30-89 DAYS PAST DUE 1,799,657 1,279,247 1,883,651 1,127,784 938,493
RESTRUCTURED LN&LS 90+ DAYS P/D 1,768 0 0 0 0 RESTRUCTURED LN&LS NONACCRL 0 0 0 0 0 RESTRUCTURED LN&LS 30-89 DAYS PD 23,358 0 0 0 0
CURRENT 1-4 FAMILY RESTRUC LN&LS 105,788 N/A N/A N/A N/A CURRENT OTHER RESTRUCTURED LN&LS 0 0 0 0 139 LOANS SECURED 1-4 RE IN FORECLOSURE 1,034,643 N/A N/A N/A N/A ALL OTHER REAL ESTATE OWNED 308,897 124,388 204,020 75,022 38,043
% OF NONCURR LN&LS BY LN TYPE BANK PG 1 PCT BANK PG 1 PCT BANK PG 1 PCT BANK PG 1 BANK PG 1
REAL ESTATE LNS-90+ DAYS P/D 0.66 0.17 88 0.35 0.09 88 0.47 0.13 91 0.27 0.08 0.25 0.08 -NONACCRUAL 3.02 1.70 80 0.75 0.56 71 1.61 0.88 81 0.45 0.40 0.22 0.35 -TOTAL 3.68 2.03 82 1.11 0.70 76 2.08 1.08 84 0.71 0.54 0.47 0.48 -30-89 DAYS P/D 1.69 1.00 80 0.98 0.61 79 1.67 1.00 82 0.94 0.67 0.51 0.58
LNS FIN COML RE-90+ DAYS P/D 0.00 0.01 85 0.01 0.02 87 0.00 0.00 89 0.00 0.00 0.01 0.00 -NONACCRUAL 0.04 0.27 70 0.02 0.06 78 0.03 0.13 74 0.04 0.03 0.03 0.05 -TOTAL 0.04 0.32 66 0.03 0.16 75 0.03 0.16 70 0.04 0.06 0.04 0.07 -30-89 DAYS P/D 0.07 0.42 65 1.54 0.21 91 0.02 0.27 64 0.08 0.17 0.25 0.28
CONST & LAND DEV-90+ DAYS P/D 1.58 0.20 93 0.15 0.06 82 0.77 0.10 93 0.15 0.03 0.21 0.03 -NONACCRUAL 5.24 4.35 64 0.56 0.69 56 2.17 1.67 66 0.29 0.35 0.22 0.18 -TOTAL 6.82 4.72 71 0.70 0.80 52 2.95 1.85 72 0.44 0.42 0.43 0.26 -30-89 DAYS P/D 3.25 1.52 84 2.11 0.74 89 3.70 1.41 87 2.17 0.72 0.93 0.52
1-4 FAM CONS & L DEV-90+ DAYS 2.93 0.19 97 0.21 0.11 81 1.09 0.15 91 N/A N/A N/A N/A -NONACCRUAL 8.97 6.20 70 0.82 0.79 62 3.26 2.36 65 N/A N/A N/A N/A -TOTAL 11.90 6.62 75 1.03 1.00 60 4.34 2.65 71 N/A N/A N/A N/A -30-89 DAYS P/D 5.80 1.92 89 3.22 1.04 86 6.01 1.72 91 N/A N/A N/A N/A
OTHER CONST & LAND DEV-90+ DAYS 0.36 0.17 81 0.05 0.71 N/A 0.35 1.34 N/A N/A N/A N/A N/A -NONACCRUAL 1.85 3.26 45 0.18 0.57 48 0.71 1.19 48 N/A N/A N/A N/A -TOTAL 2.21 3.62 47 0.23 N/A 44 1.06 N/A 55 N/A N/A N/A N/A -30-89 DAYS P/D 0.94 1.31 50 0.50 N/A 61 0.59 N/A 49 N/A N/A N/A N/A
SINGLE & MULTI MTG-90+ DAYS P/D 0.56 0.18 84 0.47 0.11 89 0.47 0.16 84 0.33 0.12 0.29 0.13 -NONACCRUAL 3.04 1.00 88 0.89 0.46 81 1.74 0.63 86 0.49 0.35 0.19 0.29 -TOTAL 3.59 1.29 88 1.36 0.65 85 2.21 0.89 88 0.82 0.52 0.48 0.47 -30-89 DAYS P/D 1.58 0.93 77 0.82 0.67 65 1.44 0.95 74 0.74 0.72 0.45 0.70
NONFARM/RESI MTG-90+ DAYS P/D 0.05 0.06 69 0.04 0.02 78 0.11 0.04 83 0.09 0.02 0.06 0.02 -NONACCRUAL 0.54 0.78 50 0.35 0.47 49 0.36 0.50 48 0.43 0.42 0.37 0.50 -TOTAL 0.59 0.89 48 0.40 0.51 52 0.47 0.57 53 0.52 0.46 0.44 0.54 -30-89 DAYS P/D 0.44 0.58 50 0.37 0.36 56 0.43 0.50 51 0.51 0.39 0.41 0.36
OWN OCC NFARM NONRE-90+ DAYS P/D 0.05 0.05 72 0.05 0.02 80 0.10 0.04 81 N/A N/A N/A N/A -NONACCRUAL 0.59 0.69 51 0.41 0.47 52 0.36 0.53 48 N/A N/A N/A N/A -TOTAL 0.64 0.77 49 0.45 0.53 52 0.46 0.59 46 N/A N/A N/A N/A -30-89 DAYS P/D 0.47 0.53 54 0.41 0.35 63 0.54 0.44 66 N/A N/A N/A N/A
OTH NONFARM NONRES-90+ DAYS P/D 0.06 0.05 78 0.03 0.02 80 0.12 0.02 88 N/A N/A N/A N/A -NONACCRUAL 0.45 0.78 50 0.26 0.38 53 0.35 0.43 56 N/A N/A N/A N/A -TOTAL 0.51 0.90 48 0.29 0.43 54 0.47 0.50 60 N/A N/A N/A N/A -30-89 DAYS P/D 0.38 0.59 50 0.30 0.33 57 0.19 0.50 32 N/A N/A N/A N/A
UBPR User’s Guide • December 2008 III-40
UBPR Page 08
Analysis of Past-Due, Nonaccrual, and Restructured Loans and Leases
These pages analyze noncurrent debt, consisting of loans and leases in past-due or nonaccrual status, including those that had been restructured; and current restructured debt, consisting of loans and leases that have been restructured and are in compliance with modified terms. Loans are grouped by type of loan, however reporting differences require special treatment of noncurrent loan ratios for banks filing call form 033 and 034 prior to March 31, 2001. From March 31, 2001 forward all banks file past due loan information using the same set of standards.
Ratio Calculation For Banks Filing FFIEC 031 and 032 Prior to March 31, 2001
The loan and lease categories used under this heading correspond to the categories used in report of condition RC-N and RC-C. For each category the percentage is determined by dividing the end-of-period noncurrent loan and lease fi gure by the corresponding loan fi gure from RC-C.
Ratio Calculation For Banks Filing FFIEC 033 and 034 Prior to March 31, 2001
Prior to March 31, 2001 Banks fi ling call forms 033 and 034 are permitted to categorize loans using their own internal system for schedules RC-N and RC-K but not for schedule RC-C. For consistency in defi nition, noncurrent loan and lease ratios use noncurrent loan information from RC-N and outstanding loan data from RC- K. Analysis of these data should be made in conjunction with analysis of other information on loans and leases provided in this report.
Noncurrent LN&LS ($000)
A recap in dollars of noncurrent and
restructured loans and leases by past due status.
90 Days and Over
Loans and leases past due over 90 days and still accruing.
Total Nonaccrual LN&LS
Loans and leases on which interest is no longer being accrued.
Total Noncurrent LN&LS
Sum of previous two categories.
LN&LS 30–89 Days Past Due
Loans and leases past due 30 through 80 days and still accruing interest.
Restructured LN&LS 90+ Days P/D
Restructured loans and leases past due 90 or more days and still accruing interest.
Restructured LN&LS Nonaccrual
Restructured loans and leases on which interest is no longer being accrued.
Restructured LN&LS 30–89 Days P/D
Restructured loans and leases past due 30 through 89 days and still accruing interest.
Current 1–4 Family Restructured LN&LS
Loans secured by 1–4 family properties that have been restructured and are current by the revised terms.
Current Other Restructured LN&LS
Other restructured loan and leases still current by their restructured terms.
Loans Secured by 1–4 RE In Foreclosure
Loans secured by 1–4 family properties in forclosure.
All Other Real Estate Owned
All other real estate owned. Excludes direct and indirect investments in real estate.
% of Noncurr LN&LS by Type
This section presents a distribution of past due loans by type of loan and status of delinquency. In each category of past due loans, e.g. Real Estate Loans 90+ Days Past Due that category is divided by the total for that type of loan, e.g. Real Estate Loans.
The gross loans and leases category refl ects all categories of loans and leases by delinquency to gross loans. See previous description in this section of calculations for specifi c report form types. Details are provided only where specific loan categories are grouped together or where a call report exception applies. The call report defi nition applies otherwise.
Each category of loans displays four types of loan delinquency:
Loans 90+ Days Past Due
Loans on Nonaccrual
Total (of the first two categories)
Loans 30–89 Days Past Due
(Note that loans 30-89 days are NOT a part of the previous total.)
Real Estate Loans
From March 31, 2001 forward includes loans secured by real estate.
For quarters prior to March 31, 2001 for banks filing 033 and 034 includes real estate loans. For banks fi ling 031 and 032 forms includes loans secured by real estate.
Loans Finance Commercial RE
Loans for the purpose of fi nancing commercial real estate from RC-C.
UBPR User’s Guide • December 2008 III-41

Construction & Land Development
Loans secured by real estate for the purpose of construction and lend development from RC-C.
1–4 Family Construction
Construction loans secured by 1–4 family properties.
Other Construction
Construction loans secured by other real estate properties.
Single & Multi Mortgage
Includes loans secured by mortgages
secured by 1–4 and multifamily (5 or more) properties from RC-C.
Nonfarm/Residential Mortgage
Loans secured by mortgages on nonfarm, nonresidential property from RC-C.
Owner Occupied Nonfarm Nonresidential
Loans secured by owner occupied nonfarm nonresidential properties.
Other Nonfarm Nonresidential
Loans secured by other nonfarm nonresidential mortgages.
UBPR User’s Guide • December 2008 III-42

CERT # DIST/RSSD ANALYSIS OF PAST DUE, NONACCRUAL & RESTRUCTURED LOANS & LEASES PAGE 08A CHARTER # COUNTY 06/30/2008 06/30/2007 12/31/2007 12/31/2006 12/31/2005
% OF NONCURR LN&LS BY LN TYPECOML & INDUST LNS-90+ DAYS P/D
-NONACCRUAL -TOTAL -30-89 DAYS P/D
LOANS TO INDIVDLS-90+ DAYS P/D -NONACCRUAL -TOTAL -30-89 DAYS P/D
CREDIT CARD PLANS-90+ DAYS P/D -NONACCRUAL -TOTAL -30-89 DAYS P/D
LEASE FINANCING-90+ DAYS P/D -NONACCRUAL -TOTAL -30-89 DAYS P/D
AGRICULTURAL LNS-90+ DAYS P/D -NONACCRUAL -TOTAL -30-89 DAYS P/D
OTHER LN&LS-90+ DAYS P/D -NONACCRUAL -TOTAL -30-89 DAYS P/D
GROSS LN&LS-90+ DAYS P/D -NONACCRUAL -TOTAL -30-89 DAYS P/D
OTHER PERTINENT RATIOS
NONCUR LN&LS TO-LN&LS ALLOWANCE -EQUITY CAPITAL
%TOTAL P/D LN&LS-INCL NONACCRUALIENC-LOANS TO TOTAL LOANSNONCURR LNS+OREO TO LNS+OREONONCURR RESTRUCT DEBT/GR LN&LSCURR+NONCURR RESTRUCT/GR LN&LSCURRENT RESTRUCT LN&LSLOANS SEC 1-4 FAM RE IN FORCLOSURE AS % TOTAL LOANS SEC 1-4 FAM RE
BANK PG 1 PCT BANK PG 1 PCT BANK PG 1 PCT BANK PG 1 BANK PG 1 0.04 0.07 59 0.04 0.05 62 0.07 0.05 70 0.05 0.05 0.06 0.06 0.37 0.78 34 0.39 0.48 51 0.28 0.50 41 0.39 0.48 0.24 0.58 0.41 0.89 31 0.42 0.56 46 0.35 0.59 38 0.44 0.56 0.30 0.67 0.41 0.70 38 0.64 0.47 66 0.39 0.62 36 0.23 0.48 0.66 0.52
1.79 0.11 97 1.14 0.09 97 1.62 0.11 97 0.87 0.09 1.06 0.14 0.28 0.19 72 0.08 0.12 54 0.29 0.16 78 0.12 0.11 0.19 0.15 2.07 0.36 95 1.22 0.25 94 1.91 0.33 94 0.99 0.23 1.24 0.34 2.59 1.13 88 1.87 1.02 82 2.41 1.26 83 1.74 1.15 2.45 1.16
1.37 0.76 71 0.00 0.53 38 0.00 0.59 38 100.00 0.76 100.00 0.61 0.00 0.32 69 0.00 0.13 73 0.00 0.24 71 0.00 0.15 0.00 0.12 1.37 1.27 57 0.00 0.80 26 0.00 0.97 27 100.00 1.06 100.00 0.86 1.63 1.65 47 0.00 1.61 16 0.00 1.51 21 0.00 1.50 0.00 1.46
0.03 0.02 78 0.00 0.01 74 0.09 0.02 85 0.03 0.02 0.00 0.02 0.24 0.40 61 0.02 0.17 57 0.15 0.23 68 0.22 0.21 0.00 0.29 0.00 0.44 57 0.00 0.20 50 0.00 0.30 65 0.00 0.27 0.00 0.37 0.76 0.68 68 0.58 0.47 66 2.28 0.69 85 1.06 0.47 0.00 0.45
0.00 0.00 85 0.95 0.02 97 0.00 0.02 80 0.38 0.01 0.00 0.00 0.22 0.34 70 0.20 0.37 62 0.19 0.31 68 0.15 0.28 0.04 0.26 0.22 0.36 68 1.15 0.48 82 0.19 0.36 63 0.53 0.30 0.04 0.34 0.01 0.42 55 0.01 0.30 54 0.20 0.23 71 1.04 0.27 1.37 0.31
0.07 0.02 90 0.00 0.02 70 0.04 0.02 80 0.00 0.02 0.00 0.02 0.03 0.14 60 0.02 0.11 58 0.02 0.08 62 0.03 0.06 0.20 0.09 0.10 0.21 63 0.03 0.18 53 0.07 0.15 63 0.03 0.12 0.20 0.16 0.09 0.33 53 0.69 0.33 80 0.02 0.28 44 0.04 0.28 0.14 0.37
0.58 0.16 88 0.34 0.09 87 0.46 0.13 88 0.26 0.09 0.29 0.10 1.92 1.34 72 0.56 0.49 65 1.08 0.72 74 0.38 0.37 0.21 0.39 2.50 1.60 77 0.90 0.62 75 1.54 0.91 80 0.64 0.51 0.50 0.52 1.38 1.02 73 0.97 0.63 79 1.42 0.96 79 0.85 0.72 0.73 0.69
194.93 110.71 84 112.94 57.62 85 159.24 83.77 85 81.87 47.35 62.53 51.16 16.85 11.48 74 6.13 4.19 72 10.38 6.20 78 4.42 3.37 3.52 3.54 3.88 2.67 75 1.87 1.34 75 2.97 1.94 81 1.49 1.30 1.23 1.26 N/A N/A N/A N/A N/A N/A N/A N/A N/A N/A N/A N/A N/A
2.73 1.77 77 0.99 0.69 74 1.69 1.01 81 0.70 0.56 0.53 0.57 0.00 0.01 76 0.00 0.00 82 0.00 0.00 78 0.00 0.00 0.00 0.00 0.09 0.04 81 0.00 0.01 71 0.00 0.02 63 0.00 0.01 0.00 0.02 0.08 0.04 81 0.00 0.00 81 0.00 0.01 77 0.00 0.00 0.00 0.01
2.04 0.44 91 N/A 0.03 80 N/A 0.08 87 N/A N/A N/A N/A
UBPR User’s Guide • December 2008 III-43

UBPR Page 08A
Analysis of Past Due, Nonaccrual & Restructured Loans & Leases Memoranda Information
This section presents additional information for past due real estate loans as well as information on current restructured loans by type.
The additional information on past due real estate loans comes from schedule RC-N memoranda section and applies to all banks. Ratios are calculated by dividing the individual past due loan category by the corresponding balance from RC-C. Two sub-sections provide both dollar and ratio information using the same loan captions. Details are provided only where items are combined, otherwise call report definitions apply. Each category displays loans 90 plus days past due, loans on nonaccrual, total noncurrent and loans 30–89 days past due.
An additional section displays other pertinent ratios including other analyses of past due and restructured loans by type that are current by their revised terms.
% of Noncurr LN&LS by LN Type
Commercial & Industrial Loans
From March 31, 2001 forward includes commercial and industrial loans for all banks. Prior to March 31, 2001 for banks filing FFIEC form 031 and 032 includes commercial and industrial loans. Prior to March 31, 2001 for banks filing FFIEC form 033 and 034 includes commercial, time and demand and all other loans.
Loans to Individuals
From March 31, 2001 forward includes loans to individuals other than credit card plans, for all banks. For banks filing FFIEC form 031 and 032 in quarters prior to March 31, 2001 includes
credit cards and other loans to individuals. For banks filing 033 and 034 in quarters prior to March 31, 2001 includes installment loans.
Credit Card Plans
Credit card and related plans from RC-C.
Foreign Government Loans
For banks filing FFIEC 031 and 032.
Lease Financing
Lease financing receivables from RC-C.
Agricultural Loans
Loans to finance agricultural production. Note that banks with less than $300 million assets report this item subject to a reporting threshold and as a supplement.
Other Loans & Leases
From March 31, 2001 forward for 031 filers includes loans to commercial banks in the US, to other depository institutions in the US, to banks in foreign countries, state and local political subdivisions, for purchasing or carrying securities and all other loans.
From March 31, 2001 forward for 041 filers includes loans to depository institutions, state and local political subdivisions, for purchasing and carrying securities, all other loans and to finance agricultural production.
Prior to March 31, 2001 for banks fi ling FFIEC Form 033 or 034 includes lease-financing receivables. Prior to March 31, 2001 for banks fi ling 031 or 032 includes all other loans, lease financing and loans to foreign governments and institutions.
Gross LN&LS
Summation of all categories of due loans by past due status, divided by gross loans.
Other Pertinent Ratios:
Noncurrent LN&LS to LN&LS Allowance
Total 90+ days past due and nonaccrual loans and leases divided by the allowance for loan and lease losses.
Noncurr LN&LS to Equity Capital
Total 90+ days past due and nonaccrual loans and leases divided by total equity capital.
% Total P/D LN&LS—Incl Nonaccrual
Total 90+ days past due, nonaccrual and 30–89 days past due loans and leases divided by gross loans and leases.
IENC—Loans to Total Loans
Income earned or accrued on loans but not collected divided by gross loans.
Noncurr Lns + OREO to Lns + OREO
Loans and leases 90 days and over past due and still accruing
+ Loans and leases on nonaccrual
+ All other real estate owned (noninvestment)
/ total loans and leases plus all other real estate owned (noninvestment).
Noncurr Restruc Debt/Gr LN&LS
Total restructured debt that is 90+ days past due or on nonaccrual by its revised terms divided by gross loans and leases.
Curr+Noncurr Restruct/Gr LN&LS
Total of restructured loans and leases that are current 90+ days past due, on nonaccrual divided by gross loans and leases.
The following ratios are not made available to the public, since they involve the confidential items on noncurrent restructured debt from
UBPR User’s Guide • December 2008 III-44

Schedule RC-N of the Report of Condition.
Current Restructured Loans and Leases
Total loans and leases restructured and in compliance with modifi ed terms as a percentage of total loans and leases.
Loans Secured by 1–4 Family Real Estate in Foreclosure as % of Total Loans Secured by 1–4 Family RE
Loans secured by 1–4 family real estate in foreclosure as a percent of total loans secured by 1–4 family real estate.
UBPR User’s Guide • December 2008 III-45
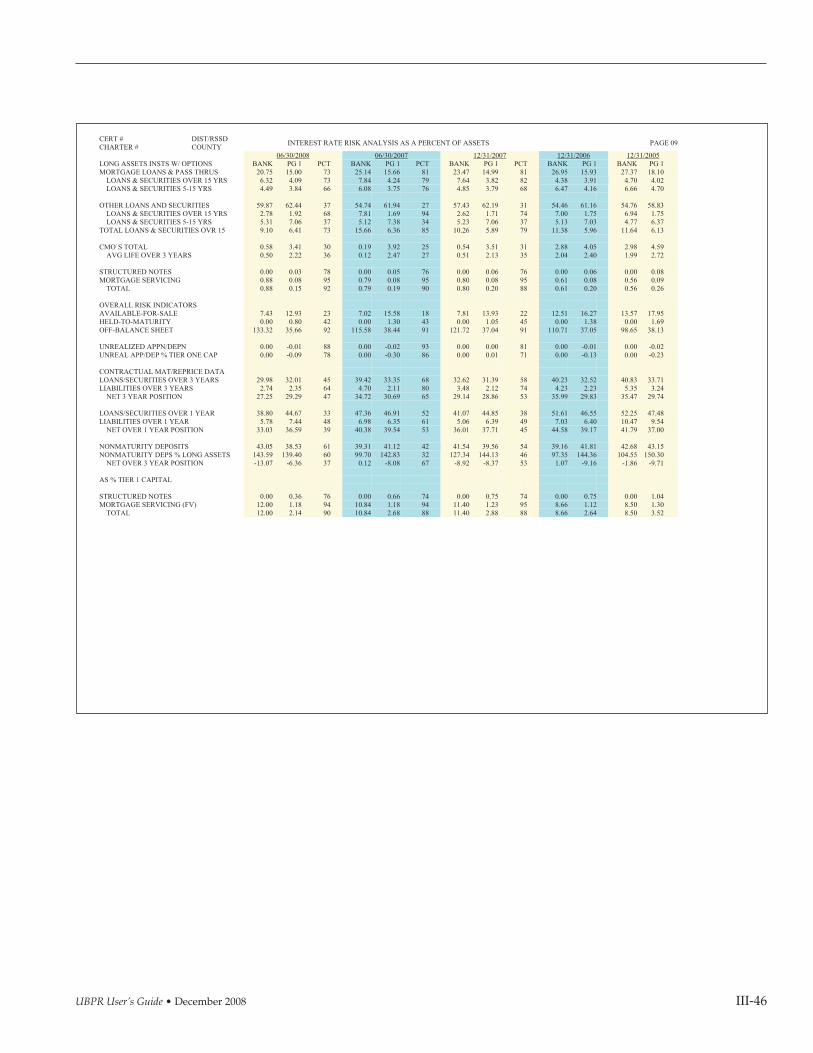
CERT # DIST/RSSD INTEREST RATE RISK ANALYSIS AS A PERCENT OF ASSETS PAGE 09 CHARTER # COUNTY 06/30/2008 06/30/2007 12/31/2007 12/31/2006 12/31/2005
LONG ASSETS INSTS W/ OPTIONSMORTGAGE LOANS & PASS THRUS LOANS & SECURITIES OVER 15 YRS LOANS & SECURITIES 5-15 YRS
OTHER LOANS AND SECURITIES LOANS & SECURITIES OVER 15 YRS LOANS & SECURITIES 5-15 YRSTOTAL LOANS & SECURITIES OVR 15
CMO`S TOTAL AVG LIFE OVER 3 YEARS
STRUCTURED NOTESMORTGAGE SERVICING TOTAL
OVERALL RISK INDICATORS AVAILABLE-FOR-SALEHELD-TO-MATURITYOFF-BALANCE SHEET
UNREALIZED APPN/DEPNUNREAL APP/DEP % TIER ONE CAP
CONTRACTUAL MAT/REPRICE DATA LOANS/SECURITIES OVER 3 YEARSLIABILITIES OVER 3 YEARS NET 3 YEAR POSITION
LOANS/SECURITIES OVER 1 YEARLIABILITIES OVER 1 YEAR NET OVER 1 YEAR POSITION
NONMATURITY DEPOSITSNONMATURITY DEPS % LONG ASSETS NET OVER 3 YEAR POSITION
AS % TIER 1 CAPITAL
STRUCTURED NOTESMORTGAGE SERVICING (FV) TOTAL
BANK PG 1 PCT BANK PG 1 PCT BANK PG 1 PCT BANK PG 1 BANK PG 1 20.75 15.00 73 25.14 15.66 81 23.47 14.99 81 26.95 15.93 27.37 18.10 6.32 4.09 73 7.84 4.24 79 7.64 3.82 82 4.38 3.91 4.70 4.02 4.49 3.84 66 6.08 3.75 76 4.85 3.79 68 6.47 4.16 6.66 4.70
59.87 62.44 37 54.74 61.94 27 57.43 62.19 31 54.46 61.16 54.76 58.83 2.78 1.92 68 7.81 1.69 94 2.62 1.71 74 7.00 1.75 6.94 1.75 5.31 7.06 37 5.12 7.38 34 5.23 7.06 37 5.13 7.03 4.77 6.37 9.10 6.41 73 15.66 6.36 85 10.26 5.89 79 11.38 5.96 11.64 6.13
0.58 3.41 30 0.19 3.92 25 0.54 3.51 31 2.88 4.05 2.98 4.59 0.50 2.22 36 0.12 2.47 27 0.51 2.13 35 2.04 2.40 1.99 2.72
0.00 0.03 78 0.00 0.05 76 0.00 0.06 76 0.00 0.06 0.00 0.08 0.88 0.08 95 0.79 0.08 95 0.80 0.08 95 0.61 0.08 0.56 0.09 0.88 0.15 92 0.79 0.19 90 0.80 0.20 88 0.61 0.20 0.56 0.26
7.43 12.93 23 7.02 15.58 18 7.81 13.93 22 12.51 16.27 13.57 17.95 0.00 0.80 42 0.00 1.30 43 0.00 1.05 45 0.00 1.38 0.00 1.69
133.32 35.66 92 115.58 38.44 91 121.72 37.04 91 110.71 37.05 98.65 38.13
0.00 -0.01 88 0.00 -0.02 93 0.00 0.00 81 0.00 -0.01 0.00 -0.02 0.00 -0.09 78 0.00 -0.30 86 0.00 0.01 71 0.00 -0.13 0.00 -0.23
29.98 32.01 45 39.42 33.35 68 32.62 31.39 58 40.23 32.52 40.83 33.71 2.74 2.35 64 4.70 2.11 80 3.48 2.12 74 4.23 2.23 5.35 3.24
27.25 29.29 47 34.72 30.69 65 29.14 28.86 53 35.99 29.83 35.47 29.74
38.80 44.67 33 47.36 46.91 52 41.07 44.85 38 51.61 46.55 52.25 47.48 5.78 7.44 48 6.98 6.35 61 5.06 6.39 49 7.03 6.40 10.47 9.54
33.03 36.59 39 40.38 39.54 53 36.01 37.71 45 44.58 39.17 41.79 37.00
43.05 38.53 61 39.31 41.12 42 41.54 39.56 54 39.16 41.81 42.68 43.15 143.59 139.40 60 99.70 142.83 32 127.34 144.13 46 97.35 144.36 104.55 150.30 -13.07 -6.36 37 0.12 -8.08 67 -8.92 -8.37 53 1.07 -9.16 -1.86 -9.71
0.00 0.36 76 0.00 0.66 74 0.00 0.75 74 0.00 0.75 0.00 1.04 12.00 1.18 94 10.84 1.18 94 11.40 1.23 95 8.66 1.12 8.50 1.30 12.00 2.14 90 10.84 2.68 88 11.40 2.88 88 8.66 2.64 8.50 3.52
UBPR User’s Guide • December 2008 III-46

UBPR Page 09
Interest Rate Risk Analysis
This page presents information that may be used to assess the interest rate risk inherent in a bank’s balance sheet. Most of the underlying repricing data is reported in the memoranda sections of RC-B, RC-C, RC-E as well as on RC. The analysis emphasizes the long side of the balance sheet and also takes into account the impact of nonmaturity deposits. Most ratios are presented as a percent of total assets. Information on this page is available from June 30, 1997 forward.
Long Assets Instruments with Options
Mortgage Loans & Pass Thrus
Sum of all repricings for mortgage pass-through securities backed by closed-end first lien residential mortgages and closed end loans secured by liens on 1–4 family residential properties divided by total assets.
Loans and Securities Over 15 Years
Sum of repricings over 15 years for above divided by total assets.
Loans and Securities 5 to 15 Years
Sum of repricings from 5 to 15 years for above divided by total assets.
Other Loans and Securities
Sum of all repricings for securities issued by U.S. Treasury, agencies, state and political subdivisions and all loans and leases other than closed-end loans secured by first liens on 1–4 family residential properties divided by total assets.
Loans and Securities Over 15 Years
Sum of repricings over 15 years for above divided by total assets.
Loans and Securities 5 to 15 Years
Sum of repricings from 5 to 15 years for above divided by total assets.
Total Loans and Securities Over 15
Sum of repricings over 15 years for Mortgage Loans and Pass Throughs and Other Loans and Securities divided by assets.
CMO’s Total
Sum of all repricings for other mortgage backed securities (including CMO’s, REMIC’s and stripped MBS) divided by assets.
Avg Life Over 3 Years
Repricings over three years for above divided by assets.
Structured Notes
Structured notes ( included in heldto-maturity and available-for-sale accounts) divided by assets.
Mortgage Servicing
Fair value of mortgage servicing assets divided by assets.
Total
Sum of structured notes, high risk securities, and mortgage servicing divided by assets.
Overall Risk Indicators
Available-For-Sale
Fair value of available-for-sale securities divided by assets.
Held-To-Maturity
Amortized cost of held-to-maturity securities divided by assets.
Off-Balance Sheet
Total of all off-balance sheet accounts, divided by assets.
Unrealized Appn/Depn
Unrealized appreciation/depreciation on held-to-maturity securities divided by assets.
Unrealized App/Dep % Tier One Capital
Unrealized appreciation/depreciation on held-to-maturity securities divided by tier one capital.
Contractual Maturity/ Reprice Data
Loans/Securities Over 3 Years
Sum of repricings over 3 years for mortgage loans and pass-throughs, other loans and securities and CMO’s divided by assets.
Liabilities Over 3 Years
Sum of repricings over 3 years for other borrowed money, time deposits less than $100,000 and time deposits of $100,000 or greater divided by assets.
Net 3 Year Position
Loans/Securities over 3 years less liabilities over 3 years divided by assets.
Loans/Securities Over 1 Year
Sum of repricings over 1 year for mortgage loans and pass throughs, other loans and securities and all CMO’s.
Liabilities Over 1 Year
Sum of repricings over 1 year for other borrowed money, time deposits less than $100,000 and time deposits of $100,000 or greater divided by assets.
Net Over 1 Year Position
Loans/Securities over 1 year less liabilities over 1 year divided by assets.
Nonmaturity Deposits
Demand deposits, NOW and ATS accounts, money market accounts and all other savings divided by assets.
UBPR User’s Guide • December 2008 III-47

Nonmaturity Deposits by Long Assets
Nonmaturity deposits divided by repricings over 3 years for loans and securities.
Net Over 3 Year Position
Repricings over 3 years for loans and securities less nonmaturity deposits divided by assets.
As % Tier 1 Capital
Structured Notes
Structured notes (included in heldto-maturity and available-for-sale accounts) divided by tier one capital.
Mortgage Servicing
Fair value of mortgage servicing assets divided by tier one capital.
Total
Sum of structured notes, high risk securities, OBS exposed to rising rates and mortgage servicing divided by tier one capital.
UBPR User’s Guide • December 2008 III-48

CERT # CHARTER #
DIST/RSSD: COUNTY: LIQUIDITY AND INVESTMENT PORTFOLIO PAGE 10
06/30/2008 06/30/2007 12/31/2007 12/31/2006 12/31/2005 SHORT TERM INVESTMENTS 2,851,833 2,145,112 2,614,497 5,500,233 3,948,269 SHORT TERM ASSETS 26,066,378 26,791,105 26,779,773 28,857,058 24,830,095 SHORT TERM NONCORE FUNDING 41,080,147 49,038,577 43,683,279 52,566,009 47,556,959 NONCORE LIABLILITIES 55,906,853 62,648,560 58,562,927 66,506,224 61,274,059 FED HOME LOAN BOR MAT < 1 YR 634,874 1,248,770 1,629,769 100,630 825,286 FED HOME LOAN BOR MAT > 1 YR 7,791,546 6,272,543 8,057,404 7,791,863 8,349,578 OTH BORROWING MAT < 1 YR 405,543 500,690 500,350 0 3,093,039 OTH BORROWING MAT > 1 YR 6,819,215 6,618,949 6,938,843 5,412,990 2,627,290
DEBT SECURITIES 90+ DAYS P/D 0 0 0 0 0 TOTAL NONCURRENT DEBT SEC 0 0 0 0 0 FAIR VALUE STRUCTURED NOTES 0 0 0 0 0
0 0 0 0 PERCENT OF TOTAL ASSETS BANK PG 1 PCT BANK PG 1 PCT BANK PG 1 PCT BANK PG 1 BANK PG 1 SHORT TERM INVESTMENTS 1 66 5 07 47 1 21 5 33 23 1 49 5 41 37 3 01 5 55 2 23 5 06 MARKETABLE EQUITY SEC (MES) 0 70 0 09 94 0 77 0 09 95 1 10 0 11 95 0 99 0 09 0 83 0 10 CORE DEPOSITS 52 34 54 23 41 48 66 56 09 27 51 30 54 36 35 48 27 54 18 50 15 54 04 S T NONCORE FUNDING 23 95 26 99 47 27 69 24 56 68 24 95 25 72 52 28 79 24 54 26 83 24 16
LIQUIDITY RATIOS NET S T NONCORE FUND DEPENDENCE 27 01 25 33 57 32 81 22 20 77 28 35 23 56 62 30 35 22 23 28 84 22 30 NET NONCORE FUND DEPENDENCE 37 48 38 13 50 42 33 32 73 71 38 62 34 74 59 39 34 33 66 37 91 33 16 BROKERED DEPOSITS TO DEPOSITS 12 66 5 90 78 13 31 5 29 82 12 24 4 92 81 14 34 5 33 12 66 5 07 BROKER DEP MAT < 1YR TO BKR DEPS 96 78 59 21 64 96 01 57 44 65 95 58 61 37 64 96 42 59 53 96 47 54 21 SHORT TRM INV TO S T NCORE FUND 6 94 19 09 47 4 37 23 73 20 5 99 24 33 35 10 46 25 60 8 30 24 07 SHORT TERM ASSET TO S T LIABS 49 72 75 10 27 42 21 76 82 21 47 32 76 89 25 42 89 78 64 44 38 77 74 NET S T LIAB TO ASSETS 15 37 9 71 64 20 71 9 20 77 17 03 9 87 67 21 05 8 60 17 56 9 65 NET LOANS & LEASES TO DEPOSITS 106 34 97 35 70 104 23 91 46 73 109 42 94 26 77 104 54 90 72 103 14 89 61 NET LN&LS TO CORE DEPOSITS 143 20 127 12 71 151 36 122 47 81 145 86 125 24 77 150 13 125 57 143 47 123 57 NET LN&LS & SBLC TO ASSETS 85 43 70 13 89 82 52 68 30 86 83 87 68 71 87 79 61 66 64 79 62 64 87 SECURITIES MIX HELD-TO-MATURITY % TOTAL SECS
US TREAS & GOVT AGENCIES 0 00 0 35 82 0 00 0 83 76 0 00 0 64 80 0 00 1 07 0 00 1 23 MUNICIPAL SECURITIES 0 00 1 62 53 0 00 1 61 53 0 00 1 46 55 0 00 1 65 0 00 1 53
PASS-THROUGH MTG BACKED SECS 0 00 0 61 62 0 00 0 91 63 0 00 0 66 63 0 00 0 93 0 00 1 10 CMO & REMIC MTG BACKED SECS 0 00 0 41 82 0 00 0 58 80 0 00 0 52 81 0 00 0 59 0 00 0 86 ASSET BACKED SECURITIES 0 00 N/A 96 0 00 N/A 97 0 00 N/A 97 0 00 N/A 0 00 N/A OTHER DOMESTIC DEBT SECS 0 00 0 13 80 0 00 0 01 87 0 00 0 02 84 0 00 0 02 0 00 0 04
FOREIGN DEBT SECURITIES 0 00 0 00 87 0 00 0 00 87 0 00 0 00 87 0 00 0 00 0 00 0 00 TOTAL HELD-TO-MATURITY 0 00 6 90 35 0 00 7 70 38 0 00 6 44 39 0 00 8 39 0 00 8 28
AVAILABLE-FOR-SALE % TOTAL SECS US TREASURY & GOVT AGENCIES 4 66 12 87 44 1 97 18 08 23 2 81 15 73 32 6 11 18 89 9 17 19 20 MUNICIPAL SECURITIES 7 62 7 85 59 7 82 6 34 64 7 37 6 60 60 4 25 5 27 3 67 4 43
PASS-THROUGH MTG BACKED SECS 68 15 28 55 92 73 89 24 68 92 65 73 25 03 91 52 01 24 23 48 82 25 63 CMO & REMIC MTG BACKED SECS 7 82 19 88 37 2 76 19 85 31 6 95 19 55 35 22 99 19 76 21 97 20 84 ASSET BACKED SECURITIES 0 40 1 55 74 2 32 1 02 83 1 54 1 42 75 4 87 1 02 6 29 0 97 OTHER DOMESTIC DEBT SECS 1 87 1 58 69 0 21 1 85 53 1 44 1 84 65 1 82 1 86 3 94 1 45
FOREIGN DEBT SECURITIES 0 04 0 13 81 0 04 0 09 79 0 04 0 17 78 0 02 0 11 0 02 0 12 INV MUT FND & OTH MKTBL 9 46 0 81 94 10 98 0 65 98 14 13 0 97 94 7 93 0 78 6 12 0 62
OTHER EQUITY SECURITIES N/A N/A N/A N/A N/A N/A N/A N/A N/A N/A N/A N/A N/A TOTAL AVAILABLE-FOR-SALE 100 00 89 01 99 100 00 87 09 99 100 00 88 92 99 100 00 85 34 100 00 86 15
OTHER SECURITIES RATIOS: APP (DEP) HI RISK & STRUC/T1CAP 0 00 -0 03 96 0 00 -0 07 98 0 00 0 00 93 0 00 -0 04 0 00 -0 08 APP (DEP) IN HTM SEC TO HTM SEC N/A -0 35 N/A N/A -0 92 N/A N/A 0 44 N/A N/A 0 00 N/A -0 03 APP (DEP) IN HTM SEC TO EQY CAP 0 00 -0 07 80 0 00 -0 24 86 0 00 0 01 72 0 00 -0 12 0 00 -0 19 PLEDGED SECURITIES TO TOT SEC 38 31 67 36 14 42 88 63 20 22 38 61 64 67 17 67 71 61 36 69 96 62 29
UBPR User’s Guide • December 2008 III-49

UBPR Page 10
Liquidity and Investment Portfolio
The top portion of this page presents dollar information and ratios that can be used to assess the bank’s liquidity position. The bottom portion of the page presents the principal components of the investment portfolio expressed as a percentage of total investment securities. End-of-period calculations that may be used to analyze the maturity distribution and the degree of appreciation or depreciation in the investment portfolio are also shown.
Short Term Investments ($000)
The sum of: Interest-bearing bank balances
+ Federal funds sold and securities purchased under agreements to resell
+ Debt securities with a remaining maturity of one year or less
+ Acceptances of other banks (loans) prior to March 31, 2001.
Short Term Assets ($000)
The sum of:
Short term investments (defi ned above)
+ Loans and leases with a remaining maturity of one year or less
- Acceptances of other banks prior to March 31, 2001.
Short Term Noncore Funding ($000)
The sum of: + Time deposits of $100M or more
with a remaining maturity of one year or less
+ Brokered deposits issued in denominations of less than $100M with a remaining maturity or one year or less
+ Other borrowed money with a remaining maturity one year or less
+ Time deposits with a remaining maturity of one year or less in foreign offi ces
+ Securities sold under agreements to repurchase and federal funds purchased
+ Demand notes issued to the U.S. Treasury (Not available from March 31, 2001 forward).
Noncore Liabilities ($000)
The sum of: Total time deposits of $100M or more
+ Other borrowed money (all maturities)
+ Foreign offi ce deposits + Securities sold under agreements
to repurchase and federal funds purchased
+ Insured brokered deposits issued in denominations of less than $100,000
+ Demand notes issued to the U.S. Treasury (Not available from March 31, 2001 forward).
Federal Home Loan Bank Borrowing Maturity Under 1 Year
From March 31, 2001 forward includes information from schedule RC-M Federal Home Loan Bank Advances with a Remaining Maturity of One Year or Less (RCFD2651).
Federal Home Loan Bank Borrowing Maturing Over 1 Year
From March 31, 2001 forward that includes information from schedule RC-M Federal Home Loan Bank Advances with a Remaining Maturity of One to Three Years (RCFDB565) plus Federal Home Loan Bank Advances with a Remaining Maturity of Over Three Years (RCFDB566).
Other Borrowing Maturing Under 1 Year
From March 31, 2001 forward includes information from schedule
RC-M Other Borrowed Money with a Remaining Maturity of One Year or Less (RCFDB571). For prior quarters includes Other Borrowed Money with a Remaining Maturity One Year or Less (RCFD2332).
Other Borrowing Maturing Over 1 Year
From March 31, 2001 forward includes information from schedule RC-M Other Borrowed Money with a Remaining Maturity of One to Three Years (RCFDB567) plus Other Borrowed Money With Remaining Maturity of Over Three Years (RCFDB568). For prior quarters includes Other Borrowed Money with a Remaining Maturity of One to Three Years (RCFDA547) plus Other Borrowed Money With a Remaining Maturity of Over Three Years (RCFDA548).
Long Term Assets ($000)
Is used in ratio calculations below but does not appear on the page. It is calculated as follows:
Net loans and leases
- Acceptances of other banks (loans) prior to March 31, 2001
+ Held-to-maturity securities
+ Available-for-sale securities
- Debt securities with a remaining maturity of one year or less
+ Other real estate owned (non– investment).
Core Deposits ($000)
Is used in ratio calculations but does not appear on the page. See page 4, balance sheet.
All demand and savings deposits including money market deposit accounts and NOW and ATS accounts, savings deposits, plus time deposits in amounts of less than $100 thousand.
UBPR User’s Guide • December 2008 III-50

Short Term Liabilities ($000)
Is used in ratio calculations but does not appear on the page.
The sum of:
Time deposits less than $100,000 with a remaining maturity of one year or less
+ Time deposits of $100M or more with a remaining maturity of one year or less
+ Other borrowed money with remaining maturity 1 year or less
+ Deposits in foreign offi ces with remaining maturity 1 year or less
+ Securities sold under agreements to repurchase and federal funds purchased
+ Demand notes issued to the U.S. Treasury (Not available from March 31, 2001 forward).
Not available prior to March 1996.
Debt Securities 90+ Days P/D
Displays dollar data for 90+ days past due debt securities from schedule RC-N and RC-B.
Total Noncurrent Debt Sec
Displays dollar data for noncurrent debt securities from schedule RC-N and RC-B.
Fair Value Structured Notes
Percent of Total Assets
Each category is divided by total assets at the end of the period.
Short Term Investments
Temporary investments divided by total assets.
Marketable Equity Securities (MES)
Investments in mutual funds and other equity securities with readily determinable values divided by total assets.
Core Deposits
Core deposits divided by total assets.
S.T. Noncore Funding
Short term noncore funding divided by total assets.
Liquidity Ratios
Net S. T. Noncore Funding Dependence
Short term noncore funding less short term investments divided by long term assets. Available from March 1996 forward.
Net Noncore Funding Dependence
Noncore liabilities less short term investments divided by long term assets. Available for all periods.
Brokered Deposits to Deposits
Deposits acquired from brokers and dealers for the account of others divided by total deposits.
Brokered Deposits Maturing < 1 year to Brokered Deposits
Brokered deposits issued in amounts of less than $100M and maturing in less than one year plus brokered deposits issued in amounts of $100M or greater divided by total brokered deposits. Not available prior to March 1996.
Short Term Investments to Short Term Noncore Funding
Short Term investments divided by short term noncore funding.
Short Term Assets to Short Term Liabilities
Short term assets divided by short term liabilities.
Net Short Term Liabilities to Assets
Short term liabilities less short term assets divided by total assets.
Net Loans & Leases to Deposits
Net loans, plus lease-fi nancing receivables, divided by total deposits.
Net Loans & Leases to Core Deposits
Net loans, plus lease-fi nancing receivables, divided by total core deposits.
Net Loans, Leases & Standby Letters of Credit to Assets
Net loans, plus lease-fi nancing receivables and standby letters of credit, divided by total assets.
Securities Mix (Percent of Total Securities)
Securities are displayed in two groups based on whether they are classifi ed as held-to-maturity or available-forsale. Held-to-maturity securities are shown at cost, while available-for-sale securities are shown at fair value.
Within each group, a distribution by type of security is displayed. Individual outstanding balances for each security is divided by the end-ofperiod total of held-to-maturity and available-for-sale securities.
U.S. Treasury & Government Agencies
Securities issued by U.S. Treasury and U.S. Agencies and U.S. government sponsored agencies are displayed.
Municipal Securities
General obligation, revenue and industrial development bonds are shown. Available prior to March 31, 2001.
Pass-Through Mtg. Backed Secs
Pass through GNMA, FNMA and privately issued mortgage-backed securities are displayed.
CMO & Remic Mtg Backed ecs
CMO’s and REMIC’s issued by FNMA and FHLMC, collateralized by MBS guaranteed by FNMA, FHLMC, GNMA and other private issues are displayed.
Asset Backed Securities
Available from March 31, 2001 forward. Asset backed securities include
UBPR User’s Guide • December 2008 III-51

those backed by credit card receivables, home equity lines, automobile loans, other consumer loans, commercial loans and other assets.
Other Domestic Debt Securities
Foreign Debt Securities
Inv Mut F. & Oth MKTBL
Investments in mutual funds and other marketable securities. Shown in available-for-sale only.
Other Equity Securities
Includes other equity securities. Displayed as available-for-sale securities only.
Total Held-To-Maturity
Sum of all securities classifi ed as held-to-maturity as a percent of total securities.
Total Available-For-Sale
Sum of all securities classifi ed as available-for-sale as a percent of total securities.
Other Securities Ratios:
App (Dep) Hi Risk & Struc/TlCap
Fair value of high risk mortgage securities plus structured notes less amortized cost divided by tier one capital.
App (Dep) in HTM sec to HTM Sec
Prior to March 31, 1994, the total market value of all investment securities, less the total book value of all investment securities divided by the total book value of all investment securities.
From March 31, 1994 and subsequent, calculated for held-to-maturity securities.
App (Dep) in HTM Sec to Eqy Cap
Prior to March 31, 1994, the total market value of all investment securities, less the total book value of all investment securities divided by total equity capital.
From March 31 and subsequent, calculated for just held-to-maturity securities.
Pledged Securities to Total Securities
The book value of all securities as defined above that are pledged to secure deposits, repurchase transactions, or other borrowing (regardless of the balance of the deposits or other liabilities against which the securities are pledged), as performance bonds under futures or forward contracts, or for any other purpose, divided by total securities.
UBPR User’s Guide • December 2008 III-52

CERT # CHARTER #
DIST/RSSD COUNTY CAPITAL ANALYSIS PAGE 11
06/30/2008 06/30/2007 12/31/2007 12/31/2006 12/31/2005 END OF PERIOD CAPITAL ($000) PERPETUAL PREFERRED 0 0 0 0 0 + COMMON STOCK 21,600 21,600 21,600 21,600 21,600 + SURPLUS 11,669,925 11,318,880 11,669,878 11,318,879 11,306,611 + UNDIVIDED PROFITS 7,374,753 7,718,866 7,153,856 7,626,425 6,568,063 + ACCUM OTHER COMP INCOME 236 292 275 643 808 440 363 165 369 064 + OTHER EQUITY CAPITAL COMP 0 0 0 0 0
TOTAL EQUITY CAPITAL 19,302,570 19,334,989 19,653,774 19,330,069 18,265,338
SUBORD NOTES & DEBENTURES 3 334 741 3 391 247 3 312 078 3 446 917 3 696 687
CHANGES IN TOTAL EQUITY ($000) BALANCE AT BEGINNING OF PERIOD 19,653,774 19,330,069 19,330,069 18,265,338 9,873,582 + NET INCOME 860 897 1 171 705 1 871 083 2 125 292 2 032 286 + SALE OR PURCHASE OF CAPITAL 0 0 0 0 0 + MERGER & ABSORPTIONS 0 0 0 0 0 + RESTATE DUE TO ACCTG ERROR&CHG 0 -222,224 -222,224 0 0 + TRANS WITH PARENT 47 -68 453 158 158 5 338 7 979 993 - DIVIDENDS 640,000 640,000 1,780,000 1,060,000 1,324,000 + OTHER COMPREHENSIVE INCOME -572,148 -236,108 296,688 -5,899 -296,523
BALANCE AT END OF PERIOD 19,302,570 19,334,989 19,653,774 19,330,069 18,265,338
INTANGIBLE ASSETS MORTGAGE SERVICING RIGHTS 1,193,450 942,012 1,049,425 810,509 657,604 + PURCH CRED CARD RELATION 0 0 0 0 0 + OTHER INTANGIBLES 155 030 223 595 186 938 263 373 353 980 + GOODWILL 6,433,012 6,433,589 6,433,125 6,425,876 6,392,746
TOTAL INTANGIBLES 7,781,492 7,599,196 7,669,488 7,499,758 7,404,330
MEMO GRANDFATHERED INTANG 0 0 0 0 0
CAPITAL RATIOS BANK PG 1 PCT BANK PG 1 PCT BANK PG 1 PCT BANK PG 1 BANK PG 1 PERCENT OF TOTAL EQUITY NET LOANS & LEASES (X) 6.66 6.83 43 6.75 6.66 50 6.67 6.62 47 6.85 6.47 6.98 6.59 SUBORD NOTES & DEBENTURES 17.28 6.50 79 17.54 6.30 80 16.85 6.43 78 17.83 6.25 20.24 6.84 LONG TERM DEBT 17.28 6.50 79 17.54 6.30 80 16.85 6.43 78 17.83 6.25 20.24 6.84 COM RE & RELATED VENTURES 144.74 243.73 29 144.21 224.13 32 139.24 230.88 28 139.56 211.83 130.32 196.87 PERCENT OF AVERAGE TOTAL EQUITY NET INCOME 8.77 5.95 57 12.12 11.47 56 9.66 9.61 49 11.30 12.89 13.59 13.91 DIVIDENDS 6.52 3.95 74 6.62 6.93 51 9.19 6.63 68 5.64 6.26 8.85 6.85 RETAINED EARNINGS 2.25 0.98 51 5.50 3.67 59 0.47 2.12 36 5.66 5.65 4.74 6.21 OTHER CAPITAL RATIOS DIVIDENDS TO NET OPER INCOME 74.34 50.74 67 54.62 59.92 47 95.13 65.99 66 49.88 47.35 65.15 47.57 EQUITY CAPITAL TO ASSETS 11.26 10.29 69 10.92 10.18 66 11.22 10.45 68 10.59 10.16 10.31 9.84 GROWTH RATES TOTAL EQUITY CAPITAL -0.17 19.32 24 3.71 15.34 31 1.67 19.48 27 5.83 17.86 84.99 15.06 EQUITY GROWTH LESS ASST GROWTH 2.97 1.12 62 6.12 4.57 61 5.77 3.94 63 2.81 3.61 49.47 3.07 INTANG ASSETS % TOTAL EQUITY MORTGAGE SERVICING RIGHTS 6.18 0.82 92 4.87 0.79 90 5.34 0.82 90 4.19 0.77 3.60 0.88 GOODWILL 33.33 18.38 75 33.27 16.62 77 32.73 18.73 73 33.24 16.12 35.00 15.53 PURCH CREDIT CARD RELATION 0.00 0.01 84 0.00 0.01 87 0.00 0.01 85 0.00 0.01 0.00 0.01 ALL OTHER INTANGIBLES 0.80 1.55 37 1.16 1.40 50 0.95 1.63 41 1.36 1.42 1.94 1.45 TOTAL INTANGIBLES 40.31 22.13 76 39.30 20.14 77 39.02 22.65 73 38.80 19.63 40.54 19.74
UBPR User’s Guide • December 2008 III-53

UBPR Page 11
Capital Analysis
This page presents end-of-period capital by call report defi nition, a reconcilement of total equity capital from period to period, an analysis of intangible assets and a series of capital ratios. Ratios using after tax income and dividends have been adjusted for assumed tax rates. See Section II Technical Information.
End-of-Period Capital ($000)
The dollar figures for each category are brought directly forward from the end-of-period Report of Condition schedule RC.
Perpetual Preferred Stock
Common Stock
Surplus
Undivided Profi ts
Accumulated Other Comprehensive Income
From March 31, 2001 forward includes accumulated other comprehensive income. For prior quarters includes accumulated G/L cash fl ow hedges, unrealized G/L available-forsale securities, cumulative foreign current adjustment.
Other Equity Capital Components
Available from March 31, 2001 forward and includes other equity capital components.
Total Equity Capital
Sum of all capital components above.
Subordinated Notes & Debentures
Subordinated notes and debentures as reported on schedule RC.
Changes in Total Equity ($000)
Displays the reconcilement of changes
in equity capital from schedule RI-A. The source of a change in capital may be identified in this section.
Balance at Beginning of Period
Net Income
Sale or Purchase Of Capital
Merger & Absorptions
Restatements due to Accounting Errors and Changes
From March 31, 2001 forward includes restatements due to corrections of material accounting errors and changes in accounting. For prior quarters includes cumulative accounting changes as well as restatements due to accounting errors and changes.
Transactions With Parent
Less: Dividends
Other Comprehensive Income
From March 31, 2001 forward includes other comprehensive income. For prior quarters includes net other increases or decreases which is defined as net change in holding gains (losses) on available-for-sale securities and foreign currency translation adjustments.
Balance At End Of Period
Intangible Assets
Displays categories of intangible assets as reported in schedule RC-M.
Mortgage Servicing Rights
Purchased Credit Card Relation
Other Intangibles
Goodwill
Total Intangibles
Memo: Grand fathered Intangibles
Intangible assets that have been grandfathered for regulatory capital purposes.
Capital Ratios
Ratios are calculated by dividing by total equity capital as shown on schedule RC.
Percent of Total Equity:
Net Loans & Leases (X)
Unlike the other ratios displayed under this heading, this ratio is multiple, e.g., shows the number of times net loans and lease-fi nancing receivables exceed equity capital.
Subordinated Notes and Debentures— Percent of Total Equity
Subordinated notes and debentures divided by total equity capital.
Long-Term Debt—Percent of Total Equity
Subordinated notes and debentures, plus mortgage indebtedness and liability for capitalized leases, divided by total equity capital.
Com Re & Related Ventures
The sum of construction and land development loans, nonfarm nonresidential mortgages, unsecured loans to finance commercial real estate, construction and land development, other real estate owned, investments in unconsolidated subsidiaries and associated companies divided by total equity.
Percent of Average Total Equity:
The following ratios use average equity derived from end-ofperiod balance for the prior year end and current year’s end-of-period balances.
UBPR User’s Guide • December 2008 III-54

Net Income—Percent of Average Total Equity
Net income divided by average total equity capital.
Dividends—Percent of Average Total Equity
Cash dividends declared on common & preferred stock.
Retained Earnings—Percent of Average Total Equity
Net income, less cash dividends declared, divided by average total equity.
Other Capital Ratios:
Dividends to Net Operating Income
Cash dividends declared, as a per
cent of Net Operating Income as defined for UBPR Page 02.
Equity Capital to Assets
All common stock plus perpetual preferred stock, plus surplus, plus undivided profits and reserve for contingencies and other capital reserves, divided by assets.
Growth Rates:
For each of the captions in this grouping, the growth rate is determined by subtracting the account balance at the end of the corresponding period in the prior year from the current account balance and dividing the result by the account balance at the end of the corresponding period in the prior year. The “equity growth less asset growth” ratio is included in this grouping for analysis purposes
even though it is not technically a growth rate.
Total Equity Capital
Equity Growth Less Asset Growth
The difference between equity capital and asset growth rates.
Intangibles Assets % Total Equity
Individual categories of intangible assets are shown as a percent of total equity.
Mortgage Servicing Rights
Goodwill
Purchased Credit Card Relation
Other Intangibles
Total Intangibles
UBPR User’s Guide • December 2008 III-55

CERT # CHARTER #
DIST/RSSD COUNTY CAPITAL ANALYSIS PAGE 11A
06/30/2008 06/30/2007 12/31/2007 12/31/2006 12/31/2005 RISK-BASED CAPITAL ($000) TIER ONE CAPITAL TOTAL EQUITY CAPITAL ADJUSTED 19 186 745 19 541 327 18 966 354 19 450 491 18 372 947 - INELIGIBLE DEF TAX ASSETS 0 0 0 0 0 - INELIGIBLE INTANGIBLES 6,540,927 6,595,025 6,565,686 6,618,789 6,658,104 - CUMUL CHANGE F.V. FINANCIAL LIAB 128,393 -21,687 62,329 0 0
NET TIER ONE 12 517 425 12 967 989 12 338 339 12 831 702 11 714 843
TIER TWO CAPITAL + QUALIF DEBT AND REDEEM PFD 2,778,057 2,730,580 2,745,224 3,026,832 3,276,819 + CUMULATIVE PREFERRED STOCK 0 0 0 0 0 + ALLOWABLE LN&LS LOSS ALLOW 1,677,416 1,050,935 1,288,914 1,045,791 1,030,471 + UNRL GAIN MKTBL EQY SEC (45%) 250,076 489,224 571,290 549,290 460,410 + OTHER TIER 2 CAPITAL COMP 0 0 0 0 0
NET ELIGIBLE TIER TWO 4,705,549 4,270,739 4,605,428 4,621,913 4,767,700 TOTAL RBC BEFORE DEDUCTIONS TIER ONE & TIER TWO 17,222,974 17,238,728 16,943,767 17,453,615 16,482,543 TIER THREE & FIN SUB ADJ 0 0 0 0 0 - RECRIPROCAL CAPITAL HOLDINGS 0 0 0 0 0 - DEDUCTIONS FOR TOTAL RBC 0 0 0 0 0
TOTAL RISK-BASED CAPITAL 17,222,974 17,238,728 16,943,767 17,453,615 16,482,543
RISK-WEIGHTED ASSETS ON-BALANCE SHEET CATEGORY TWO - 20% 4,001,214 3,925,774 4,146,709 6,519,354 6,845,044 CATEGORY THREE - 50% 16,591,814 20,766,713 19,149,453 21,624,062 20,569,806 CATEGORY FOUR - 100% 103,499,131 96,405,334 100,898,699 97,136,896 92,486,405
TOTAL ON-BALANCE SHEET 124,092,159 121,097,821 124,194,861 125,280,312 119,901,255 MEMO CATEGORY ONE - 0% 2 094 378 1 519 608 1 887 750 1 771 501 1 858 908
OFF- BALANCE SHEET CATEGORY TWO - 20% 825,576 757,792 742,136 110,172 69,766 CATEGORY THREE - 50% 1,520,912 1,769,870 2,323,658 1,362,282 1,305,765 CATEGORY FOUR - 100% 33,161,612 32,647,744 31,791,402 32,597,724 33,357,927
TOTAL OFF-BALANCE SHEET 35,508,100 35,175,406 34,857,196 34,070,179 34,733,458 MEMO CATEGORY ONE - 0% 0 8,099 5,626 2,510 0
ADJUSTMENTS TO RISK-WGT ASSETS RISK-WEIGHTED ASSET BEFORE DED 159,600,260 156,273,228 159,052,057 159,350,491 154,634,713 - INELIGIBLE DEF TAX ASSETS 0 0 0 0 0 - INELIGIBLE INTANGIBLES 0 0 0 0 0 - RECIPROCAL CAPITAL HOLDINGS 0 0 0 0 0 - EXCESS ALLOWABLE LN&LS LOSS AL 0 0 0 0 0 - ALLOCATED TRANSFER RISK RESERV 0 0 0 0 0 + MKT RISK ASSETS & FIN SUB ADJ 2,870,367 2,890,742 3,310,415 1,549,083 1,677,626
TOTAL RISK-WEIGHTED ASSETS 162,470,627 159,163,971 162,362,472 160,899,575 156,312,340
RISK-BASED CAPITAL BANK PG 1 PCT BANK PG 1 PCT BANK PG 1 PCT BANK PG 1 BANK PG 1 TIER ONE RBC TO RISK-WGT ASSETS 7.70 10.00 10 8.15 10.51 12 7.60 10.10 10 7.97 10.61 7.49 10.77 TOTAL RBC TO RISK-WEIGHT ASSETS 10.60 11.85 19 10.83 12.15 23 10.44 11.82 16 10.85 12.22 10.54 12.46 TIER ONE LEVERAGE CAPITAL 7.72 8.04 46 7.70 8.17 44 7.56 8.02 39 7.35 8.15 7.04 7.87
OTHER CAPITAL RATIO DEF TAX ASSET TO T1 CAP 0.00 3.98 23 0.00 2.67 28 0.00 2.53 33 0.00 2.46 0.00 2.44 NOTE FROM MARCH 31, 2001 FORWARD RISK-BASED CAPITAL RATIOS AND DATA DO INCLUDE ADJUSTMENT FOR FINANCIAL SUBSIDIARIES.
FOR BANKS WITH FINANCIAL SUBSIDIARIES PLEASE REFER TO CALL REPORT FOR INFORMATION ON THE ADJUSTMENT.
UBPR User’s Guide • December 2008 III-56
UBPR Page 11A
Risk-Based Capital ($000)
Risk-based capital is the standard for federal banking agency regulatory capital. It relates eligible capital to on and off-balance sheet assets that have been assigned an appropriate conversion factor and risk weight. Assets, both on and off-balance sheet are assigned to one of four broad risk weight categories which are based the obligor, nature of collateral, guarantor or nature of the instrument.
The source for on and off-balance sheet risk weighting information is schedule RC-R, where banks report assets by major risk category. From March 31, 2001 forward all risk-based capital information on page 11a is derived solely from data as reported on the call form. This includes capital; risk-weighted asset details as well as individual ratios displayed on this page. Note that data reported for tier 1 capital, tier 2 capital, total capital and risk-weighted assets are revised to include the adjustment for financial subsidiaries. Those adjustments are needed for correct calculation of risk-based capital ratios.
For quarters prior to March 31, 2001 not all banks are required to fi le complete RC-R information. For those banks that do not file a complete schedule RC-R, the agencies have developed an estimation module that uses information from the report of condition to estimate risk-weighted assets. Approximately 80% of banks were not required to file details for risk-weighted assets. The module follows that used by the FDIC risk-based insurance premium assessments.
Capital is separated into three major groups—tier one and tier two and tier three capital. Tier one is an adjusted equity capital, while tier two considers certain preferred stock and debt instruments for eligibility. Tier three capital includes an allocation for market risk. All components are combined to form total capital.
Estimated and actual calculations of risk-based capital are available to the general public.
Risk-Based Capital ($000)
Details the components of tier one and tier two capital.
Tier One Capital
Total Equity Capital Adjusted
From March 31, 2001 forward includes data from RC-R: total equity capital, the following adjustments: for net unrealized gains (losses) on available-for-sale securities, for unrealized loss on available- for-sale equity securities, for accumulated gains (losses) on cash fl ow hedges, for non qualifying perpetual preferred stock, qualifying minority interest in consolidated subsidiaries, and other additions (deletions) to equity capital. Also the adjustment for financial subsidiaries from schedule RC-R reported in tier 1 capital on schedule RC-R is deducted.
For prior quarters includes the sum of common stock, surplus, undivided profits, net worth certifi cates, cumulative foreign currency adjustments less unrealized loss on marketable equity securities, noncumulative perpetual preferred stock, minority interest in consolidated subsidiaries.
Minus Ineligible Def. Tax Assets
From March 31, 2001 forward from RC-R. For prior quarters from schedule RC-F.
Minus Ineligible Intangibles
From March 31, 2001 forward from RC-R.
For prior quarters ineligible intangible assets is calculated by subtracting eligible intangible assets from total intangible assets on schedule RC-M. Eligible intangible assets are
composed of purchased credit card relationships and mortgage servicing rights subject to an overall limit of 100% of tier one capital.
Minus Cumulative Change in Fair Value of Financial Liabilities
From schedule RC-R.
Net Tier One
From March 31, 2001 forward tier 1 capital from RC-R less the adjustment for financial subsidiaries. For prior quarters it is the sum of the above capital components.
Tier Two Capital
Qualifying Debt and Redeemable Preferred
From March P31, 2001 forward includes qualifying subordinated debt and redeemable preferred stock from RC-R.
For prior quarters includes:
Allowable subordinated debt and intermediate term preferred stock and other limited life instruments from schedule RC-R. The components are discounted by maturity as follows:
1 to 2 years = 20% 2 to 3 years = 40% 3 to 4 years = 60% 4 to 5 years = 80% over 5 years = 100%
Subordinated debt is also limited to 50% of tier one capital.
Plus mandatory convertible debt from RC-M.
Plus Cumulative Preferred Stock
From March 31, 2001 forward includes cumulative perpetual preferred stock includible in tier w from RC-R. For prior quarters preferred stock minus non cumulative perpetual preferred stock from schedules RC and RC-M.
UBPR User’s Guide • December 2008 III-57

Plus Allowable Loans & Lease Loss Allowance
From March 31, 2001 forward includes allowance for loan and lease losses includible in tier 2 from RC-R. For prior quarters the allowance for loan and lease losses is limited to 1.25% of gross risk-weighted assets, which is defined as risk-weighted assets minus ineligible intangible assets, and if applicable minus ineligible deferred tax assets. From March 31, 1997 forward for banks fi ling FFIEC 031, 032 AND 033 based on the Balance end of Current Period from RI B.II. For banks filing FFIEC 034 and for all banks for prior quarters based on Schedule RC Allowance for Loan and Lease Losses.
Plus-Unrealized Gain Marketable Equity Securities (45%)
From March 31, 2001 forward includes unrealized gains on available-for-sale equity securities inbcludible in tier 2 from RC-R. For prior quarters from September 30, 1998 forward 45% of the unrealized gain in marketable equity securities is included in tier two capital.
Other Tier Two Capital Components
Other Tier 2 Capital Components as reported on schedule RC-R item 16.
Net Eligible Tier Two*
From March 31, 2001 forward allowable tier 2 capital from RC-R including other tier two capital components. For prior quarters the sum of all tier two capital components. Tier two capital cannot exceed 100% of tier one capital.
Total RBC Before Deductions
Tier One & Tier Two
Sum of net tier one and net eligible tier two capital.
Tier Three and Financial Subsidiary Adjustment
From March 31, 2001 forward includes tier 3 capital allocated for market risk from RC-R. Also includes
50% of the adjustment for fi nancial subsidiaries reported as reported on schedule RC-R in total capital. For prior quarters includes reported tier three capital from call schedule RC-R for banks filing 031 and 032 call forms, from March 31, 1998 forward.
Minus Reciprocal Capital Holdings
Available for quarters prior to March 31, 2001 includes interbank holdings of capital instruments from schedule RC-M. Reported only in December, so for interim quarters, the prior year end figure is used.
Deductions for Total RBC
Total deductions for risk-based capital as reported on schedule RC-R.
Total Risk-Based Capital
From March 31, 2001 forward total risk-based capital from RC-R less the adjustment for fi nancial subsidiaries. For prior quarters include tier one plus tier two capital plus tier three capital less reciprocal holdings.
Risk-Weighted Assets
On Balance Sheet
From March 31, 2001 forward risk-weighted asset information for all banks is retreived from RC-R. For prior quarters on balance sheet assets are derived either from schedule RC-R for banks that fi le complete RC-R data, or from a variety of report of condition schedules for those banks that do not file complete RC-R data. Note that available-for-sale securities are counted at cost for risk-based capital purposes.
Category Two—20%
From March 31, 2001 forward the total of components in the 20% balance sheet asset categories on RC-R is multiplied by 20%.
For prior quarters components listed below are multiplied by 20% risk weight. For banks filing RC-R, it is composed of assets assigned to the 20% risk weight category.
For banks not filing RC-R, federal funds sold, securities purchased under resell agreements, assets held in trading accounts, passthrough securities issued by FNMA and FHLMC, CMOs issued by FNMA and FHLMC, private issue CMOs collateralized or guaranteed by guaranteed by FNMA, FHLMC or GNMA, US government sponsored agencies, general obligation securities of state and political subdivisions in the US, acceptances of other banks.
Additionally, for banks fi ling FFIEC form 034, add interest bearing bank balances and Noninterest bearing bank balances less currency and coin. For other banks, add cash items in process of collection.
Category Three—50%
From March 31, 2001 forward the total of components in the 50% balance sheet asset category on RC-R is multiplied by 50%. For prior quarters components listed below are multiplied by 50% risk weight.
For banks filing RC-R, it is composed of assets assigned to the 50% risk weight category.
For banks not filing RC-R completely, the sum of loans secured by fi rst liens on 1–4 family residential properties, state and local subdivision revenue obligations, privately issued pass through securities, all other privately issued CMO & REMICs.
Category Four—100%
From March 31, 2001 forward the total of all components in the 100% balance sheet asset category is risk-weighted at 100%. For prior quarters components listed below are multiplied by 100% risk weight.
For banks filing RC-R, it is composed of assets assigned to the 100% risk weight category. For banks filing RC-R items 4 through 9 the estimate of unrealized loss on marketable equity securities is not deducted from March 31, 1997 forward.
For banks not filing RC-R, total assets are adjusted to place available-for-
UBPR User’s Guide • December 2008 III-58

sale securities on a cost basis except for losses on marketable equity securities, plus allowance for loan losses and allocated transfer risk reserve, less assets assigned to 0%, 20%, 50% risk weight categories, less participation in acceptances conveyed to others (banks filing FFIEC 031, 032, 033). From September 30, 1998 forward 45% of the unrealized gain on marketable equity securities is added to risk-weighted assets.
Total On Balance Sheet
Sum of all risk-weighted on balance sheet assets.
Memo: Category One—0%
From March 31, 2001 forward the total of components in the 0% balance sheet category is displayed. For prior quarters components listed below are multiplied by 0% risk weight. (For display no weighting is done).
For banks filing RC-R, it is composed of assets assigned to the 0% risk weight category.
For banks not filing complete RC-R data, U.S. Treasury securities, securities issued by U.S. Treasury agencies, pass through securities guaranteed by GNMA, currency and coin.
Additionally, for banks fi ling FFIEC 031, 032 and 033, balances due from Federal Reserve.
Off-Balance Sheet
From March 31, 2001 forward risk-weighted asset information for all banks is retrieved from RC-R. For prior quarters off-balance sheet assets are derived from schedule RC-R for banks that file all RC-R data. For banks that do not file all data, information from schedule RC-L is used. For banks not filing RC-R data, the off-balance sheet amounts are first converted to an on balance sheet equivalent using a conversion factor then the appropriate risk weight is applied.
Category Two—20%
From March 31, 2001 forward all
components in the RC-R off-balance sheet 20% category are summed and multiplied by 20%. For prior quarters components listed below are multiplied by 20% risk weight.
For banks filing RC-R, credit equivalents of off-balance sheet items assigned to the 20% risk weight category are used. For banks not fi ling all RC-R data, the following items are converted at the appropriate rate.
Financial standby letters of credit conveyed to others and securities lent are converted at 100%, and performance standby letters of credit conveyed to others are converted at 50%.
Additionally, for banks fi ling FFIEC 031, 032 and 033, participation in acceptances conveyed to others are converted at 100% and participation in commitments with an original maturity over 1 year conveyed to others are converted at 50%.
Category Three—50%
From March 31, 2001 forward all components in the RC-R off-balance sheet 50% category are summed and multiplied by 50%. For prior quarters components listed below are multiplied by 50% risk weight.
For banks filing RC-R, credit equivalents of off-balance sheet items assigned to the 50% risk weight category are used.
For banks not filing all RC-R data, the following items are converted at the 100% rate; Principal balance of FNMA and FHLMC pools transferred and principal balance of private mortgage pools transferred. From March 31, 1997 forward includes from RC-L, Outstanding principal balance of first lien 1 to 4 family residential mortgage loans.
Category Four—100%
From March 31, 2001 forward all components in the RC-R off-balance sheet 100% category are summed and risk-weighted at 100%. For prior quarters components listed below are multiplied by 100% risk weight.
For banks filing RC-R, credit equivalents of off-balance sheet items assigned to the 100% risk weight category are used.
For banks not filing all RC-R data, the following items are converted at the appropriate rate.
Financial standby letters of credit less financial letters of credit conveyed to others, participation in acceptances acquired by the reporting bank, outstanding balance of Farmer Mac pools transferred, all other off-balance sheet items are converted at 100%.
Performance standby letters of credit less performance standby letters of credit conveyed to others, unused commitments with an original maturity over 1 year, less that conveyed to others (FFIEC 031, 032 and 033) is converted at 50%.
Total Off-Balance Sheet
Sum of the above risk-weighted credit equivalents of off-balance sheet items.
Memo: Category One—0%
From March 31, 2001 forward all components in the RC-R off-balance sheet 0% category are summed and displayed.
For prior quarters components listed below are multiplied by 0% risk weight. For display purposes no weighting is done.
For banks filing RC-R, credit equivalents of off-balance sheet items assigned to the 0% risk weight category are used.
For banks not filing all RC-R data no estimation is made.
Adjustments to Risk-Weighted Assets
Risk-Weighted Asset Before Deductions
The sum of total on and off -balance sheet risk-weighted assets.
Minus Ineligible Deferred Tax Assets
Not available from March 31, 2001
UBPR User’s Guide • December 2008 III-59

forward. See tier one capital for defi nition.
Minus Ineligible Intangibles
Not available from March 31, 2001 forward. See tier one capital for defi nition.
Minus Reciprocal Capital Holdings
Not available from March 31, 2001 forward. See tier two capital for defi nition.
Minus Excess Allowable Loans & Lease Allowance
From March 31, 2001 forward excess allowance for loan and lease losses from RC-R. For prior quarters allowance for loan and lease losses less allowable loan and lease loss included in tier two capital.
Minus Allocated Transfer Risk Reserve
Allocated transfer risk reserve.
Market Risk Equivalent Assets & Financial Subsidiary Adjustment
From March 31, 2001 forward includes market risk equivalent
assets from RC-R. Also includes the adjustment to risk-weighted assets for financial subsidiaries as reported on schedule RC-R. For prior quarters includes reported market risk equivalent assets from schedule RC-R for banks filing 031 and 032 call forms from March 31, 1998 forward.
Total Risk-Weighted Assets
From March 31, 2001 forward total risk-weighted assets from RC-R less the adjustment for fi nancial subsidiaries. For prior quarters this item is the total of the risk-weighted assets calculated above including adjustments.
Risk-Based Capital
Tier One RBC to Risk-Weighted Assets
From March 31, 2001 forward if the bank reports fi nancial subsidiaries then the tier 1 risk-based capital ratio adjusted for financial subsidiaries is displayed from RC-R. Otherwise the unadjusted tier 1 risk-based capital ratio is displayed from RC-R. For prior quarters tier one capital divided by risk-weighted assets.
Total RBC to Risk Weigh Assets
From March 31, 2001 forward if the bank reports fi nancial subsidiaries then the adjusted total risk-based capital ratio is displayed. Otherwise the unadjusted total risk-based capital ratio is displayed. For prior quarters it is calculated by dividing total risk-based capital by risk-weighted assets.
Tier One Leverage Capital
From March 31, 2001 forward if the bank reports financial subsidiaries then the tier 1 leverage ratio adjusted for fi nancial subsidiaries is displayed from RC-R. Otherwise the unadjusted tier leverage ratio is displayed from RC-R.
For prior quarters tier one capital is divided by adjusted average assets. Average assets from schedule RC-K is adjusted for ineligible intangible assets and deferred tax assets as used in tier one capital.
Other Capital Ratio:
Deferred Tax Asset to Tier One Capital
Deferred tax assets from RC-F divided by tier one capital.
UBPR User’s Guide • December 2008 III-60

CERT # DIST/RSSD ONE QUARTER ANNUALIZED INCOME ANALYSIS PAGE 12 CHARTER # COUNTY 06/30/2008 3/31/2008 12/31/2007 9/30/2007 6/30/2007
EARNINGS AND PROFITABILITY PERCENT OF AVERAGE ASSETS BANK PG 1 PCT BANK PG 1 PCT BANK PG 1 PCT BANK PG 1 BANK PG 1 INTEREST INCOME (TE) 4.85 5.20 24 5.30 5.61 26
2.44 2.51 45 2.86 3.07 31 2.24 1.23 85 2.61 2.59 52 1.31 0.62 84 1.18 1.16 46
-0.14 0.03 5 1.04 1.16 42 0.75 0.77 42 1.36 1.03 70
0.77 N/A 0.75 0.77 42
5.89 6.12 31 2.71 2.74 46 3.18 3.36 36
0.91 0.49 79 3.45 9.65 33 1.30 4.42 20
99.97 35.70 85 0.00 2.98 31
6.09 6.59 18 6.04 6.58 16 6.24 6.51 25 6.27 6.35 46 6.16 6.61 22 4.64 6.61 4 5.99 7.69 14 6.44 10.94 14 5.39 6.16 15 N/A 1.55 N/A 5.79 5.05 89 5.63 4.85 92 4.63 4.59 48 5.75 5.04 91 5.21 4.68 76 4.77 3.32 85 2.59 3.21 9 2.97 2.86 57 1.85 1.39 69 1.88 1.68 64 4.50 4.38 59 4.45 4.26 64 3.12 3.05 56 2.55 3.21 14 4.79 4.13 81 0.71 5.71 3 3.13 3.07 53
5.78 6.08 31 5.96 6.34 2.99 3.12 2.97 3.24 1.64 1.31 2.88 2.63 0.35 0.25 1.39 1.69 0.00 0.01 1.39 1.69 0.95 1.11 1.05 1.20
1.09 0.95 1.09
6.63 6.92 3.33 3.41 3.31 3.55
0.32 0.26 6.75 18.83 2.63 7.55
202.41 53.55 -8.62 3.47
6.82 7.53 6.79 7.52 6.95 7.45 N/A N/A N/A N/A 5.02 8.03 6.56 8.30 2.73 11.88 7.29 7.52 N/A 3.27 5.89 5.26 5.74 5.05 5.00 4.91 5.71 5.09 6.08 5.06 5.68 5.05 5.04 5.24 3.65 3.56 2.41 1.98 2.27 2.46 5.22 4.95 4.64 4.66 5.13 4.54 4.67 4.72 5.10 5.13 1.12 6.29 3.84 3.83
5.85 6.20 - INTEREST EXPENSE 1.95 2.03 44 2.87 2.95 47 2.97 3.04
NET INTEREST INCOME (TE) 2.89 3.15 33 2.91 3.13 32 2.88 3.17 + NONINTEREST INCOME 1.58 1.22 72 1.89 1.15 80 1.69 1.31 - NONINTEREST EXPENSE 2.83 2.66 60 2.98 2.73 63 2.61 2.56 - PROVISION LOAN&LEASE LOSSES 1.06 0.87 68 0.84 0.49 76 0.24 0.19 PRETAX OPERATING INCOME (TE) 0.58 0.86 30 0.98 1.06 39 1.72 1.77
+ REALIZED GAINS/LOSSES SECS 1.30 -0.02 99 0.01 -0.03 81 0.54 0.00 PRETAX NET OPERATING INC (TE) 1.89 0.77 78 0.99 0.94 42 2.26 1.75 NET OPERATING INCOME 1.28 0.50 81 0.69 0.63 44 1.49 1.13 ADJUSTED NET OPERATING INCOME 1.58 0.96 83 1.14 0.90 61 1.52 1.18 NET INCOME ADJUSTED SUB S 0.49 N/A 0.64 N/A 1.12 NET INCOME 1.28 0.49 81 0.69 0.64 44 1.49 1.13 MARGIN ANALYSIS INT INC (TE) TO AVG EARN ASSETS 5.37 5.67 28 6.46 6.66 33 6.49 6.76 INT EXPENSE TO AVG EARN ASSETS 2.17 2.22 47 3.21 3.24 49 3.30 3.32 NET INT INC-TE TO AVG EARN ASST 3.21 3.44 36 3.26 3.45 35 3.19 3.47
LOAN & LEASE ANALYSIS NET LOSS TO AVERAGE TOTAL LN&LS 0.99 0.66 72 0.52 0.40 70 0.27 0.21 EARNINGS COVERAGE OF NET LOSS(X) 2.09 7.98 28 4.37 8.83 37 9.32 33.47 LN&LS ALLOWANCE TO NET LOSSES(X) 1.29 3.50 28 1.91 3.61 31 2.97 10.00
CAPITALIZATION 108.75 60.52 76 49.18 61.44
RETAIN EARNS TO AVG TOT EQUITY 4.50 -0.02 63CASH DIVIDENDS TO NET INCOME 59.17 35.28 71
-0.53 -1.16 41 6.84 3.12
YIELD ON OR COST OF TOTAL LOANS & LEASES (TE) 5.53 6.05 20 6.66 7.22 17 6.72 7.37 LOANS IN DOMESTIC OFFICES 5.54 6.04 20 6.62 7.22 15 6.68 7.37 REAL ESTATE 5.72 6.05 28 6.77 7.12 30 6.82 7.27 SECURED BY 1-4 FAM. RESI PROP 5.85 6.01 42 N/A N/A N/A N/A N/A
ALL OTHER LOANS SEC. REAL EST 5.43 6.08 20 N/A N/A N/A N/A N/A COMMERCIAL & INDUSTRIAL 4.46 5.98 9 4.84 7.53 3 5.01 7.94 INDIVIDUAL 5.83 7.41 20 6.52 8.14 17 6.42 8.16
CREDIT CARD PLANS 10.27 9.96 53 3.21 10.32 13 5.85 11.77 AGRICULTURAL 4.44 6.04 13 6.90 7.03 28 7.36 7.39 LOANS IN FOREIGN OFFICES N/A 1.29 N/A N/A 1.92 N/A N/A 2.47 TOTAL INVESTMENT SECURITIES(TE) 6.04 4.94 93 5.83 5.24 87 5.69 5.11 TOTAL INVESTMENT SECURITES(BOOK) 5.90 4.75 94 5.68 5.03 92 5.53 4.91 U S TREAS & AGENCY (EXCL MBS) 4.55 4.27 59 4.92 4.77 54 4.99 4.78 MORTGAGE BACKED SECURITIES 5.80 5.03 90 5.68 5.13 86 5.47 5.00 ALL OTHER SECURITIES 6.95 4.51 95 5.87 4.90 81 5.94 4.92 INTEREST-BEARING BANK BALANCES 3.27 2.33 76 7.61 4.18 91 5.61 4.94 FEDERAL FUNDS SOLD & RESALES 2.06 2.20 36 4.39 4.68 17 5.33 5.33 TOTAL INT-BEARING DEPOSITS 2.30 2.34 48 3.50 3.36 59 3.61 3.48 TRANSACTION ACCOUNTS 1.16 1.02 61 2.34 1.75 68 2.37 1.90 OTHER SAVINGS DEPOSITS 1.30 1.25 57 2.30 2.20 57 2.13 2.39 TIME DEPS OVER $100M 3.68 3.68 48 5.09 4.76 79 5.14 4.85 ALL OTHER TIME DEPOSITS 4.00 3.74 62 4.64 4.64 51 4.54 4.60 DEPOSITS IN FOREIGN OFFICES 1.97 2.17 36 4.46 4.10 71 5.27 4.57 FEDERAL FUNDS PURCHASED & REPOS 1.72 2.33 19 4.06 4.32 27 4.95 4.77 OTHER BORROWED MONEY 4.63 3.55 84 5.10 4.82 69 4.92 5.06 SUBORD NOTES & DEBENTURES 0.42 4.94 4 1.12 6.12 4 1.84 6.14 ALL INTEREST-BEARING FUNDS 2.52 2.48 55 3.70 3.62 54 3.82 3.77
UBPR User’s Guide • December 2008 III-61

UBPR Page 12
One Quarter Annualized Income Analysis
This page presents a quarter-by-quarter analysis of income and expense. Five consecutive single quarters of historical financial information are shown.
The analysis differs from the year-todate presentation in the remainder of the UBPR in that the income or expense attributed to one quarter is annualized (multiplied by 4) and compared to average asset or liability balances for that quarter. The resulting information permits the user to associate changes in earnings with a specific quarter and is a useful supplement to year-to-date earnings analysis.
The following rules apply to income, expense, asset and liability balances in One Quarter Annualized Income Analysis:
For the second, third and fourth quarters the current income/expense item is subtracted from the prior quarter item then multiplied by 4.
For the first quarter, no subtraction is done, but the income/expense item is multiplied by 4.
For the second, third and fourth quarters when push-down accounting is indicated for the first time that year, no subtraction is performed. The reported value is multiplied by 4.
The appropriate asset or liability, i.e. loans will generally come from schedule RC-K averages for the current quarter. In the few instances where banks do not report suffi cient detail on RC-K, end-of-period balances are used.
The presentation of information on page twelve follows that of the analysis on pages one and three. An overall analysis of earnings and profitability is followed by details on loan and lease, capitalization, yield and cost information. The report of condition and report of income com
ponents used in calculations follow those used on pages one and three. Refer to those pages for defi nition of components used in ratios. Ratios using after tax income and dividends have been adjusted for assumed tax rates. See Section II Technical Information.
Earnings and Profi tability
Interest Income (TE)
All income from earning assets plus the tax benefit on tax-exempt loans, leases, and municipal securities, divided by average assets.
Interest Expense
Total interest expense divided by average assets.
Net Interest Income (TE)
Total interest income, plus the tax benefit on tax-exempt income, less total interest expense, divided by average assets.
Noninterest Income
Income derived from bank services and sources other than interest-bearing assets, divided by average assets.
Noninterest Expense
Salaries and employee benefits, expenses of premises and fixed assets and other noninterest expense divided by average assets.
Provision-Loan/Lease Losses
Provision for loan and lease-financing receivables losses divided by average assets.
Pretax Operating Income (TE)
Net interest income on a tax-equivalent basis plus noninterest income, less noninterest expenses, the provision for loan and lease-financing receivables losses and the
provision for allocated transfer risk, divided by average assets.
Realized Gain/Loss Secs
Pretax net gains or losses from the sale, exchange, retirement, or redemption of securities not held in trading accounts. After December 31, 1993 includes available-for-sale and held-to-maturity transactions divided by average assets.
Pretax Net Operating Income (TE)
Pretax operating income, plus securities gains or losses, divided by average assets.
Net Operating Income
After tax net operating income, including securities gains or losses, (which does not include extraordinary gains or losses), divided by average assets.
Adjusted Net Oper Income
Net operating income after taxes and securities gains or losses, plus the provision for possible loan and lease losses, less net loan and lease losses, divided by average assets.
Net Income Adjusted Sub S
Net income after securities gains or losses, extraordinary gains or losses, and applicable taxes, divided by average assets adjusted for sub chapter S status. Estimated income taxes are substituted for any reported applicable income taxes for banks that indicate sub chapter S status. Estimated income taxes: Federal income tax rates are applied to net income before extraordinary items and taxes plus non-deductible interest expense to carry tax-exempt securities less tax-exempt income from securities issued by states and political subdivisions, less tax-exempt income from leases, less tax-exempt income from other obligations of states and political subdivisions. (See appendix A-3 for tax table)
UBPR User’s Guide • December 2008 III-62

Please note that this ratio will be displayed only for banks that elect subchapter S status.
Net Income
Net income after securities gains or losses, extraordinary gains or losses, and applicable taxes divided by average assets.
Margin Analysis:
Interest Income (TE)/Average Earning Assets
Total interest income on a tax-equivalent basis divided by the average of the respective asset accounts involved in generating that income.
Interest Expense/Average Earning Assets
Total interest expense divided by the average of the respective asset accounts involved in generating interest income.
Net Interest Income (TE)/Average Earning Assets
Total interest income on a tax-equivalent basis, less total interest expense, divided by the average of the respective asset accounts involved in generating interest income.
Interest Income (TE) To Average Earned Assets
Loan & Lease Analysis
Net Loss to Average Total Loan & Lease
Gross loan and lease charge-offs, less gross recoveries (includes allocated transfer risk reserve charge-offs and recoveries), divided by average total loans and leases.
Earnings Coverage of Net Loss (X)
Net operating income before taxes, securities gains or losses, and extraordinary items, plus the provision for possible loan and lease-financing receivable losses divided by net loan and lease losses.
Loan & Lease Allowance Net Losses (X)
Ending balance of the allowance for possible loan and lease-financing receivable losses divided by net loan and lease losses. If gross recoveries exceed gross losses, NA is shown at this caption.
Capitalization
Cash Dividends to Net Income
Total of all cash dividends declared year-to-date divided by net income year-to-date. If net income is less than or equal to zero, NA is shown at this caption.
Retain Earns to Average Total Equity
Net income, less cash dividends declared, divided by average equity capital.
Yield on or cost of:
Total Loans & Lease (TE)
Interest and fees on loans and income on direct lease-financing receivables, plus the tax benefi t on tax-exempt loan and lease income, divided by average total loans and lease-financing receivables. See Appendix B regarding the calculation of tax benefi ts.
Loans in Domestic Offi ces
Interest and fees on loans held in domestic offi ces divided by average domestic offi ce loans.
Real Estate Loans
Interest and fees on domestic offi ce loans secured primarily by real estate, divided by average domestic real estate loans.
Loans Secured By 1-4 Family Residential Property
Interest and Fees on Loans Secured by 1–4 Family Real Estate Divided by Average Loans Secured by 1–4 Family Real Estate.
All Other Loans Secured By Real Estate
Interest and Fees on All Other Loans
Secured Real Estate Divided by Average Loans Secured by Real Estate.
Commercial & Industrial Loans
Interest and fees on domestic offi ce commercial and industrial loans, divided by average domestic commercial and industrial loans.
Individual Loans
Interest and fees on domestic offi ce loans to individuals for household, family and other personal expenditures divided by average domestic loans to individuals for household, family, and other personal expenditures.
Credit Card Plans
Interest and fees on credit card plans divided by the average for credit card and related plans.
Agricultural Loans
Interest and fees on domestic offi ce loans to finance agricultural production divided by average domestic loans to finance agricultural production.
Loans in Foreign Offi ces
Interest and fees on loans in foreign offices divided by average loans in foreign offices. Available for banks filing call form 031.
Total Investment Securities (TE)
Income on securities not held in trading accounts, plus the estimated tax benefit on tax-exempt municipal securities income, divided by average U.S. Treasury and U.S. government agency securities, state and political subdivisions, and other debt and equity securities.
Total Investment Securities (Book)
Income on securities not held in trading accounts, divided by average U.S. Treasury and U.S. government agency securities, state and political subdivisions, and other debt and equity securities.
UBPR User’s Guide • December 2008 III-63

US Treasury & Agency (Excluding MBS)
Income on U.S. Treasury securities and U.S. government agency obligations divided by average U. S. Treasury securities and U.S. government agency obligations. Excludes mortgage backed securities. Available from March 31, 2001 forward.
Mortgage Backed Securities
Income on mortgage backed securities divided by the average for those securities.
All Other Securities
Income on all other securities divided by the average for those securities. Includes taxable and tax-exempt obligations issued by state and local subdivisions.
Interest-Bearing Bank Balances
Interest on balances due from depository institutions divided by the average of interest-bearing balances due from depository institutions carried in domestic and foreign offi ce.
Federal Funds Sold & Resales
Income on federal funds sold and securities purchased under agreements to resell divided by the average of federal funds sold and securities purchased under agreements to resell.
Total Interest-Bearing Deposits
Interest on all interest-bearing time and savings deposits in domestic and foreign offices divided by average
interest-bearing time and savings deposits in domestic and foreign offi ces.
Transaction Accounts
Interest on transaction accounts (NOW accounts, ATS accounts, and telephone and preauthorized transfer accounts) divided by the average balance of such deposits.
Other Savings Deposits
For quarters from March 31 2001 forward includes interest on other savings deposits (all savings accounts and money market deposits accounts) divided by the average of such deposits. For quarters prior to March 31, 2001 excludes MMDA’s.
Time Deps over $100M or More
Interest on time certificates of deposit of $100 thousand or more issued by domestic offices divided by the average of domestic time certifi cates of deposit of $100 thousand or more. From March 31, 1997, time deposits open accounts; are included.
All Other Time Deposits
Interest on all domestic time deposits of less than $100,000 and open-account time deposits of $100,000 or more, divided by the average of such deposits. From March 31, 1997 forward, time deposit open accounts not included.
Deposits in Foreign Offi ces
Interest on deposits in foreign offi ces, Edge and Agreement subsidiaries and IBF’s divided by the average for such
deposits. Available for banks fi ling call form 031.
Federal Funds Purchased & Repos
The expense of federal funds purchased and securities sold under agreements to repurchase divided by the average of federal funds purchased and securities sold under agreements to repurchase.
Other Borrowed Money
Interest on demand notes (note balances) issued to the U.S. Treasury and on other borrowed money divided by the average of interest-bearing demand notes (note balances) issued to the U.S. Treasury and other liabilities for borrowed money.
Subordinated Notes & Debentures
Interest on notes and debentures subordinated to deposits divided by the average of notes and debentures subordinated to deposits.
All Interest-Bearing Funds
Interest on all interest-bearing deposits in domestic offices, interest-bearing foreign office deposits, demand notes (note balances) issued to the U.S. Treasury, other borrowed money, subordinated notes and debentures, and expense on federal funds purchased and securities sold under agreements to repurchase, interest expense on mortgage and capitalized leases divided by the average of the liabilities or funds that generated those expenses.
UBPR User’s Guide • December 2008 III-64

CERT # CHARTER #
DIST/RSSD COUNTY SECURITIZATION AND ASSET SALE ACTIVITIES PAGE 13
PERCENT CHANGE 06/30/2008 06/30/2007 12/31/2007 12/31/2006 12/31/2005 1 QTR 1 YEAR
SECURITIZATION ACTIVITIES 122,587,920 102,440,271 111,283,532 89,188,715 69,765,105 4.12 19.67 1-4 FAMILY RESIDENTIAL LOANS 122,013,578 101,818,576 110,689,709 88,535,977 69,741,269 4.15 19.83 HOME EQUITY LINES 0 0 0 0 0 N/A N/A CREDIT CARD RECEIVABLES 0 0 0 0 0 N/A N/A AUTO LOANS 0 0 0 0 0 N/A N/A COMMERCIAL & INDUSTRIAL LOANS 0 0 0 0 0 N/A N/A ALL OTHER LOANS AND LEASES 574 342 621 695 593 823 652 738 23 836 -1.49 -7.62
RETAINED INTEREST-ONLY STRIPS 20,653 20,875 23,447 25,664 196 -7.35 -1.06 1-4 FAMILY RESIDENTIAL LOANS 159 1,113 165 1,271 196 -1.24 -85.71 HOME EQUITY LOANS 0 0 0 0 0 N/A N/A CREDIT CARD RECEIVABLES 0 0 0 0 0 N/A N/A AUTO LOANS 0 0 0 0 0 N/A N/A COMMERCIAL & INDUSTRIAL LOANS 0 0 0 0 0 N/A N/A ALL OTHER LOANS AND LEASES 20 494 19 762 23 282 24 393 0 -7.39 3.70
RETAINED CREDIT ENHANCEMENTS 82,703 60,577 70,328 70,555 53,273 -14.51 36.53 1-4 FAMILY RESIDENTIAL LOANS 82,703 60,577 70,328 70,555 53,273 -14.51 36.53 HOME EQUITY LOANS 0 0 0 0 0 N/A N/A CREDIT CARD RECEIVABLES 0 0 0 0 0 N/A N/A AUTO LOANS 0 0 0 0 0 N/A N/A COMMERCIAL & INDUSTRIAL LOANS 0 0 0 0 0 N/A N/A ALL OTHER LOANS AND LEASES 0 0 0 0 0 N/A N/A
UNUSED LIQUIDITY COMMITTMENTS 0 0 0 0 0 N/A N/A
SELLERS INTEREST IN SECS & LOANS 0 0 0 0 0 N/A N/A HOME EQUITY LINES 0 0 0 0 0 N/A N/A CREDIT CARD RECEIVABLES 0 0 0 0 0 N/A N/A COMMERCIAL & INDUSTRIAL LOANS 0 0 0 0 0 N/A N/A
TOTAL RETAINED CREDIT EXPOSURE 103,356 81,452 93,775 96,219 53,469 -13.17 26.89
ASSET BACKED COMML PAPER COND 8,345,342 9,194,384 9,267,444 8,720,077 7,897,415 -8.51 -9.23 CR EXP SPONS BY BANK & OTHER 738,863 721,210 763,436 697,782 707,084 -4.60 2.45 LIQUID COMM BY BANK & OTHER 7,606,479 8,473,174 8,504,008 8,022,295 7,190,331 -8.87 -10.23
ACTIVITY %TOTAL ASSETS SECURITIZATION ACTIVITIES 71.48 57.85 63.55 48.85 39.36 1-4 FAMILY RESIDENTIAL LOANS 71.14 57.50 63.21 48.49 39.35 HOME EQUITY LINES 0.00 0.00 0.00 0.00 0.00 CREDIT CARD RECEIVABLES 0.00 0.00 0.00 0.00 0.00 AUTO LOANS 0.00 0.00 0.00 0.00 0.00 COMMERCIAL & INDUSTRIAL LOANS 0.00 0.00 0.00 0.00 0.00 ALL OTHER LOANS AND LEASES 0.33 0.35 0.34 0.36 0.01 ASSET BACKED COMML PAPER COND 4.87 5.19 5.29 4.78 4.46 CR EXP SPONS BY BANK & OTHER 0.43 0.41 0.44 0.38 0.40 LIQUID COMM BY BANK & OTHER 4.44 4.79 4.86 4.39 4.06
PERCENT OF TOT MANAGED ASSETS ON BALANCE SHEET & SEC ASSETS 1-4 FAMILY RESIDENTIAL LOANS 62.12 61.67 61.94 59.60 55.97 HOME EQUITY LINES 6.20 6.11 6.12 6.34 6.88 CREDIT CARD RECEIVABLES 0.15 0.01 0.14 0.00 0.00 AUTO LOANS 4.46 4.91 4.73 5.39 7.22 COMMERCIAL & INDUSTRIAL LOANS 10.97 9.95 9.84 11.06 11.69 ALL OTHER LOANS AND LEASES 16.10 17.35 17.23 17.61 18.25
UBPR User’s Guide • December 2008 III-65

UBPR Page 13
Securitziation and Asset Sale Activities
Data on bank securitization activities comes principally from call report schedule RC-S. This information is available for all banks and was first reported on the June 30, 2001 call report. Bank information is presented in dollar and percentage formats and no peer group information is calculated. One year and annualized quarterly growth rates are calculated for dollar items on page 13.
Securitization Activities
The total of all securitized assets from call schedule RC-S item 1, columns a:g.
1–4 Family Residential Loans
Dollar amount of securitized1–4 Family Residential loans reported on RC-S item 1, column a.
Home Equity Lines
Dollar amount of securitized home equity lines reported on RC-S item 1, column b.
Credit Card Receivables
Dollar amount of securitized credit card receivables reported on RC-S item 1, column c.
Auto Loans
Dollar amount of securitized auto loans reported on RC-S item 1, column d.
Commercial and Industrial Loans
Dollar amount of securitized commercial and industrial loans reported on RC-S item 1, column f.
All Other Loans and Leases
Dollar amount of securitized other consumer loans plus all other loans
reported on RC-S item 1, columns e and g.
Retained Interest Only Strips
The total of all retained interest only strips from call schedule RC-S item 2.a, columns a:g.
1–4 Family Residential Loans
Dollar amount of credit exposure from retained interest only strips on 1–4 Family Residential loans reported on RC-S item 2.a, column a.
Home Equity Lines
Dollar amount of credit exposure from retained interest only strips on home equity lines reported on RC-S item 2.a, column b.
Credit Card Receivables
Dollar amount of credit exposure from retained interest only strips on credit card receivables reported on RC-S item 2.a, column c.
Auto Loans
Dollar amount of credit exposure from retained interest only strips on auto loans reported on RC-S item 2.a, column d.
Comercial and Industrial Loans
Dollar amount of credit exposure from retained interest only strips on commercial and industrial loans reported on RC-S item 2.a, column f.
All Other Loans and Leases
Dollar amount of credit exposure from retained interest only strips on other consumer loans plus all other loans reported on RC-S item 2.a, columns e and g.
Retained Credit Enhancements
From March 31, 2001 through December 31, 2002 includes the total of All Other Credit Enhance
ments from call schedule RC-S items (RCFDB719) through RCFDB725). From March 31, 2003 forward includes the total of Subordinated Securities, Stand By Letters of Credit and All Other Credit Enhancements from call schedule RC-S items (RCFDC393) through (RCFDC406).
1–4 Family Residential Loans
From March 31, 2001 through December 31, 2002 includes All Other Credit Enhancements on 1–4 Family Residential Loans reported on RC-S item (CFDB719). From March 31, 2003 forward includes Subordinated Securities, Stank by Letters of Credit and All Other Credit Enhancements from call schedule RC-S items (RCFDC393) plus (RCFDC400).
Home Equity Lines
From March 31, 2001 through December 31, 2002 includes RC-S All Other Credit Enhancements on Home Equity Lines reported on RC-S item (RCFDB720). From March 31, 2003 forward includes Subordinated Securities, Stand by Letters of Credit and All Other Credit Enhancements from call schedule RC-S items (RCFDC394) plus (RCDDC401).
Credit Card Receivables
From March 31, 2001 through December 31, 2002 includes All Other Credit Enhancements on Credit Card Receivables reported on RC-S item (RCFDB721). From March 31, 2003 forward includes Subordinated Securities, Stand By Letters of Credit and All Other Credit Enhancements from call schedule RC-S items (RCFDC395) plus (RCFDC402).
Auto Loans
From March 31, 2001 through December 31, 2002 includes All Other Credit Enhancements on Auto Loans reported on RC-S items (RCFDB722). From March 31, 2003 forward includes Subordinated Securities,
UBPR User’s Guide • December 2008 III-66

Stand By Letters of Credit and All Other Credit Enhancements from call schedule RC-S items (RCFDC396) plus (RCFDC403).
Commercial and Industrial Loans
From March 31, 2001 through December 31, 2002 includes All Other Credit Enhancements on Commerial and Industrial Loans reported on RC-S item (RCFDB724). From March 31, 2003 forward includes Subordinated Securities, Stand By Letters of Credit and All Other Credit Enhancements from call schedule RC-S items (RCFDC398) plus (RCFDC405).
All Other Loans and Leases
From March 31, 2001 through December 31, 2002 includes All Other Credit Enhancements on Other Consumer Loans plus All Other Loans reported on RC-S item (RCFDB723) plus (RCFDB725). From March 31, 2003 forward includes Subordinated Securities, Stand by Letters of Credit and All Other Credit Enhancements from call schedule RC-S or the sum of items (RCFDC397), (RCFDC399), (RCFDC404) and (RCFDC406).
Unused Liquidity Commitments
Dollar amount of unused commitments to provide liquidity to asset sold and securitized as reported on call item 3, columns a:g.
Sellers Interest in Securities and Loans
Dollar amount of ownership (or sellers) interests carried as securities (RC-B) or loans (RC-C). Reported in RC-S items 6.a and 6.b, columns b, c and f.
Home Equity Lines
Dollar amount of ownership (or sellers) interests carried as securities (RC-B) or loans (RC-C). Reported in RC-S items 6.a and 6.b, columns b.
Credit Card Receivables
Dollar amount of ownership (or
sellers) interests carried as securities (RC-B) or loans (RC-C). Reported in RC-S items 6.a and 6.b, columns c.
Commercial and Industrial Loans
Dollar amount of ownership (or sellers) interests carried as securities (RC-B) or loans (RC-C). Reported in RC-S items 6.a and 6.b, columns f.
Total Retained Credit Exposure
The total of all retained interest only strips from call schedule RC-S item 2.a, columns a:g plus total of all other credit enhancements from call schedule RC-S item 2.b, columns a:g.
Asset Backed by Commercial Paper Conduits
Dollar amount of credit enhancements arising from conduit structures and commitments to provide liquidity to conduit structures as reported in RC-S items 3.a, 1 & 2 and 3.b, 1 & 2.
Credit Exposure Sponsored by Bank and Others
Dollar amount of credit enhancements arising from conduit structures as reported in RC-S items 3.a, 1 & 2.
Liquidity Commitments by Bank and Others
Dollar amount of commitments to provide liquidity to conduit structures as reported in RC-S items 3.b, 1 & 2.
Activity % of Total Assets
Each component of securitization activity is expressed as a percentage of total assets.
Securitization Activities
The total of all securitized assets from call schedule RC-S item 1, columns a:g, as a percent of total assets from RC item 12.
1–4 Family Residential Loans
Dollar amount of securitized1–4 Family Residential loans reported on RC-S item 1, column a, as a percent of total assets from RC item 12.
Home Equity Lines
Dollar amount of securitized home equity lines reported on RC-S item 1, column b, as a percent of total assets from RC item 12.
Credit Card Receivables
Dollar amount of securitized credit card receivables reported on RC-S item 1, column c, as a percent of total assets from RC item 12.
Auto Loans
Dollar amount of securitized auto loans reported on RC-S item 1, column d as a percent of total assets from RC item 12.
Commercial and Industrial Loans
Dollar amount of securitized commercial and industrial loans reported on RC-S item 1, column f as a percent of total assets from RC item 12.
All Other Loans and Leases
Dollar amount of securitized other consumer loans plus all other loans reported on RC-S item 1, columns e and g as a percent of total assets from RC item 12.
Asset Backed by Commercial Paper Conduits
Dollar amount of credit enhancements arising from conduit structures and commitments to provide liquidity to conduit structures as reported in RC-S items 3.a, 1 & 2 and 3.b, 1 & 2 as a percent of total assets from RC item 12.
Credit Exposure Sponsored by Bank and Others
Dollar amount of credit enhancements arising from conduit structures as reported in RC-S items 3.a, 1 & 2 as a percent of total assets from RC item 12.
UBPR User’s Guide • December 2008 III-67

Liquidity Commitments by Bank and Others
Dollar amount of commitments to provide liquidity to conduit structures as reported in RC-S items 3.b, 1 & 2 as a percent of total assets from RC item 12.
Percent of Total Managed Assets on Balance Sheet & Securitized Assets
The total of managed assets as reported on the balance sheet plus related securitized assets are expressed as a percentage of total assets plus total securitized assets.
1–4 Family Residential Loans
Dollar amount of securitized 1–4 Family Residential loans reported on RC-S item 1, column a. plus loans secured by 1–4 family residential real estate as reported on RC-C items 1.c.2 a & b as a percentage of total assets from RC item 12 plus the total of all securitized assets from call schedule RC-S item 1, columns a:g.
Home Equity Lines
Dollar amount of securitized home equity lines reported on RC-S item 1, column b plus home equity lines of credit from RC-C item 1.2.1 as a percentage of total assets from RC item 12 plus the total of all securitized assets from call schedule RC-S item 1, columns a:g.
Credit Card Receivables
Dollar amount of securitized credit card receivables reported on RC-S item 1, column c. plus loans to individuals on cards on RC-C item 6.a as a percent of total assets from schedule RC item 12 plus the total of all securitized assets from call schedule RC-S item 1, column a:g.
Auto Loans
Dollar amount of securitized auto loans reported on RC-S item 1, column d. plus other consumer loans from RC item 6.c as a percentage of total assets from RC item 12 plus the total of all securitized assets from call schedule RC-S item 1, columns a:g.
Commercial and Industrial Loans
Dollar amount of securitized commercial and industrial loans reported on RC-S item 1, column f plus commercial and industrial loans from RC item 4 as a percentage of total assets from RC item 12 plus the total of all securitized assets from call schedule RC-S item 1, columns a:g.
All Other Loans and Leases
Dollar amount of securitized other consumer loans plus all other loans reported on call schedule RC-S item 1, columns e and g plus total loans and leases RC-C item 12, less revolving lines secured by 1–4 family properties1.c.1, less closed end loans secured by 1–4 family properties item1.c.2, less loans to individuals on credit cards 6.a, less other consumer loans item RC-C 6.c, less commercial and industrial loans from RC-C item 4 as a percentage of total assets from RC item 12 plus the total of all securitized assets from call schedule RC-S item 1, columns a:g.
UBPR User’s Guide • December 2008 III-68

CERT # CHARTER #
DIST/RSSD COUNTY SECURITIZATION AND ASSET SALE ACTIVITIES PAGE 13A
06/30/2008 06/30/2007 12/31/2007 12/31/2006 12/31/2005 % TOT SECURITIZATION ACT BY TYPE RETAINED INT ONLY STRIPS 0.02 0.02 0.02 0.03 0.00 1-4 FAMILY RESIDENTIAL LOANS 0.00 0.00 0.00 0.00 0.00 HOME EQUITY LINES N/A N/A N/A N/A N/A CREDIT CARD RECEIVABLES N/A N/A N/A N/A N/A AUTO LOANS N/A N/A N/A N/A N/A COMMERCIAL & INDUSTRIAL LOANS N/A N/A N/A N/A N/A ALL OTHER LOANS AND LEASES 3.57 3.18 3.92 3.74 0.00 RETAINED CREDIT ENHANCEMENT 0.07 0.06 0.06 0.08 0.08 1-4 FAMILY RESIDENTIAL LOANS 0.07 0.06 0.06 0.08 0.08 HOME EQUITY LINES N/A N/A N/A N/A N/A CREDIT CARD RECEIVABLES N/A N/A N/A N/A N/A AUTO LOANS N/A N/A N/A N/A N/A COMMERCIAL & INDUSTRIAL LOANS N/A N/A N/A N/A N/A ALL OTHER LOANS AND LEASES 0.00 0.00 0.00 0.00 0.00 UNUSED COMM TO PROVIDE LIQUIDITY 0.00 0.00 0.00 0.00 0.00 SELLERS INT IN SECS& LNS % TRUST 0.00 0.00 0.00 0.00 0.00 HOME EQUITY LINES N/A N/A N/A N/A N/A CREDIT CARD RECEIVABLES N/A N/A N/A N/A N/A COMMERCIAL AND INDUSTRIAL LOANS N/A N/A N/A N/A N/A
PERCENT OF TIER 1 CAPITAL TOTAL RETAINED CREDIT EXPOSURE 0.83 0.63 0.76 0.75 0.46 RETAINED INTEREST-ONLY STRIPS 0.16 0.16 0.19 0.20 0.00 RETAINED CREDIT ENHANCEMENTS 0.66 0.47 0.57 0.55 0.45
30-89 DAY PD SECURITIZED ASSETS 1-4 FAMILY RESIDENTIAL LOANS 3 420 678 2 316 017 2 973 250 2 093 742 1 568 887 HOME EQUITY LINES 0 0 0 0 0 CREDIT CARD RECEIVABLES 0 0 0 0 0 AUTO LOANS 0 0 0 0 0 COMMERCIAL & INDUSTRIAL LOANS 0 0 0 0 0 ALL OTHER LOANS AND LEASES 29,087 30,896 32,461 33,707 1,698 TOTAL 30-89 DAY PD SECUR ASSET 3,449,765 2,346,913 3,005,711 2,127,449 1,570,585
90+ DAYS PD SECURITIZED ASSETS 1-4 FAMILY RESIDENTIAL LOANS 2,743,932 899,420 1,774,480 525,497 307,300 HOME EQUITY LINES 0 0 0 0 0 CREDIT CARD RECEIVABLES 0 0 0 0 0 AUTO LOANS 0 0 0 0 0 COMMERCIAL & INDUSTRIAL LOANS 0 0 0 0 0 ALL OTHER LOANS AND LEASES 23,250 23,084 27,954 27,006 2,330 TOTAL 90 + DAY PD SECUR ASSET 2,767,182 922,504 1,802,434 552,503 309,630
TOTAL PAST DUE SECURITIZED ASSETS 6,216,947 3,269,417 4,808,145 2,679,952 1,880,215
NET LOSSES SECURITIZED ASSETS 1-4 FAMILY RESIDENTIAL LOANS 89 10 37 116 82 HOME EQUITY LINES 0 0 0 0 0 CREDIT CARD RECEIVABLES 0 0 0 0 0 AUTO LOANS 0 0 0 0 0 COMMERCIAL & INDUSTRIAL LOANS 0 0 0 0 0 ALL OTHER LOANS AND LEASES 0 0 4 20 0 TOTAL NET CHARGE OFF SECUR ASSET N/A N/A N/A N/A N/A
UBPR User’s Guide • December 2008 III-69

UBPR Page 13A
% Total Securitization by Type
The type of securitization is expressed as a percentage of total securitized and sold assets by type.
Retained Interest Only Strips
The total of all retained interest only strips from call schedule RC-S item 2.a, columns a:g as a percentage of total of all securitized assets from call schedule RC-S item 1, columns a:g.
1–4 Family Residential Loans
Dollar amount of credit exposure from retained interest only strips on 1–4 Family Residential loans reported on RC-S item 2.a, column a as a percentage of securitized 1–4 family residential loans reported on RC-S item 1, column a.
Home Equity Lines
Dollar amount of credit exposure from retained interest only strips on home equity lines reported on RC-S item 2.a, column b as a percentage of securitized home equity lines reported on RC-S item 1, column b.
Credit Card Receivables
Dollar amount of credit exposure from retained interest only strips on credit card receivables reported on RC-S item 2.a, column c as a percentage of securitized credit card receivables reported on RC-S item 1, column c.
Auto Loans
Dollar amount of credit exposure from retained interest only strips on auto loans reported on RC-S item 2.a, column d as a percentage of securitized auto loans reported on RC-S item 1, column d.
Commercial and Industrial Loans
Dollar amount of credit exposure from retained interest only strips
UBPR User’s Guide • December 2008
on commercial and industrial loans reported on RC-S item 2.a, column f as a percentage of securitized commercial and industrial loans reported on RC-S item 1, column f.
All Other Loans and Leases
Dollar amount of credit exposure from retained interest only strips on other consumer loans plus all other loans reported on RC-S item 2.a, columns e and g as a percentage of securitized other consumer loans plus all other loans reported on RC-S item 1, columns e and g.
Retained Credit Enhancement
The total of all other credit enhancements from call schedule RC-S item 2, columns a:g as a percentage of total of all securitized assets from call schedule RC-S item 1, columns a:g.
1–4 Family Residential Loans
Dollar amount of all other credit enhancements on 1–4 Family Residential loans reported on RC-S item 2.b, column a as a percentage of securitized 1–4 family residential loans reported on RC-S item 1, column a.
Home Equity Lines
Dollar amount of all other credit enhancements on home equity lines reported on RC-S item 2.b, column b, as a percentage of home equity lines reported on RC-S item 1, column b.
Credit Card Receivables
Dollar amount of all other credit enhancements on credit card receivables reported on RC-S item 2.b, column c as a percentage of securitized credit card receivables reported on RC-S item 1, column c.
Auto Loans
Dollar amount of all other credit enhancements on auto loans reported
on RC-S item 2.b, column d as a percentage of securitized auto loans reported on RC-S item 1, column d.
Commercial and Industrial Loans
Dollar amount of all other credit enhancements on commercial and industrial loans reported on RC-S item 2.b, column f as a percentage of securitized commercial and industrial loans reported on RC-S item 1, column f.
All Other Loans and Leases
Dollar amount of all other credit enhancements on other consumer loans plus all other loans reported on RC-S item 2.a, columns e and g as a percentage of securitized other consumer loans plus all other loans reported on RC-S item 1, columns e and g.
Unused Commitments to Provide Liquidity
Dollar amount of unused commitments to provide liquidity to asset sold and securitized as reported on call schedule RC-S item 3, columns a:g as a percentage of all securitized assets from call schedule RC-S item 1, columns a:g.
Sellers Interest in Securities and Loans
Dollar amount of ownership (or sellers) interests carried as securities (RC-B) or loans (RC-C). Reported in RC-S items 6.a and 6.b, columns b, c and f. as a percentage of all securitized assets from call schedule RC-S item 1, columns a:g.
Home Equity Lines
Dollar amount of ownership (or sellers) interests carried as securities (RC-B) or loans (RC-C). Reported in RC-S items 6.a and 6.b, column b, as a percentage of home equity lines reported on RC-S item 1, column b.
III-70

Credit Card Receivables
Dollar amount of ownership (or sellers) interests carried as securities (RC-B) or loans (RC-C). Reported in RC-S items 6.a and 6.b, columns c as a percentage of securitized credit card receivables reported on RC-S item 1, column c.
Commercial and Industrial Loans
Dollar amount of ownership (or sellers) interests carried as securities (RC-B) or loans (RC-C). Reported in RC-S items 6.a and 6.b, columns f as a percentage of securitized commercial and industrial loans reported on RC-S item 1, column f.
Percent of Tier 1 Capital
Total Retained Credit Exposure
The total of all retained interest only strips from call schedule RC-S item 2.a, columns a:g plus the total of all other credit enhancements from call schedule RC-S item 2.b, columns a:g as a percentage of tier 1 capital. See definitions on UBPR page 11a for details on tier 1 capital.
Retained Interest Only Strips
The total of all retained interest only strips from call schedule RC-S item 2.a, columns a:g as a percentage of tier 1 capital. See definitions on UBPR page 11a for details on tier 1 capital.
Retainend Credit Enhancements
The total of all other credit enhancements from call schedule RC-S item 2.b as a percentage of tier 1 capital. See defi nitions on UBPR page 11a for details on tier 1 capital.
30–89 Day Past Due Securitized Assets
1–4 Family Residential Loans
Dollar amount of securitized 1–4 family residential loans 30 to 89 days past due as reported in RC-S item 4.a, column a.
Home Equity Lines
Dollar amount of securitized home equity lines 30 to 89 days past due as reported in RC-S item 4.a, column b.
Credit Card Receivables
Dollar amount of securitized credit card receivables 30 to 89 days past due as reported in RC-S item 4.a, column c.
Auto Loans
Dollar amount of securitized auto loans 30 to 89 days past due as reported in RC-S item 4.a, column d.
Commercial and Industrial
Dollar amount of securitized commercial and industrial loans 30 to 89 days past due as reported in RC-S item 4.a, column f.
All Other Loans and Leases
Dollar amount of securitized all other loans and leases 30 to 89 days past due as reported in RC-S item 4.a, column e & g.
Total 30–89 Day Past Due Securitized Assets
Dollar amount of all securitized loans and leases 30 to 89 days past due as reported in RC-S, item 4.a, columns a:g.
90+ Days Past Due Securitized Assets
1–4 Family Residential Loans
Dollar amount of securitized 1–4 family residential loans 90 days and over past due as reported in RC-S item 4.b, column a.
Home Equity Lines
Dollar amount of securitized home equity lines 90 days and over past due as reported in RC-S item 4.b, column b.
Credit Card Receivables
Dollar amount of securitized credit
card receivables 90 days and over past due as reported in RC-S item 4.b, column c.
Auto Loans
Dollar amount of securitized auto loans 90 days and over as reported in RC-S item 4.b, column d.
Commercial and Industrial
Dollar amount of securitized commercial and industrial loans 90 days and over due as reported in RC-S item 4.b, column f.
All Other Loans and Leases
Dollar amount of securitized all other loans and leases 90 days and over past due as reported in RC-S item 4.b, column e & g.
Total 90 Plus Days Past Due Securitized Assets
Dollar amount of all securitized loans and leases 90 plus days past due as reported in RC-S, item 4.b, columns a:g.
Total Past Due Securitized Assets
Dollar amount of all securitized loans and leases past due as reported in RC-S items 4.a and 4.b, columns a:g.
Net Losses Securitized Assets
Net losses are defined as chargeoffs less recoveries by each securitization category.
1–4 Family Residential Loans
Dollar amount of net chargeoffs for securitized 1–4 family residential loans as reported in RC-S column a, items 5.a less 5.b.
Home Equity Lines
Dollar amount of net chargeoffs for securitized home equity lines as reported in RC-S column b, items 5.a less 5.b.
UBPR User’s Guide • December 2008 III-71

Credit Card Receivables
Dollar amount of net chargeoffs for securitized credit card receivables as reported in RC-S column c, items 5.a and 5.b.
Auto Loans
Dollar amount of net chargeoffs for securitized auto loans as reported in RC-S column d, items 5.a less 5.b.
Commercial and Industrial
Dollar amount of net chargeoffs for securitized commercial and industrial loans as reported in RC-S column f, items 5.a less 5.b.
All Other Loans and Leases
Dollar amount of net chargeoffs for securitized all other loans and leases
as reported in RC-S columns e & g, items 5.a less 5.b.
Total New Chargeoffs Securitized Assets
Dollar amount of all net chargeoffs for securitized loan and leases as reported in RC-S columns a:g, items 5.a less 5.b.
UBPR User’s Guide • December 2008 III-72
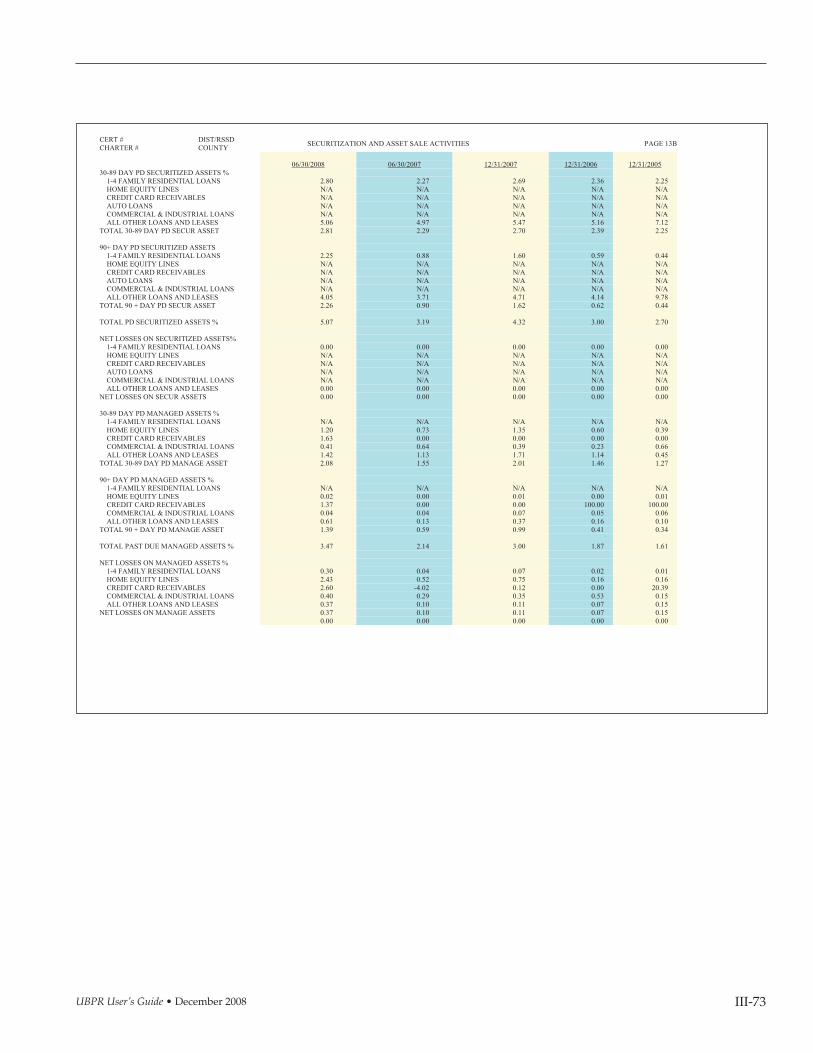
CERT # CHARTER #
DIST/RSSD COUNTY SECURITIZATION AND ASSET SALE ACTIVITIES PAGE 13B
06/30/2008 06/30/2007 12/31/2007 12/31/2006 12/31/2005 30-89 DAY PD SECURITIZED ASSETS % 1-4 FAMILY RESIDENTIAL LOANS 2.80 2.27 2.69 2.36 2.25 HOME EQUITY LINES N/A N/A N/A N/A N/A CREDIT CARD RECEIVABLES N/A N/A N/A N/A N/A AUTO LOANS N/A N/A N/A N/A N/A COMMERCIAL & INDUSTRIAL LOANS N/A N/A N/A N/A N/A ALL OTHER LOANS AND LEASES 5.06 4.97 5.47 5.16 7.12 TOTAL 30-89 DAY PD SECUR ASSET 2.81 2.29 2.70 2.39 2.25
90+ DAY PD SECURITIZED ASSETS 1-4 FAMILY RESIDENTIAL LOANS 2.25 0.88 1.60 0.59 0.44 HOME EQUITY LINES N/A N/A N/A N/A N/A CREDIT CARD RECEIVABLES N/A N/A N/A N/A N/A AUTO LOANS N/A N/A N/A N/A N/A COMMERCIAL & INDUSTRIAL LOANS N/A N/A N/A N/A N/A ALL OTHER LOANS AND LEASES 4.05 3.71 4.71 4.14 9.78 TOTAL 90 + DAY PD SECUR ASSET 2.26 0.90 1.62 0.62 0.44
TOTAL PD SECURITIZED ASSETS % 5.07 3.19 4.32 3.00 2.70
NET LOSSES ON SECURITIZED ASSETS% 1-4 FAMILY RESIDENTIAL LOANS 0.00 0.00 0.00 0.00 0.00 HOME EQUITY LINES N/A N/A N/A N/A N/A CREDIT CARD RECEIVABLES N/A N/A N/A N/A N/A AUTO LOANS N/A N/A N/A N/A N/A COMMERCIAL & INDUSTRIAL LOANS N/A N/A N/A N/A N/A ALL OTHER LOANS AND LEASES 0.00 0.00 0.00 0.00 0.00 NET LOSSES ON SECUR ASSETS 0.00 0.00 0.00 0.00 0.00
30-89 DAY PD MANAGED ASSETS % 1-4 FAMILY RESIDENTIAL LOANS N/A N/A N/A N/A N/A HOME EQUITY LINES 1.20 0.73 1.35 0.60 0.39 CREDIT CARD RECEIVABLES 1.63 0.00 0.00 0.00 0.00 COMMERCIAL & INDUSTRIAL LOANS 0.41 0.64 0.39 0.23 0.66 ALL OTHER LOANS AND LEASES 1.42 1.13 1.71 1.14 0.45 TOTAL 30-89 DAY PD MANAGE ASSET 2.08 1.55 2.01 1.46 1.27
90+ DAY PD MANAGED ASSETS % 1-4 FAMILY RESIDENTIAL LOANS N/A N/A N/A N/A N/A HOME EQUITY LINES 0.02 0.00 0.01 0.00 0.01 CREDIT CARD RECEIVABLES 1.37 0.00 0.00 100.00 100.00 COMMERCIAL & INDUSTRIAL LOANS 0.04 0.04 0.07 0.05 0.06 ALL OTHER LOANS AND LEASES 0.61 0.13 0.37 0.16 0.10 TOTAL 90 + DAY PD MANAGE ASSET 1.39 0.59 0.99 0.41 0.34
TOTAL PAST DUE MANAGED ASSETS % 3.47 2.14 3.00 1.87 1.61
NET LOSSES ON MANAGED ASSETS % 1-4 FAMILY RESIDENTIAL LOANS 0.30 0.04 0.07 0.02 0.01 HOME EQUITY LINES 2.43 0.52 0.75 0.16 0.16 CREDIT CARD RECEIVABLES 2.60 -4.02 0.12 0.00 20.39 COMMERCIAL & INDUSTRIAL LOANS 0.40 0.29 0.35 0.53 0.15 ALL OTHER LOANS AND LEASES 0.37 0.10 0.11 0.07 0.15 NET LOSSES ON MANAGE ASSETS 0.37 0.10 0.11 0.07 0.15
0.00 0.00 0.00 0.00 0.00
UBPR User’s Guide • December 2008 III-73

UBPR Page 13B
30–89 Day Past Due Securitized Assets %
Delinquencies are expressed as a percentage of securitized assets by category.
1–4 Family Residential Loans
Dollar amount of securitized 1–4 family residential loans 30 to 89 days past due as reported in RC-S item 4.a column a as a percentage of securitized 1–4 Family Residential loans reported on RC-S item 1, column a.
Home Equity Lines
Dollar amount of securitized home equity lines 30 to 89 days past due as reported in RC-S item 4.a, column b as a percentage of home equity lines reported on RC-S item 1, column b.
Credit Card Receivables
Dollar amount of securitized credit card receivables 30 to 89 days past due as reported in RC-S item 4.a, column c as a percentage of securitized credit card receivables reported on RC-S item 1, column c.
Auto Loans
Dollar amount of securitized auto loans 30 to 89 days past due as reported in RC-S item 4.a, column d as a percentage of securitized auto loans reported on RC-S item 1, column d.
Commercial and Industrial
Dollar amount of securitized commercial and industrial loans 30 to 89 days past due as reported in RC-S item 4.a, column f as a percentage of securitized commercial and industrial loans reported on RC-S item 1, column f.
All Other Loans and Leases
Dollar amount of securitized all other loans and leases 30 to 89 days past due as reported in RC-S item 4.a,
column e & g as a percentage of securitized other consumer loans plus all other loans reported on RC-S item 1, columns e and g.
Total 30–89 Day Past Due Securitized Assets
Dollar amount of all securitized loans and leases 30 to 89 days past due as reported in RC-S, item 4.a, columns a:g as a percentage of the total of all securitized assets from call schedule RC-S item 1, columns a:g.
90+ Day Past Due Securitized Assets %
Delinquencies are expressed as a percentage of securitized assets by category.
1–4 Family Residential Loans
Dollar amount of securitized 1–4 family residential loans 90 plus days past due as reported in RC-S item 4.b, column a as a percentage of securitized 1–4 Family Residential loans reported on RC-S item 1, column a.
Home Equity Lines
Dollar amount of securitized home equity lines 90 plus days past due as reported in RC-S item 4.b, column b as a percentage of home equity lines reported on RC-S item 1, column b.
Credit Card Receivables
Dollar amount of securitized credit card receivables 90 plus days past due as reported in RC-S item 4.b, column c as a percentage of securitized credit card receivables reported on RC-S item 1, column c.
Auto Loans
Dollar amount of securitized auto loans 90 plus days past due as reported in RC-S item 4.b, column d as a percentage of securitized auto loans reported on RC-S item 1, column d.
Commercial and Industrial
Dollar amount of securitized commercial and industrial loans 90 plus days past due as reported in RC-S item 4.b, column f as a percentage of securitized commercial and industrial loans reported on RC-S item 1, column f.
All Other Loans and Leases
Dollar amount of securitized all other loans and leases 90 plus days past due as reported in RC-S item 4.b, column e & g as a percentage of securitized other consumer loans plus all other loans reported on RC-S item 1, columns e and g.
Total 90 + Days Past Due Securitized Assets
Dollar amount of all securitized loans and leases 90 plus days past due as reported in RC-S, item 4.b, columns a:g as a percentage of the total of all securitized assets from call schedule RC-S item 1, columns a:g.
Total Past Due Securitized Assets %
Dollar amount of all past due securitized loans and leases in RC-S, items 4.a and 4.b, columns a:g as a percentage of the total of all securitized assets from call schedule RC-S item 1, columns a:g.
Net Losses Securitized Assets %
Net losses each securitization category are annualized then expressed as a percentage of a 5 quarter annual average of the related securitized assets.
1–4 Family Residential Loans
Annualized net chargeoffs for securitized 1–4 family residential loans as reported in RC-S column a, items 5.a less 5.b as a percentage of securitized 1–4 Family Residential loans reported
UBPR User’s Guide • December 2008 III-74

on RC-S item 1, column a. Securitized assets are averaged for 5 quarters.
Home Equity Lines
Annualized net chargeoffs for securitized home equity lines as reported in RC-S column b, items 5.a less 5.b as a percentage of home equity lines reported on RC-S item 1, column b. Securitized assets are averaged for 5 quarters.
Credit Card Receivables
Annualized net chargeoffs for securitized credit card receivables as reported in RC-S column c, items, 5.a less 5.b as a percentage of securitized credit card receivables reported on RC-S item 1, column c. Securitized assets are averaged for 5 quarters.
Auto Loans
Annualized net chargeoffs for securitized auto loans as reported in RC-S column d, items 5.a less 5.b, as a percentage of securitized auto loans reported on RC-S item 1, column d. Securitized assets are averaged for 5 quarters.
Commercial and Industrial
Annualized net chargeoffs for securitized commercial and industrial loans as reported in RC-S column f, items 5.a less 5.b as a percentage of securitized commercial and industrial loans reported on RC-S item 1, column f. Securitized assets are averaged for 5 quarters.
All Other Loans and Leases
Annualized net chargeoffs for securitized all other loans and leases as reported in RC-S columns e & g, items 5.a less 5.b expressed as a percentage of securitized other consumer loans plus all other loans reported on RC-S item 1, columns e and g. Securitized assets are averaged for 5 quarters.
Net Charge Losses Securitized Assets
Dollar amount of all net chargeoffs for securitized loan and leases as
reported in RC-S columns a:g, items 5.a less 5.b as a percentage of the total of all securitized assets from call schedule RC-S, item 1, columns a:g. Securitized assets are averaged for 5 quarters.
30–89 Day Past Due Managed Assets %
Delinquencies are combined for on-balance sheet and securitized assets.
1–4 Family Residential Loans
Dollar amount of securitized 1–4 family residential loans 30 to 89 days past due as reported in RC-S item 4.a, column a plus 1–4 family residential loans 30–89 days past due as reported on RC-N item 1.c.2, column a as a percent of securitized1–4 Family Residential loans reported on RC-S item 1, column a. plus loans secured by 1–4 family residential real estate as reported on RC-C items 1.c.2 a & b.
Home Equity Lines
Dollar amount of securitized home equity lines 30 to 89 days past due as reported in RC-S item 4.a, column b plus revolving loans 30-89 days past due as reported on RC-N 1.c.1, column a as a percentage of securitized home equity lines reported on RC-S item 1, column b plus home equity lines of credit from RC-C item 1.2.1.
Credit Card Receivables
Dollar amount of securitized credit card receivables 30 to 89 days past due as reported in RC-S item 4.a, column c plus credit cards 30–89 days past due as reported in RC-N item 5.a, column a as a percentage of securitized credit card receivables reported on RC-S item 1, column c. plus loans to individuals on cards on RC-C item 6.a.
Commercial and Industrial
Dollar amount of securitized commercial and industrial loans 30 to 89 days past due as reported in RC-S item 4.a, column f plus commercial and industrial loans 30-89 days past due as reported in RC-N item 4, col
umn a as a percentage of securitized commercial and industrial loans reported on RC-S item 1, column f plus commercial and industrial loans from RC item 4.
All Other Loans and Leases
Dollar amount of securitized all other loans and leases 30 to 89 days past due as reported in RC-S item 4.a, column e & g plus loans and leases 30 to 89 days past due as reported on RC-N column a in the following categories: construction and land development item 1.a, plus secured by farm land item 1.b, plus secured by multifamily properties item 1.d, plus secured by nonfarm nonresidential properties item 1.e, plus loans to depository institutions item 2, plus loans to finance agricultural production item 3, plus loans to foreign governments item 6, plus all other loans item 7, plus lease fi nancing receivables item 8, as a percentage of securitized other consumer loans plus all other loans reported on call schedule RC-S item 1, columns e and g plus total loans and leases RC-C item 12, less revolving lines secured by 1–4 family properties1.c.1, less closed end loans secured by 1–4 family properties item1.c.2, less loans to individuals on credit cards item 6.a, less other consumer loans item RC-C 6.c, less commercial and industrial loans from RC-C item 4.
Total 30–89 Day Past Due Managed Assets
Dollar amount of all securitized loans and leases 30 to 89 days past due as reported in RC-S, item 4.a, columns a:g plus loans and leases 30 to 89 days past due as reported in RC-N items 1:8 as a percentage of all securitized assets as reported on RC-S item 1, columns a:g plus total loans and leases as reported on schedule RC-C item 12.
90 Plus Day Past Due Managed Assets %
Delinquencies are combined for on-balance sheet and securitized assets.
UBPR User’s Guide • December 2008 III-75

1–4 Familly Residential Loans
Dollar amount of securitized 1–4 family residential loans 90 plus days past due as reported in RC-S item 4.B column a plus 1–4 family residential loans 90 days past due as reported on RC-N item 1.c.2, column b as a percent of securitized 1-4 Family Residential loans reported on RC-S item 1, column a, plus loans secured by 1–4 family residential real estate as reported on RC-C items 1.c.2, collumns a & b.
Home Equity Lines
Dollar amount of securitized home equity lines 90 plus days past due as reported in RC-S item 4.b, column b plus revolving loans 90 plus days past due as reported on RC-N 1.c.1 column b as a percentage of securitized home equity lines reported on RC-S item 1, column b plus home equity lines of credit from RC-C item 1.2.1.
Credit Card Receivables
Dollar amount of securitized credit card receivables 90 plus days past due as reported in RC-S item 4.b, column c plus credit cards 90 plus days past due as reported in RC-N item 5.a, column b as a percentage of securitized credit card receivables reported on RC-S item 1, column c. plus loans to individuals on cards on RC-C item 6.a.
Commercial and Industrial
Dollar amount of securitized commercial and industrial loans 90 plus days past due as reported in RC-S item 4.b, column f plus commercial and industrial loans 90 plus days past due as reported in RC-N item 4 column b as a percentage of securitized commercial and industrial loans reported on RC-S item 1, column f plus commercial and industrial loans from RC item 4.
All Other Loans and Leases
Dollar amount of securitized all other loans and leases 90- plus days past due as reported in RC-S item 4.b, columns e & g plus loans and leases
30 to 89 days past due as reported on RC-N column b in the following categories: construction and land development item 1.a, plus secured by farm land item 1.b, plus secured by multifamily properties item 1.d, plus secured by nonfarm nonresidential properties item 1.e, plus loans to depository institutions item 2, plus loans to finance agricultural production item 3, plus loans to foreign governments item 6, plus all other loans item 7, plus lease fi nancing receivables item 8, as a percentage of securitized other consumer loans plus all other loans reported on call schedule RC-S item 1, columns e and g plus total loans and leases RC-C item 12, less revolving lines secured by 1–4 family properties1.c.1, less closed end loans secured by 1–4 family properties item 1.c.2, less loans to individuals on credit cards item 6.a, less other consumer loans item RC-C 6.c, less commercial and industrial loans from RC-C item 4.
Total 90 Plus Day Past Due Managed Assets
Dollar amount of all securitized loans and leases 90 plus days past due as reported in RC-S, item 4.b, columns a:g plus loans and leases 90 plus days past due as reported in RC-N items 1:8, column b as a percentage of all securitized assets as reported on RC-S item 1, columns a:g plus total loans and leases as reported on schedule RC-C item 12.
Total Past Due Managed Assets
Dollar amount of all securitized loans and leases past due as reported in RC-S items 4.a and 4.b, columns a:g plus loans and leases past due as reported in schedule RC-N items 1:8 as a percentage of all securitized assets as reported on RC-S item 1, columns a:g plus total loans and leases as reported on schedule RC-C item 12.
Net Losses on Managed Assets %
Net losses are combined for each securitized and on-balance sheet
asset category then annualized and expressed as a percentage of the related the related securitized and on-balance sheet assets. The denominator is a five period average.
1–4 Family Residential Loans
Annualized net chargeoffs on securitized 1–4 family residential loans as reported in RC-S column a, item 5.a less 5.b plus net chargeoffs on 1–4 family residential loans as reported in RI-B item 1.c.2, column a less column b as a percent of securitized 1–4 Family Residential loans reported on RC-S item 1, column a, plus loans secured by 1–4 family residential real estate as reported on RC-C items 1.c.2, columns a & b. Denominator is averaged for 5 periods.
Home Equity Lines
Annualized net chargeoffs on securitized home equity lines as reported in RC-S column b item 5.a less 5.b plus net chargeoffs on revolving loans on RI-B item 1.c.1, column a less column b as a percentage of securitized home equity lines reported on RC-S item 1, column b plus home equity lines of credit from RC-C item 1.2.1. Denominator is averaged for 5 quarters.
Credit Card Receivables
Annualized net chargeoffs on securitized credit card receivables as reported in RC-S column c, item 5.a less 5.b plus net chargeoffs on credit cards as reported in RI-B item 5.a, column a less column b as a percentage of securitized credit card receivables reported on RC-S item 1, column c, plus loans to individuals on cards on RC-C item 6.a. Denominator is averaged for 5 quarters.
Commercial and Industrial
Annualized net chargeoffs on securitized commercial and industrial loans as reported in RC-S column f, item 5.a less 5.b plus net chargeoffs on commercial and industrial loans as reported in RI-B item 4, column a less column b as a percentage of
UBPR User’s Guide • December 2008 III-76

securitized commercial and industrial loans reported on RC-S item 1, column f plus commercial and industrial loans from RC item 4. Denominator is averaged for 5 quarters.
All Other Loans and Leases
Annualized net chargeoffs on securitized all other loans and leases 90- plus days past due as reported in RC-S columns e and g item 5.a less 5.b, plus net chargeoffs on other loans and leases as reported in RI-B column a less column b in the following categories: construction and land development item 1.a, plus secured by farm land item 1.b, plus secured
by multifamily properties item 1.d, plus secured by nonfarm nonresidential properties item 1.e, plus loans to depository institutions item 2, plus loans to finance agricultural production item 3, plus loans to foreign governments item 6, plus all other loans item 7, plus lease fi nancing receivables item 8, as a percentage of securitized other consumer loans plus all other loans reported on call schedule RC-S item 1, columns e and g plus total loans and leases RC-C item 12, less revolving lines secured by 1–4 family properties1.c.1, less closed end loans secured by 1-4 family properties item1.c.2, less loans to individuals item on credit cards 6.a, less other consumer loans item RC-C 6.c,
less commercial and industrial loans from RC-C item 4. Denominator is averaged for 5 quarters.
Net Losses on Managed Assets
Annualized net chargeoffs on securitized loans and leases as reported on schedule RC-S columns a:g item 5.a less 5.b plus net chargeoffs on loans and leases as reported in RI-B items 1:8, column a less b as a percentage of all securitized loans and leases as reported in schedule RC-S item 1, columns a:g plus total loans as reported on schedule RC-C item 12. Denominator is averaged for 5 quarters.
UBPR User’s Guide • December 2008 III-77

SUMMARY INFORMATION FOR BANKS STAVG AVERAGE FOR ALL INSURED COMMERCIAL BANKS BANKS WITH ASSETS - $MILL 06/30/08
06/30/2008 6/30/2007 12/31/2007 12/31/2006 12/31/2005 0-25 25-100 100+ EARNINGS AND PROFITABILITY PERCENT OF AVERAGE ASSETS: INTEREST INCOME (TE) 6 26 7 51 7 46 7 35 6 33 5 62 6 42 6 21 - INTEREST EXPENSE 2 94 3 38 3 43 2 96 2 06 1 54 2 68 3 05 NET INTEREST INCOME (TE) 3 32 4 13 4 03 4 39 4 26 4 09 3 74 3 15 + NONINTEREST INCOME 0 60 0 64 0 64 0 69 0 75 5 16 0 59 0 59 - NONINTEREST EXPENSE 3 07 3 07 3 11 3 30 3 17 14 89 3 82 2 79 - PROVISION: LOAN&LEASE LOSSES 0 52 0 24 0 41 0 32 0 30 0 82 0 35 0 60 = PRETAX OPERATING INCOME (TE) 0 29 1 52 1 13 1 58 1 62 -6 46 0 14 0 33 + SECURITIES GAINS (LOSSES) 0 03 0 00 0 00 0 00 0 00 0 03 0 02 0 03 = PRETAX NET OPERATING INC (TE) 0 33 1 53 1 13 1 58 1 62 -6 44 0 18 0 38 NET OPERATING INCOME 0 19 1 09 0 82 1 10 1 14 -7 26 0 00 0 24 ADJUSTED NET OPERATING INCOME 0 43 1 26 1 07 1 30 1 29 -6 60 0 16 0 52 NET INCOME ADJUSTED SUB S 0 14 0 99 0 74 1 00 1 06 -7 26 -0 10 0 21 NET INCOME 0 19 1 09 0 82 1 10 1 14 -7 26 -0 01 0 24
MARGIN ANALYSIS: AVG EARNINGS ASSETS TO AVG ASSETS 93 60 94 21 94 09 94 01 93 92 90 94 93 68 93 57 AVG INT-BEARING FUNDS TO AVG AST 79 15 77 48 77 87 76 56 76 91 44 54 73 17 81 08 INT INC (TE) TO AVG EARN ASSETS 6 68 7 99 7 94 7 83 6 76 6 16 6 86 6 63 INT EXPENSE TO AVG EARN ASSETS 3 14 3 60 3 65 3 16 2 19 1 64 2 86 3 26 NET INT INC-TE TO AVG EARN ASSET 3 56 4 40 4 30 4 68 4 55 4 52 4 00 3 38
LOAN & LEASE ANALYSIS: NET LOSS TO AVERAGE TOTAL LN&LS 0 40 0 10 0 23 0 15 0 16 0 39 0 24 0 47 EARNINGS COVERAGE OF NET LOSS(X) 11 92 39 00 20 01 41 97 38 37 2 62 16 89 10 55 LN&LS ALLOW TO LN&LS NOT HFS 1 56 1 36 1 47 1 38 1 39 1 82 1 43 1 60 LN&LS ALLOWANCE TO NET LOSSES(X) 12 78 22 23 13 78 21 71 19 81 5 39 17 51 11 47 LN&LS ALLOWANCE TO TOTAL LN&LS 1 55 1 36 1 46 1 37 1 39 1 56 1 43 1 59
LIQUIDITY: NET NONCORE FUNDING DEPENDENCE 30 67 24 85 26 34 23 32 21 40 -97 31 21 67 34 78 NET LOANS & LEASES TO ASSETS 71 95 71 80 71 58 70 38 70 20 34 84 66 57 74 49
CAPITALIZATION TIER ONE LEVERAGE CAPITAL 10 21 10 75 10 43 11 05 10 27 43 43 14 34 9 14 CASH DIVIDENDS TO NET INCOME 35 06 27 10 35 94 26 28 25 94 17 50 33 48 37 20 RETAIN EARNS TO AVG TOTAL EQUITY -1 53 5 95 3 30 6 96 7 19 -6 44 -1 37 -1 73
GROWTH RATES: ASSETS 11 12 15 95 14 22 16 51 17 55 1 31 14 83 10 15 TIER ONE CAPITAL 3 08 9 89 6 83 12 17 13 90 -0 45 1 40 3 80 NET LOANS & LEASES 11 72 17 52 15 81 17 14 19 14 3 78 18 70 9 87 SHORT TERM INVESTMENTS -3 39 42 07 3 47 64 23 81 84 -13 00 -4 51 -2 77 SHORT TERM NONCORE FUNDING 28 96 33 32 25 85 45 80 43 31 35 95 35 25 26 51 NONCURRENT LOANS & LEASES: TOTAL LN&LS-90+ DAYS PAST DUE 0 15 0 11 0 19 0 10 0 10 0 13 0 22 0 13
- NONACCRUAL 2 21 0 53 1 05 0 42 0 40 1 23 1 27 2 85 - TOTAL 2 44 0 73 1 34 0 59 0 56 1 35 1 56 3 05
TOTAL ASSETS ($MILLIONS) 274,866 272,508 274,492 273,664 263,109 128 6,027 268,710 EQUITY CAPITAL ($MILLIONS) 29,802 29,858 30,266 29,468 27,453 45 880 28,876 NET INCOME ($ MILLIONS) 853 1,795 2,878 3,438 3,225 -1 3 852 NUMBER OF BANKS IN TABULATION 329 329 327 330 328 7 90 232
UBPR User’s Guide • December 2008 III-78

UBPR Page STAVG
Summary Information For Banks in State
This page displays statewide peer group averages for Summary Ratio information similar to that found on page 1 of the UBPR.
Four different peer groups appear on this page. First, all banks are combined into a statewide peer group. Then banks are grouped into one of three asset-based statewide peer groups. The asset ranges are: less than $25M, $25M to $100M and over $100M.
Statewide peer group average data is not designed to be a replacement for nationwide peer group information, but as a supplement to provide insight into possible local trends.
The averaging process follows that used for the nationwide peer groups in that banks above the 95th percentile and below the 5th percentile are excluded from the average.
Earnings and Profi tability
Percent of Average Assets:
Interest Income (TE)
All income from earning assets plus the tax benefit on tax-exempt loans, leases, and municipal securities, divided by average assets.
Interest Expense
Total interest expense divided by average assets.
Net Interest Income (TE)
Total interest income, plus the tax benefit on tax-exempt income, less total interest expense, divided by average assets.
Noninterest Income
Income derived from bank services and sources other than interest-
bearing assets, divided by average assets.
Noninterest Expense
Salaries and employee benefits, expenses of premises and the fi xed assets and other noninterest expense divided by average assets.
Provision-Loan/Lease Losses (Percent of Average Assets)
Provision for loan and lease-financing receivables losses divided by average assets.
Pretax Operating Income (TE) (Percent of Average Assets)
Net interest income on a tax-equivalent basis plus noninterest income, less noninterest expenses, the provision for loan and lease-financing receivables losses and the provision for allocated transfer risk, divided by average assets.
Realized Gain/Loss Secs
Pretax net gains for losses from the sale, exchange, retirement, or redemption of securities not held in trading accounts. After December 31, 1993 includes available-for-sale and held-to-maturity transactions divided by average assets.
Pretax Net Operating Income (TE)
Pretax operating income, plus securities gains or losses, divided by average assets.
Net Operating Income
After tax net operating income, including securities gains or losses, (which does not include extraordinary gains or losses), divided by average assets.
Adjusted Net Oper Income
Net operating income after taxes and securities gains or losses, plus the provision for possible loan and lease
losses, less net loan and lease losses, divided by average assets.
Net Income Adjusted Sub S
Net income after securities gains or losses, extraordinary gains or losses, and applicable taxes, divided by average assets adjusted for sub chapter S status. Estimated income taxes are substituted for any reported applicable income taxes for banks that indicate sub chapter S status. Estimated income taxes: Federal income tax rates are applied to net income before extraordinary items and taxes plus non-deductible interest expense to carry tax-exempt securities less tax-exempt income from securities issued by states and political subdivisions, less tax-exempt income from leases, less tax-exempt income from other obligations of states and political subdivisions. (See appendix A-3 for tax table)
Net Income
Net income after securities gains or losses, extraordinary gains or losses, and applicable taxes, divided by average assets.
Margin Analysis
Average Earning Assets/Average Earning Assets
Year-to-date average of average total loans (net of unearned income) in domestic and foreign offi ces, lease-financing receivables, obligations of the U.S. government, states and political subdivisions and other securities, assets held in trading accounts, interest-bearing balances due from depository institutions, and federal funds sold and securities purchased under agreements to resell, divided by average assets.
Average Interest-Bearing Funds/Average Assets
Average interest-bearing domestic and foreign office deposits, federal
UBPR User’s Guide • December 2008 III-79

funds purchased and securities sold under agreements to repurchase, interest-bearing demand notes (note balances) issued to the U.S. Treasury, other liabilities for borrowed money, and notes and debentures subordinated to deposits, divided by average assets.
Interest Income (TE)/ Average Earning Assets
Total interest income on a tax-equivalent basis divided by the average of the respective asset accounts involved in generating that income.
Interest Expense/Average Earning Assets
Total interest expense divided by the average of the respective asset accounts involved in generating interest income.
Net Interest Income (TE)/Average Earning Assets
Total interest income on a tax-equivalent basis, less total interest expense, divided by the average of the respective asset accounts involved in generating interest income.
Loan & Lease Analysis
Net Loss to Average Total Loan & Lease
Gross loan and lease charge-offs, less gross recoveries (includes allocated transfer risk reserve charge-offs and recoveries), divided by average total loans and leases.
Earnings Coverage of Net Loss (X)
Net operating income before taxes, securities gains or losses, and extraordinary items, plus the provision for possible loan and lease-fi nancing receivables losses divided by net loan and lease losses.
Loan & Lease Allowance Net Losses (X)
Ending balance of the allowance for possible loan and lease-financing
receivables losses divided by net loan and lease losses. If gross recoveries exceed gross losses, NA is shown at this caption.
Loan & Lease Allowance to Total Loans & Lease
Ending balance of the allowance for possible loan and lease losses divided by total loans and lease-fi nancing receivables.
Liquidity
Net Noncore Funding Dependence
See page UBPR page 10 for defi nition.
Net Loans & Leases to Assets
Loans and lease-fi nancing receivables net of unearned income and the allowance for possible loans and lease-financing receivables losses divided by total assets.
Capitalization
Tier One Leverage Capital
Tier one capital divided by adjusted average assets. See the description of UBPR page 11A for defi nitions of tier one capital and adjusted average assets.
Cash Dividends to Net Income
Total of all cash dividends declared year-to-date divided by net income year-too-date. If net incomes less than or equal to zero, NA is shown at this caption.
Retain Earnings to Average Total Equity
Net income, less cash dividends declared, divided by average equity capital.
Growth Rates
Growth rates are calculated for a 12-month period. The percentage
is determined by subtracting the account balance as of the corresponding reporting period in the previous year from the current period account balance and dividing the result by the previous year balance. The following growth rates are displayed:
Assets
Tier One Capital
Net Loans & Leases
Short Term Investments
See definition on UBPR page 10.
Short Term Noncore Funding
See definition on UBPR page 10.
Noncurrent Loans and Leases:
Summation of all categories of loans by past due status, divided by gross loans. See page 8 for specifi c defi nitions.
Total LN&LS 90+Days Past Due
Summation of all categories of due loans by past due status, divided by gross loans. See page 8 for specifi c defi nitions.
Nonaccrual
Total
Total Assets
Total assets for all banks with in the peer group.
Equity Capital
Total of equity capital for all banks with in the peer group.
Net Income
Total of net income for all banks with in the peer group.
Number of Banks in Tabulation
Number of banks with in the peer group.
UBPR User’s Guide • December 2008 III-80

CERT # CHARTER #
DIST/RSSD COUNTY FIDUCIARY AND RELATED SERVICES PAGE 01
06/30/2008 03/31/2008 12/31/2007 TOTAL FIDUCIARY AND REL ASSETS ($000) %TOTAL %MGD ($000) %TOTAL %MGD ($000) %TOTAL %MGD %CHG PERSONAL TRUST AND AGENCY 24,845,996 37.82 94.86 25,684,369 37.88 94.29 27,271,445 38.04 94.79 -14.12 EMPLOYEE BENEFIT DC 8,782,639 13.37 4.02 9,107,523 13.43 3.70 10,153,078 14.16 3.33 -16.04 EMPLOYEE BENEFIT DB 7 989 851 12.16 36.46 7 989 611 11.78 38.37 8 548 868 11.93 39.26 -7.07 OTHER RETIREMENT 3,154,219 4.80 60.94 3,166,521 4.67 61.94 3,465,812 4.83 59.86 -13.23 CORPORATE TRUST AND AGENCY 290,199 0.44 2.59 282,370 0.42 1.87 289,737 0.40 1.79 -39.48 INVESTMENT MANAGEMENT AGENCY 16,927,674 25.76 100.00 18,010,909 26.56 100.00 18,417,730 25.69 100.00 -16.05 OTHER FIDUCIARY 3 711 679 5.65 81.12 3 569 665 5.26 82.11 3 539 937 4.94 80.14 26.64 TOTAL FIDUCIARY ASSETS 65,702,257 100.00 74.13 67,810,968 100.00 74.51 71,686,607 100.00 73.76 -12.63 CUSTODY AND SAFEKEEPING 85,645,298 92,335,236 93,086,903 -5.42 MEMO ACCTS IN FOREIGN OFFICES 0 0.00 0 0.00 0 0.00 N/A
TOTAL FIDUCIARY AND REL ACCOUNTS (#) %TOTAL %MGD (#) %TOTAL %MGD (#) %TOTAL %MGD %CHG PERSONAL TRUST AND AGENCY 20,101 59.41 94.74 20,442 59.49 95.47 20,655 59.44 95.75 -5.89 EMPLOYEE BENEFIT DC 1,035 3.06 7.73 1,049 3.05 8.10 1,067 3.07 8.06 -5.48 EMPLOYEE BENEFIT DB 548 1.62 28.10 550 1.60 29.09 549 1.58 30.60 2.62 OTHER RETIREMENT 3,593 10.62 80.10 3,560 10.36 82.42 3,606 10.38 82.45 -6.87 CORPORATE TRUST AND AGENCY 362 1.07 2.21 384 1.12 1.82 425 1.22 1.65 -40.66 INVESTMENT MANAGEMENT AGENCY 7,232 21.38 100.00 7,345 21.38 100.00 7,471 21.50 100.00 -8.06 OTHER FIDUCIARY 962 2.84 47.92 1 031 3.00 50.24 977 2.81 50.56 4.00 TOTAL NUMBER OF ACCOUNTS 33,833 100.00 88.25 34,361 100.00 88.95 34,750 100.00 89.14 -6.66 CUSTODY AND SAFEKEEPING 8,402 8,487 8,501 -2.83 MEMO ACCTS IN FOREIGN OFFICES 0 N/A 0 N/A 0 N/A N/A
CORPORATE TRUST AND AGENCY ($000) #ISS %CHG $(000) #ISS %CHG $(000) #ISS %CHG CORPORATE AND MUNI TRUSTEESHIPS N/A N/A N/A N/A N/A N/A 4,082,908 333 -63.33 ALL OTHER CORPORATE N/A N/A N/A N/A 185 -82.06
UBPR User’s Guide • December 2008 III-81

UBPR Page TRUST 1
Fiduciary and Related Activities
Information on fiduciary and related services is reported by banks on call schedule RC-T. This information is available from December 31, 2001 forward, however several reporting limitations apply. Depending on asset size and the percentage of trust and related revenue to total income, an individual institution may be required to report certain items quarterly, annually or not at all. Please see instructions for the report of condition and income on www. ffi ec.gov for details. Additionally, all information on fiduciary income as reported on RC-T items 12 through 23 and mem orandum item 4 are considered confidential. While confi dential information is provided to regulatory users it is not made available on the public UBPR website. Individual banks should contact their respective federal bank supervisor for access to confi dential information.
Please note that special trust peer groups are used for purposes of the analysis on trust page 2. These peer groups and the associated averages are only used on the fi duciary activities page 2. Please see section II of the UBPR Users Guide for specifi cs.
For dollar items on trust page 1 an annual growth rate or percentage change is calculated.
Total Fiduciary and Related Assets
The dollar balance of managed and non-managed fiduciary account is displayed by type. Also the percentage of trust assets by caption is displayed. Additionally the proportion of managed assets to total assets within each category is shown. Finally, the percentage change or growth rate is displayed.
Personal Trust and Agency
Dollar balance of managed and non-
managed personal trust and agency accounts as reported on schedule RC-T item 4, columns a & b is displayed. The dollar balance is also displayed as a percentage of total trust assets as reported on RC-T item 4, columns a & b. Finally managed assets as reported on RC-T item 4, column a, is displayed as a percentage of RC-T item 4, columns a & b.
Employee Benefi t Defi ned Contribution
Dollar balance of retirement related employee benefit —defined contribution accounts as reported on schedule RC-T item 5.a, columns a & b is displayed. The dollar balance is also displayed as a percentage of total trust assets as reported on RC-T item 9, columns a & b. Finally managed assets as reported on RC-T item 5.a, column a is displayed as a percentage of RC-T item 5.a, columns a & b.
Employee Benefi t Defi ned Benefi t
Dollar balance of retirement related employee benefi t—defi ned benefi t accounts as reported on schedule RC-T item 5.b, columns a & b is displayed. The dollar balance is also displayed as a percentage of total trust assets as reported on RC-T item 9, columns a & b. Finally managed assets as reported on RC-T item 5.b, column a is displayed as a percentage of RC-T item 5.b, columns a & b.
Other Retirement
Dollar balance of other retirement accounts as reported on schedule RC-T item 5.c, columns a & b is displayed. The dollar balance is also displayed as a percentage of total trust assets as reported on RC-T item 9, columns a & b. Finally managed assets as reported on RC-T item 5.c, column a is displayed as a percentage of RC-T item 5.c, columns a & b.
Corporate Trust and Agency
Dollar balance of corporate trust and agency accounts as reported on schedule RC-T item 6, columns a & b is displayed. The dollar balance is also displayed as a percentage of total trust assets as reported on RC-T item 9, columns a & b. Finally managed assets as reported on RC-T item 6, column a is displayed as a percentage of RC-T item 6, columns a & b.
Investment Management Agency
Dollar balance of investment management agency accounts as reported on schedule RC-T item 7, columns a & b is displayed. The dollar balance is also displayed as a percentage of total trust assets as reported on RC-T item 9, columns a & b. Finally managed assets as reported on RC-T item 7, column a is displayed as a percentage of RC-T item 7, columns a & b.
Other Fiduciary
Dollar balance of other fiduciary accounts as reported on schedule RC-T item 8, columns a & b is displayed. The dollar balance is also displayed as a percentage of total trust assets as reported on RC-T item 9, columns a & b. Finally managed assets as reported on RC-T item 8, column a is displayed as a percentage of RC-T item 8, columns a & b.
Total Fiduciary Assets
Dollar balance of all fiduciary accounts both managed and non-managed as reported on schedule RC-T item 9, columns a & b.
Custody and Safekeeping
The total balance of custody and safekeeping accounts as reported on schedule RC-T item 10, column b.
Memo: Accounts in Foreign Offi ces
Dollar balance of fi duciary accounts held in foreign offices as reported on schedule RC-T item 11, columns a
UBPR User’s Guide • December 2008 III-82

& b. Managed assets as reported on RC-T item 8 column a is displayed as a percentage of RC-T item 11, columns a & b.
Total Fiduciary and Related Accounts
The number of managed and non-managed fiduciary accounts is displayed by type. Also the percentage of number of trust accounts by caption is displayed. Additionally the proportion of the number of managed accounts to total number of accounts within each category is shown. Finally, the percentage change or growth rate is displayed.
Personal Trust and Agency
Number of managed and non-managed personal trust and agency accounts as reported on schedule RC-T item 4, columns c & d is displayed. The number of accounts is also displayed as a percentage of total number of accounts as reported on RC-T item 9, columns c & d. Finally managed accounts as reported on RC-T item 4, column c, is displayed as a percentage of RC-T item 4, columns a & b.
Employee Benefi t Defi ned Contribution
Number of retirement related employee benefi t—defi ned contribution accounts as reported on schedule RC-T item 5.a, columns c & d is displayed. The number is also displayed as a percentage of total number of accounts as reported on RC-T item 9, columns c & d. Finally managed accounts as reported on RC-T item 5.a, column c is displayed as a percentage of RC-T item 5.a, columns c & d.
Employee Benefi t Defi ned Benefi t
Number of retirement related employee benefi t—defi ned benefi t accounts as reported on schedule RC-T item 5.b, columns c & d is displayed. The number is also displayed as a percentage of total number of trust accounts as reported on
RC-T item 9, columns c & d. Finally managed accounts as reported on RC-T item 5.b, column c, is displayed as a percentage of RC-T item 5.b, columns c & d.
Other Retirement
Number of other retirement accounts as reported on schedule RC-T item 5.c, columns c & d is displayed. The dollar balance is also displayed as a percentage of total number of trust accounts as reported on RC-T item 9, columns c & d. Finally managed accounts as reported on RC-T item 5.c, column c is displayed as a percentage of RC-T item 5.c, columns c & d.
Corporate Trust and Agency
Number of corporate trust and agency accounts as reported on schedule RC-T item 6, columns c & d is displayed. The number of accounts is also displayed as a percentage of the total number off trust accounts as reported on RC-T item 9, columns c & d. Finally managed accounts as reported on RC-T item 6, column c is displayed as a percentage of RC-T item 6, columns c & d.
Investment Management Agency
Number of investment management agency accounts as reported on schedule RC-T item 7, columns c & d is displayed. The number of accounts is also displayed as a percentage of the total number of trust accounts as reported on RC-T item 9, columns c & d. Finally managed accounts as reported on RC-T item 7, column c is displayed as a percentage of RC-T item 7, columns c & d.
Other Fiduciary
Number of other fi duciary accounts as reported on schedule RC-T item 8, columns c & d is displayed. The number of accounts is also displayed as a percentage of the total number of accounts as reported on RC-T item 9, columns c & d. Finally managed accounts as reported on RC-T item 8, column c is displayed as a percentage of RC-T item 8, columns c & d.
Total Fiduciary Accounts
Number of all fi duciary accounts both managed and non-managed as reported on schedule RC-T item 9, columns c & d.
Custody and Safekeeping
The total balance of custody and safekeeping accounts as reported on schedule RC-T item 10, column d.
Memo: Accounts in Foreign Offi ces
Number of fi duciary accounts held in foreign offices as reported on schedule RC-T item 11, columns c & d. Managed accounts as reported on RC-T item 8, column c is displayed as a percentage of RC-T item 11, columns c & d.
Corporate Trust and Agency
The Balance and number of corporate trust and agency accounts are displayed. Additionally, an annual growth rate in balances between quarters is displayed.
Corporate and Municipal Trusteeships
The number of issues and balance of corporate and municipal trusteeships as reported on RC-T memoranda item 2.a, columns a & b respectively.
All Other Corporate
The number of transfer agent, registrar, paying agent and other corporate agency issues as reported on schedule RC-T item 2.b, column a.
Fiduciary and Related Services Income
The amount of income generated from and expense related to trust activities is displayed. Additionally, each component of income is expressed as a percentage of gross fiduciary and related services income. Note that this information is confi dential and as a consequence WILL NOT be displayed on the public website. Regulatory users have
UBPR User’s Guide • December 2008 III-83

access to the information. Individual banks should see their respective federal bank supervisor to obtain this information.
Personal Trust and Agency
Total amount of income from personal trust and agency accounts as reported on RC-T item 12. It is also expressed as a percentage of gross fiduciary income as reported on RC-T item 19.
Employee Benefi t Defi ned Contribution
Total amount of income from employee benefi t defi ned contribution accounts as reported on RC-T item 13.a. It is also expressed as a percentage of gross fi duciary income as reported on RC-T item 19.
Employee Benefi t Defi ned Benefi t
Total amount of income from employee benefit defined benefit accounts as reported on RC-T item 13.b. It is also expressed as a percentage of gross fiduciary income as reported on RC-T item 19.
Other Retirement
Total amount of income from other retirement accounts as reported on RC-T item 13.c. It is also expressed as a percentage of gross fi duciary income as reported on RC-T item 19.
Corporate Trust and Agency
Total amount of income from corporate trust and agency accounts as reported on RC-T item 14. It is also expressed as a percentage of gross fiduciary income as reported on RC-T item 19.
Investment Management Agency
Total amount of income from investment management agency accounts as reported on RC-T item 15. It is also expressed as a percentage of gross fiduciary income as reported on RC-T item 19.
Other Fiduciary Accounts
Total amount of income from other fiduciary accounts as reported on RC-T item 16. It is also expressed as a percentage of gross fi duciary income as reported on RC-T item 19.
Custody and Safekeeping
Total amount of income from custody and safekeeping accounts as reported on RC-T item 17. It is also expressed as a percentage of gross fiduciary income as reported on RC-T item 19.
Other Fiduciary and Related Services Income
Total amount of income from other fiduciary and related services as reported on RC-T item 18. It is also expressed as a percentage of gross fiduciary income as reported on RC-T item 19.
Gross Fiduciary and Related Income
Gross amount of fiduciary and related income as reported on RC-T item 19.
LESS: Expenses
The total of expenses as reported in schedule RC-T item 20. It is also expressed as a percentage of gross fiduciary income as reported on RC-T item 19.
LESS: Net Losses
Net losses from fi duciary activities as reported in schedule RC-T item 21. It is also expressed as a percentage of gross fiduciary income as reported on RC-T item 19.
PLUS: Intercompany Credits
The total of intracompany income credits as reported on schedule RC-T item 22. It is also expressed as a percentage of gross fiduciary income as reported on RC-T item 19.
Net Fiduciary and Related Income
Net fiduciary and related services income as reported on schedule RC-T item 23.
Memo: Fiduciary Income Foreign
The memo amount of fi duciary and related service income—foreign offices as reported on schedule RC-T item 19.a, It is also expressed as a percentage of gross fi duciary income as reported on RC-T item 19.
Gross Fiduciary Income % Noninterest Income
Total fi duciary income as reported on schedule RC-T item 19, expressed as a percentage of total noninterest income reported in schedule RI, item 5.m.
UBPR User’s Guide • December 2008 III-84

CERT # CHARTER #
DIST/RSSD COUNTY FIDUCIARY AND RELATED SERVICES PAGE 01A
06/30/2008 03/31/2008 12/31/2007 FIDUCIARY INCOME % FID ASSETS BANK PEER PCT BANK PEER PCT BANK PEER PCT PERSONAL TRUST AND AGENCY N/A 0.59 N/A N/A 0.57 N/A N/A 0.55 N/A EMPLOYEE BENEFIT DC N/A 0.45 N/A N/A 0.43 N/A N/A 0.40 N/A EMPLOYEE BENEFIT DB N/A 0.19 N/A N/A 0.21 N/A N/A 0.20 N/A OTHER RETIREMENT N/A 0.42 N/A N/A 0.42 N/A N/A 0.45 N/A CORPORATE TRUST AND AGENCY N/A 0.26 N/A N/A 0.57 N/A N/A 0.61 N/A INVESTMENT MANAGEMENT AGENCY N/A 0.42 N/A N/A 0.40 N/A N/A 0.37 N/A OTHER FIDUCIARY N/A 0.17 N/A N/A 0.16 N/A N/A 0.15 N/A TOTAL FIDUCIARY ASSETS N/A 0.40 N/A N/A 0.38 N/A N/A 0.35 N/A CUSTODY AND SAFEKEEPING N/A 0.04 N/A N/A 0.04 N/A N/A 0.05 N/A MEMO FIDUCIARY INCOME FOREIGN N/A 0.50 N/A N/A 0.37 N/A N/A 0.26 N/A
GROSS FIDUCIARY LOSSES - MANAGED ($000) %REV PEER PCT ($000) %REV PEER PCT ($000) %REV PEER PCT PERSONAL TRUST AND AGENCY N/A N/A 0.69 N/A N/A N/A N/A N/A N/A N/A 0.30 N/A RETIREMENT TRUST AND AGENCY N/A N/A 6.11 N/A N/A N/A N/A N/A N/A N/A 0.11 N/A INVESTMENT MANAGEMENT AGENCY N/A N/A 0.81 N/A N/A N/A N/A N/A N/A N/A 0.30 N/A OTHER FIDUCIARY N/A N/A 105.23 N/A N/A N/A N/A N/A N/A N/A 0.11 N/A TOTAL GROSS MANAGED LOSSES N/A N/A 27.30 N/A N/A N/A N/A N/A N/A N/A 0.23 N/A
GROSS FIDUCIARY LOSSES - NON MGD PERSONAL TRUST AND AGENCY N/A N/A 0.00 N/A N/A N/A N/A N/A N/A N/A 0.02 N/A RETIREMENT TRUST AND AGENCY N/A N/A 0.00 N/A N/A N/A N/A N/A N/A N/A 0.26 N/A INVESTMENT MANAGEMENT AGENCY N/A N/A 0.00 N/A N/A N/A N/A N/A N/A N/A 0.02 N/A OTHER FIDUCIARY N/A N/A 0.00 N/A N/A N/A N/A N/A N/A N/A 0.62 N/A TOTAL GROSS NON MANAGED LOSSES N/A N/A 0.00 N/A N/A N/A N/A N/A N/A N/A 0.24 N/A
NET FIDUCIARY LOSSES - ALL PERSONAL TRUST AND AGENCY N/A N/A -0.31 N/A N/A N/A N/A N/A N/A N/A 0.29 N/A RETIREMENT TRUST AND AGENCY N/A N/A 0.00 N/A N/A N/A N/A N/A N/A N/A 0.26 N/A INVESTMENT MANAGEMENT AGENCY N/A N/A 0.33 N/A N/A N/A N/A N/A N/A N/A 0.30 N/A OTHER FIDUCIARY N/A N/A 1.26 N/A N/A N/A N/A N/A N/A N/A 0.67 N/A TOTAL NET LOSSES N/A N/A 0.56 N/A N/A N/A N/A N/A N/A N/A 0.38 N/A
COLLECTIVE/COMMON TRUST FUNDS $(000) %TOTAL %CHG $(000) %TOTAL %CHG $(000) %TOTAL %CHG DOMESTIC EQUITY N/A N/A N/A N/A N/A N/A N/A N/A N/A INTERNATION/GLOBAL EQUITY N/A N/A N/A N/A N/A N/A N/A N/A N/A STOCK/BOND BLEND N/A N/A N/A N/A N/A N/A N/A N/A N/A TAXABLE BOND N/A N/A N/A N/A N/A N/A N/A N/A N/A MUNICIPAL BOND N/A N/A N/A N/A N/A N/A N/A N/A N/A SHORT TERM/MONEY MARKET N/A N/A N/A N/A N/A N/A N/A N/A N/A SPECIALITY/OTHER N/A N/A N/A N/A N/A N/A N/A N/A N/A TOTAL TRUST FUNDS N/A N/A N/A N/A N/A N/A N/A N/A N/A
UBPR User’s Guide • December 2008 III-85

UBPR Trust Page 1A
Page 1A displays an analysis of income and losses on fiduciary accounts. Additionally gross loss, recovery and net loss rates are calculated for each type of account. To provide a basis for analysis of bank information, average ratios are calculated for a peer group of comparably sized banks. Please see section II for details on peer group composition and a description of the averaging process. Finally, a percentile ranking or relative position is developed for each income and loss ratio. Please note that, all fiduciary income and loss data as reported on RC-T items 12 through 23 and memorandum item 4 are considered confi dential. While confidential information is provided to regulatory users it is not made available on the public UBPR website. Individual banks should contact their respective federal bank supervisor for access to confi dential information.
Fiduciary Income % Fiduciary Assets
An analysis of yields by type of fi duciary account is presented. Income generated by a particular type of account is divided by the outstanding account balance. For non-year end dates the income is annualized. Please note that not all banks will report income on RC-T. Please see the call instructions on www.ffi ec.gov.
Personal Trust and Agency
Income from personal trust and agency accounts reported on RC-T item 12 expressed as a percentage of personal trust and agency account assets reported on RC-T item 4, columns a & b.
Employee Benefi t Defi ned Contribution
Income from employee benefit defined contribution accounts reported on RC-T item 13.a expressed as a percentage of employee benefi t
defined contribution account assets reported on RC-T item 5.a, columns a & b.
Employee Benefi t Defi ned Benefi t
Income from employee benefit defi ned benefit accounts reported on RC-T item 13.b expressed as a percentage of employee benefi t defi ned benefit account assets reported on RC-T item 5.b, columns a & b.
Other Retirement
Income from other retirement accounts reported on RC-T item 13.c expressed as a percentage of other retirement account assets reported on RC-T item 5.c, columns a & b.
Corporate Trust and Agency
Income from corporate trust and agency accounts reported on RC-T item 14 expressed as a percentage of corporate trust and agency assets reported on RC-T item 6, columns a & b.
Investment Management Agency
Income from investment management agency accounts reported on RC-T item 15 expressed as a percentage of investment management and agency account assets reported on RC-T item 7, columns a & b.
Other Fiduciary
Income from other fi duciary accounts reported on RC-T item16, expressed as a percentage of other fi duciary account assets reported on RC-T item 8, columns a & b.
Total Fiduciary Assets
Gross fiduciary income as reported on RC-T item 19 expressed as a percentage of total managed and non managed account assets reported on RC-T item 9, columns a & b.
Custody and Safekeeping
Income from custody and safekeeping accounts as reported on schedule
RC-T item 17 expressed as a percentage of custody and safekeeping accounts as reported on schedule RC-T item 10, column b.
Memo: Fiduciary Income Foreign
Fiduciary and related services income-foreign offices as reported on schedule RC-T item 19.a expressed as a percentage of total managed and non-managed fiduciary accounts held in foreign offices as reported on schedule RC-T item 11, columns a & b.
Gross Fiduciary Losses— Managed
The rate of gross losses on fi duciary accounts is expressed as a percentage of the income generated by type of account.
Personal Trust and Agency
The dollar amount of gross losses on managed personal trust and agency accounts reported on schedule RC-T memoranda item 4.a, column a is displayed. It is also expressed as a percentage of income on personal and trust agency accounts reported in RC-T item 12.
Retirement Trust and Agency
The dollar amount of gross losses on managed retirement trust and agency accounts reported on schedule RC-T memoranda item RC-T item 4.b, column a. It is also expressed as a percentage of income on retirement related and agency accounts reported on RC-T items 13.a, b & c.
Investment Management Agency
The dollar amount of gross losses on managed investment management agency accounts reported on schedule RC-T memoranda item 4.c column a. It is also expressed as a percentage of income in investment management agency accounts reported on RC-T item 15.
UBPR User’s Guide • December 2008 III-86

Other Fiduciary
The dollar amount of gross losses on managed other fi duciary accounts and related services reported on schedule RC-T memoranda item 4.d, column a. It is also expressed as a percentage of income from corporate trust and agency, other fi duciary, custody and safekeeping and other related services accounts reported on RC-T items 14, 16, 17 & 18.
Total Gross Managed Losses
Total fiduciary settlements, surcharges and other losses on managed accounts reported on schedule RC-T item 4.e, column a. It is also expressed as a percentage of total fi duciary and related services income reported on RC-T item 19.
Gross Fiduciary Losses— Non Managed
The rate of gross losses on fi duciary accounts is expressed as a percentage of the income generated by type of account.
Personal Trust and Agency
The dollar amount of gross losses on non- managed personal trust and agency accounts reported on schedule RC-T memoranda item 4.a, column b is displayed. It is also expressed as a percentage of income on personal and trust agency accounts reported in RC-T item 12.
Retirement Trust and Agency
The dollar amount of gross losses on non-managed retirement trust and agency accounts reported on schedule RC-T memoranda item 4.b, column b. It is also expressed as a percentage of income on retirement related and agency accounts reported on RC-T items 13.a, b & c.
Investment Management Agency
The dollar amount of gross losses on non-managed investment management agency accounts reported on schedule RC-T memoranda item 4.c, column b. It is also expressed
as a percentage of income in investment management agency accounts reported on RC-T item 15.
Other Fiduciary
The dollar amount of gross losses on non-managed other fiduciary accounts and related services reported on schedule RC-T memoranda item 4d, column b. It is also expressed as a percentage of income from corporate trust and agency, other fiduciary, custody and safekeeping and other related services accounts reported on RC-T items 14, 16, 17 & 18.
Total Gross Non-Managed Losses
Total fiduciary settlements, surcharges and other losses on managed accounts reported on schedule RC-T item 4.e, column b. It is also expressed as a percentage of total fi duciary and related services income reported on RC-T item 19.
Net Fiduciary Losses—All
The rate of net losses on fi duciary accounts is expressed as a percentage of the income generated by type of account.
Personal Trust and Agency
The dollar amount of gross losses on managed personal trust and agency accounts reported on schedule RC-T memoranda item 4.a, column a, plus gross losses on non-managed accounts reported on RC-T memoranda item 4.a, column b, less recoveries reported on RC-T item 4.a, column c is displayed. It is also expressed as a percentage of income on personal and trust agency accounts reported in RC-T item 12.
Retirement Trust and Agency
The dollar amount of gross losses on managed retirement trust and agency accounts reported on schedule RC-T memoranda item 4.b, column a, plus gross losses on non-managed accounts reported on RC-T memoranda item 4.b, column b, less recov
eries reported on RC-T memoranda item 4.b, column c. It is also expressed as a percentage of income on retirement related and agency accounts reported on RC-T items 13 a, b & c.
Investment Management Agency
The dollar amount of gross losses on managed investment management agency accounts reported on schedule RC-T memoranda item 4.c, column a plus gross losses on non-managed accounts reported on schedule RC-T memoranda item 4.c column b less recoveries reported on RC-T item 4.c, column c. It is also expressed as a percentage of income in investment management agency accounts reported on RC-T item 15.
Other Fiduciary
The dollar amount of gross losses on managed other fi duciary accounts and related services reported on schedule RC-T memoranda item 4.d, column a plus gross losses on managed accounts reported on schedule RC-T memoranda item 4.d, column b, less recoveries reported on RC-T item 4.d, column c. It is also expressed as a percentage of income from corporate trust and agency, other fi duciary, custody and safekeeping and other related services accounts reported on RC-T items 14, 16, 17 & 18.
Total Gross Managed Losses
Total fiduciary settlements, surcharges and other losses on managed accounts reported on schedule RC-T item 4.e, column a plus gross losses reported on non-managed accounts reported on RC-T item 4.e, column b, less recoveries reported on RC-T item 4.e, column c. It is also expressed as a percentage of total fi duciary and related services income reported on RC-T item 19.
Collective and Common Trust Funds
The dollar amount of collective and common trust funds is displayed by
UBPR User’s Guide • December 2008 III-87

type of investment vehicle. In addition individual totals are shown as a percentage of total collective and common trust funds. Finally an annual growth rate is calculated.
Domestic Equity
Dollar amount of domestic equity funds as reported on RC-T memoranda item 3.a, column b is displayed. It is also expressed as a percentage of total collective investment funds reported on RC-T memoranda item 3.h, column b.
International/Global Equity
Dollar amount of international/ global equity funds as reported on RC-T memoranda item 3.b, column b is displayed. It is also expressed as a percentage of total collective investment funds reported on RC-T memoranda item 3.h, column b.
Stock/Bond Blend
Dollar amount of stock/bond blend funds as reported on RC-T memo
randa item 3.c, column b is displayed. It is also expressed as a percentage of total collective investment funds reported on RC-T memoranda item 3.h, column b.
Taxable Bond
Dollar amount of taxable bond funds as reported on RC-T memoranda item 3.d, column b is displayed. It is also expressed as a percentage of total collective investment funds reported on RC-T memoranda item 3.h, column b.
Municipal Bond Funds
Dollar amount of municipal bond funds as reported on RC-T memoranda item 3.e, column b is displayed. It is also expressed as a percentage of total collective investment funds reported on RC-T memoranda item 3.h, column b.
Short Term/Money Market
Dollar amount of short term invest-ments/money market funds as
reported on RC-T memoranda item 3.f, column b is displayed. It is also expressed as a percentage of total collective investment funds reported on RC-T memoranda item 3.h, column b.
Specialty/Other
Dollar amount of specialty/other funds as reported on RC-T memoranda item 3.g, column b is displayed. It is also expressed as a percentage of total collective investment funds reported on RC-T memoranda item 3.h, column b.
Total Trust Funds
Dollar amount of total collective investment funds as reported on RC-T memoranda item 3.h, column b is displayed.
UBPR User’s Guide • December 2008 III-88

Appendix A: Tax-Equivalency Worksheet
This work sheet can be used to replicate the Uniform Bank Performance Report tax-equivalency adjustment.
General Information
This Tax-Equivalency Worksheet is divided into four parts. Part I determines the amount of tax-exempt income that is available for tax benefit by comparing it to taxable income. Part II estimates the tax benefit for this amount of available tax-exempt income by determining the bank’s marginal tax rate and multiplying by a percentage based on that tax rate. Part III describes the usage of this estimated tax benefit in the UBPR, in earning ratios, dollar amounts, and asset yield ratios. The “Defi nition of Preliminary Calculations” section describes the calculation of items for Part I using Report of Income items.
PART I: Determine the Amount of Tax-Exempt Income Available for Tax Benefi t
Preliminary Calculations
Calculate the following items according to the defi nitions in the last section of the Appendix:
i. tax-exempt income (write the amount here and at “Final Part I Calculation,” line b: ;
iii. total pretax income, including tax-exempt income: ;
v. 100% nondeductible interest expense: .
ii. pretax taxable income: ;
iv. total applicable income taxes: ;
Alternatives for Part I—(Only one alternative is possible for any bank.)
Alternative 1
If the bank does not have any tax-exempt income, the tax-equivalent adjustment equals zero (0) and no further calculations are necessary. Otherwise, proceed to the next alternative.
Alternative 2
If pretax taxable income (preliminary calculation ii) exceeds tax-exempt income, or if pretax taxable income is greater than or equal to zero (0), write the amount of tax-exempt income here and at “Final Part I Calculation,” line a, and proceed from there; otherwise, proceed to the next alternative.
Alternative 3
If pretax taxable income (preliminary calculation ii) is less than zero (0) and total pretax income (preliminary calculation iii) exceeds zero (0) and total applicable income taxes (preliminary calculation iv) is less than zero (0) (e.g., the bank reports tax credits), perform the following calculation; otherwise, proceed to the next alternative.
Multiply the total applicable income taxes (preliminary calculation iv) by negative 1.67 (–1.67). Add the result to total pretax income (preliminary calculation iii). Write the amount here and at “Final Part I Calculation,“ line a, and proceed from there.
UBPR User’s Guide • December 2008 A-1

Alternative 4
If total pretax income (preliminary calculation iii) is less than or equal to zero (0) and total applicable income taxes (preliminary calculation iv) is less than zero (0), then perform the following calculation; otherwise, proceed to the next alternative.
Multiply the total applicable income taxes (preliminary calculation iv) by negative 1.67 (–1.67). Write the result here and at “Final Part I Calculation,” line a, and proceed from there.
Alternative 5
If total pretax income (preliminary calculation iii) is less than or equal to zero (0) and total applicable income taxes (preliminary calculation iv) are greater than or equal to zero (0), then the bank receives no calculated tax benefit. Enter a zero (0) in Final Part I Calculation, line a.
Final Part I Calculation
a. Amount calculated using one of the five above alternatives:
b. Amount of tax-exempt income (preliminary calculation I):
Write the lesser of a. or b. here: –Subtract the amount of nondeductible interest expense (preliminary calculation vi):
If the result is zero (0) or less, there is no tax-exempt income available for tax benefit. If the result is greater than zero (0), proceed with Part II using that amount.
PART II: Estimate the Tax Benefit for Available Tax-Exempt Income from Part I.
The tax benefi t for the amount of tax-exempt income available for such benefi t is estimated by: Calculating the annualized amount of net taxable income plus available tax-exempt income; determining the marginal income tax rate for this adjusted income fi gure; calculating the tax benefi t based on the marginal tax rate.
A. Calculating Annualized Taxable Income Plus Available Tax-Exempt Income
In order to estimate the tax benefi t of tax-exempt income, it is fi rst necessary to calculate what the annalized taxable income would be if available tax-exempt income were included. Up to this point, all fi gures have been on a year-to-date basis. Perform the following calculation to determine annualized taxable income for tax-equivalency purposes:
1. Add: pretax taxable income (preliminary calculation ii):
Plus: available tax-exempt income from Part I:
Equals: year-to-date adjusted income:
2. Multiply the above result by the appropriate annualization factor:
+
Reporting Period Ending Annualization Factor
March 31, YYYY 4 June 30, YYYY 2
September 30, YYYY 1.333 December 31, YYYY 1
Equals: annualized amount of taxable income plus available tax-exempt income
x
UBPR User’s Guide • December 2008 A-2

B. Calculating Estimated Tax Benefi t:
1. Find the appropriate tax benefit factor in the table below, based on the annualized income calculated above.
Tax Rates and Tax Benefi t Factors
Annualized Income from Part II A
1986 or earlier 1987 1988 or later
Marginal Tax Rate (Percent)
Tax Benefi t Factor
Marginal Tax Rate (Percent)
Tax Benefi t Factor
Marginal Tax Rate (Percent)
Tax Benefi t Factor
up to 25 15 .18 15 .18 15 .18 25–50 18 .22 16.5 .20 15 .18 50–75 30 .43 27.5 .38 25 .33 75–10,000 40 .67 37.0 .59 34 .52 over 10,000 46 .85 40.0 .67 35 .54
2. Enter the available tax-exempt income from Part I here:
Estimated Tax Benefi t (year-to-date):
Multiply by the tax benefi t factor from the above table: x
PART III: Using the Estimated Tax Benefit in the UBPR
The estimated tax benefit calculated in Part II, which is based on total tax-exempt income, is allocated back to tax-exempt loan & lease income and tax-exempt securities income.
The tax benefit is then added to pretax income and used in earnings presentations and yield ratios in the UBPR.
A. Allocating Tax Benefit to Loans & Leases and Securities:
Assign the estimated tax benefit from Part II back to the two sources of tax-exempt income as follows:
1. Calculate the ratio of tax-exempt loan & lease income to total tax-exempt income:
Tax-exempt loan & lease income (see “definitions of Preliminary Calculations”, Paragraph i): ÷
Divided by total tax-exempt income (preliminary calculation I):
Equals: ratio of tax-exempt loan & lease income:
2. Multiply the estimated tax benefi t: x By the ratio calculated in 1.:
Equals estimated tax benefit for tax-exempt loan & lease income:
3. From the total estimated tax benefi t:
Subtract: loan & lease tax benefi t from 2.:
Equals: estimated tax benefit for tax-exempt securities income:
UBPR User’s Guide • December 2008 A-3

B. Using and Presenting Tax Benefits in the UBPR
1. The tax benefits allocated loans and securities allocated in A. above, are also presented separately on UBPR Page 02. For other than December reporting periods, these fi gures must be de-annualized by dividing by the annualization factor in Part II. Tax benefi ts are included in various sub-totals that appear on page 2 such as Total Interest Income (TE) and Pre Tax Net Operating Income (TE). Computed tax benefits are reversed or subtracted out to allow after tax net income to reconcile properly. Tax benefits are reversed by including them as Current Tax Equivalent Adjustment in Applicable Income Taxes (TE).
2. The tax-equivalent income amounts, annualized, are used in the earnings ratios that appear on UBPR Page 01.
3. The book and tax-equivalent income figures for loans & leases and securities that appear on page 2 are used in selected yield ratios that appear on UBPR Pages 03 and 12.
Definitions of Preliminary Calculations
Add:
i. Tax-exempt Income:
Tax-exempt loan & lease income: (Report of Income Memoranda section item 3):
Tax-exempt securities income: (Report of Income Memoranda item 4): +
Equals: Total tax-exempt income:
These figures are presented on UBPR Page 02.
ii. Pretax Taxable Income Income (loss) before income taxes, extraordinary items and other adjustments (Report of
Income item 8):
Plus: Interest expense incurred to carry tax-exempt obligations acquired after August 7, 1986, that is not deductible for federal income tax purposes (Report of Income item M1):
Less: Tax-exempt income (preliminary calculation I.): +
– Equals: Total pretax taxable income:
iii. Total Pretax Income
Tax-exempt income (preliminary calculation I.):
Plus: Pretax taxable income (preliminary calculation ii.):
Equals: Total pretax income: +
iv. Total Applicable Income Taxes: Applicable income taxes (Report of Income item 9):
Plus: Applicable income taxes on extraodinary items and other adjustment (Report of Income item 11a):
+Equals: Total applicable income taxes:
v. 100% Nondeductible Interest Expense:
UBPR User’s Guide • December 2008 A-4

Interest expense incurred to carry tax-exempt obligations acquired after August 7, 1986, that is not deductible for federal income tax purposes (Report of Income item M1).
UBPR User’s Guide • December 2008 A-5

Appendix B: UBPR Data Ordering Information
In addition to the individual bank UBPR, the FFIEC makes data available on DVD. UBPR data is stored on the DVD in delimited format for use with spreadsheets and database software individual UBPR Reports are available on line for viewing and printing at www.ffiec.gov. These items are:
UBPR Data Tapes
The types of UBPR data that are available on DVD are:
• R1—Bank-level ratio and dollar values:
Each tape will contain a record for each insured commercial bank for one data date. Each record will contain approximately 900 ratio or dollar values.
• R2—Peer group averages:
Each tape will contain a record for each of the UBPR peer groups plus a record for all banks, for all of the data dates for that edition. Each record will contain approximately 330 average ratio values.
• R3—Bank percentile ranks:
Each tape will contain a record for each insured commercial bank for one data date. Each record will contain approximately 330 percentile rank values.
• R4 and R5—State and state/asset group averages:
Each tape will contain a record for each state plus a record for all banks. The same tape will also contain a record for each of three asset size groups in each state,
plus a record for all banks in each of these asset sizes ($0–25 million, $25–100 million and over $100 million); these size group records are present only for the latest data date for the edition. Each record will contain approximately 33 ratio averages, plus total assets and total net income.
UBPR Data
Requests for or inquiries about UBPR data DVDs should be made to:
Federal Financial Institutions Council
UBPR Coordinator 3501 Fairfax Drive Room D8073a Arlington, VA 22226-3550
Phone: 703-516-5732
E-Mail: [email protected]
UBPR User’s Guide • December 2008 B-1