Embed Size (px)
Citation preview

Institute for Climate Economics - I 4CE
An independent Peer review of the report “Ex-post Investigation of Cost Pass-Though in the E U ETS: an analysis of six sectors” 1
AN INDEPENDENT PEER REVIEW OF THE STUDY
“EX-POST INVESTIGATION OF COST PASS-THROUGH IN
THE EU ETS: AN ANALYSIS OF SIX SECTORS”
May 2016
THE EXECUTIVE SUMMARY
� This report provides a Peer review of the study “Ex-post Investigation of Cost Pass-Though in the EU ETS: an analysis of six sectors” produced by CE-Delft and Oeko Institut and published by the EU Commission in Nove mber 2015
� The study of CE-Delft and Oeko Institut (2015) investigates carbon costs pass-through across iron and steel, refineries, cement, organic basic chemicals, fertilizer, and glass. It also provides estimates of these cost pass-through rates of roughly around 100% for petrochemicals, 80-100% for petrol above 100% for diesel and gasoil.
� Our Peer review (on refineries and organic basic chemicals) concludes that the results of the study cannot be used as direct polic y recommendations due to the following three main limitations.
• The robustness of the econometric results is not cl early grounded: the claims of the study are only supported at a low con fidence level (the chosen confidence interval was 10% while sound econometric practice would require at least 5%).
• Moreover detailed analysis shows that the hypothesis of a cost pass-through is significant (at 10%) only for some products and for some EU countries. The results are heterogeneous and not representative of a conclusion at the EU level for either sector.
• The quantitative estimates on the cost pass-through rates are obtained through a simple accounting relationship between in put costs and output prices. Economic practice would rather use an explicit price formation model allowing for such factors as trade intensity, marke t structure and concentration, heterogeneity of competitors, etc... Some of these factors are marginally analyzed in the study without providing clear conclusions. Indeed, without any in-depth statistical analysis, the study cannot establish a statistical significant relationship between market shares and cost pass-through rates. Other explanatory variables such as the role of EUA price volatility and the macroeconomic environment should also have been considered. Altogether the simple relationship used by the study cannot provid e a valid estimate of the cost pass through.
# PUBLIC VERSION

Institute for Climate Economics - I 4CE
An independent Peer review of the report “Ex-post Investigation of Cost Pass-Though in the E U ETS: an analysis of six sectors” 2
This report has been prepared by I4CE for the CEFIC and Fuels Europe however it reflects only
the independent views of the authors. The authors h ave expressed their impartial point of view
and have disclosed all relevant links with the two federations and operators in these sectors.
The authors take sole responsibility for findings o r ideas presented in this report as well as any
errors or omissions. I4CE and the academic reviewer cannot be held responsible for the use by
CEFIC and Fuels Europe of the information, results and conclusions presented in the report.

Institute for Climate Economics - I 4CE
An independent Peer review of the report “Ex-post Investigation of Cost Pass-Though in the E U ETS: an analysis of six sectors” 3
CONTENTS
Glossary ........................................................................................................................................... 4
Introduction ..................................................................................................................................... 5
1. A summary of the CE-DELFT and oeko-institut study ............................................................ 5
a. Objective .............................................................................................................................. 5
b. Methodology ....................................................................................................................... 6
c. Data ..................................................................................................................................... 7
d. Main results ......................................................................................................................... 7
2. Peer-review: Critical Assessment of the CE deflt and oeko institut study’s results ............. 9
a. The positive conclusion is not supported by a strong econometric evidence ................... 9
b. Moreover the model specifications have not been properly discussed ........................... 10
c. The data is heterogeneous and not representative .......................................................... 11
d. There are no economic interpretation of the econometric results .................................. 11
e. The quantitative estimates on pass-through rates should not be taken at face value ..... 12
3. Conclusion ............................................................................................................................. 13
4. ANNEX – The peer-review reports from three academic experts ....................................... 14

Institute for Climate Economics - I 4CE
An independent Peer review of the report “Ex-post Investigation of Cost Pass-Though in the E U ETS: an analysis of six sectors” 4
GLOSSARY
Confidence interval
A confidence interval measures the probability that an econometric result falls between two set values. The confidence interval can take any number of probabilities, with the most common being 95% or 99%, meaning respectively a level of confidence of 5% and 1%. A level of confidence of 10% demonstrates a weak robustness of econometric results.
Econometric significance
A result in econometrics may be said to be significant if its statistical significance is demonstrated with a strong level of confidence. Econometric practice would require at least 5% confidence level.

Institute for Climate Economics - I 4CE
An independent Peer review of the report “Ex-post Investigation of Cost Pass-Though in the E U ETS: an analysis of six sectors” 5
INTRODUCTION
This report provides an independent review of the study “Ex-post Investigation of Cost Pass-Though in the EU ETS: an analysis of six sectors” published by the European Commission – DG Clima in November 2015 and realized by CE Delft and Oeko-Institut. The study empirically assesses whether or not carbon costs have been passed through to the final product prices for six industrial sectors over the period 2005-2014 covered by the EU ETS (iron and steel, refineries, cement, organic basic chemicals, fertilizer, and glass).
The report is focused on two only sectors: refineries and basic organic chemicals. It is produced on the basis of the three academic peer reviews mandated by I4CE.
The report provides four sections that present:
1. A summary of the study of the CE Delft and Oeko Institut, its methodological approach, data used and main results.
2. The identified weaknesses of the study that undermine the interpretation of results for policy decisions.
3. The conclusion of the report that provides an independent point of view. 4. Annex: Peer-review reports from the three academic experts.
In this document, we refer to the “report” to talk about the peer-review we conduct and we refer to the “study” to comment the study published “Ex-post investigation of cost pass-through in the EU ETS” by CE Delft and Oeko-Institut (November 2015) (abbreviated CEDOI 2015 hereafter).
1. A SUMMARY OF THE CE-DELFT AND OEKO-INSTITUT STUDY
A. OBJECTIVE
The study “Ex-post Investigation of Cost Pass-Though in the EU ETS: an analysis of six sectors” produced by CE-Delft and Oeko Institut (CEDOI 2015) intends to provide answers to two questions (to be referred for convenience as Q1 and Q2):
• Whether or not carbon costs have been passed throug h to final product prices across six industrial sectors (iron and steel, refineries, cement, organic basic chemicals, fertilizer, and glass) covered by the EU ETS over t he period 2005-2014? (Q1)
• For those sectors that have passed through costs, t o what degree are these carbon costs reflected in the final product prices? The an swer to Q1 is based on an econometric analysis. Some quantitative values for Q2 are then derived. (Q2)
Policy implications drawn from the study may have major consequences. These sectors have been considered as sectors at risk of leakage and have so far benefited from free allocations. Positive answer to Q1 combined with high values for Q2 would provide grounds that such benefits are not economically justified and should be eliminated (as it has been advocated in the electricity sector).
All through the study the authors specify many caveats. They repeatedly mention that their results are highly dependent on the methods chosen and the data used. The extent, to which carbon costs are estimated to be passed through whenever Q1 is statistically significant, is only indicative.

Institute for Climate Economics - I 4CE
An independent Peer review of the report “Ex-post Investigation of Cost Pass-Though in the E U ETS: an analysis of six sectors” 6
B. METHODOLOGY
The authors of the CEDOI 2015 study use of a traditional cost-price model similar to the approach used in Alexeeva-Talebi (2011, Energy Economics) to estimate if the opportunity costs of CO2 have or have not been passed through.
����,� = � + ������ �,� + �������,� + �� (M1)
with the logarithm of the price of a product as the dependent variable, the logarithm of the price of inputs (e.g., price of labour, capital, energy, materials, CO2 allowances, etc.) as independent variables, and the error term. The coefficient β1 gives the share of CO2 costs in the total product price, i.e. the extent to which opportunity costs have been put forward in the product price.
With the hypothesis (H0) under which the opportunity costs of CO2 have not been passed through, the answer to Q1 would then be negative.
To answer Q2 whenever the answer to Q1 is positive the cost pass-through rate in percentage (cpt % rate) is calculated as the ratio of the estimated β1 coefficient over the hypothetical CO2 cost share if all opportunity costs would have been passed through:
���%���� = �������������� ������
!��������� ∗ #$������%&��'�����'�������
(c1)
To deal with the overestimation of the cost pass-through rate, the cost pass-through ratio in percentage (cpt % ratio) is computed as well:
���%����� = �������������� ������
!�������� ����� ∗ #$������%����'�������
(c2)
An important caveat is discussed in section 3.3.3. The relationship (M1) is estimated using average cost while economic models of pricing should be based on marginal cost. This may lead to overestimation of pass-through rates.1
1 This can be illustrated with the electricity sector. The price is determined by the technology with the highest marginal cost. Suppose coal is this technology. It has the highest emission factor. If the average technology mix has an emission factor which only half that of coal, the average pass-through would be twice the one of coal. Say 200 % instead of 100%.

Institute for Climate Economics - I 4CE
An independent Peer review of the report “Ex-post Investigation of Cost Pass-Though in the E U ETS: an analysis of six sectors” 7
C. DATA
The data spans several categories from January 2005 to February 2015, on a monthly basis:
• Price of the end product;
• Price of labour input;
• Price of energy;
• Price of material input;
• Price on capital input;
• Price of CO2 allowances;
• Stock markets behaviour;
• Volume of sectoral output.
The data is accessed from commercial vendors (Datastream), national statistical offices or Eurostat, as well as by calculation from Prodcom/Comext data.
The amount of free allowances allocated by the EU ETS to these sectors is not considered in the econometric model of the study CEDOI (2015). The study analyses whether or not carbon costs have been passed through to final product prices across six industrial sectors without analysing the potential effect of mitigation costs thanks to free allocation.
D. MAIN RESULTS
The main results of the study are summarized in the Table 1 (page 9):

Institute for Climate Economics - I 4CE
An independent Peer review of the report “Ex-post Investigation of Cost Pass-Though in the E U ETS: an analysis of six sectors” 8
From this table, the reader may infer that there is ample evidence of a positive answer for the two questions:
• Carbon costs have been passed through to the final product prices for a number of products, which is more pronounced for cement, iron & steel, and refineries sectors (Q1) ;
• Cost pass-through rates (Q2) vary across products and are roughly 20-40% for cement, around 100% for petrochemicals, 55-85% for iron & steel, 80-100% for petrol or above 100% for diesel and gasoil, and 40-100% for glass.
For each sector, the table indicates in its column 3 if the cost pass-though is not significant and in which countries, in its column 4 if the cost pass-through is significant and in which countries (Q1), and in its column 5 the indicative rate of the cost pass-through (Q2).
• For the petrochemicals, the table indicates that there is no evidence of carbon cost pass-through for three products of the sector : mono ethylene glycol, methanol and butadiene; there is only evidence of carbon cost pass-through for propylene oxide but only in the North-Western Europe area; and there is no robust evidence of carbon pass-through for propylene glycol ether.
• For refineries, the study finds reasonably high indicative cost pass-through rates , ranging
from 80-100% for petrol and at, or over, 100% for diesel and gasoil with a more strong evidence for diesel rather than for gasoil and petrol, but finds that there is heterogeneous responses across these countries for these two last products, undermining the demonstration of the evidence at the EU level .
Authors underline some limitations of their analysis and are aware th at results of the study need to be considered with cautious . They admit that (page 8) “the extent to which costs are estimated to be passed through is highly dependent of the methods chosen and the data used”; recognize (page 10) that “only price-setters can make a formal decision to pass through carbon costs explicitly; and state (page 61) that “the estimated cost pass-through rate is only giving an indicative value”.
The study draws also cautions conclusions on carbon leakage based on its findings, stating that evidence of pass-through is not an indicator for le akage . Indeed, establishing the effect of cost pass-through on leakage would require further investigation into the effect of pass-through on trade flows.
However, some additional limitations have been identified by independent peer-reviewers that are specified in the section 2.

Institute for Climate Economics - I 4CE
An independent Peer review of the report “Ex-post Investigation of Cost Pass-Though in the E U ETS: an analysis of six sectors” 9
2. PEER-REVIEW: CRITICAL ASSESSMENT OF THE CE DEFLT AND OEKO
INSTITUT STUDY’S RESULTS
A. THE POSITIVE CONCLUSION FOR Q1 IS NOT SUPPORTED BY A STRONG
ECONOMETRIC EVIDENCE
First of all, the econometric robustness can be dis cussed . On the statistical significance of coefficients reported in the results tables, only the 10% threshold is used. The choice of the critical level (10%) for assessing the significance of the estimates is marginally reliable. This is quite arbitrary, and not satisfactory from the point of view of understanding for which products the influence of the CO2 coefficient is indeed strong. It would have been much better to indicate also the 1% and 5% thresholds. Indeed,
The results for the refineries sector are very limi ted . In the study, Table 9 for diesel indicates that carbon cost share coefficient is significant in Belgium, France, Italy, Poland and Greece, except Germany, but this evidence is marginal (at 10% level). Similarly, the CO2 cost share in the case of petrol (Table 10) is significant in only two out of six countries (with no satisfactory results for Poland). The evidence for Germany is too marginal to be considered. The same pattern is observed for gasoil (Table 11) where evidence of cost pass-through is significant in Belgium, Germany and in France. We can clearly see this lack of significance in Table 12 where CO2 coefficients and cost pass-through rates are reported. Indeed, CO2 cost share is significant in only 8 out of the 18 cases (so 44%) at the 5% level, which is the conventional threshold for economic studies.
Taken together, if we ignore the countries with mar ginal evidence of CO 2 cost pass-through and statistically invalid estimates, the findings f or refineries sector in 6 countries under consideration offer not a solid ground for their ge neralization at the EU level .
The results presented for petrochemicals sector are also quite limited. Whenever ARDL models2 are successfully implemented, according to the authors, “adjustment coefficients are all negative” but somewhat large for Ethylene that turns out to be problematic later (page 131). Page 126, the price of MEG (CIF) (Table 68, page 199) is stationary in raw form. The authors did not comment on that possibility invalidating the couples of variables including MEG. For MEG (CIF) and Ethylene (CIF), the authors admit (note in Table 25, page 128) “potential problems in model formulation”. Overall for petrochemicals, the evidence of cost pass-through is not overwhelming meaning there is no evidence of cost pass-through provided by robust econometric results (page 130) as (i) “the models seemed to suit the data not very well”, and (ii) “the estimated cost shares are high”3. Many inconsistencies seem to impact the results reproduced in the Table 25.
Altogether only models for four out of seven products (ethylene, mono ethylene glycol, propylene oxide and propylene glycol ether) provide good fits to the data. For these four products it is worth noting that the results are not significant for all the nine price series. Two series display insignificant results and two others show statistical problems.
These mixed results for the petrochemical products cannot permit the generalization of the results, i.e., the validity of the carbon cost pass -through is not supported by the data.
2 The ARDL model stands for Autoregressive Distributed Lag Model. This econometric model is used to test the relationship – the statistical property of cointegration - between several variables 3 Table 25 (page 128), the t-statistic (1.434) for the CO2 coefficient is marginally significant, although the authors
highlight it in bold.
Institute for Climate Economics - I 4CE
An independent Peer review of the report “Ex-post Investigation of Cost Pass-Though in the E U ETS: an analysis of six sectors” 10
B. MOREOVER THE MODEL SPECIFICATIONS HAVE NOT BEEN PROPERLY
DISCUSSED
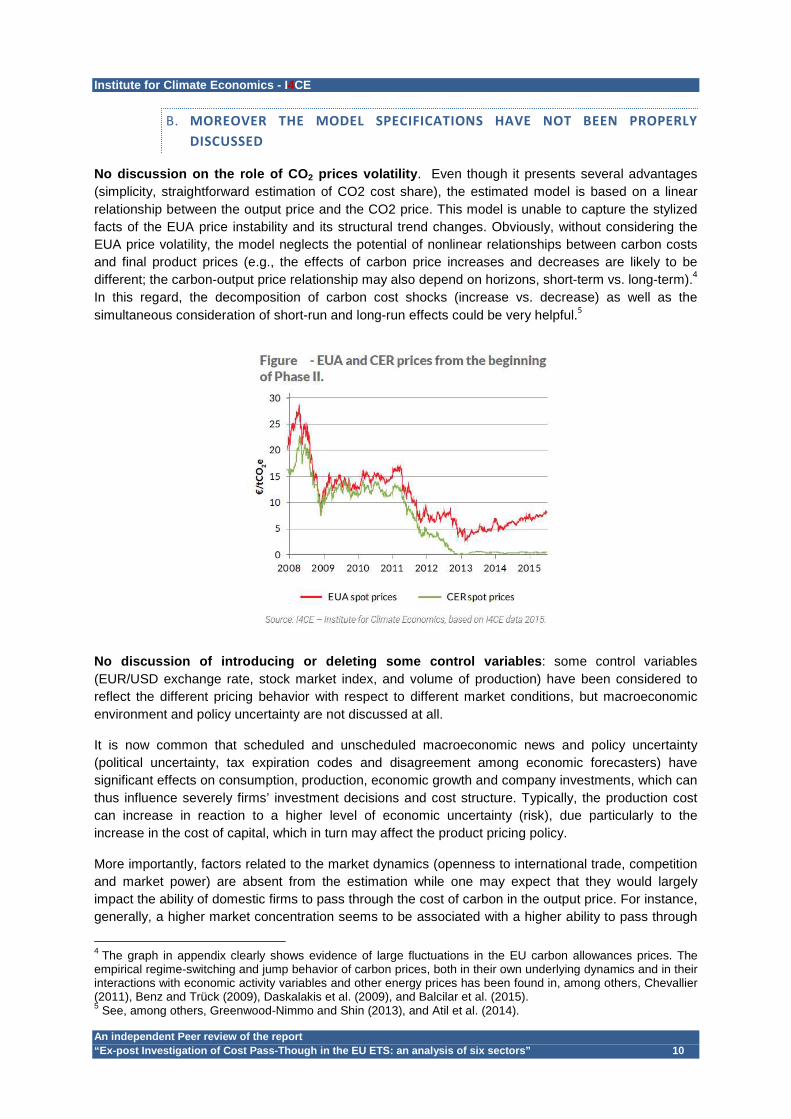
No discussion on the role of CO 2 prices volatility . Even though it presents several advantages (simplicity, straightforward estimation of CO2 cost share), the estimated model is based on a linear relationship between the output price and the CO2 price. This model is unable to capture the stylized facts of the EUA price instability and its structural trend changes. Obviously, without considering the EUA price volatility, the model neglects the potential of nonlinear relationships between carbon costs and final product prices (e.g., the effects of carbon price increases and decreases are likely to be different; the carbon-output price relationship may also depend on horizons, short-term vs. long-term).4 In this regard, the decomposition of carbon cost shocks (increase vs. decrease) as well as the simultaneous consideration of short-run and long-run effects could be very helpful.5
No discussion of introducing or deleting some contr ol variables : some control variables (EUR/USD exchange rate, stock market index, and volume of production) have been considered to reflect the different pricing behavior with respect to different market conditions, but macroeconomic environment and policy uncertainty are not discussed at all.
It is now common that scheduled and unscheduled macroeconomic news and policy uncertainty (political uncertainty, tax expiration codes and disagreement among economic forecasters) have significant effects on consumption, production, economic growth and company investments, which can thus influence severely firms’ investment decisions and cost structure. Typically, the production cost can increase in reaction to a higher level of economic uncertainty (risk), due particularly to the increase in the cost of capital, which in turn may affect the product pricing policy.
More importantly, factors related to the market dynamics (openness to international trade, competition and market power) are absent from the estimation while one may expect that they would largely impact the ability of domestic firms to pass through the cost of carbon in the output price. For instance, generally, a higher market concentration seems to be associated with a higher ability to pass through
4 The graph in appendix clearly shows evidence of large fluctuations in the EU carbon allowances prices. The empirical regime-switching and jump behavior of carbon prices, both in their own underlying dynamics and in their interactions with economic activity variables and other energy prices has been found in, among others, Chevallier (2011), Benz and Trück (2009), Daskalakis et al. (2009), and Balcilar et al. (2015). 5 See, among others, Greenwood-Nimmo and Shin (2013), and Atil et al. (2014).

Institute for Climate Economics - I 4CE
An independent Peer review of the report “Ex-post Investigation of Cost Pass-Though in the E U ETS: an analysis of six sectors” 11
costs. The authors stated that “lack of empirical data (on market power) prevents clear estimation of this relationship (market power effects on output price)”.
C. THE DATA IS HETEROGENEOUS AND NOT REPRESENTATIVE
Data consistency and reliability are not guaranteed : while the authors have taken care of the data problems by doing appropriate treatments (moving average, outlier elimination) and transformations, the main problems with their dataset is the heterogeneity of data sources and their consistency across countries. For instance for petrochemical products, information was only found for the year 2010. In addition to the data collection consistency, since the estimations of the relationship between input and output prices are carried out for “2-3 products” in “2-3 countries”, one can be very skeptical with the representative character of the data.
On energy prices, the method may not capture well t he true variation in energy prices faced by the production sector . Indeed, the authors construct a sector-specific price index by combining country-specific energy price series by fuel type and sector-product specific consumption of these fuel types from SimaPro for Western Europe. This method may not capture well the true variation in energy prices faced by the production sector in cases where fuel composition in a country/plant for a certain product diverges from the Western-Europe average or if there is considerable process heterogeneity across plants for a certain product.
In addition, there are a number of issues with the quality of the country- specific energy price data. First, it is not clear why the authors chose to use energy prices without taxes/ subsidies. In examining the drivers of product prices, it would seem sensible to account not only for the variation in base-energy prices over time, but also the variation in total energy prices including tax. It is well understood from the literature that industrial producers pass-through the cost of energy taxes (e.g. Marion and Muehlegger (2011)). By excluding the tax/subsidies component, the estimations are therefore can underestimate/overestimate the betas on the energy prices, depending on how these taxes/subsidies affect the energy costs. In addition, the energy price series data collected is not specific to industry, except for natural gas prices. Energy prices can vary considerably by consumer (e.g. electricity generation, industry, commercial and retail). The variation over time may be driven mainly by the global fuel price hence similar across different end-users, or it may also diverge, for example if prices are regulated for certain users (e.g. with fuel subsidies or long-term energy price contracts). For example, the IEA reports energy prices and price indexes by fuel type by different user group including industrial users. This may be a better source of energy price data.
D. THERE ARE NO ECONOMIC INTERPRETATION OF THE ECONOMETRIC
RESULTS
The empirical results seem to be purely data-driven , given the drawbacks in methodological approach and the data inconsistency/representativity: the study shows a divergence of cost pass-through rates across sectors and products (even for those of the same sector). While the divergence of the results may exist, proper economic justifications of these differences are more than needed.
As noted repeatedly in our report, the analysis conducted in the study CEDOI (2015) is able to give an indication of the degree of pass-through, but there is a high degree of uncertainty around this magnitude. The "indicative cost pass-through rates " or "CO2 cost shares" estimated in the study CEDOI (2015) are interesting from a comparative perspective of sectors or products. This interpretation is misleading, as they cannot be compared to actual cost pass-through rates, as is acknowledged in the study. It would have been better then to group products by relative indicative cost

Institute for Climate Economics - I 4CE
An independent Peer review of the report “Ex-post Investigation of Cost Pass-Though in the E U ETS: an analysis of six sectors” 12
pass-through levels (e.g. using high/medium/low categories) to avoid miss-leading comparisons with existing estimates, for example.
E. THE QUANTITATIVE ESTIMATES ON PASS-THROUGH RATES (Q2) SHOULD
NOT BE TAKEN AT FACE VALUE
First of all, there are important data issues .
• Emissions factors for refineries are derived from the literature to compute the indicative cost pass-through rates (Section 4.2.8, page 74). These factors are insufficiently documented (COWI et al., 2015 not found in the reference list page 171 to the best of my knowledge). Robustness checks need to accompany these choices to ensure reliability of estimates and conclusions derived from them.
• Emissions factors for petrochemicals are derived from the literature which is written in Dutch (reference to Agentschap), limiting readership. A second reference to Ecofys (2009) attempts to convince the reader that the range of values is reliable for computing the indicative pass-through rates, although the authors do not provide sensitivity analysis as to how these choices impact their published results.
More fundamentally, the econometric methodology adopted –- the cost-price approach -- is to regress product prices on a number of ‘average costs’ such as average material input costs, labour costs, capital costs and energy costs. Explaining product prices as a function of various average input costs is not grounded in economic theory . Standard microeconomic theory rather equates prices to marginal costs (under perfect competition).
The petrochemical and refineries sectors are characterized by multiple and heterogeneous products and integrated or complex production processes. The choice to use average costs as explanatory variables reflects data availability constraints an d severely reduces the significance of the values obtained for Q2.
The authors do acknowledge the role of economic factors for price formation (competitiveness, market structure, heterogeneity of competitors, capacity constraints…). Since these factors are not introduced in the model, and even quantified, any interpretation of the results remains speculative at best.
The methodology used by the authors may be contrast ed with the one used in the electricity sector where the economic analysis of price formati on is much better explicited (see e.g. Fabra (2014). There is also a highly relevant ex-post literature that analyse pass-through of energy costs and taxes in the refinery products such as gasoline and petrol. For example Doyle and Samphantharak (2008) examine the effects of gasoline sales taxes on sales prices at the gas-station level using microdata (station level) and linear regression, by exploiting a temporary suspension of the sales tax in two US states. Marion and Muehlegger (2011) also examine gasoline and diesel tax pass-through to retail prices but using US state-level data a fixed effects model and explores the role of supply constraints such as refinery capacity utilisation. Ganapati et al (2016) instead uses a highly ambitious and complex approach that 'backs-out' or recovers pass-through estimates using a production function.
Answering Q2 would require a much more involved economic model. This model would allow estimating output elasticities, marginal costs and markups, market structure including the degree of openness to foreign competition to better understand the mechanism behind and determin ants of pass through.

Institute for Climate Economics - I 4CE
An independent Peer review of the report “Ex-post Investigation of Cost Pass-Though in the E U ETS: an analysis of six sectors” 13
3. CONCLUSION
The CE Delft and Oeko Institut study provides some evidence of carbon costs pass-through in six carbon intensive sectors that benefited from free allocations. This evidence raises the question ofthe economic rationale for categorizing these sectors as being at risk of leakage. However, our peer review amply demonstrates that the econometric results of the study have not been firmly established. They cannot be used for direct policy recommendations. The main limitations are the following ones.
1. The demonstration of the evidence of carbon costs p ass-through is not supported by strong econometric evidence . The econometric significance threshold of 10% can be discussed, limiting the significance of results for both sectors.
2. The model specifications have not been properly dis cussed in the study regarding the role of EUA price volatility, suggesting a linear relationship between the output price and the carbon price and neglecting the potential nonlinear relationships between carbon costs and final product prices. The macroeconomic environment and policy uncertainty are not discussed in the study.
3. The data is heterogeneous and not representative fo r a conclusion at the EU level .
4. The empirical results seem to be purely data-driven and not linked with a more economic interpretation .
5. The quantitative estimates on pass-through rate are indicatives and should not be taken at face value .
As suggested by authors of the study, and demonstrated by this report, main results of the CE Delft and Oeko Institut study need to be considered with caution and would require further investigation to support any policy recommendations.
***

Institute for Climate Economics - I 4CE
An independent Peer review of the report “Ex-post Investigation of Cost Pass-Though in the E U ETS: an analysis of six sectors” 14
4. ANNEX – THE PEER-REVIEW REPORTS FROM THREE ACADEMIC EXPERTS
Paris, April 22, 2016
PEER-REVIEW ESTABLISHED BY
PROFESSOR XXXX
The objective of the present document is to provide an academic peer-review of the DG Clima report “Ex-post investigation of cost pass-through in the EU ETS” published by CE Delft and Oeko-Institut on November 2015.
1. OBJECTIVE OF THE STUDY
The study examines which ETS-related carbon costs have been passed through in the product prices of industries. The authors admit that (page 8) “the extent to which costs are estimated to be passed through is highly dependent on the methods chosen and the data used”.
2. MAIN FINDING OF THE STUDY
The authors state that (page 10) “industry often passes through a substantial share of the opportunity cost of freely obtained allowances” although they recognize as well that “only price-setters can make a formal decision to pass through carbon costs explicitly”.
The main finding features that carbon costs have been passed through for about 60% of the product prices investigated.
3. LITERATURE REVIEW
Section 2.5 (page 38), ex-post empirical studies on cost-pass through are of particular interest for this peer-review, since we are mostly interested in analysing the reliability of econometric estimates gathered from quantitative data.
The literature review hinges mainly on papers published by Alexeeva-Talebi (Working Paper ZEW 2010, Energy Economics 2011), Oberndorfer et al. (Working Paper ZEW, 2010), CE Delft (2010) and Walker (Working Paper UCD, 2008). Results and data are summarized in Tables 4 through 6 (pages 40-45).
4. ECONOMETRIC MODELLING
The cost-price model of Alexeeva-Talebi (2011) is used in the current report:
����,� = � + ������ �,� + �������,� + �� (M1)
with the logarithm of the price of a product as the dependent variable, the logarithm of the price of inputs (e.g., price of labour, capital, energy, materials, CO2 allowances, etc.) as independent variables, and the error term.
Under H0, the opportunity costs of CO2 have not been passed through.

Institute for Climate Economics - I 4CE
An independent Peer review of the report “Ex-post Investigation of Cost Pass-Though in the E U ETS: an analysis of six sectors” 15
Considerations about the model used:
• As stated by the authors (pages 51-52), the accuracy of the econometric estimates may be impacted by two factors: (i) divergence between costs and prices, and (ii) data problems.
• Gaussianity of the error term is assumed, although not written explicitly in the text of the report. • The coefficient β1 gives the share of CO2 costs in the total product price, i.e. the extent to which
opportunity costs have been put forward in the product price. • The cost pass-through rate in percentage (cpt % rate) is calculated as the ratio of the estimated β1
coefficient over the hypothetical CO2 cost share if all opportunity costs would have been passed through:
���%���� = �������������� ������
!��������� ∗ #$������%&��'�����'�������
(c1)
• To deal with the overestimation of the cost pass-through rate, the cost pass-through ratio in percentage (cpt % ratio) is computed as well:
���%����� = �������������� ������
!�������� ����� ∗ #$������%����'�������
(c2)
• Page 54, the authors concede that the average cost pass-through of a sector thus computed imply the following limitations:
o The value of β1 is a statistical approximation; o Confidence bounds can be quite substantial; o Denominator for ratio (c2) can be difficult to determine precisely because of data issues.
The presentation of the econometric model (M1) is followed by an exposition of VECM vs. ARDL estimation routines.
5. DATA
The data spans several categories from January 2005 to February 2015, on a monthly basis:
• Price of the end product; • Price of labour input; • Price of energy; • Price of material input; • Price on capital input; • Price of CO2 allowances; • Stock markets behaviour; • Volume of sectoral output.
The data can be accessed from commercial vendors (Datastream), national statistical offices or Eurostat, as well as by calculation from Prodcom/Comext data.
Page 60, the authors admit that “the results are very sensitive against the quality of the data, especially regarding the price of outputs”. Besides, they state that the data quality can be particularly poor, such as in the cement & glass sectors. When this is the case, the series are smoothed by substituting outliers or applying MA processes.

Institute for Climate Economics - I 4CE
An independent Peer review of the report “Ex-post Investigation of Cost Pass-Though in the E U ETS: an analysis of six sectors” 16
�To conclude this overview of the methodological framework, the authors are aware (page 61) that “the estimated cost pass-through rate in this research is only giving an indicative value”, and that “it provides a conjectured estimate of the amount of costs that seem to be passed through in the product prices”.
6. RESULTS
In the remainder of the peer-review, we focus on the analysis of the estimation results for the refineries (NACE code 1920) and petrochemicals (NACE code 2014) sectors.
6.1 REFINERIES (NACE 1920)
Results are provided for the prices of diesel / gasoil (weekly data) and petrol (monthly data) for Belgium, Germany, France, Greece, Italy and Poland. VECM models are invalidated by a high sensitivity to the lag parameterization, and mostly by residual autocorrelation. Hence, ARDL models are implemented.
According to the authors (page 71), “ARDL models behaved reasonably well for the refineries sector” with “well behaved residuals”, “consistent estimates”, where “all variables have the expected signs”. The main conclusions feature that (page 71) “significant cost pass-through of CO2 was found”, (page 76) “refineries seem to be able to pass-through the majority of the costs of carbon allowances”.
Delving into the results:
• for Diesel (Table 9, page 72), the authors emphasize that “adjustment coefficients are negative and significant indicating a long-term tendency within the market for diesel to revert to the equilibrium relationship” (in the case of a cointegration between diesel, CO2 and Brent prices). Note: (i) the order of lags retained (mostly zero) seems to point out a contemporary relationship which is odd; (ii) the t-statistic for the CO2 coefficient of Greece (1.322) is on the margin of the 10% statistical significance under Gaussian law although highlighted in bold by the authors.
• for Petrol (Table 10, page 73), it is reported that adjustment coefficients are negative and significant – except for Poland.
• for Diesel and Gasoil, evidence of cost pass-through rates higher than 100% % cost pass-through ratios (Table 12, page 76) can be puzzling to the reader, although the authors attempt to explain it.
6.2 PETROCHEMICALS (NACE 2014)
Results are provided for Butadiene, Ethylene, Methanol, MEG, Propylene, PGE, Propylene Oxide in North West Europe and Mediterranean countries. The cointegration relationship is conducted between the price of the output, the price of Naphta and the CO2 price. Further on the results:
• Whenever are ARDL models are successfully implemented, according to the authors, “adjustment coefficients are all negative” but somewhat large for Ethylene that turns out to be problematic later (page 131).
• Page 126, the price of MEG (CIF) (Table 68, page 199) is stationary in raw form. Does that imply unbalanced VECM / ARDL analysis? The authors did not comment on that possibility invalidating the couples of variables including MEG. For MEG (CIF) and Ethylene (CIF), the authors admit (note in Table 25, page 128) “potential problems in model formulation”. Overall for petrochemicals, the evidence of cost pass-through is not overwhelming (page 130) as (i) “the models seemed to suit the data not very well”, and (ii) “the estimated cost shares are high”.
• Table 25 (page 128), the t-statistic (1.434) for the CO2 coefficient is marginally significant, although the authors highlight it in bold. Many inconsistencies seem to impact the results

Institute for Climate Economics - I 4CE
An independent Peer review of the report “Ex-post Investigation of Cost Pass-Though in the E U ETS: an analysis of six sectors” 17
reproduced in this Table, with neither VECM nor ARDL specifications being satisfactory, ending up in a VAR in first-difference specification that does belong to the cointegration space.
7. ANALYSIS
The authors recognize (page 62) that “the crucial element is here to obtain an estimation that is unbiased and efficient in which the t-statistics can be interpreted without problem”.
In fact, the authors are several times “stuck with inconsistent models” (page 71) and need to find a way around their problem. Sometimes, the solutions envisaged can be critically discussed upon.
7.1 REFINERIES (NACE 1920)
Results reproduced in Table 9 (page 72) for Diesel, Table 10 (page 73) for Petrol, Table 11 (page 72) for Gasoil are presented in reduced form only . The same comment applies for Tables 47 to 49 in the Annex B. This choice can be criticized because the reader is not given detailed tables with the full estimation results, but only a fraction of them. Further useful robustness checks about the choice of the lags and further statistical tests that could be implemented (for residual autocorrelation, normality, heteroscedasticity) are missing to the reader.
For Petrol , the estimation routine page 72) “did not produce satisfactory results”. Instead, the authors choose to add costs of labour to improve the estimates. The justification for such a choice is poor (inexistent), without a hint of sensitivity analysis for further candidates of additional variables. Taken together with the absence of any significant finding for Poland, it appears difficult to draw any policy recommendation at all from the results produced for Petrol.
Emissions factors derived from the literature to compute the indicative cost pass-through rates (Section 4.2.8, page 74) are insufficiently documented (COWI et al., 2015 not found in the reference list page 171 to the best of my knowledge). Robustness checks need to accompany these choices to ensure reliability of estimates and conclusions derived from them.
7.2 PETROCHEMICALS (NACE 2014)
Although the inclusion of the price of Naphta in the cointegration relationship is convincing, the list of additional variables (page 126; e.g., “energy prices, wages, the interest rate, the stock exchange, an indicator for the production in the sector and the €/$ exchange rate”) comes with a lack of proper economic or engineering justification.
In a similar vein, the choice (page 126) of (i) German data as the proxy of Energy, Wages, and the Interest Rate for North-West Europe, and (ii) Italian data as a proxy for the Mediterranean countries values is neither supported by empirical evidence nor accompa nied by a sensitivity analysis of the implications of such choices .
Emissions factors derived from the literature are written in Dutch (reference to Agentschap), limiting readership. A second reference to Ecofys (2009) attempts to convince the reader that the range of values is reliable for computing the indicative pass-through rates, although the authors do not provide sensitivity analysis as to how these choices impact their published results.
The authors admit (page 131) “without further analysis it is difficult to discern to what extent costs may have been passed through”. Therefore, the empirical evidence can be viewed as weak for this sector.

Institute for Climate Economics - I 4CE
An independent Peer review of the report “Ex-post Investigation of Cost Pass-Though in the E U ETS: an analysis of six sectors” 18
SUMMARY:
According to the present peer-review, the report “Ex-post investigation of cost pass-through in the EU ETS” presents the following shortcomings that need to be addressed before formulating policy decisions based on its conclusions:
◊ The ex-post empirical literature on which hinges the model features only one paper published in an internationally refereed journal (e.g., Energy Economics, impact factor 2.708).
◊ The authors claim proprietary access to their database, mixing publicly available data and commercial data. This stance limits replication of the report’s results for a wider audience.
◊ The reader is not given any clue about the software and optimization routines on which the model runs.
◊ The modelling strategy features essentially linear time-series econometrics techniques (e.g., VECM, ARDL, Granger-causality, Unit root tests). Several caveats may be uncovered.
1. First, which functional form has been selected for the cointegration framework? (with trend and/or constant in the data and/or in the cointegration equation). There is no record of such critical choices.
2. Second, have the authors explored weak / block exogeneity for the variables entering the VECM-ARDL models?
3. Third – and somewhat even more importantly – have the authors considered the hypothesis that the cost pass-through rates / ratio investigated in their report could turn up to be essentially NONLINEAR? (e.g. Threshold VARs, Threshold Cointegration, Unbalanced Cointegration) In the latter case, the methodological framework (and the results based upon) would be invalidated.
◊ For petrochemicals, in the words of the authors, (page 127) “in six price series our models behaved poorly (…) the models we estimated did not solve the issue of higher order auto correlation and the ARDL selection did not pick any model as reliable”. For these products (e.g. butadiene, propylene and methanol), “we could not estimate the potential cost pass-through (…) in the petrochemical industries”.
◊ Indicative cost pass-through rates reported in Tabl e 29 (page 144) are “ the outcome of regression analysis (…) shielded by a confidence interval (which) consists of a range of values that act as good estimates of the unknown co st pass-through parameter ”. Given the shortcomings highlighted in this Peer-Review, the e conometric evidence gathered in this report falls short to provide reliable estimates th at could eventually feed-in policy formulation.
Prof. XXXXX

Institute for Climate Economics - I 4CE
An independent Peer review of the report “Ex-post Investigation of Cost Pass-Though in the E U ETS: an analysis of six sectors” 19
Date: April 22, 2016
PEER-REVIEW ESTABLISHED BY
PROFESSOR XXXXX
Purpose
I conduct this independent review in two steps:
• First, I comment the main points of the study as a whole including, among others, its objectives, methodological approach, empirical findings and main conclusions. This general assessment is important because the sectoral analysis is straightforwardly affected by how the overall analytical framework is designed.
• Second, I provide a critical and detailed assessment of the results as well as their interpretations and policy implications, relative to the two EU sectors of particular interest: refineries (NACE 1920) and petrochemical (NACE 2014).
Overview and General Assessment
The study entitled “Ex-post Investigation of Cost Pass-through in the EU ETS: An Analysis for Six Sectors” aims to investigate the extent to which carbon costs have been passed through to the final product prices for six industrial sectors of the European Union over the period 2005-2014 for most of the sectors: iron and steel, refineries, cement, organic basic chemicals, fertilizer, and glass. These sectors are chosen based on their size of carbon emissions, the share of carbon costs in the production costs, and data availability.
The authors of the study make use of a cost-price model similar to the approach used in Alexeeva-Talebi (2011, Energy Economics). After providing a literature review on related studies, they present their empirical approach to assess the pass-through rates of carbon costs into the prices of various products for each of the sectors under consideration, and discuss the implications of the results for each sector, regarding their ability to pass through carbon costs.
Their empirical results of the study, which I will explain later that they cannot be used for guiding climate policy actions, are:
• There is evidence of carbon cost pass-through for a number of products, which is more pronounced for cement, iron & steel, and refineries sectors;
• Cost pass-through rates vary however across products; • Factors such as market power (e.g., bargaining power), and international competition
exposure are the main driving forces of the output price formation and the ability of carbon cost pass-through.
My review identified some serious methodological and interpretation problems of the above-mentioned study, which definitively cast doubt on the reliability of the results and lead to biased policy implications. The usefulness of the presented results in supporting the policy-decision making process is consequently questionable. As we can see later, the main problems can be summarized as follows:
• The study has a limited scope, compared to the poli cy debate on climate change and measures : while it aims to contribute to the understanding of the effects of carbon cost pass-through on the risk of carbon leakage related to the EU ETS market, and to the potential implementation of “safeguard measures”, it only provides, for instance, a mere and linear estimate of cost pass-through rate (obtained from a cost-price model relating the carbon prices to final product prices, in the absence of good proxies for carbon leakage.

Institute for Climate Economics - I 4CE
An independent Peer review of the report “Ex-post Investigation of Cost Pass-Though in the E U ETS: an analysis of six sectors” 20
• Even though it presents several advantages (simplicity, straightforward estimation of CO2 cost
share), the proposed/estimated model is unable to capture t he stylized facts of carbon markets (e.g., large price instability and structural change) and obviously neglects the potential of nonlinear relationships between carbon costs and final product prices (e.g., the effects of carbon price increases and decreases are likely to be different; the carbon-output price relationship may also depend on horizons, short-term vs. long-term).6 In this regard, a nonlinear ARDL which allows for the decomposition of carbon cost shocks (increase vs. decrease) as well as the simultaneous consideration of short-run and long-run effects could be very helpful.7
• The study made no distinction between carbon cost p ass-through related to free carbon allowances and purchased allowances , while carbon leakage risk occurs only if firms are unable to take advantage of opportunity costs related to free carbon allowances. If the latter component (paid costs) is not excluded, there is a risk of underestimating the cost pass-through rate.
• The study suffers from the problem of omitted varia bles : some control variables (EUR/USD exchange rate, stock market index, and volume of production) have been considered to reflect the different pricing behavior with respect to different market conditions, but macroeconomic environment and policy uncertainty are not discussed at all. It is now common that scheduled and unscheduled macroeconomic news and policy uncertainty (political uncertainty, tax expiration codes and disagreement among economic forecasters) have significant effects on consumption, production, economic growth and company investments, which can thus influence severely firms’ investment decisions and cost structure.8 Typically, the production cost can increase in reaction to a higher level of economic uncertainty (risk), due particularly to the increase in the cost of capital, which in turn may affect the product pricing policy. Moreover, factors related to the market structure (competition and market power) are absent from the estimation. In page #10, the authors stated that “lack of empirical data (on market power) prevents clear estimation of this relationship (market power effects on output price)”. I finally think that R&D costs must be explicitly taken into account, as technological change (innovation) would enable firms to obtain the “windfall profits” from the free allowances, all other things being equal.
• Data consistency and reliability are not guaranteed : while the authors have taken care of the data problems by doing appropriate treatments (moving average, outlier elimination) and transformations, the main problems with their dataset is the heterogeneity of data sources and their consistency across countries. Since the estimations of the relationship between input and output prices are carried out for “2-3 products” in “2-3 countries”, I am very skeptical with the representative character of the data. In addition, the market structure/conditions and regulatory frameworks (environmental policy, tax, etc.) still differ very much across the EU countries.
• The empirical results seem to be purely data-driven , given the drawbacks in methodological approach and the data inconsistency/representativity: the study shows a
6 The graph in appendix clearly shows evidence of large fluctuations in the EU carbon allowances prices. The empirical regime-switching and jump behavior of carbon prices, both in their own underlying dynamics and in their interactions with economic activity variables and other energy prices has been found in, among others, Chevallier (2011), Benz and Trück (2009), Daskalakis et al. (2009), and Balcilar et al. (2015). 7 See, among others, Greenwood-Nimmo and Shin (2013), and Atil et al. (2014) 8 See, e.g., Baker et al. (2012), and Kang and Ratti (2013)

Institute for Climate Economics - I 4CE
An independent Peer review of the report “Ex-post Investigation of Cost Pass-Though in the E U ETS: an analysis of six sectors” 21
divergence of cost pass-through rates across sectors and products (even for those of the same sector): roughly speaking 20-40% for cement, 55-85% for iron & steel, 80-100% for petrol or above 100% for diesel and gasoil, and 40-100% for glass. While the divergence of the results may exist, proper economic justifications of these differences are more than needed. Another issue is the choice of the critical level (10%) for assessing the significance of the estimates. In economics, this significance threshold is marginally reliable. Moreover, the authors only use one-sided t-test to decide whether the (positive) opportunity cost of freely obtained allowances (i.e., free allowances are priced at market value which then increases the production cost and price of final products) is passed through to the product price, which left negative cost pass-through coefficients unexplained. Fortunately, they did not find any negative coefficient.
• There is clearly and definitively a serious ambigui ty in terms of result interpretations and policy implications . The null hypothesis of the study is that “the opportunity costs of CO2 have not been passed through” (page #61). Then, the authors state that there is evidence of cost pass-through if the coefficient related to carbon cost share is significantly different from zero. By contrast, “a result where this coefficient is not significantly different from zero can therefore not be regarded as evidence that no costs have been passed through”. Not only it is ambiguous, but also policymakers may get confused when they have to make a concrete action/regulation.
All in all, despite the valuable efforts of the authors, the results of this study remain unreliable and cannot be used for guiding policy actions . Much has to be done in order to make it robust and unbiased. The authors recognized themselves in page #61 that “the estimated cost pass-through rate in this research is only giving an indicative value and can by no means be interpreted as absolute truth”. “This implies that it is difficult to base a decision regarding carbon leakage risk and the free allocation of emission allowances on estimated cost pass-through rates alone”.
In what follows, I provide specific comments for two sectors: refineries and petrochemicals. However, my main critics regarding the invalidity of the empirical results as exposed above still hold.
Comments on the results for the refineries sector
Some facts: The EU refineries sector is characterized by large multinational companies that participate into a global market where prices are somewhat integrated. To examine the null hypothesis of carbon cost pass-through, the authors estimate their empirical model for three major products (diesel, petrol and gasoil) using the data from 6 countries (Belgium, Germany, France, Greece, Italy and Poland). The investigation is based on weekly data for diesel and gasoil, and monthly/weakly data for petrol. The best-suited empirical model, among the VAR, ARDL, and VECM specifications, is selected based on different criteria (unit root tests, causality tests, cointegration tests). The ARDL suits best in most cases.
Variables : the main input is the crude oil price which is proxied by the Brent price index, to which the authors add the CO2 price. The control variables include other costs (wages, interest rate, stock market index, and sectoral production volume).
Problems : I skip the model and lag selection, and stress on the model setting and the estimation results.
• Using a 10% threshold for significance level is really irrelevant. The results in Table 9 for diesel indicate that carbon cost share coefficient is significant in Belgium and Greece, but this evidence is marginal (at 10% level). This finding leads to the fact that the no cost pass-through hypothesis is rejected in only 3 out of 6 cases. Similarly, the CO2 cost share in the

Institute for Climate Economics - I 4CE
An independent Peer review of the report “Ex-post Investigation of Cost Pass-Though in the E U ETS: an analysis of six sectors” 22
case of petrol (Table 10) is significant in only two out of six countries (with no satisfactory results for Poland). The evidence for Germany is too marginal to be considered. The same pattern is observed for gasoil (Table 11) where evidence of cost pass-through is significant in only two cases, Belgium and Germany, with marginal evidence in France. We can clearly see this lack of significance in Table 12 where CO2 coefficients and cost pass-through rates are reported. Indeed, CO2 cost share is significant in only 8 out of the 18 cases (so 44%) at the 5% level, which is the conventional threshold for economic studies Taken together, if we ignore the countries with marginal evidence of C O2 cost pass-through and statistically invalid estimates, the findings for r efineries sector in 6 countries under consideration make me skeptical about any possibili ty of generalization of results at the EU level .
• Another serious drawback is related to the specification of the empirical model for the refineries sector. The latter suffers from the misspecification of the relationship between crude oil prices and the refined petroleum prices . This problem consequently leads to overestimate/underestimate the CO2 cost share. In the past literature, many studies have tackled the issue of crude oil price pass-through to the prices of refined petroleum products. Most of these studies documented that downstream prices (i.e., diesel, gasoil and petrol) respond to increases in upstream prices (i.e., crude oil) more rapidly than their responses to decreases in upstream prices.9 This asymmetric price interaction, also known as “rockets and feathers” effects, suggests that the empirical model needs to explicitly take into account the patterns of changes in crude oil prices (decreases vs. increases). Recall that this modeling could be properly done within a nonlinear ARDL, regardless of the order of integration of the variables in the model.
• The results are not interpreted in an economically meaningful way . I firstly think that the authors explicitly control for the capacity utilization rates and market structure (competition/concentration), but they simply make reference to these factors. The interpretation is merely convincing when the authors attempt to explain the difference in the pass-through rates between petrol and diesel and petrol, for example. The authors mention the substitutability and sales facilities, yet no proof is given and the argument may be specific to Germany. The difference in the findings for different countries is left unexplained. Some interpretations, such as “Both markets (petrol/diesel) may be oligopolistic in nature but operating margins are higher in the diesel market which may indicate that the market structure is less competitive”, are too approximate and not grounded.
• The frequency of data is not always mentioned, whic h does not allow me to have an idea of how the results are sensitive to the data f requency . It is well known that causal relations between price variables are more pronounced with higher data frequency.
Comments on the results for the petrochemicals sect or
Some facts: This sector is a major industry in Europe and derives chemical products from petroleum. As stated in the study, the most significant source of CO2 comes from the transformation of naphtha into monomer ethylene through steam cracking. The hypothesis of carbon cost pass-through is examined for seven products, represented by various price data (spot prices, futures prices, FOB prices, etc.). Empirical models (VECM for most cases) are estimated based on the monthly data and limiting the sample to Phase 2 and 3.
9 See, among others, Bacon (1991), Borenstein et al. (1997), and Grasso and Manera (2007).

Institute for Climate Economics - I 4CE
An independent Peer review of the report “Ex-post Investigation of Cost Pass-Though in the E U ETS: an analysis of six sectors” 23
Variables : the main input is the naphtha price, to which the authors add the CO2 price in order to consider the CO2 cost pass-through. Similar to the refineries section, the authors consider control variables include other costs (energy prices, wages, interest rate, stock market index, and sectoral production volume).
Problems : I skip the model and lag selection, and stress on the model setting and the estimation results.
• The results presented for petrochemicals sector are quite confusing , even though I read the section several times. It seems that only models for four out of seven products (ethylene, mono ethylene glycol, propylene oxide and propylene glycol ether) provide good fits to the data. It is worth noting that the results are not significant for all the nine price series of these four products. Two series display insignificant results and two others show statistical problems.
• Like the authors suggested, the mixed results for the chemical products cannot permit the generalization of the results, i.e., the validi ty of the carbon cost pass-through is not supported by the data (assuming that the models used are correctly specified and the data are consistently constructed).
Conclusion
Given the methodological limitations, the lack of data inconsistency and the absence of main economic drivers of the output prices (e.g., demand and supply shocks/elasticity, market structure, market power, etc.), the results of this study are far from plausible and reliable. Therefore, they should not be used for guiding climate policy measures, all the more carbon leakage indicators are not explicitly accounted for. Much has to be done on the model specification to make sure that estimation results are free of errors and statistical bias.
References
Chevallier, J., 2011. A model of carbon price interactions with macroeconomic and energy dynamics. Energy Economics 33, 1295-1312.
Daskalakis, G., Psychoyios, D., Markellos, R.N., 2009. Modelling CO2 emission allowance prices and derivatives: evidence from the European trading scheme. Journal of Banking and Finance 33, 1230–1241.
Benz, E., Trück, S., 2009. Modelling the price dynamics of CO2 emission allowances. Energy Economics 31, 4–15.
Baker, S., Bloom, N., Davis, S., 2012. Measuring Economic Policy Uncertainty. Working Paper Series. Stanford University.
Kang, W., Ratti, R.A., 2013. Structural oil price shocks and policy uncertainty. Economic Modelling 35, 314-319.
Greenwood-Nimmo, M.J., Shin, Y., 2013. Taxation and the asymmetric adjustment of selected retail energy prices in the UK. Economics Letters 121, 411-416.
Bacon, R.W., 1991. Rockets and feathers: the asymmetric speed of adjustment of UK retail gasoline prices to cost changes. Energy Economics 13, 211–218.

Institute for Climate Economics - I 4CE
An independent Peer review of the report “Ex-post Investigation of Cost Pass-Though in the E U ETS: an analysis of six sectors” 24
Borenstein, S., Cameron, A.C., Gilbert, R., 1997. Do gasoline prices respond asymmetrically to crude oil price changes? Quarterly Journal of Economics 112, 305–339.
Grasso, M., Manera, M., 2007. Asymmetric error correction models for the oil– gasoline price relationship. Energy Policy 35, 156–177.
Appendix. Spot prices of EU emission allowances 10
10 https://www.eex.com/en/market-data/emission-allowances/spot-market/european-emission-
allowances#!/2016/04/21

Institute for Climate Economics - I 4CE
An independent Peer review of the report “Ex-post Investigation of Cost Pass-Though in the E U ETS: an analysis of six sectors” 25
REVIEW OF “EX-POST INVESTING OF COST PASS-THROUGH IN THE EU ETS”
BY PROFESSOR XXXX
DATE: 26TH APRIL 2016
1. Summary
This report provides a review of the study “Ex-post investigation of cost pass-through in the EU ETS” by CE Delft and Oeko-Institut (November 2015) (abbreviated CEDOI 2015 hereafter).
CEDOI (2015) aims to empirically assess whether or not CO2 cost pass-through has occurred in the context of the EU ETS, for six industrial sectors. The fact that firms have the ability to pass through costs is well-established in the literature in public finance on the incidence of tax in general, and also on the incidence of carbon taxes, fuel taxes and energy prices more specifically (Section 2). This study contributes to the evidence base on the question as to whether or not firms actually pass through carbon costs. The study also attempts to estimate the degree to which cost pass-through. While the evidence on pass-through is robust for the electricity sector which benefits from homogeneous product and availability of high frequency data on output and input prices, the evidence is much less robust in he industrial sectors. Econometric analysis on this topic is notoriously difficult for industrial sectors, often characterised by multiple and heterogeneous products and integrated or complex production processes.
The study's approach is to first assess the current state of understanding on cost pass-through by surveying the broad surrounding literature. In particular, the time-series econometric model choice is heavily guided by the developments in the existing literature. This is followed by an extensive data collection exercise, to gather weekly or monthly data for 50 products covered. The constructed dataset then enables an econometric analysis across many products, exploring the ways in which carbon prices affect sale prices. Additional qualitative and quantitative analysis is then conducted on factors that determine cost pass-through.
The econometric methodology adopted –- the cost-price approach -- is to regress product prices on a number of ‘average costs’ such as average material input costs, labour costs, capital costs and energy costs. Explaining product prices as a function of various average input costs is not grounded in economic theory. Standard microeconomic theory rather equates prices to marginal costs (under perfect competition). This choice to use average costs as explanatory variables in this study reflects data availability constraints, because there are often multiple input factors for industrial production and it is difficult to obtain marginal costs data or to compute estimates of marginal costs in industrial sectors. It is relatively more straightforward in the electricity where the economic analysis of price formation is simple and much better understood (see e.g. Fabra (2014).
The fact that the chosen econometric model relates product prices to average rather than marginal costs changes means that the results coefficient on the carbon price cannot be straightforwardly interpreted as a cost pass-through rates, as is the case with a specification which relates prices to marginal costs (i.e. with 1 representing complete pass through). The interpretation of the coefficients is therefore more nuanced as discussed in section 2.3.2 and 3.3.3, but the results do still indicate both the existence of carbon cost pass through, and relative magnitudes.
The econometric techniques used for time-series data analysis in CEDOI (2015) -- ARDL and VECM-- are not novel. Rather, they are well established and suitable for the data and purpose. These methods are rigorously implemented and suitable tests are conducted to guide the choice of specific methodology for each product.

Institute for Climate Economics - I 4CE
An independent Peer review of the report “Ex-post Investigation of Cost Pass-Though in the E U ETS: an analysis of six sectors” 26
The key result of the study is that it finds evidence of significant pass-through in a number of products studied. It provides additional evidence rejecting zero pass-through, on which there is already a firmly established consensus in the wider economics literature on the incidence of tax. The fact that firms have the ability to pass through costs and that they actually pass through costs is well-established in the literature in public finance on the incidence of tax in general, and also on the incidence of carbon taxes, fuel taxes and energy prices more specifically (Section 2). The headline finding of the report - that CO2 cost pass-through indeed occurs - is therefore neither novel nor controversial and aligned with the surrounding literature. The results also show heterogeneous incidences of changes in CO2 prices across products and sectors. Whilst caveating that pass-through rates cannot be measured with high degree of precision, the study also shows that for many products, large shares have been passed through to product prices.
While the findings and methods are not unique, this study nonetheless represents a substantive and high quality contribution to the literature in a number of ways. The first key contribution is in the dataset constructed for analysis, which is impressive in scope and level of detail, and goes beyond previous studies in this area. Data availability has been the major obstacle to conducting this type of analysis outside the electricity sector, due to the data-intensive nature of this type of time-series econometric analysis. To avoid omitted variable bias issues requires collecting not only data on output prices and carbon prices (at reasonably high-frequency), but also on other determinants of output prices such as other input prices such as labour and materials. Obtaining these information at a fairly high frequency, at disaggregated sector level (e.g. NACE 4-digit) and for several countries is a non-trivial task and is thus a major achievement of this study.
A second, related key contribution is the scope of analysis in terms of sector/ product coverage (50 products in six carbon intensive sectors) and geographical coverage, enabled by the data collection efforts. Compared to previous studies that focus on few select products, this study offers a broader view of how the EU ETS affects pricing behaviour in the key emitting sectors. The study finds evidence of cost pass through in 60% of the 50 products studies, demonstrating that CO2 cost pass through is indeed a fairly generalizable phenomena and prevalent across the manufacturing/industrial sectors, as is expected.
The key weakness of the report is that it is difficult to translate the estimates into pass-through rates.
Overall CEDOI (2015) adds value to this literature and advances the evidence-based literature.
2. The choice of general ex-post approach and its p ositioning within the existing literature
The key hypothesis being tested in CEDOI (2015) is whether cost pass-through indeed occurs or not. The existence of some cost-pass through in general is undisputed in the academic literature - where there is less certainty is the degree of pass-through. Nonetheless, the very existence of cost pass-through remains a contentious point in the policy debate, with some sectors denying this occurrence.
The chosen cost-price model is appropriate because it is based on observed data, and the method is simple and straightforward, regressing the output price on input prices. It enables statistically testing whether variation in carbon prices over time affects the product sale price - the null being that CO2 prices do not affect product prices and a simple significance test indicates if the null is rejected or not rejected. It also relies on fewer assumptions (e.g. relative to approaches that 'back-out' or recover pass-through rates by estimating a production function as adopted in Ganapati et al. 2016) making the results more tangible and suitable for input into politically charged discussions.
As noted in CEDOI (2015), so far only a handful of studies take an ex-post approach to quantifying CO2 cost pass through, hence more studies are needed to enable policy decisions to be made on

Institute for Climate Economics - I 4CE
An independent Peer review of the report “Ex-post Investigation of Cost Pass-Though in the E U ETS: an analysis of six sectors” 27
solid empirical grounds. The growing data availability with over a decade's EU ETS experience also justifies more work on cost pass through resulting from this policy.
There is, however, a highly relevant ex-post literature that analyse pass-through of energy costs and taxes, which finds robust evidence of cost pass-through in the refinery products such as gasoline and petrol (e.g. Alm et al 2009 and Chouinard and Perloff 2004). For example Doyle and Samphantharak (2008) examine the effects of gasoline sales taxes on sales prices at the gas-station level using microdata (station level) and linear regression, by exploiting a temporary suspension of the sales tax in two US states. Marion and Muehlegger (2011) also examine gasoline and diesel tax pass-through to retail prices but using US state-level data a fixed effects model and explores the role of supply constraints such as refinery capacity utilisation. Ganapati et al (2016) instead uses a highly ambitious and complex approach that 'backs-out' or recovers pass-through estimates using a production function. This approach requires numerous assumptions (e.g. on firm cost minimization, symmetric firms) (but arguably less than in CGE models) but also allows estimating output ealsticities, marginal costs and markups to better understand the mechanism behind and determinants of pass-through.
In addition to the political debate, CEDOI (2015) also contributes to filling an important empirical gap in the wider public finance literature on carbon, environmental and energy tax incidence i.e. how relative producer/consumer welfare changes with fluctuations in input prices (e.g. Bovenberg and Goulder 2001; Bovenberg et al 2005; Fullerton and Heutel 2007; Williams et al 2014). These studies explore incidence of environmental taxes using general equilibrium models and expenditure data, and their assumptions about cost pass-through are implicit in the model assumptions, rather than being based on observation. Typically they model complete cost pass-through, because they tend to assume perfect competition and inelastic supply.
3. The choice of empirical specification
To statistically explore CO2 cost pass-through, CEDOI (2015) uses the cost-price approach and regress product prices on a number of ‘average costs’ such as average material input costs, labour costs, capital costs and energy costs. Explaining product prices as a function of various average input costs departs from standard economic theory of price formation. In theory, firms under perfect competition equate prices to marginal costs. Based on this theory, previous econometric studies in the electricity sector have obtained cost pass-through rates by examining the effect of increased marginal costs on prices (e.g. Sijm and Neuhoff 2006 and Fabra 2014). This is relatively straightforward in the case of electricity where there is a homogeneous product, a simple production function with few variable inputs and marginal production costs can be estimated easily (using information on marginal technology and its carbon intensity). This is unfortunately not the case for industrial product. For example, there may be multiple outputs from one integrated production plant, which makes it hard to attribute specific input prices to an output. It is also difficult to obtain or estimate marginal costs for multiple production inputs.
Driven by data availability and other constraints, analyses of cost pass-through in industrial products rely more on average costs as explanatory variables rather than marginal costs. Hence the choice of empirical specification is data driven, rather than being grounded in economic theory. Is this problematic? As discussed in section 2.3.2 of the study, in practice, pricing strategies do not adhere to theory. Some argue that average costs are more relevant than marginal costs in pricing strategies.
Given the absence of marginal cost data, using average costs to try to explain product prices seems an appropriate empirical strategy. Even if this is unfounded in theory. However, it does mean that the results coefficient on the carbon price cannot be straightforwardly interpreted as a cost pass-through rates, as is the case with a specification which relates prices to marginal costs (i.e. with 1 representing complete pass through). The interpretation of the coefficients is therefore more nuanced as discussed in section 2.3.2 and 3.3.3.

Institute for Climate Economics - I 4CE
An independent Peer review of the report “Ex-post Investigation of Cost Pass-Though in the E U ETS: an analysis of six sectors” 28
4. The choice of econometric methodology and its po sitioning within the existing literature
The strategy to econometric analysis adopted by CEDOI (2015) is one of maximum data collection and utilisation - to collect as much data as possible on the observable factors influencing sales price, then run a regression including all these variables. Considerable effort has therefore been put into collecting price series for various material inputs of production, sector specific labour prices, constructing a sector specific energy price index etc. This data collection effort addresses the concerns of omitted variable bias in regression analysis, to which previous ex-post studies such as CE Delft (2010) are vulnerable.
4.1 Strength of the approach
The ultimate aim is to econometrically explore how changes in carbon costs (controlling for changes in other input costs) affect sales prices. In the absence of panel data (e.g. station- plant- or firm-level), econometric studies on pass-through relationships typically applies three broad time-series techniques: single-equation based approach (AR models); vector autoregression models (VAR) and; cointegrated VAR models or; error correction models. Sticking to the use of these established econometric methodologies is appropriate for the purpose of providing robust and transparent evidence to a highly politically charged debate.
The specific model choice strategy adopted in CEDOI (2015) is clearly illustrated in Figure 2, and no obvious issues can be identified. The flow chart procedure gives the possibility for cointegration to be model dependent, but this appears not to occur in practice. There would be a problem, for example, if once granger causality is accepted in VECM, cointegration test is rejected, but then in ARDL bounds test the conintegration is not rejected.
CEDOI (2015) states in Secion 3.3.4 that the preferred methodology is a Vector Error Correction Model (VECM) as used in Alexeeva-Talebi (2011). VECM estimated for example by OLS represents the short term dynamics between the relationship between variables, and has the key advantage that it allows for cointegration of variables. However, it is suited only to data where all series are stationary (I(0)), integrated of the same order and cointegrated. These set of conditions are less likely to be fulfilled in estimations with many explanatory variables. Indeed, in all the cases of products studied in the Refining and Petrolchemical, these conditions are not met, hence the adopted model is instead an ARDL. It may be possible to alternatively specify a VECM by dropping variables if they are not important. This option is not explored in this study, But doing so would complement well the previous study using VECM (Alexeeva-Talebi (2011), which finds similar results but for an earlier time period (2005-2007).
The adopted ARDL model with Bounds testing methodology of Peseran and Shin (1999) is a good choice when the data structure turns out to be less clear cut e.g. some variables are stationary and some are I(1) and/or there is some cointegration between the I(1) variables. The ARDL method has some advantages over conventional cointegration testing. e.g. it can be used with a mix of I(0) and I(1); involves a single equation set-up and easy to implement and different variables can be assigned different lag-lengths.
4.2 Weaknesses of the approach
The main weakness of the study is the lack of theoretical foundation of the econometric model. There are several downsides to the econometric set-up here as discussed in the paper. The main one being that it is not straight forward to estimate the magnitude of the cost pass-through using this approach. This is due to a number of reasons.
Institute for Climate Economics - I 4CE
An independent Peer review of the report “Ex-post Investigation of Cost Pass-Though in the E U ETS: an analysis of six sectors” 29
First, as explained in the paper, according to the theory of incidence, it more standard in the pass-through literature to consider the effect of changes to input prices on marginal production costs, not average costs. The model (M1*) is set up to assess the impact on marginal costs, but average costs. This affects the interpretation of the results and the magnitudes. It means that the results cannot be interpreted directly as pass-through rates in the usual sense. This shortcoming is described in detail in the report.
Second, the betas reflect the share of sale prices explained by the different input costs like CO2 costs (CO2 cost share), indicating the products for which the sales price is significantly influenced by changes to carbon prices over time. Additional assumptions are required to translate this to a pass through rate. Again, this affects the interpretation of the results and this shortcoming is described in detail in the report.
Third, the econometric model relates costs to sales price. One issue here is that under this setting, the markup contained in the sale price is not modelled explicitly, but is implicit in the product price (value of product sales/ quantity). This should not affect the interpretation of the results and the cost pass through rate because it is already done in average terms, rather than marginal terms. It would be problematic to ignore markup (or assume no or time-constant markup) in a marginal price setting where firms' pricing strategy consists of marginal costs and markup (e.g. Fabra 2014, Ganapati et al 2016). The problem is less obvious with average costs prices, as the relationship between average price and average costs and average markup is less well known/ defined. Intuitively, there is likely to be less fluctuation in the average mark-up over time. It would have been useful to include the a discussion on how markups for example in Section 3.3.3. In any case, data on marginal costs and markups are not readily available. Although sales price is an imperfect proxy of the marginal costs and markup, it still represents the best data available for this type of analysis.
4.3 Comments on the implementation of the methods
On the statistical significance of coefficients reported in the results tables, only the 10% threshold is used. This is quite arbitrary, and not satisfactory from the point of view of understanding for which products the influence of the CO2 coefficient is indeed strong. It would have been much better to indicate also the 1% and 5% thresholds. However, this does not affect the overall results, as there is considerable consistency in the results across countries for the same product.
The results tables do not report coefficients on all the controls, therefore it is nt possible to tell whether omitting these variables is indeed a problem or not. Including variables that have no influence on sales price in this setting does not affect the validity of the results (assuming issues around cointegration etc. are properly dealt with), but omitted variables instead would indeed lead to biased results. Although the adopted approach is 'safe' from this perspective, the choice of explanatory variables to include in the regression should be better justified, as it affects the efficiency and there is also a trade off-between including more explanatory variables and choice of econometric model as is discussed below.
5. The data being used and its underlying assumptio ns
5.1 Data sources
Data are collected from reputable sources such as PLATTS, Eurostat, TR Datastream, Brent Index etc.
On labour costs collected from Eurostat SBS, it appears (but is not explicitly stated) that this study is able to obtain monthly observed personnel costs at the NACE 4-digit level. If this is indeed the case, it
Institute for Climate Economics - I 4CE
An independent Peer review of the report “Ex-post Investigation of Cost Pass-Though in the E U ETS: an analysis of six sectors” 30
marks a significant improvement in data to previous studies which used sectorally more aggregated wage data (e.g. Alexeeva-Talebi (2011) uses aggregation NACE-2 ).
On energy prices, CEDOI (2015) constructs a sector-specific price index by combining country-specific energy price series by fuel type and sector-product specific consumption of these fuel types from SimaPro for Western Europe. While this method is frequently used in the literature, it may not capture well the true variation in energy prices faced by the production sector in cases where fuel composition in a country/plant for a certain product diverges from the Western-Europe average or if there is considerable process heterogeneity across plants for a certain product. In addition, there are a number of issues with the quality of the country- specific energy price data. First, it is not clear to me why CEDOI (2015) choses to use energy prices without taxes/ subsidies. In examining the drivers of product prices, it would seem sensible to account not only for the variation in base-energy prices over time, but also the variation in total energy prices including tax. It is well understood from the literature that industrial producers pass-through the cost of energy taxes (e.g. Marion and Muehlegger (2011) ). By excluding the tax/subsidies component, the estimations are therefore can underestimate/overestimate the betas on the energy prices, depending on how these taxes/subsidies affect the energy costs. In addition, the energy price series data collected is not specific to industry, except for natural gas prices. Energy prices can vary considerably by consumer (e.g. electricity generation, industry, commercial and retail). The variation over time may be driven mainly by the global fuel price hence similar across different end-users, or it may also diverge, for example if prices are regulated for certain users (e.g. with fuel subsidies or long-term energy price contracts). For example, the IEA reports energy prices and price indexes by fuel type by different user group including industrial users. This may be a better source of energy price data.
5.2 Frequency of the data
The analysis CEDOI (2015) collects weekly/ monthly data on variables. In the literature, there is a range of data time frequency, ranging from annual data (e.g. Ganapati et al 2016) to those using hourly data for electricity. In general, higher frequency data is more desirable especially for commodity products that are traded on open markets but there may be high order autocorrelation. For non-commodity products, such data is usually not available, and it is more difficult to say what the optimal frequency of the data is.
For the Refineries sector, while many of the price series are available at weekly frequency, CEDOI (2015) opts or monthly data in order to include explanatory variables such as labour costs. As noted above, it is not clear from the report whether these additional controls are necessary or if weekly data may be better suited. Comparing with the literature, Marion and Muehlegger (2011) also uses monthly data on gasoline and diesel whereas Alexeeva-Talebi (2011) uses weekly data and VECM methodology but only controls for crude oil price, carbon price and exchange rates. It does not account for other material costs, labour costs or capital costs in the regressions. The petrolchemicals sector analysis also uses monthly data. The output prices are available weekly, but the regression is run with monthly prices.
6. Interpretation being drawn on the results
As noted repeatedly in the study, and explained in Section 3, the analysis conducted is able to give an indication of the degree of pass-through, but there is a high degree of uncertainty around this magnitude. The "indicative cost pass-through rates" or "CO2 cost shares" estimated in this study are interesting from a comparative perspective of sectors or products. The value is higher for some sectors like refining, medium for sectors like steel and low for sectors like cement.
Based on regression results, the study suggests indicative CO2 cost pass-through rates. However, this interpretation is misleading, as they cannot be compared to actual cost pass-through rates, as is

Institute for Climate Economics - I 4CE
An independent Peer review of the report “Ex-post Investigation of Cost Pass-Though in the E U ETS: an analysis of six sectors” 31
acknowledged in the study. It would have been better then to group products by relative indicative cost pass-through levels (e.g. using high/medium/low categories) to avoid miss-leading comparisons with existing estimates, for example.
CEDOI (2015) draws cautions conclusions on carbon leakage based on their findings, stating that evidence of pass-through is not an indicator for leakage. Indeed, establishing the effect of cost pass-through on leakage would require further investigation into the effect of pass-through on trade flows.
7. Positioning of the results within the existing l iterature on cost pass through
As noted, the fact that firms with pricing power exercise cost pass through is well established in the literature in public finance on the incidence of tax, and documented across theoretical/ ex-ante and empirical studies. With regards the incidence of carbon taxes, the theory and ex-ante papers also predict a significant degree of cost pass through abilities in firms, and previous econometric studies have found results in line with these predictions as summarised in CEDOI (2015).
From this perspective, the findings in CEDOI (2015) are in line with the literature. For diesel, petrol and gasoil, they find reasonably high CO2 cost shares across most EU member states studied, but find that there is heterogeneous responses across these countries. These findings are in line with Alexeeva-Talebi (2011) and parallel studies that econometrically explore incidence and pass-through rates of fuel taxes and energy prices which also find evidence of full cost pass-through e.g. Marion, J., and E. Muehlegger (2011), Alm et al (2009) and Chouinard and Perloff (2004) for diesel and gasoline taxes.
Incidence of carbon taxes in the petrolchemicals sectors is less well established in the literature. Previous studies include only those in the grey literature: Alexeeva-Talebi (2010) and Oberndorfer (2010). CEDOI (2015) also finds some evidence of cost pass-through for ethylene and mono-ethylene, by combining regression results with further analysis of factors influencing product prices.
References
Alexeeva-Talebi V. Cost Pass-Through in Strategic Oligopoly: Sectoral Evidence for the EU ETS, ZEW Working Paper, 2010
Alexeeva-Talebi, V. (2011). Cost pass-through of the EU emissions allowances: Ex- amining the European petroleum markets. Energy Economics, 33, Supplement 1, S75–S83. Available from: http://www.sciencedirect.com/science/article/pii/S0140988311001599.
Alm, James, Sennoga, Edward, Skidmore, Mark, 2009. Perfect competition, urbanicity, and tax incidence in the retail gasoline market. Economic Inquiry 47 (1), 118–134.
Bovenberg, A. L., and L. H. Goulder (2001): Behavioral and Distributional Effects of Environmental Policy. chap. Neutralizing the Adverse Industry Impacts of CO2 Abatement Policies: What Does It Cost?, pp. 45–90. University of Chicago Press.
Bovenberg, A.L., Goulder, L.H., Gurney, D.J., 2005. Efficiency costs of meeting industry- distributional constraints under environmental permits and taxes. The RAND Journal of Economics 36 (4), 950–970.
Chouinard, Hayley, Perloff, Jeffrey M., 2004. Incidence of federal and state gasoline taxes. Economics Letters 83, 55–60.
Doyle, Jr., J. J., and K. Samphantharak (2008): “200 Gas! Studying the Effects of a Gas Tax Moratorium Across State Borders,” Journal of Public Economics, 92, 869–884.

Institute for Climate Economics - I 4CE
An independent Peer review of the report “Ex-post Investigation of Cost Pass-Though in the E U ETS: an analysis of six sectors” 32
Fabra, N. & Reguant, M. (2014). Pass-through of emissions costs in electricity markets. American Economic Review.
Fullerton, D., and G. Heutel (2007): “The general equilibrium incidence of environmental taxes,” Journal of Public Economics, 91(3-4), 571–591.
Ganapati, S., Shapiro, J. S., & Walker, R. (2016). Energy Prices, Pass-Through, and Incidence in US Manufacturing. Yale Economics Working Paper.
Marion, J., and E. Muehlegger (2011): “Fuel tax incidence and supply conditions,” Journal of Public Economics, 95(9), 1202–1212.
Miller, N. H., M. Osborne, and G. Sheu (2015): “Pass-Through in a Concentrated Industry: Empirical Evidence and Regulatory Implications,” Mimeo, Georgetown University.
Oberndorfer U, Alexeeva-Talebi V, Löschel A. Under- standing the Competitiveness Implications of Future Phases of EU ETS on the Industrial Sectors, ZEW Dis- cussion Paper 10–044. Mannheim: ZEW; 2010
Williams, III, R. C., H. Gordon, D. Burtraw, J. C. Carbone, and R. D. Morgenstern (2014): “The Initial Incidence of a Carbon Tax across U.S. States,” National Tax Journal, 67(4), 807–830.


![[IKEM/I4CE/OFATE] Panorama des investissements dans la](https://img.pdfslide.net/doc/110x75/6237431825b2ec46a71a8070/ikemi4ceofate-panorama-des-investissements-dans-la-.jpg)