Embed Size (px)
Citation preview

BBC RESEARCH & CONSULTING APPENDIX A, PAGE 1
APPENDIX A. AI Supporting Maps
Thisappendixcontainsthemapsthatwerecreatedtoanalyzesegregationandintegration;areasofraciallyandethnicallyconcentratedareasofpoverty(RCAPs/ECAPs);affordablehousingopportunitiesincludingpubliclysupportedhousingpatterns;accesstohousingchoicesforpersonswithdisabilities;anddisparitiesincommunityassets.
Racial and Ethnic Concentration and RCAPs and ECAPs
ForthepurposesofthisAnalysisofImpedimentstoFairHousingChoice(AI),racialandethnicconcentrationisdefinedasCensustractsinwhichthenon‐whiteorHispanicresidentproportionis20percentagepointshigherthantheproportionforthecityoverall.
Censustractsinwhichtheproportionofnon‐Hispanicwhiteresidentsexceeds90percentareidentifiedasraciallyandethnicallyexclusive.
MapsA‐1throughA‐3showtheconcentrationsof:
AfricanAmericanresidents(morethan28%AfricanAmericanresidents—20percentagepointshigherthanthecity’soverallproportionof8%);
Hispanicresidents(morethan55%Hispanic);and
Asianresidents(morethan26%Asian).

BBC RESEARCH & CONSULTING APPENDIX A, PAGE 2
Figure A‐1. Concentrations of African American Residents by Census Tract, Austin, 2012
Source:
2008‐2012 American Community Survey (ACS) and BBC Research & Consulting.
BBC RESEARCH & CONSULTING APPENDIX A, PAGE 3
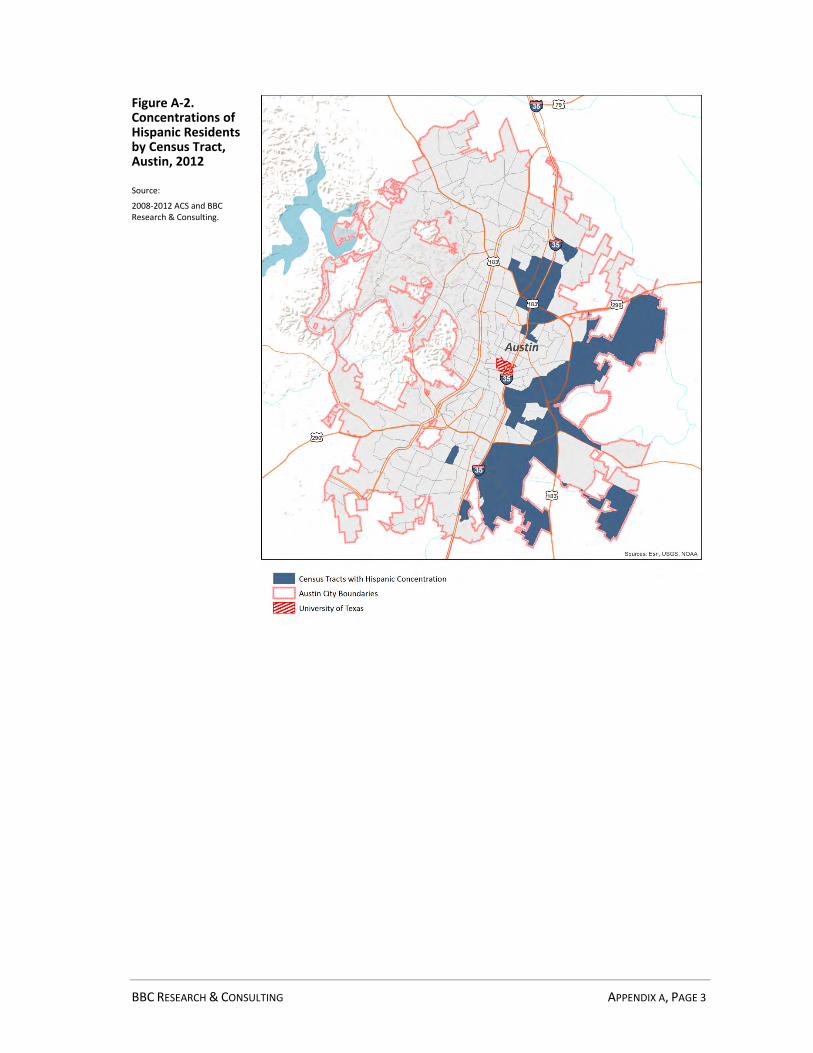
Figure A‐2. Concentrations of Hispanic Residents by Census Tract, Austin, 2012
Source:
2008‐2012 ACS and BBC Research & Consulting.

BBC RESEARCH & CONSULTING APPENDIX A, PAGE 4
Figure A‐3. Concentrations of Asian Residents by Census Tract, Austin, 2012
Source:
2008‐2012 ACS and BBC Research & Consulting.

BBC RESEARCH & CONSULTING APPENDIX A, PAGE 5
FigureA‐4showsCensustractsinAustinthatare“majorityminority”—thatis,wheremorethan50percentofresidentsarenon‐whiteand/orHispanic.Similartotheraceandethnicityspecificconcentrations(showninA‐1throughA‐3),theseCensustractsarealmostentirelyinEastAustin.
Figure A‐4. Census Tracts with Greater than 50 PercentMinority Concentration, Austin, 2012
Source:
2008‐2012 ACS and BBC Research & Consulting.

BBC RESEARCH & CONSULTING APPENDIX A, PAGE 6
FigureA‐5showsareasinAustinwheretheproportionofnon‐Hispanicwhiteresidentsexceeds90percent;theseareconsideredraciallyandethnicallyexclusiveareasforthepurposeofthisAI.Theseareashave40percentagepointsmorethanthecitywideproportionofnon‐Hispanicwhiteresidents.
Figure A‐5. Census Tracts with Greater than 90 Percent Non‐Hispanic White Concentration, Austin, 2012
Source:
2008‐2012 ACS and BBC Research & Consulting.

BBC RESEARCH & CONSULTING APPENDIX A, PAGE 7
RCAPsorECAPsareCensustractswithracialandethnicconcentrationsandhighpovertyrates.RCAPsandECAPsaredefinedbyHUDasCensustractsthathavefamilypovertyratesexceeding40percentorthreetimestheregionalpovertyrateandaremajorityminority(i.e.,minoritiesaccountfor50%ormoreofthetotalpopulation).
FigureA‐6showstheRCAPsandECAPsinAustinasof2012.FigureA‐7showstheRCAPsandECAPsin2000.
FourteenRCAPsandECAPswereidentifiedusingthedatainthe2008‐2012ACS;thesemakeup4percentofthe332CensustractsthatarewhollyorpartiallycontainedwithinAustin.
In2000,accordingtothedecennialCensus,therewereonlythreeRCAPs/ECAPS,makingup1percentofthe242Censustractsinthecityatthattime.
Figure A‐6. Racially and Ethnically Concentrated Areas of Poverty (RCAPs/ECAPs) by Census Tract Austin, 2012
Source:
2008‐2012 ACS and BBC Research & Consulting.

BBC RESEARCH & CONSULTING APPENDIX A, PAGE 8
Figure A‐7. Racially and Ethnically Concentrated Areas of Poverty (RCAPs/ECAPs) by Census Tract Austin, 2000
Source:
2000 Census and BBC Research & Consulting.
Thefollowingdotdensitymapssupplementtheconcentrationmaps.ThesemapsareconsistentwiththerequirementsofHUD’snewAssessmentofFairHousing(AFH)template.

BBC RESEARCH & CONSULTING APPENDIX A, PAGE 9
Figure A‐8. African American Residents by Dot Density, Austin, 2012
Source:
2008‐2012 ACS and BBC Research & Consulting.

BBC RESEARCH & CONSULTING APPENDIX A, PAGE 10
Figure A‐9. Hispanic Residents by Dot Density, Austin, 2012
Source:
2008‐2012 ACS and BBC Research & Consulting.

BBC RESEARCH & CONSULTING APPENDIX A, PAGE 11
Figure A‐10. All Minorities by Dot Density, Austin, 2012
Source:
2008‐2012 ACS and BBC Research & Consulting.

BBC RESEARCH & CONSULTING APPENDIX A, PAGE 12
ThefollowingfourmapsshowchangesintheresidencesofAfricanAmericanandHispanicresidentsbetween2000and2010.Asdemonstratedbythemaps,duringthepastdecade,AfricanAmericansmigratedawayfromEastAustinintothenorthernsuburbsandAfricanAmericanconcentrationsintheeasternpartofAustinbecamelesspronounced.
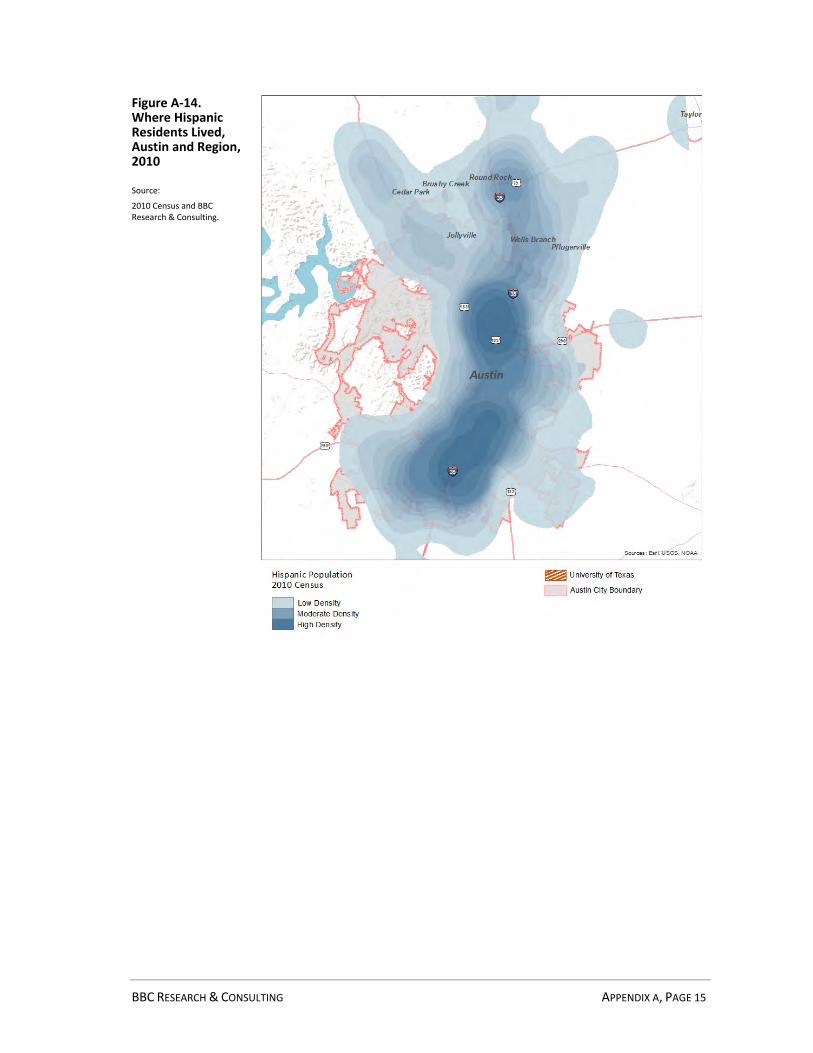
ThesuburbanareasaroundAustinalsogainedHispanicresidents—bothnorthernandsouthernareas—yetHispanicresidentconcentrationinthecentralandsoutheasternpartoftheCityofAustinremained.
Figure A‐11. Where African American Residents Lived, Austin and Region, 2000
Source:
2000 Census and BBC Research & Consulting.

BBC RESEARCH & CONSULTING APPENDIX A, PAGE 13
Figure A‐12. Where African American Residents Lived, Austin and Region, 2010
Source:
2010 Census and BBC Research & Consulting.

BBC RESEARCH & CONSULTING APPENDIX A, PAGE 14
Figure A‐13. Where Hispanic Residents Lived, Austin and Region, 2000
Source:
2000 Census and BBC Research & Consulting.
BBC RESEARCH & CONSULTING APPENDIX A, PAGE 15
Figure A‐14. Where Hispanic Residents Lived, Austin and Region, 2010
Source:
2010 Census and BBC Research & Consulting.

BBC RESEARCH & CONSULTING APPENDIX A, PAGE 16
National Origin and Limited English Proficiency
FigureA‐15showsconcentrationsofthecity’sforeignbornresidents,usingthe“foreignborn”designationfromCensussurveys.ThemajorityofCensustractswithforeignbornconcentrationsarelocatedinEastAustin.Manyofthesearealsomajorityminorityareas.
Figure A‐15. Census Tracts with Foreign Born Concentrations, Austin, 2012
Source:
2008‐2012 ACS and BBC Research & Consulting.

BBC RESEARCH & CONSULTING APPENDIX A, PAGE 17
FigureA‐16usesdotdensitiestodisplaywhereforeign‐bornresidentslive.
Figure A‐16. Foreign Born Residents by Dot Density, Austin, 2012
Source:
2008‐2012 ACS and BBC Research & Consulting.

BBC RESEARCH & CONSULTING APPENDIX A, PAGE 18
FiguresA‐17andA‐18showwhereresidentswhoarelinguisticallyisolatedareconcentrated(firstmap)andreside(secondmap).ThesearealsoareasofHispanicconcentrations.
Figure A‐17. Census Tracts with Linguistically Isolated Concentrations, Austin, 2012
Source:
2008‐2012 ACS and BBC Research & Consulting.

BBC RESEARCH & CONSULTING APPENDIX A, PAGE 19
Figure A‐18. Linguistically Isolated Residents by Dot Density, Austin, 2012
Source:
2008‐2012 ACS and BBC Research & Consulting.

BBC RESEARCH & CONSULTING APPENDIX A, PAGE 20
Persons with Disabilities
About10percentofAustinresidentsreporthavingoneormoredisabilities.Aconcentrationanalysisofpersonswithdisabilities,foundonlyoneCensustractwithaconcentration(morethan30%ofresidentswithadisability),asshownbelow.
Figure A‐19. Census Tracts with Persons with a Disability Concentrations, Austin, 2012
Source:
2008‐2012 ACS and BBC Research & Consulting.

BBC RESEARCH & CONSULTING APPENDIX A, PAGE 21
Residentsareverylikelytobecomedisabledastheyage:indeed,37percentofAustin’sseniorshaveoneormoredisability.Therearemanymoreconcentrationsofseniorswithdisabilitiesthanpersonswithdisabilitiesoverall,asshownbelow.
Figure A‐20. Census Tracts with Persons with a Disability over 65 Years Old Concentrations, Austin, 2012
Source:
2008‐2012 ACS and BBC Research & Consulting.
Acriticalcomponenttohousingchoiceforpersonswithdisabilitiesisavailabilityoftransitthatfacilitatesthroughoutacommunity.Asthefollowingparatransitmapsuggests,areaswithseniordisabilityconcentrationsareservedbyparatransit.

BBC RESEARCH & CONSULTING APPENDIX A, PAGE 22
Figure A‐21. Areas Served by Paratransit Services and Capital Metro Transit Stops, Austin, 2012
Source:
City of Austin and BBC Research & Consulting.

BBC RESEARCH & CONSULTING APPENDIX A, PAGE 23
Persons living in Poverty
Abodyofpovertyresearchhasfoundthata40percentpovertyrateisthepointatwhichaneighborhoodbecomessignificantlysociallyandeconomicallychallenged.Conversely,researchhasshownthatareaswithupto14percentofpovertyhavenonoticeableeffectoncommunityopportunity.1
FigureA‐22showsareaswithinAustinthathave1)povertyratesof15percentandless(wherepovertyisthoughttohave“nonoticeableeffect”onaneighborhood),2)povertyratesbetween15and39percent,and3)povertyratesof40percentandhigher(“sociallyandeconomicallychallenged”).Asthefiguredemonstrates,verylowpovertyareasarealmostexclusivelyonthewestsideofAustin;highpovertyareas,inEastAustin;andmoderatepovertyareasinthecentralpartsofthecity(partiallyduetothepresenceofstudents).
1TheCostsofConcentratedPoverty:NeighborhoodPropertyMarketsandtheDynamicsofDecline.”InNicolasP.RetsinasandEricS.Belsky,eds.,RevisitingRentalHousing:Policies,Programs,andPriorities.Washington,DC:BrookingsInstitution,116–9.

BBC RESEARCH & CONSULTING APPENDIX A, PAGE 24
Figure A‐22. Poverty Rates by Census Tract, Austin, 2012
Source:
2008‐2012 ACS and BBC Research & Consulting.
FigureA‐23showsthehighpovertyCensustractsonly(40%povertyandgreater).Some,butnotall,ofthehighpovertyareasarealsoareasofAfricanAmericanandHispanicconcentrations.

BBC RESEARCH & CONSULTING APPENDIX A, PAGE 25
Figure A‐23. Extremely High Poverty Census Tracts, 2012
Source:
2008‐2012 ACS and BBC Research & Consulting.

BBC RESEARCH & CONSULTING APPENDIX A, PAGE 26
Publicly Subsidized Housing
Thissectionoftheappendixcontainsmapsthatoverlayaffordablehousing—primarilypubliclyassistedhousing,consistentwiththeAFH,withconcentrationsbyraceandethnicity,disability,povertyandRCAPs/ECAPs.
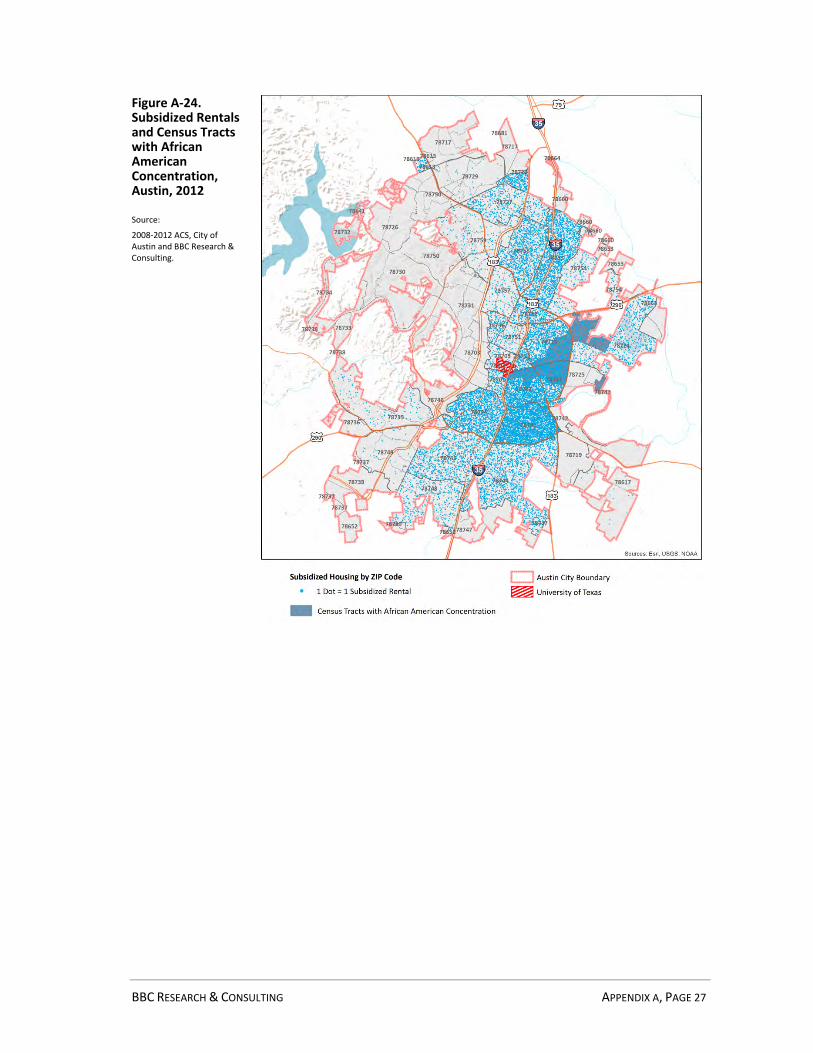
FiguresA‐24throughA‐28showthelocationofsubsidizedrentalunitsrelativetoconcentrations.Anestimated18,500affordablerentalunitsexistinAustin,accordingtotheCity’s2013affordablehousinginventorydatabase.Theseincludehousingauthorityunits,developmentsbuiltwithrentaltaxcredits,developmentsfundedbyGeneralObligation(GO)bonds,SMARTHousingdevelopmentsandothers.
MostZIPcodescontainabout3percentofthecity’ssubsidizedrentalunits.FourZIPcodeshavebetween9and10percentofthecity’ssubsidizedunitsandone—ZIPcode78741—contains18percentofthesubsidizedrentals.ZIPcode78741islocatedinSoutheastAustin,withEastRiversideAvenuecuttingthroughthemiddle.AbouthalfoftheareawithinthisZIPcodeisHispanic‐concentratedandveryhighpoverty.
BBC RESEARCH & CONSULTING APPENDIX A, PAGE 27
Figure A‐24. Subsidized Rentals and Census Tracts with African American Concentration, Austin, 2012
Source:
2008‐2012 ACS, City of Austin and BBC Research & Consulting.

BBC RESEARCH & CONSULTING APPENDIX A, PAGE 28
Figure A‐25. Subsidized Rentals and Census Tracts with Hispanic Concentration, Austin, 2012
Source:
2008‐2012 ACS, City of Austin and BBC Research & Consulting.

BBC RESEARCH & CONSULTING APPENDIX A, PAGE 29
Figure A‐26. Subsidized Rentals and Extremely High Poverty Census Tracts, Austin, 2012
Source:
2008‐2012 ACS, City of Austin and BBC Research & Consulting.

BBC RESEARCH & CONSULTING APPENDIX A, PAGE 30
Figure A‐27. Subsidized Rentals and Census Tracts with Persons with a Disability Concentration, Austin, 2012
Source:
2008‐2012 ACS, City of Austin and BBC Research & Consulting.

BBC RESEARCH & CONSULTING APPENDIX A, PAGE 31
Figure A‐28. Subsidized Rentals and Racially and Ethnically Concentrated Areas of Poverty, Austin, 2012
Source:
2008‐2012 ACS, City of Austin and BBC Research & Consulting.

BBC RESEARCH & CONSULTING APPENDIX A, PAGE 32
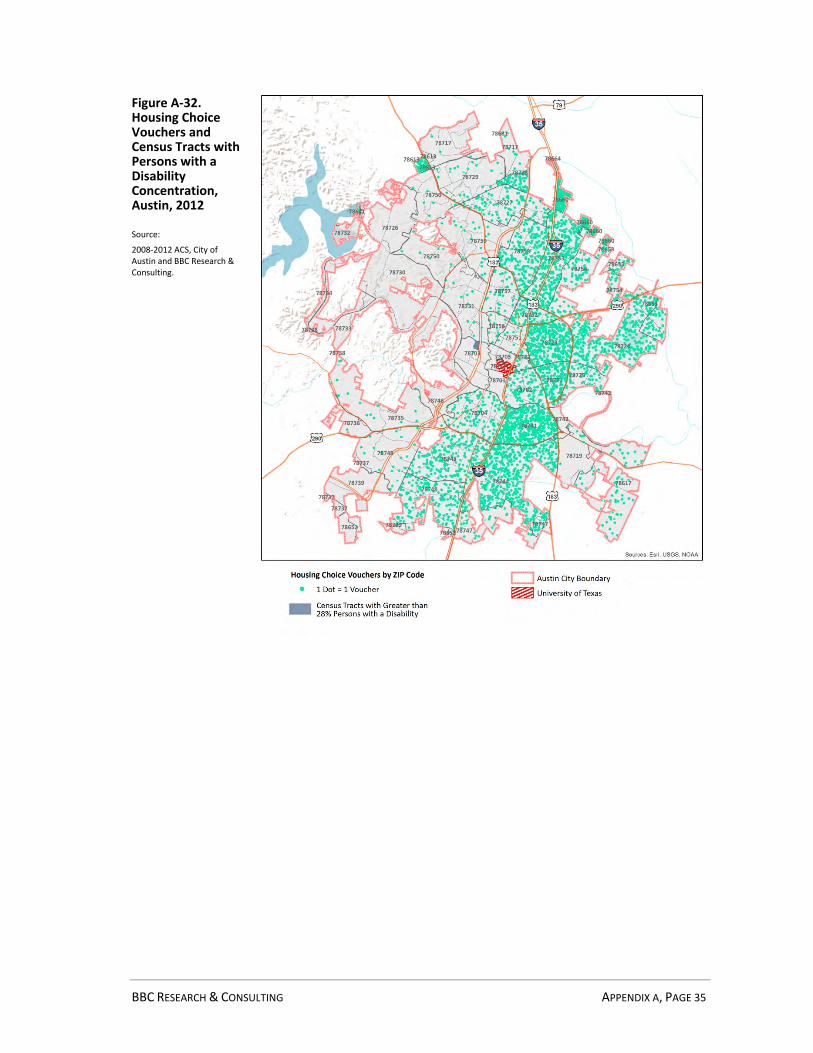
Thefollowinghousingmapsshowoverlaysofhousingchoicevoucherholdersandconcentrations.VoucherholdersareclusteredinbothAfricanAmerican‐andHispanic‐concentratedareas.Althoughvouchersclustersomewhatinareasofhighpoverty,thisislessprominentthaninminority‐concentratedareas.FewvoucherholderslivewestofI‐183.
Figure A‐29. Housing Choice Vouchers and Census Tracts with African American Concentration, Austin, 2012
Source:
2008‐2012 ACS, City of Austin and BBC Research & Consulting.

BBC RESEARCH & CONSULTING APPENDIX A, PAGE 33
Figure A‐30. Housing Choice Vouchers and Census Tracts with Hispanic Concentration, Austin, 2012
Source:
2008‐2012 ACS, City of Austin and BBC Research & Consulting.

BBC RESEARCH & CONSULTING APPENDIX A, PAGE 34
Figure A‐31. Housing Choice Vouchers and Extremely High Poverty Census Tracts, Austin, 2012
Source:
2008‐2012 ACS, City of Austin and BBC Research & Consulting.
BBC RESEARCH & CONSULTING APPENDIX A, PAGE 35
Figure A‐32. Housing Choice Vouchers and Census Tracts with Persons with a Disability Concentration, Austin, 2012
Source:
2008‐2012 ACS, City of Austin and BBC Research & Consulting.

BBC RESEARCH & CONSULTING APPENDIX A, PAGE 36
Figure A‐33. Housing Choice Vouchers and Racially and Ethnically Concentrated Areas of Poverty, Austin, 2012
Source:
2008‐2012 ACS, City of Austin and BBC Research & Consulting.

BBC RESEARCH & CONSULTING APPENDIX A, PAGE 37
ThefinalsetofhousingmapsshowthelocationofLowIncomeHousingTaxCredit(LIHTC)propertiesinrelationtoareasofconcentration.ThemapsshowclustersofLIHTCpropertiesinAfricanAmerican,Hispanicandpovertyconcentratedareas.
Figure A‐34. Low Income Housing Tax Credit (LIHTC) Locations and Census Tracts with African American Concentration, Austin, 2012
Source:
2008‐2012 ACS, City of Austin and BBC Research & Consulting.

BBC RESEARCH & CONSULTING APPENDIX A, PAGE 38
Figure A‐35. Low Income Housing Tax Credit (LIHTC) Locations and Census Tracts with Hispanic Concentration, Austin, 2012
Source:
2008‐2012 ACS, City of Austin and BBC Research & Consulting.

BBC RESEARCH & CONSULTING APPENDIX A, PAGE 39
Figure A‐36. Low Income Housing Tax Credit (LIHTC) Locations and Extremely High Poverty Census Tracts, Austin, 2012
Source:
2008‐2012 ACS, City of Austin and BBC Research & Consulting.
Access to Opportunity
ThissectionsupplementstheAccesstoOpportunityworkcompletedaspartofthe2013regionalstudy“TheGeographyofOpportunityinAustinandHowitisChanging.”ThemapsinthissectionexaminetherelationshipofprotectedclassandRCAP/ECAPconcentrationsusingvariablesthatwerenotincludedintheregionalstudy.Theseinclude:
Housingconditionandquality,asmeasuredbycodecompliancedata;
Incidenceofcrime(asanindependentvariable;theregionalstudyincorporatescrimeintoitsoverallopportunityindex);
Residentialforeclosures;and
Capitaldisinvestment(asmeasuredthroughhomemortgagedataanalysis).
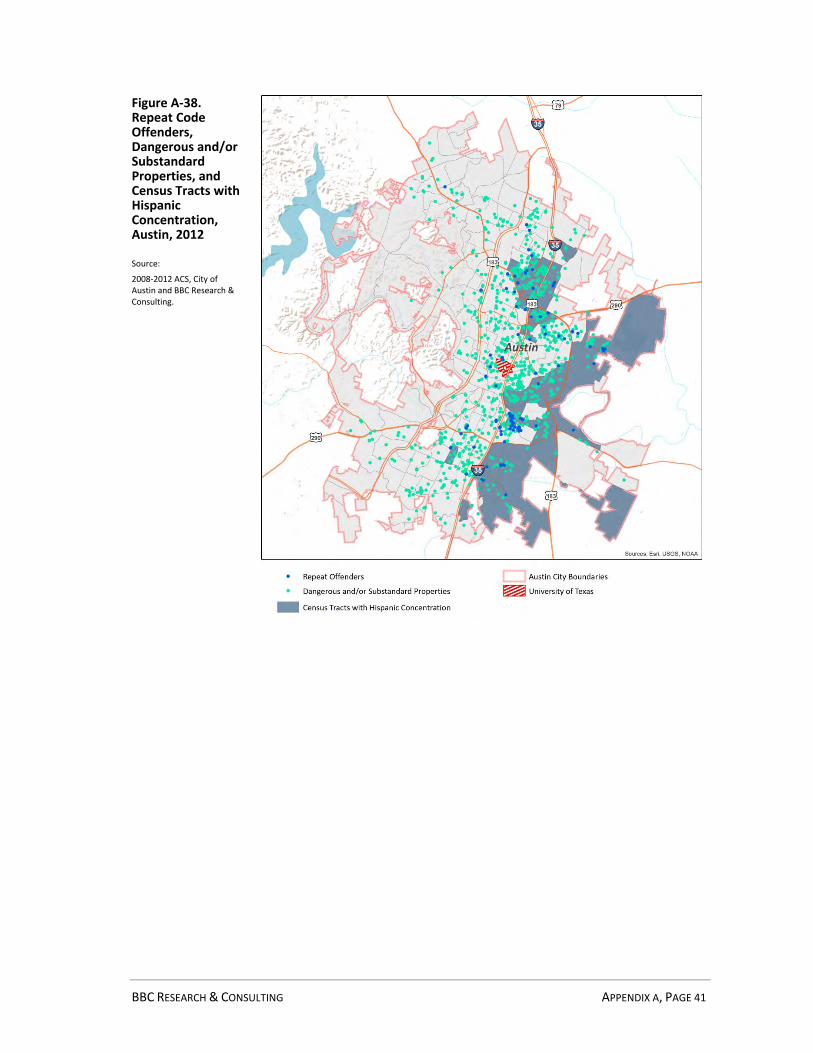
ThefirstfourmapsoverlayareaswithrepeatcodeoffendersanddangerouslysubstandardpropertieswithareasofAfricanAmericanandHispanicconcentrations,areasofhighpoverty

BBC RESEARCH & CONSULTING APPENDIX A, PAGE 40
andRCAPs/ECAPs.Asthemapsshows,mostoftheunitsinsubstandardcondition(asmeasuredbycodecompliancedata)arelocatedinthecentralportionsofAustin,andnotnecessarilyinconcentratedareas.
Figure A‐37. Repeat Code Offenders, Dangerous and/or Substandard Properties, and Census Tracts with African American Concentration, Austin, 2012
Source:
2008‐2012 ACS, City of Austin and BBC Research & Consulting.
BBC RESEARCH & CONSULTING APPENDIX A, PAGE 41
Figure A‐38. Repeat Code Offenders, Dangerous and/or Substandard Properties, and Census Tracts with Hispanic Concentration, Austin, 2012
Source:
2008‐2012 ACS, City of Austin and BBC Research & Consulting.

BBC RESEARCH & CONSULTING APPENDIX A, PAGE 42
Figure A‐39. Repeat Code Offenders, Dangerous and/or Substandard Properties, and Extremely High Poverty Census Tracts, Austin, 2012
Source:
2008‐2012 ACS, City of Austin and BBC Research & Consulting.

BBC RESEARCH & CONSULTING APPENDIX A, PAGE 43
Figure A‐40. Repeat Code Offenders, Dangerous and/or Substandard Properties, and Racially and Ethnically Concentrated Areas of Poverty, Austin, 2012
Source:
2008‐2012 ACS, City of Austin and BBC Research & Consulting.
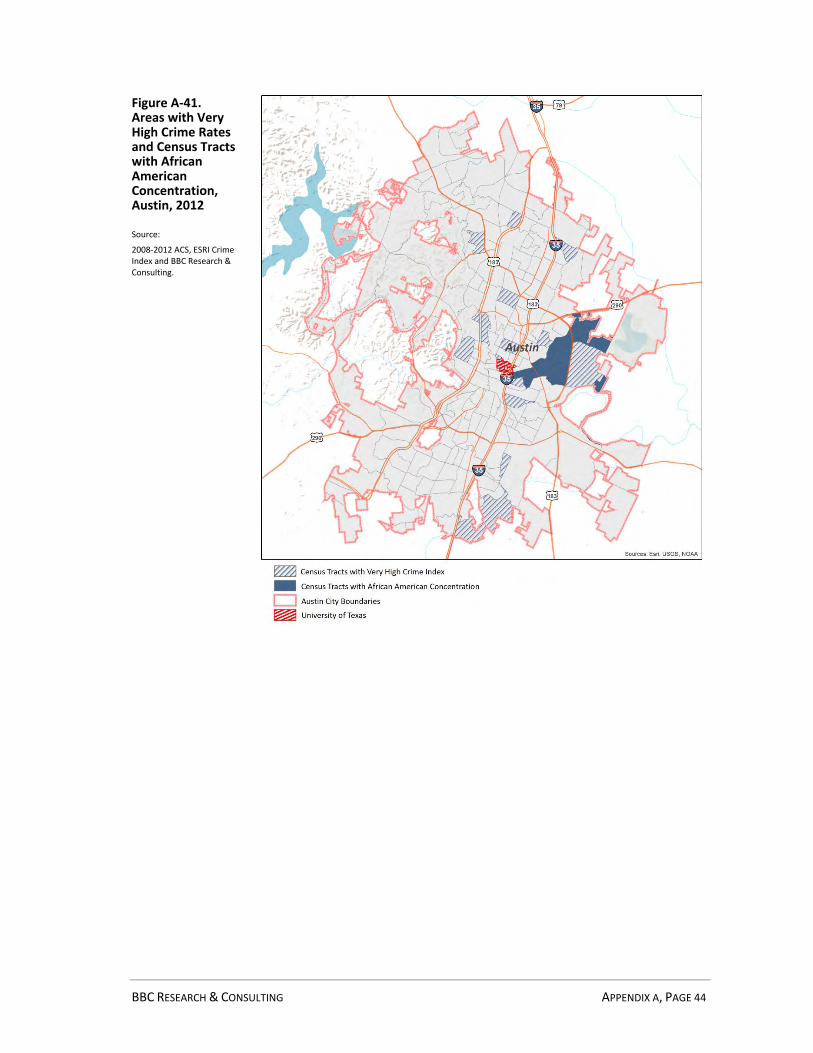
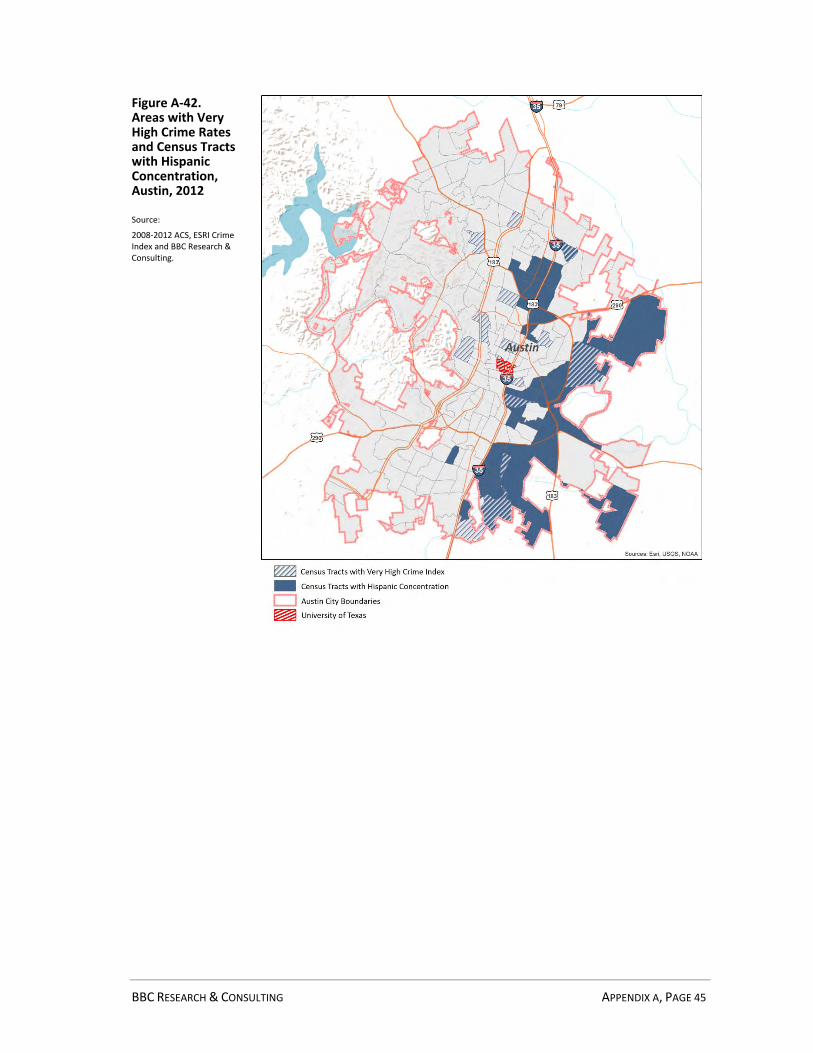
Thesecondsetofmapsshowtherelationshipbetweenareaswithveryhighcrimeandconcentrations.2Theoverlaysshowalimitednumberofareasthatareminorityorpovertyconcentratedandhaveveryhighcrimerates.
2ThecrimeindexisfromcommercialdataproviderESRIandincludesinformationaboutmurder,rape,robbery,assault,burglaryandmotorvehicletheft.
BBC RESEARCH & CONSULTING APPENDIX A, PAGE 44
Figure A‐41. Areas with Very High Crime Rates and Census Tracts with African American Concentration, Austin, 2012
Source:
2008‐2012 ACS, ESRI Crime Index and BBC Research & Consulting.
BBC RESEARCH & CONSULTING APPENDIX A, PAGE 45
Figure A‐42. Areas with Very High Crime Rates and Census Tracts with Hispanic Concentration, Austin, 2012
Source:
2008‐2012 ACS, ESRI Crime Index and BBC Research & Consulting.

BBC RESEARCH & CONSULTING APPENDIX A, PAGE 46
Figure A‐43. Areas with Very High Crime Rates and Extremely High Poverty Census Tracts, Austin, 2012
Source:
2008‐2012 ACS, ESRI Crime Index and BBC Research & Consulting.

BBC RESEARCH & CONSULTING APPENDIX A, PAGE 47
Figure A‐44. Areas with Very High Crime Rates and Racially and Ethnically Concentrated Areas of Poverty, Austin, 2012
Source:
2008‐2012 ACS, ESRI Crime Index and BBC Research & Consulting.
TheLocalInitiativeSupportCorporation(LISC)’sForeclosureResponseprojectprovidesdataonforeclosurerisktohelpcommunitiesbettertargetresourcesforforeclosureresolutionandprevention.TheLISCforeclosureindexincorporatesmeasuresofsubprimelending,foreclosures,delinquencyandvacancies.
ThefollowingmapsshowZIPcodeswithhighforeclosurerisk,accordingtotheLISCindex,andconcentrationsbyCensustract.TheseZIPcodeshavemorethanthreetimestheaverageriskintheregion,asofSeptember2013.
ManyoftheforeclosureriskareasalsoincludeCensustractswithHispanicconcentrations—butnotareasofhighpoverty.Someofthesearealsoareaswhereloanapplicationdenialswerehigh,asdiscussedinthefollowingsection.

BBC RESEARCH & CONSULTING APPENDIX A, PAGE 48
Figure A‐45. Areas with High Foreclosure Risk and Census Tracts with African American Concentration, Austin, 2012
Source:
2008‐2012 ACS, Local Initiative Support Corporation and BBC Research & Consulting.

BBC RESEARCH & CONSULTING APPENDIX A, PAGE 49
Figure A‐46. Areas with High Foreclosure Risk and Census Tracts with Hispanic Concentration, Austin, 2012
Source:
2008‐2012 ACS, Local Initiative Support Corporation and BBC Research & Consulting.

BBC RESEARCH & CONSULTING APPENDIX A, PAGE 50
Figure A‐47. Areas with High Foreclosure Risk and Extremely High Poverty Census Tracts, Austin, 2012
Source:
2008‐2012 ACS, Local Initiative Support Corporation and BBC Research & Consulting.

BBC RESEARCH & CONSULTING APPENDIX A, PAGE 51
Figure A‐48. Areas with High Foreclosure Risk and Racially and Ethnically Concentrated Areas of Poverty, Austin, 2012
Source:
2008‐2012 ACS, Local Initiative Support Corporation and BBC Research & Consulting.
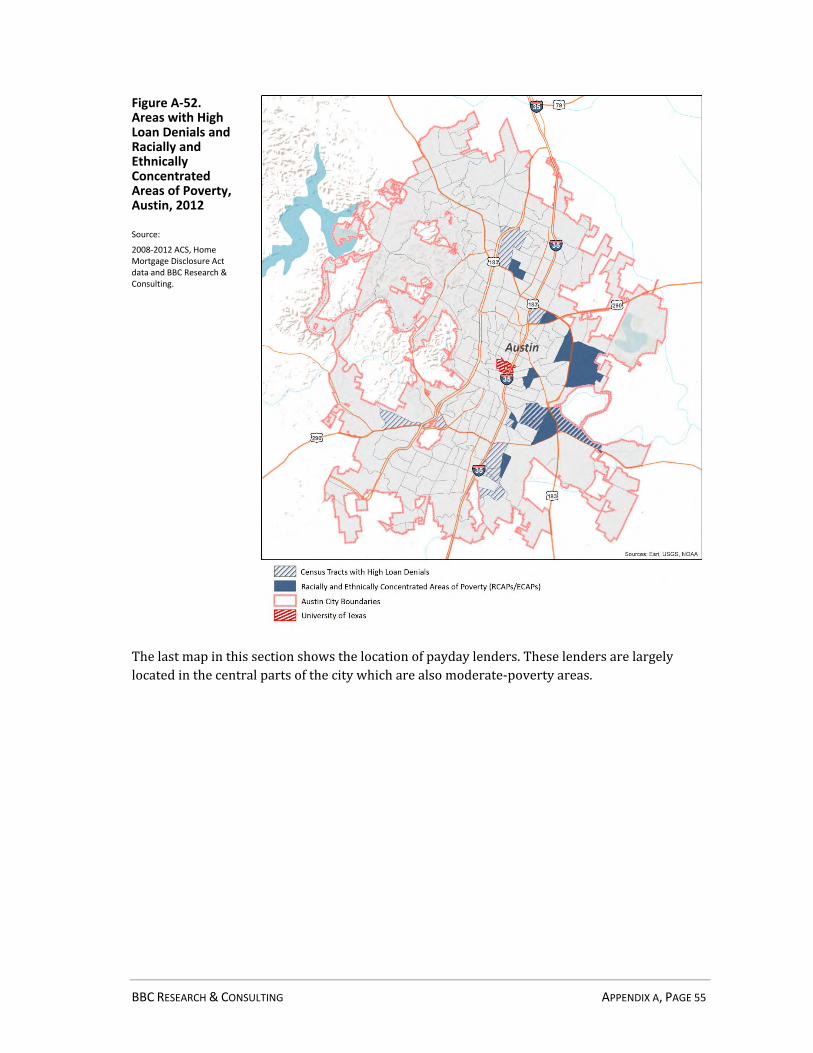
ThefinalsetofsupplementalmapsoverlayhighloandenialCensustractswithconcentrations.Neighborhoodswithhighratesofresidentialloansdenialscanbeatriskofdisinvestmentandpropertydecline,relatedtoalackofprivatecapitalforhomepurchasesandimprovements.
Thehighdenialareasshowninthemapbelowhavetwicethedenialrate(32%)ofthecityoverall(16%).Ofthese17areas,allbutfouralsohaveHispanicconcentrations.

BBC RESEARCH & CONSULTING APPENDIX A, PAGE 52
Figure A‐49. Areas with High Loan Denials and Census Tracts with African American Concentration, Austin, 2012
Source:
2008‐2012 ACS, Home Mortgage Disclosure Act data and BBC Research & Consulting.

BBC RESEARCH & CONSULTING APPENDIX A, PAGE 53
Figure A‐50. Areas with High Loan Denials and Census Tracts with Hispanic Concentration, Austin, 2012
Source:
2008‐2012 ACS, Home Mortgage Disclosure Act data and BBC Research & Consulting.

BBC RESEARCH & CONSULTING APPENDIX A, PAGE 54
Figure A‐51. Areas with High Loan Denials and Extremely High Poverty Census Tracts, Austin, 2012
Source:
2008‐2012 ACS, Home Mortgage Disclosure Act data and BBC Research & Consulting.
BBC RESEARCH & CONSULTING APPENDIX A, PAGE 55
Figure A‐52. Areas with High Loan Denials and Racially and Ethnically Concentrated Areas of Poverty, Austin, 2012
Source:
2008‐2012 ACS, Home Mortgage Disclosure Act data and BBC Research & Consulting.
Thelastmapinthissectionshowsthelocationofpaydaylenders.Theselendersarelargelylocatedinthecentralpartsofthecitywhicharealsomoderate‐povertyareas.

BBC RESEARCH & CONSULTING APPENDIX A, PAGE 56
Figure A‐53. Payday Lenders and Racially and Ethnically Concentrated Areas of Poverty, Austin, 2012
Source:
2008‐2012 ACS, Yelp.com and BBC Research & Consulting.