Embed Size (px)
Citation preview

Institute for Futures Research
Business Futures 2013
Contents and Executive Summary


© IFR
Business Futures 2013
Business Futures 2013
Contents and Executive Summary
Contents of Business Futures 2013 ......................................................................................... i
List of figures of Business Futures 2013 ................................................................................ vi
List of tables of Business Futures 2013 ................................................................................ xii
List of exhibits of Business Futures 2013 ............................................................................ xvii
Chapter 1: Strategic thinking and the future .................................................................. 1
Chapter 2: The social environment ............................................................................... 3
Chapter 3: The political environment ............................................................................ 6
Chapter 4: The technological environment ................................................................. 10
Chapter 5: The natural environment ........................................................................... 14
Chapter 6: The political environment .......................................................................... 18
Chapter 7: Sustainable development .......................................................................... 21


Contents
i © IFR
Business Futures 2013
Contents
List of Figures ...................................................................................................................................................... vi List of Tables ..................................................................................................................................................... xii List of Exhibits ..................................................................................................................................................... xvii List of Abbreviations ............................................................................................................................................. xix Acknowledgements .............................................................................................................................................. xxv Institute for Futures Research Associates ............................................................................................................xxvi Institute for Futures Research Personnel ............................................................................................................ xxvii
Chapter 1: Strategic Thinking and the Future
Introduction ............................................................................................................................................................1-3 Business foresight .................................................................................................................................................1-4
Introduction: Strategy and futures thinking ...................................................................................................1-4 Barriers to a futures thinking mode ...............................................................................................................1-5 Forecasting, planning and strategy ...............................................................................................................1-8 The need for sound judgement and purposefulness.....................................................................................1-8 Knowledge and foresight ..............................................................................................................................1-9 Measuring and making the future ...............................................................................................................1-10 Conceptual frameworks for foresight .........................................................................................................1-11
Long-range forecasting: Methods and techniques ...............................................................................................1-17 Statistical forecasting/extrapolation ............................................................................................................1-18 Environmental scanning .............................................................................................................................1-19 Delphi studies .............................................................................................................................................1-23 Scenarios ...................................................................................................................................................1-23
Using the systems approach in thinking about the future ...................................................................................1-27 Systems and systems thinking ...................................................................................................................1-27
Idealised redesign ...............................................................................................................................................1-30 The process of idealised redesign defined .................................................................................................1-30 The process of idealised redesign .............................................................................................................1-30 The contributions of idealised redesign to organisational transformation ...................................................1-31
Forces shaping the future - global certainties and uncertainties ..........................................................................1-32 Introduction ................................................................................................................................................1-32
References ..........................................................................................................................................................1-38
Chapter 2: The Social Environment
Executive summary ...............................................................................................................................................2-3 Introduction ............................................................................................................................................................2-5 Socio-political challenges: Development, democracy and diversity .......................................................................2-8
Introduction ...................................................................................................................................................2-8 The global context ......................................................................................................................................2-10 Social capital ..............................................................................................................................................2-14 Social identities, political maturity, equality and diversity ............................................................................2-17 Identities constructed; identities reconstructed; identities in flux.................................................................2-17 Race and issues of resource distribution ...................................................................................................2-24 Identity, nation-building and democracy .....................................................................................................2-34 Language ...................................................................................................................................................2-35 Movements of faith and religion ..................................................................................................................2-40 Families and society ...................................................................................................................................2-54 Conclusion ..................................................................................................................................................2-64 References .................................................................................................................................................2-66
Human development: People are the real wealth of a nation ..............................................................................2-71 Understanding human development ...........................................................................................................2-71 The Human Development Reports and measuring human development ...................................................2-72 Human development in South Africa ..........................................................................................................2-79 Social Progress Index .................................................................................................................................2-82 Millennium Development Goals ..................................................................................................................2-84 The post-2015 development agenda ..........................................................................................................2-88 Happiness, well-being and human development ........................................................................................2-92

Contents
ii © IFR
Business Futures 2013
References .................................................................................................................................................2-93 Demography ........................................................................................................................................................2-95
Introduction .................................................................................................................................................2-95 Global population trends .............................................................................................................................2-95 Sub-Saharan Africa and SADC population trends ....................................................................................2-105 South African population trends................................................................................................................2-109 Implications of longer term demographic trends .......................................................................................2-120 Population policies ....................................................................................................................................2-122 References ...............................................................................................................................................2-124
Urbanisation ......................................................................................................................................................2-126 Introduction ...............................................................................................................................................2-126 Global urbanisation trends ........................................................................................................................2-126 African urbanisation trends .......................................................................................................................2-132 South African urbanisation trends .............................................................................................................2-137 Positive implications (benefits) of urbanisation .........................................................................................2-141 Negative implications of urbanisation (urban problems) ...........................................................................2-142 Urban policy, management and governance ............................................................................................2-149 References ...............................................................................................................................................2-151
Health and health care ......................................................................................................................................2-153 Introduction ...............................................................................................................................................2-153 Health indicators .......................................................................................................................................2-153 Infectious disease patterns .......................................................................................................................2-163 Health care resources and financing ........................................................................................................2-175 Implications of health trends .....................................................................................................................2-181 Health care policy and reform ...................................................................................................................2-182 References ...............................................................................................................................................2-184
Crime and violence ............................................................................................................................................2-188 Global crime trends ..................................................................................................................................2-188 Crime trends in Africa ...............................................................................................................................2-195 Crime trends in South Africa .....................................................................................................................2-199 The South African criminal justice system ................................................................................................2-209 The South African correctional services ...................................................................................................2-210 Initiatives to prevent and combat crime and violence in South Africa .......................................................2-211 References ...............................................................................................................................................2-214
Education and training .......................................................................................................................................2-217 Introduction: Why is education and training important? ............................................................................2-217 Global and regional education trends .......................................................................................................2-218 South African education and training trends .............................................................................................2-228 Socio-economic implications ....................................................................................................................2-248 Education policy developments ................................................................................................................2-253 References ...............................................................................................................................................2-256
Chapter 3: The Political Environment
Executive summary ...............................................................................................................................................3-3 A globalising, world: Opportunities, security threats and South Africa ...................................................................3-6
Introduction: Globalisation and globalism .....................................................................................................3-6 Trends ........................................................................................................................................................3-11 Issues .........................................................................................................................................................3-15 Inequality and the marginalisation of the majority world .............................................................................3-22 Democracy .................................................................................................................................................3-25 (In)Stability and social cohesion .................................................................................................................3-27 Policy choices .............................................................................................................................................3-28 Key countries and global re-polarisation? ...................................................................................................3-29
South Africa’s external relations ..........................................................................................................................3-39 Introduction .................................................................................................................................................3-39 South Africa’s foreign policy: Issues and uncertainties ...............................................................................3-40 Relations in Southern Africa .......................................................................................................................3-57 SADC as a regional integrative initiative .....................................................................................................3-58
Africa and the future ............................................................................................................................................3-61 Introduction .................................................................................................................................................3-61 Historical considerations .............................................................................................................................3-62 African initiatives .........................................................................................................................................3-63 Democratisation and human rights in Africa ...............................................................................................3-71
South Africa and the developmental state ...........................................................................................................3-78 The South African transition .......................................................................................................................3-78

Contents
iii © IFR
Business Futures 2013
A South African developmental state ..........................................................................................................3-80 South Africa and democratic consolidation .................................................................................................3-84 The provincial political environment in South Africa ...................................................................................3-94 Local government transformation ...............................................................................................................3-97 Crucial issues over the next five years .....................................................................................................3-103 Black economic empowerment .................................................................................................................3-104 Land reform ..............................................................................................................................................3-106
References ........................................................................................................................................................3-117
Chapter 4: The Technological Environment
Executive summary ...............................................................................................................................................4-3 The nature and importance of technology .............................................................................................................4-5
Introduction ...................................................................................................................................................4-5 Technological change and forecasting: The technology ‘S’-curve and curves of growth .............................4-7 Technological innovation and the competitive advantage of nations ............................................................4-8 Does a better technological situation lead to increased wealth and a better standard of living? ................................................................................................................................................4-10 Infrastructural indicators .............................................................................................................................4-11
The strategic management of technology ............................................................................................................4-14 Why manage technology? ..........................................................................................................................4-14 The management of technology .................................................................................................................4-15 Responsibility for technology management ................................................................................................4-16
The enabling and new technologies: Developments and trends ............................................................................4-18 Technological progress and technological transformations ........................................................................4-18 The enabling and new technologies ...........................................................................................................4-20
Information and communication technologies ......................................................................................................4-23 Biotechnology, genetic engineering and proteomics ............................................................................................4-35 Materials technology ............................................................................................................................................4-43 Emerging energy technologies ............................................................................................................................4-49 Transport technologies ........................................................................................................................................4-54 Environmentalism ................................................................................................................................................4-57 Africa’s and South Africa’s position in R&D: Expenditure and manpower ...........................................................4-59
Expenditure on R&D ...................................................................................................................................4-60 S&T in Africa – indicators and observations ...............................................................................................4-61 Science and technology research excellence at South African institutions ................................................4-64 Centres of excellence .................................................................................................................................4-66 Skilled manpower .......................................................................................................................................4-67
Science and technology policy ............................................................................................................................4-69 Technology policy: Purpose and definition .................................................................................................4-69 Key points regarding national science and technology policies ..................................................................4-69 Science and technology policy in South Africa ...........................................................................................4-70 South Africa is implementing a national technology strategy, but challenges remain .................................4-79
References ..........................................................................................................................................................4-80
Chapter 5: Natural Environment
Executive summary ...............................................................................................................................................5-3 Land resources ......................................................................................................................................................5-5
Introduction ...................................................................................................................................................5-5 Land-use systems ........................................................................................................................................5-6 Agricultural land use ...................................................................................................................................5-10 Impact of climate change on African agricultural production ......................................................................5-17 Agricultural food production trends in South Africa .....................................................................................5-19 Food security trends ...................................................................................................................................5-21 Policy actions to achieve food security for all .............................................................................................5-27 Grasslands and forest resources ................................................................................................................5-30 References .................................................................................................................................................5-36
Water resources ..................................................................................................................................................5-40 Introduction .................................................................................................................................................5-40 Global water resources ...............................................................................................................................5-40 South Africa’s water resources ...................................................................................................................5-47 Water resource management and policy ....................................................................................................5-57 Implications and conclusion ........................................................................................................................5-61

Contents
iv © IFR
Business Futures 2013
References .................................................................................................................................................5-62 Ocean and fish resources ....................................................................................................................................5-66
Introduction .................................................................................................................................................5-66 Global fish resources ..................................................................................................................................5-67 South Africa’s fish resources ......................................................................................................................5-74 South Africa’s estuaries ..............................................................................................................................5-79 References .................................................................................................................................................5-80
Mineral resources ................................................................................................................................................5-83 Background ................................................................................................................................................5-83 The global picture .......................................................................................................................................5-83 The Mining Industry Growth, Development and Employment Task Team ..................................................5-84 South Africa’s mining sector has significant economic potential .................................................................5-85 MIGDETT: Investigating the constraints facing the South African mining sector ........................................5-86 Contribution of mining to the economy of South Africa ...............................................................................5-87 The benefits of mining are captured locally ................................................................................................5-88 Legislative issues affecting the South African mining industry....................................................................5-88 References .................................................................................................................................................5-88
Energy resources ................................................................................................................................................5-89 Introduction .................................................................................................................................................5-89 Total energy................................................................................................................................................5-89 Oil ...............................................................................................................................................................5-93 Coal ............................................................................................................................................................5-95 Natural gas .................................................................................................................................................5-97 Uranium and nuclear energy ......................................................................................................................5-98 Renewable energy ......................................................................................................................................5-99 Electricity ..................................................................................................................................................5-103 Global climate change and energy use ....................................................................................................5-104 References ...............................................................................................................................................5-107
Biodiversity and ecosystems .............................................................................................................................5-109 Introduction ...............................................................................................................................................5-109 Global biodiversity loss .............................................................................................................................5-110 Biodiversity in Africa .................................................................................................................................5-117 Biodiversity in South Africa .......................................................................................................................5-118 The business sector and biodiversity ........................................................................................................5-120 Biodiversity futures for the 21
st century .....................................................................................................5-121
Biodiversity conservation and ecosystem restoration ...............................................................................5-122 Ecotourism................................................................................................................................................5-124 References ...............................................................................................................................................5-126
Waste and pollution ...........................................................................................................................................5-128 The world’s worst pollution problems ........................................................................................................5-128 Solid waste ...............................................................................................................................................5-131 Water pollution ..........................................................................................................................................5-139 Atmospheric (air) pollution ........................................................................................................................5-147 Waste and climate change .......................................................................................................................5-153 Noise pollution ..........................................................................................................................................5-153 Space pollution .........................................................................................................................................5-155 Light pollution ...........................................................................................................................................5-156 Legislation for the management of waste .................................................................................................5-156 The value of healthy ecosystem services for business .............................................................................5-157 Commercial opportunities in the management of waste and pollution ......................................................5-157 References ...............................................................................................................................................5-157
Global climate change .......................................................................................................................................5-163 Introduction ...............................................................................................................................................5-163 Background ..............................................................................................................................................5-163 Driving forces: Anthropogenic greenhouse gas emissions .......................................................................5-164 Radiative forcing .......................................................................................................................................5-165 Observable changes in the environment ..................................................................................................5-166 Climate change trends ..............................................................................................................................5-167 Impacts of climate change ........................................................................................................................5-169 Climate change and risk ...........................................................................................................................5-172 Business exposure to climate change and associated risks .....................................................................5-173 Dangers of abrupt climate change ............................................................................................................5-177 Possible impacts of extreme or abrupt climate changes ...........................................................................5-178 The current state of the carbon market .....................................................................................................5-178 Mitigation: Biofuels, renewables and REDD .............................................................................................5-179 The governance of climate change ...........................................................................................................5-180

Contents
v © IFR
Business Futures 2013
South Africa’s national strategy on climate change ..................................................................................5-186 Long-term adaptation and mitigation scenarios: Strategic options for South Africa ..................................5-187 Climate change politics .............................................................................................................................5-187 Concluding remarks ..................................................................................................................................5-187 References ...............................................................................................................................................5-188
Environmental scenarios ...................................................................................................................................5-193 Global environmental scenarios ...............................................................................................................5-193 Environmental scenarios for Africa ...........................................................................................................5-197 Environmental scenarios for South Africa .................................................................................................5-200 References ...............................................................................................................................................5-203
Chapter 6: The Economic Environment
Executive summary ...............................................................................................................................................6-3 Introduction ............................................................................................................................................................6-4 The global context .................................................................................................................................................6-5
The global economic architecture .................................................................................................................6-5 The great recession ......................................................................................................................................6-9 Future trends, imperatives and challenges .................................................................................................6-12
Africa: The new frontier .......................................................................................................................................6-16 Introduction .................................................................................................................................................6-16 Selected basic indicators ............................................................................................................................6-16 Economic structure .....................................................................................................................................6-18 The structure of demand in Africa ...............................................................................................................6-19 Resource dependence ...............................................................................................................................6-19 Is a higher growth trajectory sustainable? ..................................................................................................6-20 Messages for Africa ....................................................................................................................................6-23
The South African context ................................................................................................................................... 6.24 Introduction ................................................................................................................................................. 6.24 The structure of the South African economy ..............................................................................................6-25 South Africa is stuck in a middle income trap .............................................................................................6-26 Deficit 1: Domestic expenditure exceeds domestic production ...................................................................6-32 Deficit 2: government spending exceeds government revenue ..................................................................6-37 Deficit 3: Exports exceed imports ...............................................................................................................6-40 Deficit 4: Investment demand exceeds savings supply ..............................................................................6-42 The implications of being a deficit country ..................................................................................................6-45 Inflationary pressures .................................................................................................................................6-50 Unemployment ...........................................................................................................................................6-51 Poverty and inequality ................................................................................................................................6-63 Interest rates...............................................................................................................................................6-66 Provincial overview .....................................................................................................................................6-67 The competitiveness imperative .................................................................................................................6-68 The medium and longer term outlook .........................................................................................................6-70
References ..........................................................................................................................................................6-78
Chapter 7: Sustainable Development
Executive summary ...............................................................................................................................................7-3 Sustainable development ......................................................................................................................................7-5
The concept of sustainable development .....................................................................................................7-5 Related concepts of resilience, adaptability and transformability in social-ecological systems ..................7-11 Systemic unsustainability ...........................................................................................................................7-12 Unsustainable trends: Patterns identified by the IFR ..................................................................................7-13 Nine planetary boundaries ..........................................................................................................................7-17 Green economy initiatives ..........................................................................................................................7-20 High-level panel on global sustainability .....................................................................................................7-21 National strategies for sustainable development ........................................................................................7-22 Business and sustainable development .....................................................................................................7-24 The evolution of sustainability reporting .....................................................................................................7-29 Sustainability, strategy and innovation .......................................................................................................7-32 Towards a more sustainable future: Transition to a new sustainability paradigm .......................................7-35
Conclusion: Managing complexity through corporate governance ......................................................................7-38 References ..........................................................................................................................................................7-40

List of Figures
vi © IFR
Business Futures 2013
List of Figures
Chapter 1: Strategic Thinking and the Future
Figure 1.1: Images of the future ................................................................................................................... 1-8 1.2: A classification of knowledge about the future ........................................................................... 1-9 1.3: Different kinds of futures .......................................................................................................... 1-11 1.4: Long-term cycles as a basis for business foresight .................................................................. 1-13 1.5: The life cycle of evolution ......................................................................................................... 1-14 1.6: What the organisation can and cannot control ......................................................................... 1-19 1.7: Multiple perspectives in environmental scanning ..................................................................... 1-20 1.8: Assumption plotting graph: Importance and certainty .............................................................. 1-22
Chapter 2: The Social Environment
Figure 2.1: The five interdependent dimensions of redesigning social systems and defining the state of social systems (SSS) .......................................................................................... 2-5 2.2: Integration (homogenisation) and differentiation as necessary qualities of societal
development ................................................................................................................................................... 2-7 2.3: The peace-process-pyramid ..................................................................................................... 2-13 2.4: Schematic of social capital theory ............................................................................................ 2-16 2.5: Representation of employees at senior management level by race and sex, 2000-2012 ........ 2-26 2.6: Religious affiliation of South Africans, 2001 and 2010 ............................................................. 2-51 2.7: Human Development Index values of African countries, 2012 ................................................. 2-73 2.8: Human Development Index values for South Africa, 1980-2012 .............................................. 2-74 2.9: Multidimensional Poverty Index values of African countries ..................................................... 2-75 2.10: Difference between HDI values and IHDI values of African countries, 2012 ............................ 2-77 2.11: Gender Inequality Index values of African countries, 2012 ...................................................... 2-78 2.12: An integrated framework for realising the ‘future we want for all’ in the post-2015
UN development agenda .......................................................................................................... 2-89 2.13: Size and annual population growth rates of the world population, 1950-2050 ......................... 2-96 2.14: Population size and annual population growth rates of more and less developed regions, 1950-2050 ............................................................................................................................. 2-96 2.15: Major refugee hosting countries, end 2012 ............................................................................ 2-101 2.16: Proportion of children and older people in the world, 1950-2050 ........................................... 2-102 2.17: World population age pyramids, 1950, 2010 and 2050 .......................................................... 2-102 2.18: The population of Europe and Africa by broad age groups, 1950-2050 ................................. 2-103 2.19: Annual population growth rates in sub-Saharan Africa, 2010-2015 ....................................... 2-108 2.20: Sex composition in South Africa during census years 1904-2011, with projections to 2040 .............................................................................................................................. 2-111 2.21: Projected population growth rates of the South African population by race, 1985-2040 ........ 2-114 2.22: Ranking of provinces by actual (2001-2011) and projected (2020-2025) population
…..growth rates ...................................................................................................................... 2-114 2.23: Population pyramids of the total South African population, 1985, 2011 and 2040 ................. 2-115 2.24: Projected number of people aged <15, 15-64 and 65+ in the total South African
population, 1985-2040 ....................................................................................................... 2-116 2.25: Ranking of provinces by percentage children, adults aged 15-64 and older persons,
2011 (census data) and 2025 (ASSA2008 projections)..................................................... 2-117 2.26: South Africa: Net migration gains and losses, 1940-2003 ...................................................... 2-118 2.27: Brain drain and gain in South Africa, 1945-2003 .................................................................... 2-118 2.28: Estimated internal migration in South Africa, 2001-2011........................................................ 2-119 2.29: Official deportation of undocumented immigrants by South Africa, 1994-2011 ...................... 2-120 2.30: Urban and rural populations of the world, 1950-2050 ............................................................ 2-126 2.31: Urban populations of more and less developed regions, 1950-2050 ..................................... 2-127 2.32: Rural populations of more and less developed regions, 1950-2050....................................... 2-128 2.33: Urbanisation levels of major regions, 1970, 2011 and 2050 .................................................. 2-128 2.34: The world’s 10 largest urban agglomerations, 1970, 1990, 2011 and 2025 ........................... 2-130 2.35: Urban population distribution of the world and more and less developed regions by urban
settlement size, 1970, 2011 and 2025............................................................................... 2-131

List of Figures
vii © IFR
Business Futures 2013
2.36: Urban and rural populations of Africa, 1950-2050 .................................................................. 2-133 2.37: Urban and rural populations of South Africa, 1950-2050........................................................ 2-137 2.38: Urbanisation levels and urban and rural growth rates in South Africa, 1950-2050 ................. 2-137 2.39: Urbanisation levels in South Africa by population group, 1904-2011 ..................................... 2-138 2.40: Ranking of provinces by urbanisation level, 2011 .................................................................. 2-138 2.41: Actual size of South Africa’s 10 largest cities, 2001 and 2011 ............................................... 2-139 2.42: Annual population growth rates of South Africa’s 10 largest cities, 1996-2001 and
.. 2001-2011 ......................................................................................................................... 2-140 2.43: Percentage of households living in informal dwellings in South Africa’s 10 largest cities, 2001 and 2011 ....................................................................................................................... 2-144 2.44: Percentage of households in South Africa’s 10 largest cities without access to
piped water, 2001 and 2011 ................................................................................................... 2-145 2.45: Percentage of households in South Africa’s 10 largest cities with bucket toilets or less,
2001 and 2011 ....................................................................................................................... 2-145 2.46: Percentage of households in South Africa’s 10 largest cities with communal/town
dump or no refuse collection, 2001 and 2011 ........................................................................ 2-146 2.47: Life expectancy at birth in African countries, 2010-2015 ........................................................ 2-154 2.48: Impact of AIDS on life expectancy at birth in the six worst HIV-affected African countries,
.. 1950-2050 ......................................................................................................................... 2-155 2.49: Projected life expectancy at birth in South Africa by population group, 1985-2040 ................ 2-155 2.50: Crude mortality rates in African countries, 2010-2015............................................................ 2-156 2.51: Percentage distribution of age at death by region, 2000 and 2011 ........................................ 2-157 2.52: Percentage distribution of cause of death by region, 2000 and 2011 ..................................... 2-157 2.53: Projected crude death rates in South Africa by population group, 1985-2040........................ 2-160 2.54: Child mortality rates in African countries, 2010-2015 ............................................................. 2-162 2.55: Projected child mortality rates in South Africa by population group, 1985-2040..................... 2-162 2.56: Annual notifications of malaria in South Africa, 1990-2012 .................................................... 2-165 2.57: Number of notified TB cases in South Africa, 1995-2010 ....................................................... 2-167 2.58: Ranking of provinces by TB incidence, 2010 ......................................................................... 2-167 2.59: HIV prevalence among adults, 2011 ...................................................................................... 2-169 2.60: HIV prevalence in antenatal clinic attenders in South Africa, 1990-2011 ............................... 2-170 2.61: Estimated HIV prevalence in antenatal clinic attenders by age in South Africa,
2009-2011 ......................................................................................................................... 2-171 2.62: The ‘waves’ of the AIDS epidemic in South Africa according to the ASSA2008-model,
1985-2025 ......................................................................................................................... 2-171 2.63: Projected population age structure of the South African population in the presence
and absence of the AIDS, 2040 ........................................................................................ 2-173 2.64: Membership of restricted and open medical schemes in South Africa, 1990-2011 ................ 2-179 2.65: Trends in the number of medical aid beneficiaries, 1997-2011 .............................................. 2-179 2.66: Risk and medical savings accounts contributions and claims per beneficiary per month for registered schemes, 2000-2011 ......................................................................... 2-179 2.67: South African public health expenditure, 1990-2016 .............................................................. 2-180 2.68: Six sectors and institutions most affected by corruption in South Africa and the
total sample according to the TI Global Corruption Barometer 2013 ................................. 2-195 2.69: Number of reported piracy attacks, 2004-2013 (June) ........................................................... 2-197 2.70: Total number of recorded crimes by type of crime, 1994/1995 to 2011/2012 ........................ 2-199 2.71: Total recorded crime rates in South Africa, 1994/1995 to 2011/2012 .................................... 2-200 2.:72 Reported number of murder cases and murder rates in South Africa, 1994/1995 to
2011/2012 ......................................................................................................................... 2-200 2.73: Reported number of attempted murder cases and attempted murder rates in South
Africa, 1994/1995 to 2011/2012 ........................................................................................ 2-201 2.74: Reported number of sexual offence cases and sexual offence rates in South Africa,
2003/2004 to 2011/2012 .................................................................................................. 2-201 2.75: Reported number of violent robbery cases and violent robbery rates in South Africa,
1994/1995 to 2011/2012 ................................................................................................... 2-202 2.76: The ‘trio crimes’ in South Africa, 2002/2003 to 2011/2012 ..................................................... 2-202
2.77: Reported number of violent assault cases and violent assault rates in South Africa, 1994/1995 to 2011/2012 ................................................................................................... 2-203
2.78: Reported number of common assault cases and common assault rates in South Africa, ……1994/1995 to 2011/2012 ................................................................................................. 2-203
2.79: Recorded number of property-related crime cases and property-related crime rates in …..South Africa, 1994/1995 to 2011/2012 ............................................................................. 2-204
2.80: Property-related crime rates in South Africa, 1994/1995 to 2011/2012 .................................. 2-204 2.81: Recorded number of commercial crime cases and commercial crime rates in
…..South Africa, 1994/1995 to 2011/2012 ............................................................................. 2-205 2.82: Ranking of provinces by commercial crime rates, 1994/1995 and 2011/2011 ....................... 2-205

List of Figures
viii © IFR
Business Futures 2013
2.83: Attacks and murders on farms and smallholdings, 1990 to 2012 (April)................................. 2-208 2.84: Number of cases to court, withdrawn, prosecuted and convicted, 1996 to 2011/2012 ........... 2-209 2.85: Number of sentenced prisoners and awaiting-trial detainees, 1995-2012 .............................. 2-210 2.86: Prison occupancy rate, 1996-2012 ......................................................................................... 2-211 2.87: Origin of mobile students, 2010 .............................................................................................. 2-227 2.88: Number of learners enrolled in primary education and the potential primary school-age
population, 2001-2011 ....................................................................................................... 2-233 2.89: Number of learners enrolled in primary education by grade and the potential primary
school-age population, 2011 ............................................................................................. 2-233 2.90: Number of learners enrolled in secondary education and the potential secondary
school-age population, 2001-2011 .................................................................................... 2-235 2.91: Number of learners enrolled in secondary education by grade and the potential
secondary school-age population, 2011 ............................................................................ 2-235 2.92: Number of full-time grade 12 learners enrolled vs the potential grade 12 population,
2000-2012 ......................................................................................................................... 2-235 2.93: Throughput of learners from grade 10 (2010) to grade 12 (2012) .......................................... 2-236 2.94: Number of full-time grade 12 learners enrolled and writing exam, 2000-2012 ....................... 2-236 2.95: Number of full-time grade 12 learners writing exam, passing exam and pass rates,
2000-2012 ......................................................................................................................... 2-236 2.96: Number of full-time grade 12 learners passing matric, passing with endorsement and
endorsement rate, 2000-2012 ........................................................................................... 2-237 2.97: Enrolment by gender at public higher education institutions, 1986-2011 ................................ 2-243 2.98: Enrolment by race at public higher education institutions, 1986-2011 .................................... 2-243 2.99: Number of students enrolled at public higher education institutions by major field of .. study, 2001-2011 .............................................................................................................. 2-244 2.100: Number of graduates/diplomates at public higher education institutions by major field of study, 2001-2011 ................................................................................................... 2-244 2.101: Tertiary throughput rate, first-year class of 2005 .................................................................... 2-245
Chapter 4: The Technological Environment
Figure 4.1: The technology S-curve ............................................................................................................. 4-7 4.2: The curve of growth for a given technology................................................................................ 4-8 4.3: Technological substitutions as shown by multiple curves of growth ........................................... 4-8 4.4: Share of world wealth by type of country – illustrating the role of human resources and thus innovation in contributing to wealth ........................................................................ 4-9 4.5: The relationship between productivity and national wealth for selected countries, 2011 ........ 4-10 4.6: The dependence of wealth on technology ................................................................................ 4-10 4.7: The dependence of living standards on technology ................................................................. 4-10 4.8: The importance of national education in applying technology for competitive advantage ........ 4-11 4.9: Links between technology, economic growth and human development ................................... 4-13 4.10: Forces that affect competition .................................................................................................. 4-14 4.11 Technology management ......................................................................................................... 4-15 4.12: The technology life cycle .......................................................................................................... 4-17 4.13: The effect of technological transformations on the world population ........................................ 4-18 4.14: Minimum integrated circuit line size (in production), actual and forecast ................................. 4-23 4.15 PC and tablet sales, 2012-2014 ............................................................................................... 4-24 4.16: Growth in telephone lines and cellular phone subscribers worldwide, 1990-2012 ................... 4-26 4.17: The growth of the Internet in number of hosts .......................................................................... 4-28 4.18: Telephone penetration in Africa per 100 people, 2007-2013 ................................................... 4-32 4.19: Africa telecoms services and infrastructure markets analysis and forecasts, 2007-2013 ......... 4-33 4.20: Global plantings of genetically modified crops, 1995-2012 and trend ...................................... 4-39 4.21: Worldwide spending on nanotechnology, 2000-2015 ............................................................... 4-46 4.22: Global clean-energy projected growth, 2012 and 2022 ............................................................ 4-49 4.23: Forecast of world traffic volumes, 1960-2050........................................................................... 4-54 4.24: R&D per capita as a function of GDP per capita (PPP) for 51 selected countries ................... 4-60 4.25: The trend in R&D expenditure, South Africa, 1984-2011 ......................................................... 4-61 4.26: Royalty payments to and receipts from overseas countries by South Africa, 2000-2012 ......... 4-63 4.27: Distribution of R&D expenditure by broad discipline in South Africa for 2007/2008, 2008/2009 and 2009/2010 .................................................................................................. 4-63 4.28: R&D workforce in South Africa by race and gender, 2007 ...................................................... 4-67 4.29: Overview of the national government’s Science and Technology System ............................... 4-71

List of Figures
ix © IFR
Business Futures 2013
Chapter 5: The Natural Environment
Figure 5.1: The transformation of the earth’s land biosystems, 6000BC to 2000 ......................................... 5-9 5.2: Natural habitat change from 1970 to 2050 in Millennium Ecosystem Assessment .................... 5-9 5.3: Land under conservation globally: Total and as a proportion of total land, 1961-2011 ............ 5-13 5.4: Global classification of soil degradation ................................................................................... 5-13 5.5: Land use for field crop and horticultural production in Africa, 1961-2009 ................................. 5-16 5.6: Yields for the major field crops in Africa, 1961-2009 ................................................................ 5-16 5.7: Total and per capita agricultural production in Africa, 1964-2006 ............................................ 5-16 5.8: Africa’s food imports and exports, 1961-2006 .......................................................................... 5-16 5.9: Africa’s net imports of wheat and maize, 1961-2007 ................................................................ 5-17 5.10: Number of undernourished people by major region, 1990/1992-2010/2012 with WFS target for 2015 ..................................................................................................................... 5-21 5.11: Low-income food-deficit countries and countries requiring external food assistance in Africa, Jul 2013 ................................................................................................................ 5-22 5.12: Distribution of the world’s grasslands ....................................................................................... 5-30 5.13: Designated functions of forests, 2005 ...................................................................................... 5-32 5.14: Projected global freshwater stress and scarcity, 1990-2050 .................................................... 5-43 5.15: Freshwater stress and scarcity in Africa, 2025 ......................................................................... 5-43 5.16: Global annual freshwater withdrawals by sector, 1900-2025 ................................................... 5-44 5.17: Global fish production, 1950-2012 ........................................................................................... 5-67 5.18: Ten leading countries in marine and freshwater fisheries production, 2011 ............................. 5-67 5.19: Ten leading countries in aquaculture production, 2011 ............................................................ 5-69 5.20: Annual demersal and pelagic fishery catches in South African coastal waters, 1990-2011 ........................................................................................................................... 5-75 5.21: Annual rock lobster catches in South African coastal waters, 1965-2011 ................................ 5-75 5.22: Aquaculture production in South Africa, 1990-2011 ................................................................. 5-77 5.23: Commodity prices and emerging market economic activity. 2000-2013 .................................. 5-83 5.24: In situ mineral resources in selected countries, 2010 ............................................................... 5-85 5.25: South African reserves for key minerals, 2010 ......................................................................... 5-85 5.26: Projected trends in the mineral weighted production profile of the South African mining sector, 2010-2020 .................................................................................................... 5-85 5.27: World primary energy consumption, 2000-2012 ....................................................................... 5-91 5.28: World energy intensity by region, reference case scenario, 2010-2040 ................................... 5-91 5.29: World CO2 intensity of energy use by region, 2010-2040......................................................... 5-91 5.30: Primary energy consumption in South Africa, 2012 ................................................................. 5-92 5.31: Current (2012) distribution of proved oil reserves, OPEC and non-OPEC ............................... 5-94 5.32: South Africa’s demand for and supply of liquid fuels, 2006-2025 ............................................. 5-95 5.33: World consumption of energy: Hydroelectricity and other renewable energy in the context of all other sources of energy, 2010-2040 .............................................................. 5-99 5.34: Renewable energy’s share of global final energy consumption, 2011 ...................................... 5-99 5.35: Estimated renewable energy’s share of global electricity production, end-2012 ...................... 5-99 5.36: Global new investments in renewable energy, 2004-2012 ..................................................... 5-100 5.37: Global new investment in renewable energy, by technology, developed and developing countries, 2012 ............................................................................................... 5-100 5.38: Top 10 emitters listed in order of SA scope 1 & 2 emissions ................................................. 5-106 5.39: Linking biodiversity to human well-being ................................................................................ 5-109 5.40: The Ecological Footprint and Human Development Index by country, 2007 .......................... 5-112 5.41: The Living Planet Index, Temperate Index and Tropical Index, 1970-2008 ........................... 5-113 5.42: The Red List Index for corals, birds, mammals and amphibians, 1980-2010 ......................... 5-114 5.43: Africa’s total Ecological Footprint and biocapacity, 1961-2008 .............................................. 5-117 5.44: Ecosystem status in South Africa, 2011 ................................................................................. 5-118 5.45: The Ecological Footprint and biocapacity of South Africa, 1961-2008 ................................... 5-120 5.46: Waste management strategy ................................................................................................. 5-133 5.47: Number of obsolete computers – estimates and projections, 1990-2030 ............................... 5-136 5.48: National risk profile of wastewater treatment plants: Cumulative risk rating as a percentage of maximum risk rating, Oct 2008 to Apr 2012 .................................................... 5-141 5.49: Global growth in volume of bottled water, 2010-2015 ............................................................ 5-142 5.50: Plastics production in million tonnes, 1950-2010 ................................................................... 5-145 5.51: Number of medium and large spills per decade, 1970-2012 .................................................. 5-146 5.52: Global premature deaths from selected environmental risks: Baseline scenario, 2010-2050 ......................................................................................................................... 5-147 5.53: Comparison of annual mean concentration of PM10 across urban areas .............................. 5-151 5.54: Severity of health effects due to noise versus the number of people affected ....................... 5-154 5.55: Number of objects in earth’s orbit ........................................................................................... 5-155

List of Figures
x © IFR
Business Futures 2013
5.56: The monthly average atmospheric carbon dioxide concentration at Mauna Loa Observatory, Hawaii, 1700-2013 ....................................................................................... 5-165 5.57: Variations of the earth’s surface temperature, 1000-2100 ..................................................... 5-180 5.58: The Conventional World and Sustainable World scenarios ................................................... 5-197 5.59: Drivers of environmental change ............................................................................................ 5-200 5.60: Four scenarios of South Africa’s future environment .............................................................. 5-201 5.61: The environmental implications of the four scenarios ............................................................ 5-202
Chapter 6: The Economic Environment
Figure 6.1: Structure of economies, 2011 .................................................................................................... 6-7 6.2: Structure of merchandise exports, 2011 .................................................................................... 6-7 6.3: Structure of merchandise imports, 2011 .................................................................................... 6-7 6.4: Global middle class: Daily expenditure $10-$100 per day per person, 2009 and 2030 ............ 6-12 6.5: Number of African households with discretionary spending power, 2000-2020 ....................... 6-16 6.6: Generic scenarios for African countries ................................................................................... 6-22 6.7: South Africa’s macro-economy ................................................................................................ 6-24 6.8: Structure of the SA economy by primary, secondary and tertiary sectors, 1960-2012 ............. 6-25 6.9: Gross value added in the financial sector to gross value added in the primary sector, 1950-2012 ........................................................................................................................... 6-26 6.10: Average annual % growth in value added by major kind of economic activity, 1960-2012 ...... 6-26 6.11: GDP and GDE, 1980-2012....................................................................................................... 6-32 6.12: Real GDP and GDE per capita, 1980-2012.............................................................................. 6-32 6.13: Economic growth in South Africa, 1946-2012 .......................................................................... 6-33 6.14: Household debt and net wealth as % of disposable income, 1975-2012 ................................. 6-33 6.15: Components of GDP, 1960-2012 ............................................................................................. 6-34 6.16: Real FCE per capita, 1970-2012 .............................................................................................. 6-35 6.17: Real FCE as % of GDP, 1970-2012 ......................................................................................... 6-36 6.18: Components of FCE, 1970-2012 .............................................................................................. 6-36 6.19: Annual changes in index of coincident indicators and durable spending, 1971-2012 .............. 6-36 6.20: Annual changes in index of coincident indicators and non-durable spending and services, 1970-2012 ............................................................................................................ 6-36 6.21: Government expenditure: Consumption and gross fixed capital formation, 1960-2012 ........... 6-37 6.22: Gross fixed capital formation by government as a percentage of total government expenditure, 1960-2012 ...................................................................................................... 6-38 6.23: Government revenue, expenditure, and deficit/surplus as % of GDP, 1960-2012 ................... 6-38 6.24: National government debt as % of GDP, 1960-2012 ............................................................... 6-38 6.25: National government debt as % of total national government debt, 1960-2012 ....................... 6-38 6.26: Selected items of general government expenditure expressed in real terms, 1990-2014 ........ 6-39 6.27: Selected items of general government expenditure as share of total spending, 1990-2014 .... 6-39 6.28: Selected taxes as percentage of total revenue, 1990-2013 ..................................................... 6-39 6.29: Exports and imports of goods and services and current account balance as % of GDP, 1960-2012 ........................................................................................................................... 6-40 6.30: Year-on-year % change in merchandise export and import prices, and terms of trade, 1961-2012 ........................................................................................................................... 6-40 6.31: Gross fixed capital formation and gross savings as % of GDP, 1960-2012 ............................. 6-42 6.32: Gross fixed capital formation: Private and government, 1960-2012 ......................................... 6-43 6.33: Gross fixed capital formation: Net capital formation and consumption of fixed capital, 1960-2012 ........................................................................................................................... 6-43 6.34: Fixed capital stock: Total and per capita, 1960-2012 ............................................................... 6-43 6.35: Fixed capital stock required per R1 of GDP, 1960-2012 .......................................................... 6-43 6.36: Fixed capital stock in economic infrastructure: Total and per capita, 1960-2012 ..................... 6-44 6.37: Gross fixed capital formation in infrastructure as % of GDP, 1960-2012 ................................. 6-44 6.38: Fixed capital stock in electricity, gas and water: Total and per capita, 1960-2012 ................... 6-44 6.39: Real gross savings, 1960-2012 ................................................................................................ 6-45 6.40: Composition of gross savings, 1960-2012 ............................................................................... 6-45 6.41: Household savings and household debt as % of household disposable income, 1975-2012 .. 6-45 6.42: Government and savings balance as % of GDP, 1970-2012 ................................................... 6-46 6.43: Savings balance and net financial flows as % of GDP, 1970-2012 .......................................... 6-46 6.44: Current account and financial account balance as % of GDP, 1970-2012 ............................... 6-46 6.45: Gross gold and foreign reserves, 1981-2012 ........................................................................... 6-46 6.46: Composition of net financial flows ............................................................................................ 6-47 6.47: Effective exchange rate of the rand, normal and real, 2000-2012 ............................................ 6-48 6.48: Under-/over-valuation of the rand, 2000-2012.......................................................................... 6-48

List of Figures
xi © IFR
Business Futures 2013
6.49: CPI inflation, 1970-2012 ........................................................................................................... 6-50 6.50: CPI inflation rate: Food and non-alcoholic beverages; all goods; total CPI, 2003-2013 ........... 6-51 6.51: Employment-gross value added coefficient, 2000-2012 ........................................................... 6-53 6.52: Output, labour and capital ratios, 1970-2012 ........................................................................... 6-57 6.53: Number of workers per R1m of output, 1970-2012 .................................................................. 6-57 6.54: GNI per member of labour force, and GNI per capita; selected income regions
and countries, 2011 ............................................................................................................. 6-58 6.55: Productivity of labour and capital in the non-agricultural sectors, 1970-2012 ........................... 6-59 6.56: Percentage change in total remuneration per worker and labour productivity, and
index of nominal unit labour costs in the non-agricultural sectors, 1970-2012 .................... 6-58 6.57: Real disposable income of households, real GDP and real final consumption expenditure
per capita, 1990-2012 ......................................................................................................... 6-64 6.58: Proportion of population living below various poverty lines ...................................................... 6-64 6.59: Mean per capita real income: Richest 10% and poorest 10%, 1994-2009 ............................... 6-65 6.60: Income inequality: Gini coefficient, 2000-2010 ......................................................................... 6-65 6.61: Distribution of South Africans by Living Standards Measure, 2005-2011 ................................. 6-65 6.62: Social assistance grant recipients: Total and child-related grants, 2004-2012 ......................... 6-66 6.63: Social assistance grant expenditure, 2004-2012 ...................................................................... 6-66 6.64: CPI inflation, normal and real prime lending rate, 1980-2012 .................................................. 6-67 6.65: Real average annual economic growth by province, 2001-2011 .............................................. 6-68 6.66: Provincial contribution to South Africa’s GDP, 1995, 2005 and 2011 ....................................... 6-68
Chapter 7: Sustainable Development
Figure 7.1: Nine planetary boundaries and the safe operating space ........................................................ 7-17 7.2: Reasons for reporting on sustainability .................................................................................... 7-26
7.3: Vision 2050 .............................................................................................................................. 7-36 7.4: Corporate governance and related terminology ....................................................................... 7-38

List of Tables
xii © IFR
Business Futures 2013
List of Tables
Chapter 1: Strategic Thinking and the Future
Table 1.1: Continuum of futures methods and techniques ........................................................................ 1-17 1.2: Environmental analysis techniques .......................................................................................... 1-21 1.3: Characteristics of classical forecasting compared with those of the prospective approach ..... 1-23 1.4: Share of global real GDP, by scenario ..................................................................................... 1-35
Chapter 2: The Social Environment
Table 2.1: Human aspirations and the obstructions to the development of societies .................................. 2-6 2.2: Representation of employees by race, sex and occupational level, 2012 ................................ 2-26 2.3: The three most dominant home languages in South Africa by race, 2011 ............................... 2-38 2.4: The three most dominant home languages by province, 2011 ................................................. 2-38 2.5: The 10 largest Muslim populations, 2010 ................................................................................. 2-48 2.6: Muslim population by major region, 2010 and 2030 ................................................................. 2-49 2.7: Marital status of the South African population, 2001 and 2011 ................................................ 2-59 2.8: Number of registered marriages and published divorces in South Africa, 2000-2011 .............. 2-59 2.9: Number and proportion of children living with biological parents by province, 2010 ................ 2-60 2.10 Number and proportion of orphans by province, 2010 ............................................................. 2-61 2.11: Number and proportion of children living in child-headed households by province, 2002 and 2010 .................................................................................................................... 2-62 2.12: Number and proportion of children living in income poverty by province, 2003 and 2010 ........ 2-63 2.13: HDI values and components by region and HDI group, 2012 .................................................. 2-73 2.14: South Africa’s HDI indicators for 2012 relative to selected countries and regions.................... 2-74 2.15: South Africa’s multiple deprivations relative to selected countries ........................................... 2-76 2.16: Inequality-adjusted HDI values and components by region and HDI group, 2012 ................... 2-77 2.17: Gender Inequality Index values and components, by region and HDI group, 2012.................. 2-78 2.18: South Africa’s GII indicators for 2012 relative to selected countries and regions ..................... 2-79 2.19: The 10 highest ranked countries, South Africa and the 10 lowest ranked countries according to the Social Progress Index, 2013 .......................................................................... 2-83 2.20: Africa’s MDGs performance at a glance, 2012 ......................................................................... 2-87 2.21: Population size and annual population growth rates of major regions 1970-2050 ................... 2-97 2.22: Ranking of the 11 most populous countries, 1950, 2013, 2030 and 2050 ................................ 2-98 2.23: Average annual net number of migrants per decade by major region, 1990-2050 ................. 2-100 2.24: Percentage distribution of the world population within three age groups by major region,
1950-2050 ......................................................................................................................... 2-102 2.25: Median age of the world population by major region, 1950-2050 ........................................... 2-103 2.26: Labour force participation among older persons by major region, 2012 ................................. 2-105 2.27: Population size and annual population growth rates of sub-Saharan African countries and SADC countries, 1970-2050 ....................................................................... 2-106 2.28: Actual (2011) and projected size of the South African population by race and sex,
2011-2040 ......................................................................................................................... 2-110 2.29: Actual (2001 and 2011) and projected size of the provincial populations, 2001-2025 ............ 2-111 2.30: Actual (2011) and projected racial composition of the South African population,
1985-2040 .............................................................................................................................. 2-112 2.31: Actual racial composition in South Africa by province, 2012 .................................................. 2-113 2.32: Projected annual population growth rates of the South African population by race,
1985-2040 ......................................................................................................................... 2-113 2.33: Actual (2011) and projected age distribution, median ages and old age dependency
ratios of the South African population by race, 2010-2040 ..................................................... 2-115 2.34: Residence permits issued, 2011 and 2012 ............................................................................ 2-118 2.35: Estimated number of South Africans living abroad, 2010 ....................................................... 2-119 2.36: Urban and rural population size by major region, 1970-2050 ................................................. 2-127 2.37: Urban and rural growth rates by major region, 1970-2050 ..................................................... 2-129 2.38: Urban population size and urbanisation levels of African regions and countries,
1970-2050 ......................................................................................................................... 2-133 2.39: Africa’s urban and rural growth rates by region, 1970-2050 ................................................... 2-135 2.40: Africa’s urban population distribution by urban settlement size, 1970-2025 ........................... 2-136 2.41: South Africa’s secondary cities ranked by annual population growth rate, 2001-2011 ........... 2-140

List of Tables
xiii © IFR
Business Futures 2013
2.42: Access of households to housing in South Africa, 1996, 2001 and 2011 ............................... 2-144 2.43: Modes of transport used by commuters in South Africa, by settlement type, 2003 ................ 2-148 2.44: Life expectancy at birth by major region, 1950-2050 ............................................................. 2-154 2.45: Projected life expectancy at birth of the South African population by province, 1990-2025 ....... 2-155 2.46: Crude mortality rates by major region, 1950-2050 ................................................................. 2-156 2.47: Ten leading causes of death in the world, 2011, with projections for 2030 ............................ 2-158 2.48: Projected crude mortality rates of the South African population by province, 1990-2025....... 2-160 2.49: Ten leading underlying causes of death by gender in South Africa, 2010 .............................. 2-161 2.50: Child mortality rates by major region, 1950-2050 ................................................................... 2-162 2.51: Projected child mortality rates of the South African population by province 1990-2025 ......... 2-163 2.52: Ranking of the 10 countries with the highest TB burden by number of new cases,
incidence rates, as well as HIV prevalence in TB cases, 2011 ......................................... 2-166 2.53: HIV/AIDS indicators by major region, 2011 ............................................................................ 2-168 2.54: HIV prevalence and AIDS deaths and AIDS orphans in the 10 worst-affected sub-
Saharan countries, 2011 ................................................................................................... 2-170 2.55: Estimated HIV prevalence in antenatal clinic attenders by province in South Africa,
2002-2011 ......................................................................................................................... 2-171 2.56: Projected number of HIV-infected people and AIDS deaths per province, 2005-2025 ........... 2-172
2.57: Projected demographic impact of HIV/AIDS on the total South African population, 2010-2040 ......................................................................................................................... 2-173
2.58: Public sector health care personnel in South Africa by province, 2012 .................................. 2-178 2.59: Distribution of public and private hospitals and hospital beds, as well as primary health care facilities ........................................................................................................... 2-178 2.60: Provincial health expenditure in real terms, 2009/2010 to 2015/2016 .................................... 2-181 2.61: The 10 highest ranked countries, South Africa and the 10 lowest ranked countries according to the Corruption Perceptions Index, 2012 ....................................................... 2-193 2.62: Ranking of countries according to the Bribe Payers Index, 2011 ........................................... 2-193 2.63: Incidence of corruption and perceived corruption in sub-Saharan African countries .............. 2-198 2.64: Violent crime rates by province, 1994/1995 and 2011/2012 .................................................. 2-201 2.65: Ranking of provinces according to property-related crime rates, 2011/2012 ......................... 2-204 2.66: Estimated number of adult illiterates and adult literacy rates by major region in 1985-1994 and 2005-2010, with projections to 2015 ........................................................ 2-219 2.67: Pre-primary enrolment and gross enrolment ratios by major region, 1999 and 2010 ............. 2-220 2.68: Estimated number of out-of-school children by major region, 1999 and 2010 ....................... 2-221 2.69: New entrants to grade 1, primary education enrolment and net enrolment ratios by major region, 1999 and 2010 ............................................................................................ 2-222 2.70:` Rates of transition to, and participation in, secondary education by major region, 1999 and 2009/2010 ......................................................................................................... 2-223 2.71: Teaching staff and learner/educator ratios in primary and secondary education by major region, 1999 and 2010 ............................................................................................ 2-224 2.72: Tertiary education enrolment and gross enrolment ratios by major region, 1999 and 2010 ........................................................................................................................... 2-226 2.73: Tertiary education enrolment by field of study for major regions, 2010 .................................. 2-226 2.74: Top 20 universities according to the THES and SJTU world rankings, 2012-2013 ................ 2-228 2.75: Percentage of the adult population by level of education and by race, 1996, 2001 2011 and 2012 .................................................................................................................. 2-229 2.76: Enrolment in pre-grade R and grade R levels by province, 2005 and 2012 ........................... 2-231 2.77: Number of learners, educators and ordinary schools, as well as learner/educator ratios and learner/school ratios by province, 2000 and 2012 ............................................ 2-232 2.78: Numeracy and literacy performance in grades 3 and 6, 2001-2011 ....................................... 2-233 2.79: NSC results by province, 2008, 2011 and 2012 ..................................................................... 2-237 2.80: Number of grade 12 learners writing and passing mathematics, 2008-2012 ......................... 2-238 2.81: Number of grade 12 learners writing and passing physical science, 2008-2012 .................... 2-239 2.82: Condition of education facilities, 1996, 2006, 2009 and 2011 ................................................ 2-240 2.83: Number of post-school education and training institutions and student enrolment, 2011 ....... 2-243 2.84: Enrolment at public higher education institutions by race, 2011............................................. 2-244 2.85: Private higher education institutions by province and programmes, 2013 (July) .................... 2-245 2.86: Enrolment at public FET colleges by province and programme, 2011 ................................... 2-246 2.87: Returns to investment in education by level ........................................................................... 2-248 2.88: Provincial education expenditure, 2009/2010 to 2015/2016 ................................................... 2-252

List of Tables
xiv © IFR
Business Futures 2013
Chapter 3: The Political Environment
Table 3.1: Anarchy’s anatomy: Failed states, 2010 .................................................................................. 3-21 3.2: South Africa’s top 10 trading partners, 2011 ............................................................................ 3-44 3.3: Land restitution to 2011/2013 ................................................................................................. 3-110 3.4: Land redistribution, April 1994 to June 2010 .......................................................................... 3-111
Chapter 4: The Technological Environment
Table 4.1: Selected indicators of technological competitiveness potential, 2011 ...................................... 4-12 4.2: Management tasks in managing technology ............................................................................ 4-17 4.3: Forecasts of some microprocessor parameters, 2010-2022 .................................................... 4-24 4.4: The ten most powerful supercomputers as at June 2013 ......................................................... 4-25 4.5: Broadband: Top ten countries by subscribers per 100 population, 2012 ................................. 4-28 4.6: Broadband: Top ten countries by number of lines, 2012 .......................................................... 4-28 4.7: Global Internet usage and penetration, by region (as at 30 June 2012) ................................... 4-29 4.8: e-Readiness Index top 50, 2010 .............................................................................................. 4-29 4.9: Information penetration in Africa, 2012 .................................................................................... 4-31 4.10: Some landmark events in genetic engineering......................................................................... 4-35 4.11: Area under genetically modified crops in million hectares by major country, 1996-2012 ......... 4-40 4.12: Landmark events in materials technology ................................................................................ 4-43 4.13: Comparative performance of internal combustion, hybrid and fuel cells for car engines,
2010-2030 ........................................................................................................................... 4-56 4.14: Indicators of technological competitiveness potential for some countries ................................ 4-59 4.15: R&D and high technology in Africa ........................................................................................... 4-61 4.16: R&D expenditure by province................................................................................................... 4-64 4.17: NRF rated researchers at South African institutions, ranked by ratings within
institution type ...................................................................................................................... 4-65 4.18: Education and S&T personnel in Africa .................................................................................... 4-67 4.19: Government funding to public entities and programmes, 2008/2009-2011/2012 ..................... 4-73 4.20: Selected DST performance indicators ...................................................................................... 4-77
Chapter 5: The Natural/Physical Environment
Table 5.1: Global land availability by selected countries and territory, 2011 ............................................... 5-6 5.2: Ranking of top 10 countries and South Africa with regard to the distribution of
arable and irrigated land, 2011 .............................................................................................. 5-7 5.3: The composition of agricultural land in the USA, the EU, BRICS and selected
Southern African countries, 2011 .......................................................................................... 5-7 5.4: Consumption of key resources in China and the USA, assuming current trends ....................... 5-8 5.5: Growth in arable land use by major region, 1700-2011 ............................................................ 5-10 5.6: Percentage distribution of estimated sources of growth in crop production in developing countries, 1961-2005 and 2005/2007-2050......................................................................... 5-14 5.7: Potential arable land and arable land in use in developing countries, 2005/2007 and 2050 ........ 5-15 5.8: Area equipped for irrigation in developing countries, 1961/1963 to 2050 ................................. 5-15 5.9: Logistics Performance Index .................................................................................................... 5-17 5.10: Yield effects by crop and management system ........................................................................ 5-18 5.11: World food prices in 2000 and 2050 ......................................................................................... 5-18 5.12: The impact of increased crop prices on food consumption, availability and child
malnutrition in sub-Saharan Africa and developing countries, 2000 and 2050 .................... 5-19 5.13: The Global Hunger Index, 1990 and 2012 ............................................................................... 5-21 5.14: Growth in demand for, and production of, agricultural products by major region, 1970-2050 .. 5-24 5.15: Per capita food consumption by major region, 1969/1971-2050 .............................................. 5-24 5.16: Nutrition indicators for the developing world, 1990-2010 (% of children under 5) .................... 5-25 5.17: Fertiliser consumption and annual growth by major region, 1961/1963-2050 .......................... 5-29 5.18: Trends in forest cover and deforestation by major region, 2010 .............................................. 5-32 5.19: Summary assessment of the main forces affecting forest industry development ..................... 5-33 5.20: Trends in production and consumption of sawn wood, 1965-2030 .......................................... 5-33 5.21: Production of bioenergy, 1970-2030 ........................................................................................ 5-34 5.22: Plantation area by species and ownership, 2010/2011 ............................................................ 5-35 5.23: Freshwater resource availability versus population distribution by major region, 2010 and 2030 .................................................................................................................... 5-42

List of Tables
xv © IFR
Business Futures 2013
5.24: The Millennium Development Goals: Past performance and future targets for water and sanitation ...................................................................................................................... 5-46 5.25: Natural mean annual runoff, ecological reserve and available freshwater yield by water management area, 2000 ...................................................................................... 5-49 5.26: Freshwater availability and requirements in South Africa by water management area, 2000 and 2025 in million m
3 per annum .............................................................................. 5-50
5.27: World fish production, utilisation and consumption, 2010-2012, with forecasts for 2013 ......... 5-70 5.28: Proved reserves of non-renewable energy resources, at the end of 2012 ............................... 5-90 5.29: World energy consumption by energy source, reference case scenario, 2010-2040 ............... 5-90 5.30: Energy efficiency and CO2 emissions of South Africa and selected countries ......................... 5-92 5.31: Oil reserves, production and consumption as a percentage of the world total, 2012 ............... 5-93 5.32: Coal reserves, production and consumption in selected countries, 2012 ................................. 5-96 5.33: Natural gas reserves, production and consumption in selected regions, 2012 ........................ 5-97 5.34: Top 10 countries with technically recoverable shale gas resources ......................................... 5-97 5.35: Known recoverable resources of uranium, 2011 ...................................................................... 5-98 5.36: Renewable energy added and existing capacities, 2012 ....................................................... 5-100 5.37: Global energy provided by source, percentages, 2000-2050 ................................................. 5-101 5.38: Total allocation for renewable energy technologies through the RE IPP programme ............ 5-102 5.39: Committed IRP2010 build plan ............................................................................................... 5-104 5.40: World CO2 emissions by fuel type, 2010-2040, in million tonnes of CO2................................ 5-105 5.41: Emissions for Eskom generation, 2010/2011-2012/2013 ....................................................... 5-105 5.42: The 10 countries with the largest Ecological Footprints per person, South Africa and the 10 countries with the smallest Ecological Footprints per person, 2008 ....................... 5-112 5.43: Number of extinct and threatened species by major groups of organisms in the world, 2013 ........................................................................................................................ 5-114 5.44: Top ten industrial pollutants by DALY and DALYs comparison .............................................. 5-129 5.45: Leading contributors to death and DALYs .............................................................................. 5-129 5.46: Municipal solid waste generation by income level, current data and projections for 2025 ..... 5-132 5.47: Life-Cycle-Assessed waste prevention indicators by waste type ........................................... 5-134 5.48: Quantity of e-waste generated in tonnes/year, selected countries ......................................... 5-136 5.49: Global nanotechnology consumption by end-user segment, 2009-2015 ................................ 5-137 5.50: Global abundances of key GHGs average over the 12 months of 2011 and the changes relative to 1750 and 2010, and contributions to radiative forcing ........................ 5-150 5.51: GHG emissions from waste, 1990-2010 and projections to 2050 .......................................... 5-153 5.52: Global greenhouse gas emissions by sector .......................................................................... 5-164
Chapter 6: The Economic Environment
Table 6.1: Distribution of world PPP GNI and population by income category and selected regions, 2011 .......................................................................................................... 6-6 6.2: The 20 largest economies by PPP GNI, 2011 ............................................................................ 6-6 6.3: The BRICS economies, 2011 ..................................................................................................... 6-7 6.4: Structure of GDP by income group, region and selected countries, 2011 .................................. 6-8 6.5: Contribution to global components of GDP by income group, region and selected countries, 2011 ....................................................................................................... 6-9 6.6: Global economic growth, 2010-2014 ........................................................................................ 6-10 6.7: Projections for GDP and GDP per capita, 2000-2050 .............................................................. 6-11 6.8: Selected basic indicators for Africa, 2010 ................................................................................ 6-18 6.9: Economic value added by economic activity by region and selected countries in Africa, 1980-2010 ............................................................................................................ 6-18 6.10: Structure of demand for Africa, 1990-2010 .............................................................................. 6-19 6.11: Top three exports for selected African countries, 2010 ............................................................ 6-20 6.12: South Africa’s economy, 1980-1993 and 1994-2012 ............................................................... 6-24 6.13: Sectoral contribution to total value added in constant 2005 terms, 1960-2012 ........................ 6-25 6.14: Economies in the middle income trap, 2010 ............................................................................ 6-28 6.15: Middle income economies not in the MIT, 2010 ....................................................................... 6-29 6.16: Household final consumption expenditure (FCE) as a percentage of GDP by region and selected countries, 1995 and 2011 .................................................................... 6-35 6.17: Average annual per capita growth in household FCE by region and selected countries, 1990-2000 and 2000-2011 .................................................................................................. 6-35 6.18: Real growth in selected items of government expenditure, 1990-2014 .................................... 6-39 6.19: Revealed comparative advantage in respect of merchandise trade – upper middle income countries and South Africa ...................................................................................... 6-41

List of Tables
xvi © IFR
Business Futures 2013
6.20: Revealed comparative advantage in respect of services trade – upper middle income countries and South Africa ....................................................................................... 6-42 6.21: Depreciation/appreciation of the nominal and real effective exchange rate of the rand, 2000-2013 .................................................................................................................. 6-48 6.22: Labour force participation, absorption and unemployment by sex, Mar 2001-Mar 2013 .......... 6-52 6.23: Unemployment rate by province, Mar 2001-Mar 2013 ............................................................. 6-52 6.24: Employment by main industry, Mar 2001-Mar 2013 ................................................................. 6-53 6.25: Job creation in emerging markets, 2000-2009 ......................................................................... 6-55 6.26: Macro-economic environment of fast and medium job creators, and South Africa................... 6-56 6.27: Labour market statistics for fast and medium job creators, and South Africa ........................... 6-56 6.28: Employment by occupation, Mar 2001-Mar 2013 ..................................................................... 6-60 6.29: Highest level of education of the employed in March 2013 ...................................................... 6-60 6.30: Highest level of education of the unemployed in March 2013 .................................................. 6-61 6.31: Employment scenarios to 2014 ................................................................................................ 6-61 6.32: Growth in real monthly wage and minimum wage in PPP US$, selected countries, 2006-2009 ........................................................................................................................... 6-63 6.33: Poverty measures by population group and gender, 1993, 2000 and 2008 ............................. 6-64 6.34: Provincial contribution to South Africa’s GDP by sector, 2011 ................................................. 6-69 6.35: Sectoral contribution to provincial GDP, 2011 .......................................................................... 6-69 6.36: The 12 pillars of competitiveness, by sub-index ....................................................................... 6-70 6.37: Sub-index weights by stage of development ............................................................................ 6-71 6.38: South Africa’s global competitiveness rankings by sub-index and pillar, 2013/2014 ................ 6-71 6.39: South Africa’s global competitiveness: Best and worst rankings .............................................. 6-72 6.40: South Africa: Selected medium term macroeconomic projections, 2011-2018 ........................ 6-75
Chapter 7: Sustainable Development
Table 7.1: Nine planetary boundaries and their parameters ..................................................................... 7-19 7.2: Sustainability challenges, competencies and opportunities ..................................................... 7-33

List of Exhibits
xvii © IFR
Business Futures 2013
List of Exhibits
Chapter 1: Strategic Thinking and the Future
Exhibit 1.1: A selection of paradoxical statements .......................................................................................1-15 1.2: Mind sets required to anticipate future change ..........................................................................1-15 1.3: Taxonomy of futures research methods ....................................................................................1-18 1.4: Organisational models and their implications for management .................................................1-29 1.5: Megatrends and tectonic shifts ..................................................................................................1-33
Chapter 2: The Social Environment
Exhibit 2.1: Categories of construct .............................................................................................................2-18 2.2: Official list of MDG goals and targets ........................................................................................2-85 2.3: Millennium Development Goals: 2012 Progress Chart ..............................................................2-86 2.4: Post-2015 development agenda universal goals and national targets ......................................2-90 2.5: China’s one-child policy .............................................................................................................2-99 2.6: Demographic profile of young people aged 15-24 ...................................................................2-104 2.7: Demographic profile of the emerging black African middle class ............................................2-116 2.8: The Gauteng Urban Region ....................................................................................................2-139 2.9: Cities and climate change .......................................................................................................2-142 2.10: The global tobacco epidemic – some facts..............................................................................2-158 2.11: Alcohol abuse – some facts.....................................................................................................2-159 2.12: Key messages: The global economic burden of non-communicable diseases report .............2-159 2.13: Key elements of an HIV/AIDS workplace policy and an HIV/AIDS workplace programme ......2-175 2.14: Public health care sector vs private health care sector: Some shortcomings, strengths and challenges ..................................................................................................................2-177 2.15: The 10 Point Plan for the 2009-2014 period ............................................................................2-182 2.16: The National Health Insurance green paper, 2011 ..................................................................2-183 2.17: Estimates of the extent and value of key transnational organised crime-related flows ............2-190 2.18: Actions that organisations should take to defend themselves against cyber security attacks ................................................................................................................................2-191 2.19: Policy proposals for sustainable corporate integrity ................................................................2-195 2.20: The South African Cyber Threat Barometer 2012/3: Key issues .............................................2-207 2.21: The Education for ALL goals and the education-related Millennium Development Goals .......2-218 2.22: The main findings of the 2009 CHET study with regard to 18-24 year-olds ............................2-248 2.23: The goals of the Action Plan to 2014 .......................................................................................2-255
Chapter 3: The Political Environment
Exhibit 3.1: Regional integration schemes in Southern Africa ......................................................................3-70 3.2: China’s top ten African trading partners in 2008........................................................................3-73 3.3: Chinese investment in Africa .....................................................................................................3-74 3.4: The Constitution of the Republic of South Africa 1996 ............................................................3-108
Chapter 4: The Technological Environment
Exhibit 4.1: The five technological transformations ......................................................................................4-19 4.2: A brief history of nanotechnology ..............................................................................................4-46 4.3: Major flows of funding for R&D in South Africa, 2009/2010 .......................................................4-62
Chapter 5: The Natural/Physical Environment
Exhibit 5.1: Types of soil productivity degradation according to GLASOD .................................................. 5-11 5.2: Future implications of current trends in access to food ............................................................ 5-23 5.3: REDD+ ..................................................................................................................................... 5-31 5.4: Actions to overcome water-food-environment issues and challenges ...................................... 5-58

List of Tables
xviii © IFR
Business Futures 2013
5.5: Types of marine ecosystem services ....................................................................................... 5-66 5.6: Fish and aquaculture scenario for sub-Saharan Africa, 2006-2015 ......................................... 5-71 5.7: The impact of climate change on fisheries and aquaculture .................................................... 5-72 5.8: Strategic Plan 2012/13-2016/17 for the Department of Agriculture, Forestry and Fisheries: Fisheries management ....................................................................................... 5-78 5.9: The role of emerging markets in commodity consumption ....................................................... 5-84 5.10: Risks and opportunities in high emitting sectors .................................................................... 5-107 5.11: Trends shown by agreed indicators of progress towards the 2010 biodiversity target ........... 5-111 5.12: 2011 National biodiversity assessment: Key findings ............................................................. 5-119 5.13: Ecosystem status, protection level, services and pressures .................................................. 5-119 5.14: TEEB for business study: Key findings .................................................................................. 5-120 5.15: Protected areas ...................................................................................................................... 5-122 5.16: Ecosystem restoration ............................................................................................................ 5-123 5.17: Effects of air pollutants on human health, the environment and the climate .......................... 5-148 5.18: A summary of measurement of changes in the earth’s temperature ...................................... 5-167 5.19: Recent trends, assessment of human influence on the trend, and projections for extreme weather events for which there is an observed late 20
th century trend ................ 5-168
5.20: Risks and opportunities for different economic sectors .......................................................... 5-177 5.21: Key landmark events in the United Nations Framework Convention on Climate Change ...... 5-181 5.22: Typical projects that could qualify for CDM financing ............................................................. 5-184 5.23: Indicators in support of the project approval criteria ............................................................... 5-185 5.24: Key environmental challenges: Trends and projections without new policies ........................ 5-195 5.25: Manifestations of CWS and SWS, and strategies for moving towards SWS .......................... 5-197
Chapter 6: The Economic Environment
Exhibit 6.1: A new world order? .................................................................................................................. 6-14 6.2: Structural challenges to a high growth trajectory ...................................................................... 6-76
Chapter 7: Sustainable Development
Exhibit 7.1: Core challenges of sustainable development..............................................................................7-6 7.2: The sustainable development timeline ........................................................................................7-7

1 | P a g e
Chapter 1
Strategic thinking and the future
(A Roux & T Hichert)
The purpose of this chapter is twofold: (1) to de-
scribe the context for and operating philosophy of
the IFR’s approach to futures research and studies;
and (2) to trace the relationship between strategy
and futures thinking by, inter alia, highlighting the
need to acquire and nurture foresight as a tool to
gain knowledge about the factors moulding the
future.
Various principles for studying and making sense
of the future are listed as a precursor to the presen-
tation of various conceptual frameworks for fore-
sight (including models of change and the dynam-
ics of social and economic evolution). Attention is
also devoted to a number of long-range forecasting
methods and techniques (including Delphi studies,
environmental scanning, scenarios, and visioning).
A subsection of this introductory chapter is devoted
to a brief discussion of the systems approach. Not
only is systems thinking an integrating discipline
that enables us to understand the complexities of
society; it is also an indispensable tool in strategic
transformation as a way of solving the real life
problematique of strategic management. The pur-
pose of strategic transformation is to redirect and
transform society or an organisation in a purpose-
ful, directed and practical fashion, ie, to measure
and make the future the concept of idealised rede-
sign is also explained. The objective (and result) of
transformation should be organisational develop-
ment and enhanced competence. Development
means continuous renewal and capacity enhance-
ment – the ability to remain effective over the long
term.
Managing complexity through corporate govern-
ance is discussed. Catalysts for change in corporate
governance (eg, globalisation, stakeholder activ-
ism, standardisation and legislative reform) are
compelling the corporate world to reappraise its
role within society and the natural/physical envi-
ronment.
This chapter also points Associates to the way in
which the remaining chapters of Business Futures
2013 (and, indeed, all of the IFR’s products) can be
used for strategic planning. In essence, Business
Futures aims to convert data and information into
knowledge in the domain of the contextual envi-
ronment, ie, those external environmental forces
over which an organisation has little influence and
no control, but nonetheless needs to adapt to. Thus,
Business Futures 2013 covers a wide range of
global, African and South African realities and
trends in the social, political/institutional, natural,
technological and economic environments. This
boils down to an ongoing process whereby signifi-
cant changes in the world are identified, focusing
on trends (changes that occur through time), rather
than events (changes that occur rapidly, and are
generally less significant for understanding the fu-
ture).
Business Futures 2013 therefore offers Associates
a tool to identify and understand those phenomena
or aspects of the world that are likely to shape
Figure 1.7: Multiple perspectives in environmental scanning
Figure 1.6: What the organisation can and cannot control
Entity
Transactional environment
Stakeholders
Contextual environment
Multiple environmental forces
Organisation has total control over
internal processes, structures &
functions
Organisation has influence, but little
control
Organisation has little influence and no control; can only
adapt
Social
Resources
Technology
Politics/
Institutional
Economics
World Africa
Nation
Issue

List of Tables
2 | P a g e
and/or change those trends that could have major impacts on organisations. Thus, by formally scanning the
environment Business Futures 2013 (and other IFR products) aims to identify and analyse the nature, causes,
speed of development and potential impacts of trends.
The IFR does not provide predictions; Business Futures 2013 does not describe any specific future. However,
by scanning the environment and by identifying, analysing and monitoring trends in a systemic and structured
way, we provide Associates with the ability to acquire foresight to determine how their futures could unfold.
While it is not possible to describe what will happen in the future, we can think about what might happen.
Exhibit 1.5 Megatrends and tectonic shifts
Megatrends
Individual empowerment Diffusion of power Demographic patterns Growing food, water and energy nexus
Poverty reduction Expanding global middle class Education and the gender gap
Role of communications technology Improving health
A more conflicted ideological landscape
The rise and fall of coun- tries: not the same old
story The limits of hard power
in the world of 2030
Widespread ageing Shrinking number of youthful countries
A new age of migration The world as urban
Food, water and climate
A brighter energy outlook
Tectonic shifts
Growth of the global middle
class
Wider access to lethal and
disruptive technologies
Definitive shift of economic power to the
East and South
Unprecedented and widespread
ageing
Urbanisation Food and water pres-
sures
US energy independence
Source: Compiled from NIC, 2012.

3 | P a g e
Chapter 2
The social environment
(BB Haldenwang, WP Esterhuizen, B Leonard & E van Vuuren)
The social environment is the underlying founda-
tion upon which other institutions, activities and
processes are built. It is the sphere in which the
most basic dimensions of human existence are ex-
pressed, ie, the need to learn, to interact, and to
make sense of the world. It is shaped by a variety
of processes and factors such as group behaviour,
developmental patterns and demographic change.
This chapter identifies and analyses, from a global,
African and South African perspective, a number
of important issues and trends regarding the social
environment and social groups, viz
Cultural pluralism is an enduring attribute of
contemporary societies and ethnicity will not
disappear with modernisation. There is a grow-
ing appreciation of the importance of cultural
freedom for human development.
Racism has become a global issue.
There is an increasing pressure towards lan-
guage homogeneity, with thousands of lan-
guages in decline or seriously at risk of becom-
ing extinct.
Research indicates a return to the prominence of
religion with a greater distinction between relig-
iosity and formalised religion. Religion is a
growing phenomenon and by 2050 it is estimat-
ed that China could reflect the world’s biggest
Christian as well as Muslim communities.
There is a re-emergence of social capital in the
well-being of societies and it is argued that reli-
gion-based social capital is probably more du-
rable than secular-based social capital.
The trend towards inter-religious and inter-
cultural dialogue, involving representatives of
both Christianity and Islam, is growing.
Seeds of decay in society can be found in the
weakening of the family as a living societal in-
stitution.
The family, as a social institution, is undergoing
rapid transformation, reflecting a movement
away from the marital state and thus the nuclear
family.
A balance sheet of global human development
reveals both gratifying progress and disappoint-
ing fragmentation, especially in sub-Saharan
Africa. The world continues to be characterised
by persistently large gaps in well-being, life ex-
pectancy and education that continue to divide
an increasingly interconnected world. Amidst
talk of an omnipotent globalisation and a small-
er, more comfortable world we face greater
fragmentation, poverty and even anger.
Although progress is being made, Africa (par-
ticularly sub-Saharan Africa) is unlikely to
achieve all the Millennium Development Goals
by 2015.
Figure 2.4: Schematic of social capital theory
Source: Adapted from Narayan & Cassidy, 2001.
Number of memberships
Contribution of money
Frequency of participation
Participation in decision-making
Membership heterogeneity
Source of group funding
Helpfulness of people
Trustworthiness of people
Fairness of people
How well people get along
Togetherness of people
Everyday sociability
Asking neighbour to care for sick child
Asking for help for yourself is sick
Trust of family
Trust of people in neighbourhood
Trust of people from other tribes/castes
Trust of business owners
Trust of government officials
Trust of judges/courts/police
Trust of government service providers
Trust of local government
Have you volunteered
Expectations of volunteering
Criticism for not volunteering
Fair contribution to neighbourhood
Have you helped someone
Generalised
norms
Togetherness
Everyday
sociability
Neighbourhood
connections
Volunteerism
Trust
Group
characteristics
So
cia
l c
ap
ita
l

List of Tables
4 | P a g e
Worldwide fertility rates are declining, resulting
in declining population growth rates, but the de-
cline is far slower in the less developed world,
particularly sub-Saharan Africa, than in the
more developed regions.
Stagnant population growth or even population
decline coupled with population ageing are ma-
jor challenges in more developed countries, es-
pecially Japan and Europe.
Although Africa will remain the youngest re-
gion in the world due to high fertility rates, it
will experience population ageing as well as in-
creasing numbers and proportions of persons of
working age – the so-called demographic divi-
dend, or window of opportunity for economic
development.
International migration is at an all-time high and
projected to continue increasing especially be-
tween less developed countries and from less
developed to more developed countries, leading
to a ‘brain drain’ in many African countries.
The numbers of refugees and internally dis-
placed persons are increasing.
Although HIV/AIDS epidemics are stabilising
in many countries, they will continue to change
the demographic future of many African coun-
tries (including South Africa) for years to come
by slowing population growth, declining life
expectancy and fertility, increasing mortality,
changing the age structure of populations and
leaving millions of AIDS orphans in their wake.
Rapid urbanisation and the growth of large cit-
ies (mega-cities) will continue, especially in less
developed countries, resulting in numerous ur-
ban problems, eg, poverty, insufficient housing,
unemployment, poor sanitation, pollution, ill-
health, inadequate health care, crime and
transport congestion.
Figure 2.7: Human Development Index values of African countries, 2012
Source: Compiled from UNDP, 2013a:144-147.
Figure 2.14: Population size and annual population
growth rates of more and less developed re-
gions, 1950-2050 (2012 UN medium-variant
projections)
Source: UN, 2013b.
Human Development
Index
< 0.390
0.390 – 0.460
0.461 – 0.555
> 0.55
No data
Table 2.9: Number and proportion of children (0-17 years) living with biological parents by province, 2010
Province Mothers only Both parents Fathers only Neither parent
Number % Number % Number % Number %
Eastern Cape 1 095 000 40.8 592 000 22.1 81 000 3.0 916 000 34.1
Free State 419 000 39.1 356 000 33.2 34 000 3.1 262 000 24.5
Gauteng 1 140 000 34.4 1 668 000 50.4 99 000 3.0 402 000 12.2
KwaZulu-Natal 1 726 000 40.5 1 100 000 25.8 199 000 4.7 1 238 000 29.0
Limpopo 1 049 000 46.4 571 000 25.3 32 000 1.4 607 000 26.9
Mpumalanga 612 000 41.9 430 000 29.5 58 000 4.0 359 000 24.6
North West 501 000 39.2 402 000 31.5 38 000 3.0 336 000 26.3
Northern Cape 177 000 41.1 134 000 31.1 12 000 2.9 107 000 24.9
Western Cape 564 000 31.9 958 000 54.1 61 000 3.5 187 000 10.6
South Africa 7 287 000 39.3 6 195 000 33.4 615 000 3.3 4 426 000 23.9
Source: Meintjies & Hall, 2012:83.

5 | P a g e
Africa is, and will continue to be, the least ur-
banised region in the world, but it is experienc-
ing the highest urban growth rates with the ur-
ban population expected to double in size be-
tween now and 2035.
Crime rates are rising in most parts of the
world, representing a pathology that could stunt
the development of society. Particular concerns
are organised crime (eg, drug and human traf-
ficking, fraud, money laundering and cyber-
crime), corruption and bribery and the sub-
optimum capacity to combat these.
Although the 20th century saw significant im-
provements in health, the world’s disadvantaged
continue to bear a disproportionately high bur-
den of disease, malnutrition and environment-
based health risks. Other health challenges in-
clude the re-emergence of some infectious dis-
eases such as malaria and tuberculosis, the
emergence of new infectious diseases, the con-
tinuous spread of HIV/AIDS, the rise of chronic
diseases, especially in developing countries, and
the global shortage of health care workers.
In Africa and other low-income countries where
the majority of deaths are still attributable to
communicable diseases, the situation is project-
ed to change rapidly as populations age and
lifestyles and diets change, resulting in increas-
ing numbers of people dying from chronic dis-
eases such as cancer and diabetes.
In spite of significant improvements in school
enrolment, the Education for All target will not
be reached by 2015, access to secondary educa-
tion remains limited, many children do not
complete secondary education, educator short-
ages are a serious problem and millions of
adults remain illiterate. Many jobs go unfilled
because people are not being educated for the
real needs of the future workplace. Workers re-
quire a higher quality education integrating
general knowledge in arts and science with new
technology.
Figure 2.16: Proportion of children and older people in the
world, 1950-2050 (2012 UN medium-variant pro-
jections)
Source: Compiled from UN, 2013b.

6 | P a g e
Chapter 3
The political environment
(P du Toit & A Sithole)
The euphoria of the democratic uprisings in 2010
and 2011, the so called Arab Spring, is now being
tempered by the reality of long drawn and at times
tumultuous transitions. Islamist-led governments in
Egypt, Libya and Tunisia have faced mass protests
and calls for their resignations, reminding them that
the support they enjoyed after the fall of the dema-
gogues was not support for the creation of Islamic
states. These protests have led to the removal of the
democratically elected leader, Mohammed Morsi,
in Egypt by the military. Morsi and his party are
accused of using democracy to gain power through
which they sought to impose an Islamic state. They
completely mistook the victory of the Islamist
Muslim Brotherhood party as a vote for an Islamic
state with dire consequences. This has led to deep
polarisation that has left Egyptian society split in
the middle between those who support and those
against Morsi and his government. The resultant
stalemate has provided a rationale for the military
to intervene. This risks a return to prolonged mili-
tary rule and endangers the future of democracy in
Egypt. The military is portrayed as the defender
and custodians of democracy. Morsi supporters
decry the violation of the constitution and removal
of a democratically elected government. Democra-
cy should be guaranteed by votes and democratic
institutions and not military force. The divisions,
instability, chaos and violence in Egypt are mir-
rored in the instability in Libya, Syria, Tunisia and
Yemen. Islamist insurgencies in Kenya, Libya, Ma-
li, Nigeria and other countries in the Sahel, as well
as the standoff between Sudan and South Sudan
continue. The quest for stability in Africa's Great
Lakes region continues. The rebel M23 guerrillas,
the Congolese Revolutionary Army, continue their
incursion into the Democratic Republic of the
Congo (DRC) with alleged support from Rwanda
and Uganda. The UN has warned that the Central
African Republic (CAR) could become a failed
state, threatening the region after the Seleka rebels,
seen as largely Muslim, led by Michel Djotodia,
seized power in March, but is yet to restore stabil-
ity and order. Fighting continues between Seleka
and the forces loyal to the ousted president.
The crisis in Syria has become a full-blown bloody
civil war that has claimed many lives and precipi-
tated a refugee crisis in the region. It is pitting the
USA and its allies such as France, the UK and Tur-
key who favour military action against the Syrian
regime of President Bashar al-Assad contrary to
Russia and China.
The state of geopolitical tensions continues to be
aggravated by the decline in international aid to
developing countries to help them fight the scourge
of poverty precipitated by the on-going global fi-
nancial crisis.
The Pittsburgh Summit of the G-20 underscored
the reality of the phenomenon of cooperative capi-
talism. The global financial crisis is blamed on the
interaction of the emergence of China as a global
economic power and the consumption patterns of
USA (and other western) consumers, especially
with regard to credit and its link to the sub-prime
lending phenomenon. Initiatives to contain the ad-
verse consequences of the financial crisis have seen
greater cooperation between the world’s major
economic and political centres. The crisis is a stark
reminder of the extent of the coupling of countries
and economies. Globalisation is indeed a mega-
trend of our time. It has at its core the opening of
markets on a global scale, which manifests itself in
an ever greater movement of people, information,
goods and capital across the globe. The defining
trends in this process entail the ever increasing
commodification and commercialisation of goods,
the development of global markets, and the instan-
taneous and simultaneous transmission of in-
formation that shapes ideas and decisions. Human
mobility is likely to be the final frontier of globali-
sation. Globalisation is also characterised by hyper-
capitalism. Hyper-capitalism is said to undermine
the state and national identity, and to generate new
social identities, and new knowledge structures.
For the world of business, it generates new con-
sumers, new markets, and new centres of produc-
tion.
The global world is one of non-stop social change,
even upheaval, with the major winners thus far be-
ing transnational business firms, crime syndicates
and religious movements. There are also indica-
tions that some of the world’s poor in the develop-

7 | P a g e
ing world, especially China and India, are benefi-
ciaries, while others in Africa and South America
are stagnating. Four major issues have emerged
from this mega- trend. The first one is the issue of
insecurity, of conflict driven by competition for
scarce energy resources, especially oil. This scarci-
ty is being significantly affected by current global
climate change. Insecurity is also being driven by
conflict between cultural groups, especially defined
in terms of religious differences, and by global mil-
itarisation, driven by the big five on the UN Securi-
ty Council. These conflicts manifest themselves in
war, terrorism and crime. The second issue is per-
sistent poverty and hunger even though the propor-
tion of people living on less than $2 a day has fall-
en from 43.1% in 1990 to 22.2% in 2008. The third
issue is the weakening of democracy. Elected lead-
ers in democracies have to deliver on their promis-
es to their voters, but they find that with their own
economies embedded in a global capitalist system,
crucial decisions about the welfare of their own
citizens lie beyond their own control. The final is-
sue is one of social cohesion. Global capitalism and
global conflicts destabilise societies, and destroy
the social fabric of communities, both crucial to the
long-term viability of democracies.
To secure the stability of the global political and
economic system, major policy choices are at
hand. Drastic changes in the use of fossil fuels are
needed; policies geared to prevent or combat
global climate change are needed; the marginali-
sation of those at the edges of the global economy
has to be ended; and forceful measures to combat
terrorism have to be combined with policies that
do not re-militarise the global system.
In complex societies small events can have large
destabilising consequences, which could impact
far away from their origin. Key countries that
could produce such impacts would arguably be
distinctive in terms of one or more of the follow-
ing aspects:
sites of vital resources; and/or
consumers of these resources;
producers of weapons of mass destruction;
vulnerable to environmental disasters; and
social cohesion, or the lack thereof.
Egypt, Syria, Mali, Iraq, Sudan, Iran and Afghani-
stan are the obvious current sites of conflict. The
most powerful members of the Security Council
are divided on the need to impose global sanctions
and/or authorise military action to resolve the Syri-
an conflict which borders on a civil war. Russia
and China have vetoed three Western-backed reso-
lutions aimed at pressuring the Syrian government
to stop the violence and start peace talks with its
opponents.
Future trends in conflict and conflict resolution will
also be shaped by a few key countries. These in-
clude the major powers of China, Russia, Japan,
and the USA. Smaller countries in key roles are
Israel, North Korea, Pakistan and Turkey. The role
of Russia is likely to grow, as it is anticipated that
Russia, along with China, could embark on estab-
lishing a new countervailing political and economic
group of states aiming to counter an American-
dominated global order. This new formation is like-
ly to be largely capitalist, but also undemocratic,
with dominant-party or one-party regimes. They
are also likely to be domestically unstable.
South Africa as a young democracy has to consoli-
date itself and develop within this volatile global
context. ‘Development’ in the 21st century, with its
global capitalist system in terms of the rules set by
Table 3.1: Anarchy’s anatomy: Failed states, 2010
Country (population, m) Failed states index, score
1)
Life expectancy (years)
Symptoms
Somalia (9.4) 114.3 51.5 Anarchy, civil war, piracy
Chad (11.5) 113.3 50.0 Desertification, destitution, meddling neighbours
Sudan (43.2) 111.8 59.8 Ethnic, religious strife, illiteracy, tyranny
Zimbabwe (12.6) 110.2 50.4 Economic collapse, kleptocracy, oppression
Congo (67.8) 109.9 48.8 Civil war, massacres, mass rape, looting
Afghanistan (29.1) 109.3 45.5 Civil war, drugs, no infrastructure, terrorism
Iraq (31.5) 107.3 70.2 Ruined infrastructure, sectarian strife, terrorism
Central African Republic (4.5) 106.4 48.6 Desertification, destitution, disease, terrorism
Guinea (10.3) 105.0 60.1 Destitution, drugs, kleptocracy
Pakistan (184.8) 102.5 68.0 Coups, drugs, illiteracy, terrorism
Haiti (10.2) 101.6 62.1 Deforestation, destitution, crime
Côte d’Ivoire (21.6) 101.2 59.6 Incipient civil war, post-election deadlock
Note: 1) Out of a potential 120, based on 12 indicators. Source: The Economist, 19-25 Mar 2011:53-54.

8 | P a g e
the Washington Consensus, means only one thing:
establishing an economy that is globally competi-
tive. Policy-makers in South Africa in search of a
guideline for building such an economy are drawn
to the examples of the so-called developmental
states of the late 20th century.
These rare examples (Japan, South Korea, Taiwan,
Singapore, Mauritius, Malaysia and Botswana) all
involved a set of close-knit elites who managed to
concentrate power in their hands, and to formulate
economic policy with the effect of maintaining
growth levels of 4% and above for more than two
decades.
However, many of the successful developmental
states have very poor track records with regard to
human rights, and very few grant freedom to civil
society. The world’s leading developmental state
today is China, very successful in producing
growth, but also very undemocratic. The fact that
the Chinese are achieving such growth without
submitting to the rules of the Washington Consen-
sus is one that inspires many African states, and
could also become influential in the debate on how
South Africa should develop.
There are even fewer democratic developmental
states. The kind of successful democratic develop-
mental state that South Africa will be able to build
will depend on how the country’s democracy con-
solidates. The achievement of meaningful growth
without compromising the democratic constitution
amidst the clamour by the majority of South Afri-
cans, especially the poor, for tangible benefits of
democracy, internal divisions within the ANC, the
global financial crisis, the uncertainties pertaining
to the Zimbabwean power-sharing accord, is likely
to be exceptionally difficult for the country to
achieve under President Jacob Zuma’s leadership.
One of the leading problems in the consolidation
of democracy in South Africa is embedded in the
problem of performance legitimacy faced by gov-
ernment. Even with very substantial success in
service delivery it has and will always fall short of
the virtually impossible promise of a ‘better life
for all’ – hence the imperative for more growth.
The leeway to move boldly is provided by the
huge electoral majorities of the ruling alliance up
to the 2014 election, their political legitimacy, and
their success in de-racialising both wealth and
poverty.
The challenge facing South Africa remains the
need to deepen democracy by establishing a culture
of participation by the broader society and effective
administration. To realise its ambition to be a de-
velopmental state, South Africa will need leader-
ship of an exceptional quality to manage the inher-
ent trade-offs between short-term sacrifice and
long-term gain by curtailing current avarice and
persuading the public to support leadership.
The role of local government at the provincial and
municipal level will be crucial in this regard.
The effectiveness and even usefulness of provincial
governments have been questioned by central gov-
ernment and the ANC. This could be a sign that the
ANC might consider reneging on its constitutional
compromise. Frustration with provincial govern-
ment is understandable in the light of the lack of
delivery, unresponsive bureaucracies and an inabil-
ity to implement national policy frameworks.
Exhibit 3.2
China’s top ten African trading partners in 2008
Top two-way trade partners of China in Africa
Top African exporters
to China
Top African importers
from China
Angola Angola South Africa
South Africa South Africa Nigeria
Sudan Sudan Egypt
Nigeria Rep of Congo Algeria
Egypt Libya Angola
Algeria Equatorial Guinea Morocco
Rep of Congo Gabon Benin
Libya DRC Sudan
Morocco Mauritania Ghana
Equatorial Guinea Algeria Libya
Top ten as overall percentage
78% 93% 74%
Source: African Progress Panel, 2009.

9 | P a g e
Local government will probably be an increasingly
important role player in future – both in the govern-
ing process in general and in the delivery of ser-
vices in particular. In principle, the 1996 constitu-
tion accords municipalities powers and functions
that equal those of provincial governments. How-
ever, to have any chance of achieving its potential
for service delivery, the creeping erosion of
knowledge, skills and expertise needs to be arrested.
For this, local government needs more resources.
In broad terms, government’s dilemma is to rec-
oncile two fundamental realities, viz
socio-economic reform (reconstruction and
development) is essential for the future pros-
perity and stability of the country; but
if governmental initiatives aimed at solving the
inequalities within South African society are
carried out in such a way that they affront and
demotivate highly skilled human capital, deter
entrepreneurs and investors, and overtax the
middle-class, then the country will inevitably
slip into reverse gear as far as economic per-
formance and stability are concerned.
Table 3.4: Land redistribution, April 1994 to June 2010
Category Size (ha) Percentage
Total area of SA 122 320 000 100
Former homelands 17 112 800 14.0 of total
Former white SA 105 267 300 86.1 of total
Commercial agriculture 86 186 026 70.5 of total
30% of commercial agriculture 25 855 808 21.1 of total
Redistributed land 3 186 000 3.7 of agriculture
Restituted land 2 174 000 2.5 of agriculture
Total transfer 5 900 000 6.8 of agriculture
Required rate (30% target Jan 2011-Dec 2015) 3 991 162ha/year 4.6 of agriculture
Average rate to date 368 750ha/year 0.4 of agriculture
Years to meet 30% target at current rate 70 years
Source: Jara, 2011.

10 | P a g e
Chapter 4
The technological environment
(MJ Butler)
To remain competitive, either at the leading edge
or as a follower, organisations need to pre-empt or
respond effectively to the rapid pace of technologi-
cal change in their environments. It is essential that
all decision-makers understand technology, integrate
technology strategy with business strategy, and ac-
tively manage technology in their organisations.
Technology is a key driver of change and has a
direct impact on the rapid pace and profound nature
of change experienced by organisations and indi-
viduals alike. Technology can be utilised in the
strategy of the organisation to a far greater extent
than other forces in the contextual environment,
and as such it is the change factor that is most re-
sponsive to creative management action, ie, in cre-
ating the future of the organisation. Technologies
tend to develop incrementally over time, and trends
and future developments can be readily identified
by the seasoned observer with far more certainty
than, for example, the economic effects of markets.
Managers of technology need to develop the organ-
isation into a technology learning system. A focus
on innovation is crucial for future success, both
organisational and national. Special attention to
new product (goods and services) development is
imperative to obtain and maintain a competitive
edge. At the national level, high levels of education
underpin the successful application of technology
and innovations, leading to wealth creation and a
higher quality of life.
The concept of ‘technology’ encompasses far more
than technological artefacts, which are but a pro-
duct of technology. ‘Technology’ encompasses the
creation of capabilities by means of the systematic
application of organised knowledge. It is only
meaningful in a particular organisational context, in
which skills exist to utilise artefacts, and in which
there is an infrastructure and a technological li-
teracy to support this activity.
The world is currently undergoing a high--
technology revolution. This technological trans-
formation, the fifth since the first Industrial Revo-
lution, is associated with socioeconomic shifts and
rapid changes in economic activity. It is driven by
five enabling technologies and slowed by an ena-
bling issue. The enabling technologies are those of
computer technology and its convergence with
communications technology, both of which are
underpinned by developments in materials technol-
ogy and energy technology; biotechnology, led by
dramatic advances in genetic engineering and pro-
teomics, is developing in the wings and, together
with nanotechnology (a subset of materials tech-
nology), is expected to become the dominant tech-
nology during the 21st century. Indeed, some ob-
servers believe that the convergence of bio-
technology with nanotechnology will result in more
extensive societal and economic changes than have
resulted from developments in computers and
communications. The enabling issue is environ-
mentalism, which is acting as a constraint in some
areas of technological development, and as a cata-
lyst in others.
The rates of change observed in technological per-
formance parameters are unlike any experienced by
past generations. The ability to access larger sets of
information quickly and to compute at high speed,
is transforming many aspects of organisational,
social and technological systems, and is a signifi-
cant contributor to economic development. Alt-
hough the Internet now reaches 2.3bn people, about
33% of the world’s population, there is a widening
digital divide. While cellular telephone networks
continue to show high growth rates, especially in
Africa, South Africa is no longer seen as Africa’s
telecommunications role model, as high telecom-
munication costs have constrained local Internet
user growth and mobile growth. Other African
countries have caught up on mobile penetration
rates.
Figure 4.11: Technology management
Source: Adapted from Durand et al, 2004:13.

11 | P a g e
Commercial plantings of genetically modified
(GM) crops, now more often called biotech crops,
have entered their second decade. The area of land
under biotech crops, such as biotech soybeans,
maize, canola and cotton continues to grow at a
linear rate. In just 16 years after commercialisation,
biotech crops exceeded 170m ha in 2011. A total
of 16.7m farmers in 29 countries now benefit from
the technology. With an unprecedented 94-fold
increase between 1996 and 2011, biotech crops are
the fastest-adopted crop technology in the history
of modern agriculture. South Africa remains one of
the leaders in this field, albeit with relative small
volumes when compared to the total picture. Va-
rious ethical considerations have come into play in
consumers’ acceptance of these products, particu-
larly with regard to food products, and this have
affected the development of this technology.
Figure 4.17: The growth of the Internet in number of
hosts, 1993-2012
Source: Internet Systems Consortium, 2013.
Exhibit 4.1 The five technological transformations
Technological trans-formation (& origin)
Associated techno-economic paradigms
First The Industrial Revolution
(Britain) 1770-1800
• Factory production • Mechanisation • Productive/time keeping and time saving • Fluidity of movement (as ideal for machines with water-power and for transport through canals and other waterways) • Local Networks
Second The Age of Steam and Rail-
ways (Britain, spreading to Europe and the USA)
1830-1850
• Economics of agglomeration/Industrial cities/National markets • Power centres with national networks • Scale as progress • Standard parts/machine-made machines • Energy where needed (steam) • Interdependent movement (of machines and of means of transport)
Third The Age of Steel, Electricity
and Heavy Engineering (USA and Germany overtake
Britain) 1860-1900
• Giant structures (steel) • Economies of scale of plant/vertical integration • Distributed power for industry (electricity) • Science as a productive force • Worldwide networks and empires (including cartels) • Universal standardisation • Cost accounting for control and efficiency • Great scale for world market power • ‘Small’ is successful, if local
Fourth The Age of Oil, Synthetics
and Mass Production (USA, spreading to Europe)
1930-1950
• Mass production/mass markets • Economies of scale (product and market volume)/horizontal integration • Standardisation of products • Energy intensity (oil based) • Synthetic materials • Functional specialisation/hierarchical pyramids • Centralisation/metropolitan centres, suburbanisation • National powers, world agreements and confrontations
Fifth The Age of Information and
Telecommunications (USA, spreading to Europe
and Asia) 1980-?
• Information-intensity (microelectronics-based ICT) • Decentralised integration/network structures • Knowledge as capital/intangible value added • Heterogeneity, diversity, adaptability • Segmentation of markets/proliferation of niches • Economies of scope and specialisation combined with scale • Globalisation/interaction between the global and the local • Inward and outward cooperation/clusters • Instant contact and action/instant global communications
Source: Perez, 2002:18.

12 | P a g e
The completion of the decoding of the complete
human genome, as well as the genomes of many
plants, animals and organisms has drawn attention
to the emerging technology of proteomics, the aim
of which is to decipher the function and purpose of
the proteins produced by genes, and then to use this
information to improve the quality of life or to
make more effective biotechnological products.
Biomedicine has set itself ‘audacious’ goals for the
next decade, which include understanding the func-
tions of the complete human genome, and unravel-
ling all the genetic mechanisms which cause can-
cer.
Materials science continues to produce a variety of
new materials with new properties and new appli-
cations, which are finding commercial application
in information technologies and biotechnologies.
Nanotechnology is being significantly stimulated
by industrialised nations as an investment for a ma-
jor future industry. Indeed, there is now the pro-
spect of combining this with biotechnology into
nanobiotechnology which has the potential of being
able to create materials and devices that do not ex-
ist in nature, but are modelled on biological princi-
ples.
As the world continues to rely on non-renewable
polluting energy sources such as coal, gas and oil,
energy technologies are focussing on environmen-
tally sound and energy efficient methods of utilis-
ing these resources. Increasing environmental pres-
sure ensures renewed focus and investments to
commercialise renewable energy sources. Although
solar, geothermal, wind and other renewable ener-
gy sources are showing significant growth rates,
they deliver but a small proportion of the world’s
power requirements. Progress is being made in the
development of fuel cells which convert hydrogen
or oxygen directly to electricity. Growth in nuclear
energy is being re-stimulated by power shortages
and new indications that it might not be as envi-
ronmentally unfriendly when compared to fossil
fuels. This is in spite of a year in which the dangers
of nuclear energy have been in the public eye after
the tsunami in Japan and subsequent nuclear leak-
ages.
Environmental and legislative pressures for more
energy efficient motor vehicles are driving
transport technologies, with hybrid electric vehicles
showing great promise. The past year has seen the
international launch of hybrid and electrical vehi-
cles from major manufacturers. No less than three
new hybrid models have been launched on the lo-
cal market, indicating a definite movement up-
wards on the technology growth curve. Although
the internal combustion engine seems set to domi-
nate vehicular transport for at least the next decade
due to developments that is making it ever more
fuel efficient and therefore better from an environ-
mental perspective, the first true competitors are
appearing on the horizon. The fastest growing
transport sector is that of mass high speed trans-
port, which comprises aircraft, ships and trains and
the introduction of Boeing’s 787 Dreamliner – a
significant milestone in aviation history. One of the
more unconventional suggestions seen in 2013 was
Figure 4.18: Telephone penetration in Africa per 100 peo-ple, 2007-2013
Source: ITU, 2013.
Figure 4.20: Global plantings of genetically modified
crops, 1995-2012 and trend
Source: James, 2012.
Figure 4.21: Worldwide spending on nanotechnology,
2004-2010
Source: Scientifica, 2009.
0
20
40
60
80
100
120
2007 2008 2009 2010 2011 2012 2013
Mil
lio
ns
Fixed-line cumulative investments Mobile cumulative investments
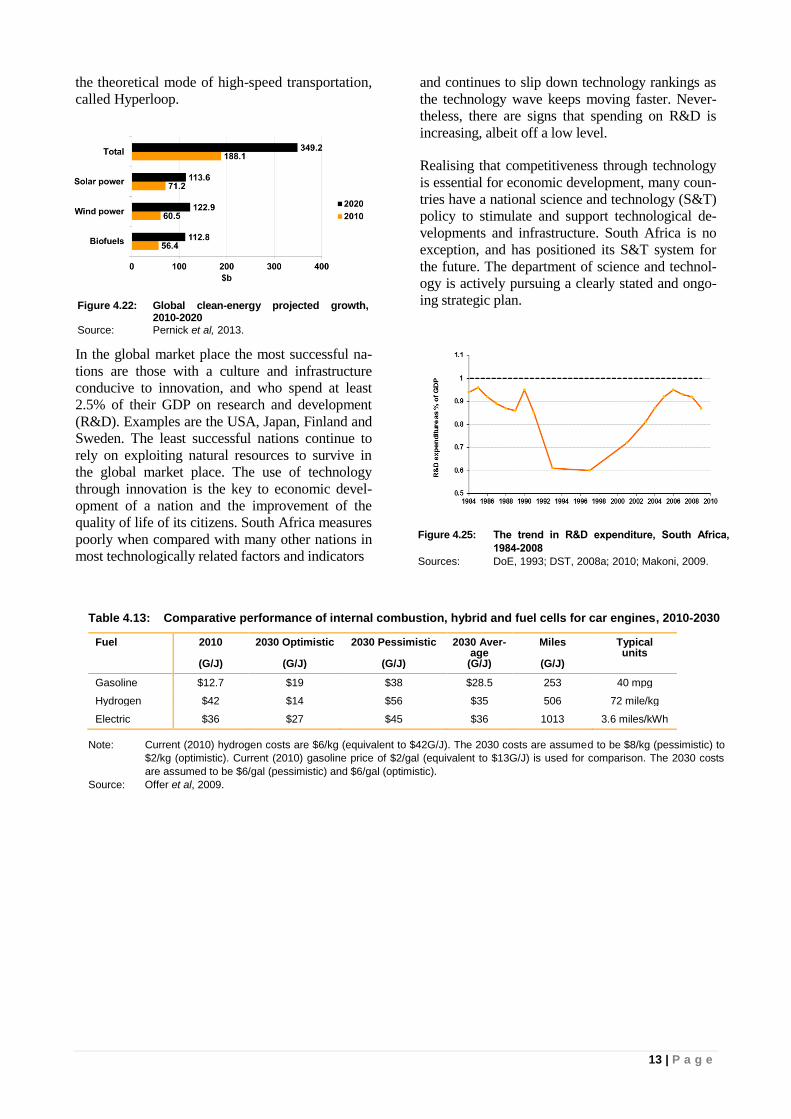
13 | P a g e
the theoretical mode of high-speed transportation,
called Hyperloop.
In the global market place the most successful na-
tions are those with a culture and infrastructure
conducive to innovation, and who spend at least
2.5% of their GDP on research and development
(R&D). Examples are the USA, Japan, Finland and
Sweden. The least successful nations continue to
rely on exploiting natural resources to survive in
the global market place. The use of technology
through innovation is the key to economic devel-
opment of a nation and the improvement of the
quality of life of its citizens. South Africa measures
poorly when compared with many other nations in
most technologically related factors and indicators
and continues to slip down technology rankings as
the technology wave keeps moving faster. Never-
theless, there are signs that spending on R&D is
increasing, albeit off a low level.
Realising that competitiveness through technology
is essential for economic development, many coun-
tries have a national science and technology (S&T)
policy to stimulate and support technological de-
velopments and infrastructure. South Africa is no
exception, and has positioned its S&T system for
the future. The department of science and technol-
ogy is actively pursuing a clearly stated and ongo-
ing strategic plan.
Figure 4.22: Global clean-energy projected growth, 2010-2020
Source: Pernick et al, 2013.
Figure 4.25: The trend in R&D expenditure, South Africa,
1984-2008
Sources: DoE, 1993; DST, 2008a; 2010; Makoni, 2009.
Table 4.13: Comparative performance of internal combustion, hybrid and fuel cells for car engines, 2010-2030
Fuel 2010
(G/J)
2030 Optimistic
(G/J)
2030 Pessimistic
(G/J)
2030 Aver-age
(G/J)
Miles
(G/J)
Typical units
Gasoline $12.7 $19 $38 $28.5 253 40 mpg
Hydrogen $42 $14 $56 $35 506 72 mile/kg
Electric $36 $27 $45 $36 1013 3.6 miles/kWh
Note: Current (2010) hydrogen costs are $6/kg (equivalent to $42G/J). The 2030 costs are assumed to be $8/kg (pessimistic) to
$2/kg (optimistic). Current (2010) gasoline price of $2/gal (equivalent to $13G/J) is used for comparison. The 2030 costs
are assumed to be $6/gal (pessimistic) and $6/gal (optimistic).
Source: Offer et al, 2009.

14 | P a g e
Chapter 5
The natural environment
(J du Toit, BB Haldenwang, A Chapman, A Roux & PH Spies)
The earth is a fragile resource that has to be man-
aged with better quality stewardship than in the
past, but at the same time it is a physically large
resource with enormous potential. Chapter 5 de-
scribes changes and trends occurring within the
natural environment. The most important factors
influencing the state of the natural environment
are rapidly growing human populations and urbani-
sation, increasing economic development, higher
income and consumption patterns, emerging global
markets, and technological, political and climate
change.
In terms of land resources there are five major
global challenges that have to be faced: a) the
availability of land for future agriculture; b) the
global impact of climate change; c) trends in food
production and expectations over the coming dec-
ade; d) global patterns of poverty and hunger; and
e) the prospects for Africa. There has been a
steady increase in the available arable land global-
ly over the past three centuries, to the extent that
1.8bn hectares, or about 14% of the total land area
of the world, are now used for crop farming. Most
projections of global agricultural output assume
that the demand for food will be met, although
regional and local shortages are likely to persist.
Currently, however, approximately 1 in every 7
people in the world faces daily hunger. The major-
ity of undernourished people (98%) live in devel-
oping countries, primarily in Asian and sub-
Saharan countries.
The world is facing a serious freshwater crisis.
Supplies of fresh water are finite and dispropor-
tionately distributed. Demand continues to increase
as populations grow and consumption per capita
increases in proportion to wealth creation. Water
contamination and the competition for freshwater is
increasing, while regional drought frequency is
also increasing. Water could be the resource that
will define the limits of sustainable development:
there is no substitute for most of its uses and it is
expensive to transport.
Climate change is a major global issue of concern
in the 21st century. We are increasingly being ex-
posed to extreme weather, which has consequences
for safety and health. The Fourth Assessment Re-
port by the Intergovernmental Panel on Climate
Change (IPCC, 2007) makes unequivocal state-
ments about the unfolding change in climate which
is prompting many organisations to take stock of
their vulnerability, and to plan activities which
could mitigate the impacts of climate change. The
Fifth Assessment Report due in 2014 will add ur-
Table 5.1: Global land availability by selected countries and territory, 2011
Country/Territory Thousand hectares % of total Cumulative % of total
Russian Federation 1 637 687 12.6 12.6
Antarctica 1 400 000 10.8 23.4
China 932 749 7.2 30.6
USA 914 742 7.0 37.6
Canada 909 351 7.0 44.6
Brazil 845 942 6.5 51.1
Australia 768 230 5.9 57.0
India 297 319 2.3 59.3
Argentina 273 669 2.1 61.4
Kazakhstan 269 970 2.1 63.5
South Africa 121 309 0.9 64.4
Rest of the world 4 632 452 35.6 100.0
Total 13 003 420 100.0 100.0
Source: FAOSTAT, 2013.
Table 5.13: The Global Hunger Index, 1990 and 2012
Region 1990 2012
Sub-Saharan Africa 24.6 20.7
South Asia 30.3 22.5
Southeast Asia 14.5 7.9
Near East and North Africa 8.2 5.3
Latin America and the Caribbean 8.8 4.9
World 19.8 14.7
Source: IFPRI, 2012:11.

15 | P a g e
gency to the need for appropriate responses as
more evidence of the mounting impacts accumu-
lates. The politics of climate change are becoming
increasingly complex as the costs of mitigation and
adaptation are negotiated, allocated or denied.
Observable changes in the environment supply ear-
ly proof of global climate change: rising tempera-
tures, the thinning of the Arctic ice sheet, sea level
rise, increased cloud cover, etc. As the world’s
poorest, most agriculturally-dependent continent
Africa is the region most vulnerable to global cli-
mate change. Effects will include declining food
security, more frequent droughts and loss of soil
fertility, impacts on human health, loss of power
generating capacity (a large component of power
generation is delivered through hydropower), and
damage to infrastructure by extreme events.
The ecosystem services provided by the world’s
oceans vary from supporting the multi-billion dol-
lar seafood and coastal tourism industries to the
natural sequestration of carbon, being a source of
raw material inputs, enabling certain production
processes and providing climate stability. Howev-
er, signs of over-fishing, coastal pollution and dead
zones, bottom trawling, invasive species infesta-
tions and other environmentally-damaging activi-
ties are evident. Fortunately global fish production
has kept pace with rapid population growth and
increasing consumption, primarily as a result of
rapid growth in aquaculture production. South Af-
Figure 5.15: Freshwater stress and scarcity in Africa,
2025
Sources: Calculated from WRI, 2005a; 2005b:176-177.
Morocco
AlgeriaLibya
Tunisia
Ghana
Burkina
Faso
Niger
Nigeria
Egypt
Eritrea
Ethiopia
Djibouti
Somalia
KenyaUganda
Rwanda
Burundi
Tanzania
Malawi
Zimbabwe
South Africa
Water scarcity in 2025
less than 1 000m3/capita/year
Water stress in 2025
1 000 to 1 700m3/capita/year
Table 5.52: Global greenhouse gas emissions by sector
Sector % of total
Power and heat generation 24.7
Transportation 11.6
Manufacturing and construction1) 10.4
Other fuel combustion 8.8
Fugitive/escaped emissions 3.9
International bunkers 2.0
Land-use and forestry2) 18.3
Agriculture 13.5
Waste 3.5
Industrial processes 3.4
Notes: 1) Includes cement production, which is a significant
CO2 emitter.
2) Includes deforestation.
Source: IPCC, 2007.
Exhibit 5.18 A summary of measurement of changes in the earth’s temperature
Type of data Direction of 20th
century change Size of change, comments
Direct surface air temper-ature
Warming Average surface air temperature increased approximately 0.6°C over
the 20th
century, with about half the warming occurring between 1980 and 2000.
Glaciers Warming Glaciers have been receding on average for a few centuries, with evi-dence of faster retreat in the 20
th century. The warming implied by this
recession is about two-thirds of a degree Celsius per century, con-sistent with the surface record.
Sea-level change Warming Sea level rose about 15cm in total over the 20th
century, with approxi-mately half of this coming from the expansion of ocean water as it warmed.
Sea ice Warming The area of Arctic sea ice in spring and summer has decreased by 10-15% over the past 50 years. Average thickness of Arctic sea ice has decreased by 40% over the same period.
Ocean temperature Warming The top 300m of the ocean has warmed by 0.18°C over the past 50
years.
Climate proxies1) Warming Combined data from many climate proxies shows gradual Northern
Hemisphere cooling from the year 1000 to the 19th
century, then strong warming during the 20
th century.
Satellite temperature measurements
Warming Satellite instruments show warming of 0.06-0.26°C per decade.
Note: 1) A ‘proxy’ climate record shows past climate variation that has been imprinted on a long-lived physical, chemical or biological system, eg, tree rings, ice cores and corals.
Source: Dessler & Parson, 2006:65.

16 | P a g e
rica is still in the developing phase of aquaculture,
which has great potential for job creation and food
security.
The continued sluggishness of the economic
growth recovery in the advanced economies, cou-
pled to rising nervousness about growth prospects
in China, have raised the level of uncertainty about
future metals and minerals prices, with long-term
forecasts suggesting a significant decline in real
prices. South Africa has significant mineral poten-
tial, well developed capital markets, world class
financial services, a well-developed and capable
mining sector, good support services, and well-
developed supplier markets and infrastructure.
However, it is faced with some challenges in the
regulatory framework, institutional capacity, infra-
structure constraints, human capital constraints, a
volatile exchange rate and a perceived weak social
licence to operate.
The two key drivers of growth in energy consump-
tion are population growth and income. The BP
Energy Outlook 2030 sees energy efficiency im-
proving over the next two decades, driven by cur-
rent high prices for energy and global integration.
The energy sector remains the main contributor to
carbon emissions, and especially companies that
rely heavily on electricity are preparing for a re-
source-constrained world and show a shift in com-
pany strategy to prepare for a low-carbon economy
and new business opportunities.
Globally, the state of biodiversity is declining; the
pressures upon it are increasing; and the benefits
derived by humans from biodiversity are diminish-
ing. However, the responses to address its loss are
increasing. Even with modest projections for popu-
lation growth, consumption and climate change,
humanity will be using resources and land at the
rate of two planets each year by 2033, and just over
2.6 planets each year by 2050. The African conti-
nent is rich in biodiversity, but biological diversity
is declining with climate change the main future
threat for biodiversity and ecosystems. While
South Africa is one of the most biologically diverse
countries in the world, the state of its biodiversity
and ecosystems is deteriorating as a result of in-
creasing human-induced pressures and climate
change.
The health of over one billion people around the
globe is estimated to be compromised by exposure
to the pollution of air, water and soil. Pollution also
Figure 5.22: Aquaculture production (including aquatic plants) in South Africa, 1990-2011
Source: FAO, 2013e.
Commodity prices
Emerging market economic and market conditions
Figure 5.23: Commodity prices and emerging market economic activity, 2000-2013
Source: IMF, 2013:26.
0
2000
4000
6000
8000
10000
12000
14000
2002
2003
2004
2005
2006
20
07
2008
2009
20
10
2011
2012
Mil
lio
n t
on
nes o
f o
il
eq
uiv
ale
nt
Oil
Natural gas
Nuclear
Hydro
Coal
Figure 5.27: World primary energy consumption, 2002-2012
Note: Time series not available for renewables, for 2012.
Source: BP, 2013b:40
Table 5.34: Top 10 countries with technically recoverable shale gas resources
Rank Country Shale gas (trillion cubic feet)
1 China 1 115
2 Argentina 802
3 Algeria 707
4 USA1) 665 (1 161)
5 Canada 573
6 Mexico 545
7 Australia 437
8 South Africa 390
9 Russia 285
10 Brazil 245
World total 7 299 (7 795)
Note: 1) EIA estimates used for ranking order. ARI (Advanced Resource International) estimates in brackets.
Source: EIA, 2013g.

17 | P a g e
Figure 5.60: Four scenarios of South Africa’s future environment Source: DEAT, 2006.
makes the lives of millions of people markedly
more difficult through chronic illness, neurological
damage and a shortened lifespan. The impacts of
pollution are disproportionately large in developing
countries, among marginalised communities and
children. Companies, driven by more stringent
waste management and pollution regulations, visi-
ble public pressure, but also a growing awareness
that better environmental performance can be prof-
itable, are becoming more aware of the advantages
of reducing their impacts on the environment. By
increasing the efficiency of their resource use and
through the use of new technologies, redesigned
products, reconfigured processes and new man-
agement practices, some companies are already
ahead in the race to reduce their waste stream and
become more sustainable.
From the above it is clear that the world is on an
unsustainable course. Deterioration in most of the
world’s natural resources is becoming more evident
and critical thresholds, in many cases, are being ap-
proached. As mentioned in the opening paragraph,
the drivers behind environmental change are rapid-
ly growing human populations and urbanisation,
increasing economic development, higher income
and consumption patterns, emerging global mar-
kets, and technological, political and climate
change. These are the leverage points that need to
be managed.
The final section of this chapter commences with
global environmental scenarios, ie, what could the
environment look like in 2050? This is followed
two different sets of scenarios: one for Africa and
the other for South Africa. The possible scenario
assumptions and choices are described, together
with the projected consequences for elements of
the natural environment, and for linked social and
economic systems.
Figure 5.43: Africa’s total Ecological Footprint and bio-
capacity, 1961-2008
Sources: Global Footprint Network, 2009:10; WWF,
2010:44; WWF & African Development Bank,
2012.
Figure 5.52: Global premature deaths from selected envi-ronmental risks: Baseline scenario, 2010-2050
Note: *Child mortality only. Source: OECD, 2012:5.
Strong economy and technology
Weak economy and technology
Weak ineffective environmental governance
Strong effective environmental governance
Tata Ma Chance
• Widespread institutional failure
• Abuse of resources by powerful multinationals
• Increasing socio-economic disparities and conflicts
• Widespread environmental degradation
Laduma!
• Sustainable development
• Self-governing & self-regulating environmental governance
• Full cost accounting
• Rapid social development
• Improved ecosystem services
Skorokoro
• Widespread non-compliance – the ‘tragedy of the
commons’
• Gradually increasing inequities and environmental
degradation
• Widespread economic decline
• Eventual collapse of ecosystem services
Going Nowhere Slowly!
• Increasing reliance on aid/donors to support environmental
management
• Eventual increase in disparities
•Gradual decline in environment
• Partial and local solutions

18 | P a g e
Chapter 6
The economic environment
(A Roux)
Continued (and renewed) concerns about growth
prospects for the global economy, coupled to un-
sustainably high levels of government debt, in
especially Europe, have highlighted the fact that
we now operate in a new, fast-evolving multipolar
world economy, in which global challenges are
intensifying and the way to address these issues is
shifting. Economic and political tectonic plates
are shifting, bringing new realities and new op-
portunities.
The world will look very different in ten years’
time, with demand coming not just from the USA
but from around the globe. Indeed, the developing
world is fast becoming a driver of the global
economy. More than 70% of the recovery in
world trade since the second half of 2008 has been
due to strong demand for imports among develop-
ing countries. We are also witnessing a move to-
wards multiple poles of growth as middle classes
in developing countries grow and billions of peo-
ple join the world economy. In sub-Saharan Afri-
ca economic growth could average 5% or more up
to 2015 while South Asia, where half the world’s
poor live, could grow by as much as 6% a year
over the same period.
These shifts open new opportunities. For instance,
China is moving up the value chain, and is in-
creasing wages and consumption. Increased in-
come and growth in the developing world also
means that developing economies can exert more
influence on global affairs.
If it is no longer possible to solve serious interna-
tional issues without the involvement of develop-
ing and transition countries, it is also no longer
possible to presume that their most prominent
members, the so-called BRICS – Brazil, Russia,
India, China and South Africa – will represent all.
Higher growth rates in sub-Saharan Africa raise
the possibility of the dawning of a new age of
poverty alleviation and human development, alt-
hough this hope could be dashed if countries fail
to diversify their economic activity and/or contin-
ue to be guilty of rent-seeking behaviour.
In an African and particularly a sub-Saharan Afri-
can context, the South African economy is a pow-
erhouse. South Africa’s future role in the sub-
continent will therefore play a key role in regional
upliftment and prosperity. By the same token, in-
stability in certain parts of the region will have a
2009: 525m2030: 3 228m
2009: 338m2030: 322m
2009: 664m2030: 680m
2009: 137m2030: 341m
2009: 181m2030: 313m
Table 6.7: Projections for GDP and GDP per capita, 2000-2050
Year India China Brazil Russia G6
GDP GDP per capita
GDP GDP per capita
GDP GDP per capita
GDP GDP per capita
GDP GDP per capita
2000 469 468 1 078 854 762 4 338 391 2 675 19 702 34 797
2005 604 559 1 724 1 324 468 2 512 534 3 718 22 548 39 552
2010 929 804 2 998 2 233 668 3 417 847 5 948 24 919 42 926
2020 2 104 1 622 7 070 4 965 1 333 6 302 1 741 12 527 29 928 48 849
2030 4 935 3 473 14 312 9 809 2 189 9 823 2 980 22 427 35 927 57 263
2040 12 367 8 124 26 439 18 209 3 740 16 370 4 467 35 314 44 072 69 431
2050 27 803 17 366 44 453 31 357 6 074 26 592 5 870 49 646 54 433 83 710
Source: Adapted from Goldman Sachs, 2003:8-9.
Figure 6.4: Global middle class: Daily expenditure $10-$100 per day per person, 2009 and 2030
Source: Oxford Martin School, 2013.

19 | P a g e
contagion-like effect on South Africa as foreign
investors might fear similar problems here. It is as
important to point out that economic growth in
South Africa is underperforming in comparison
with the rate being recorded in the rest of sub-
Saharan Africa.
While South Africa weathered the financial crisis
better than most, the recovery in the domestic
economy is tepid, and the short-term prospects are
uninspiring. Major challenges lie ahead; not least
of which to finance a variety of financial and fis-
cal deficits, and reduce unemployment, poverty
and inequality (probably through higher economic
growth). This, in turn, requires fiscal and mone-
tary policies that will sustain the ongoing recovery
while, over time, gradually tightening.
Monetary policy (guided inter alia by inflation
targeting) has served South Africa well and the
South African Reserve Bank’s (SARB’s) interest
rate cuts have moderated the impact of the reces-
sion. Inflation prospects over the next few years
are largely a function of domestic spending and
the concomitant monetary and fiscal policy stance,
as well as international developments regarding
energy and food prices.
In the longer term, given the highly volatile nature
of foreign capital flows, a moderate depreciation
Figure 6.23: Government revenue, expenditure, and defi-cit/surplus as % of GDP (fiscal years), 1960-2012
Source: Computed from SARB historical series.
Figure 6.11: GDP and GDE, 1980-2012
Note: 1) GDP less GDE as % of GDP.
Source: Computed from SARB historical series.
Table 6.11: Top three exports for selected African countries, 2010
Country First Second Third Top three combined
share of total exports (%)
Product Share of total exports (%)
Product Share of total exports
(%)
Product Share of total exports
(%)
Sub-Saharan Africa
Angola Petroleum oils 97.3 - - - - 97.3
Botswana Diamonds non-industrial un-
worked
49.7 Nickel mattes 21.9 Diamonds non-
industrial nes excl
mounted or set
8.9 80.5
Eq Guinea Petroleum oils 78.0 Natural gas 14.7 - - 92.7
Ghana Cocoa beans 46.4 Cocoa paste 7.2 Manganese ores
5.7 59.3
Malawi Tobacco 53.0 Black tea 6.9 Natural uranium
6.8 66.7
Namibia Natural uranium 26.8 Diamonds non-industrial
unworked
16.1 Unwrought zinc
13.4 56.3
Nigeria Petroleum oils 85.9 Natural gas 6.9 - - 92.8
South Afri-ca
Platinum un-wrought or in powder form
7.6 Gold 6.9 - - 14.5
North Africa
Algeria Petroleum oils 45.0 Natural gas (gaseous)
20.0 Natural gas (liquefied)
8.7 73.7
Libya Petroleum oils 86.6 Natural gas (gaseous)
6.9 - - 93.5
Source: Compiled from World Bank, 2013:72-73.
-10
-5
0
5
10
15
20
25
30
35
19
60
19
62
19
64
19
66
19
68
19
70
19
72
19
74
19
76
19
78
19
80
19
82
19
84
19
86
19
88
19
90
19
92
19
94
19
96
19
98
20
00
20
02
20
04
20
06
20
08
20
10
20
12
National government deficit/surplus
National government expenditure
National government revenue

20 | P a g e
in the international value of the rand would not
surprise. In fact, this is essential for the main-
tenance of international competitiveness.
The major socio-economic challenges facing
South Africa over the next few years are to grow
the first economy by redistributing wealth in an
orderly and disciplined fashion through a policy
and budgetary framework and to match supply
(production) with robust demand, so as to avoid
undue and unsustainable pressure on prices, inter-
est rates, the balance of payments, and the ex-
change rate. The success of economic policy will
be measured against its ability to meet these chal-
lenges.
Ultimately, South Africa requires a sustained eco-
nomic growth rate of at least 6% per annum. The
achievement of this target is a function of many
variables, not least of which a far more competi-
tive environment and a significantly higher level
of fixed investment. In this regard, labour and in-
frastructure constraints are worrying, while ques-
tions can be raised about the efficiency of gov-
ernment spending. Governance and leadership
reform and efficiency will be decisive in this re-
gard.
Figure 6.29: Exports and imports of goods and services and current account balance as % of GDP, 1960-2012
Sources: Computed from SARB historical series.
Figure 6.31: Gross fixed capital formation and gross savings as % of GDP, 1960-2012
Sources: Computed from SARB historical series.
Figure 6.47: Effective exchange rate of the rand, normal and real, 2000-2012
Sources: Composed from SARB, online dataset.
0
5
10
15
20
25
30
35
40
1960
1962
1964
1966
19
68
1970
1972
1974
1976
1978
1980
19
82
1984
1986
1988
1990
1992
1994
1996
1998
2000
20
02
2004
2006
2008
2010
2012
Gross fixed capital formation Gross savings
-10
-5
0
5
10
15
20
25
30
19
80
/01
198
1/0
2
198
2/0
3
198
3/0
4
198
4/0
5
198
5/0
6
198
6/0
7
19
87
/08
198
8/0
9
198
9/1
0
199
0/1
1
199
1/1
2
199
3/0
1
199
4/0
2
199
5/0
3
199
6/0
4
199
7/0
5
199
8/0
6
199
9/0
7
200
0/0
8
200
1/0
9
200
2/1
0
20
03
/11
200
4/1
2
200
6/0
1
200
7/0
2
200
8/0
3
200
9/0
4
201
0/0
5
20
11
/06
201
2/0
7
Real prime Prime lending rate CPI inflation
Figure 6.64: CPI inflation, normal and real prime lend-ing rate, 1980-2012
Source: Computed from The Presidency, 2013.
Table 6.38: South Africa’s global competitiveness rankings by sub-index and pillar, 2013/ 2014
Sub-index/pillar Rank
Basic requirements 95
- institutions 41
- infrastructure 66
- macro-economic environment 95
- health & primary education 135
Efficiency enhancers 34
- higher education & training 89
- goods market efficiency 28
- labour market efficiency 116
- financial market development 3
- technological readiness 62
- market size 25
Innovation & sophistication factors 37
- business sophistication 35
- innovation 39
Source: Compiled from WEF, 2013:346.
60
70
80
90
100
110
120
20
00
2001
2002
2003
2004
2005
2006
2007
20
08
2009
2010
2011
2012
Nominal Real

21 | P a g e
Chapter 7
Sustainable development
(J du Toit, T Hichert & A Roux)
Business Futures endeavours to provide Associates
with knowledge of, and insight into, trends and
developments that are shaping the future. It also
undertakes – by providing the relevant information
– to assist Associates in redirecting and transform-
ing their organisations in a purposeful, directed and
practical fashion towards a desired future. The pub-
lication can serve as an early-warning system about
trends that are unsustainable or trend breaks that
have dangerous implications. It is in this sense that
the concept of sustainable development is crucially
important – and this chapter elaborates on the un-
derlying principles of sustainable development.
The definition of sustainable development has
evolved over time, both in meaning and in focus,
and it will continue to evolve as human values,
market structures and technology change. Sustain-
able development is interpreted differently by dif-
ferent stakeholders (with different interests), over
different time horizons. It involves the interface of
economic, environmental and social development.
A very accessible way to comprehend the concept
of sustainable development is to review a Sustain-
able Development Timeline as it contains high-
lights, key meetings, environmental events, publi-
cations and other milestones that have contributed
to the evolution of the concept since 1962. The
most significant recent sustainable development
‘event’ and dialogue was the global Earth Summit
2012 held in Rio de Janeiro.
The concept of sustainable development is closely
related to, and enhanced by, the notions of resili-
ence, adaptability and transformability in social-
ecological systems (SESs). This is due to the in-
creasing focus on vulnerability, risk and robustness
of SESs that are deemed to be ‘unsustainable’, to-
gether with the emergent interdisciplinary studies
around tipping points, non-linear stability, bubbles,
complexity, collapse theory and panarchy. Accord-
ing to systemic principles, there are specific char-
acteristics of unsustainable systems behaviour and
some of the worrying signs of systems under stress
are discussed. Unsustainable patterns identified by
the IFR (as described in the preceding chapters of
this publication) as well as the nine planetary
boundaries are listed, and the High-Level Panel on
Global Sustainability (GSP) is discussed.
South Africa’s National Framework for Sustainable
Development (NFSD) is discussed within an inter-
national context (adherence to the United Nations’
Agenda 21), with a report on the country’s state of
the environment measures.
Sixty-three of the world’s 100 largest economic en-
tities are corporations, not countries, and as Wer-
bach (2009) states: ‘Great power creates great ex-
pectations – society increasingly holds global busi-
nesses accountable as the only institutions strong
enough to meet the huge long-term challenges fac-
ing our planet’.
According to the World Business Council for Sus-
tainable Development (WBCSD) societal percep-
tions of the role of business have shifted markedly
in the last two decades. While the core function of
business remains innovation, technology develop-
ment, capital investment and the implementation of
sound management capability for wealth creation,
business is increasingly being looked upon as a
creator of solutions to global problems.
WBCSD’s Tomorrow’s Leaders Group identifies
the four major ‘big issues’ in sustainability (pov-
erty, the environment, population change and glob-
alisation) and cites examples of how companies are
addressing these issues. The WBCSD’s objectives
Exhibit 7.1
Core challenges of sustainable development
What is to be sustained? What is to be developed?
Nature
Earth Biodiversity Ecosystems
People
Child survival Life expectancy Education Equity Equal opportunity
Life support Ecosystem services Resources Environment
Economy Wealth Productive sectors Consumption
Community
Cultures Groups Places
Society
Institutions Social capital States Regions
Source: Kates et al, 2005:11.

22 | P a g e
are listed as are those of its partner organisation in
South Africa, the National Business Initiative (NBI).
Reporting on sustainability has clear advantages for
companies. Trends in sustainability reporting, and
institutions dealing with the issue are covered.
A section on strategy and innovation discusses the
conviction held by some business executives that
caring for the environment and social responsibility
will erode their companies’ competitiveness, and
lists why integrating sustainability into business
objectives is so challenging. Research, however,
shows that sustainability is a major source of or-
ganisational and technological innovation.
Doing business in a sustainable manner and bene-
fitting from the opportunities this offers does not
happen overnight – it is a strategic process that
companies have to go through and the five stages
on the path to becoming sustainable are illustrated.
Four competitive environmental strategies are dis-
cussed, and recommendations for business to turn
sustainability principles into practice are offered.
The last section deals with the need for, and means
towards, reaching a new sustainability paradigm
that can bring about a more sustainable world. The
report, Vision 2050: The new agenda for business
(WBCSD, 2010a) addresses three questions: What
does a sustainable world look like? How can we
realise it? What are the roles business can play in
ensuring more rapid progress toward that world?
Today companies recognise that they are actors in
large, complex systems and need to interact in a
web of relationships with a host of different stake-
holders. Leadership is now about balancing com-
peting demands and engaging people in collective
goals.
Corporate
social responsibility
(CSR)
Cause
related marketing
(CRM)
Socially
responsibility investment
(SRI)
Corporate
social investment
(CSI)
Corporate citizenship
(CC)
Corporate governance (CG)
Table 7.2: Sustainability challenges, competencies and opportunities
Stage 1
Viewing compliance as oppor-
tunity
Stage 2
Making value chains
sustainable
Stage 3
Designing sustainable prod-
ucts and services
Stage 4
Developing new business
models
Central challenge
To ensure that compliance with
norms becomes an opportunity
for innovation
To increase efficiencies through-
out the value chain
To develop sustainable offerings
or redesign existing ones to
become eco-friendly
To find novel ways of delivering
and capturing value, which will
change the basis of competition
Competencies needed
The ability to anticipate and
shape regulations
The skill to work with other
companies, including rivals, to
implement creative solutions
Expertise in techniques such
as carbon management and
life-cycle assessment
The ability to redesign opera-
tions to use less energy and
water, produce fewer emis-
sions, and generate less waste
The capacity to ensure that
suppliers and retailers make
their operations eco-friendly
The skills to know which prod-
ucts or services are most un-
friendly to the environment
The ability to generate real
public support for sustainable
offerings and not be consid-
ered as ‘greenwashing’
The management know-how to
scale both supplies of green
materials and the manufacture
of products
The capacity to understand
what consumers want and to
figure out different ways to
meet those demands
The ability to understand how
partners can enhance the val-
ue of offerings
Innovation opportunity
Using compliance to induce
the company and its partners
to experiment with sustainable
technologies, materials, and
processes
Developing sustainable
sources of raw materials and
components
Increasing the use of clean
energy sources such as wind
and solar power
Finding innovative uses for
returned products
Applying techniques such as
biomimicry in product devel-
opment
Developing compact and eco-
friendly packaging.
Developing new delivery tech-
nologies that change value-
chain relationships in signifi-
cant ways
Creating monetisation models
that relate to services rather
than products
Devising business models that
combine digital and physical
infrastructures
Source: Nidumolu et al, 2009.
Figure 7.4: Corporate governance and related ter-
minology Source: Bureau of Market Research, 2004:19.