Embed Size (px)
Citation preview
Data- and Resource-Aware Conformance Checking ofBusiness Processes
Massimiliano de Leoni, Wil M. P. van der Aalst, and Boudewijn F. van Dongen
Eindhoven University of Technology, Eindhoven, The Netherlands{m.d.leoni,w.m.p.v.d.aalst,b.f.v.dongen}@tue.nl
Abstract. Process mining is not restricted to process discovery and also includesconformance checking, i.e., checking whether observed behavior recorded in theevent log matches modeled behavior. Many organizations have descriptive or nor-mative models that do not adequately describe the actual processes. Therefore, avariety of techniques for conformance checking have been proposed. However,all of these techniques focus on the control-flow and abstract from data and re-sources. This paper describes an approach that aligns event log and model whiletaking all perspectives into account (i.e., also data and resources). This way it ispossible to quantify conformance and analyze differences between model and re-ality. The approach has been implemented in ProM and evaluated using a varietyof model-log combinations.
1 Introduction
Modern organizations are centered around the processes needed to deliver products andservices in an efficient and effective manner. Organizations that operate at a higher pro-cess maturity level use formal/semiformal models (e.g., UML, EPC, BPMN and YAWLmodels) to document their processes. In some case these models are used to configureprocess-aware information systems (e.g., WFM or BPM systems). However, in mostorganizations process models are not used to enforce a particular way of working. In-stead, process models are used for discussion, performance analysis (e.g., simulation),certification, process improvement, etc. However, reality may deviate from such mod-els. People tend to focus on idealized process models that have little to do with reality.This illustrates the importance of conformance checking [1, 2, 3].
An important enabler for conformance checking is the availability of event data inmodern organizations. Even though processes are typically not enforced by a process-aware information system, still most events are recorded. Consider for example a hos-pital. Medical doctors are not controlled by some BPM system. However, many eventsare recorded, e.g., blood tests, X-ray images, administered drugs, surgery, etc. all resultin events that can be linked to a particular patient. Digital data is everywhere – in everysector, in every economy, in every organization, and in every home – and will continueto grow exponentially. MGI estimates that enterprises globally stored more than 7 ex-abytes of new data on disk drives in 2010, while consumers stored more than 6 exabytesof new data on devices such as PCs and notebooks [4]. The growing availability of eventdata is an important enabler for conformance checking.
2 M. de Leoni, W. M. P. van der Aalst, B. F. van Dongen
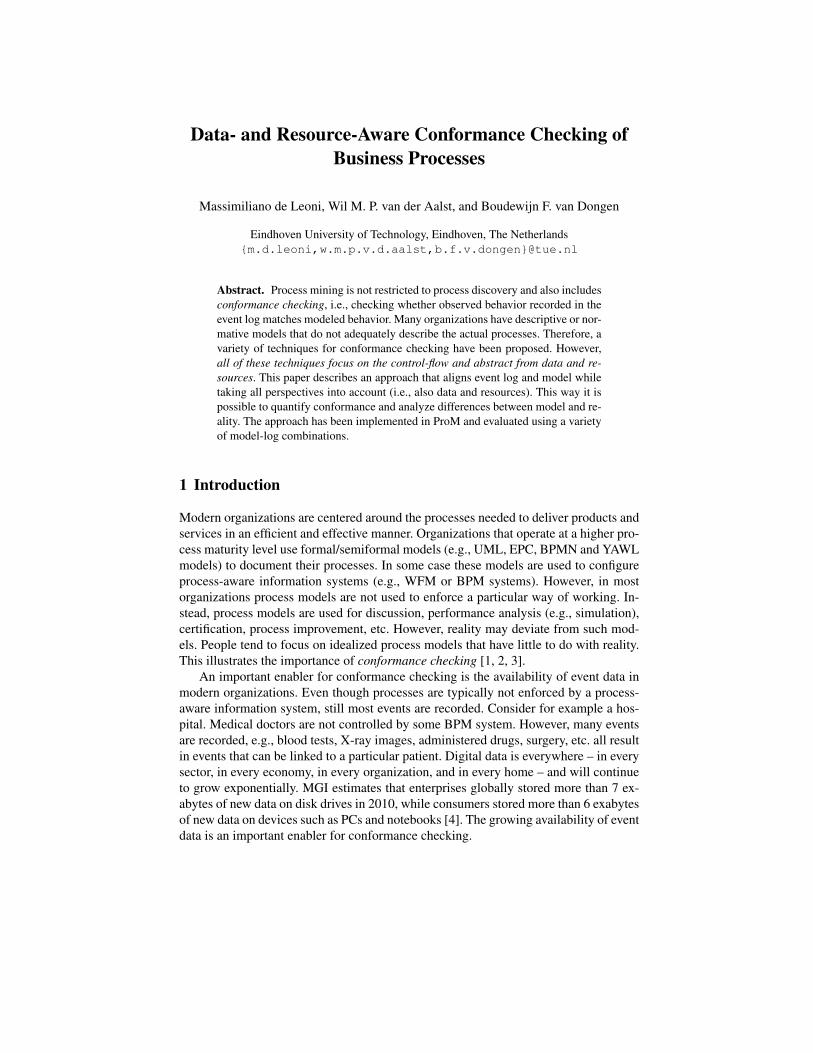
Fig. 1: BPMN diagram of a data and resource-aware process to manage credit requeststo buy home appliances. In the remainder, data objects are simply referred with theupper-case initials, e.g., V=Verification, and activity names by the letter in brackets,e.g. a=Credit Request.
Along with process discovery (learning process models from logs) and process en-hancement (e.g., extending process models with bottleneck information based on times-tamps in event logs), conformance checking belongs to the area of Process Mining [5],which is a relatively young research discipline that sits between computational intelli-gence and data mining on the one hand, and process modeling and analysis on the otherhand.
Conformance checking techniques take an event log and a process model and com-pare the observed behavior with the modeled behavior. There are different dimensionsfor comparing process models and event logs. In this paper, we focus of the fitness di-mension: a model with good fitness allows for most of the behavior seen in the eventlog. A model has a perfect fitness if all traces in the log can be replayed by the modelfrom beginning to end. Other quality dimensions are simplicity, precision, and general-ization [1, 2].
Various conformance checking techniques have been proposed in recent years [1,2, 3, 6, 7, 8, 9, 10, 11]. However, all of the techniques described in literature focuson the control flow, i.e. the ordering of activities. They do not take into account otherperspectives, such as resources and data. For example, when an activity is executedby the wrong person it is important to detect such a deviation. Conformance checkingtechniques need to detect that an activity reserved for gold customers is executed forsilver customers. Note that information about cases and data is readily available intoday’s event logs. The routing of a case may depend on data, i.e., a check needs to be
Data- and Resource-Aware Conformance Checking of Business Processes 3
performed for claims over 5000. Therefore, it is important to look at the combinationof all perspectives.
In a process model each case, i.e. a process instance, is characterized by its caseattributes. Paths taken during the execution may be governed by guards and conditionsdefined over such attributes. Process models also define, for each attribute, its domain,i.e. the values that can be given. Moreover, process models prescribe which attributesevery activity can read or write. Last but not least, process models also describe whichresources are allowed to execute which activities. An activity is typically associatedwith a particular role, i.e., a selected group of resources. Moreover, there may be ad-ditional rules such as the “four-eyes principle” which does not allow for the situationwhere the same resource executes two related tasks. If the data and the resource per-spective are not considered, process executions can apparently be fully conforming,whereas actually they are not. Let us consider the following example:
Example 1 A credit institute has activated a process to deal with loans requested by clients.These loans can be used to buy small home appliances (e.g., fridges, TVs, high-quality digitalsound systems). A customer can apply for a loan through a shop clerk. The clerk prepares the re-quest by filling out the form and attaching documents that prove the capability to pay off the loan.Upon receiving a new request, the credit institute opens a new case of the process in Figure 1.Dotted lines going from activities to data objects indicate the data objects (i.e., the attributes) thatactivities are allowed to change the value of. The resource perspective is specified by defining therole that participants need to have in order to execute the corresponding activity.
Let us also consider the following trace where attribute E stands for Executor anddenotes the activity executor:1
〈(a, {A = 3000, R = Michael, E = Pete}), (b, {V = OK,E = Sue, A = 3000, R = Michael}),(c, {I = 530, D = OK,E = Sue, A = 3000, R = Michael}), (f, {E = Pete, A = 3000, R = Michael})〉.
Existing conformance checking techniques [2, 3, 6, 7, 8, 9, 10, 11] would only considerthe control flow and ignore the decision points, values assigned to attributes and re-sources. Hence, the given trace would be considered as perfectly fitting. The approachproposed in this paper also considers the data and resource perspectives. For example,using our techniques, we can discover violations of rules, such as: (i) activity c shouldnot be executed since the loan amount is not greater than 5000 (conversely, activity dshould); (ii) for the considered credit loan, the interest should not be more 450 Eurosand, hence, proposing an interest of 530 Euros is against the credit-institute’s policyfor small loans; (iii) ‘Sue’ is not authorized to execute activity b since she cannot playrole Assistant; (iv) activity h has not been executed and, hence, the decision cannot bepositive. The approach we propose is based on the principle of finding an alignmentof event log and process model. The events in the traces are mapped to the executionof activities in the process model. Such an alignment shows how the event log can bereplayed on the process model. In [12] an alignment-based conformance checking tech-niques is described. However, this approach is limited to the control-flow perspective.This paper extends [12] by also taking the data and resource perspectives into account.
We allow costs to be assigned to every potential deviation. Some deviations aremore severe than others and the severity can also be influenced by the point in the1 Notation (act, {attr1 = val1, . . . , attrn = valn}) is used to denote the occurrence of activ-
ity act in which attributes attr1, . . . , attrn are assigned values val1, . . . , valn, respectively.
4 M. de Leoni, W. M. P. van der Aalst, B. F. van Dongen
process when these occur, e.g., skipping a notification activity is more severe for goldcustomers. Our approach uses the A* algorithm [13] to find, for each trace in the eventlog, the process execution, among those possible, whose deviations from the log tracehas the lowest overall cost. In order to keep the technique as general as possible, we havedeveloped it as independent of both the actual language in which business processesare described and the log format. Together with measuring the degree of conformance,the technique highlights where deviations occur thereby showing the control-flow, dataand resource perspectives. In particular, among the different types of deviations thatthe technique can diagnose, it is capable to compute how much a value assignment toan attribute deviates. Similarly, from the resource viewpoint, the techniques pinpointswhich resources and activities more often violate the authorization.
Section 2 illustrates a formalism that abstracts from the actual log and process nota-tion and focuses on the behavior described by the model and recorded in the event logs.Section 3 shows how constructing an optimal alignment of process model and eventlog can be used to diagnose non-conformance and quantify the fitness. Section 4 elabo-rates the adaptation of the A* algorithm to solve the problem of conformance checking.Section 5 describes our implementation of this new approach in ProM. Moreover, ex-perimental results are given. Finally, Section 6 concludes the paper, describing futuredirections of improvement.
2 The General Framework
Typically, any process model, such as the BPMN diagram in Figure 1, relies on con-structs such as parallel split nodes, synchronization nodes, decision/choice nodes, con-ditions, merge nodes, etc. However, the model description can be “expanded” into a(possible infinite) set of (potentially arbitrarily long) traces yielding to a final state, i.e.the set of admissible behaviors. Each trace can be seen as a sequence of execution steps,each of which corresponds to the execution of a given process activity. Usually, a pro-cess model also defines a set of attributes together with their domain (i.e., the valuesthat can be given). An activity is allowed to read and write attributes in a predefinedmanner.
Let A, V be, respectively, the finite set of activities and attributes. For all attributesv ∈ V , let us denote with domAttr(v) the set of values allowed for v (i.e., the attributedomain). Let be U =
⋃v∈V domAttr(v). A execution step s = (as, ϕs) consists of
an executed activity as and a function that denotes an assignment of values to processattributes: ϕs ∈ V 6→ U s.t. ∀v ∈ dom(ϕs). ϕs(v) ∈ domAttr(v).2 Let S be the setof possible execution steps. A process P is the set of all admissible execution traces:P ⊆ S∗. For each execution step s = (as, ϕs), we use function #act(s) = as to extractthe activity associated to the execution step.
Resources are taken into account by “reserving” a special attribute to carry theexecutor information. Each value assignment to attributes can either be a read orwrite operation and the semantics depends on the executed activity and event log.For instance, let us consider the trace in Section 1 and the first two execution steps2 The domain of a function f is denoted by dom(f).
Data- and Resource-Aware Conformance Checking of Business Processes 5
s′ = (a, {A = 3000, R = Michael, E = Pete}) and s′′ = (b, {V = OK,E =Sue, A = 3000, R = Michael}). The assignment A = 3000 for s′ denotes that theexecution of step s′ provokes an assignment of value 3000 to attribute A. Conversely,A = 3000 for s′′ indicates that, during the execution of step s′′, the value 3000 hasbeen read for attribute A. In the remainder, we focus on the writing operations. It isobvious to see that our approach can be extended to distinguish between read and writeoperations.
An event log contains events associated to cases, i.e., process instances. Each casefollows a trace of events. Each trace records the execution of a process instance. Differ-ent instances may follow the same trace. Therefore, an event log is a multi-set of traces,i.e., L ∈ B(S∗).3
3 Aligning Event Log and Process Model
Conformance checking requires an alignment of event log L and process model P: theevents in the event log need to be related to model elements and vice versa. Such analignment shows how the event log can be replayed on the process model. This is farfrom being trivial since the log may deviate from the model and not all activities mayhave been modeled and recorded.
We need to relate “moves” in the log to “moves” in the model in order to establishan alignment between a process model and an event log. However, it may be the casethat some of the moves in the log cannot be mimicked by the model and vice versa. Weexplicitly denote “no move” by⊥. For convenience, we introduce the set S⊥ = S∪{⊥}.
One step in an alignment is represented by a pair (s′, s′′) ∈ (S⊥ × S⊥) \ {(⊥,⊥)}such that
– (s′, s′′) is a move in log if s′ ∈ S and s′′ = ⊥,– (s′, s′′) is a move in process if s′ = ⊥ and s′′ ∈ S,– (s′, s′′) is a move in both if s′ ∈ S and s′′ ∈ S.
SA = (S⊥×S⊥) \ {(⊥,⊥)} is the set of all legal moves where the first and the secondelement of every pair denote possible moves in the log and in the process, respectively.
The alignment of two execution traces σ′, σ′′ ∈ S∗ is a sequence γ ∈ SA∗ suchthat, ignoring all occurrences of ⊥, the projection on the first element yields to σ′ andthe project on the second yields to σ′′. In particular, γ is a complete alignment if σ′ ∈ Land σ′′ ∈ P .
In order to define the severity of a deviation, we introduce a cost function on legalmoves: κ ∈ SA → R+
0 . The costs of each legal move depends on the specific modeland process domain and, hence, cost function κ needs to be defined ad-hoc for everyspecific case. The cost function can be generalized to alignments γ as the sum of thecost of each individual move: K(γ) =
∑(s′,s′′)∈γ κ(s
′, s′′).
Example 1 (cont.). When checking for conformance, the business analysts repute more severethe misconformances on activities that are concerned with interactions with customers, since theycan undermine the reputation of the credit institute. Therefore, every alignment step between ⊥3 B(X) the set of all multi-sets over X .
6 M. de Leoni, W. M. P. van der Aalst, B. F. van Dongen
γ1a,{A=3000,R=Michael,E=Pete} a,{A=3000,R=Michael,E=Pete}b,{V=OK,E=Pete} b,{V=OK,E=Sue}c,{I=530,D=OK,E=Sue} ⊥⊥ d,{I=599,D=NOK,E=Sue}f,{E=Pete} f,{E=Pete}
γ2a,{A=3000,R=Michael,E=Pete} a,{A=3000,R=Michael,E=Pete}b,{V=OK,E=Pete} ⊥⊥ b,{V=OK,E=Sue}c,{I=530,D=OK,E=Sue} ⊥
d,{I=599,D=NOK,E=Sue}f,{E=Pete} f,{E=Ellen}
γ3a,{A=3000,R=Michael,E=Pete} a,{A=3000,R=Michael,E=Pete}b,{V=OK,E=Pete} b,{V=OK,E=Sean}c,{I=530,D=OK,E=Sue} ⊥⊥ d,{I=500,D=NOK,E=Sue}f,{E=Pete} f,{E=Pete}
γ4a,{A=3000,R=Michael,E=Pete} a,{A=5001,R=Michael,E=Pete}b,{V=OK,E=Pete} b,{V=OK,E=Sean}c,{I=530,D=OK,E=Sue} c,{I=530,D=NOK,E=Sue}f,{E=Pete} f,{E=Pete}
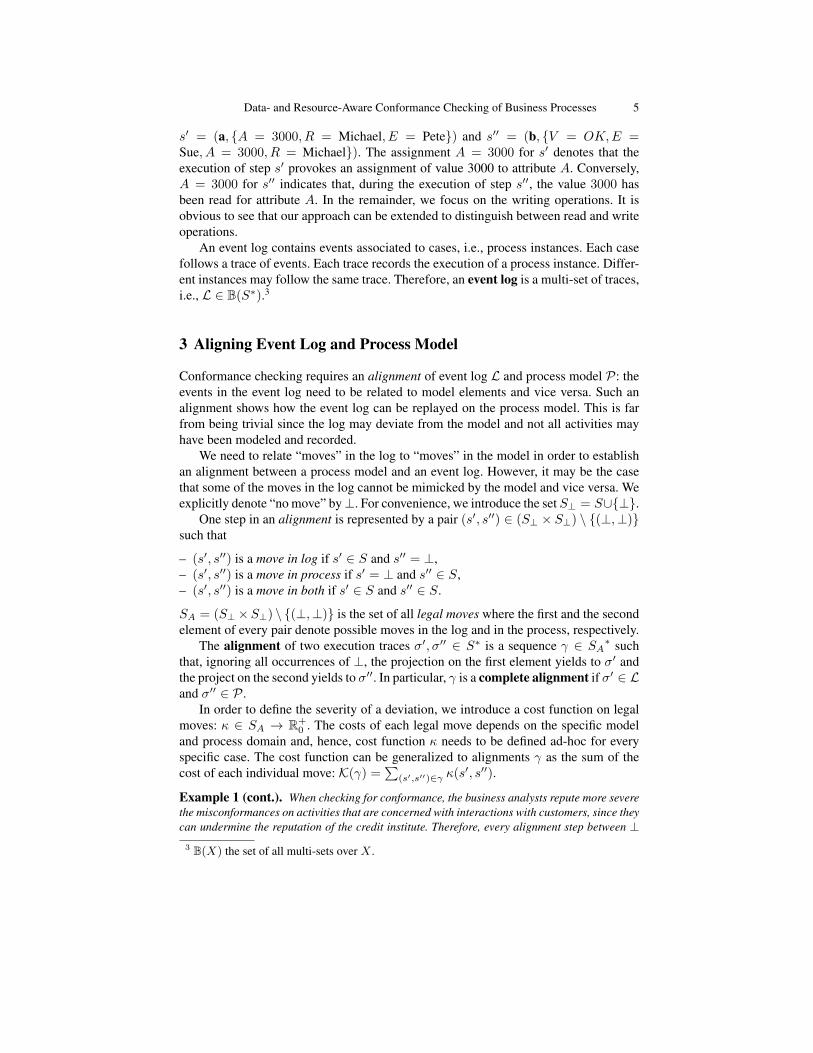
Fig. 2: Four possible alignments of the log trace described in Section 1 and the processmodel in Figure 1
and an execution step for activities c or d is given a cost 1, whereas a cost of 10 is given toalignment steps between ⊥ and execution steps for any activity different from c and d:
∀s ∈ S. κ(s,⊥) = κ(⊥, s) ={1 if #act(s) ∈ {c, d}10 if #act(s) 6∈ {c, d}
Let Diff(s′, s′′) be the set of attributes to which both steps s′ and s′′ assign a value, but a differentone. Every move in both is assigned a cost as follows:
∀s′, s′′ ∈ S. κ(s′, s′′) =
0.2 · ‖Diff(s′, s′′)‖ if #act(s
′) = #act(s′′) ∧#act(s
′) ∈ {c, d}3 · ‖Diff(s′, s′′)‖ if #act(s
′) = #act(s′′) ∧#act(s
′) 6∈ {c, d}∞ otherwise
The idea is that moves in both with different value assignment to attributes are given a higher costfor activities c and d rather than for any other activity. Let us consider again the log trace givenin Section 1. Figure 2 shows four possible alignments. It is easy to check that K(γ1) = K(γ3) =0+3+1+1+0 = 5,K(γ2) = 0+10+10+1+1+2 = 24 andK(γ4) = 3+2+0.6+0 = 5.6
and, hence, alignments γ1 and γ3 are certainly better than γ2 and γ4.
So far we have considered single complete alignments. However, given a log trace σL ∈L, our goal is to find a complete alignment of σL and P which minimizes the cost withrespect to all σ′P ∈ P . We refer to it as an optimal alignment. Let ΓσL,P be the set of allcomplete alignments of σL and P . The alignment γ ∈ ΓσL,P is an optimal alignmentif ∀γ′ ∈ ΓσL,P . K(γ) ≤ K(γ′). Note that there may exist several optimal alignments,i.e. several complete alignments of the same minimal cost.
Example 1 (cont.). For this example, using the cost function κ defined above, γ1 and γ3 areboth optimal alignments. Of course, the set of optimal alignments depends on the cost functionκ. For instance, let us consider a cost function κ̂ s.t. ∀s ∈ S. κ̂(⊥, s) = κ̂(s,⊥) = 10 and∀s′, s′′ ∈ S.κ̂(s′, s′′) = κ(s′, s′′). Using κ̂ as cost function, the alignment γ4 would be optimalwith K(γ4) = 5.6, whereas alignments γ1 and γ3 would no more be optimal since K(γ1) =
K(γ3) = 22.
In the next section we propose an approach to create an optimal alignment withrespect to a custom cost function κ. The approach is based on the A* algorithm, i.e. analgorithm intended to find the path with the lowest overall cost between two nodes ina direct graph with costs associated to nodes. We have adapted it to derive one of theoptimal alignments.
Data- and Resource-Aware Conformance Checking of Business Processes 7
4 The A* Algorithm for Conformance Checking
The A* algorithm, initially proposed in [13], aims at finding a path in a graph V froma given source node v0 to any node v ∈ V in a target set. With every node v of graphV there is an associated cost, which is determined by an evaluation function f(v) =g(v) + h(v), where
– g : V → R+0 is a function that returns the smallest path cost from v0 to v;
– h : V → R+0 is an heuristic function that estimates the path cost from v to its
preferred target node.
Function h is said to be admissible if it returns a value that underestimates the distanceof a path from a node v′ to its preferred target node v′′, i.e. h(v′) ≤ g(v′′). If h isadmissible, A* finds a path that is guaranteed to have the overall lowest cost.
The A* algorithm keeps a priority queue of nodes to be visited: higher priority isgiven to nodes with lower costs so as to traverse those with the lowest costs at first. Thealgorithms works iteratively: at each step, the node v with lowest cost is taken fromthe priority queue. If v belongs to the target set, the algorithm ends returning node v.Otherwise, v is expanded: every successors v′ is added to priority queue with a costf(v′).
We employ A* to find any of the optimal alignments between a log trace σL ∈ S∗and a Process Model P . In order to be able to apply A*, an opportune search spaceneeds to be defined. Every node γ of the search space V is associated to a differentalignment that is a prefix of some complete alignment of σL and P . Since a differentalignment is also associated to every node and vice versa, later on we use the alignmentto refer to the associated state. The source node is empty alignment γ0 = 〈〉 and the setof target nodes includes every complete alignment of σL and P .
Let us denote the length of a sequence σ with ‖σ‖. Given a node/alignment γ ∈ V ,the search-space successors of γ include all alignments γ′ ∈ V obtained from γ byconcatenating exactly one move step. Let us consider a custom cost function κ anddenote with κmin the smallest value returned by κ that is greater than 0. Given analignment γ ∈ V of σ′L and σ′P , the cost of path from the initial node to node γ ∈ V is:
g(γ) = κmin · ‖σ′L‖+K(γ).
It is easy to check that, given a log trace σL and two complete alignments γ′C and γ′′Cof σL and P , K(γ′C) < K(γ′C) iff g(γ′C) < g(γ′′C) and K(γ′C) = K(γ′′C) iff g(γ′C) =g(γ′′C). Therefore, an optimal solution returned by the A* algorithm coincides with anoptimal alignment. Term κmin · ‖σ′L‖, which does not affect the optimality, has beenadded because it allows us to define a more efficient admissible heuristics. Given analignment γ ∈ V of σ′L and σ′P , we employ the following heuristics:
h(γ) = κmin · (‖σL‖ − ‖σ′L‖)
For alignment γ, the number of steps to add in order to reach a complete alignment islower bounded by the number of execution steps of trace σL that have not been includedyet in the alignment, i.e. ‖σL‖−‖σ′L‖. Since the additional cost to traverse a single nodeis at least κmin, the cost to reach a target node is at least h(γ), corresponding to the casewhen the part of the log trace that still needs to be included in the alignment fits in full.
8 M. de Leoni, W. M. P. van der Aalst, B. F. van Dongen
5 Implementation and Experiments
The Data-Aware Conformance Checker is implemented as a software plug-in of ProM,a generic open-source framework for implementing process mining tools in a standardenvironment [14]. The plug-in takes as input a process model and a log and, by em-ploying the techniques described in Section 4, answers to the conformance-checkingquestions expressed in the Section 1.
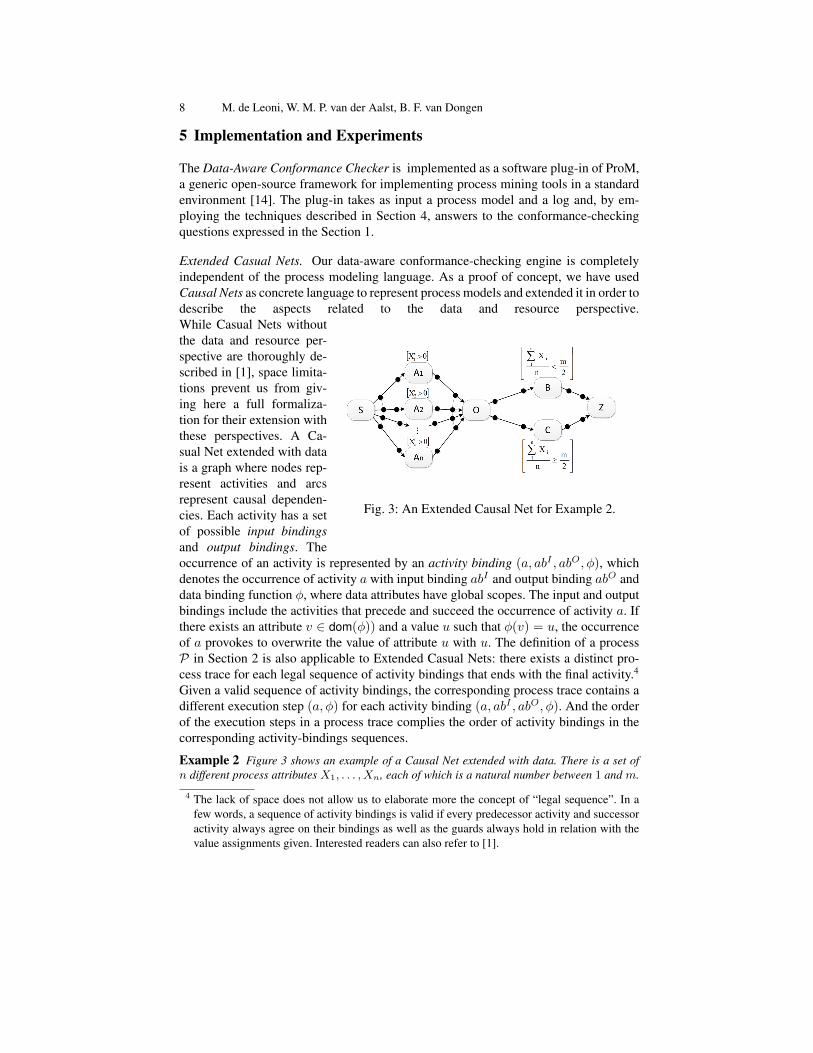
Extended Casual Nets. Our data-aware conformance-checking engine is completelyindependent of the process modeling language. As a proof of concept, we have usedCausal Nets as concrete language to represent process models and extended it in order todescribe the aspects related to the data and resource perspective.
Fig. 3: An Extended Causal Net for Example 2.
While Casual Nets withoutthe data and resource per-spective are thoroughly de-scribed in [1], space limita-tions prevent us from giv-ing here a full formaliza-tion for their extension withthese perspectives. A Ca-sual Net extended with datais a graph where nodes rep-resent activities and arcsrepresent causal dependen-cies. Each activity has a setof possible input bindingsand output bindings. Theoccurrence of an activity is represented by an activity binding (a, abI , abO, φ), whichdenotes the occurrence of activity a with input binding abI and output binding abO anddata binding function φ, where data attributes have global scopes. The input and outputbindings include the activities that precede and succeed the occurrence of activity a. Ifthere exists an attribute v ∈ dom(φ)) and a value u such that φ(v) = u, the occurrenceof a provokes to overwrite the value of attribute u with u. The definition of a processP in Section 2 is also applicable to Extended Casual Nets: there exists a distinct pro-cess trace for each legal sequence of activity bindings that ends with the final activity.4
Given a valid sequence of activity bindings, the corresponding process trace contains adifferent execution step (a, φ) for each activity binding (a, abI , abO, φ). And the orderof the execution steps in a process trace complies the order of activity bindings in thecorresponding activity-bindings sequences.
Example 2 Figure 3 shows an example of a Causal Net extended with data. There is a set ofn different process attributes X1, . . . , Xn, each of which is a natural number between 1 and m.
4 The lack of space does not allow us to elaborate more the concept of “legal sequence”. In afew words, a sequence of activity bindings is valid if every predecessor activity and successoractivity always agree on their bindings as well as the guards always hold in relation with thevalue assignments given. Interested readers can also refer to [1].
Data- and Resource-Aware Conformance Checking of Business Processes 9
Node S is the starting activity: it has no input binding and one output binding, which is the set{A1, . . . , An} of activities. This means activity S is followed by activities A1, . . . , An executedin any order (i.e., AND-split). Activity Ai is associated a guard X ′
i ≥ 0; when an attribute, e.g.Xi, is annotated with the prime symbol in a guard, the activity, e.g. Ai, is prescribed to updatethe value of the attribute. And the written value must not violate the guards, e.g. Xi has to beassigned a non-negative value. Activity O is characterized by an input binding {A1, . . . , An},which means that O can only be executed after all activities A1, . . . , An have been (i.e., AND-join). Two possible output bindings are modeled for O: B and C. Therefore, O is followed byeitherB or C (i.e., XOR-split).B and C are associated with two guards indicating that activitiesB or C can follow O if the average of values for X1, . . . , Xn is less than m/2 or, vice versa,greater or equal to m/2.
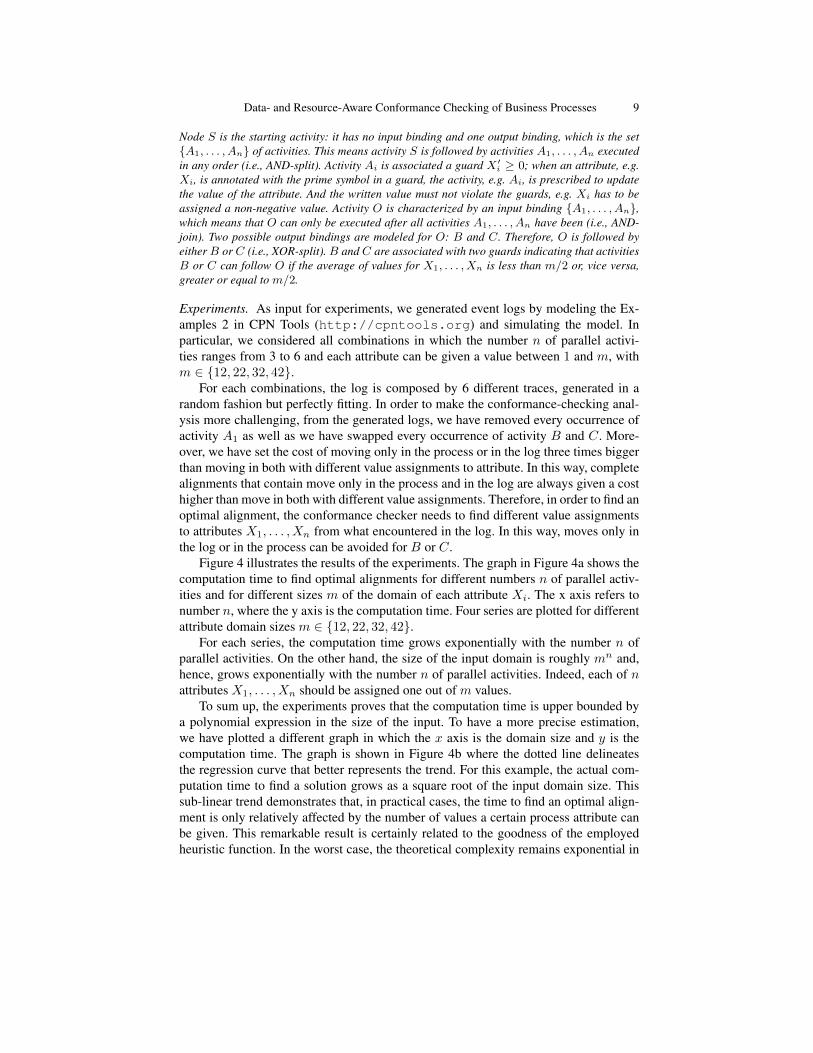
Experiments. As input for experiments, we generated event logs by modeling the Ex-amples 2 in CPN Tools (http://cpntools.org) and simulating the model. Inparticular, we considered all combinations in which the number n of parallel activi-ties ranges from 3 to 6 and each attribute can be given a value between 1 and m, withm ∈ {12, 22, 32, 42}.
For each combinations, the log is composed by 6 different traces, generated in arandom fashion but perfectly fitting. In order to make the conformance-checking anal-ysis more challenging, from the generated logs, we have removed every occurrence ofactivity A1 as well as we have swapped every occurrence of activity B and C. More-over, we have set the cost of moving only in the process or in the log three times biggerthan moving in both with different value assignments to attribute. In this way, completealignments that contain move only in the process and in the log are always given a costhigher than move in both with different value assignments. Therefore, in order to find anoptimal alignment, the conformance checker needs to find different value assignmentsto attributes X1, . . . , Xn from what encountered in the log. In this way, moves only inthe log or in the process can be avoided for B or C.
Figure 4 illustrates the results of the experiments. The graph in Figure 4a shows thecomputation time to find optimal alignments for different numbers n of parallel activ-ities and for different sizes m of the domain of each attribute Xi. The x axis refers tonumber n, where the y axis is the computation time. Four series are plotted for differentattribute domain sizes m ∈ {12, 22, 32, 42}.
For each series, the computation time grows exponentially with the number n ofparallel activities. On the other hand, the size of the input domain is roughly mn and,hence, grows exponentially with the number n of parallel activities. Indeed, each of nattributes X1, . . . , Xn should be assigned one out of m values.
To sum up, the experiments proves that the computation time is upper bounded bya polynomial expression in the size of the input. To have a more precise estimation,we have plotted a different graph in which the x axis is the domain size and y is thecomputation time. The graph is shown in Figure 4b where the dotted line delineatesthe regression curve that better represents the trend. For this example, the actual com-putation time to find a solution grows as a square root of the input domain size. Thissub-linear trend demonstrates that, in practical cases, the time to find an optimal align-ment is only relatively affected by the number of values a certain process attribute canbe given. This remarkable result is certainly related to the goodness of the employedheuristic function. In the worst case, the theoretical complexity remains exponential in
10 M. de Leoni, W. M. P. van der Aalst, B. F. van Dongen
(a) The computation timefor different numbers nof parallel activities. Eachseries refers to a differ-ent size m of the domainof each attribute Xi (withm ∈ {12, 22, 32, 42}).
(b) The influence of thesize of the input do-main on the computationtime. In particular, thetrend line shows that thecomputation time growssub-linearly with growingsizes of the input domain.
(c) The number of visitedsearch-space nodes in thecase of 3 parallel activi-ties with and without us-ing the heuristics. The xaxis refers to the size mof the domain of each at-tribute Xi.
Fig. 4: The results of the experiments conducted on Example 2.
the size of the domain. But, in practice, the heuristic allows the algorithm to signifi-cantly cut the number of search-space nodes to visit and, hence, the computation timeto find a solution. As a matter of fact, Figure 4c shows the number of visited nodesin case of 3 parallel activities and for different values of m. In particular, we comparesuch a number in the case both the heuristic is used and is unused: the heuristics roughlyinstructs the algorithm to only visit a logarithmic number of nodes with respect to thecase when the heuristic is not used.
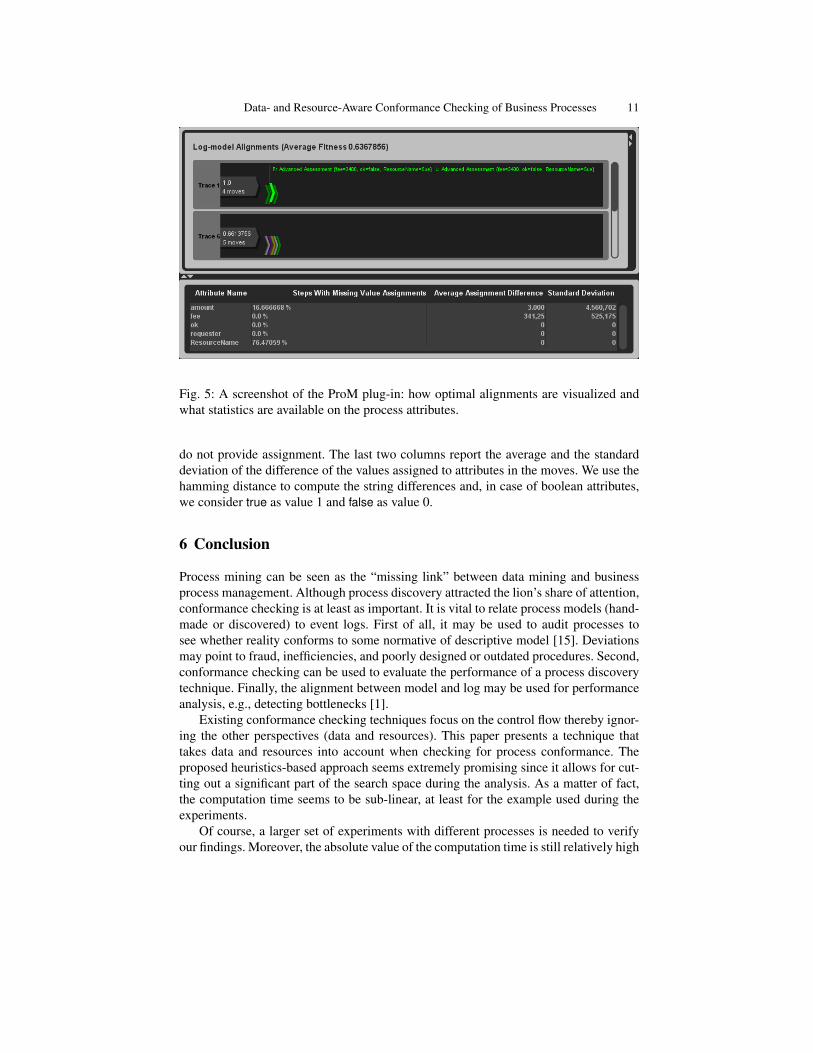
Visualization of the Results in the Operationalization as ProM plug-in. We concludethis section by showing the actual operationalization as ProM plug-in in a scenariosin which we want to check the conformance of a given log against the process ofExample 1. The log contains one perfectly-fitting trace and other trace with differentproblems. Figure 5 illustrates how the conformance-checking results are visualized: theoptimal alignment of each log trace is shown as a sequence of triangles, each represent-ing a move in the process and/or in the log. The triangle colors represent the alignmenttype. The green and white color identify moves in both with the same attribute assign-ment or with a different one; yellow and purple report moves only in the log or in theprocess, respectively. When the user passes over a triangle with the mouse, the plug-inshows the execution step(s) associated to the move. The value near to every trace is thefitness value of the trace, i.e. a value between 0 and 1 which quantifies the quality of thealignment. Fitness value 1 identifies the perfect alignment. Conversely, a fitness value0 pinpoints the alignment with the largest possible cost, which typically only consistsby moves in log and moves in process. Interested readers can refer to [2] where fitnessvalues are computed in the same way. At the bottom, a table shows some statistics onthe attribute assignments in the moves present in the optimal alignments shown in theupper part of the screen. The second column highlights the percentage of log steps that
Data- and Resource-Aware Conformance Checking of Business Processes 11
Fig. 5: A screenshot of the ProM plug-in: how optimal alignments are visualized andwhat statistics are available on the process attributes.
do not provide assignment. The last two columns report the average and the standarddeviation of the difference of the values assigned to attributes in the moves. We use thehamming distance to compute the string differences and, in case of boolean attributes,we consider true as value 1 and false as value 0.
6 Conclusion
Process mining can be seen as the “missing link” between data mining and businessprocess management. Although process discovery attracted the lion’s share of attention,conformance checking is at least as important. It is vital to relate process models (hand-made or discovered) to event logs. First of all, it may be used to audit processes tosee whether reality conforms to some normative of descriptive model [15]. Deviationsmay point to fraud, inefficiencies, and poorly designed or outdated procedures. Second,conformance checking can be used to evaluate the performance of a process discoverytechnique. Finally, the alignment between model and log may be used for performanceanalysis, e.g., detecting bottlenecks [1].
Existing conformance checking techniques focus on the control flow thereby ignor-ing the other perspectives (data and resources). This paper presents a technique thattakes data and resources into account when checking for process conformance. Theproposed heuristics-based approach seems extremely promising since it allows for cut-ting out a significant part of the search space during the analysis. As a matter of fact,the computation time seems to be sub-linear, at least for the example used during theexperiments.
Of course, a larger set of experiments with different processes is needed to verifyour findings. Moreover, the absolute value of the computation time is still relatively high
12 M. de Leoni, W. M. P. van der Aalst, B. F. van Dongen
and that seems to be mostly related to the parsing of the guard expressions to determinethe node successors in the search space. The parsing operations approximately take70% of the overall computation time: we are currently investigating how to reduce thenumber of guards to be evaluated, along with integrating a more efficient parser.
Acknowledgements. The research leading to these results has received funding from theEuropean Community’s Seventh Framework Programme FP7/2007-2013 under grantagreement no 257593 (ACSI).
References1. van der Aalst, W.M.P.: Process Mining - Discovery, Conformance and Enhancement of
Business Processes. Springer (2011)2. van der Aalst, W., Adriansyah, A., van Dongen, B.: Replaying history on process models
for conformance checking and performance analysis. Wiley Interdisciplinary Reviews: DataMining and Knowledge Discovery 2(2) (2012) 182–192
3. Rozinat, A., van der Aalst, W.: Conformance Checking of Processes Based on MonitoringReal Behavior. Information Systems 33 (March 2008) 64–95
4. Manyika, J., Chui, M., Brown, B., Bughin, J., Dobbs, R., Roxburgh, C., Byers, A.H.: Bigdata: The next frontier for innovation, competition, and productivity. Technical report, McK-insey Global Institute (MGI) (May 2011)
5. van der Aalst, W.M.P. et al.: Process mining manifesto. In: Proceedings of Business Pro-cess Management Workshops 2011. Volume 99 of Lecture Notes in Business InformationProcessing (LNBIP)., Springer Verlag (2012)
6. Weijters, A., van der Aalst, W., de Medeiros, A.A.: Process Mining with the HeuristicsMiner-algorithm. Technical report, Eindhoven University of Technology, Eindhoven (2006)BETA Working Paper Series, WP 166.
7. de Medeiros, A.A., Weijters, A., van der Aalst, W.: Genetic Process Mining: an ExperimentalEvaluation. Data Mining and Knowledge Discovery 14 (2007) 245–304
8. Adriansyah, A., van Dongen, B., van der Aalst, W.: Towards Robust Conformance Checking.In: Proceedings of the 6th Workshop on Business Process Intelligence (BPI 2010). (2010)
9. Weidlich, M., Polyvyanyy, A., Desai, N., Mendling, J.: Process Compliance Measurementbased on Behavioural Profiles. In: Proceedings of the 22nd International Conference onAdvanced Information Systems Engineering. CAiSE’10, Springer-Verlag (2010) 499–514
10. Rozinat, A., Veloso, M., van der Aalst, W.: Using hidden markov models to evaluate thequality of discovered process models. Technical report (2008) BPM Center Report BPM-08-10.
11. Cook, J., Wolf, A.: Software Process Validation: Quantitatively Measuring the Correspon-dence of a Process to a Model. ACM Transactions on Software Engineering and Methodol-ogy (TOSEM) 8 (April 1999) 147–176
12. Adriansyah, A., van Dongen, B., van der Aalst, W.: Conformance Checking Using Cost-Based Fitness Analysis. In: IEEE International Enterprise Distributed Object ComputingConference, IEEE Computer Society (2011) 55–64
13. Dechter, R., Pearl, J.: Generalized best-first search strategies and the optimality of A*. Jour-nal of the ACM (JACM) 32 (July 1985) 505–536
14. Verbeek, H.M.W., Buijs, J.C.A.M., van Dongen, B.F., van der Aalst, W.M.P.: XES, XESame,and ProM 6. In: Proceedings of Information Systems Evolution (CAiSE Forum 2010). Vol-ume 72 of Lecture Notes in Business Information Processing. (2011) 60–75
15. van der Aalst, W.M.P., van Hee, K., J.M. van der Werf, J., Verdonk, M.: Auditing 2.0: UsingProcess Mining to Support Tomorrow’s Auditor. IEEE Computer 43(3) (2010) 90–93