Embed Size (px)
Citation preview

How Britons fell back in love with borrowingPrecious Plastic
www.pwc.co.uk/financial-services
Exploring the latest trends in the UK consumer credit and payments market
2015

IntroductionWelcome to Precious Plastic 2015
PwC projects that the average UK household is set to owe close to £10,000 in unsecured debt by the end of 2016, which in cash terms is more than ever before. While borrowers sought to reduce their debts in the years following the financial crisis, this period of retrenchment has now ended, with secured lending rising once again and unsecured debt bouncing back to an all-time high, in cash terms, of close to £9,000 per household by the end of 2014.
These are the key findings of the 2015 Precious Plastic report from PwC, the latest in a series of annual reports into the UK consumer credit and payments market. The report warns that while most Britons are currently in control of their borrowing – and are confident in their ability to remain so – there is a danger of complacency. The total household debt to income ratio is projected to, once again, reach above 170% by 2020, while PwC analysis indicates that a 2 percentage point increase in the cost of servicing consumer’s total debt would see households needing to find an extra £1,000 a year.
At the same time as this significant growth in overall borrowing, we are also seeing significant changes in the way people borrow. Old favourites such as credit cards are staging something of a revival, while newer forms of borrowing, such as peer-to-peer, are starting to gain ground.
While profitability for the industry (particularly credit card issuers) is strong, a number of factors are converging that will undermine this position: regulatory scrutiny of business models, new entrants competing aggressively for market share, increasingly innovative use of technology, and changing consumer behaviour and expectations, all put the industry on the brink of significant change.
In the face of so much change, there is new evidence to suggest that borrowers still do not have a good understanding of how products work and what they might cost; a stark reminder that innovation in the market must be matched by improvements in transparency, simplicity, and better financial literacy amongst consumers to ensure good outcomes.
Part 1 of this report charts the size and growth prospects of the UK consumer credit market, while Part 2 features the results of the annual PwC/YouGov study of credit confidence. Part 3 considers the strong profitability that lenders are experiencing, but highlights some significant headwinds that they will face over the coming years.
We hope that you find the report interesting and useful. If you would like to discuss any of the issues raised, please feel free to contact one of the authors listed on page 43.

Contents
Executive summary 2
Part one: Lending rebounds to record levels 5
Improved economic backdrop underpins growth in lending 8
Continued growth in student borrowing 11
Credit cards recover from their midlife crisis? 12
Personal loans and overdrafts 14
Mixed fortunes for newer forms of borrowing 15
Time to push the panic button? 16
Part two: Consumers grow in confidence 18
The 2015 PwC Credit Confidence survey 18
On top of debt repayments 20
Increasing confidence in jobs and pay 22
Borrowing for necessities falls back 24
Poor financial literacy hinders planning for the future 26
Part three: Strong profits.... for now 27
From stars aligned to perfect storm? 30
A resurgence in bad debt? 31
Regulatory scrutiny 32
Changing consumer behaviour 36
Competition is set to intensify 38
Confronting the window of opportunity 38
About PwC 42

2 | Precious Plastic 2015 | PwC
Executive summaryExecutive summary
£239bn
in other sources (e.g. personal loans/overdrafts).
in credit cards.
in student borrowing.
£6.4bn
£4.2bn
£9.1bn
Part 1: Unsecured lending rebounds
£
In 2014 unse
cure
d debt grew by
£8,936per household
Unsecured borrowing rebounded in 2014.
or
2007 2014
Total debt to income ratio (%)
2020
But rises in interest rates could increase pressure on borrowers.
This debt pile is a�ordable for now.
A two percentage point rise in the interest charged on total debt could leave households needing to find an additional £1000 a year to service those debts.
Consisting of
Part 3: Strong profits... for now
GDP(+2.6%)
Employment Real wages
Consumer confidence
+ + + =
=
£10,000per household by end of 2016
£1000
+2%=
With a positive economic backdrop, unsecured debt could rise to unprecedented levels.
20%
2010 2013 2015
Credit card issuers are seeing strong profits.
Strong profit and margins2002 2010 2014
Bad debts Average spreads
2002 2009 2014
Borrowers’ confidence is returning.
I am worried about my ability to repay:
31% 26% 18%
2 3
£239bn
172%169%
145%
in total unsecured debt
+10%
3% 3%
9% 10%
17%16%
12%2015
of us use credit to pay for essentials such as food or bills.
Less use credit to pay for essentials.
? ?Financial literacy in question as Britons take on more debt.
correctly estimated the costof a mortgage.
Only Only
correctly estimated the cost of a payday loan.
1 in 5 3%
for 35-44 year olds as some still feel the squeeze.
But t
his ris es to 20%
A resurgence in bad debt?• High debt to income• Rising interest rates
Changing consumer behaviour• Younger consumers using credit cards less• Less borrowing more transacting
Regulatory scrutiny• Interchange reduction• FCA market study• Cross subsidies
Intensifying competition• New forms of borrowing• New entrants to payments• Other credit card providers
But this will come under pressure in the coming years.
Future profits will be
squeezed
A fee for all? Introduction of annual fees would reduce any cross subsidies and diversify issuers’ revenue sources.
New sources of revenue Leveraging rich customer spend and location data from smartphones could open up new sources of value.
Now is the time to act...
Cracking mobile payments Unlocking the potential of mobile payments could rekindle interest from younger consumers.
Part 2: The 2014 PwC Credit Confidence Survey
2010 2013 2015 2010
20% 40%16% 13% 25%
2015
I am worried about losing my job: I am worried my pay will be frozen:Increased optimism over jobs and pay.

PwC | Precious Plastic 2015 | 3
Executive summary
£239bn
in other sources (e.g. personal loans/overdrafts).
in credit cards.
in student borrowing.
£6.4bn
£4.2bn
£9.1bn
Part 1: Unsecured lending rebounds
£
In 2014 unse
cure
d debt grew by
£8,936per household
Unsecured borrowing rebounded to its pre-crisis peak in 2014.
or
2007 2014
Total debt to income ratio (%)
2020
But rises in interest rates could increase pressure on borrowers.
This debt pile is a�ordable for now.
A two percentage point rise in the interest charged on total debt could leave households needing to find an additional £1000 a year to service those debts.
Consisting of
Part 3: Strong profits... for now
GDP(+2.6%)
Employment Real wages
Consumer confidence
+ + + =
=
£10,000per household
by 2020
£1000
+2%=
With a positive economic backdrop, unsecured debt could rise to unprecedented levels.
20%
2010 2013 2015
Credit card issuers are seeing strong profits.
Strong profit and margins2002 2010 2014
Bad debts Average spreads
2002 2009 2014
Borrowers’ confidence is returning.
I am worried about my ability to repay:
31% 26% 18%
2 3
£239bn
172%169%
145%
in total unsecured debt
+10%
3% 3%
9% 10%
17%16%
12%2015
of us use credit to pay for essentials such as food or bills.
Less use credit to pay for essentials.
? ?Financial literacy in question as Britons take on more debt.
correctly estimated the cost of a mortgage.
Only Only
correctly estimated the cost of a payday loan.
1 in 5 3%
for 35-44 year olds as some still feel the squeeze.
But t
his ris es to 20%
A resurgence in bad debt?• High debt to income• Rising interest rates
Changing consumer behaviour• Younger consumers using credit cards less• Less borrowing more transacting
Regulatory scrutiny• Interchange reduction• FCA market study• Cross subsidies
Intensifying competition• New forms of borrowing• New entrants to payments• Other credit card providers
But this will come under pressure in the coming years.
Future profits will be
squeezed
A fee for all? Introduction of annual fees would reduce any cross subsidies and diversify issuers’ revenue sources.
New sources of revenue Leveraging rich customer spend and location data from smartphones could open up new sources of value.
Now is the time to act...
Cracking mobile payments Unlocking the potential of mobile payments could rekindle interest from younger consumers.
Part 2: The 2015 PwC Credit Confidence Survey
2010 2013 2015 2010
20% 40%16% 13% 25%
2015
I am worried about losing my job: I am worried my pay will be frozen:Increased optimism over jobs and pay.

4 | Precious Plastic 2015 | PwC
Executive summary
£239bn
in other sources (e.g. personal loans/overdrafts).
in credit cards.
in student borrowing.
£6.4bn
£4.2bn
£9.1bn
Part 1: Unsecured lending rebounds
£
In 2014 unse
cure
d debt grew by
£8,936per household
Unsecured borrowing rebounded in 2014.
or
2007 2014
Total debt to income ratio (%)
2020
But rises in interest rates could increase pressure on borrowers.
This debt pile is a�ordable for now.
A two percentage point rise in the interest charged on total debt could leave households needing to find an additional £1000 a year to service those debts.
Consisting of
Part 3: Strong profits... for now
GDP(+2.6%)
Employment Real wages
Consumer confidence
+ + + =
=
£10,000per household by end of 2016
£1000
+2%=
With a positive economic backdrop, unsecured debt could rise to unprecedented levels.
20%
2010 2013 2015
Credit card issuers are seeing strong profits.
Strong profit and margins2002 2010 2014
Bad debts Average spreads
2002 2009 2014
Borrowers’ confidence is returning.
I am worried about my ability to repay:
31% 26% 18%
2 3
£239bn
172%169%
145%
in total unsecured debt
+10%
3% 3%
9% 10%
17%16%
12%2015
of us use credit to pay for essentials such as food or bills.
Less use credit to pay for essentials.
? ?Financial literacy in question as Britons take on more debt.
correctly estimated the costof a mortgage.
Only Only
correctly estimated the cost of a payday loan.
1 in 5 3%
for 35-44 year olds as some still feel the squeeze.
But t
his ris es to 20%
A resurgence in bad debt?• High debt to income• Rising interest rates
Changing consumer behaviour• Younger consumers using credit cards less• Less borrowing more transacting
Regulatory scrutiny• Interchange reduction• FCA market study• Cross subsidies
Intensifying competition• New forms of borrowing• New entrants to payments• Other credit card providers
But this will come under pressure in the coming years.
Future profits will be
squeezed
A fee for all? Introduction of annual fees would reduce any cross subsidies and diversify issuers’ revenue sources.
New sources of revenue Leveraging rich customer spend and location data from smartphones could open up new sources of value.
Now is the time to act...
Cracking mobile payments Unlocking the potential of mobile payments could rekindle interest from younger consumers.
Part 2: The 2014 PwC Credit Confidence Survey
2010 2013 2015 2010
20% 40%16% 13% 25%
2015
I am worried about losing my job: I am worried my pay will be frozen:Increased optimism over jobs and pay.

PwC | Precious Plastic 2015 | 5
Part one: Lending rebounds to record levels

6 | Precious Plastic 2015 | PwC
Total lending to consumers rose by over 2% in 2014 to £1.54 trillion (see figure 1), nearly twice the growth seen in 2013. The lion’s share of the increase in total borrowing was accounted for by secured lending, which increased from £1.28 trillion to £1.30 trillion as the mortgage market continued to recover. Competition between mortgage lenders has become increasingly intense which, alongside low funding costs, rising property prices and falling bad debt, has led to a decline in the cost of mortgages to home buyers. Government initiatives including schemes such as Funding for Lending and the Help to Buy scheme also buoyed the mortgage market, though the Mortgage Market Review has to some extent been a countervailing factor.
However, the relatively modest overall rate of increase in total borrowing (2%) was eclipsed by the acceleration of unsecured borrowing (see
Source: Bank of England, PwC Analysis * Data is based on December position. December 2014 includes 9 months of extrapolated student loan data.
Source: Bank of England * Data is based on December position. December 2014 includes 9 months of extrapolated student loan data.
Figure 1: UK Total lending and growth rate
Figure 2: Total UK unsecured lending and growth rate
2006 2007 2008 2009 2010 2011 2012 2013 2014*
Total Lending (£ tr)
Growth rateTotal lending
2005
1.18
1.29 1.41 1.46 1.45 1.45 1.45 1.48 1.50 1.54
0.0
0.4
0.8
1.2
1.6
(4%)
0%
4%
8%
12%
Growth rate (%)
2006 2007 2008 2009 2010 2011 2012 2013 2014* 2015 F
Unsecured Lending (£ bn) Growth rate (%)
Growth rate ForecastUnsecured lending
2005
211 213 222 234215 213 206 210 219
239 248
0
50
100
150
200
250
300
(12)
(6)
0
6
12
figure 2). Britons added nearly £20bn to their total unsecured borrowing during 2014, an increase of nearly 9% on 2013 – the largest percentage rise in more than a decade. Total unsecured borrowing now stands at £239bn, the equivalent of £8,936 per household (see figure 3). This significant increase in unsecured borrowing took place against an improved economic backdrop, which we believe will continue to be conducive to a growth in borrowing. PwC projects unsecured borrowing will grow over the next two years by between 4% and 6% annually. This projected rise would leave the average UK household with unsecured borrowing of close to £10,000 by the end of 2017, taking consumers into uncharted territory in terms of borrowing levels.

PwC | Precious Plastic 2015 | 7
Figure 3: Average unsecured borrowing per household
Source: Bank of England, Office for National Statistics, PwC Analysis * Data is based on December position. December 2014 included 9 months of extrapolated student loan data.
0
1,000
2,000
3,000
4,000
5,000
6,000
7,000
8,000
9,000
10,000
2008 2009 2010 2011 2012 2013 2014*
UK unsecured debt per household (£)
Student loan debtUnsecured debt per household (excluding student debt)
1,140
9,049
8,250 8,1087,812 7,882
8,214
8,937
7,909
1,315
6,935
1,496
6,612
1,679
6,133
2,023
5,859
2,263
5,951
2,620
6,317

8 | Precious Plastic 2015 | PwC
2. Falling unemployment: Britain’s unemployment rate is now back below 6% (see figure 5) for the first time since the post-financial crisis recession sent joblessness soaring. Even more positively, the employment rate, at around 73%, now stands at levels that have not been seen since 2008 – Britain has more people in work than ever before. However there are some doubts about this improvement: for example, many people
have left unemployment for part-time jobs, while the rise of the zero-hours contract means many of those ostensibly in employment have little certainty about their income. Nevertheless, the fact that so many more Britons have left the ranks of the unemployed is part of the explanation for the increases we are now seeing in consumer borrowing.
There are a number of economic factors that will underpin our projected growth in borrowing:
1. GDP growth: In 2014 the UK economy grew by 2.6%, its fastest rate since before the financial crisis. While some concern remains about the UK’s ability to continue to post strengthening growth figures – potential
headwinds include the economic problems in the eurozone, the uncertainties of this year’s general election and the ongoing effects of austerity and deficit reduction – PwC projects GDP growth will continue at around 2.5% in 2015 in our main scenario, with a plausible range of around 1.5-3.5% in alternative scenarios (see figure 4).
Figure 4: Alternative UK GDP growth scenarios
Source: ONS, PwC scenarios
(8%)
(6%)
(4%)
(2%)
0%
2%
4%
6%
2007 20162014 2015201320122011201020092008
% change on a year earlier
Strong recovery Renewed slowdown Main scenario
Scenarios
Improved economic backdrop underpins growth in lending

PwC | Precious Plastic 2015 | 9
Source: Office of National Statistics, PwC analysis
3. Rising real wages: In recent months, Britain has returned to positive real wage growth for the first time in more than five years (see figure 6). In part, this has been a result of the sharp fall in inflation, with the Consumer Price Index falling to just 0.3% during January 2015, amid lower energy and food costs. The Bank of England expects this unusually low level of inflation – which is well below its target of 2% – to persist in the
short term, with a dip into deflation possible during the Spring, although inflation may return to around target during 2017. At the same time, wage settlements in the UK continue to average around 2%, with the improvement in the labour market benefiting employees. An emphasis on discipline in the public sector may hold overall pay back, but the return to real wage growth looks set to endure.
Figure 5: Employment/Unemployment Rates 1995 – 2014
68
69
70
71
72
73
74
199
5
1996
1997
1998
1999
2000
2001
2002
2003
2004
2005
2006
2007
2008
2009
2010
2011
2012
2013
2014
Employment Rate (%) Unemployment Rate (%)
Employment rate (%) Unemployment rate (%)
4
5
6
7
8
9
10
Figure 6: Year on Year growth in Regular Pay and Real Wages
Source: ONS
(6%)
(4%)
(2%)
0
2
4
6
Jan
2006
Jun
2006
Jan
2007
Jun
2007
Jan
2008
Jun
2008
Jan
2009
Jun
2009
Jan
2010
Jun
2010
Jan
2011
Jun
2011
Jan
2012
Jun
2012
Jan
2013
Jun
2013
Jan
2014
Jun
2014
Regular Pay (excl. bonuses) Real wage growth
Year on Year Growth (%)

10 | Precious Plastic 2015 | PwC
4. Rising consumer confidence: Better wage settlements and lower unemployment are also linked to an important driver of borrowing: the recovery in consumer confidence that has taken place over the past 18 months to two years (see figure 7). In fact, while confidence has been improving since the middle of 2013, it only broke into positive territory – where more consumers feel confident than not – during last year. Clearly, where consumers feel more confident about
their economic prospects, their appetite for borrowing is likely to be higher as a result. And while the increase in confidence may have plateaued in recent months, consumers remain far more positive than during the difficult years between 2009 and 2012. This optimism is also reflected in PwC’s Credit Confidence survey, which reveals that borrowers feel relatively relaxed about their increasing levels of debt and their ability to stay on top of their borrowing (see page 18).
(45)
(40)
(35)
(30)
(25)
(20)
(15)
(10)
(5)
0
5
Jan
2007
Jun
2007
Jan
2008
Jun
2008
Jan
2009
Jun
2009
Jan
2010
Jun
2010
Jan
2011
Jun
2011
Jan
2012
Jun
2012
Jan
2013
Jun
2013
Jan
2014
Jan
2015
Jun
2014
Consumer sentiment index
Figure 7: Consumer confidence
Source: GfK

PwC | Precious Plastic 2015 | 11
Student loans account for 46% of the increase in unsecured debt seen in 2014 (see figure 8). This is a result of the overhaul of the funding system for higher education that took place at the beginning of the 2012-13 academic year, when tuition fees were raised from a maximum of £3,000 a year to £9,000 a year for new students, alongside a corresponding increase in the size of student loans available to pay for these fees. It seems likely that the significant increase in unsecured debt accounted for by student loans will continue in the years ahead. While applications to universities initially dipped following the funding shake-up, they have since bounced back; the university admissions service UCAS says applications are now at record highs1.
The average student loan value in 2014/15 is £11,710, a jump of more than 35% on last year’s figure (see figure 9). PwC estimates that the typical
student who began university post 2012 will graduate with unsecured debt of between £40,000 and £50,000. While student loans are offered on favourable terms – no repayments are due until borrowers’ earnings hit certain thresholds, for example – this level of borrowing is bound to have an impact on a graduate’s future borrowing behaviour. It may mean it takes longer for these borrowers to get on to the property ladder and may also make them less willing or able take on other unsecured debt. At the same time, there are doubts about how much of this debt will ever be repaid, given that loans not redeemed within 30 years are written off under the scheme’s rules. On some analyses of Treasury figures, student loan write-offs could total as much as £20bn a year in 30 years’ time2.
Continued growth in student borrowing
1 https://www.ucas.com/sites/default/files/january_application_rates_2015_final_0.pdf2 http://cdn.budgetresponsibility.org.uk/ExecSummary2014-FSR_OBR_web.pdf and PwC analysis
Figure 9: Student loans: value and number in the UK by, academic years
Notes: Data from 2014/15 is provisional (a) Values are for students from England only. Other figures included EU domiciled students (fee loans only)
Source: DfES statistical first release 32/2003 Student support: statistics of student loans for higher education in the UK; Student Support for Higher Education in England: Academic Year 2014/15 (Provisional) and earlier editions, SLC; Student Support Scheme Facts and Figures, www.slc.co.uk
Average loan value (£) Number (000's)
Number ('000s)Average value
1990/91 1995/96 2000/01 2005/06 2011/12 2012/13 2014/15
390 1,2502,900 3,470
6,8908,580
11,710
0
2,000
4,000
6,000
8,000
10,000
12,000
14,000
0
250
500
750
1,000
1,250
1,500
1,750
2,000
Figure 8: Breakdown of change in unsecured debt growth in between 2013 and 2014
Source: Bank of England, PwC Analysis
190
200
210
220
230
240
250
2013 Student loans Credit cards 2014Other (inc. overdrafts and personal loans)
Unsecured lending, £ billions
219.0
9.1
4.2
6.4 238.6
12 | Precious Plastic 2015 | PwC
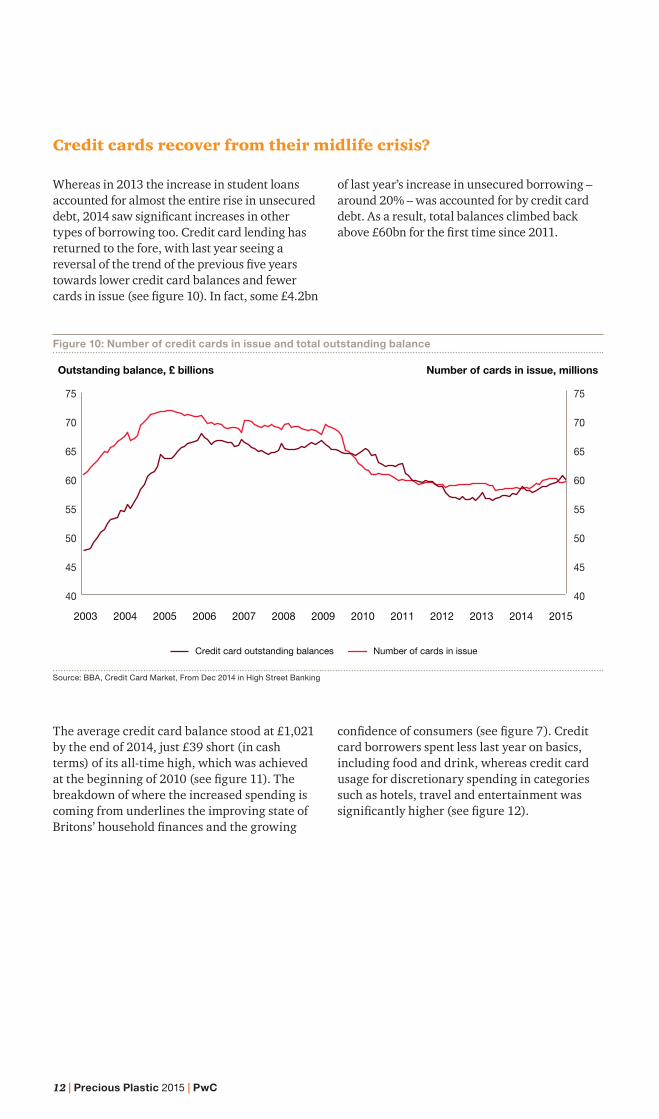
Whereas in 2013 the increase in student loans accounted for almost the entire rise in unsecured debt, 2014 saw significant increases in other types of borrowing too. Credit card lending has returned to the fore, with last year seeing a reversal of the trend of the previous five years towards lower credit card balances and fewer cards in issue (see figure 10). In fact, some £4.2bn
of last year’s increase in unsecured borrowing – around 20% – was accounted for by credit card debt. As a result, total balances climbed back above £60bn for the first time since 2011.
Credit cards recover from their midlife crisis?
The average credit card balance stood at £1,021 by the end of 2014, just £39 short (in cash terms) of its all-time high, which was achieved at the beginning of 2010 (see figure 11). The breakdown of where the increased spending is coming from underlines the improving state of Britons’ household finances and the growing
confidence of consumers (see figure 7). Credit card borrowers spent less last year on basics, including food and drink, whereas credit card usage for discretionary spending in categories such as hotels, travel and entertainment was significantly higher (see figure 12).
Figure 10: Number of credit cards in issue and total outstanding balance
40
45
50
55
60
65
70
75
40
45
50
55
60
65
70
75
2003 201520142013201220112010200920082007200620052004
Outstanding balance, £ billions Number of cards in issue, millions
Credit card outstanding balances Number of cards in issue
Source: BBA, Credit Card Market, From Dec 2014 in High Street Banking
PwC | Precious Plastic 2015 | 13
Figure 12: Value of credit card transactions (spot November, £m)
Source: BBA, Credit Card Market, From Dec 2014 in High Street Banking
The stagnancy in the credit card market in recent years partly reflected consumers’ lack of appetite for debt, but also prompted suggestions that the long-established product might be suffering something of a midlife crisis as it lost its appeal to younger borrowers and faced significant disruption from new entrants and digital innovation. In fact, the product has
proven to be resilient, and new entrants have been slower to break through than many expected. Nevertheless, PwC foresees some significant headwinds facing the industry, which are explored in more detail in section 3 (see page 27).
Figure 11: Average balance (£) per card
700
750
800
850
900
950
1,000
1,050
1,100
200
3
2003
2004
2004
2005
2005
2006
2006
2007
2007
2008
2008
2009
2009
2010
2010
2011
2011
2012
2012
2013
2013
2014
2014
2015
Average balance per card
Average balance (£) per card
Source: BBA, Credit Card Market, From Dec 2014 in High Street Banking
13,400
13,500
13,600
13,700
13,800
13,900
14,000
14,100
14,200
14,300
14,400
2013
2014
Aut
omot
ive
Fuel
s
Food
and
drin
k
Veh
icle
Sal
es a
nd S
ervi
ces
Fina
ncia
l
Hot
els
Mix
ed b
usin
ess
Oth
er r
etai
l
Trav
el
Ent
erta
inm
ent
Oth
er s
ervi
ces
Hou
seho
ld
Clo
thin
g
Value of credit card transactions (£m)

14 | Precious Plastic 2015 | PwC
Personal loans and overdraftsBritons borrowed around £6.4bn extra through personal loans, overdrafts, and other sources of lending (such as payday and peer-to-peer loans) during 2014, which accounted for around 32% of the total increase in unsecured lending last
year. In the personal loan sector, in particular, the reduction in average interest rates from a peak of 10.8% in 2009 to 4.8% in January 2015 may have encouraged more borrowing.

PwC | Precious Plastic 2015 | 15
Figure 13: Total Volume of Payday Loans (£bn)
0.0
0.5
1.0
1.5
2.0
2.5
3.0
2009 2010 2011 2012 2013 2014
Total Volume of Payday Loans (£bn)
Volume of Payday Loans (bn)
0.9 1.2 1.5 2.3 2.5 1.867,081
Mixed fortunes for newer forms of borrowingMeanwhile, payday loans and other relatively newer forms of lending, such as peer-to-peer, had very different prospects. The regulatory crackdown on payday lenders continues to bite with a package of measures, (see figure 13) including a cap on the total cost of credit, contributing to an expected further contraction
in the sector through 2015. Peer-to-peer lending is growing rapidly with the support of policymakers – in 2015, deposits with peer-to-peer platforms will become eligible holdings for savers’ tax-efficient individual savings accounts (ISAs), which is likely to increase the supply of funds as savers seek higher returns.
Source: OCD, CMA, FCA, Parliament and PwC analysis

16 | Precious Plastic 2015 | PwC
Figure 14: Total Household Debt to Income Ratio
March forecast
2005 20202012 2013 2014 2015 2016 2017 2018 2019201120102009200820072006
Total household debt to income ratio (%)
March forecast
130
140
150
160
170
180
190
However, it would be wrong to be complacent. The Office for Budget Responsibility (OBR) expects the debt to income ratio to climb rapidly in the coming years, forecasting it to break through the previous high of 169% by the end of 2020.
When combined with the prospect that interest rates will have risen by then, the picture becomes more concerning. While an increase in the Bank of England’s base rate during 2015 now looks less likely than before (though a small rise in late 2015 cannot be ruled out), the market is pricing in an increase from next year. Having grown conditioned to interest rates that are, in historical terms, anomalously low,
indebted Britons may be vulnerable to interest rate rises. PwC analysis indicates that a 2 percentage point rise in the cost of servicing household debt would require the average household to find more than £1,000 extra each year simply to cover the additional cost of servicing their debts.
While interest rate rises are likely to be gradual and well signalled by the Bank of England, the future could still problematic for those Britons who fail to plan adequately for the likely increase in the cost of servicing their debt.
Source: OBR Economic and Fiscal Outlook, Mar 2015 and Office for National Statistics
Time to push the panic button?With unsecured borrowing standing at an all-time high, and projected to increase further over the next two years to around £10,000 per household, is it time to hit the panic button? For now there are reasons to be relatively positive. At around 145%, the UK’s total household debt to income ratio remains well below its pre-crisis peak of 169% (see figure 14) and low by recent standards. In addition, historically low interest
rates, and intense competition between lenders has kept the cost of servicing this borrowing in check. PwC’s Credit Confidence survey indicates that consumers have grown more confident about their financial prospects and their ability to stay on top of their repayments (see pages 18-26), and are less dependent on borrowing for basic needs.

PwC | Precious Plastic 2015 | 17

18 | Precious Plastic 2015 | PwC
Part two: Consumers grow in confidence
The 2015 PwC Credit Confidence survey

PwC | Precious Plastic 2015 | 19
In conjunction with YouGov, we poll around 2,000 British consumers on their attitudes towards borrowing, their perceptions of their ability to repay what they owe, and their future borrowing intentions. First ran in 2008, the PwC Credit Confidence survey provides one of the most comprehensive and up to date pictures of Britons’ finances.
This year’s survey suggests Britons are feeling significantly more confident about their personal finances than in our last survey. They are more optimistic about their job security and earnings potential and less concerned about their ability to stay on top of debt, despite the significant increase in unsecured borrowing we have seen over the past 12 months. However, there are some warning signs amid the generally upbeat responses – and it is also questionable whether all consumers have a good understanding of the true cost of their borrowing.
Note: All figures, unless otherwise stated, are from YouGov Plc. Total sample size was 2126 adults. Fieldwork was undertaken between 29 – 30 January 2015. The survey was carried out online. The figures have been weighted and are representative of all GB adults (aged 18+).

20 | Precious Plastic 2015 | PwC
On top of debt repaymentsMost borrowers are currently feeling comfortable about their ability to make repayments on their outstanding debt (see figure 15). Almost two-thirds of respondents (65%) strongly agree or agree that they are able to cope with their repayments. Still, a small but significant minority are concerned – around one in seven (14%)
report that they are having problems. Certain age groups are much less likely to be coping: only 41% of 18-24 year-olds say they are able to make repayments on their outstanding credit. This may reflect their exposure to student loans or their lower income levels.
Figure 15: I am able to make repayments on all of the outstanding debt I have
(80%)
(60%)
(40%)
(20%)
0%
20%
40%
60%
80%
2008 2009 2010 2011 2013 2015
Total (%)
(80%)
(60%)
(40%)
(20%)
0%
20%
40%
60%
80%
18-24 25-34 35-44 45-54 55+ ABC1 C2DE
By age and socio-demographic (%)
Strongly agree Agree Neither agree or disagree Disagree Strongly disagree

PwC | Precious Plastic 2015 | 21
Strongly agree Agree Neither agree or disagree Disagree Strongly disagree
Furthermore, overall, Britons’ confidence in their ability to stay on top of their debt in the future has improved since 2013. Just 18% of people are worried about how they will make
Figure 16: I am worried about my ability to make repayments on debt in the future
(80%)
(60%)
(40%)
(20%)
0%
20%
40%
60%
80%
2008 2009 2010 2011 2013 2015
Total (%)
(80%)
(60%)
(40%)
(20%)
0%
20%
40%
60%
80%
18-24 25-34 35-44 45-54 55+ ABC1 C2DE
By age and socio-demographic (%)
future repayments, down from 26% in our last survey and 31% in 2010 in the aftermath of the crisis (see figure 16).

22 | Precious Plastic 2015 | PwC
Figure 17: I am worried about losing my job in the next 12 months
(80%)
(60%)
(40%)
(20%)
0%
20%
40%
60%
80%
18-24 25-34 35-44 45-54 55+ ABC1 C2DE
By age and socio-demographic (%)
(80%)
(60%)
(40%)
(20%)
0%
20%
40%
60%
80%
2009 2010 2011 2013 2015
Total (%)
Increasing confidence in jobs and payAs unemployment has fallen and economic growth has returned, consumers have become much less concerned about the prospect of losing their jobs. Just 13% of respondents are worried they may lose their jobs over the next 12 months, down from 16% in the last survey
and more than 20% in 2011 (see figure 17), when unemployment was peaking. This represents a significant improvement in sentiment and helps to explain why borrowers are feeling more relaxed about their ability to stay on top of their debt repayments.
Strongly agree Agree Neither agree or disagree Disagree Strongly disagree

PwC | Precious Plastic 2015 | 23
(80%)
(60%)
(40%)
(20%)
0%
20%
40%
60%
80%
2009 2010 2011 2013 2015
Total (%)
Figure 18: I expect my pay to be frozen or decrease over the next 12 months
(80%)
(60%)
(40%)
(20%)
0%
20%
40%
60%
80%
18-24 25-34 35-44 45-54 55+ ABC1 C2DE
By age and socio-demographic (%)
Similarly, while Britain has only just seen a return to positive real wage growth, consumers’ expectations about their future income have improved markedly. Around a quarter of respondents expect their pay to be frozen or decrease over the next 12 months, down a third from the last survey and from nearly 40% in 2011 (see figure 18). This anticipation of better times
ahead is likely to have fuelled appetites for consumer borrowing. Still, not everyone is so confident. Around a third of people aged between 35 and 44 expect that their pay could decrease or be frozen this year. With public sector wage settlements in particular still under pressure, this may not be an unduly pessimistic view.
Strongly agree Agree Neither agree or disagree Disagree Strongly disagree

24 | Precious Plastic 2015 | PwC
Borrowing for necessities falls backWith many consumers feeling more confident about their finances, increasing numbers are intending to save more over the year ahead. Almost half of the respondents (47%) said they would save more this year, up from 42% in the last survey and just 36% in 2009 in the immediate aftermath of the financial crisis (see figure 19). With borrowing rising so quickly, this
aspiration may not prove realistic for all. Some age groups are particularly keen to save more: 69% of 18 to 24 year-olds say they intend to increase their savings over the next 12 months. However, with interest rates still at rock bottom, savers may be disappointed by the returns they earn on their money.
Figure 19: I intend to save more over the next 12 months
(80)
(60)
(40)
(20)
0
20
40
60
80
2009 2010 2011 2013 2015
Respondents (%)
(60%)
(40%)
(20%)
0%
20%
40%
60%
80%
100%
18-24 25-34 35-44 45-54 55+ ABC1 C2DE
Respondents (%)
Strongly agree Agree Neither agree or disagree Disagree Strongly disagree

PwC | Precious Plastic 2015 | 25
Figure 20: I have needed to use credit to pay for essentials items in the last six months
PwC’s survey also shows dependence on credit to pay for essentials such as food and household bills has fallen to its lowest level since our survey began with only 12% of consumers now needing to borrow for this reason, down from 13% in the last survey and 15% at the height of the crisis (see figure 20). However, there are notable differences between age groups. One fifth of all 35-44 year-olds say they have used credit to pay
for essentials in the past 6 months, underlining the extent to which this section of the society appears to be finding the going tougher than others. One possible explanation is that five years of negative wage inflation may have been particularly difficult to cope with for this demographic, where parents with young children are most likely to be found.
2010 2011 2013 2015
Respondents (%)
20090%
4%
8%
12%
16%
20%
14%15% 15%
13%12%
25-34 35-44 45-54 55+ C2DEABC1
Respondents (%)
18-240%
4%
8%
12%
16%
20%
8%
18%20%
11%
7%
13%11%

26 | Precious Plastic 2015 | PwC
Figure 21a: If you take out a mortgage of £200,000 on a fixed interest rate of 4% over 25 years, roughly how much do you think you would pay back IN TOTAL (i.e. including the cost of interest)?
Figure 21b: If you take out a £100 loan from a payday loan provider, for two weeks at an APR of 1509%, roughly how much do you think you would pay back IN TOTAL (i.e. including the cost of interest)?
£200,000 to
£249,999
£250,000 to
£299,999
£300,000 to
£349,999
£350,000 or more
Don't know0%
5%
10%
15%
20%
25%
30%
9%
19%21%
23%
28%
Correct answer
% respondents
£100 to £119 £120 to £139 £140 to £159 £160 or more Don't know0%
10%
20%
30%
40%
50%
60%
3% 9%16%
48%
24%
Correct answer
% respondents
Poor financial literacy hinders planning for the futureThis year’s survey also assessed consumers’ understanding of the cost of borrowing. Unless consumers have a reasonably accurate picture of the cost of their borrowing, their assessment of their ability to meet those costs may prove inaccurate. On both counts, the survey suggests, there is much work to do to improve knowledge and understanding.
Asked to estimate the full cost of a £200,000 mortgage priced at 4% a year over 25 years (see figure 21a), just a fifth (21%) of consumers selected the correct answer of between £300,000 and £350,000. Worse still, just 3% of consumers were able to correctly estimate the cost of a payday loan made over two weeks, (see figure 21b) underlining the confusion about this sort of borrowing, which may be affordable over the very short term, but far more expensive for longer periods.
This lack of knowledge is worrying and could lead to consumers making poor choices about how much they can afford to borrow. These findings underline the need for regulators and lenders to, not only pursue greater transparency,
but to also to simplify products and in how their costs are communicated – to help consumers make informed choices based on a better understanding.

Part three: Strong profits.... for now
PwC | Precious Plastic 2015 | 27

28 | Precious Plastic 2015 | PwC
The Stars align for lenders… for nowA number of factors have combined to deliver strong profits for unsecured lenders, and in particular credit card issuers. In the very short term, this looks set to continue and is being driven by three main factors:
1. Strong top line growth – While the UK consumer credit market is mature, and long-term growth prospects are therefore somewhat limited, in the short term lenders are benefiting from strong growth (9% in 2014) as Britain falls back in love with borrowing. We project this growth will continue (circa 4% – 6% annually) for the next two years, as increasing supply of credit coincides with rising demand.
2. Falling bad debt – The improved economic backdrop, particularly rising real wages and increased employment, has fed through to a significant reduction in personal insolvencies (figure 22) and bad debt (figure 23), which have both fallen back to pre-crisis levels. For credit card issuers, the steps taken to tighten underwriting criteria and improve collections activities have, combined with rising employment and real wages, left write-offs at only 2.7% in 2014, a low last seen in 2002 (figure 23). We project write-offs will fall further through 2015.
3. Widening spreads – Whereas spreads on some forms of unsecured lending – personal loans (see figure 24), for example – have fallen significantly over the last four years, this has not been the case with credit cards. Average spreads on credit cards stand at around 17.5% today compared to around 11% in 2007 (figure 25). These higher spreads were explicable in the immediate aftermath of the financial crisis: while Bank of England base rates were low, funding costs were relatively high and bad debt hit record levels. In addition, issuers were wrestling with structural changes to their revenue model such as the capping of penalty fees and the reduction in income from ancillary insurances such as payment protection. Since then, however, funding costs and bad debt have fallen, while spreads have remained high, resulting in strong margins and profits.
Figure 22: Quarterly number personal insolvencies
0
5
10
15
20
25
30
35
40
Q2
2003
Q4
2003
Q2
2004
Q4
2004
Q2
2005
Q4
2005
Q2
2006
Q4
2006
Q2
2007
Q4
2007
Q2
2008
Q4
2008
Q2
2009
Q4
2009
Q2
2010
Q4
2010
Q2
2011
Q4
2011
Q2
2012
Q4
2012
Q2
2013
Q4
2013
Q2
2014
Q4
2014
(p)
Volume (000's)
Bankruptcy orders Debt relief orders Individual voluntary arrangements
Total
Source: Insolvency service

PwC | Precious Plastic 2015 | 29
Figure 23: Credit write-offs as a proportion of outstanding balances
Source: Bank of England
Figure 24: Monthly interest rate of UK monetary financial institution (excl Central Bank) sterling personal loan, 10k to households
0%
2%
4%
6%
8%
10%
% write-o�s
1993
1994
1995
1996
1997
1998
1999
2000
2001
2002
2003
2004
2005
2006
2007
2008
2009
2010
2011
2012
2013
2014
2015
Source: Bank of England
Average credit card interest rate Bank base rate Spread
0%
2%
4%
6%
8%
10%
12%
2005
2005
2006
2006
2007
2007
2008
2008
2009
2009
2010
2010
2011
2011
2012
2012
2013
2013
2014
2014
2015
Spread/rate
30 | Precious Plastic 2015 | PwC
Figure 25: Average credit card interest rate versus Bank of England rate
Average credit card interest rate Bank base rate Spread
Sep
02
Sep
03
Sep
04
Sep
05
Sep
06
Sep
07
Sep
08
Sep
09
Sep
10
Sep
11
Sep
12
Sep
13
Sep
14
Mar
02
Mar
03
Mar
04
Mar
05
Mar
06
Mar
07
Mar
08
Mar
09
Mar
10
Mar
11
Mar
12
Mar
13
0%
2%
4%
6%
8%
10%
12%
14%
16%
18%
20%
Source: Bank of England
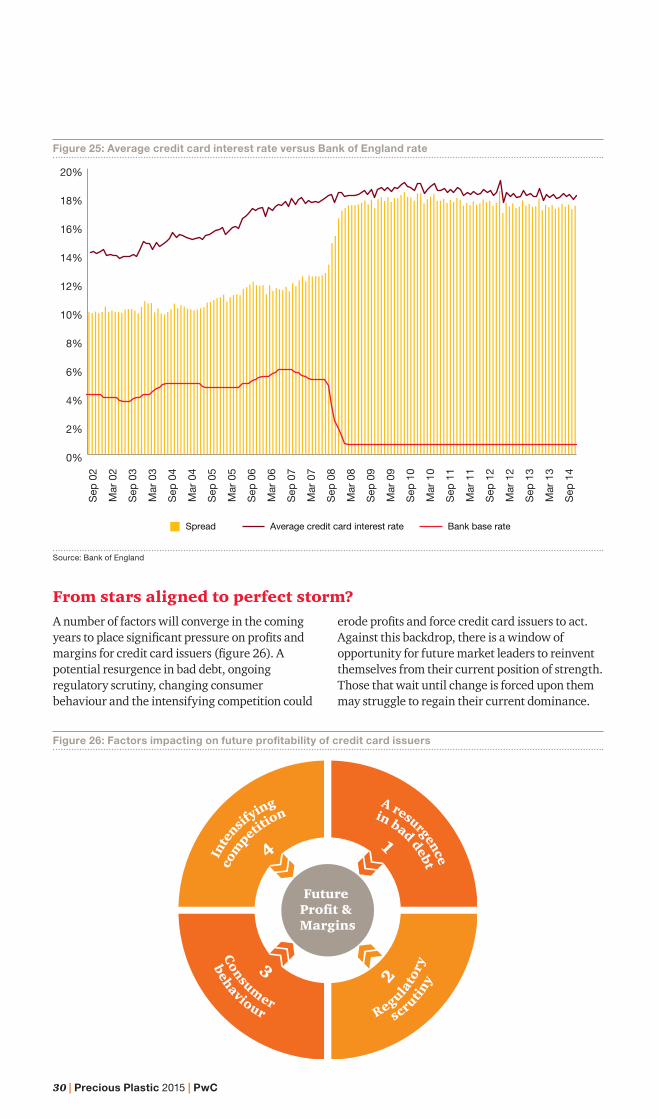
From stars aligned to perfect storm?A number of factors will converge in the coming years to place significant pressure on profits and margins for credit card issuers (figure 26). A potential resurgence in bad debt, ongoing regulatory scrutiny, changing consumer behaviour and the intensifying competition could
erode profits and force credit card issuers to act. Against this backdrop, there is a window of opportunity for future market leaders to reinvent themselves from their current position of strength. Those that wait until change is forced upon them may struggle to regain their current dominance.
Future Profit & Margins
Regulato
ry
scrutiny
Consum
er
behaviour
Inte
nsifying
com
petition
4
2
3
1
A resurgence
in bad debt
Figure 26: Factors impacting on future profitability of credit card issuers

PwC | Precious Plastic 2015 | 31
A resurgence in bad debt?Despite PwC’s annual Credit Confidence survey revealing a relatively high degree of confidence among consumers about their ability to stay on top of their debts (page 18), we believe affordability of the UK’s debt pile will come under significant pressure in the coming years, which will undermine top-line growth for lenders and could feed through to a resurgence in bad debt.
This will be driven by three main factors:
• Overall debt to reach an all-time high – Unsecured debt is rising faster than at any time since before the crisis. With this growth set to continue over the coming years, as set out in Section 1 of this report, we project that unsecured borrowing will reach an-all time high, in cash terms, of around £10,000 per household by the end of 2017.
• Total debt to income ratio to reach an all-time high – More significant than the absolute amount of debt is its affordability. With the total household debt to income ratio set to reach a new high of 172% by 2020 (compared to around 145% today and 169% at the height of the crisis), we believe households will feel the squeeze.
• Rising interest rates – While the prospect of interest rate rises in 2015 appears to be receding, we expect rates to begin rising in 2016. While the increase is likely to be gradual and well signalled by the Bank of England, we believe UK consumers are to some extent conditioned to the record low base rate and are vulnerable to increases. PwC analysis suggests that a 2 percentage point increase in the cost of servicing total household debt would require households to find an extra £1,000 a year just to cover the incremental interest costs.
Our survey shows higher levels of anxiety amongst some consumers about their ability to make repayments on their debts – particularly those on low and middle incomes (see figure 27). An increase in base rates would also likely increase lenders’ funding costs. This, combined with higher bad debts, will squeeze margins unless the rise is passed on to consumers either in the form of higher interest rates (which will be difficult as rates have already risen steadily over the last seven years) or offset by new sources of revenue (such as the introduction of annual fees see page 39).
Figure 27: Percentage of respondents who are worried about their ability to make repayments on debt in the future by income level
Source: PwC/YouGov Credit Confidence Survey 2015
Under £9,999
£10,000 to £19,999
per year
£20,000 to £29,999
£30,000 to £39,999
per year
£40,000 to £49,999
per year
£50,000 to £99,999
£100,000 and over
0
5
10
15
20
25
30
35
40% of respondents
Income level
Average

32 | Precious Plastic 2015 | PwC
While the industry has been dealing with heightened regulatory scrutiny for some time, the transfer of consumer credit regulation from the Office of Fair Trading to the Financial Conduct Authority a year ago, and the associated shift in focus towards sound business models, consumer protection and customer outcomes, has taken this to a new level. We set out in figure 29 the myriad of regulatory scrutiny facing the industry.
Whereas previous interventions in the credit card market by the OFT and others have tended to focus on individual aspects of the product on a relatively piecemeal basis (for example, capping late fees or changing payment hierarchies), the FCA’s current market study is taking a more comprehensive view and cuts right to the heart of the business model.
This is particularly the case with the FCA’s examination of potential customer cross subsidies, i.e where a group of customers may be contributing disproportionally, while others enjoy the utility of a credit card at low or no cost. While cross subsidisation may not be an issue in itself, and is widespread in other industries (for example, those at the front of the plane subsidising those at the back), the issue in relation to credit cards is the potential ‘reverse Robin Hood’ effect: i.e those with less means and/or financial literacy may be subsidising the rest. The regulator’s methodology in analysing this potential issue will be important: for example, the picture will differ significantly if cross subsidies are examined on a risk adjusted basis as opposed to analysing it purely on revenue contribution.
We set out illustratively in figure 28 how the cross subsidy might be working. We chart how the cross subsidisation might have evolved, from the relatively unrestricted period the industry enjoyed up to the late 2000s, to how it might look in the near future when cuts in interchange fee income come into effect – as well as to how it might look in a hypothetical future scenario where annual fees are introduced and there is a corresponding reduction in interest rates charged to customers (which would also make credit cards a more attractive source from which to borrow).
It may be the case that the various piecemeal regulatory interventions over the years have exacerbated the cross subsidy issue, with issuers’ revenues increasingly concentrated in interest income (and therefore a smaller segment of customers)... as other revenue sources have become restricted. Futhermore, the proportion of customers
paying interest on their credit cards has been reducing over recent years, further concentrating the revenue contribution to a smaller and smaller proportion of customers. According to the UK Cards Association, in 2014, 61% of consumers were ‘transactors’ (that is, they paid no interest) while only 39% were ‘revolvers’ who paid interest. Included in the ‘revolver’ categorisation were further subsets of 11% who were ‘partial payers’ and 6% who were ‘minimum repayers’. All other things being equal, this revenue concentration in revolvers will become more acute following the expected interchange reduction due to take effect in the latter part of 2015, as a revenue source that a wider group of customers contribute to (in direct proportion to their usage of the product) is curtailed.
The terms of reference for the FCA’s market study also include a focus on the customer outcomes associated with balance transfer offers. In recent times, there has been something of a divergence in the industry, as some have increased their focus on balance transfers as a means of customer acquisition, while others have moved away from introductory pricing entirely. Using the recent outcome of the FCA’s market study into the savings market as a proxy, we expect any measures taken by the FCA in relation to balance transfers to be anchored in enhanced transparency and simplicity to help customers make more informed choices, rather than more direct measures such as an outright ban.
Transparency is the third main focus of the FCA’s market study, which may, for example, result in a requirement for firms to review their customer-facing information so that customers can see ‘at-a-glance’ key information about product costs and features. This is an area also being probed by the Competition and Markets Authority, which is reviewing competition in the UK retail banking market. PwC anticipates that measures suggested by the CMA may include a price comparison website authorised by the FCA – as the CMA recently recommended in relation to payday lending products. However, given the relatively poor levels of financial literacy highlighted in our Credit Confidence survey (page 18), transparency measures alone may not be sufficient to ensure customers make informed choices. That may also require further simplification of products and a responsibility on lenders proactively to support customers who may be making poor choices – those who regularly make only the minimum payment on their credit card over a sustained period of time, for example.
Regulatory scrutiny

PwC | Precious Plastic 2015 | 33
Figure 28: Illustrative analysis only
1 Scenario description
• Revenue less concentrated in revolvers, and contribution was shared more evenly across the customer base due to availability of multiple other revenue sources
• While cross-subsidisation may exist, it is less acute than in the following ‘near future’ scenario
• With a number of revenue streams curtailed and the upcoming cap on interchange fees, revenue is becoming significantly more concentrated in revolvers
• At the same time, fewer people are revolving, as consumers increasingly use credit cards to pay rather than borrow
• The cross subsidy may be at its most acute
• This hypothetical scenario assumes the introduction of an annual fee across all customers and some corresponding reduction in customer interest rates (i.e. the introduction of an annual fee is broadly revenue neutral)
• The reduced interest rate also serves to make the credit card a more attractive borrowing source, driving an increase in the number of revolvers
PastNear future
Future with annual fees
2 Illustrative assumed revenue splits
Interest Income 50% 80% 55%
Interchange 15% 10% 11%
Penalty Fees 10% 4% 4%
Annual Fees - - 20%
Insurances 20% - -
FX 5% 6% 7%
Other - - 3%
3 Potential degree of cross subsidisation
Medium/Low High Low
4 Revenue Contribution ranked low to high by customer decile (total = 100%)
% C
on
trib
uti
on
by
dec
ile
RevolversTransactors RevolversTransactors Transactors Revolvers
1 2 3 4 5 6 7 8 9 10 1 2 3 4 5 6 7 8 9 10 1 2 3 4 5 6 7 8 9 10
5 Profit Contribution ranked low to high by customer decile (total = 100%)
% C
on
trib
uti
on
by
dec
ile
1 2 3 4 5 6 7 8 9 10 1 2 3 4 5 6 7 8 9 10 1 2 3 4 5 6 7 8 9 10
The illustrative analysis below groups a hypothetical mass market credit card provider’s customers into deciles and ranks them according to both their revenue and profit contribution. We have illustratively split customers between ‘Revolvers’, i.e. those that pay interest and ‘Transactors’ i.e. those who clear their balance and pay no interest. We show three scenarios: ‘past’ (where credit card issuers had multiple revenue sources open to them), near future (i.e. following a period of attritional curtailment of revenue sources and the pending reduction in interchange income) and a future hypothetical scenario where annual fees have been introduced for all customers.

34 | Precious Plastic 2015 | PwC
Retail savings
Consumer credit
Date Regulatory action Scope Impact
January 2015
FCA study on retail savings market published
The study found that the savings market could work better for consumers, particularly in relation to (i) the lower interest rates on older accounts, (ii) weak transparency of alternative savings products with possibly better interest rates, (iii) hassle and low gains from switching and (iv) a convenience of holding both current accounts and savings accounts with the same provider (thereby acting as a barrier to separate providers of savings accounts)
The FCA have avoided some of the tougher regulatory interventions used elsewhere (such as outright ban of teaser rates, or enforced product simplification). Rather, it is aiming to improve the information available to customers. They also aim to improve the switching process. Lastly, the FCA will explore lowering the barriers to account aggregators. This is potentially the most interesting as it may change the interface between consumers and banks
Date Regulatory action Scope Impact
July 2014 Review of debt collection process for payday lenders
In depth thematic review into the way the pay day loan industry collects debts and helps borrowers in arrears
An early action by the regulator, one of several measures (such as action on logbook lenders) which demonstrated it was not afraid to act swiftly
January 2015
Changes to consumer credit rules (CONC)
Credit broking and High Cost Short Term (HCST) credit
These introduced the HCST price cap and new restrictions on upfront fees for brokers – the latter coming in without prior consultation because of the concerns about the adverse impact on consumers
February 2015
Results of CMA investigation into payday lending market published
Payday lending practices and marketing
Recommends significant changes to payday lending market, including requirement for product details to be published on a price comparison website authorised by the FCA
February 2015
Occasional Paper No. 8 – Consumer Vulnerability
Practices of financial services firms in relation to customers in vulnerable circumstances
Reminders and pointers to employ methods to identify and assist customers in vulnerable circumstances
February 2015
FCA consults on changes to consumer credit rules and guidance (CP15/6)
Rules for guarantors of loans and APR and risk warnings in financial promotions plus comments
Updates following FCA’s concerns arising in supervision of CCA firms or issues raised by stakeholders.
March 2015
Results of FCA’s thematic review of HCST credit market (TR 15/3)
Arrears and forbearance in the HCST credit market
Too many firms have been failing to treat customers in arrears fairly. A stark warning from the FCA that firms which do not meet the FCA’s threshold conditions will be refused authorisation
June –August 2015
FCA to consult on implementing recommendations from CMA’s investigation into payday lending market
Follows on from CMA investigation on payday lending market
The number of payday lenders receiving full authorisation, as well as the full impact of the investigation on the market, should be known later this year
Figure 29: Regulatory timeline

PwC | Precious Plastic 2015 | 35
Date Regulatory action Scope Impact
October 2015
Consumer Rights Act to be brought into force
Looks to consolidate existing consumer protection law and reflect existing EU consumer rights directive
Should have an impact on unfair terms included in contracts, amongst other things
March 2016
FCA expected to complete authorisation process for all consumer credit firms. Interim permission regime ends
Determines firms authorised by the FCA in new regulatory regime
Firms will either be authorised by the FCA or forced out of the market. Payday lending firms may well be forced out earlier (end 2015)
April 2016
Full FCA regime for consumer credit comes into force
Marks the end of the transition period from the OFT to FCA
Follows on from authorisation process above
Q1-Q2 2017
FCA to review HCST price cap Will affect any payday lenders left in the market with FCA authorisation
There appears to be limited pressure for loosening, and a retightening of the cap may be likely. However, this will depend largely on how many higher cost payday and other lenders achieve FCA authorisation
By 2019 FCA to review retained Consumer Credit Act conduct requirements
Will review necessity and value of continuing the separate CCA legislation in light of FCA handbook
It would appear to make sense to consolidate conduct requirements into one place
Consumer credit (Continued)
Date Regulatory action Scope Impact
July 2013 PSD 2 (Payment Service Directive)
All providers of payment services across the EU
Expanded to cover new innovations in payments and extends the geographical scope of the current PSD
2014 EU proposal to cap fees paid by a merchant’s bank to a cardholder’s bank when a payment card is used (Interchange fees)
Payment services across the EU that attract interchange fees
Will have significant affect on both the credit and debit card markets.Explored in greater deal in Section 3. Likely to come into force in early 2016
20 March 2015
Payment Services Regulator consultation on competition concurrency guidance closes
The role of the PSR in relation to other UK financial services regulators on matters of competition
Will determine how the financial services regulators fulfil statutory objectives relating to competition matters
End March 2015
PSR’s policy statement on how it will regulate the payments industry
Rules for the regulation of the UK payment systems
Will introduce new rules for the operation of payment systems including access to the systems. Rules likely to come into effect in summer 2015. If EU interchange regulation is delayed, PSR may introduce domestic cap in advance
April 2015 PSR becomes fully operational Follows on from policy statement (above)
Follows on from policy statement (above)
October 2016
Non-eurozone countries to comply with the Single Euro Payments Area (SEPA) Migration Regulation
Non euro-countries involved in transaction with/within SEPA
Aims to harmonise national and cross-border payments
Payment services

36 | Precious Plastic 2015 | PwC
Issuers will need to adapt to a number of changes in consumer behaviour.
1 Transacting more, borrowing less UK consumers are increasingly using their credit cards as a method of payment rather than as a line of credit. While in absolute terms credit card borrowing is currently growing, the share of total unsecured gross advances that credit cards take has fallen from 70% in 2009 to 62% in 2014 (figure 30). Compared to other sources of borrowing, credit cards may now be less competitive (for example, personal loan rates have fallen significantly over the last five years). As a payment tool meanwhile, they are increasingly losing ground to debit cards (see figure 31) and have failed to deliver on the mobile payments promise, at least at any ubiquity or scale. Given that credit card issuers’ revenue is increasingly concentrated in interest income, the fact that growing numbers of customers use their credit cards to pay rather than borrow could be a cause for concern.
2 Increasing willingness to borrow from alternative sources Consumers are increasingly willing to borrow from non-bank lenders and in more innovative ways. Figure 33 shows the significant progress made by non-bank lenders since the crisis; far outstripping the mainstream banks in terms of growth in the provision of unsecured lending. New forms of borrowing are gaining ground – for example, consumer peer-to-peer lending grew by 108%3 in 2014.
3 Losing appeal to younger consumers Our survey shows a decline in the use of credit cards by younger consumers. In the 18-24 bracket, when asked if they have ever used a credit card, just 21% of respondents answered positively, down from 26% in 2013. In the 25-34 age group, 63% respondents answered positively, down nearly 10% from our last survey (figure 32). If this trend continues, as younger borrowers look for more affordable ways to borrow and more innovative ways to pay, credit card issuers will see their customer base age, as it is not sufficiently replenished by younger consumers.
Figure 31: The split of debit and credit card expenditure
Source: Data Monitor
Figure 30: Proportion of Gross Advances – Unsecured Lending (%)
2012 2014
Credit Card Other
20090%
20%
40%
60%
80%
100%
70% 66% 62%
30%34% 38%
% gross advances
Changing consumer behaviour
3 http://www.nesta.org.uk/sites/default/files/understanding-alternative-finance-2014.pdf
2014Credit Card Debit card
20090
20
40
60
80
100
66%50%
53%
34%
50%
47%
% expenditure

PwC | Precious Plastic 2015 | 37
Figure 32: Usage of credit cards by age
Figure 33: Bank vs. non bank lending indexed to Jan 2015
Percentage of respondents aged 18-24 who have ever used a credit card
18-24 Average 25-34 Average
2013 2015
26%
61%
21%
Percentage of respondents aged 25-34 who have ever used a credit card
2013 2015
72%63%61% 61%
21%
61%
0
20
40
60
80
0
20
40
60
80
Source: PwC/YouGov Credit Confidence Survey 2015
Source: Bank of England
60
70
80
90
100
110
120
130
140
150
160
170
Monetary Financial Institutions (Banks) Non-monetary financial institutions (non-banks)
2005
2005
2005
2005
2005
2006
2006
2006
2006
2006
2006
2007
2007
2007
2007
2007
2007
2008
2008
2008
2008
2008
2008
2009
2009
2009
2009
2009
2009
2010
2010
2010
2010
2010
2010
2011
2011
2011
2011
2011
2011
2012
2012
2012
2012
2012
2012
2013
2013
2013
2013
2013
2013
2014
2014
Index (Jan 2005 = 100)

38 | Precious Plastic 2015 | PwC
The final factor that will place pressure on credit card issuers is increasingly intense competition from four main sources:
• Other credit card providers While some providers continue to battle it out over their respective interest free balance transfer periods, others are looking to move away from the balance transfer model towards simple, transparent pricing structures. These different strategies have resulted in competition on multiple lines, with a number of participants also looking to differentiate through innovation, especially through mobile payments and point-of-sale solutions.
• Other sources of lending As credit card revenues become increasingly anchored to borrowing rather than payments, the competitive threat from potentially cheaper and more innovative forms of borrowing becomes more significant. In addition, traditional forms of debt – for example, personal loans – are becoming less expensive and more accessible as the supply of credit increases and may be more attractive than credit cards for financing larger purchases.
• New payment providers (the ‘piggy-backers’) Competition is perhaps most intense amongst rivals that seek to ‘piggy-back’ on existing payment mechanisms by relying on a primary funding source such as a credit card or a current account to which they can link their services. These competitors threaten to push credit cards down the value chain, increasing the distance between them and the customer. Apple Pay has the potential to be a signficant competitor in this space, offering a technology that couples mobile payments to a borrower’s existing credit or debit card account, but transforms the customer experience at the point of sale and opens up the possibility of more ubiquitous mobile payments.
• New payment providers (the ‘disintermediators’) Their competitors could bypass the card completely. Ripple, for example, is an entirely new payment system based on free, open source internet protocol, which could theoretically render existing payment systems obsolete. In practice, such threats are unlikely to effect existing card providers in the near future, and caps on interchange fees may make the payments market less attractive to new entrants. Still, credit card providers must have one eye trained on such radical alternatives in the medium to long term.
Competition is set to intensify
Confronting the window of opportunityWhile there are some good examples of innovation in the industry which should not be unduly discounted, the primary responses thus far to the changes in the market we have outlined, particularly to the revenue lost at the hands of regulatory interventions, have tended to be tactical in nature. Revenues foregone have simply been replaced by a gradual widening in credit spreads, including an increase in interest rates to customers. These changes, combined with the current favourable point in the cycle, have delivered strong profits and margins and have therefore to some extent shielded issuers from the imperative for more fundamental changes to the business model.
However, we believe that this tactical approach has run its course; can issuers realistically increase interest rates to consumers further when interchange is cut, when base rates rise (and funding costs increase) and/or when bad debt spikes again? Is it prudent for issuers to increasingly have their revenue so concentrated in interest income? Can credit card issuers afford to wait in order to counter the fact that the product is losing its appeal to younger consumers? And that it is losing market share to other forms of unsecured borrowing? We think not, and that for those who want to be the market leaders over the next decade, more fundamental change is required.

PwC | Precious Plastic 2015 | 39
Fee for all?
On an economic level at least, the most logical solution might be the widespread introduction of annual fees. Similar to the predominance of ‘free if in credit’ current accounts, the prevalence of no annual fee credit cards in the UK is to some extent an anomaly by international standards, with annual fees being common in many other markets. The introduction of annual fees would simultaneously reduce issuers’ revenue concentration in interest income and would also erode the inequitable reverse ‘Robin Hood’ customer cross subsidisation (if indeed its existence is confirmed through the FCA’s market study).
If the introduction of annual fees also coincided with some corresponding reduction in the interest rates on credit cards (that is, a redistribution of revenue between interest income and annual fees, as opposed to the introduction of annual fees being a mechanism to drive material incremental revenue) then this would go some way to increasing the attractiveness of credit cards as a borrowing vehicle, which, as we have seen, has been eroded as credit cards have lost market share to other – perhaps more economical – forms of unsecured borrowing.
However, the introduction of annual fees would prove a significant challenge given that customers have become conditioned to expect ‘free’ credit cards. In the absence of a regulatory intervention that compelled all issuers to charge annual fees, given the relatively wide availability of credit cards and the ease of switching (which years of strong marketing of balance transfer offers has underlined) there could be a significant first mover disadvantage to whichever issuer takes the first step as customers would likely switch en masse to no fee alternatives.
Using the outcome of other recent FCA market studies as a proxy (for example, the recent review of the savings market), combined with the difficulty in explaining to customers why
the widespread introduction of annual fees would be a good thing, we believe regulatory compulsion to charge annual fees is unlikely. Nevertheless, as we have seen in other areas of banking, there will be a strong expectation from the regulator for issuers to improve transparency and simplicity, and create a stronger correlation between a customer’s usage of the product (in the case of credit cards, not just the borrowing facility, but also the other utility offered by a credit card) and what they pay.
Given the difficulties associated with the introduction of annual fees, any such move would need to coincide with an enhancement of the overall customer value proposition, such that customers could be convinced of the value they are receiving in return for their annual fee; this enhancement might in part come from technological innovations such as mobile payments and/or enhanced loyalty programmes (see below).
New revenue sources
Another route, perhaps alongside, or as an alternative to annual fees is to open up new sources of revenue, the most obvious of which might stem from leveraging the rich customer data held by credit card issuers. Combining spend and customer demographic data with location based information from customer’s smart phones, opens up the possibility of retailers being able to deliver highly targeted and timely messages to existing or potential customers. Leveraging this data further and combining it with new point of sale technology, there is an opportunity to create extremely compelling customer loyalty programmes. Despite a number of false starts in the past, the combination of new point of sale technology, rich customer data and the ubiquity of smart phones and location data means all the component parts are in place to make such programmes a success, which could create significant value for retailers and therefore by extension to credit card issuers.

40 | Precious Plastic 2015 | PwC
Mobile payments
Despite the long promise of mobile payments, and widespread smart phone ownership, progress towards a ubiquitous solution has remained elusive. Among others, barriers have included:
1. Consumer appetite: While the prospect of mobile payments may in itself be an attractive proposition, the incremental enhancement between traditional card based payments – and now the rising popularity of contactless payments – and mobile payments has perhaps not been sufficient to drive significant customer demand and/or a willingness to pay (directly at least) for such a facility. While there have been multiple mobile payment advances, they do not fundamentally appear to address an unmet customer need.
2. Security: A survey of 2,000 adults by mobile payment operator Zapp found that perceived security risk was one of the biggest reasons (cited by some 50% of respondents) for not using mobile payments. In August 2013, the FCA initiated a Thematic Review into mobile banking and payments, highlighting its determination to be proactive in tackling potential risks including security and fraud.
3. Regulatory: On the one hand, the direction being set by regulators is, of course, to encourage competition, new entrants and an opening up of the payment systems. However, on the other hand, given the systematic importance of the payment networks, further regulatory scrutiny and control is likely to be exacted, which could prove to be a barrier to entry for new providers. The reduction in interchange income will also drain value; leaving payments as a low margin business with an increasingly complex regulatory backdrop. Lower interchange could also result in a further entrenchment of merchants with the current scheme providers, making new alternatives less attractive.
4. Merchant participation: Another critical barrier for achieving greater take up is the lack of investment in upgrading the merchant infrastructure, as most are yet to be convinced of the ‘winning’ standard. This has been a circular issue since the lack of clarity around the winning future standard, multiple initiatives and lack of future-proofing (i.e. functionality, scalability and interoperability) makes merchants understandably reluctant to upgrade their point of sale infrastructure.
Despite the barriers outlined above, we remain of the view that mobile payments will become ubiquitous and those who seek to lead the credit card market in the future will need to be part of it. As issuers reinvent their business model and change the way they charge customers for their services, the addition of mobile payments will be a vital competent in the overall customer value proposition.

PwC | Precious Plastic 2015 | 41
In conclusion
To sum up, the UK’s consumer credit sector finds itself at a crossroads. With the financial crisis now receding from people’s memories, unsecured debt is once again returning to the fore. The small increase in debt seen in 2013 was followed by a decisive uplift in borrowing last year: consumers are once again comfortable with taking on more debt.
Moreover, given the economic backdrop and better consumer confidence we believe this trend will continue. With borrowers looking forward to better prospects for their personal finances and feeling more confident about their ability to service their debts, we are heading towards record levels of unsecured debt.
And yet, there are challenges ahead. Debt may be affordable today, but rising interest rates and the increasing total household debt to income ratio could change that picture, particularly in an environment where lending had reached new heights. The prospect of rising bad debt is just one worry with which the industry should concern itself: greater regulatory scrutiny, changing consumer habits and mounting competition all pose a threat, particularly to credit card lenders.
Now is the time to act. For now, lenders are profitable, enjoying strong profits and the prospect of this continuing in the short term at least. This is the time for lenders to consider radical innovation, new business models and strategy renewal – rather than waiting until they have been forced on to the back foot.
We hope that you found the report interesting and useful. If you would like to discuss any of the issues raised, please feel free to contact one of the authors listed on page 43.

The consumer credit and payments markets continue to undergo significant change, demanding participants to be more competitive and innovative. The retail banking and consumer finance team at PwC is a leading adviser in this market. We offer a perspective derived from working with all types of market participants across multiple functions, including banks, card issuers, building societies and other non-financial institutions, specialist lenders and brokers. The team has extensive experience advising and assisting clients with:
• Strategy and business plan development
• Regulation and the business response
• Digital strategy and execution
• Strategic cost reduction
• Due diligence
• Risk
• Market and economic analyses
• Partnership strategies and contract negotiations
• Debt portfolio strategies
• Valuations
• Transactions and investment decisions
• Regulatory authorisations
About PwC
42 | Precious Plastic 2015 | PwC

PwC | Precious Plastic 2015 | 43
Our team
Simon Westcott (lead author)[email protected] +44 (0) 20 7804 1338
Steve DaviesRetail and Commercial Banking [email protected] +44 (0) 131 260 4129
Louise [email protected] +44 (0) 20 7804 1594
Stephen [email protected] +44 (0) 20 7804 1011
Nick ForrestEconomics & [email protected] +44 (0) 20 7804 5695
Victor KossStrategy&[email protected] +44 (0) 20 7393 3738
David [email protected] +44 (0) 20 7804 4794
Laura [email protected] +44 (0) 20 7212 1579
Richard ThompsonPortfolio Advisory [email protected] +44 (0) 20 7213 1185
Robert BouldingPortfolio Advisory [email protected] +44(0)20 7804 5236
The authors would also like to thank the following people for their contributions: Tom Crawford, Hannah Cox, Nick Pringle, Penny Bruce and Megan Charles

44 | Precious Plastic 2015 | PwC

PwC | Precious Plastic 2015 | 45

pwc.co.uk/financial-servicesThis publication has been prepared for general guidance on matters of interest only, and does not constitute professional advice. You should not act upon the information contained in this publication without obtaining specific professional advice. No representation or warranty (express or implied) is given as to the accuracy or completeness of the information contained in this publication, and, to the extent permitted by law, PricewaterhouseCoopers LLP, its members, employees and agents do not accept or assume any liability, responsibility or duty of care for any consequences of you or anyone else acting, or refraining to act, in reliance on the information contained in this publication or for any decision based on it.
© 2015 PricewaterhouseCoopers LLP. All rights reserved. In this document, “PwC” refers to the UK member firm, and may sometimes refer to the PwC network. Each member firm is a separate legal entity. Please see www.pwc.com/structure for further details.
150309-114916-EM-OS