Embed Size (px)
Citation preview

November 14,2013| Strictly private and confidential
In Pod We Trust Ross Colbert, Rabobank International
National Automatic Merchandising Association
P

2
Agenda
Introduction
Outlook on US Market for Single Cup Coffee 3
Today’s presentation will cover the following:
A brief look at Global Market for Single Cup Coffee 2
An introduction to Rabobank 1
2
Q & A 4

3
Introduction to Rabobank
Section I
3

4
M&A Advisory
Global Client
Solutions
Credit
Products
Global
Financial
Markets
Trade &
Commodity
Finance
F&A
Research &
Advisory
Fundamentals
Highest rated
Privately owned bank
Total Assets: $992bn
(December 2012)
> 10 million clients
Rabobank - Strong Fundamentals & Full Product Suite
Food & Agri Research & Advisory
Relationship Management/ Wholesale Banking
M&A Advisory
Safest Privately Owned Bank in the World (August 2013)
29th-largest bank worldwide by total assets (July 2013)
Global Financial Markets
Highest rated privately owned bank based on new ratings system (2011)

5
Rabobank… The Financial Link in the Global Food Chain
19/20 19 of the Top 20 Global Beverage companies are Rabobank clients
100 clients around the globe 100
$6.0 billion in commitments to the global beverage industry

6 6
Introduction to Rabobank
Strategic relationships throughout the global coffee, tea and cocoa sectors
Multinational coffee traders Diversified traders and processors
Roasters, consumer packaged goods and OCS companies
7
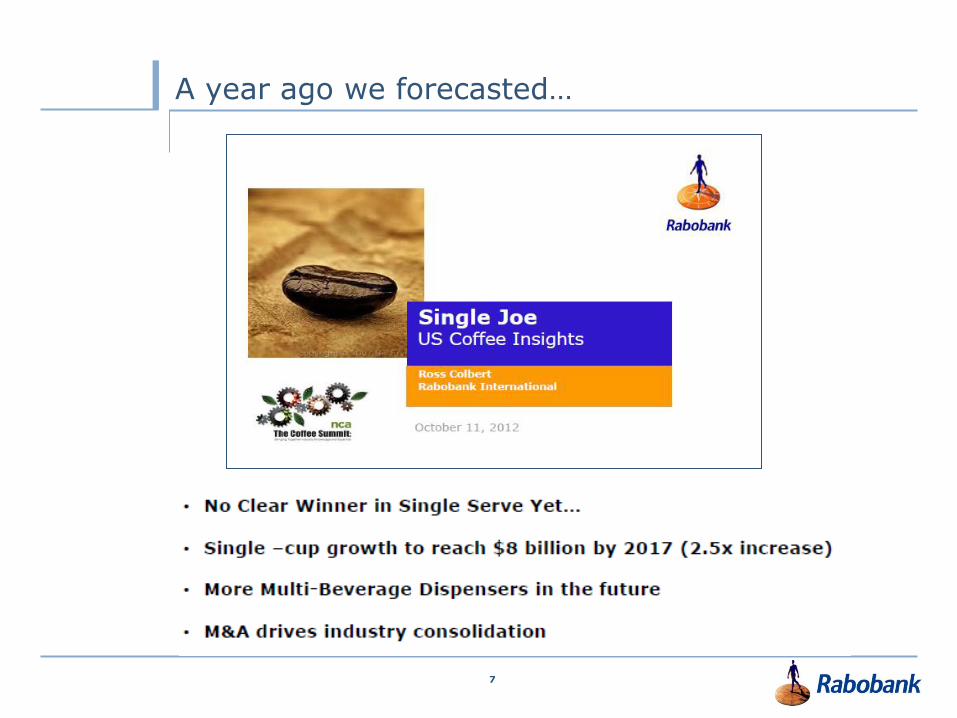
A year ago we forecasted…

8
2013 – A Transformational Year in Coffee!
$10.5 billion in new capital

9
Consumer confidence has moved lower since May

10
Small Business Optimism is at pre-recession level
DEC 2007
11
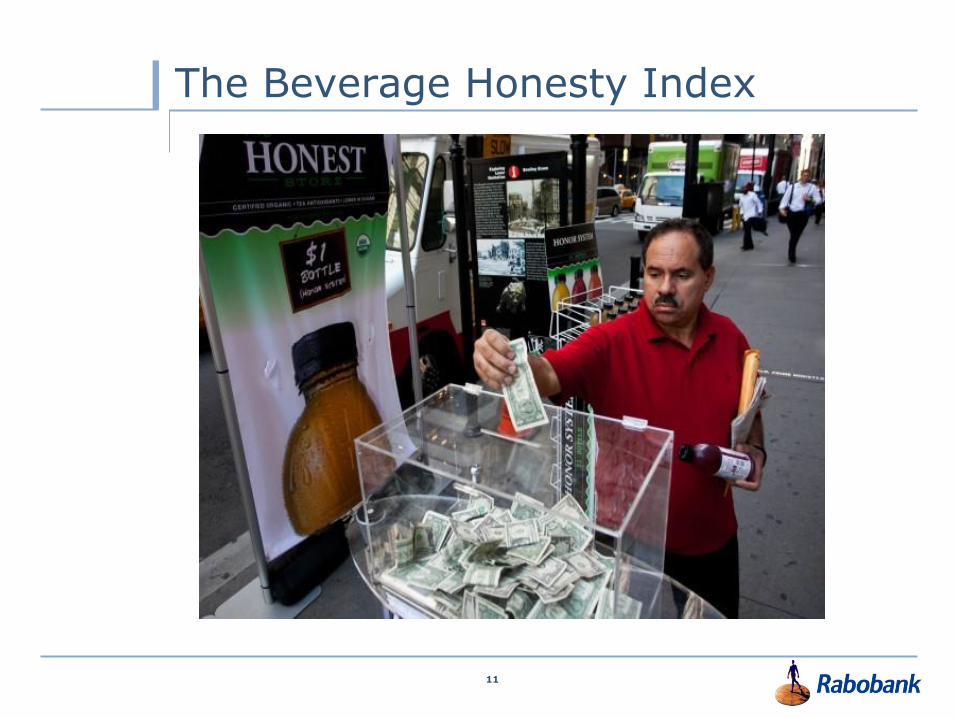
The Beverage Honesty Index

12
Global Coffee Pod Market
Section II

13
Consumers now demand
convenience, variety and
premium/quality taste, both at-
home and out-of-home
Changing consumption patterns and
recent hardware innovations are helping to drive
growth in the single-serve coffee
market
Increasing consumption in
emerging markets
Key coffee market drivers
Strategic considerations in global coffee demand
Shift from multi-serve to single-serve
Premiumization
Growing out-of-home offering
Growing demand in emerging markets
Product innovation
Consumers willing to pay more for convenience
Gourmet coffee shops continue to lose ground in specialty coffee to quick-service restaurants (“QSR”)
Growth focused on differentiation, brands and quality
Premiumization within R&G
Premium offerings also supported by fair trade, health benefits, organic and origin
At-home and out-of-home consumption changed by single-serve systems
Format innovations driving value growth in mature markets
Emerging markets to reach 50% of global coffee consumption by 2020¹
Growth in instant coffee driven largely by emerging countries
Innovation driving market share gains and gross profits
Consumer preference for convenience and quality driving innovation in single-serve R&G brewing technology
Regional differences in retail coffee value and volume
Western Europe continues to lead both value and volume sales of coffee
Asia Pacific second in value but trailing North America, Eastern Europe and Latin America in RTD retail volume
Coffee market fundamentals
8
Source: Rabobank

14
Coffee preferences vary greatly by region
• In 2012, North America and Western Europe, combined, accounted for over 90% of the global pod market
• North American is increasing at a much faster rate, recording 105% value growth in 2012, compared to Western Europe’s 12% increase.
• At over US$5 billion, the market for fresh coffee pods in Western Europe is still almost twice as large that of the North America.
Source: Euromonitor International/ Rabobank

15
• Fresh coffee pods are most successful in Western Europe and North America - high per capita consumption of fresh coffee & high income regions,
• Pods are actually benefiting from the recession - consumers are not spending money in cafes but purchasing pod coffee machines in order to replicate the café experience at home for a better value.
Pod market is geographically concentrated
Source: Euromonitor International

16
Global coffee value is driven by pod growth
• Between 2007 and 2012, pods expanded in value by an average annual rate of 26%, or 8 x faster than the remaining coffee categories combined.
• Pod penetration limited almost entirely to higher income markets like Western Europe and North America.
Source: Euromonitor International, Rabobank

17
Nespresso maintains widest global presence
Source: Euromonitor International
• Coffee styles are different around the world, and single cup formats remain fragmented.
• Nespresso continues to be the leader in global pod value share with nearly 26% share
• #2 Keurig is closing in fast – despite a far more limited market in North America.

18
• After North America, Latin America was the fastest growing region for coffee in 2012.
• In 2012, pods accounted for only 2% of the Latin America fresh coffee market, recording US$154 million in sales, with a presence in only six countries: Argentina, Brazil, Chile, Columbia, Mexico and Uruguay.
• The price of a cup of pod coffee in Latin America was more than 3x the price of any of the types of non-pod coffee.
• While Brazil accounts for 69% of Latin American pod sales, pods still made up only 2% of the Brazilian fresh coffee market in 2012.
Opportunities in Latin America
Source: Euromonitor International

19
• By registering patents for every aspect of the Nespresso system, Nestlé aimed to prevent other companies from manufacturing Nespresso-compatible pods With so many layers of protection, other companies have struggled to compete with Nespresso for share of the pod category.
• However, while Nespresso maintains the widest global penetration of any major pod brand, its presence in the rapidly growing North American market remains limited.
• Since 2009, Nespresso’s share in North America has declined from 5% to 3%.
Nespresso’s will be challenged outside of Europe
Source: Euromonitor International

20
Top Five Global Pod Brands: Value 2012
Rank Brand Company % value
share 2012
1 Nespresso Nestlé 25.8
2 Keurig GMCR 14.7
3 Senseo DE Master Blenders 1753
8.6
4 Nescafé Dolce Gusto
Nestlé 8.0
5 Tassimo Mondelez 6.6
Total 63.6
Top Five Global Pod Brands: Volume 2012
Rank Brand Company % volume
share 2012
1 Senseo DE Master Blenders 1753
17.7
2 Nespresso Nestlé 14.5
3 Keurig GMCR 7.4
4 Nescafé Dolce Gusto
Nestlé 6.2
5 Tassimo Mondelez 5.6
Total 51.4
Consolidated among top five brands
Source: Euromonitor International
21
US Coffee Pod Market Trends
Section III

22 Source: Euromonitor International
US market is over 25% of global retail value of pods

23
Channel %
Supercenters (WalMart) 33%
Supermarkets & Grocery 19%
Convenience 1%
Drugstores 2%
Department Stores 4%
Warehouse Clubs 10%
Home Retailers 9%
Office Supply Stores 8%
Natural Food Stores 3%
Internet 10%
Dollar Stores 1%
Single serve across multiple retail channels
Measured Channels
59%
Unmeasured Channels
41%
Source: Packaged Facts, Feb 2013
Unmeasured channel volume may be as high as 65% of total volume
Excluding: • Foodservice – QSR • Office Coffee Service • Hospitality & Leisure
24
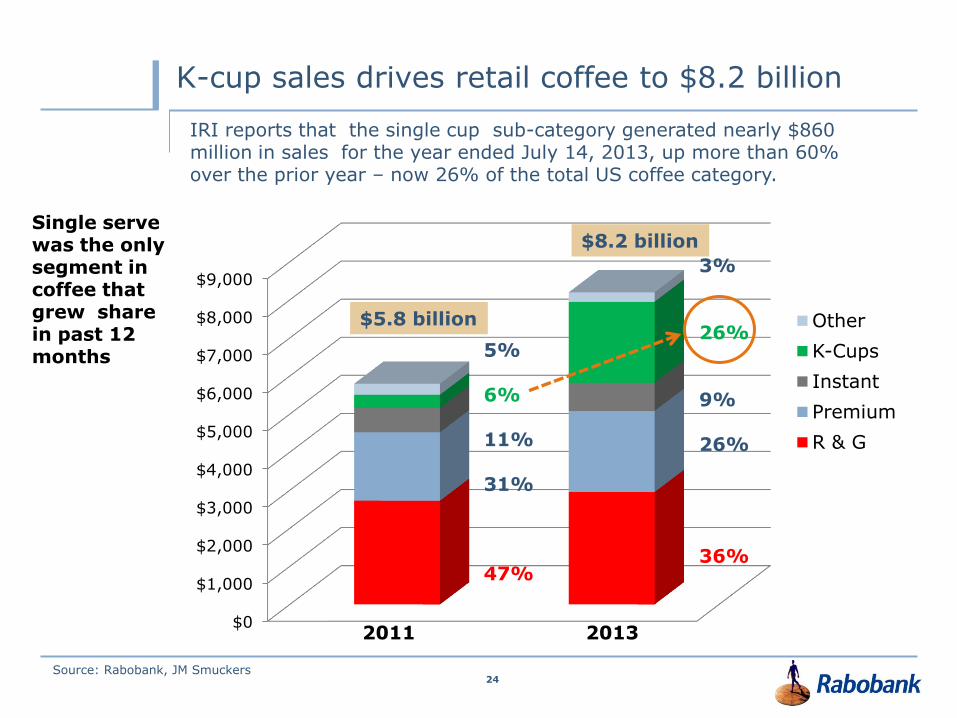
K-cup sales drives retail coffee to $8.2 billion
$0
$1,000
$2,000
$3,000
$4,000
$5,000
$6,000
$7,000
$8,000
$9,000
Other
K-Cups
Instant
Premium
R & G
5% 6% 11% 31% 47%
3% 26% 9% 26% 36%
2011 2013
IRI reports that the single cup sub-category generated nearly $860 million in sales for the year ended July 14, 2013, up more than 60% over the prior year – now 26% of the total US coffee category.
$5.8 billion
$8.2 billion Single serve was the only segment in coffee that grew share in past 12 months
Source: Rabobank, JM Smuckers

25
US Single serve retail market dominated by GMCR
Source: SymphonyIRI Rabobank, industry reports
• GMCR remains clear leader in US despite share loss
• Private label has estimated 8% share of single serve market
• Folgers also losing out to Kraft & Private Label brands
• Top 3 brands total over 73% of K-Cup sales
53.0
19.0
14.3
0
0
3.4 3.7
6.6
K-Cup Sales Dec 2012
Green Mountain
J.M. Smucker
Starbucks
Kraft
Peets
Eight O'Clock
Caribou
Private Label, Others
45.1
14.3
14.2
5.4
1.3 5.0
3.1 11.6
K-Cup Sales Sep 2013

26
Volume Share of K-Cups
K-Cup Volume Share in Food-Drug-Mass Channels
1Q12 2Q12 3Q12 4Q12 1Q13 2Q13 19-May 16-Jun 14-Jul 11-Aug 8-Sep
Caribou 7% 5% 4% 4% 3% 3% 3% 3% 3% 3% 3%
Eight O'Clock 0% 0% 1% 3% 4% 5% 6% 5% 5% 6% 6%
Green Mountain 60% 61% 60% 53% 49% 46% 45% 45% 47% 43% 45%
JM Smucker 22% 20% 20% 20% 19% 16% 17% 15% 15% 15% 15%
Starbucks 8% 11% 11% 11% 10% 11% 10% 11% 9% 11% 11%
GMCR-licensed 97% 97% 96% 91% 86% 81% 81% 81% 79% 78% 79%
Kraft 0% 0% 0% 0% 3% 5% 5% 5% 6% 6% 6%
Peet's 0% 0% 0% 0% 0% 0% 0% 0% 0% 1% 1%
Private Label /
Other 3% 3% 4% 9% 11% 14% 14% 14% 14% 15% 15%
Unlicensed 3% 3% 4% 9% 14% 19% 19% 19% 21% 22% 21%
Source: Symphony IRI.

27
• In past twelve months the category growth rate has slowed by over 62%
• Last three months in 55-46% range, likely even slower in Oct/Nov period.
• Outlook for volume growth in 2014 is +25-30% range
Category Volume Growth has slowed
0%
20%
40%
60%
80%
100%
120%
140%
Source: Symphony IRI
+124%
+46%

28
K-Cup Retail Price Segmentation
LTM Sep 2013
Volume
(K-cups) Sales
$/K-
cup
Peet’s 6,247791 5,362,042
$0.86 Starbucks 381,009,478 305,558,556 $0.80
Caribou 124,839,036 77,239,073 $0.62 Green Mountain 1,776,926,748 1,067,858,908 $0.60
JM Smucker 640,123,449 378,172,298 $0.59 Kraft 123,007,740 72,045,947 $0.59
Eight O‘ Clock 165,379,036 89,781,065 $0.54 Private Label / Other 421,720,527 190,852,043 $0.45 Total 3,639,253,805 2,186,869,932 $0.60
Source: Symphony IRI
• Premium brands (Peets & SBX) priced at 33% to 43% premium over GMCR
• Private Label/Other priced at 25% discount to GMCR

29
K-Cup prices appear to have stabilized
$0.00
$0.20
$0.40
$0.60
$0.80
$1.00
$1.20
Caribou Eight O'Clock Green Mountain
JM Smucker Kraft Peet's
Starbucks Private Label / Other Total
Source: Symphony IRI

30
Private label pods are expanding
• The expiration of Keurig patents in 2012 and overturned legal challenges to Nespresso exclusivity in Germany has resulted in a host of new private label brands using the Keurig and Nespresso formats.
• In the US, key retailers including Safeway, Wegmans, SuperValue, Kroger and Costco have entered the pod category using the K-cup format. Over time, it is likely that US retailer /unlicensed brands will increase from current 8%-10% to 12% share of the pod category.
Source: Euromonitor International, industry sources
Private label penetration still low in US – expected to reach 12% share in 2014
0.0
5.0
10.0
15.0
20.0
25.0
30.0
35.0
40.0
Netherlands Germany Switzerland Portugal Italy US
Coffee Pods - Private Label Share
8%
12%
31
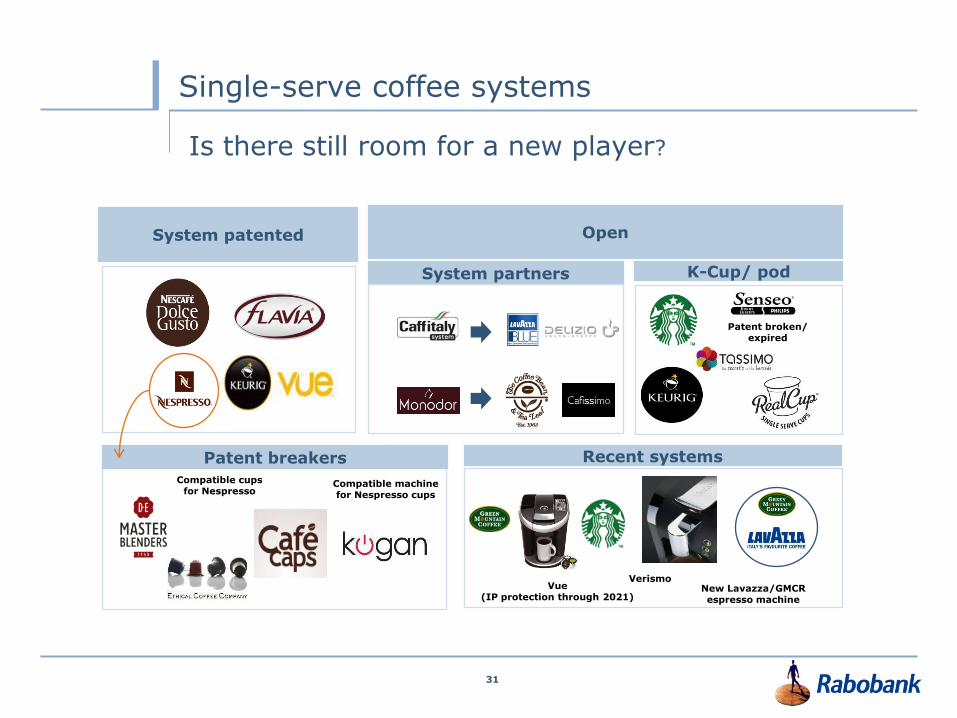
Single-serve coffee systems
System partners
Compatible machine for Nespresso cups
Compatible cups for Nespresso
System patented Open
K-Cup/ pod
Recent systems Patent breakers
Patent broken/ expired
Is there still room for a new player?
Verismo Vue
(IP protection through 2021) New Lavazza/GMCR espresso machine

32
“Make way for McCafé” in supermarkets in 2014
2009 2007 2013 2014
• McCafé was created and launched in Melbourne Australia in 1994 • McDonalds launched their very successful national US McCafe platform in 2009. • McCafe Premium Roast in bags began testing in Canada in November 2012 • October 2013, McDonald’s announced partnership with Kraft for retail distribution of McCafe
Premium in US supermarkets in 2014. • Kraft deal includes McCafe Single Cup launch, expected to be in Tassimo brewer format.

34
Innovation: Single-serve’s next generation
Growing convergence between single cup coffee & soft drinks

35
From Coffee …to “Keurig 2.0” ?
By Fiscal 2015 GMCR to launch:
Keurig 2.0 Interactive Brewer technology
Four Systems : Hot, Cold, Specialty & Water
Multiple platforms & partners for each system
Global applications & common components
Sustainability built-in
GMCR & Licensed -partner brands for each
3 -year pipeline of innovations
Choice, convenience and consistency drive consumer demand

36
Regional growth potential for pods
Chicago, Miami, Los Angeles , Atlanta and San Francisco among the largest markets - West Coast offers biggest upside

37
How Big Can GMCR Get by 2018?
Source:GMCR report
Model based on growing HHP of brewers through new innovations Increasing at home attachment by new products & occasions
2013
16 mil brewers 18% HHP
1.4 servings

38
GMCR Vision of 2018 is “10x current market”
Source:GMCR report
39
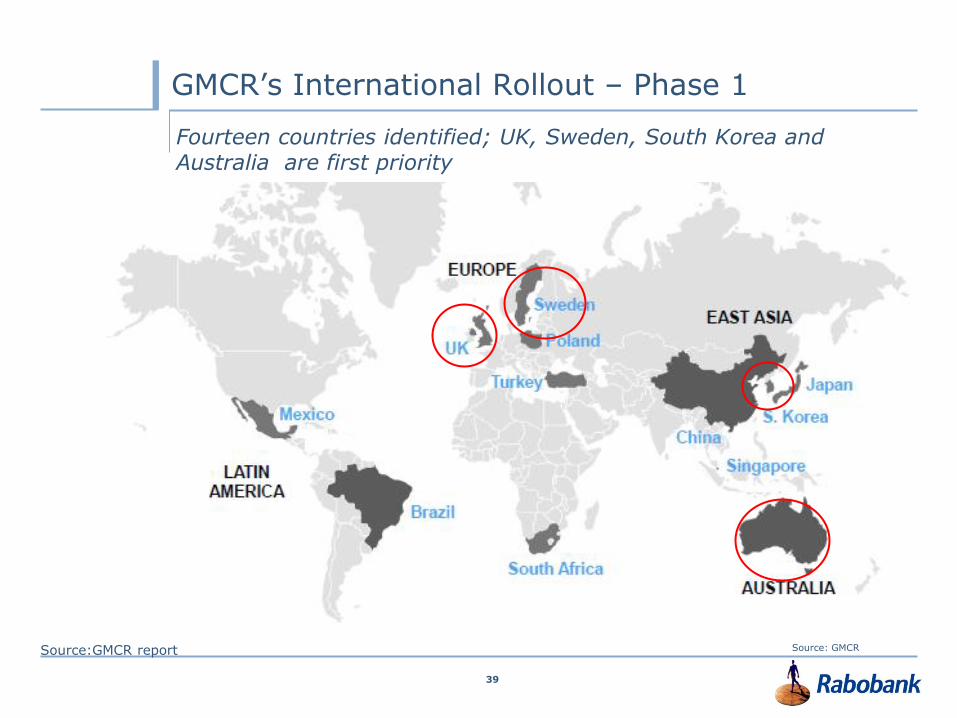
GMCR’s International Rollout – Phase 1
Source: GMCR
Fourteen countries identified; UK, Sweden, South Korea and Australia are first priority
Source:GMCR report

40
1. GMCR
• International rollout (UK, Sweden, S. Korea, Australia)
• Keurig 2.0 - Four systems with new partners in each
1) Hot
2) Cold
3) Specialty
4) Water
2. Other Players: Bevyz, SodaStream, Mars
3. Major appliance deals
4. Strategic partnership in Espresso?
5. Consolidation, M&A
What’s ahead in 2014-2015?
41
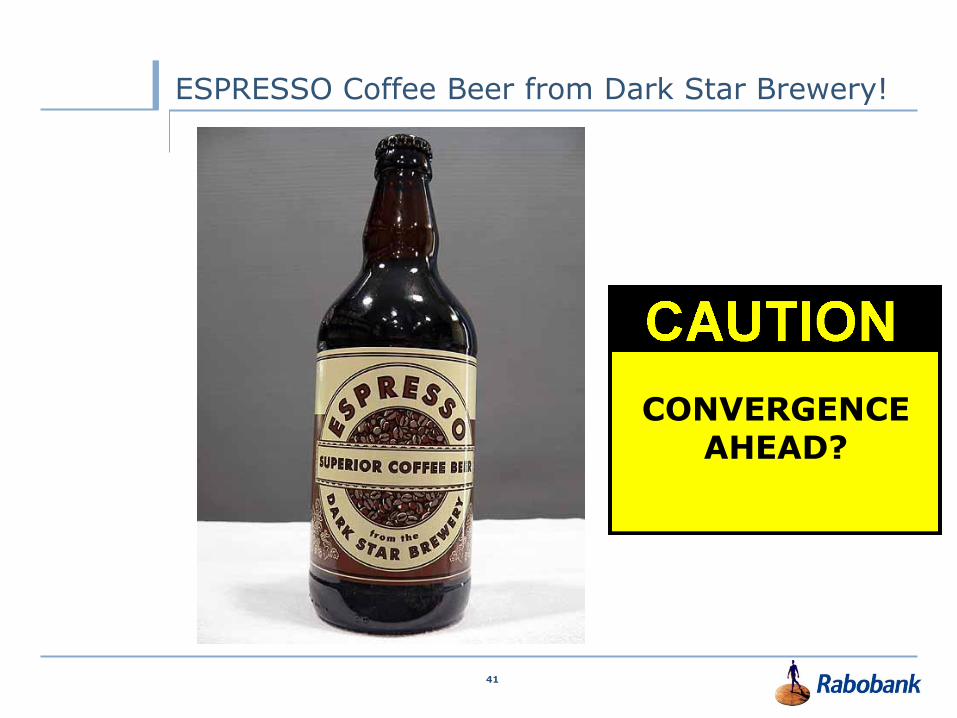
ESPRESSO Coffee Beer from Dark Star Brewery!
CONVERGENCE AHEAD?

42
For more information contact:
Ross Colbert, Global Strategist-Beverages
Rabobank International
245 Park Avenue – 36th Floor
New York, NY 10169
Thank You!