Embed Size (px)
Citation preview
THE REAL ESTATE INTELLIGENCE SERVICE (REIS)REIS India is a subscription-based research service designed to provide you with timely, accurate, insightful real estate intelligence across India to enable you to make informed decisions.
REIS India combines international expertise with local knowledge and is backed by Jones Lang LaSalle’s award-winning research platform. Real estate professionals across the globe have been relying on REIS in their decision-making process for over two decades in Australia and New Zealand, and over a decade in Asia.
This service consists of comprehensive real estate data, analyses and forecasts for institutional property players. The wide spectrum of outputs are prepared by a dedicated team of researchers located across 8 cities (Mumbai, NCR Delhi, Bangalore, Chennai, Pune, Hyderabad, Kolkata & Ahmedabad) in India.
SECTORAL COVERAGEOffice-Commercial & IT/ITESRetail-Mall & High StreetsResidential-Apartments, Villas & Plotted Development
SERVICE OFFERINGREIS India provides comprehensive historical market data for all real estate indicators by specific micro-markets:
•••
MARKET
2008
2009
2010
2011
2012
2013
2014 HIGHLIGHTS
MUMBAI Island City
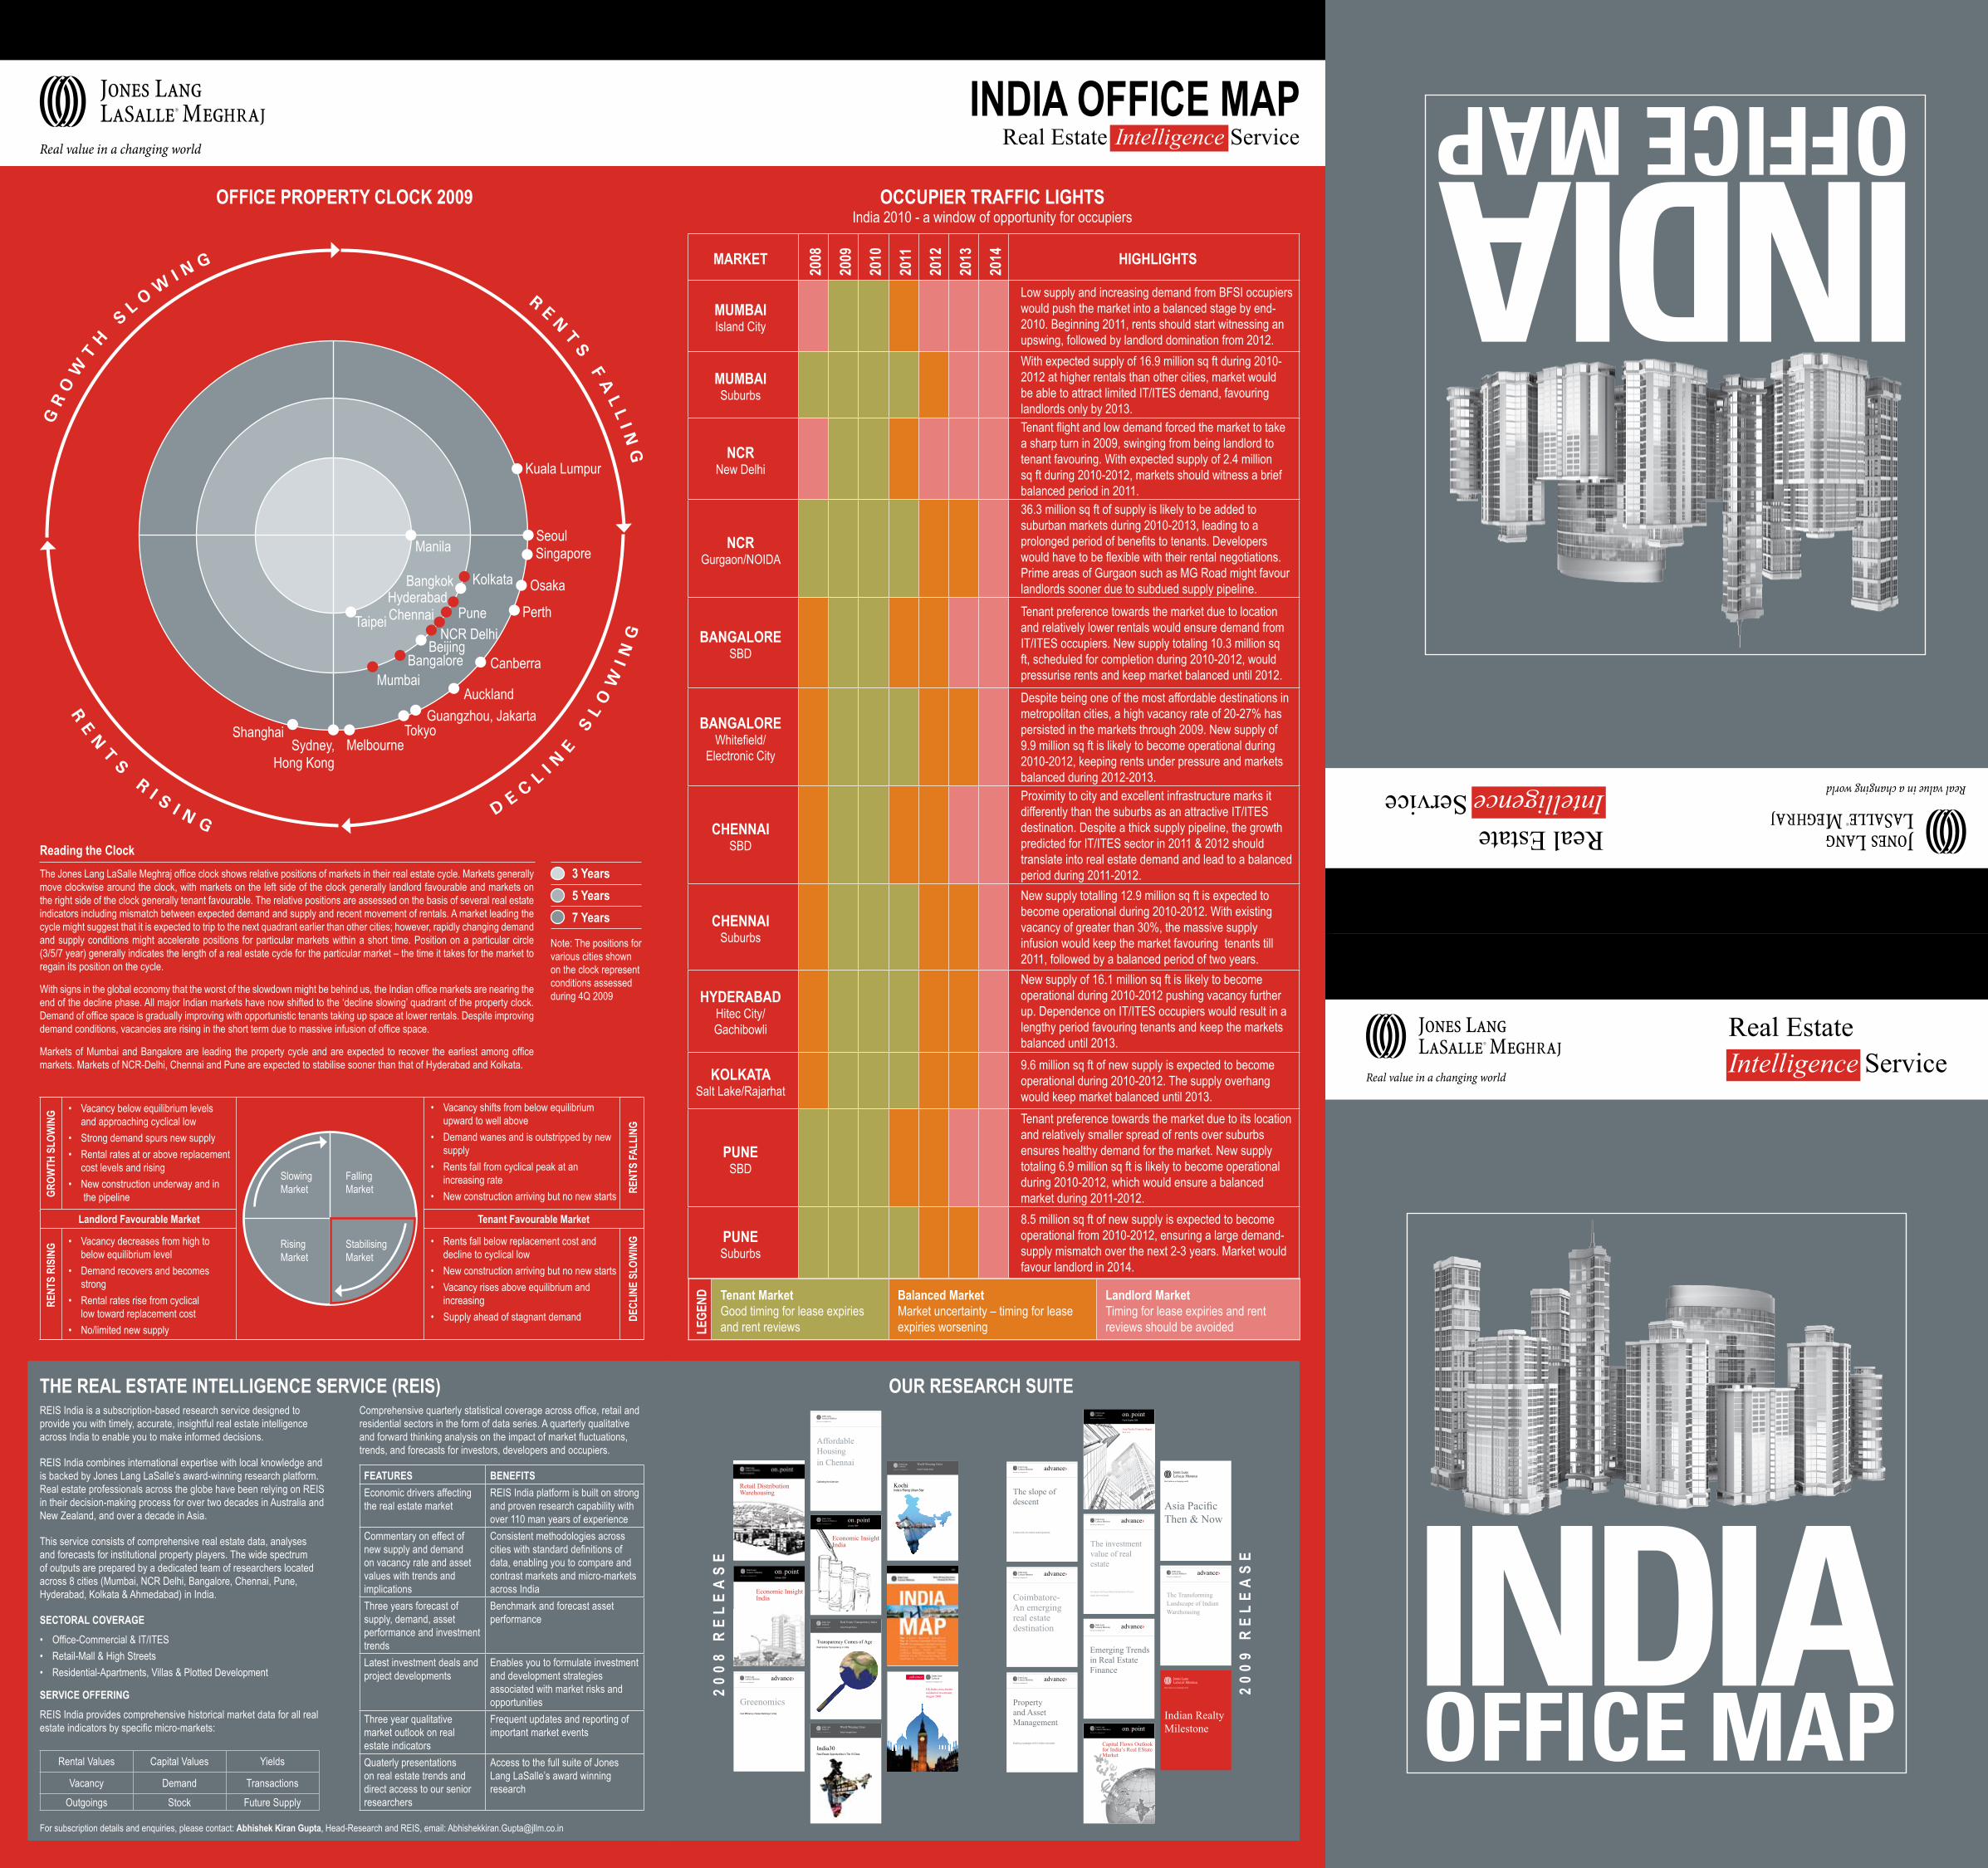
Low supply and increasing demand from BFSI occupiers would push the market into a balanced stage by end-2010. Beginning 2011, rents should start witnessing an upswing, followed by landlord domination from 2012.
MUMBAI Suburbs
With expected supply of 16.9 million sq ft during 2010-2012 at higher rentals than other cities, market would be able to attract limited IT/ITES demand, favouring landlords only by 2013.
NCR New Delhi
Tenant flight and low demand forced the market to take a sharp turn in 2009, swinging from being landlord to tenant favouring. With expected supply of 2.4 million sq ft during 2010-2012, markets should witness a brief balanced period in 2011.
NCR Gurgaon/NOIDA
36.3 million sq ft of supply is likely to be added to suburban markets during 2010-2013, leading to a prolonged period of benefits to tenants. Developers would have to be flexible with their rental negotiations. Prime areas of Gurgaon such as MG Road might favour landlords sooner due to subdued supply pipeline.
BANGALORESBD
Tenant preference towards the market due to location and relatively lower rentals would ensure demand from IT/ITES occupiers. New supply totaling 10.3 million sq ft, scheduled for completion during 2010-2012, would pressurise rents and keep market balanced until 2012.
BANGALOREWhitefield/
Electronic City
Despite being one of the most affordable destinations in metropolitan cities, a high vacancy rate of 20-27% has persisted in the markets through 2009. New supply of 9.9 million sq ft is likely to become operational during 2010-2012, keeping rents under pressure and markets balanced during 2012-2013.
CHENNAISBD
Proximity to city and excellent infrastructure marks it differently than the suburbs as an attractive IT/ITES destination. Despite a thick supply pipeline, the growth predicted for IT/ITES sector in 2011 & 2012 should translate into real estate demand and lead to a balanced period during 2011-2012.
CHENNAISuburbs
New supply totalling 12.9 million sq ft is expected to become operational during 2010-2012. With existing vacancy of greater than 30%, the massive supply infusion would keep the market favouring tenants till 2011, followed by a balanced period of two years.
HYDERABADHitec City/Gachibowli
New supply of 16.1 million sq ft is likely to become operational during 2010-2012 pushing vacancy further up. Dependence on IT/ITES occupiers would result in a lengthy period favouring tenants and keep the markets balanced until 2013.
KOLKATASalt Lake/Rajarhat
9.6 million sq ft of new supply is expected to become operational during 2010-2012. The supply overhang would keep market balanced until 2013.
PUNESBD
Tenant preference towards the market due to its location and relatively smaller spread of rents over suburbs ensures healthy demand for the market. New supply totaling 6.9 million sq ft is likely to become operational during 2010-2012, which would ensure a balanced market during 2011-2012.
PUNESuburbs
8.5 million sq ft of new supply is expected to become operational from 2010-2012, ensuring a large demand-supply mismatch over the next 2-3 years. Market would favour landlord in 2014.
Reading the ClockThe Jones Lang LaSalle Meghraj office clock shows relative positions of markets in their real estate cycle. Markets generally move clockwise around the clock, with markets on the left side of the clock generally landlord favourable and markets on the right side of the clock generally tenant favourable. The relative positions are assessed on the basis of several real estate indicators including mismatch between expected demand and supply and recent movement of rentals. A market leading the cycle might suggest that it is expected to trip to the next quadrant earlier than other cities; however, rapidly changing demand and supply conditions might accelerate positions for particular markets within a short time. Position on a particular circle (3/5/7 year) generally indicates the length of a real estate cycle for the particular market – the time it takes for the market to regain its position on the cycle.
With signs in the global economy that the worst of the slowdown might be behind us, the Indian office markets are nearing the end of the decline phase. All major Indian markets have now shifted to the ‘decline slowing’ quadrant of the property clock. Demand of office space is gradually improving with opportunistic tenants taking up space at lower rentals. Despite improving demand conditions, vacancies are rising in the short term due to massive infusion of office space.
Markets of Mumbai and Bangalore are leading the property cycle and are expected to recover the earliest among office markets. Markets of NCR-Delhi, Chennai and Pune are expected to stabilise sooner than that of Hyderabad and Kolkata.
RENT
S FA
LLIN
GDE
CLIN
E SL
OWIN
G
GROW
TH S
LOW
ING
RENT
S RI
SING
Vacancy below equilibrium levels and approaching cyclical lowStrong demand spurs new supply Rental rates at or above replacement cost levels and rising New construction underway and in the pipeline
•
••
•
Vacancy decreases from high to below equilibrium levelDemand recovers and becomes strong Rental rates rise from cyclical low toward replacement cost No/limited new supply
•
•
•
•
Vacancy shifts from below equilibrium upward to well aboveDemand wanes and is outstripped by new supply Rents fall from cyclical peak at an increasing rate New construction arriving but no new starts
•
•
•
•
Rents fall below replacement cost and decline to cyclical lowNew construction arriving but no new startsVacancy rises above equilibrium and increasingSupply ahead of stagnant demand
•
••
•
Landlord Favourable Market Tenant Favourable Market
Slowing Market
Falling Market
Stabilising Market
Rising Market
OFFICE PROPERTY CLOCK 2009 OCCUPIER TRAFFIC LIGHTS India 2010 - a window of opportunity for occupiers
LEGE
ND Tenant Market Good timing for lease expiries and rent reviews
Balanced Market Market uncertainty – timing for lease expiries worsening
Landlord Market Timing for lease expiries and rent reviews should be avoided
Rental Values Capital Values Yields
Vacancy Demand Transactions
Outgoings Stock Future Supply
Comprehensive quarterly statistical coverage across office, retail and residential sectors in the form of data series. A quarterly qualitative and forward thinking analysis on the impact of market fluctuations, trends, and forecasts for investors, developers and occupiers.
FEATURES BENEFITSEconomic drivers affecting the real estate market
REIS India platform is built on strong and proven research capability with over 110 man years of experience
Commentary on effect of new supply and demand on vacancy rate and asset values with trends and implications
Consistent methodologies across cities with standard definitions of data, enabling you to compare and contrast markets and micro-markets across India
Three years forecast of supply, demand, asset performance and investment trends
Benchmark and forecast asset performance
Latest investment deals and project developments
Enables you to formulate investment and development strategies associated with market risks and opportunities
Three year qualitative market outlook on real estate indicators
Frequent updates and reporting of important market events
Quaterly presentations on real estate trends and direct access to our senior researchers
Access to the full suite of Jones Lang LaSalle’s award winning research
INDIA OFFICE MAPReal Estate Intelligence Service
3 Years 5 Years 7 Years
Note: The positions for various cities shown on the clock represent conditions assessed during 4Q 2009
OUR RESEARCH SUITE
20
08
RE
LE
AS
E
20
09
RE
LE
AS
E
UK-India cross-border residential investment, August 2008
advance
Real Estate Transparency Index
Global Foresight Series
Transparency Comes of AgeReal Estate Transparency in India
World Winning Cities
Global Foresight Series
India30Real Estate Opportunities in Tier III Cities
Economic InsightIndia
January 2009
Real Estate Opportunities in India’s Pharmaceutical Sector
Economic InsightIndia
October 2008
Real Estate Opportunities in the Semiconductor Sector
World Winning Cities
Global Foresight Series
KochiIndia’s Rising Urban Star
Affordable Housingin Chennai
Calibrating the ticket size
Cost Efficiency of Green Buildings in India
Greenomics
Coimbatore-An emerging real estate destination????????
Propertyand Asset Management
Enabling a paradigm shift in Indian real estate
Fourth Quarter 2008
Asia Pacific Property DigestWest Asia
The investment value of real estate
An inquiry into the portfolio risk and return of bond, equity and real estate
Capital Flows Outlook for India’s Real Estate MarketDemystifying the property cycle economics
The Transforming Landscape of Indian Warehousing
????????
Emerging Trends in Real Estate Finance
The slope of descent
A closer look into India’s rental dynamics
For subscription details and enquiries, please contact: Abhishek Kiran Gupta, Head-Research and REIS, email: [email protected]
Indian Realty Milestone
Retail Distribution Warehousing
Economic InsightIndia
Economic InsightIndia
Capital Flows Outlook for India’s Real EState Market
Asia PacificThen & Now
Real Estate Intelligence Service
Real Estate Intelligence Service
N E P A L
S R I L A N K A
I N D I A N O C E A N
A R A B I A NS E A
B AY O FB E N G A L
B A N G L A D E S H
P A K I S T A N
A F G H A N I S T A N
C H I N A
B H U T A N
M Y A N M A R
COPYRIGHT©JONES LANG LASALLE MEGHRAJ 2010. Based on the Survey of India Map. No part of this publication may be reproduced or transmitted in any form or by any means without prior written consent of Jones Lang LaSalle. It is based on material that we believe to be reliable. Whilst every effort has been made to ensure its accuracy, we cannot offer any warranty that it contains no factual errors. We would like to be told of any such errors in order to correct them.
NCR Delhi
Mumbai
Pune
Hyderabad
Bangalore Chennai
Kolkata
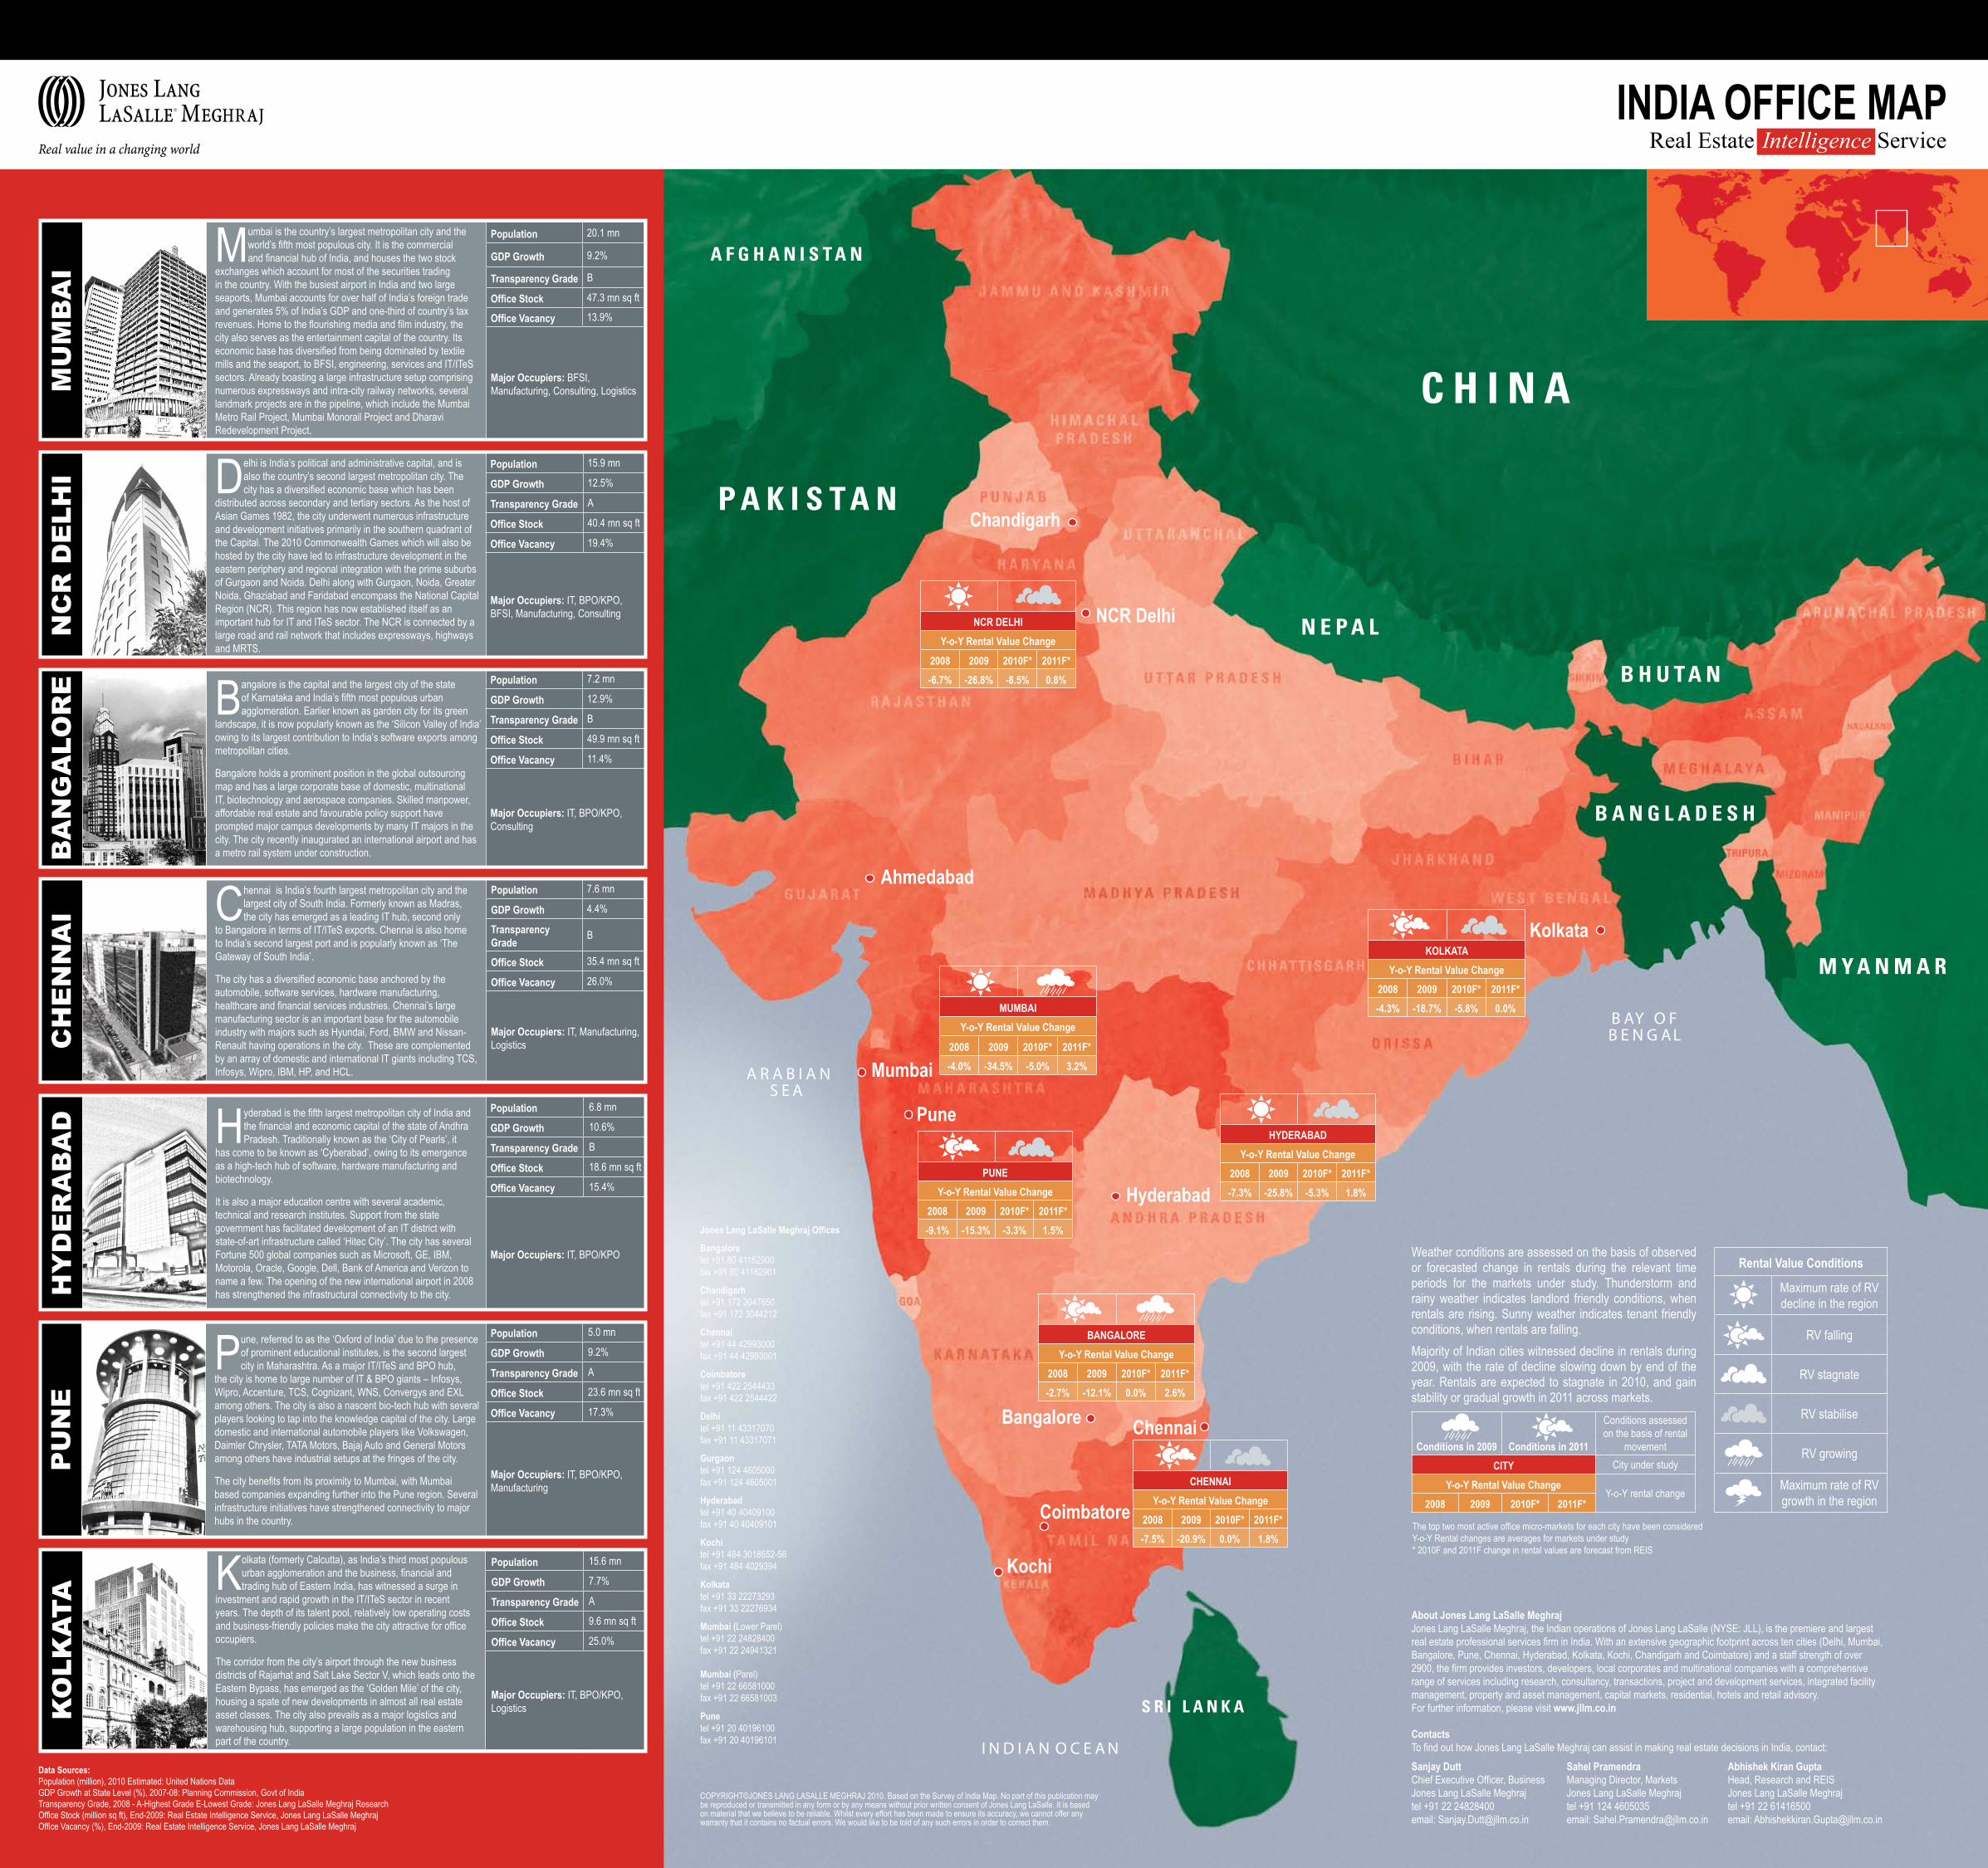
NCR DELHIY-o-Y Rental Value Change
2008 2009 2010F* 2011F*-6.7% -26.8% -8.5% 0.8%
MUMBAIY-o-Y Rental Value Change
2008 2009 2010F* 2011F*-4.0% -34.5% -5.0% 3.2%
PUNEY-o-Y Rental Value Change
2008 2009 2010F* 2011F*-9.1% -15.3% -3.3% 1.5%
HYDERABADY-o-Y Rental Value Change
2008 2009 2010F* 2011F*-7.3% -25.8% -5.3% 1.8%
BANGALOREY-o-Y Rental Value Change
2008 2009 2010F* 2011F*-2.7% -12.1% 0.0% 2.6%
CHENNAIY-o-Y Rental Value Change
2008 2009 2010F* 2011F*-7.5% -20.9% 0.0% 1.8%
KOLKATAY-o-Y Rental Value Change
2008 2009 2010F* 2011F*-4.3% -18.7% -5.8% 0.0%
Weather conditions are assessed on the basis of observed or forecasted change in rentals during the relevant time periods for the markets under study. Thunderstorm and rainy weather indicates landlord friendly conditions, when rentals are rising. Sunny weather indicates tenant friendly conditions, when rentals are falling.Majority of Indian cities witnessed decline in rentals during 2009, with the rate of decline slowing down by end of the year. Rentals are expected to stagnate in 2010, and gain stability or gradual growth in 2011 across markets.
Conditions in 2009 Conditions in 2011
Conditions assessed on the basis of rental
movementCITY City under study
Y-o-Y Rental Value ChangeY-o-Y rental change
2008 2009 2010F* 2011F*
The top two most active office micro-markets for each city have been considered Y-o-Y Rental changes are averages for markets under study * 2010F and 2011F change in rental values are forecast from REIS
Rental Value Conditions
Maximum rate of RV decline in the region
RV falling
RV stagnate
RV stabilise
RV growing
Maximum rate of RV growth in the region
Data Sources: Population (million), 2010 Estimated: United Nations Data GDP Growth at State Level (%), 2007-08: Planning Commission, Govt of India Transparency Grade, 2008 - A-Highest Grade E-Lowest Grade: Jones Lang LaSalle Meghraj Research Office Stock (million sq ft), End-2009: Real Estate Intelligence Service, Jones Lang LaSalle Meghraj Office Vacancy (%), End-2009: Real Estate Intelligence Service, Jones Lang LaSalle Meghraj
ContactsTo find out how Jones Lang LaSalle Meghraj can assist in making real estate decisions in India, contact:
Jones Lang LaSalle Meghraj Offices
Bangalore tel +91 80 41182900 fax +91 80 41182901
Chandigarh tel +91 172 3047650 fax +91 172 3044212
Chennai tel +91 44 42993000 fax +91 44 42993001
Coimbatore tel +91 422 2544433 fax +91 422 2544422
Delhi tel +91 11 43317070 fax +91 11 43317071
Gurgaon tel +91 124 4605000 fax +91 124 4605001
Hyderabad tel +91 40 40409100 fax +91 40 40409101
Kochi tel +91 484 3018652-56 fax +91 484 4029394
Kolkata tel +91 33 22273293 fax +91 33 22276934
Mumbai (Lower Parel) tel +91 22 24828400 fax +91 22 24941321 Mumbai (Parel) tel +91 22 66581000 fax +91 22 66581003
Pune tel +91 20 40196100 fax +91 20 40196101
INDIA OFFICE MAPReal Estate Intelligence Service
HY
DE
RA
BA
D Hyderabad is the fifth largest metropolitan city of India and the financial and economic capital of the state of Andhra Pradesh. Traditionally known as the ‘City of Pearls’, it
has come to be known as ‘Cyberabad’, owing to its emergence as a high-tech hub of software, hardware manufacturing and biotechnology.
It is also a major education centre with several academic, technical and research institutes. Support from the state government has facilitated development of an IT district with state-of-art infrastructure called ‘Hitec City’. The city has several Fortune 500 global companies such as Microsoft, GE, IBM, Motorola, Oracle, Google, Dell, Bank of America and Verizon to name a few. The opening of the new international airport in 2008 has strengthened the infrastructural connectivity to the city.
Population 6.8 mn
GDP Growth 10.6%
Transparency Grade B
Office Stock 18.6 mn sq ft
Office Vacancy 15.4%
Major Occupiers: IT, BPO/KPO
PU
NE
Pune, referred to as the ‘Oxford of India’ due to the presence of prominent educational institutes, is the second largest city in Maharashtra. As a major IT/ITeS and BPO hub,
the city is home to large number of IT & BPO giants – Infosys, Wipro, Accenture, TCS, Cognizant, WNS, Convergys and EXL among others. The city is also a nascent bio-tech hub with several players looking to tap into the knowledge capital of the city. Large domestic and international automobile players like Volkswagen, Daimler Chrysler, TATA Motors, Bajaj Auto and General Motors among others have industrial setups at the fringes of the city.
The city benefits from its proximity to Mumbai, with Mumbai based companies expanding further into the Pune region. Several infrastructure initiatives have strengthened connectivity to major hubs in the country.
Population 5.0 mn
GDP Growth 9.2%
Transparency Grade A
Office Stock 23.6 mn sq ft
Office Vacancy 17.3%
Major Occupiers: IT, BPO/KPO, Manufacturing
MU
MB
AI Mumbai is the country’s largest metropolitan city and the
world’s fifth most populous city. It is the commercial and financial hub of India, and houses the two stock
exchanges which account for most of the securities trading in the country. With the busiest airport in India and two large seaports, Mumbai accounts for over half of India’s foreign trade and generates 5% of India’s GDP and one-third of country’s tax revenues. Home to the flourishing media and film industry, the city also serves as the entertainment capital of the country. Its economic base has diversified from being dominated by textile mills and the seaport, to BFSI, engineering, services and IT/ITeS sectors. Already boasting a large infrastructure setup comprising numerous expressways and intra-city railway networks, several landmark projects are in the pipeline, which include the Mumbai Metro Rail Project, Mumbai Monorail Project and Dharavi Redevelopment Project.
Population 20.1 mn
GDP Growth 9.2%
Transparency Grade B
Office Stock 47.3 mn sq ft
Office Vacancy 13.9%
Major Occupiers: BFSI, Manufacturing, Consulting, Logistics
NC
R D
ELH
I Delhi is India’s political and administrative capital, and is also the country’s second largest metropolitan city. The city has a diversified economic base which has been
distributed across secondary and tertiary sectors. As the host of Asian Games 1982, the city underwent numerous infrastructure and development initiatives primarily in the southern quadrant of the Capital. The 2010 Commonwealth Games which will also be hosted by the city have led to infrastructure development in the eastern periphery and regional integration with the prime suburbs of Gurgaon and Noida. Delhi along with Gurgaon, Noida, Greater Noida, Ghaziabad and Faridabad encompass the National Capital Region (NCR). This region has now established itself as an important hub for IT and ITeS sector. The NCR is connected by a large road and rail network that includes expressways, highways and MRTS.
Population 15.9 mn
GDP Growth 12.5%
Transparency Grade A
Office Stock 40.4 mn sq ft
Office Vacancy 19.4%
Major Occupiers: IT, BPO/KPO, BFSI, Manufacturing, Consulting
BA
NG
ALO
RE Bangalore is the capital and the largest city of the state
of Karnataka and India’s fifth most populous urban agglomeration. Earlier known as garden city for its green
landscape, it is now popularly known as the ‘Silicon Valley of India’ owing to its largest contribution to India’s software exports among metropolitan cities.
Bangalore holds a prominent position in the global outsourcing map and has a large corporate base of domestic, multinational IT, biotechnology and aerospace companies. Skilled manpower, affordable real estate and favourable policy support have prompted major campus developments by many IT majors in the city. The city recently inaugurated an international airport and has a metro rail system under construction.
Population 7.2 mn
GDP Growth 12.9%
Transparency Grade B
Office Stock 49.9 mn sq ft
Office Vacancy 11.4%
Major Occupiers: IT, BPO/KPO, Consulting
CH
EN
NA
I Chennai is India’s fourth largest metropolitan city and the largest city of South India. Formerly known as Madras, the city has emerged as a leading IT hub, second only
to Bangalore in terms of IT/ITeS exports. Chennai is also home to India’s second largest port and is popularly known as ‘The Gateway of South India’.
The city has a diversified economic base anchored by the automobile, software services, hardware manufacturing, healthcare and financial services industries. Chennai’s large manufacturing sector is an important base for the automobile industry with majors such as Hyundai, Ford, BMW and Nissan-Renault having operations in the city. These are complemented by an array of domestic and international IT giants including TCS, Infosys, Wipro, IBM, HP, and HCL.
Population 7.6 mn
GDP Growth 4.4%
Transparency Grade B
Office Stock 35.4 mn sq ft
Office Vacancy 26.0%
Major Occupiers: IT, Manufacturing, Logistics
KO
LKA
TA
Kolkata (formerly Calcutta), as India’s third most populous urban agglomeration and the business, financial and trading hub of Eastern India, has witnessed a surge in
investment and rapid growth in the IT/ITeS sector in recent years. The depth of its talent pool, relatively low operating costs and business-friendly policies make the city attractive for office occupiers.
The corridor from the city’s airport through the new business districts of Rajarhat and Salt Lake Sector V, which leads onto the Eastern Bypass, has emerged as the ‘Golden Mile’ of the city, housing a spate of new developments in almost all real estate asset classes. The city also prevails as a major logistics and warehousing hub, supporting a large population in the eastern part of the country.
Population 15.6 mn
GDP Growth 7.7%
Transparency Grade A
Office Stock 9.6 mn sq ft
Office Vacancy 25.0%
Major Occupiers: IT, BPO/KPO, Logistics
Chandigarh
Ahmedabad
Kochi
Coimbatore
Sanjay DuttChief Executive Officer, BusinessJones Lang LaSalle Meghrajtel +91 22 24828400 email: [email protected]
About Jones Lang LaSalle Meghraj Jones Lang LaSalle Meghraj, the Indian operations of Jones Lang LaSalle (NYSE: JLL), is the premiere and largest real estate professional services firm in India. With an extensive geographic footprint across ten cities (Delhi, Mumbai, Bangalore, Pune, Chennai, Hyderabad, Kolkata, Kochi, Chandigarh and Coimbatore) and a staff strength of over 2900, the firm provides investors, developers, local corporates and multinational companies with a comprehensive range of services including research, consultancy, transactions, project and development services, integrated facility management, property and asset management, capital markets, residential, hotels and retail advisory. For further information, please visit www.jllm.co.in
Sahel PramendraManaging Director, MarketsJones Lang LaSalle Meghrajtel +91 124 4605035email: [email protected]
Abhishek Kiran GuptaHead, Research and REISJones Lang LaSalle Meghrajtel +91 22 61416500 email: [email protected]