Embed Size (px)
Citation preview
Department of Economic DevelopmentINDIA
Market Overview
The Republic of India is the third largest Asian economy after China and Japan. Among the major emerging markets, India ranks second in terms of economic growth with the IMF forecasting a GDP growth rate of 6.9 percent for 2012. India is the second most populous country in the world; approximately thirty percent of the country’s 1.2 billion inhabitants reside in urban areas. India’s industrialized economy encompasses diverse manufacturing sectors (steel production, oil and gas refining, auto, plastics, textiles) while also including traditional village farming, modern agriculture, and handicrafts. Services, especially information technology, are the major source of economic growth, accounting for more than half of India’s output with less than one third of its labor force, which is currently estimated to be 457 million workers.
The economy posted an average growth rate of more than 7 percent since 1997, reducing poverty by about 10 percentage points. Dependent on services exports and private domestic consumption, according to the IMF, India’s 2011 GDP registered a 6.8 percent increase reaching USD 1,843 billion with a GDP per capita of USD 3,703. India’s 2012 GDP is expected to reach USD 2,072 billion. Multiple factors have affected economic growth in India. They include: the worldwide economic slowdown, an uncertain U.S. recovery, a debt crisis in Europe resulting in a decline in demand in the EU for India’s exports, decreasing international financing, and anti-inflationary measures of 2011 introduced by the Indian central bank – the Reserve Bank of India. Policy uncertainty, stalled reforms, expensive credit and deteriorating political and security conditions are expected to depress economic activity in the short and medium term. The challenging business climate in India attracted only USD 19.42 billion in 2010-11 in Foreign Direct Investment (FDI) falling from $25.83 billion in 2009-2010. Though analysts expected FDI inflows to surpass $40 billion in Indian fiscal year (FY) 2011-12, it stood at $35 billion in April-December 2011, mainly the result of a few large deals.
The 2011 nominal exchange rate was 48 Indian rupees per 1 USD and is expected by many economists to fall further against the dollar in 2012. Unemployment reached 9.8 percent; however, more than 60 percent of total employment is in the informal economy. The government’s 15 percent wage hike brought minimum wages in India to USD 130 per month for unskilled workers to USD 160 per month for skilled workers. Rapidly rising salaries with generous perks (cars, housing allowances) have generated high turnover among the professional ranks. The Indian government is promoting public-private partnerships to advance large infrastructure projects and is attempting to diversify its trade beyond Europe and the United States to the Association of Southeast Asian Nations (ASEAN), Latin America, and Africa.
Leading Sector for U.S. Exports & Investment Analysis
Commercial Sectors•Architecture, Construction, Engineering (ACE) and Construction Equipment •Civil Aviation •Education Service
1
•Environment and Water •Healthcare and Medical Equipment• Infrastructure ( Roads, Ports, Railways)•Mining and Mineral Processing Equipment•Plastics•Power and Renewable Energy•Travel and Tourism
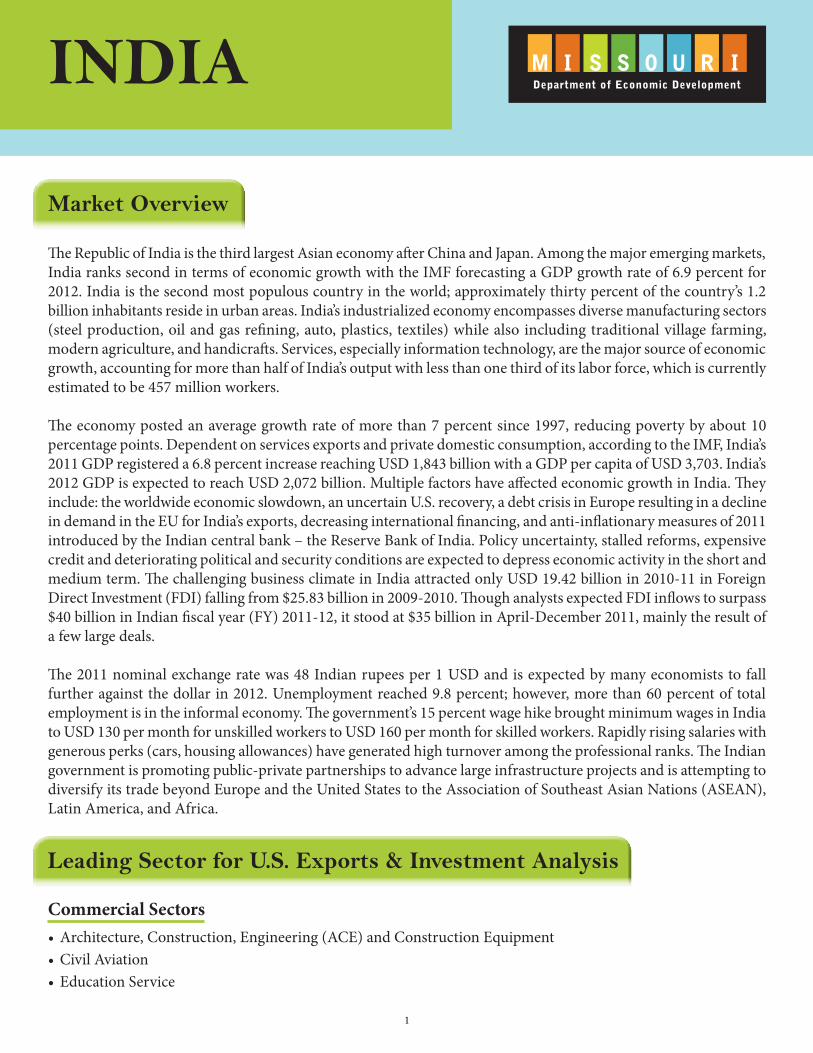
Construction Equipment
Market Size 2013 est.
Local Production 2013 est.
Exports 2013 est.
Imports from (Global)
Imports From U.S.
2,490 2,880 800 410 380USD
Civil AviationMarket Size:For a country of more than one billion people with a sizeable middle class (200-250 million) that can afford air travel, the size of the aviation sector is relatively small. While the U.S. has on average 50,000 commercial scheduled aircraft movements per day, India has a little over 3,800 each day.
The present market size for airport and ground support equipment is estimated to be $440 million. Successful privatization of airport maintenance and ground support services will lead to another $100 million in market growth over the next three years.
Educational ServicesEducation Service Market Overview:India has one of the largest and oldest systems of higher education. Presently, there are 496 universities in the country, including 239 state universities (established by the state governments), 130 deemed universities (a status of autonomy granted to high performing institutes and universities by the Department of Higher Education), 40 central universities (established by the Department of Higher Education), 49 private universities, and 38 institutes of national importance, such as Indian Institute of Technology (IIT), and Indian Institute of Management (IIM). In addition, there are private and accredited universities, institutions created by an act of Parliament, independent
Construction Equipment 2013 est. (USD)Market Size Local Production Exports Imports (Global) Imports From U.S.
2,490 2,880 800 410 380
Construction Equipment 2013 est. (USD)
Market Size
Local Production
Exports
Imports (Global)
Imports From U.S.
2
institutes and over 16,000 colleges. Together they offer a wide range of degree and diploma programs
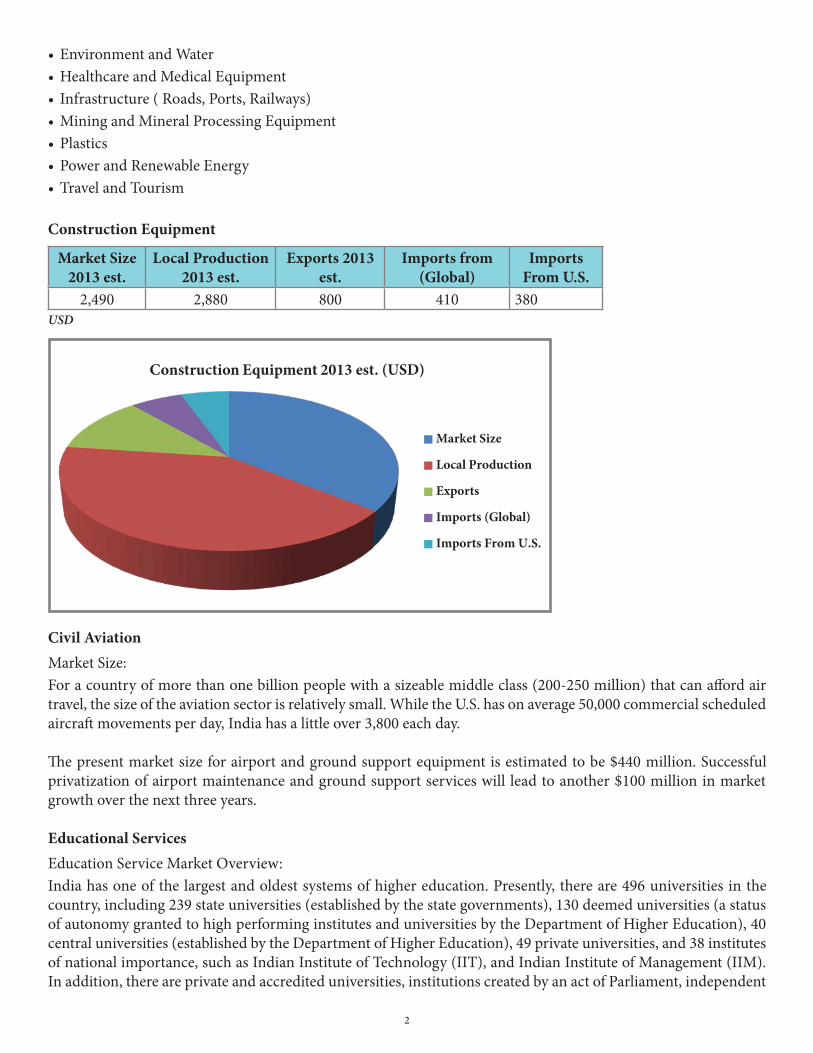
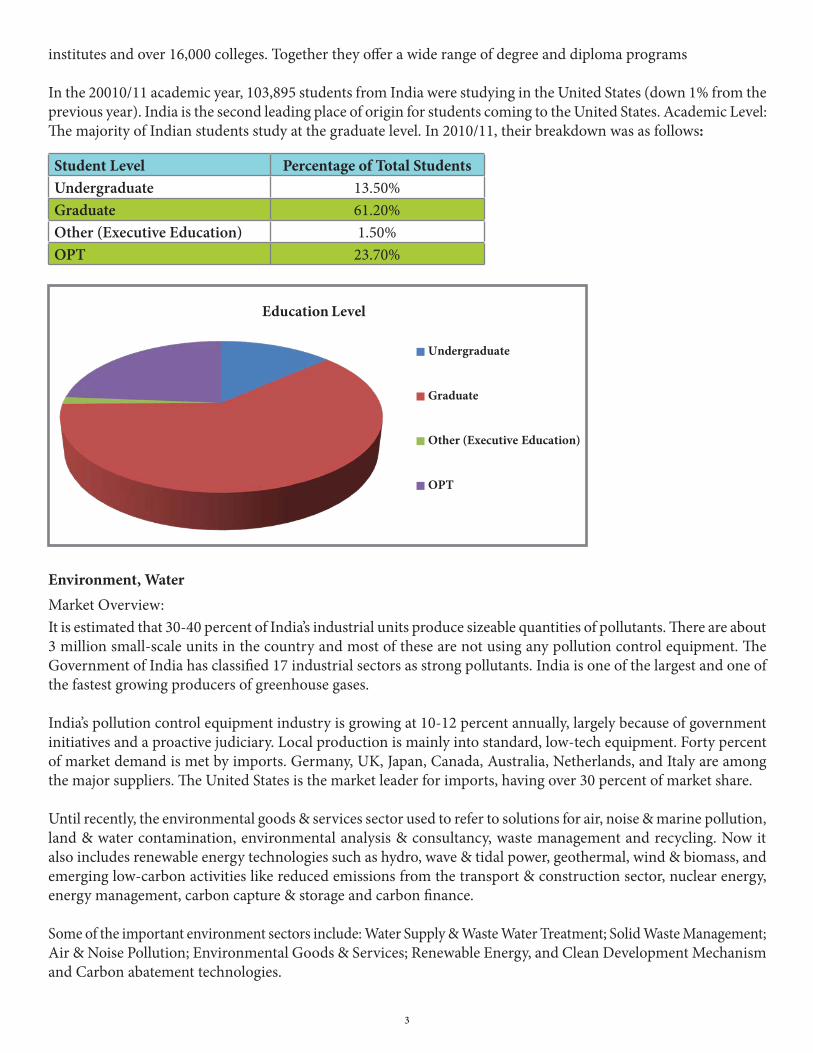
In the 20010/11 academic year, 103,895 students from India were studying in the United States (down 1% from the previous year). India is the second leading place of origin for students coming to the United States. Academic Level: The majority of Indian students study at the graduate level. In 2010/11, their breakdown was as follows:
Student Level Percentage of Total StudentsUndergraduate 13.50%Graduate 61.20%Other (Executive Education) 1.50%OPT 23.70%
Environment, WaterMarket Overview:It is estimated that 30-40 percent of India’s industrial units produce sizeable quantities of pollutants. There are about 3 million small-scale units in the country and most of these are not using any pollution control equipment. The Government of India has classified 17 industrial sectors as strong pollutants. India is one of the largest and one of the fastest growing producers of greenhouse gases.
India’s pollution control equipment industry is growing at 10-12 percent annually, largely because of government initiatives and a proactive judiciary. Local production is mainly into standard, low-tech equipment. Forty percent of market demand is met by imports. Germany, UK, Japan, Canada, Australia, Netherlands, and Italy are among the major suppliers. The United States is the market leader for imports, having over 30 percent of market share.
Until recently, the environmental goods & services sector used to refer to solutions for air, noise & marine pollution, land & water contamination, environmental analysis & consultancy, waste management and recycling. Now it also includes renewable energy technologies such as hydro, wave & tidal power, geothermal, wind & biomass, and emerging low-carbon activities like reduced emissions from the transport & construction sector, nuclear energy, energy management, carbon capture & storage and carbon finance.
Some of the important environment sectors include: Water Supply & Waste Water Treatment; Solid Waste Management; Air & Noise Pollution; Environmental Goods & Services; Renewable Energy, and Clean Development Mechanism and Carbon abatement technologies.
Student Level Percentage of Total StudentsUndergraduate 13.50%Graduate 61.20%Other (Executive Education) 1.50%OPT 23.70%
Education Level
Undergraduate
Graduate
Other (Executive Education)
OPT
3
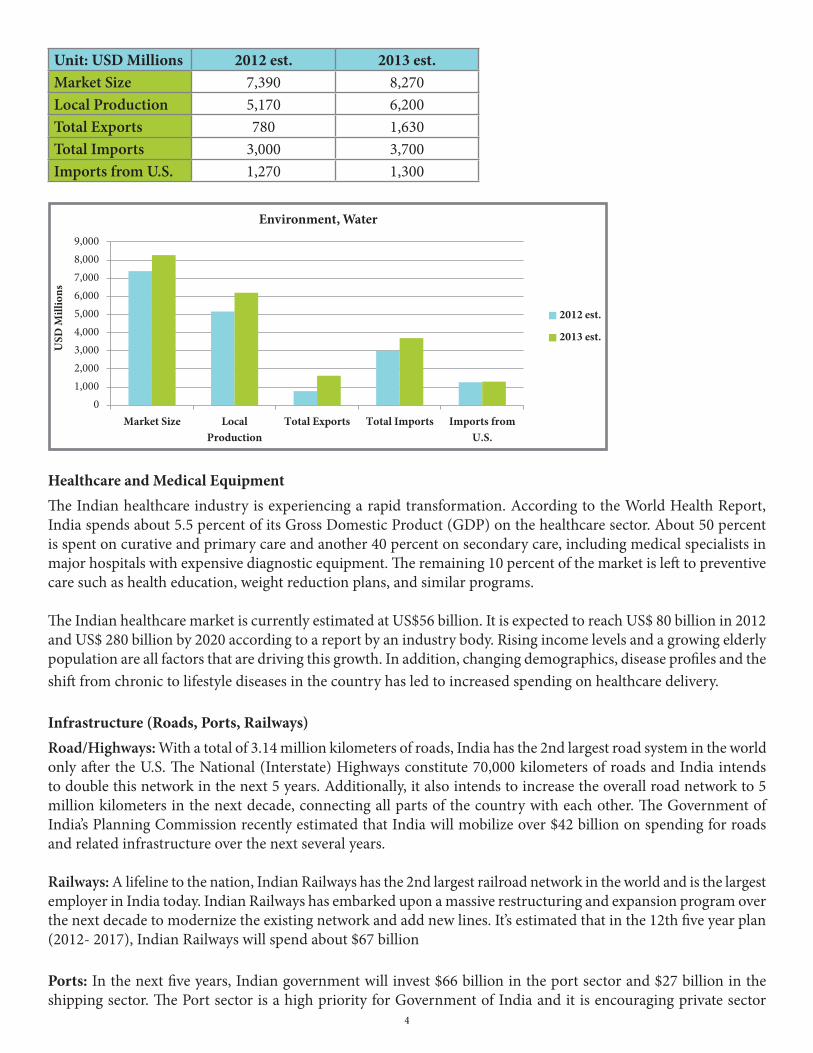
Unit: USD Millions 2012 est. 2013 est.Market Size 7,390 8,270Local Production 5,170 6,200Total Exports 780 1,630Total Imports 3,000 3,700Imports from U.S. 1,270 1,300
Healthcare and Medical EquipmentThe Indian healthcare industry is experiencing a rapid transformation. According to the World Health Report, India spends about 5.5 percent of its Gross Domestic Product (GDP) on the healthcare sector. About 50 percent is spent on curative and primary care and another 40 percent on secondary care, including medical specialists in major hospitals with expensive diagnostic equipment. The remaining 10 percent of the market is left to preventive care such as health education, weight reduction plans, and similar programs.
The Indian healthcare market is currently estimated at US$56 billion. It is expected to reach US$ 80 billion in 2012 and US$ 280 billion by 2020 according to a report by an industry body. Rising income levels and a growing elderly population are all factors that are driving this growth. In addition, changing demographics, disease profiles and the shift from chronic to lifestyle diseases in the country has led to increased spending on healthcare delivery.
Infrastructure (Roads, Ports, Railways)Road/Highways: With a total of 3.14 million kilometers of roads, India has the 2nd largest road system in the world only after the U.S. The National (Interstate) Highways constitute 70,000 kilometers of roads and India intends to double this network in the next 5 years. Additionally, it also intends to increase the overall road network to 5 million kilometers in the next decade, connecting all parts of the country with each other. The Government of India’s Planning Commission recently estimated that India will mobilize over $42 billion on spending for roads and related infrastructure over the next several years.
Railways: A lifeline to the nation, Indian Railways has the 2nd largest railroad network in the world and is the largest employer in India today. Indian Railways has embarked upon a massive restructuring and expansion program over the next decade to modernize the existing network and add new lines. It’s estimated that in the 12th five year plan (2012- 2017), Indian Railways will spend about $67 billion
Ports: In the next five years, Indian government will invest $66 billion in the port sector and $27 billion in the shipping sector. The Port sector is a high priority for Government of India and it is encouraging private sector
Unit: USD Millions 2012 est. 2013 est.Market Size 7,390 8,270Local Production 5,170 6,200Total Exports 780 1,630Total Imports 3,000 3,700Imports from U.S. 1,270 1,300
0 1,000 2,000 3,000 4,000 5,000 6,000 7,000 8,000 9,000
Market Size Local Production
Total Exports Total Imports Imports from U.S.
USD
Mill
ions
Environment, Water
2012 est.
2013 est.
4
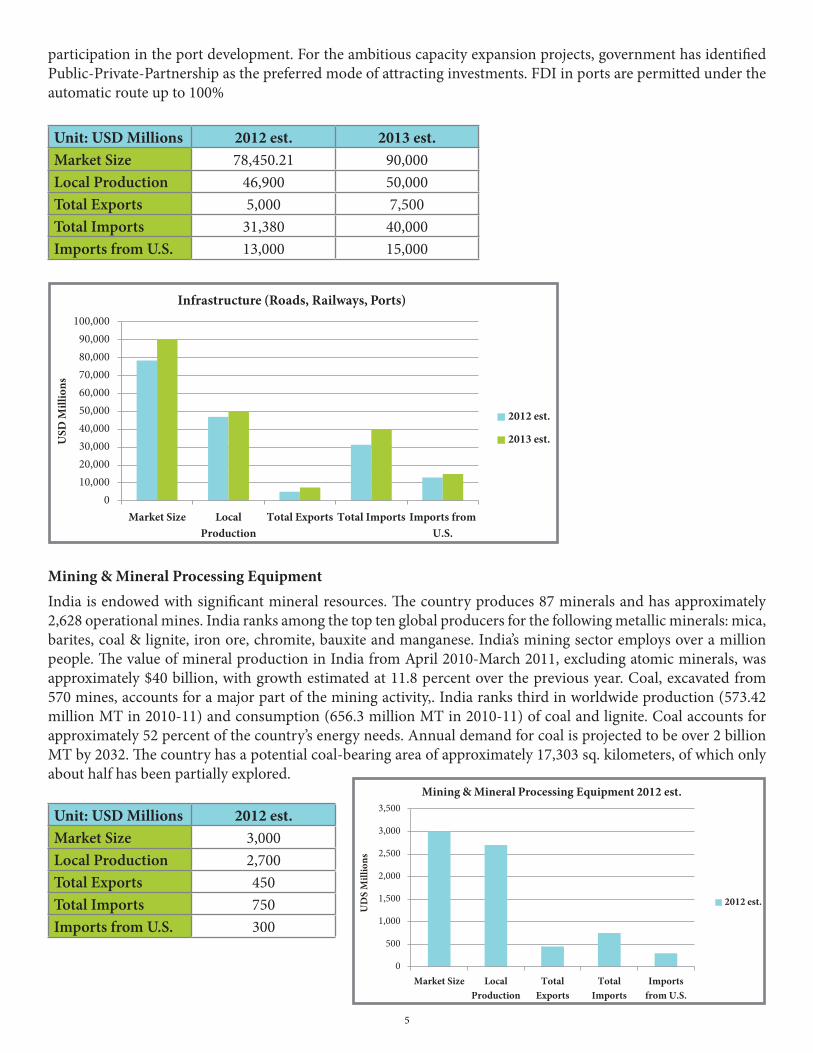
participation in the port development. For the ambitious capacity expansion projects, government has identified Public-Private-Partnership as the preferred mode of attracting investments. FDI in ports are permitted under the automatic route up to 100%
Unit: USD Millions 2012 est. 2013 est.Market Size 78,450.21 90,000Local Production 46,900 50,000Total Exports 5,000 7,500Total Imports 31,380 40,000Imports from U.S. 13,000 15,000
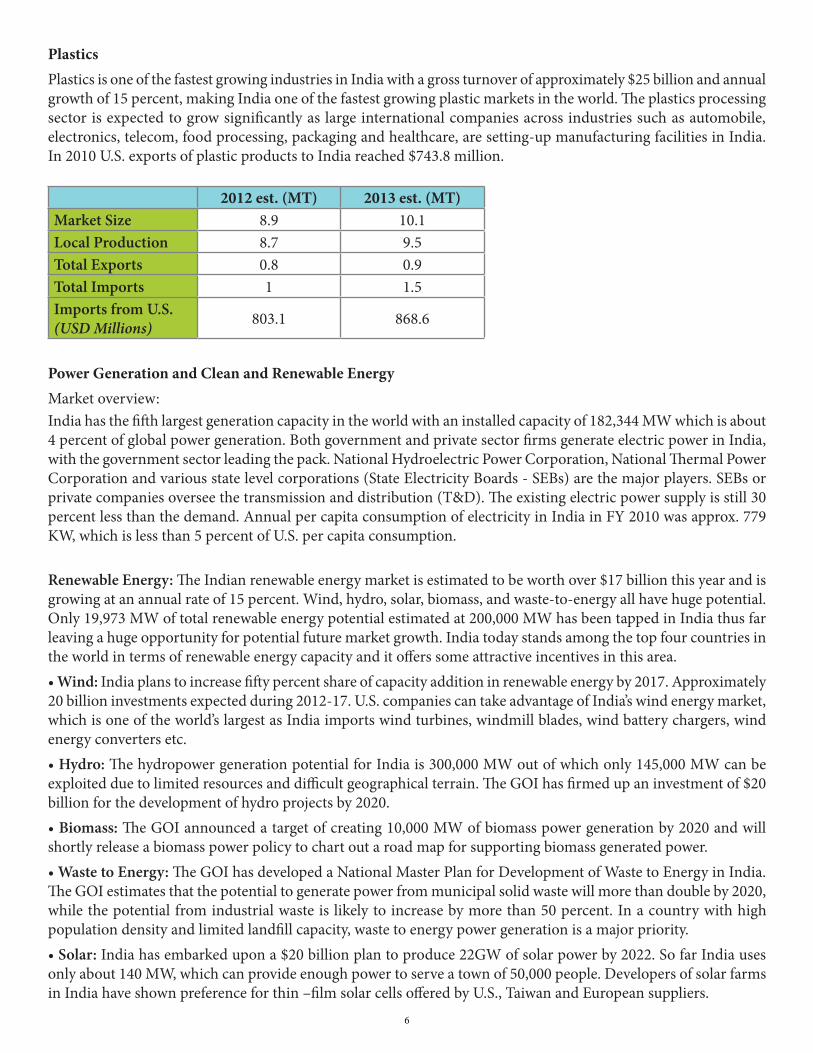
Mining & Mineral Processing EquipmentIndia is endowed with significant mineral resources. The country produces 87 minerals and has approximately 2,628 operational mines. India ranks among the top ten global producers for the following metallic minerals: mica, barites, coal & lignite, iron ore, chromite, bauxite and manganese. India’s mining sector employs over a million people. The value of mineral production in India from April 2010-March 2011, excluding atomic minerals, was approximately $40 billion, with growth estimated at 11.8 percent over the previous year. Coal, excavated from 570 mines, accounts for a major part of the mining activity,. India ranks third in worldwide production (573.42 million MT in 2010-11) and consumption (656.3 million MT in 2010-11) of coal and lignite. Coal accounts for approximately 52 percent of the country’s energy needs. Annual demand for coal is projected to be over 2 billion MT by 2032. The country has a potential coal-bearing area of approximately 17,303 sq. kilometers, of which only about half has been partially explored.
Unit: USD Millions 2012 est.Market Size 3,000Local Production 2,700Total Exports 450Total Imports 750Imports from U.S. 300
Unit: USD Millions 2012 est. 2013 est.Market Size 78,450.21 90,000Local Production 46,900 50,000Total Exports 5,000 7,500Total Imports 31,380 40,000Imports from U.S. 13,000 15,000
0 10,000 20,000 30,000 40,000 50,000 60,000 70,000 80,000 90,000
100,000
Market Size Local Production
Total Exports Total Imports Imports from U.S.
USD
Mill
ions
Infrastructure (Roads, Railways, Ports)
2012 est.
2013 est.
Unit: USD Millions 2012 est.Market Size 3,000Local Production 2,700Total Exports 450Total Imports 750Imports from U.S. 300
0
500
1,000
1,500
2,000
2,500
3,000
3,500
Market Size Local Production
Total Exports
Total Imports
Imports from U.S.
UD
S M
illio
ns
Mining & Mineral Processing Equipment 2012 est.
2012 est.
5
PlasticsPlastics is one of the fastest growing industries in India with a gross turnover of approximately $25 billion and annual growth of 15 percent, making India one of the fastest growing plastic markets in the world. The plastics processing sector is expected to grow significantly as large international companies across industries such as automobile, electronics, telecom, food processing, packaging and healthcare, are setting-up manufacturing facilities in India. In 2010 U.S. exports of plastic products to India reached $743.8 million.
2012 est. (MT) 2013 est. (MT)Market Size 8.9 10.1Local Production 8.7 9.5Total Exports 0.8 0.9Total Imports 1 1.5Imports from U.S. (USD Millions) 803.1 868.6
Power Generation and Clean and Renewable EnergyMarket overview:India has the fifth largest generation capacity in the world with an installed capacity of 182,344 MW which is about 4 percent of global power generation. Both government and private sector firms generate electric power in India, with the government sector leading the pack. National Hydroelectric Power Corporation, National Thermal Power Corporation and various state level corporations (State Electricity Boards - SEBs) are the major players. SEBs or private companies oversee the transmission and distribution (T&D). The existing electric power supply is still 30 percent less than the demand. Annual per capita consumption of electricity in India in FY 2010 was approx. 779 KW, which is less than 5 percent of U.S. per capita consumption.
Renewable Energy: The Indian renewable energy market is estimated to be worth over $17 billion this year and is growing at an annual rate of 15 percent. Wind, hydro, solar, biomass, and waste-to-energy all have huge potential. Only 19,973 MW of total renewable energy potential estimated at 200,000 MW has been tapped in India thus far leaving a huge opportunity for potential future market growth. India today stands among the top four countries in the world in terms of renewable energy capacity and it offers some attractive incentives in this area. •Wind: India plans to increase fifty percent share of capacity addition in renewable energy by 2017. Approximately 20 billion investments expected during 2012-17. U.S. companies can take advantage of India’s wind energy market, which is one of the world’s largest as India imports wind turbines, windmill blades, wind battery chargers, wind energy converters etc. •Hydro: The hydropower generation potential for India is 300,000 MW out of which only 145,000 MW can be exploited due to limited resources and difficult geographical terrain. The GOI has firmed up an investment of $20 billion for the development of hydro projects by 2020. •Biomass: The GOI announced a target of creating 10,000 MW of biomass power generation by 2020 and will shortly release a biomass power policy to chart out a road map for supporting biomass generated power. •Waste to Energy: The GOI has developed a National Master Plan for Development of Waste to Energy in India. The GOI estimates that the potential to generate power from municipal solid waste will more than double by 2020, while the potential from industrial waste is likely to increase by more than 50 percent. In a country with high population density and limited landfill capacity, waste to energy power generation is a major priority. •Solar: India has embarked upon a $20 billion plan to produce 22GW of solar power by 2022. So far India uses only about 140 MW, which can provide enough power to serve a town of 50,000 people. Developers of solar farms in India have shown preference for thin –film solar cells offered by U.S., Taiwan and European suppliers.
6
•Nuclear: opportunities in equipment and technology expected to boost India’s nuclear power plants, but the process has slowed because of the environmental and security concerns and continued concerns over potential liability exposure for foreign players.
Travel and TourismIndia ranks 12th in the Top 50 Markets (2010) for International Visitors to the United States. India had a record number of visitors in 2010 with 650,935 visitors to the U.S. which is an increase of 18 percent over 2009.
India ranks 9th in the Top 10 Markets (2010) for International Visitor Spending: Reversing the downturn in 2009, international visitor spending from India increased 12 percent in 2010 to $2.86 billion, allowing India to maintain its ninth place ranking overall.
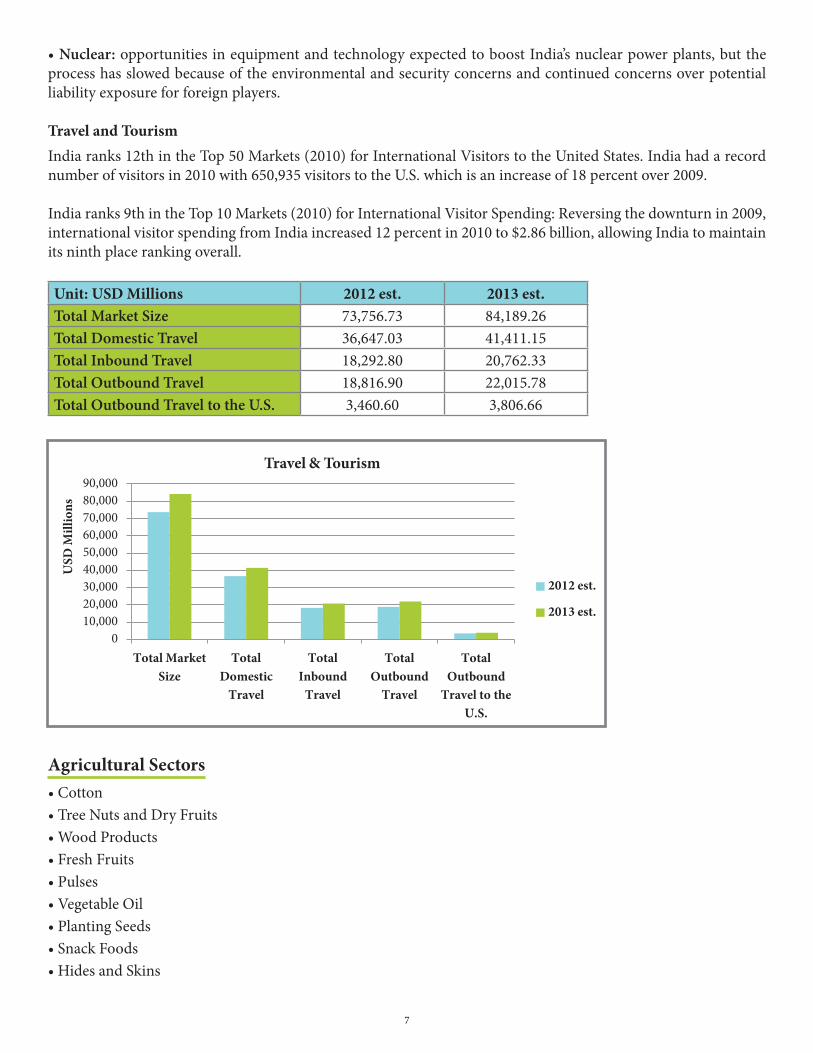
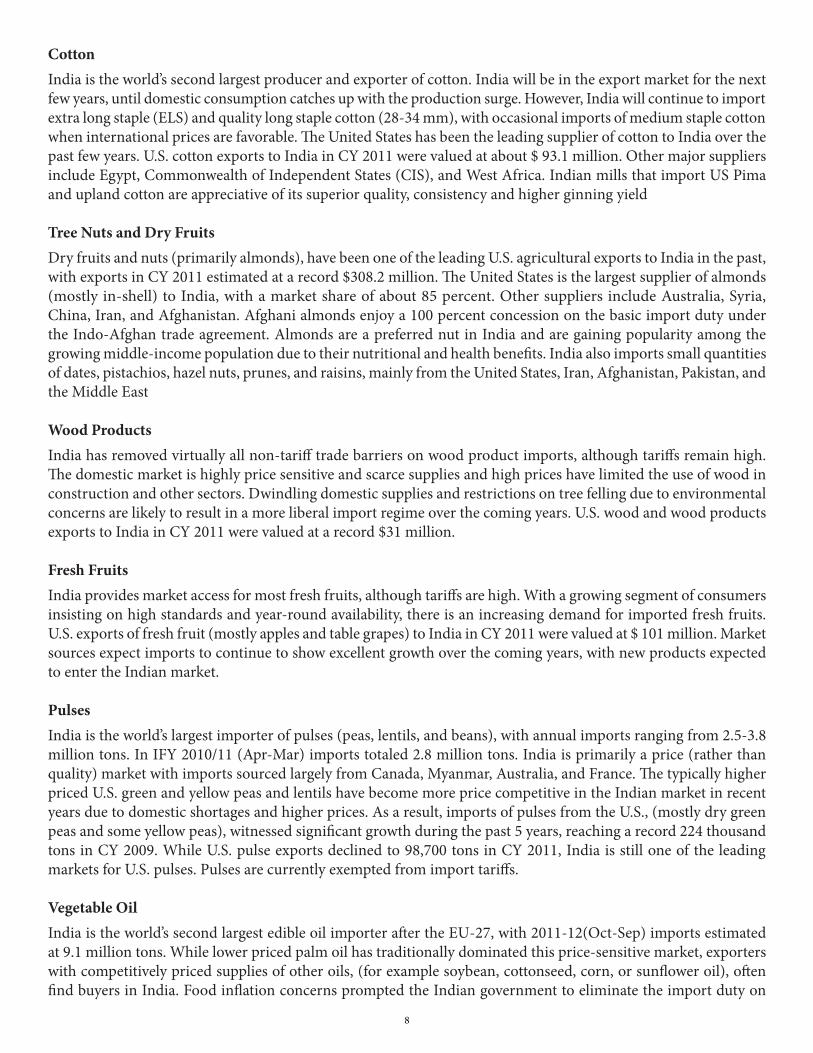
Unit: USD Millions 2012 est. 2013 est.Total Market Size 73,756.73 84,189.26Total Domestic Travel 36,647.03 41,411.15Total Inbound Travel 18,292.80 20,762.33Total Outbound Travel 18,816.90 22,015.78Total Outbound Travel to the U.S. 3,460.60 3,806.66
Agricultural Sectors•Cotton•TreeNutsandDryFruits•WoodProducts•FreshFruits•Pulses•VegetableOil•PlantingSeeds•SnackFoods•HidesandSkins
Unit: USD Millions 2012 est. 2013 est.Total Market Size 73,756.73 84,189.26Total Domestic Travel 36,647.03 41,411.15Total Inbound Travel 18,292.80 20,762.33Total Outbound Travel 18,816.90 22,015.78Total Outbound Travel to the U.S. 3,460.60 3,806.66
0 10,000 20,000 30,000 40,000 50,000 60,000 70,000 80,000 90,000
Total Market Size
Total Domestic
Travel
Total Inbound
Travel
Total Outbound
Travel
Total Outbound
Travel to the U.S.
USD
Mill
ions
Travel & Tourism
2012 est.
2013 est.
7
CottonIndia is the world’s second largest producer and exporter of cotton. India will be in the export market for the next few years, until domestic consumption catches up with the production surge. However, India will continue to import extra long staple (ELS) and quality long staple cotton (28-34 mm), with occasional imports of medium staple cotton when international prices are favorable. The United States has been the leading supplier of cotton to India over the past few years. U.S. cotton exports to India in CY 2011 were valued at about $ 93.1 million. Other major suppliers include Egypt, Commonwealth of Independent States (CIS), and West Africa. Indian mills that import US Pima and upland cotton are appreciative of its superior quality, consistency and higher ginning yield
Tree Nuts and Dry FruitsDry fruits and nuts (primarily almonds), have been one of the leading U.S. agricultural exports to India in the past, with exports in CY 2011 estimated at a record $308.2 million. The United States is the largest supplier of almonds (mostly in-shell) to India, with a market share of about 85 percent. Other suppliers include Australia, Syria, China, Iran, and Afghanistan. Afghani almonds enjoy a 100 percent concession on the basic import duty under the Indo-Afghan trade agreement. Almonds are a preferred nut in India and are gaining popularity among the growing middle-income population due to their nutritional and health benefits. India also imports small quantities of dates, pistachios, hazel nuts, prunes, and raisins, mainly from the United States, Iran, Afghanistan, Pakistan, and the Middle East
Wood ProductsIndia has removed virtually all non-tariff trade barriers on wood product imports, although tariffs remain high. The domestic market is highly price sensitive and scarce supplies and high prices have limited the use of wood in construction and other sectors. Dwindling domestic supplies and restrictions on tree felling due to environmental concerns are likely to result in a more liberal import regime over the coming years. U.S. wood and wood products exports to India in CY 2011 were valued at a record $31 million.
Fresh FruitsIndia provides market access for most fresh fruits, although tariffs are high. With a growing segment of consumers insisting on high standards and year-round availability, there is an increasing demand for imported fresh fruits. U.S. exports of fresh fruit (mostly apples and table grapes) to India in CY 2011 were valued at $ 101 million. Market sources expect imports to continue to show excellent growth over the coming years, with new products expected to enter the Indian market.
PulsesIndia is the world’s largest importer of pulses (peas, lentils, and beans), with annual imports ranging from 2.5-3.8 million tons. In IFY 2010/11 (Apr-Mar) imports totaled 2.8 million tons. India is primarily a price (rather than quality) market with imports sourced largely from Canada, Myanmar, Australia, and France. The typically higher priced U.S. green and yellow peas and lentils have become more price competitive in the Indian market in recent years due to domestic shortages and higher prices. As a result, imports of pulses from the U.S., (mostly dry green peas and some yellow peas), witnessed significant growth during the past 5 years, reaching a record 224 thousand tons in CY 2009. While U.S. pulse exports declined to 98,700 tons in CY 2011, India is still one of the leading markets for U.S. pulses. Pulses are currently exempted from import tariffs.
Vegetable OilIndia is the world’s second largest edible oil importer after the EU-27, with 2011-12(Oct-Sep) imports estimated at 9.1 million tons. While lower priced palm oil has traditionally dominated this price-sensitive market, exporters with competitively priced supplies of other oils, (for example soybean, cottonseed, corn, or sunflower oil), often find buyers in India. Food inflation concerns prompted the Indian government to eliminate the import duty on
8
most crude edible vegetable oils and to lower the import duty on refined vegetable oils to 7.5 percent. In CY 2010, U.S. soybean oil was price competitive in India, resulting in commercial sales of around $133 million dollar, up 11 percent over CY 2009. CY 2011 exports were negligible due to higher U.S. prices.
Planting SeedsIndian imports of planting seeds, mostly for vegetables and flowers in Indian fiscal year 2010/11 (April/March) were valued at $63.6 million, with a U.S. share of over $6 million. The Indian seed industry is undergoing a transformation, which includes an increasing role for private seed companies, the rising presence of multinational seed companies, and wide-ranging changes in the regulatory framework. All of these will likely affect seed research, marketing, and trade in coming years. With demand for high quality fruits and vegetables growing from domestic consumers and the food processing industry, India’s seed imports are likely to grow.
Snack FoodsConsumers’ changing life styles and the increasing disposable income of the middle class have spurred rising demand for imported snack foods, despite competition from local players. CY 2011 exports of U.S. snack foods to India reached a record $7 million.
Hides and SkinsIndia imported hides and skins worth $92.16 million during Indian CY 2010, about 20 percent over the previous year. (Complete CY 2011 data is not yet available). These were primarily used by the booming leather goods export sector. While India has historically imported from Europe, exporters from New Zealand, Myanmar, the Middle East and Africa have emerged as significant competitors. Imports of hides and skins from U.S. suppliers fell from approximately 3 million dollars in 2010 to 750 thousand dollars in 2011 (75 percent). Raw hide imports attract a zero tariff in India while wet blues attract a tariff of 14.71 percent.
9