Embed Size (px)
Citation preview
18
CHAPTER 2
INDUSTRIAL SICKNESS IN INDIA AND
REVIEW OF LITERATURE
2.1 INTRODUCTION
This chapter covers two broad topics - Industrial Sickness in India and
Review of Literature. In the first section, an overview of industrial sickness in
India is provided. Legal framework and reorganization of sick units are also
discussed in the first section. The second section of this chapter is devoted to
the review of previous research studies. Such a review provides a glimpse of
already established sickness prediction models and the financial ratios used as
discriminators and predictors. In all, this chapter provides the basic theoretical
framework.
2.2 INDUSTRIAL SICKNESS IN INDIA
Corporate distress is a global phenomenon. It can involve any of the
three main stages namely bad corporate performance, corporate bankruptcy and
industrial sickness. Firms that perform poorly are likely to enter corporate
bankruptcy when they fail to pay their debt obligations. The definition of
industrial sickness in India is beyond bankruptcy and it refers to the firms
persistently making losses and survive, even after such accumulated losses
have exceeded net worth many times (Goswami, 1996)1. Financial distress is
defined as “the inability of a firm to pay its financial obligations as they
mature” (Beaver, 1966)2. Similar definitions of financial distress were
proposed by Andrade and Kalpan (1998)3 and Brown, James and

19
Mooradian (1993)4 who interpreted financial distress as a crucial event, the
occurrence of which separates the time of a company’s financial health from
the period of financial illness and requires corrective actions in order to
overcome the troubled situation.
The term ‘bankruptcy’ is used in research studies carried out in USA.
Bankruptcy is a legal event taking place at a definite point of time and is
undoubtedly a conclusive evidence of the firm having failed. In practice,
bankruptcy is the culmination of failure. Failure, in the economic sense, occurs
prior to bankruptcy proceedings. Platt and Platt (2006)5 found that financial
distress and bankruptcy were not same process, explaining the reason why
many fiancially distressed firms do not ultimately file for bankruptcy
protection.
India has coined her own terminology as ‘industrial sickness’ or
‘corporate sickness’ (Banjerjee, 2005)6. In general, bankruptcy is defined as
the inability of a company to continue its current operations due to high debt
obligations (Pongstat, Ramage and Lawrence, 2004)7. Some of the research
studies including Beaver (1966)2, have defined bankruptcy according to the
rationale and scope of their study, rather than following any general definition.
In the present study, the definition of sick industrial unit as proposed by Sick
Industrial Companies (Special Provisions) Act, 1985 (SICA) has been
considered. The terms ‘sickness’ and ‘bankruptcy’ have been used
interchangeably in this study.
20
2.2.1 Operational Definition of Sick Industrial Unit:
According to Sick Industrial Companies (Special Provisions) Repeal
Act, 2003, Sick Industrial Company means an industrial company which has at
the end of any financial year accumulated losses exceeding 50 per cent of peak
net worth during the last four years or has failed to repay installment of its
debts or creditors in 3 consecutive quarters.
Any of the above two conditions is sufficient to consider a company
sick.
It may be noted here that industrial companies existing immediately
before the commencement of Sick Industrial Companies (Special Provisions)
Act, 1985 (1 of 1986) commonly known as SICA and are registered for at least
last five years, have accumulated losses equal to or exceeding its entire net
worth, will also be treated as sick units. Sick Industrial Companies (Special
Provisions) Act, 1985 (SICA) was repealed and replaced by Sick Industrial
Companies (Special Provisions) Repeal Act, 2003.
The definition of a sick unit by RBI is that a firm which incurs cash loss
for one year and in the judgment of the bank is likely to incur further losses for
the current year as well as for the following year. It highlights a common
factor, namely sustenance of cash loss and erosion of Net Worth (Panigrahy
and Mishra, 1993)8.
As per section 2(46AA) of Companies Act 1956 ‘Sick Industrial
Company’ means an industrial company, which has at the end of any financial
year, accumulated losses exceeding 50% of average net worth during four
21
years; or has failed to repay debts to its creditor(s) in three consecutive quarters
on demand made in writing for such repayment.
Net worth means sum total of paid up capital and free reserves. Free
reserves includes all reserves created out of profits and security premium
account but does not include reserves created out of revaluation of assets and
depreciation reserves. Sick Industrial Companies (Special Provisions) Act,
1985 (SICA) deals with industrial sickness and it applies to industrial
undertakings both in public and private sectors.
The Act pertains to the following:
(a) The industries specified in the First schedule to the Industries
(Development and Regulation) Act, 1951 except the industries relating to ships
and other vessels drawn by power;
(b) Not being "small scale industrial undertakings or ancillary industrial
undertakings" as defined in Section 3(j) of the IDR Act.
(c) The criteria to determine sickness in an industrial company are (i) the
accumulated losses of the company to be equal to or more than its net worth i.e.
its paid up capital plus its free reserves (ii) the company should have completed
five years after incorporation under the Companies Act, 1956 (iii) it should
have 50 or more workers on any day of the 12 months preceding the end of the
financial year with reference to which sickness is claimed and (iv) it should
have a factory license.
2.2.2. History of Industrial Sickness in India:
Industrial sickness in India has become an important matter of concern,
22
in the light of its increasing magnitude in terms of number of sick units,
outstanding bank credit involved and number of workers affected. The total
number of sick industrial units in large, medium and small scale rose from
17,150 at the end of June 1979 to 92,559 at the end of December 1984. The
total amount of bank credit outstanding against these sick units rose from
Rs.1,283.43 crores at the end of June 1979 to Rs.3,218 crores at the end of
December 1984 (Yadav, 1986)9. During 1982-89, outstanding credit to sick
units has risen from Rs.2,585 crores to Rs.9,353 crores. The number of sick
units have increased at a modest rate of 4.8% per year, the amount of
outstanding credit locked in these companies have grown at 17.65% during
1982-89 and the real outstanding bank credit has risen by 11% per year over
inflation (Kapila and Kapila, 1995)10
. Industrial sickness in India has resulted
in an accumulated loss of more than Rs.23,000 crores during 1987-96 and has
left about 1.2 million workers in uncertainty.
According to BIFR performance review report of 1996, the cumulative
losses of 1,447 sick companies registered with the board added up to Rs.23,793
crores against the total net worth of Rs.8,981 crores up to December 1996.
Total accumulated losses of the Central and Public sector undertakings attained
Rs.15,392 crores and about 6,10,000 workers were affected. As on March
2001, the total number of sick units in the portfolio of scheduled commercial
banks stood at 2,52,947 involving an outstanding bank credit of about
Rs.25,775 crores. The major industries affected by sickness are textiles,
engineering goods and jute (Mukherjee and Ghose, 2002)11
.
23
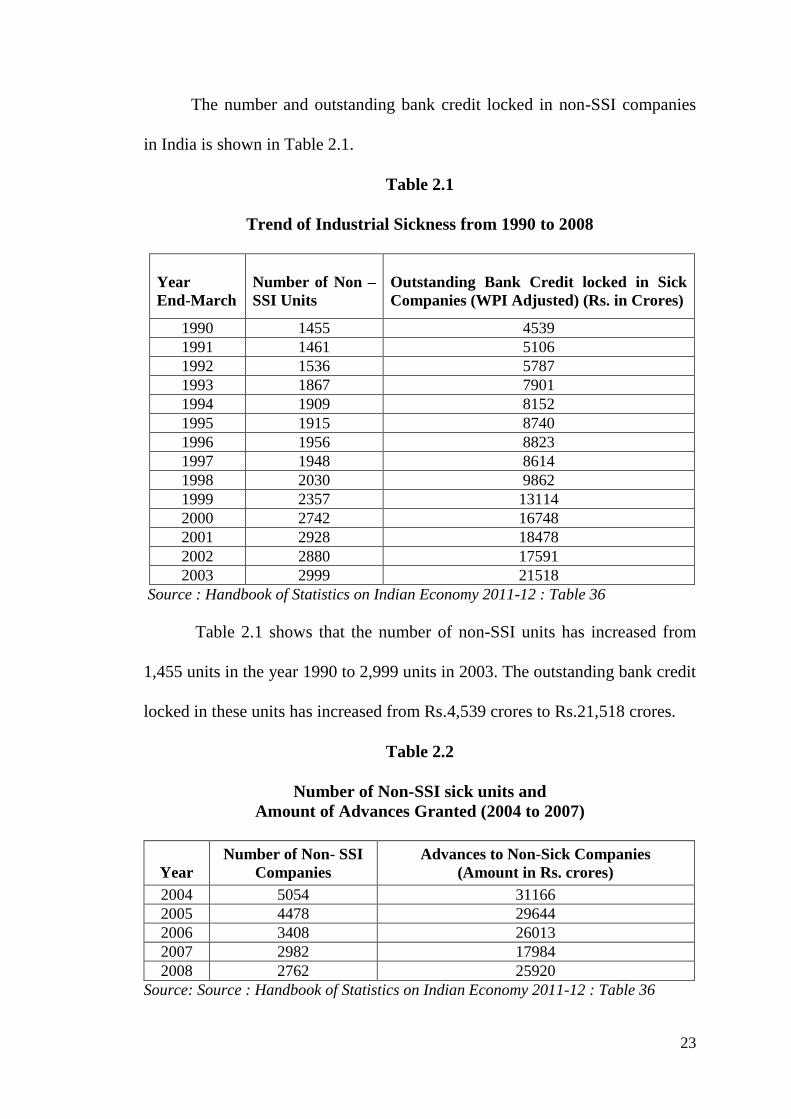
The number and outstanding bank credit locked in non-SSI companies
in India is shown in Table 2.1.
Table 2.1
Trend of Industrial Sickness from 1990 to 2008
Year
End-March
Number of Non –
SSI Units
Outstanding Bank Credit locked in Sick
Companies (WPI Adjusted) (Rs. in Crores)
1990 1455 4539
1991 1461 5106
1992 1536 5787
1993 1867 7901
1994 1909 8152
1995 1915 8740
1996 1956 8823
1997 1948 8614
1998 2030 9862
1999 2357 13114
2000 2742 16748
2001 2928 18478
2002 2880 17591
2003 2999 21518
Source : Handbook of Statistics on Indian Economy 2011-12 : Table 36
Table 2.1 shows that the number of non-SSI units has increased from
1,455 units in the year 1990 to 2,999 units in 2003. The outstanding bank credit
locked in these units has increased from Rs.4,539 crores to Rs.21,518 crores.
Table 2.2
Number of Non-SSI sick units and
Amount of Advances Granted (2004 to 2007)
Year
Number of Non- SSI
Companies
Advances to Non-Sick Companies
(Amount in Rs. crores)
2004 5054 31166
2005 4478 29644
2006 3408 26013
2007 2982 17984
2008 2762 25920
Source: Source : Handbook of Statistics on Indian Economy 2011-12 : Table 36
24
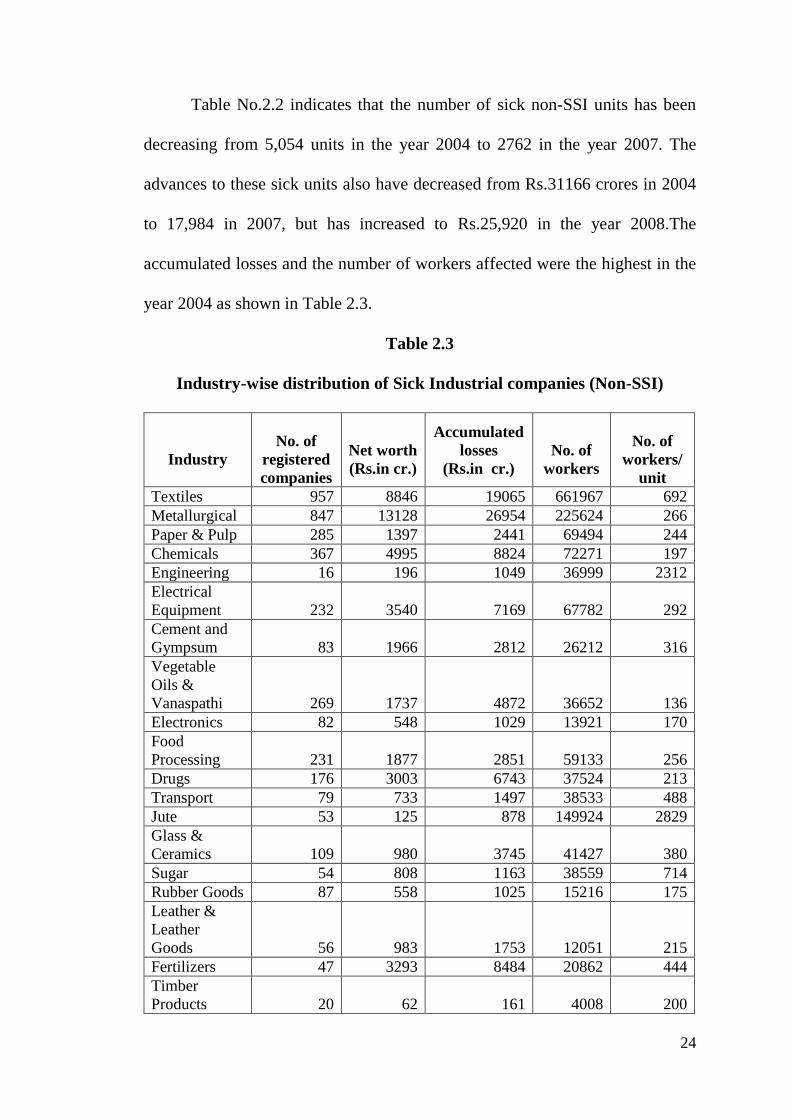
Table No.2.2 indicates that the number of sick non-SSI units has been
decreasing from 5,054 units in the year 2004 to 2762 in the year 2007. The
advances to these sick units also have decreased from Rs.31166 crores in 2004
to 17,984 in 2007, but has increased to Rs.25,920 in the year 2008.The
accumulated losses and the number of workers affected were the highest in the
year 2004 as shown in Table 2.3.
Table 2.3
Industry-wise distribution of Sick Industrial companies (Non-SSI)
Industry
No. of
registered
companies
Net worth
(Rs.in cr.)
Accumulated
losses
(Rs.in cr.)
No. of
workers
No. of
workers/
unit
Textiles 957 8846 19065 661967 692
Metallurgical 847 13128 26954 225624 266
Paper & Pulp 285 1397 2441 69494 244
Chemicals 367 4995 8824 72271 197
Engineering 16 196 1049 36999 2312
Electrical
Equipment 232 3540 7169 67782 292
Cement and
Gympsum 83 1966 2812 26212 316
Vegetable
Oils &
Vanaspathi 269 1737 4872 36652 136
Electronics 82 548 1029 13921 170
Food
Processing 231 1877 2851 59133 256
Drugs 176 3003 6743 37524 213
Transport 79 733 1497 38533 488
Jute 53 125 878 149924 2829
Glass &
Ceramics 109 980 3745 41427 380
Sugar 54 808 1163 38559 714
Rubber Goods 87 558 1025 15216 175
Leather &
Leather
Goods 56 983 1753 12051 215
Fertilizers 47 3293 8484 20862 444
Timber
Products 20 62 161 4008 200
25
Miscellaneous 1097 16790 26627 845070 770
Total 5147 65565 129144 2473229 481
Source: BIFR website www.bifr.nic.in.(visited on 26.06.2011).
Figures are as on 31.12.2004
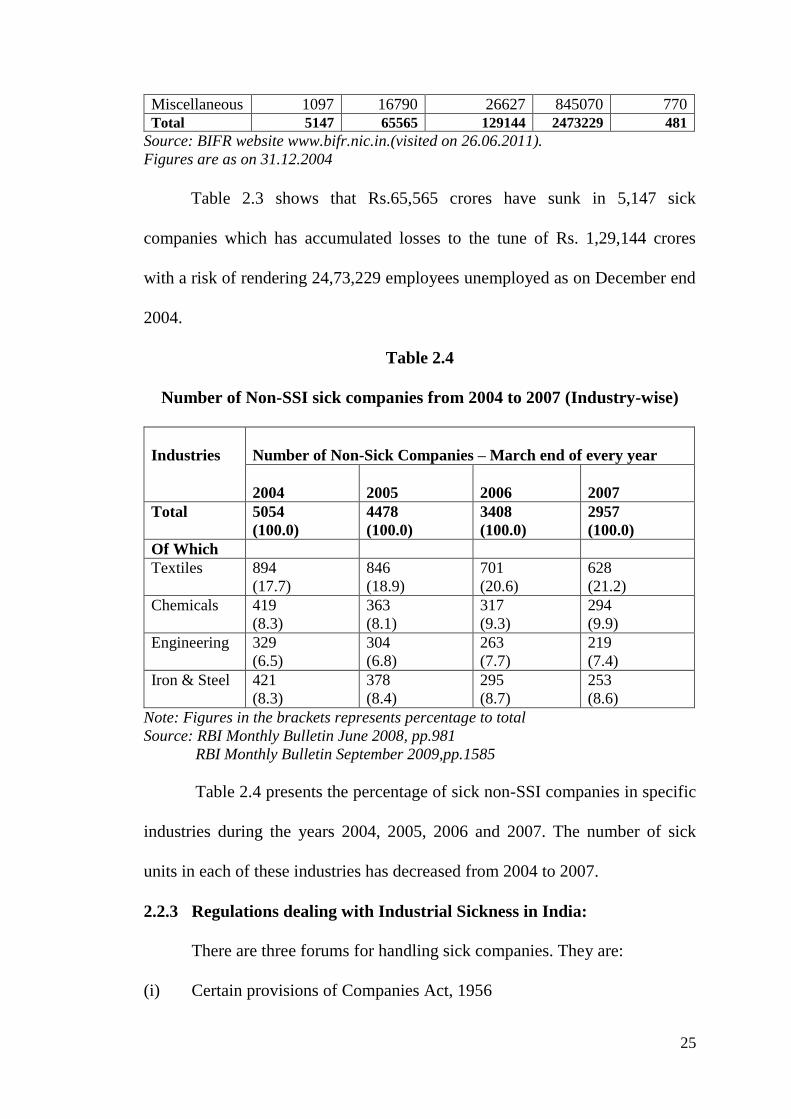
Table 2.3 shows that Rs.65,565 crores have sunk in 5,147 sick
companies which has accumulated losses to the tune of Rs. 1,29,144 crores
with a risk of rendering 24,73,229 employees unemployed as on December end
2004.
Table 2.4
Number of Non-SSI sick companies from 2004 to 2007 (Industry-wise)
Industries
Number of Non-Sick Companies – March end of every year
2004
2005
2006
2007
Total 5054
(100.0)
4478
(100.0)
3408
(100.0)
2957
(100.0)
Of Which
Textiles 894
(17.7)
846
(18.9)
701
(20.6)
628
(21.2)
Chemicals 419
(8.3)
363
(8.1)
317
(9.3)
294
(9.9)
Engineering 329
(6.5)
304
(6.8)
263
(7.7)
219
(7.4)
Iron & Steel 421
(8.3)
378
(8.4)
295
(8.7)
253
(8.6)
Note: Figures in the brackets represents percentage to total
Source: RBI Monthly Bulletin June 2008, pp.981
RBI Monthly Bulletin September 2009,pp.1585
Table 2.4 presents the percentage of sick non-SSI companies in specific
industries during the years 2004, 2005, 2006 and 2007. The number of sick
units in each of these industries has decreased from 2004 to 2007.
2.2.3 Regulations dealing with Industrial Sickness in India:
There are three forums for handling sick companies. They are:
(i) Certain provisions of Companies Act, 1956
26
(ii) Sick Industries Companies Act, 1985 (SICA) and this was replaced by
Sick Industrial Companies (Special Provisions) Repeal Act, 2003.
(iii) Board for Industrial and Financial Reconstruction (BIFR) for revival and
rehabilitation of sick companies and High Court for winding up.
The details of each of these forums have been discussed below.
(i) Companies Act, 1956:
The major amendments to the Companies Act 1956 include Companies
Amendment Act, 1988 and the Companies Amendment Act, 2002. The basic
intention behind incorporation of the new provisions (section 424A to 424L) in
Companies Act 1956 with regard to sick companies was to close the loopholes
in Sick Industrial Companies Act. The proposed Companies Bill 2011 contains
provisions with regard to revival/winding up of companies from section 253 to
259.
(ii) Sick Industrial Companies (Special Provisions) Act, 1985 (SICA)
The broad objectives of SICA are:
1. Timely detection of sick and potentially sick companies
2. Speedy determination of preventive, remedial measures by expediting
the revival of potentially viable units or closure of unviable units ( Sick
Industrial Company) and
3. Expeditious enforcement of the measures and thus by revival of the sick
unit, idle investments will become productive and by closure, the locked
up investments in unviable units would get released for productive use
elsewhere.
27
(iii) Board for Industrial and Financial Reconstruction (BIFR):
The Government of India set up Board for Industrial and Financial
Reconstruction (BIFR) in January 1987 (operational from May 15, 1987), under
the purview of Sick Industrial Companies (Special Provisions) Act, 1985
(SICA) for determining the preventive ameliorative remedial and other
measures which were required to be taken in respect of sick industrial
companies. It has been established as a quasi-judicial body in the Department of
Economic Affairs, Ministry of Finance, for revival and rehabilitation of
potentially sick undertakings and for closure/liquidation of non-viable and sick
industrial companies.
BIFR deals with medium and large scale sick industrial companies as
heavy investments are sunk in such industries. In December 2004, the
Government established a Board for Reconstruction of Public Sector Enterprises
(BRPSE) to advice on revival /restructuring of sick and loss-making CPSEs.
The Board of directors will be responsible for reporting sickness of industrial
companies to BIFR under the provisions of SICA within 60 days from the date
of finalization of duly audited accounts of the company. The Central or State
Government or RBI or public financial institution or scheduled bank, if have
sufficient reasons to believe that accumulated losses have resulted in an erosion
of 50 per cent of its peak net worth during the immediately preceding four
financial years, then it can report the matter to BIFR. If BIFR, upon its own
knowledge, has reasons to believe that accumulated losses have resulted in an
erosion of 50 per cent of its peak net worth during the immediately preceding
28
four financial years, then also BIFR can initiate enquiry regarding sickness.
On receipt of such a reference, BIFR will conduct an inquiry and
ascertain whether the company is sick or not. For this purpose, the Board may,
through any operating agency, cause to prepare with respect to the sick
company:
a. A complete inventory of that company which includes all assets and
liabilities as well as all books of accounts, registers, maps, plans, records,
documents of title or ownership of property and all other documents of
whatsoever nature relating thereto;
b. A list of shareholders and creditors (showing separately the list of
secured creditors and unsecured creditors);
c. A valuation report in respect of the shares and assets of the company;
d. An estimate of its reserve price, lease rent or share exchange ratio; and
Performa accounts, where no up-to-date audited accounts are available.
On the basis of such an enquiry, if BIFR is convinced that the company
has become sick, it will either give reasonable time to the company concerned
to make its net worth positive or it will appoint an operating agency consisting
of certain banks and financial institutions to prepare a package for the revival of
such sick industrial units. When BIFR is of the opinion that the sick industrial
unit is not likely to make its net worth exceed its accumulated losses within a
reasonable time and it is just and equitable that the company should be wound
up, then BIFR will forward its opinion for winding up of the sick unit to the
concerned High Court. The High Court will take final decision at its discretion
29
and it is binding on all the concerned parties.
The Act has established ‘Appellate Authority for Industrial and
Financial Reconstruction’. If the sick unit is not satisfied with the decision given
by BIFR, then it can appeal to this higher authority against the orders of BIFR,
within 45 days from the date on which order issued to sick unit. The person who
violates the provisions of this Act or any order of the Board or makes false
statement or gives false evidence shall be punishable with imprisonment up to 3
years and shall also be fined.
Table 2.5
Status of cases received by BIFR
Particulars
No. of Units
Number of cases received 7472
Number of cases disposed 4620
Number cases pending 1031
Number of companies declared sick 744
Companies recommended for winding up 1229
Winding up recommended to the High Court 1337
Source: Indian Express dated May 04,2010 (accessed on 07.05.2013)
Table 2.5 shows that out of total cases received so far, 744 cases were
declared sick, 1229 recommended for winding up and 1337 were recommended
to the High court for winding up.
BIFR has successfully achieved recovery of Bharat Heavy Electricals
Limited in the 1980s, and the turnaround of Arvind Mills, Scooters India and
the North Eastern Regional Agricultural Marketing Corporation. There have
been many cases in which attempts to revive the companies failed, including
Bharat Coking Coal Limited, Binny and Co., Calico Mills, Guest Keen
30
Williams, Hindustan Cables, Metal Box Company and Wyman Gordon (Kazmi,
2008)12
. The reasons include insufficient resources, delays and lack of political
willingness to take tough decisions. The BIFR in practice has been often
prolonging the life of unviable companies for years together at taxpayer expense
(Baijal, 2008)13
.
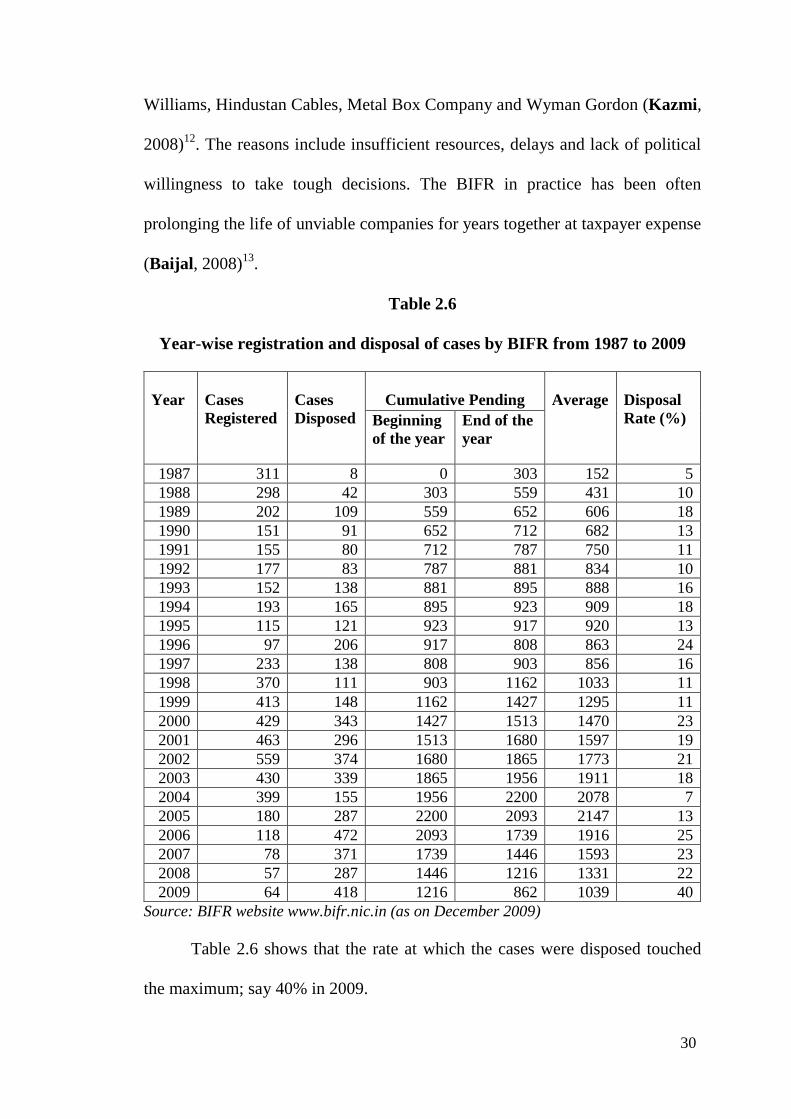
Table 2.6
Year-wise registration and disposal of cases by BIFR from 1987 to 2009
Year
Cases
Registered
Cases
Disposed
Cumulative Pending
Average
Disposal
Rate (%)
Beginning
of the year
End of the
year
1987 311 8 0 303 152 5
1988 298 42 303 559 431 10
1989 202 109 559 652 606 18
1990 151 91 652 712 682 13
1991 155 80 712 787 750 11
1992 177 83 787 881 834 10
1993 152 138 881 895 888 16
1994 193 165 895 923 909 18
1995 115 121 923 917 920 13
1996 97 206 917 808 863 24
1997 233 138 808 903 856 16
1998 370 111 903 1162 1033 11
1999 413 148 1162 1427 1295 11
2000 429 343 1427 1513 1470 23
2001 463 296 1513 1680 1597 19
2002 559 374 1680 1865 1773 21
2003 430 339 1865 1956 1911 18
2004 399 155 1956 2200 2078 7
2005 180 287 2200 2093 2147 13
2006 118 472 2093 1739 1916 25
2007 78 371 1739 1446 1593 23
2008 57 287 1446 1216 1331 22
2009 64 418 1216 862 1039 40
Source: BIFR website www.bifr.nic.in (as on December 2009)
Table 2.6 shows that the rate at which the cases were disposed touched
the maximum; say 40% in 2009.
31
The number of cases registered with BIFR in years 2010, 2011 and 2012
were 72, 73 and 80 units respectively. (Source: www.bifr.nic.in as on 06.05.13)
The Companies (Amendment) Bill 2001 proposed to set up a National
Company Law Tribunal (NCLT) and a National Company Law Appellate
Tribunal (NCLAT) which would take over the functions of the BIFR and other
bodies in order to speed up the process of winding down sick companies. The
government considered that the BIFR had not met its objective of preventing
industrial sickness and hence the bill was introduced. The Sick Industrial
Companies (Special Provisions) Repeal Act, 2003 replaced SICA and sought to
dissolve the BIFR and the Appellate Authority for Industrial and Financial
Reconstruction (AAIFR) and replace them by the NCLT and NCLAT.
However, legal hurdles prevent the constitution of NCLT.
2.2.4 Factors causing Industrial Sickness:
Industrial Sickness may be due to change in government policy, over
spending on essentials, absence of control on borrowings, dishonest practices
on the part of the management. The reasons for such sickness may vary from
unit to unit. The business failure may have been caused by a plethora of
reasons. The factors causing industrial sickness could be internal and external.
The external factors usually affect all the industrial units in the same group and
the internal factors affect a particular unit only, not the entire industry
(Srivastava and Yadav, 1986)14
.
32
When the causes of corporate bankruptcy are identified, preventive
measures can be undertaken and failure rates can be reduced (Abdelsamad
and Kindling, 197815
; Larson and Clute, 197816
)
The internal factors includes inadequate management, inappropriate
technology, sub-optimal plant and/or factors external to the organization, like
increased competition, economic condition, input shortages, changes in
government policies, or disturbed industrial relations. The major reasons for
industrial sickness are financial reasons, managerial inability, government
laws, technological changes, reduced product demand, and marketing related
problems (Singh and Singh, 2011)17
.
Hambrick and D’Aveni (1992)18
when examined top management
teams in bankrupt firms noticed that bankruptcy was associated with a
dominant CEO, high top management team turnover, small top management
teams with lower percentage of members with expertise in marketing/sales,
operations, production and R&D.
Argenti (1976)19
found that features associated with companies failure
could be categorized into three categories namely, inherent defects in the
actual organization and financial structure of the company (ii) management
mistakes and (iii) symptoms of deterioration and thus supported the fact that
lack of financial expertise among top management team members was
associated with bankruptcy.
33
A firm would be in a crisis situation when already weakened by poor
management, lack of control and inefficiency is subjected to adverse
movements in market demand and commodity prices, price competition
(Slatter, 1984)20
.
This part of the chapter has discussed the trend of industrial sickness in
India and the outstanding bank credit due to the lenders including banks and
financial institutions. The efforts being made by various legal regulations have
been dealt in detail. The factors affecting industrial performance have gained
serious attention of the researchers, who explore various techniques of
predicting the symptoms of corporate bankruptcy in order to prevent companies
from falling sick. In this direction, the present study attempts to identify the
financial ratios that reveal symptoms of sickness and thus focus on developing
sickness prediction models using various analytical tools.
2.3 REVIEW OF LITERATURE
This part provides an outline of previous research works on
discriminators and predictors of corporate bankruptcy. Failure prediction
models including Altman’s Model and new sickness prediction models
developed using Multi Discriminant Analysis (MDA) and Logit analysis have
been discussed. The academic literature on corporate bankruptcy is an
extensive area for research work and has definite conclusions indicating that
financial ratios significantly predict corporate failure. Most of the studies have
concluded that Multiple Discriminant Analysis (MDA) performs well and
certain other research studies have found that Logit analysis was better than
34
Altman’s model and MDA. An overview of these related studies is provided
below.
2.3.1 Financial Ratios as Discriminators and Predictors of Corporate
Bankruptcy:
Karami, Hosseini, Attaran and Hosseini (2012)21
employed
independent sample t-test to 18 financial ratios of 45 bankrupted and 45 non-
bankrupted firms from various industries and found that there were significant
differences in two groups and those ratios such as liquidity (Current
Assets/Current Liabilities), leverage (Total Liabilities/Total Assets) and
profitability (Return On Assets, Net Income/Fixed Assets, Operating
Income/Total Assets) were appropriate measures for classifying bankrupt from
non-bankrupt.
Leksrisakull and Evans ( 2005)22
selected a sample of 89 non-failed
and 46 failed firms and employed 37 financial ratios classified into five
categories, namely leverage, profitability, turnover, liquidity and others. It was
found that the significance of the Wilks’ Lambda statistic indicating that the
five variables - market value of equity/ total debt, earnings before interest and
tax/total assets, retained earnings/ total assets, sales/total assets and working
capital to total assets - were significant discriminators.
Samarakoon and Hasan (2003)23
tested for the difference between the
means of the variables belonging to 13 distressed and 13 non-distressed firms
of same size belonging to the same industry, using the paired t-test. It was
found that the means of the variables namely working capital to total assets,
35
retained earnings to total assets, earnings before interest and taxes to total
assets, market value of equity to book value of total liabilities, book value of
equity to book value of total liabilities and sales to total assets in the distressed
sample were vastly lower than the means in the non-distressed sample. Also the
results of the paired t-test showed that the mean differences in variables
between the two groups were extremely significant.
Gupta (1983)24
examined a sample containing 20 sick and 21 non sick
textile companies during 1962-64 to identify the lead indicators of sickness
using 63 financial ratios. Using Discriminant analysis, it was found that net
worth to short and long term debt and all outside liabilities to tangible assets
were useful. The study revealed that five ratios were found to have the highest
predictive value and the least classification error when applied to a
homogeneous group. They were: Earnings Before Depreciation, Interest and
Tax (EBDIT)/Net Sales, Operating Cash Flow (OCF)/Net Sales, EBDIT/Total
Gross Assets, OCF/Total gross Assets and EBDIT/Interest + 0.25 (Debt). The
study also revealed that in early years of the company, the predictive power of
OCF and EBDIT was more or less the same and in the later years, OCF become
important as sick firms rely more and more on borrowed funds.
Green (1978)25
stated that financial ratios have been regarded as
indicators of corporate health revealing liquidity, leverage, activity and
profitability and one could evaluate its future likelihood of success.
Weibel (1973)26
constructed a sample of 36 failed swiss firms from
1960 to 1971 and matched them to a like number of non-failed firms in terms
36
of age, size and line of business. The researcher analyzed ratios of these two
groups using univariate statistical parametric and non-parametric tests, and
found that many of the individual ratios were non-normal. He used cluster
analysis and found that six other ratios including liquidity measures were
effective in discriminating among the paired groups and also found that
inventory turnover and debt to asset ratios were good individual predictors.
Beaver (1966)27
compared the mean values of 30 ratios of 79 failed and
79 non-failed firms in 38 industries and the results of the univariate analysis
showed empirical evidence that cash flow/total debt exhibit statistically
significant warnings prior to business failure. The researcher found that Net
Income to Total Debt had the highest predictive ability (92% accuracy one year
prior to failure), followed by Net Income to Sales (91%) and Net Income to Net
Worth, Cash Flow to Total Debt and Cash Flow to Total Assets (each with
90% accuracy) and suggested that the possibility of using multiple ratios
simultaneously may have higher predictive ability than single ratios.
Winakor and Smith (1935)28
analysed financial ratios of 183 failed
firms belonging to different industries in a follow-up study to the BBR’s 1930
publication. The results of the study indicated that Working capital to total
assets was a better predictor than both cash to total assets and current ratio. It
was found out that current assets to total assets ratio dropped as the firm
approached bankruptcy.
Patrick (1932)29
the pioneer in the field of corporate failure, examined
whether there was significant difference in the ratios between failed and non-
37
failed firms at least three years prior to failure. The researcher selected 19
companies randomly which had failed during the period of 1920-1929 and
matched with 19 successful companies using financial soundness, asset size,
sales volume, product line and fiscal year as matching criteria. The study
showed that the net worth to debt and net profits to net worth were the best
indicators of failure among the ratios used.
In 1930, the Bureau of Business Research (BBR)30
published a bulletin
containing a study analyzing 24 ratios of 29 firms to determine common
characteristics of failing firms. When the ratios of each firm were compared
with the average ratios, eight ratios were considered as indicators of “growing
sickness” of a firm. They were: Working capital to total assets, Surplus and
Reserves to total assets, Net worth to fixed assets, Fixed assets to total assets,
current ratio, Net worth to total assets, Sales to total assets and cash to total
assets. It claimed that Working capital to total assets ratio was a more valuable
indicator than current ratio.
Zulkarnain et al. (2001)31
Lennox (1999)32
, Ohlson (1980)33
and
Libby (1975)34
revealed that profitability was an important determinant of
bankruptcy. The companies with large profits naturally have a lower
probability of bankruptcy; hence, the relationship between profitability and
corporate sickness is negative. The company’s short term solvency must be
measured to find out its ability to meet short term financial obligations.
38
Majority of the studies including Mohamed, Li, and Sanda (2001)35
,
Zmijewski (1984)36
, Ohlson (1980)37
, Deakin (1972)38
and Beaver (1966)27
found that Debt related ratios significantly determine corporate failure.
2.3.2 Corporate Bankruptcy Prediction Models:
Datta (2012)39
found that the financial ratios used in various models
including Altman’s (1968) model were so complicated that it become difficult
to operationalize them in the Indian context and concluded that the existing
models might not provide a robust set of financial ratios for analyzing firm
level sickness. Thus models were developed based on MDA and Logit analysis
and the validity of these two models were checked by considering a panel data
of 50 ‘healthy’ companies and 50 ‘sick’ companies and found them robust. The
Discriminant model correctly classified 97% before one year, 95% before two
years, 93% before three years, 90% before four years and 86% before five
years of original grouped companies whereas using the predictive model
developed, with probability of 0.72, 97% of the companies have been found to
be correctly classified into their respective predetermined group.
Uchenna and Okelue (2012)40
used a sample of 11 Nigerian firms and
employed parametric t-test to test the hypothesis if there is no significant
difference between the failure/success factor (Z) of Nigerian manufacturing
firms and the corporate bankruptcy model using multi discriminant analysis
model. The study indicated that there is no significant difference between the
failure/success factor (Z) of Nigerian manufacturing firms and the multi
discriminant analysis model outcome.
39
Rashid and Abbas (2011)41
considered a sample of companies
belonging to non-financial sector of Pakistan which became bankrupt over the
time period 1996-2006 and matched non-bankrupt firms in the same industry.
Using statistical t-test, it was found out that there was a significant difference
between the two populations means for three financial variables namely EBIT
to total assets, market value of equity to book value of debt, and equity to long
term debt. The Multivariate Discriminant Analysis concluded that EBIT to
current liabilities ratio, sales to total assets ratio and cash flow ratio were found
highly significant at 5% significance level. Twenty four financial ratios
covering profitability, liquidity, leverage, and turnover ratios were examined
for a five-year period prior to bankruptcy. The researchers used discriminant
analysis to produce a parsimonious model of three variables viz. sales to total
assets, EBIT to current liabilities, and cash flow ratio. The estimates showed
that firms having Z-value below zero falls into the “bankrupt” whereas the
firms with Z-value above zero fall into the “non-bankrupt” category and the
model achieved 76.9% prediction accuracy.
Kosmidis , Venetaki , Stavropoulos and Terzidis (2011)42
developed
a model for the prediction of financial distress using 27 financially
distressed and 27 financially viable companies with 41 financial ratios. T-tests
and univariate discriminant analysis were employed to identify the most
significant factors for the financial viability of companies. The empirical
results of the study indicated that the Logit model was more accurate than
the MDA model in terms of correct classification.
40
Yap, Yong and Poon (2010)43
used 32 failed companies with matching
32 non-failed companies and developed a failure prediction model to improve
the predictive abilities for company failures using 16 financial ratios for 64
companies in Malaysia. A strong discriminant function was constructed using
multi discriminant analysis wherein seven ratios were found to be significant in
its discriminating power and the model had good predictive abilities with
accuracy rates of 90% on average for the analysis sample and 89% on average
for the hold-out sample for the five years prior to actual failure. The results of
the study revealed that the ratios measuring liquidity and profitability were
most useful in predicting a company’s success or failure.
Hlahla (2010)44
developed a bankruptcy prediction model for South
African companies listed on the Johannesburg Stock Exchange. The study used
a sample of 14 failed and 14 non-failed firms and 64 financial ratios as
independent variables in a Multi Discriminant Model. Times Interest Earned,
Cash to Debt, and working capital to turnover ratios were identified as
significant ratios. The results of the study showed that the Times Interest
Earned had greater discriminating power followed by cash to debt ratio and
working capital turnover ratio. The overall classification accuracy of the model
was found to be 75.3 per cent.
Ahmad, Azhar and Wan-Abu-Bakar (2010)45
investigated whether a
model utilizing cash-flow ratios in combination with other categories of
financial ratios result in a model superior to a model that does not include cash-
flow ratios. A sample of 4607 non-failed firms and 2260 failed firms for a

41
period of 5 years from 1998 to 2002 with 41 financial ratios as independent
variables was employed using logistic regression. The study considered all the
firms to be included in the analysis and the matched pair design was not
adopted. Two models were constructed, first model containing activity,
liquidity, leverage and profitability ratios along with operating cash flow based
ratios. The operating cash flow to current liabilities, operating cash flow to total
assets and operating cash flow to total debts were the cash flow ratios. The
second model is similar to the first one, except that it excluded operating cash
flow based ratios. It was found that the first model had a better association
between the independent variables and the dependent variable than the second
model and the overall accuracy was 68.30 per cent and 66.90 for the two
models respectively. The results asserted that a model utilizing cash flow ratios
served as the best warning signals of bankruptcy.
Angelina (2009)46
developed a model using Discriminant Analysis to
investigate into the prediction of sickness in the textile industries in India,
considering 70 textile industries, of which 39 being sick, 31 non-sick between
the years 1996 and 2006, using 25 financial ratios. Sick firms were taken on the
basis of those who have made a request for sickness with the BIFR or those
experiencing serious financial difficulties. The study revealed that that in the
case of isolated data set, the discriminant function was able to predict and
correctly classify 76.9%, 87.2% and 89.7% of the observations in the Non-sick
group and 83.9%, 80.6% and 83.9% respectively of the observations in the Sick
group in the first, second and third year prior to the event. The function
42
predicted 73.1% of the observations correctly in the Non-sick group for 1 and 2
years prior to sickness taken together and 82.3% of the observations in the Sick
group. The prediction for 1,2 and 3 years prior to sickness taken together was
78.6% of the observations correctly in the Non-sick group and 79.6% of the
observations in the Sick group observations correctly.
Gerantonis, Vergos and Christopoulos (2009)47
analyzed whether
Altman Z-Score model can predict correctly company failures for a period of
up to three years prior to sickness. The researcher found that this model was
useful in identifying financially troubled companies that may fail up to 2 years
before bankruptcy as it matches both accounting data and market value.
Chowdhury and Barua (2009)48
used Z score model to predict risk of
financial distress of Z category companies listed in Dhaka Stock Exchange
(DSE). The results suggested that ninety percent of the companies were
suffering from financial distress risk due to very poor management capability
and operating inefficiency. The Altman’s Z score model, though may not be
fully applicable for companies in Bangladesh, still it has proved its strong
validity and correctness in predicting distressful status of the Z category
companies. The researchers have acknowledged that the Altman Z score (1968)
model to predict the financial distress of publicly traded manufacturing firms
may not be the best technique to apply for companies operating in Bangladesh
as the rules of accounting treatment, the rules of accounting information
disclosure, and the governance structure may not be perfectly commensurate
with the companies considered by Altman (1968) in his model and thus they
43
opted to develop a new model to predict the financial distress for the
companies operated and traded in Bangladesh capital market both in DSE and
CSE.
Abdullah, Hallim, Ahmad and Rus (2008)49
considered a sample of 52
distressed and non-distressed companies. Among ten determinants of corporate
performance examined, the ratio of debt to total assets was found to be a
significant predictor of corporate distress regardless of the methodology used.
In addition, net income growth was another significant predictor in MDA,
whereas the return on assets was an important predictor when the logistic
regression and hazard model methodologies were used.
Bellovary, Giacomino and Akers (2007)50
have summarized and
analyzed the existing research on bankruptcy prediction studies from 1930’s,
when studies focused on the use of simple ratio analysis to predict future
bankruptcy, to the present. Investigation of model type by decade showed that
the primary method began to shift to Logit analysis in the 1980's.
Ugurlu and Aksoy (2006)51
identified predictors of corporate financial
distress, with help of the discriminant and Logit models, using a sample of 27
failed and 27 non-failed manufacturing firms during the period 1996-2003,
which included a period of high economic growth (1996-1999) followed by an
economic crisis period (2000-2002). The results of the study identified the
same number of significant predictors out of the total variables analyzed, using
the discriminant and Logit models, and six of these are common in both. The
ratio of EBITDA to total asset was found to be the most important predictor of
44
financial distress in both models. The Logit model identified operating profit
margin and the proportion of trade credit within total claims ratios as the
second and third most important predictors respectively. It was also found that
the discriminant model had lesser power and predictive accuracy during the
four years period prior to bankruptcy than the Logit model.
Sori, Hamid, Nassir and Mohamad (2006)52
selected a set of sample
companies from 6 different industries: 23 companies from the industrial sector,
6 companies from the property sector and 1 company from the consumer,
finance, hotel and mining sectors and used sixty-five ratios as independent
variables which were found to be of non-normal distribution and hence applied
log transformation to approximate the distribution to normal, but found it to be
ineffective for a diversified industry.
Sori, Hamid and Nassir (2006)53
examined the corporate failure before
the 1997 Asian Financial Crisis in three emerging capital markets namely
Malaysia, Singapore and Thailand and thus developed a failure classification
model based on multiple discriminant analysis to classify listed corporations
from these countries for the 1980 to 1996 period. The model was tested on a
sample of 33 Malaysian, 17 Singaporean and 52 Thailand failed firms and
similar number of non-failed firms in the respective countries as a control
sample. The model successfully discriminated between failed and non-failed
listed firms at the rate of 86%, 82% and 71% of Malaysian, Singaporean and
Thailand firms respectively.
45
Charitou, Neophytou and Charalambous (2004)54
examined the
incremental information content of operating cash flows in predicting financial
distress and thus developed reliable failure prediction models for UK public
industrial firms. The results of the study indicated that a parsimonious model
that includes three financial variables, a cash flow, a profitability and a
financial leverage variable which yielded an overall correct classification
accuracy of 83% one year prior to the failure and that the predictive ability of
the Altman model did not perform well when compared to Logit analysis. It
was found that operating cash flows possess discriminatory power when it
comes to predicting failure of UK companies.
Grice and Ingram (2001)55
found that the overall accuracy of the
model was significantly higher for manufacturing firms than non-
manufacturing firms and also that the relation between financial ratios and
financial distress changes over time. The results of the study indicated that
those who employ Altman’s Z-score model should re-estimate the model’s
coefficients rather than relying on those reported by Altman (1968).
Sulaiman, Jili and Sanda (2001)56
tested a Logit model that
distinguishes between the Malaysian firms that did and those that did not seek
court protection from their creditors. The factors which were found to have
significant discriminating power were: debt ratio, interest coverage and total
asset turnover ratio. The Logit model was able to classify accurately 80.7 per
cent of the firms in the estimation sample and 74.4 per cent in the hold out
sample.
46
Sori et al. (2001)57
developed a failure prediction model for Malaysian
industrial sector listed firms which discriminated between 24 failed and non-
failed for the period 1980 to 1996. The model correctly and significantly
classified 91.1% and 89.3% of the failed and non-failed firms respectively.
Also an alternative prediction model was developed based solely on accounting
information which showed similar results. These models predicted failure up to
4 years before the actual event. The variables in the final model implied that
that profits, cash flows, working capital and net worth are important
determinants of firm failures in the Kuala Lumpur Stock Exchange.
Mohamed, Li and Sanda (2001)35
compared MDA and Logit model in
the analysis of bankruptcy. The sample of 26 distressed companies and 79 non-
distressed companies were employed and the results showed that when using
MDA, debt ratio and total assets turnover were found to be significant but
when Logit analysis was used, an additional variable, interest coverage was
also found to be significant, emphasizing the importance of leverage ratio as a
predictor of failure. The Logit model predicted 80.7% of the companies in the
estimation sample and 74.4% in the hold-out sample, whereas the MDA model
predicted 81.1% of the companies in the estimation sample and 75.4% in the
hold-out sample.
Kahya and Theodossiou (1999)58
investigated a sample obtained using
the debt default criteria that included 117 healthy firms and 72 failed firms
whose financial data span the period 1974-91. The CUSUM (Cumulative
Sums) model being viewed as the dynamic time-series extension of LDA
47
resulted in correctly classifying failed firms to the extent of 68% in first year,
49% in second year, 43% in third year and 30% in fourth year prior to failure.
Mossman, Bell, Swartz and Turtle (1998)59
compared four types of
bankruptcy prediction models Altman’s (1968) Z-score model based on
financial ratios; Aziz, Emanuel, and Lawson’s (1988) model comprised of cash
flows; Clark and Weinstein’s (1983) market return model, and Aharony, Jones,
and Swary’s (1980) market return variation model. It was found out that in the
year prior to bankruptcy, the ratio model was the most effective in explaining
the likelihood of bankruptcy and in the three years preceding bankruptcy, the
cash flow model most consistently discriminates between bankrupt and non-
bankrupt firms.
Rujoub, Cook and Hay (1995)60
attempted to examine whether cash
flow data can provide a superior measure to predict bankruptcy over accrual
accounting data. The study used a sample of 33 failed firms and 33 non-failed
firms, matched on the basis of industry type and asset size and employed
eighteen financial ratios based on cash flow data including financial policies
ratio which is equal to cash from financing activities/Total assets. A stepwise
discriminant procedure was employed for selecting the financial ratios that are
most useful in discriminating between bankrupt and non-bankrupt firms and the
results showed that the classification accuracy of cash flow data model is
86.36%,78.79% and 69.70% in one year, at two years and three years prior to
failure respectively. This is higher than that of the model based on accrual data
with 81.82%, 71.21% and 69.70% in one year, two years and three years
48
respectively showing that cash flow data predict bankruptcy better than accrual
accounting data. It was concluded that the classification accuracy of the
combined model comprising of both accrual and cash flow data provide a
superior measure to predict bankruptcy, say, 90.91%, 86.36% and 69.70% in
one year, two years and three years respectively, meaning that the use of cash
flow data in conjunction with accrual accounting data improves the overall
predictive power of accrual accounting data.
Panigrahy and Mishra (1993)61
developed a cash flow variable model
using Multiple Discriminant Analysis (MDA) to predict corporate sickness
using a sample of 45 sick companies matched with 45 non-sick companies on
the basis of size, age, nature of industry and fiscal year of comparison. The sick
companies reported during 1977-87 were drawn at random from 12 different
industry groups and 16 cash flow ratios were employed. The results of the
study indicated that cash flow ratios have 86.67 per cent, 85.56 percent of
correct classification in 1 year and 2 years prior to sickness respectively.
Rais (1990)62
adopted stratified purposive sampling method in selecting
a sample of 18 sick and 18 non sick sugar mills and employed 28 financial
ratios. The researcher developed a discriminant function having five financial
ratios namely profit before tax/capital employed; net profit/net worth; profit
before interest and tax/interest; net profit/net working capital; net sales/net
working capital and net sales/fixed assets using multivariate discriminant
analysis. The accuracy of classification of sick and non-sick sugar mills was
found to be as high as 91%.
49
Gilbert et al (1990)63
investigated the predictive abilities of models
based on two types of samples: 52 bankrupt and 208 non-bankrupt firms and 52
bankrupt and 208 distressed firms during the period 1974-83. Holdout sample
was used to test accuracy of the model. 14 ratios were employed, of which
three were cash flow ratios. On applying stepwise logit, it was found out that
cash flow from operations to total liabilities was significant in classifying
bankrupt and non-bankrupt firms and cash flow from operations to current
liabilities was significant in classifying bankrupt and distressed firms. The
study concluded that cash flow ratios add significantly to prediction accuracy
of accrual models.
Aziz and Lawson (1989)64
compared cash models with Altman’s Z and
Zeta models, and a mixed model comprising cash and accrual variables
employing 49 bankrupt firms matched with 49 non-bankrupt firms up to five
years prior to failure. The researchers compared cash models with Altman’s Z
model and a mixed model comprising cash and accrual variables. It was found
that the cash flow model was more accurate in predicting bankruptcies and
operating cash flow and lender cash flow were the two most significant cash
variables.
Aziz, Emanuel and Lawson (1988)65
developed a Logit model with 6
factors that predicted accuracy levels of 85.7%, 85.7%, 79.6%, 81.3% and
84.8% respectively in 1st, 2
nd, 3
rd, 4
th and 5
th year before failure.
Gahlon and Vigeland (1988)66
compared cash flow profiles with
selected accrual ratios for 60 bankrupt and 204 non-bankrupt firms five years
50
prior to failure. The study resulted in cash flow from operation cash flow after
debt retirement and cash coverage indicating failure as early as the fifth year
prior to failure.
Dambolena and Shulmen (1988)67
recomputed logit model equivalents
for Altman’s (1968) model and Gentry et al. model using 25 bankrupt firms
and matching 25 non-bankrupt companies. The study revealed that net liquid
balance (equals operating cash flows minus increase in cash investments, plus
increase in long term financial flows) improved the predictive accuracy of both
models especially for non-bankrupt firms. This improvement in predictive
accuracy was greater for the Gentry et al model than for Altman’s model.
Gombola et al (1987)68
computed 21 accrual ratios and three cash flow
ratios namely cash flow from operations/sales, cash flow from operations/assets
and cash flow from operations/debt for 77 failed and matched non-failed firms
and found that non of these cash flow ratios were significant predictors of
failure.
So (1987)69
used eleven financial ratios for ten fiscal years from 1970 to
1979. He found that the distribution of many financial ratios were not normal
and were asymmetrically distributed even after removing the outliers.
Viscione (1985)70
carried out trend analysis of 24 bankrupt firms up to
five years prior to failure and compared cash flow from operations with
selected accrual ratios. He found out that cash flow from operations was not a
strong indicator of financial distress.
51
Casey and Bartczak (1985)71
conducted a study to assess whether
operating cash flow data and related measures lead to more accurate
predictions of bankrupt and non-bankrupt firms and whether operating cash
flow data can increase the accuracy of accrual based multiple discriminant and
Logit models to distinguish between bankrupt and non-bankrupt firms. He used
60 bankrupt and 230 non-bankrupt firms belonging to the same industry during
the period 1971-82 and employed MDA and logit. The results of the study
suggested that operating cash flow data do not provide incremental predictive
power over accrual based ratios.
Gentry, Newbold, and Whitford (1985)72
found that the addition of
cash-based funds flow components to the traditional financial ratios to
discriminate between failed and non-failed companies resulted in significantly
improved predictive performance. A sample of 33 failed and 33 non-failed
firms paired by size and industry classification was used with three techniques
namely, linear discriminant, Probit and Logit analysis and it was found that
MDA classification accuracy and predicted probabilities of failure were
marginally better than Probit and Logit analysis.
Zavgren (1985)73
using a sample of 45 bankrupt and 45 non-bankrupt
firms, developed 7-factor Logit model which resulted in an accuracy of 69%
for holdout sample in all the five years prior to failure.
Taffler (1984)74
examined 24 failed and 49 non-failed companies of the
distribution/retail sector for one year prior to sickness. Using MDA and
adjusted model for prior probabilities and misclassification costs, the results
52
showed that cash flow to total liability was the second most significant
predictor in the model.
Mensah (1983)75
employed 30 bankrupt and matching 30 non-bankrupt
firms with financial ratios up to five years prior to failure. By using MDA and
logit, it was found out that cash flow to net worth was the most significant
variable in historical cost model and this variable was ranked second in specific
price level model.
Largay and Stickney (1980)76
conducted comparison and trend
analysis of cash flow from operations and other accrual variables including
stock price for single case study of W.T.Grant Company. He found out that
cash flow from operations more accurately indicate impending failure up to 10
years prior to WT Grant’s demise.
Ohlson (1980)33
developed a prediction model using a sample of 105
bankruptcy firms and 2058 non-bankrupt firms during the period 1970-1976.
The results of the study revealed that the four factors derived from financial
statements which significantly assessed the probability of bankruptcy were:
(i) size (ii) the financial structure as reflected by a measure of leverage (Total
Liabilities to Total Assets) (iii) some performance measure (Net Income to
Total Assets, and Funds provided by operations to Total Liabilities) and some
measures of current liquidity (Working Capital to Total Assets and Current
Liabilities to Current Assets). The ratios that could very well discriminate
between non-sick and sick companies included net income ratios and sales
53
ratios as the net income and sales of a healthier company grew relatively
rapidly when compared to a sick company.
Sharma and Mahajan (1980)77
presented a general model of failure
prediction for retail firms using MDA and found that the model accuracy was
92%, 78%, 74%, 73% and 77% in the 1st, 2
nd, 3
rd, 4
th and 5
th year respectively
before failure.
Altman, Baidya and Dias (1979)78
utilized Altman (1968) model to
classify Brazilian firms during the period 1973 to 1976. A sample of 23
serious–problem firms was compared with a slightly larger control sample of
healthy firms. A four-variable bankruptcy classification model developed in the
study successfully classified 88 percent of the firms one year prior to serious
problems and as much as 78 percent three years prior.
Moyer (1977)79
used a paired sample of 27 bankrupt and 27 non-
bankrupt firms during 1965-75 and developed nine factor MDA model which
resulted in an accuracy of 89% in predicting corporate failure in each of the
three years prior to failure.
Blum (1974)80
developed a failing company model with reference to
three common denominators underlying the cash-flow framework namely
liquidity, profitability and variability to assess the probability of business
failure. Discriminant analysis was used to test the hypothesis that the model
can distinguish between 115 failed and 115 non-failed samples paired based on
industry, sales and number of employees. The model predicted failures with an
accuracy of approximately 94 percent when failure occurred within one year
54
from the date of prediction, 80 percent for failure two years into the future and,
70 per cent for failure in three, four and five years from the present.
Deakin (1972)38
made an attempt to develop an alternative to the Beaver
and Altman models. A sample of thirty-two failed firms during 1964-1970 and
thirty-two non-failed firms matched in terms of industry and asset size were
considered. In the first test, he adopted a method of analysis similar to Beaver’s
study by applying the dichotomous classification test and percentage error of
each ratio ascertained. In the second test, discriminant analysis technique was
applied using the same sample of data and 14 financial ratios as input to the
discriminant analysis. It was concluded that discriminant analysis could be
used to predict business failure from accounting data as far as three years in
advance with fairly high degree of accuracy. The prediction accuracy
pertaining to failed firms were found to be 77%, 96%, 94%, 91% and 87% in
the 1st, 2
nd, 3
rd, 4
th and 5
th years respectively.
Altman (1968)81
used multivariate discriminant analysis to develop a
five factor model for predicting bankruptcy of manufacturing firms. The ‘Z-
score’ predicted bankruptcy when the firm’s score fell within a certain range.
The discriminant-ratio model proved to be extremely accurate in predicting
bankruptcy correctly to the extent of 95% accuracy for the initial sample one
year before failure. However, the predictive ability of the model subsequently
dropped to 72% accuracy two years before failure, 48%, 29% and 36%
accuracy two years before failure, 48%, 29% and 36% accuracy three, four and
55
five years before failure respectively. The model resulted in 79% accuracy
when tested on a hold sample.
2.4 SUMMARY
From the review of previous research studies, it is observed that the
previous studies have focused more on predictors of bankruptcy rather than
discriminators between failed and non-failed firms. There are limited studies
attempting to determine financial ratios which discriminate between sick and
non-sick companies, though most of the studies focused on determining
predictors of corporate sickness. The studies using both parametric and non-
parametric statistical tests in determining discriminators and predictors with the
help of isolated and non-isolated data set are rare in the present. Earlier studies
have shown contradicting results in determining superior prediction models and
analytical tools in terms of prediction accuracy. Several studies established
superiority of accrual ratios over cash flow ratios in predicting corporate
sickness. They used either parametric or non-parametric tests in determining
discriminators and predictors. Quite a few studies used net worth-related and
cash flow-related measures. Some researchers have developed bankruptcy
prediction models with and without cash flow ratios to determine the predictive
ability of cash flows over accrual ratios; but there are very few studies
comparing these results on the basis of analytical tools used namely, Multiple
Discriminant Analysis, and Logit Analysis. Hence, this study attempts to fill
these gaps.
![WIEN-#2533808-v4-Marko Mobile Payments [Kompatibilitätsmodus] · Mag., LL.M., Akad. Medienfachmann Tel: + 43 / 1 / 51510 – 5090 Fax: + 43 / 1 / 51510 – 665090 E-Mail: roland.marko@wolftheiss.com](https://img.pdfslide.net/doc/110x75/5ec416f7e2fbf52ed91cd7a1/wien-2533808-v4-marko-mobile-payments-kompatibilittsmodus-mag-llm-akad.jpg)