Embed Size (px)
Citation preview
Integrating Energy Efficiency
Into Cold Storage Design
Paul G. Henningsen. Jr.
V.P. Corporate Development & Engineering
Henningsen Cold Storage Co.
&
Marcus H. Wilcox
President
Cascade Energy, Inc.
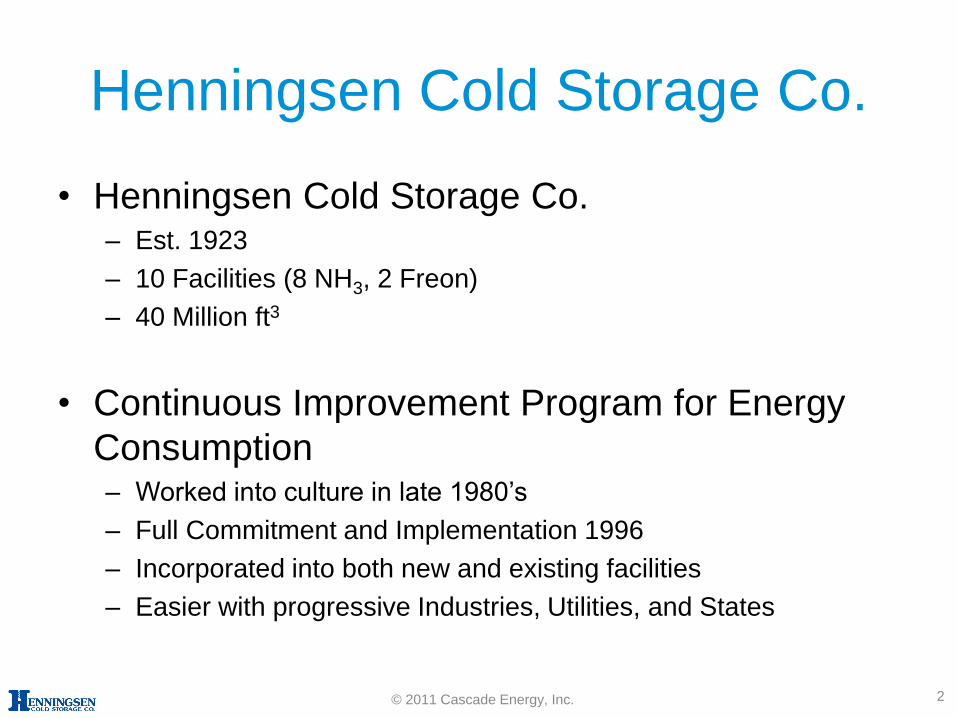
Henningsen Cold Storage Co.
• Henningsen Cold Storage Co. – Est. 1923
– 10 Facilities (8 NH3, 2 Freon)
– 40 Million ft3
• Continuous Improvement Program for Energy
Consumption – Worked into culture in late 1980’s
– Full Commitment and Implementation 1996
– Incorporated into both new and existing facilities
– Easier with progressive Industries, Utilities, and States
2 © 2011 Cascade Energy, Inc.
• GCCA Service Partner – Energy Efficiency
• We don’t sell equipment, we have no vendor preferences
• Offices in Oregon, Utah, and Washington – 75 people
• Industrial energy efficiency consulting
– Food processing, pulp & paper, petrochemical, manufacturing
– Worked on 700 to 800 ammonia refrigeration systems
• Services include:
– Energy management services, tools and software
– Traditional retrofit or new construction project engineering
– Tune-ups (i.e., kaizen blitzes or retro-commissioning)
– Design and management of utility energy efficiency programs
• Corporate energy management
– e.g. Americold, etc.
– e.g. Sysco, SuperValu, Ben E. Keith, etc. • Approximately 300 DCs and PRWs
Cascade Energy, Inc.
3 © 2011 Cascade Energy, Inc.
Continuous Improvement
• Process – Know where you are today
– Know where you want to be in the future
– Take stock of the tools available
– Devise a plan of how to get there
– Tackle small manageable steps
– Evaluate each step, refine, repeat
– Plan for the future (new technology and
improvements that don’t pencil today)
– Select Qualified Contractors & Consultants
4 © 2011 Cascade Energy, Inc.
Where are you today? • Establish a Baseline
– Industry Baseline (ASHRAE)
– Company Baseline (Historical Practices)
• What is Current Cost Structure
– Capital Costs
– Operating Costs
• Maintenance
• Utilities (Consumption & Rate)
• Know the Corporate Culture
– Quality Level
– Payback Period
– Partnership Tendency
5 © 2011 Cascade Energy, Inc.
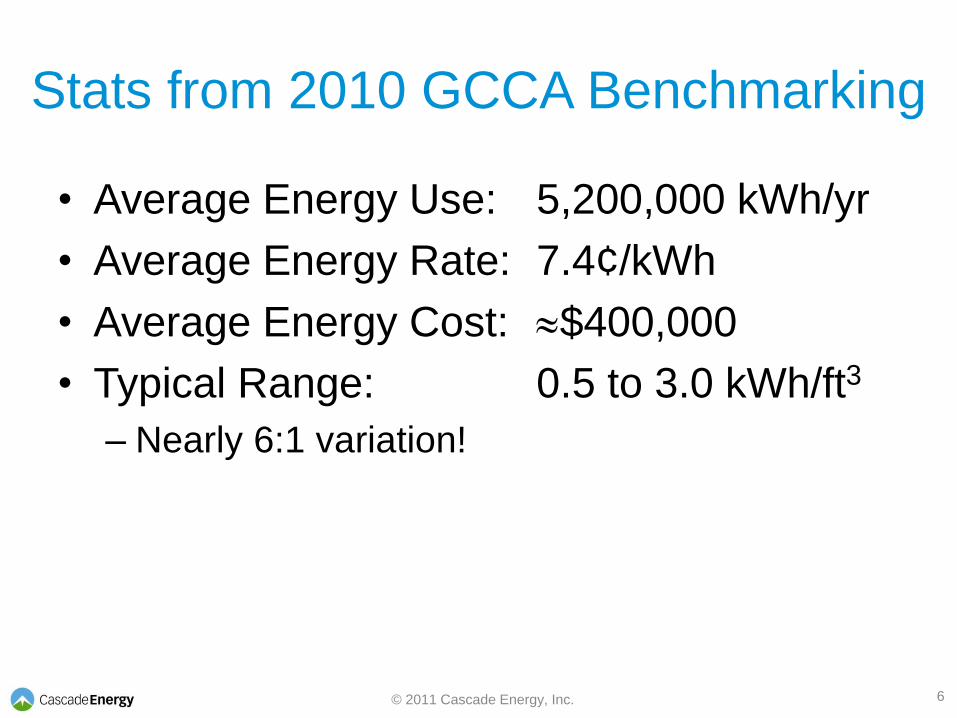
• Average Energy Use: 5,200,000 kWh/yr
• Average Energy Rate: 7.4¢/kWh
• Average Energy Cost: $400,000
• Typical Range: 0.5 to 3.0 kWh/ft3
– Nearly 6:1 variation!
Stats from 2010 GCCA Benchmarking
6 © 2011 Cascade Energy, Inc.
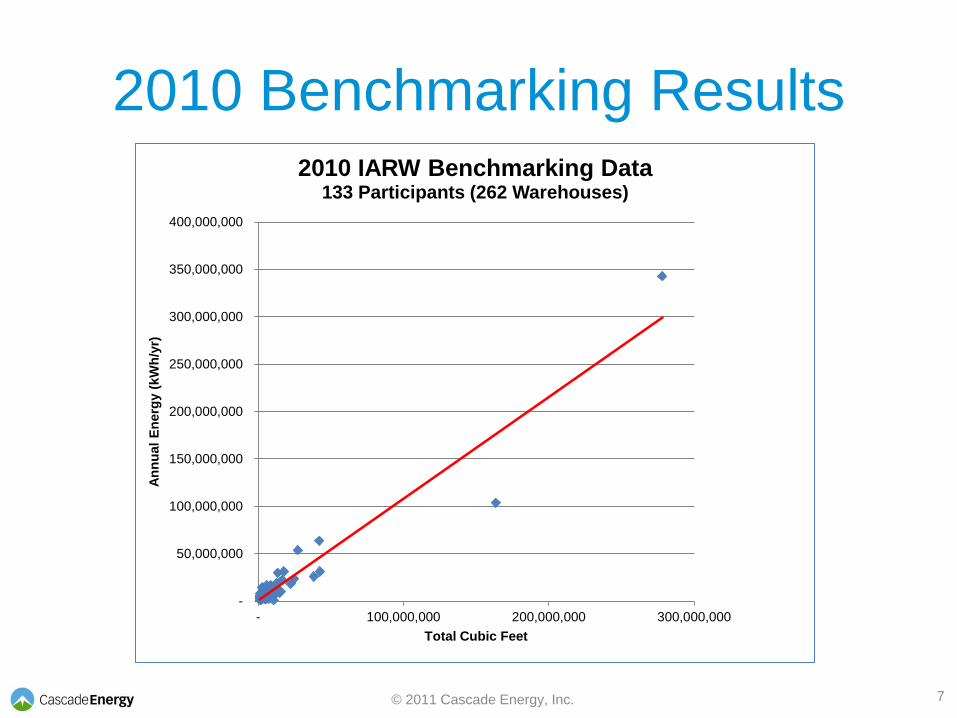
2010 Benchmarking Results
-
50,000,000
100,000,000
150,000,000
200,000,000
250,000,000
300,000,000
350,000,000
400,000,000
- 100,000,000 200,000,000 300,000,000
An
nu
al
En
erg
y (
kW
h/y
r)
Total Cubic Feet
2010 IARW Benchmarking Data 133 Participants (262 Warehouses)
7 © 2011 Cascade Energy, Inc.
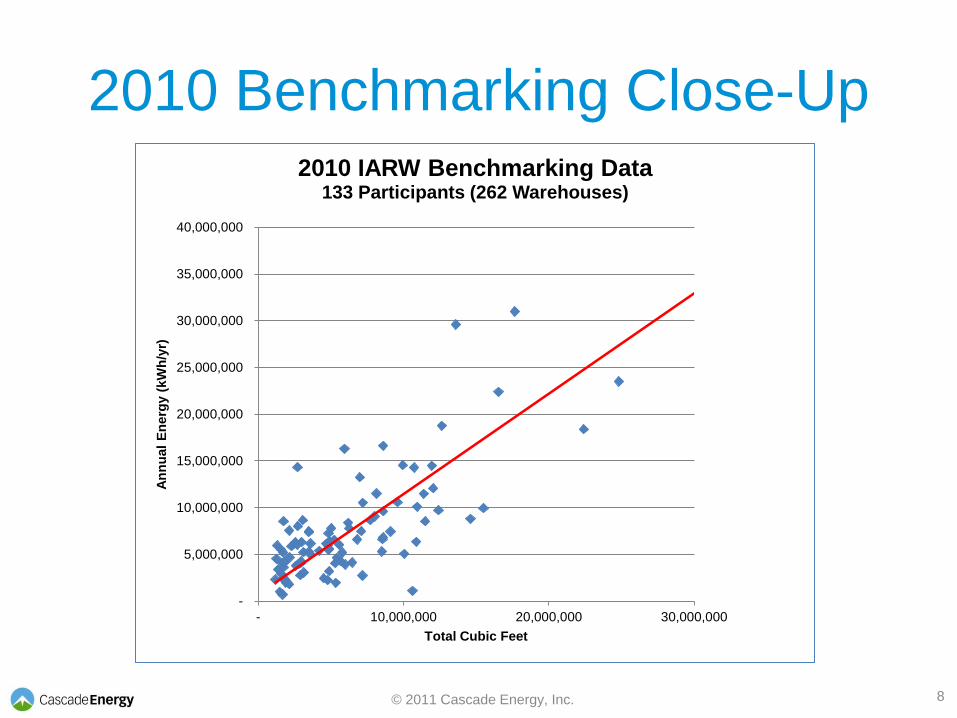
2010 Benchmarking Close-Up
-
5,000,000
10,000,000
15,000,000
20,000,000
25,000,000
30,000,000
35,000,000
40,000,000
- 10,000,000 20,000,000 30,000,000
An
nu
al
En
erg
y (
kW
h/y
r)
Total Cubic Feet
2010 IARW Benchmarking Data 133 Participants (262 Warehouses)
8 © 2011 Cascade Energy, Inc.
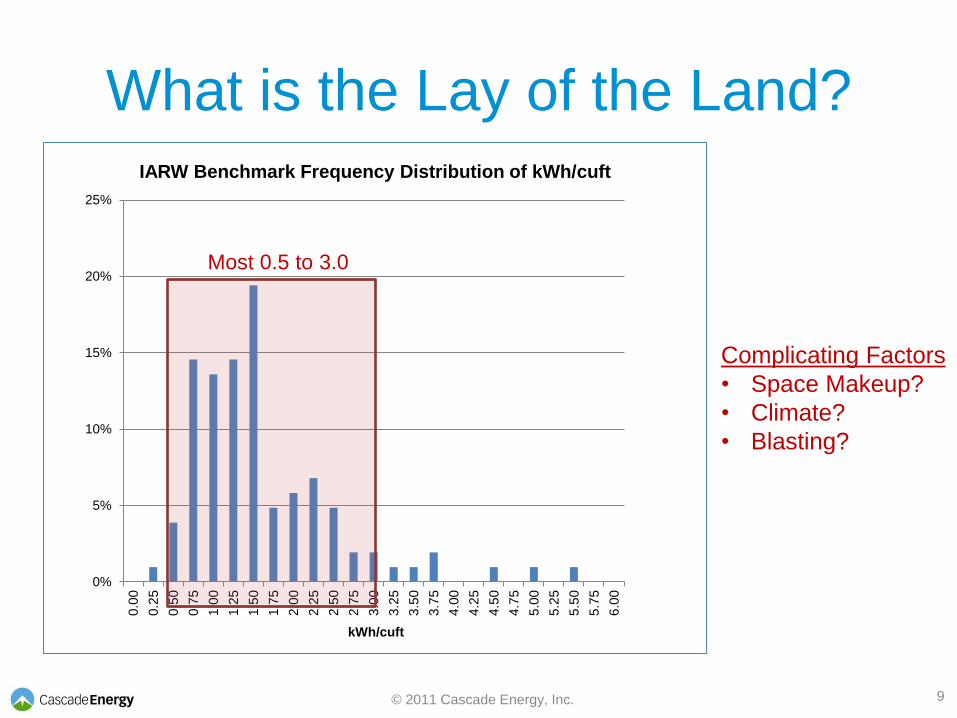
What is the Lay of the Land?
0%
5%
10%
15%
20%
25%
0.0
0
0.2
5
0.5
0
0.7
5
1.0
0
1.2
5
1.5
0
1.7
5
2.0
0
2.2
5
2.5
0
2.7
5
3.0
0
3.2
5
3.5
0
3.7
5
4.0
0
4.2
5
4.5
0
4.7
5
5.0
0
5.2
5
5.5
0
5.7
5
6.0
0
kWh/cuft
IARW Benchmark Frequency Distribution of kWh/cuft
Complicating Factors
• Space Makeup?
• Climate?
• Blasting?
9
Most 0.5 to 3.0
© 2011 Cascade Energy, Inc.
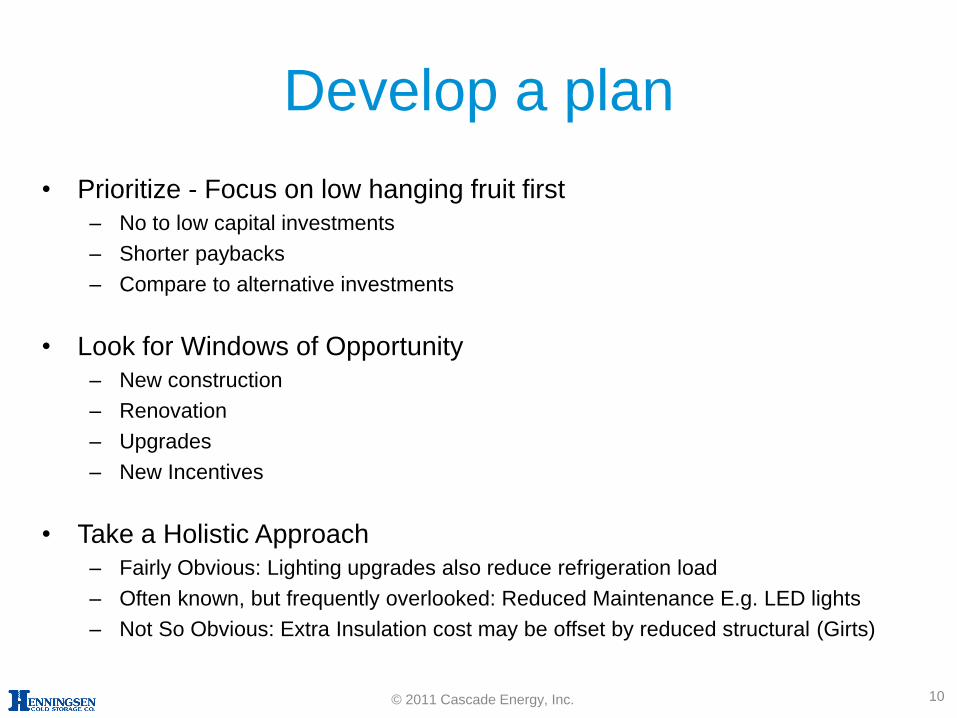
Develop a plan
• Prioritize - Focus on low hanging fruit first
– No to low capital investments
– Shorter paybacks
– Compare to alternative investments
• Look for Windows of Opportunity
– New construction
– Renovation
– Upgrades
– New Incentives
• Take a Holistic Approach
– Fairly Obvious: Lighting upgrades also reduce refrigeration load
– Often known, but frequently overlooked: Reduced Maintenance E.g. LED lights
– Not So Obvious: Extra Insulation cost may be offset by reduced structural (Girts)
10 © 2011 Cascade Energy, Inc.
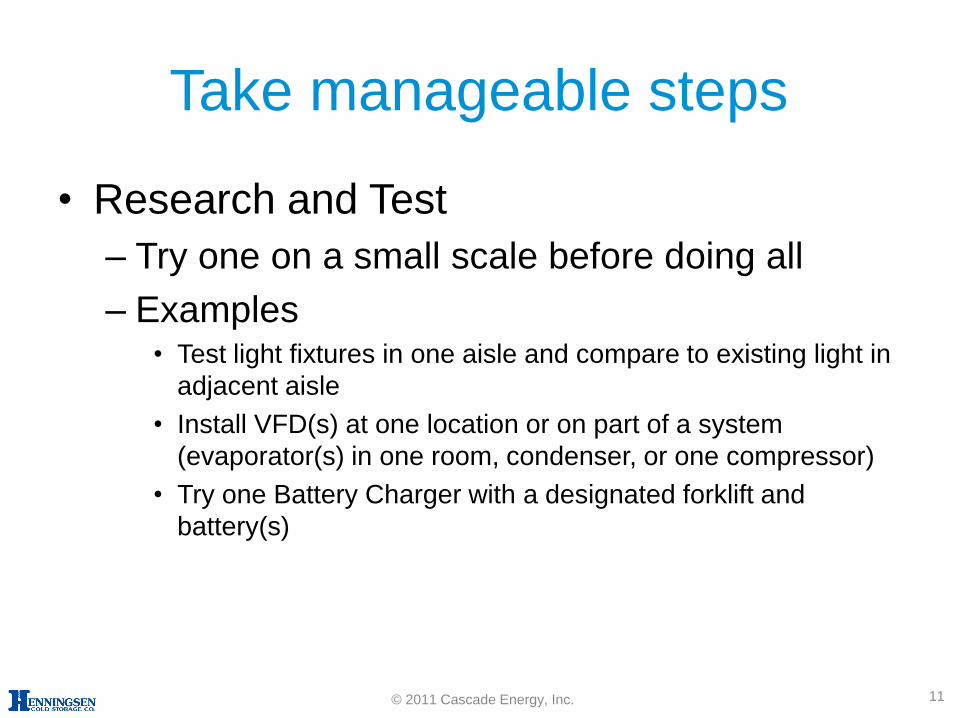
Take manageable steps
• Research and Test
– Try one on a small scale before doing all
– Examples • Test light fixtures in one aisle and compare to existing light in
adjacent aisle
• Install VFD(s) at one location or on part of a system
(evaporator(s) in one room, condenser, or one compressor)
• Try one Battery Charger with a designated forklift and
battery(s)
11 © 2011 Cascade Energy, Inc.
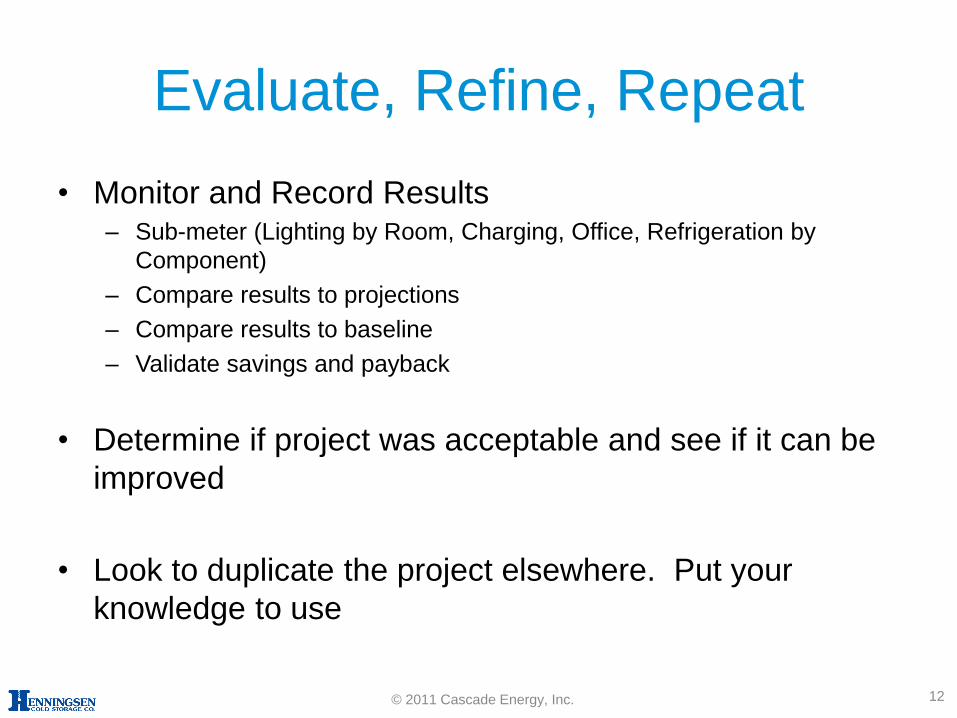
Evaluate, Refine, Repeat
• Monitor and Record Results – Sub-meter (Lighting by Room, Charging, Office, Refrigeration by
Component)
– Compare results to projections
– Compare results to baseline
– Validate savings and payback
• Determine if project was acceptable and see if it can be
improved
• Look to duplicate the project elsewhere. Put your
knowledge to use
12 © 2011 Cascade Energy, Inc.
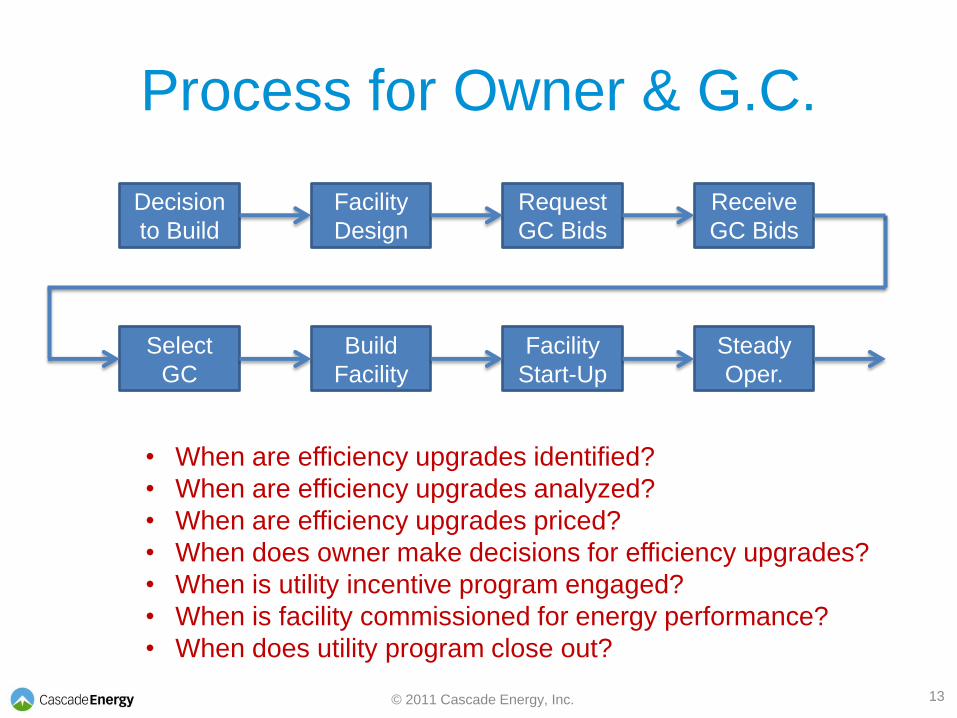
Process for Owner & G.C.
Decision
to Build
Facility
Design
Request
GC Bids
Receive
GC Bids
Select
GC
Build
Facility
Facility
Start-Up
Steady
Oper.
• When are efficiency upgrades identified?
• When are efficiency upgrades analyzed?
• When are efficiency upgrades priced?
• When does owner make decisions for efficiency upgrades?
• When is utility incentive program engaged?
• When is facility commissioned for energy performance?
• When does utility program close out?
13 © 2011 Cascade Energy, Inc.
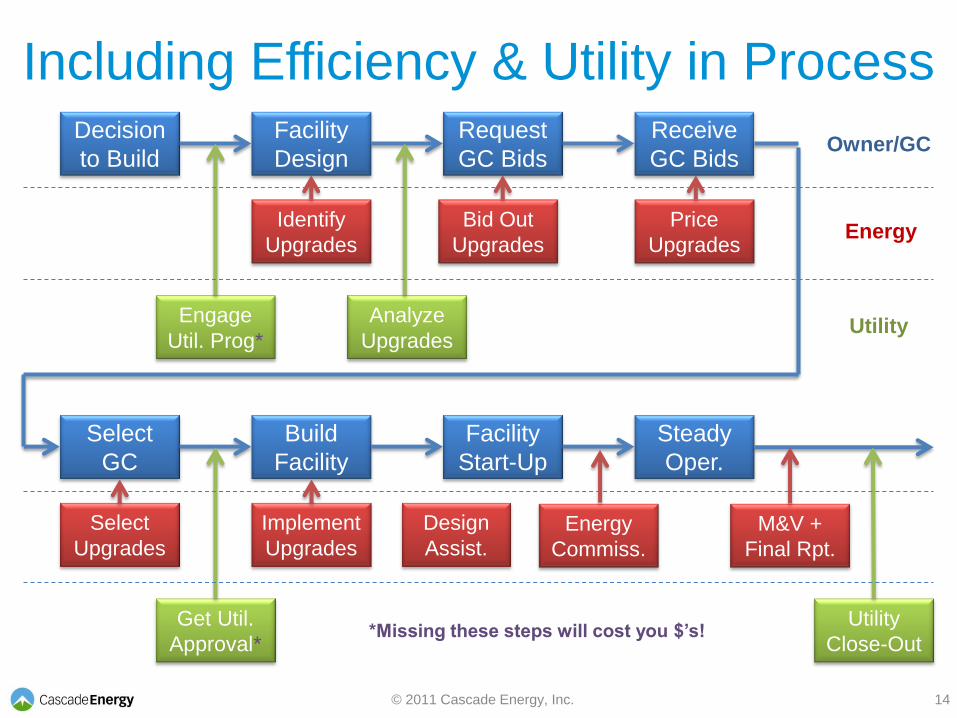
Including Efficiency & Utility in Process Decision
to Build
Facility
Design
Request
GC Bids
Receive
GC Bids
Select
GC
Build
Facility
Facility
Start-Up
Steady
Oper.
Identify
Upgrades
Analyze
Upgrades
Bid Out
Upgrades
Price
Upgrades
Engage
Util. Prog*
Select
Upgrades
Get Util.
Approval*
Implement
Upgrades Energy
Commiss.
M&V +
Final Rpt.
Utility
Close-Out *Missing these steps will cost you $’s!
Design
Assist.
14
Owner/GC
Energy
Utility
© 2011 Cascade Energy, Inc.
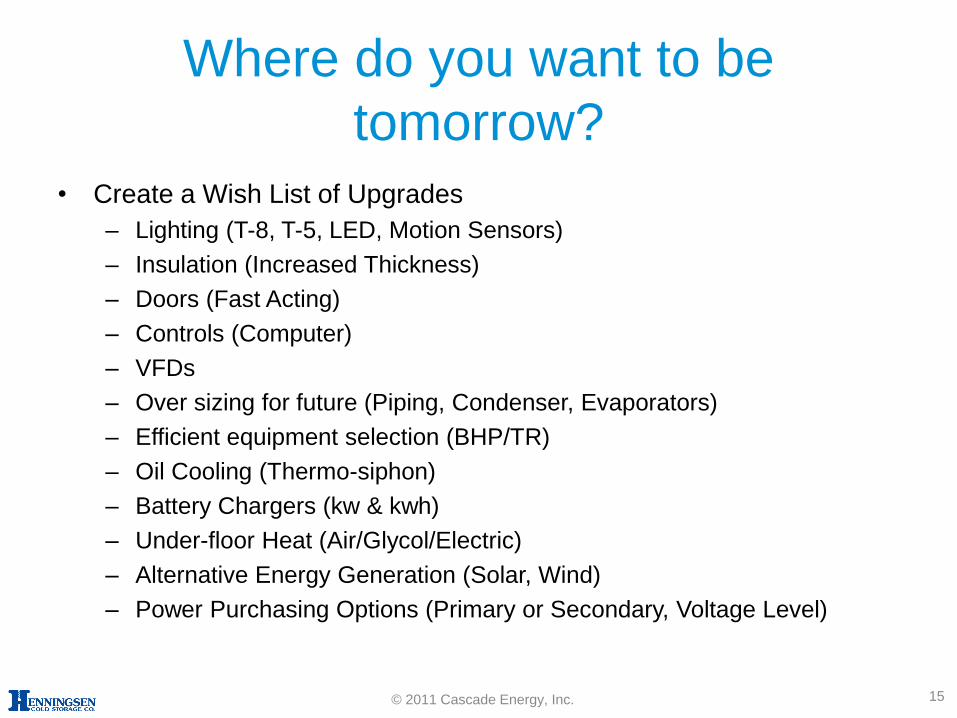
Where do you want to be
tomorrow?
• Create a Wish List of Upgrades
– Lighting (T-8, T-5, LED, Motion Sensors)
– Insulation (Increased Thickness)
– Doors (Fast Acting)
– Controls (Computer)
– VFDs
– Over sizing for future (Piping, Condenser, Evaporators)
– Efficient equipment selection (BHP/TR)
– Oil Cooling (Thermo-siphon)
– Battery Chargers (kw & kwh)
– Under-floor Heat (Air/Glycol/Electric)
– Alternative Energy Generation (Solar, Wind)
– Power Purchasing Options (Primary or Secondary, Voltage Level)
15 © 2011 Cascade Energy, Inc.
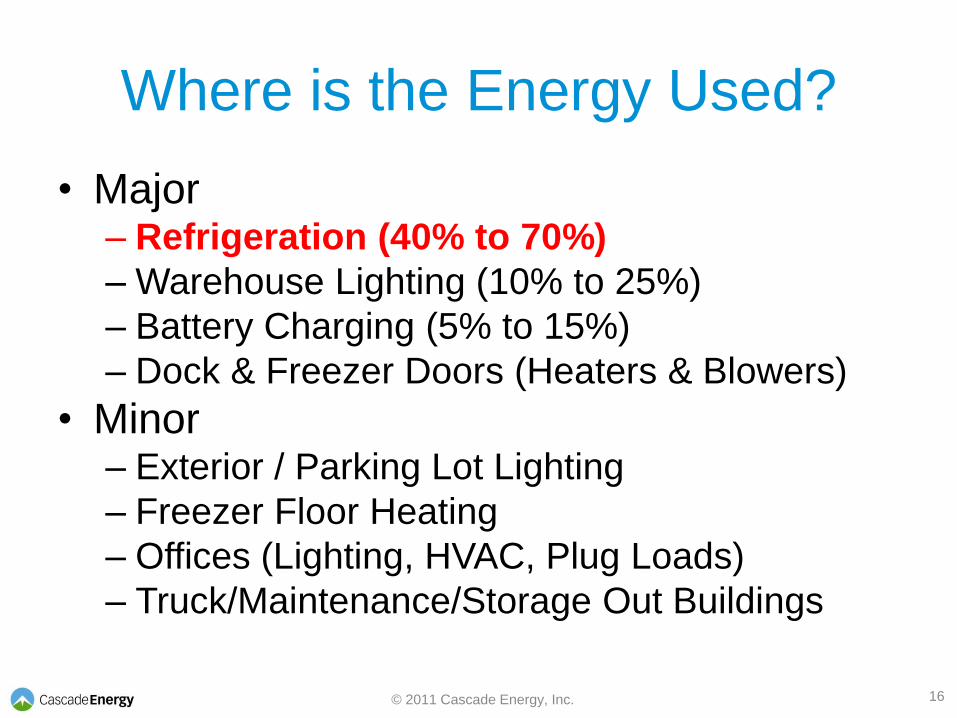
Where is the Energy Used?
• Major – Refrigeration (40% to 70%)
– Warehouse Lighting (10% to 25%)
– Battery Charging (5% to 15%)
– Dock & Freezer Doors (Heaters & Blowers)
• Minor – Exterior / Parking Lot Lighting
– Freezer Floor Heating
– Offices (Lighting, HVAC, Plug Loads)
– Truck/Maintenance/Storage Out Buildings
16 © 2011 Cascade Energy, Inc.
Refrigeration Efficiency
Opportunities
1. Reducing System “Lift”
2. Improving Part-Load Performance
3. Upgrading Equipment
4. Improving System Design
5. Reducing Refrigeration Loads
17 © 2011 Cascade Energy, Inc.
1. Reducing System “Lift”
• Raise Suction Pressure (Temperature)
– Rule of Thumb: 2% per degree
– May be limited by process, equipment or system
• Mismatch of suctions to load
• Evaporator coil selection
• Suction line pressure drop
• Reduce Discharge Pressure (Temperature)
– Rule of Thumb: 1½% per degree
– May be limited by process, equipment or system
• Defrost system design
• Freezer floor heat
• Condenser selection
• Compressor limitations
18 © 2011 Cascade Energy, Inc.
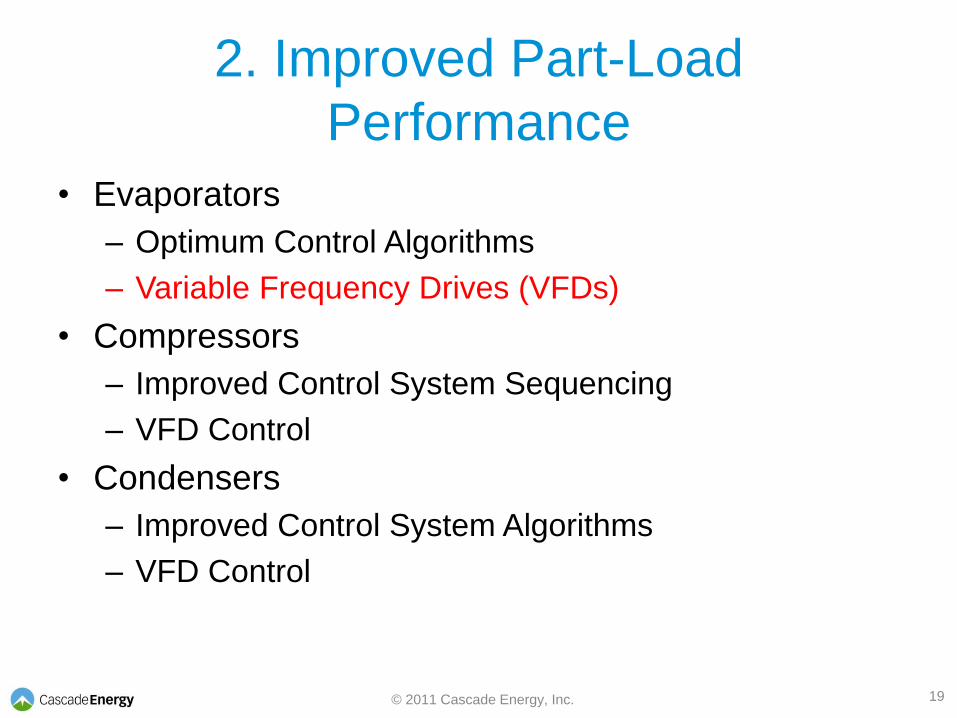
2. Improved Part-Load
Performance
• Evaporators
– Optimum Control Algorithms
– Variable Frequency Drives (VFDs)
• Compressors
– Improved Control System Sequencing
– VFD Control
• Condensers
– Improved Control System Algorithms
– VFD Control
19 © 2011 Cascade Energy, Inc.
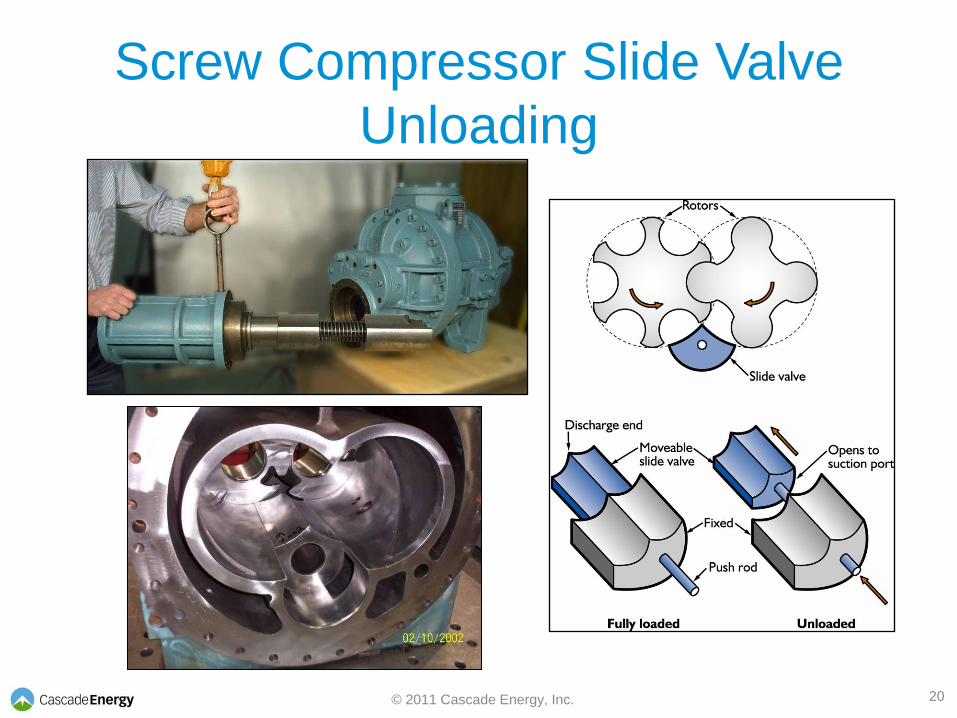
Screw Compressor Slide Valve
Unloading
20 © 2011 Cascade Energy, Inc.
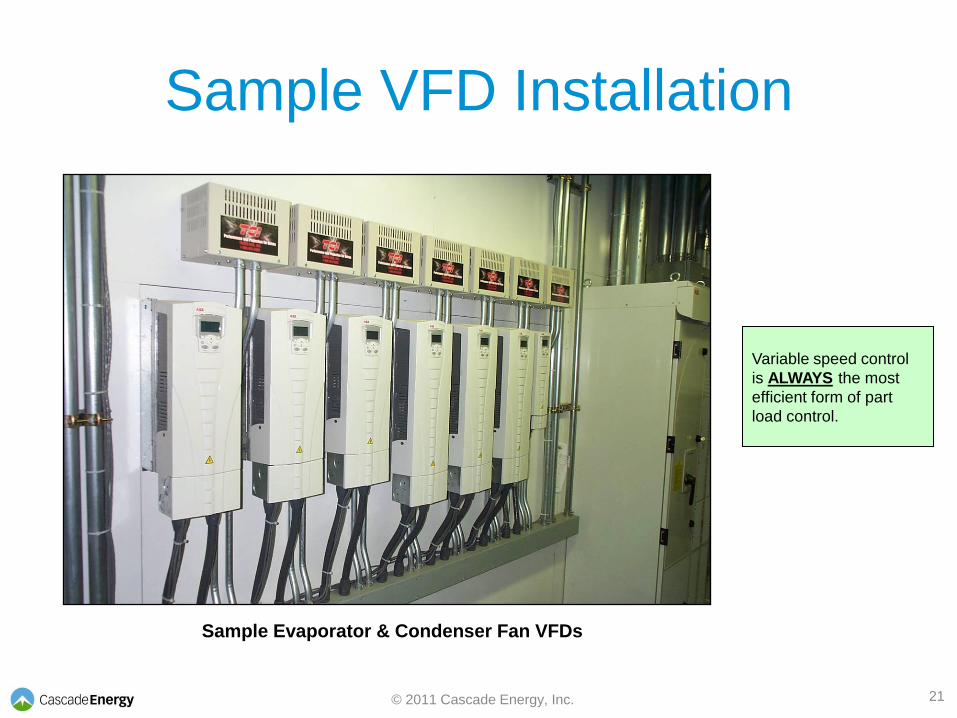
Sample VFD Installation
Variable speed control
is ALWAYS the most
efficient form of part
load control.
Sample Evaporator & Condenser Fan VFDs
21 © 2011 Cascade Energy, Inc.
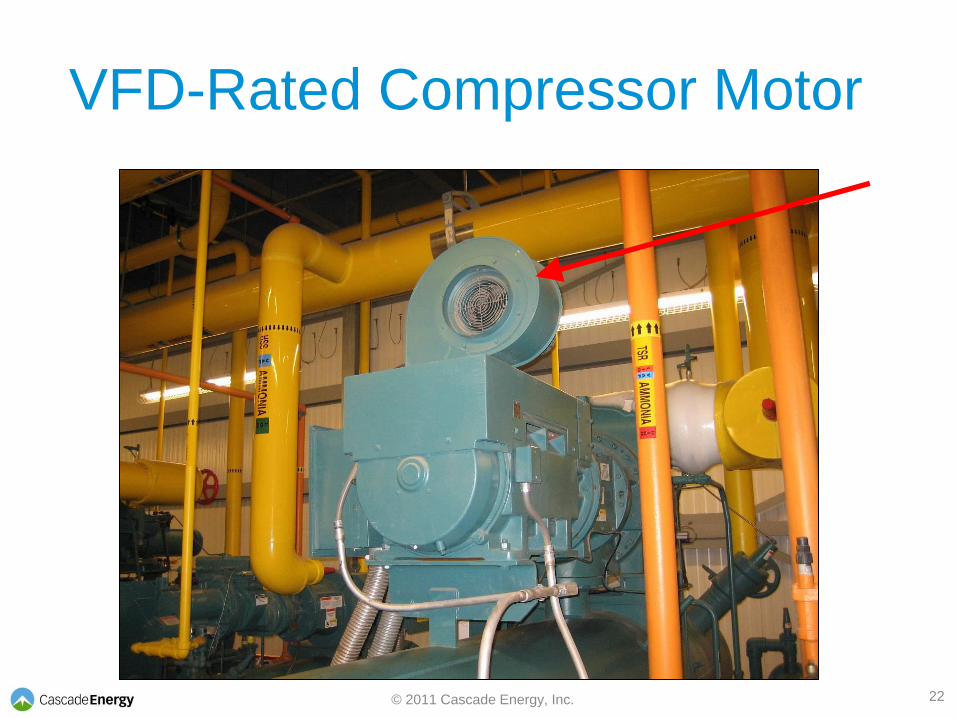
VFD-Rated Compressor Motor
22 © 2011 Cascade Energy, Inc.
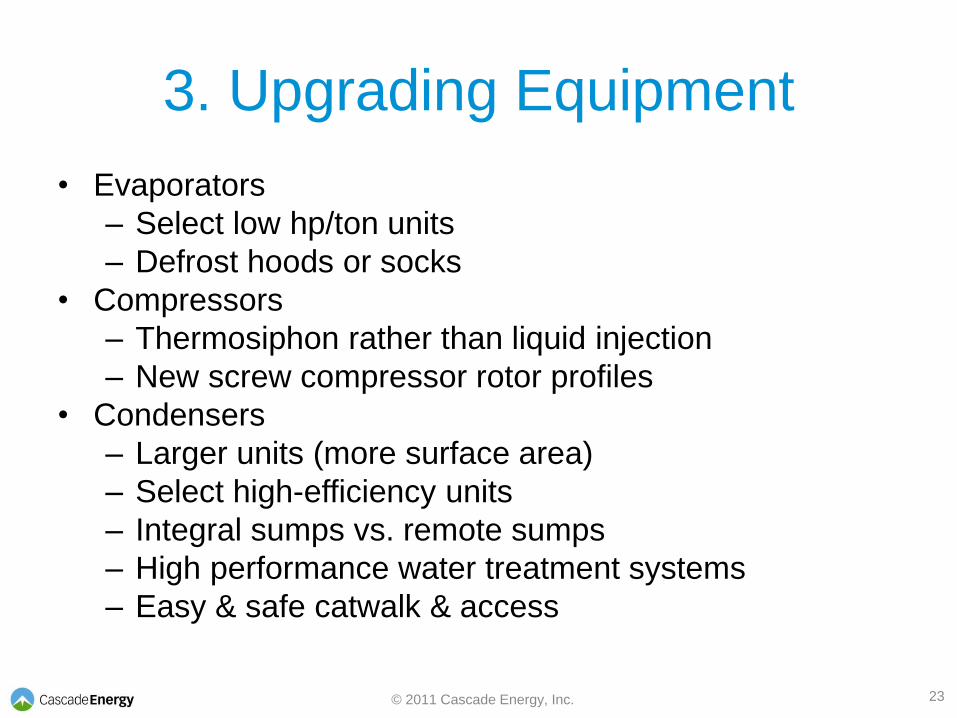
3. Upgrading Equipment
• Evaporators
– Select low hp/ton units
– Defrost hoods or socks
• Compressors
– Thermosiphon rather than liquid injection
– New screw compressor rotor profiles
• Condensers
– Larger units (more surface area)
– Select high-efficiency units
– Integral sumps vs. remote sumps
– High performance water treatment systems
– Easy & safe catwalk & access
23 © 2011 Cascade Energy, Inc.
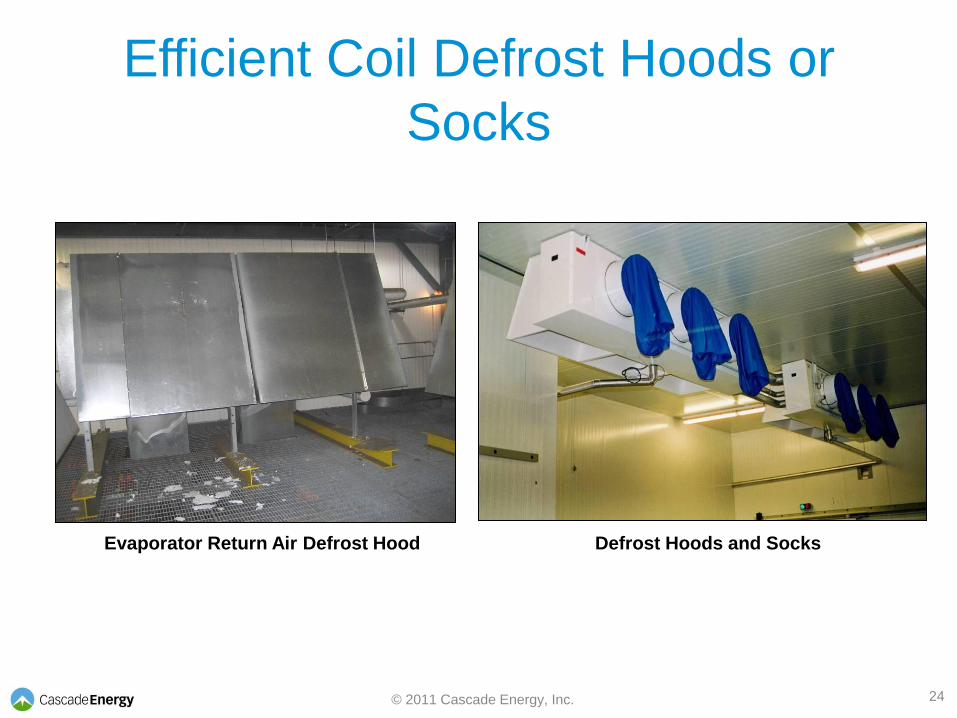
Efficient Coil Defrost Hoods or
Socks
Evaporator Return Air Defrost Hood Defrost Hoods and Socks
24 © 2011 Cascade Energy, Inc.
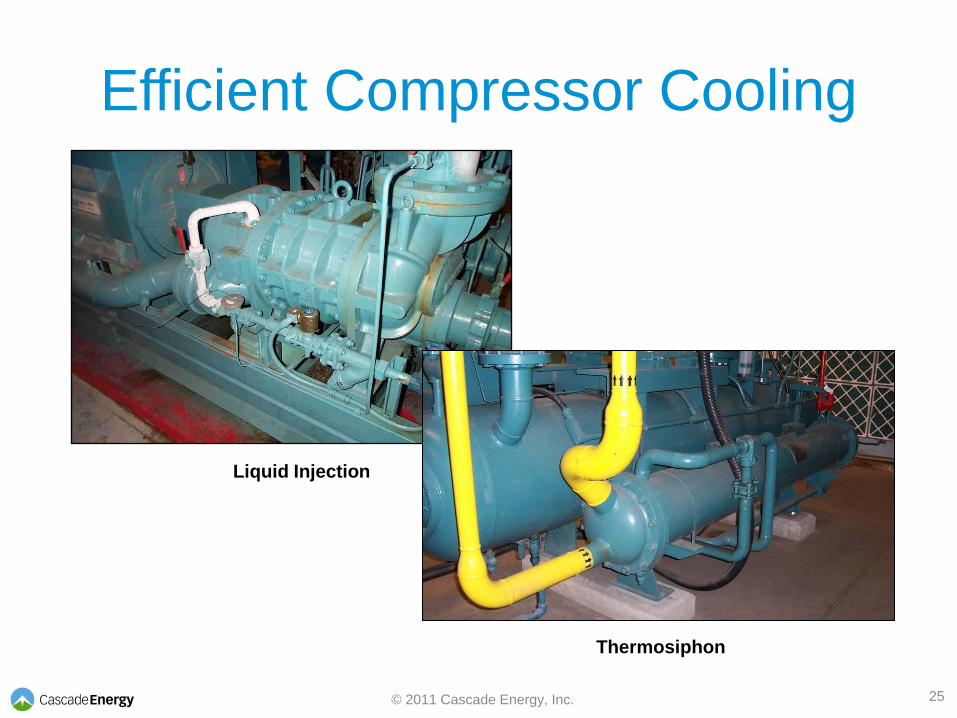
Efficient Compressor Cooling
Liquid Injection
Thermosiphon
25 © 2011 Cascade Energy, Inc.
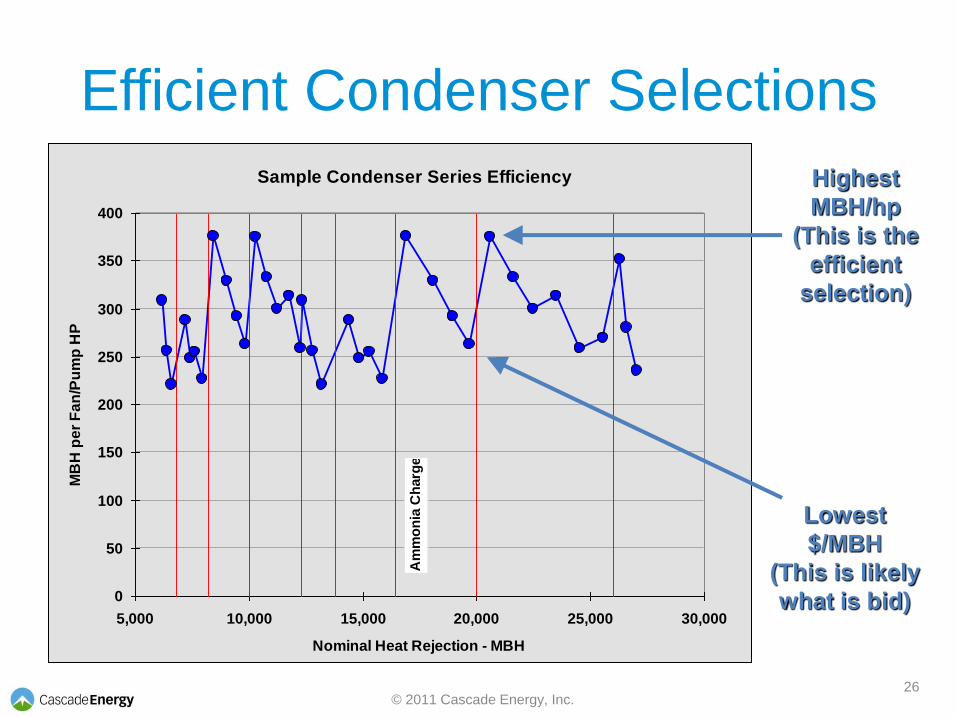
Efficient Condenser Selections
Sample Condenser Series Efficiency
0
50
100
150
200
250
300
350
400
5,000 10,000 15,000 20,000 25,000 30,000
Nominal Heat Rejection - MBH
MB
H p
er
Fa
n/P
um
p H
P
Am
mo
nia
Ch
arg
e
Lowest
$/MBH
(This is likely
what is bid)
Highest
MBH/hp
(This is the
efficient
selection)
26 © 2011 Cascade Energy, Inc.
4. Improved System Design
• Single vs. Two-Stage
• CO2 Cascade
• Piping / Pressure Drop
• Defrost System
• Purgers (Air & Water)
• Proper Pump Selection
27 © 2011 Cascade Energy, Inc.
• Insulation Levels
• Under-Floor Heating
• Warehouse Doors
• Leveler Seals
• Warehouse Lighting
5. Reducing Refrigeration Load
28 © 2011 Cascade Energy, Inc.
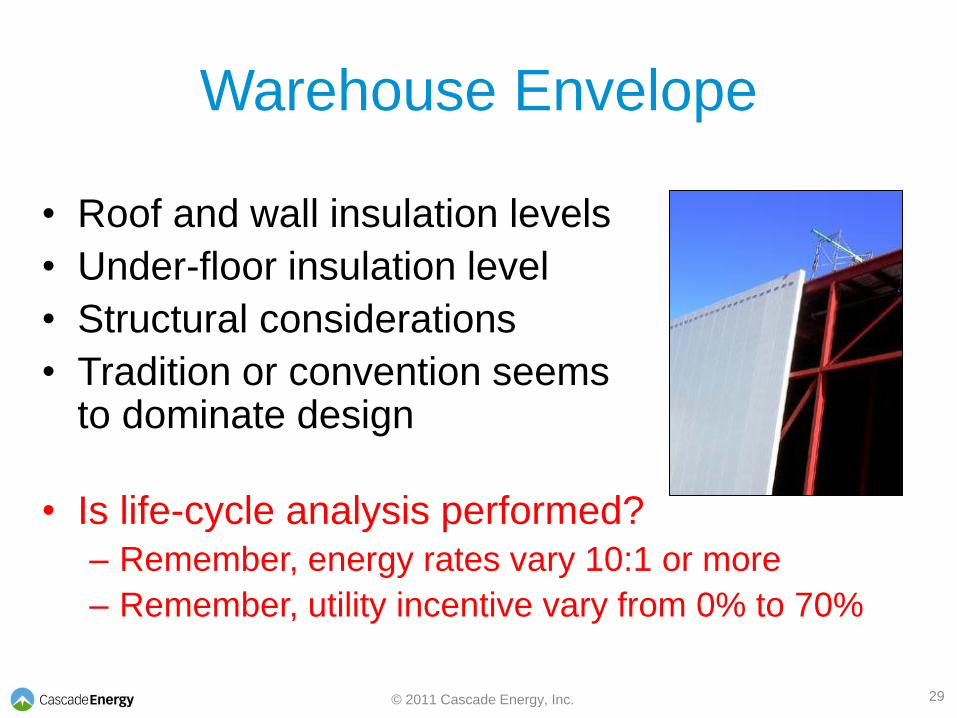
• Roof and wall insulation levels
• Under-floor insulation level
• Structural considerations
• Tradition or convention seems to dominate design
• Is life-cycle analysis performed?
– Remember, energy rates vary 10:1 or more
– Remember, utility incentive vary from 0% to 70%
Warehouse Envelope
29 © 2011 Cascade Energy, Inc.
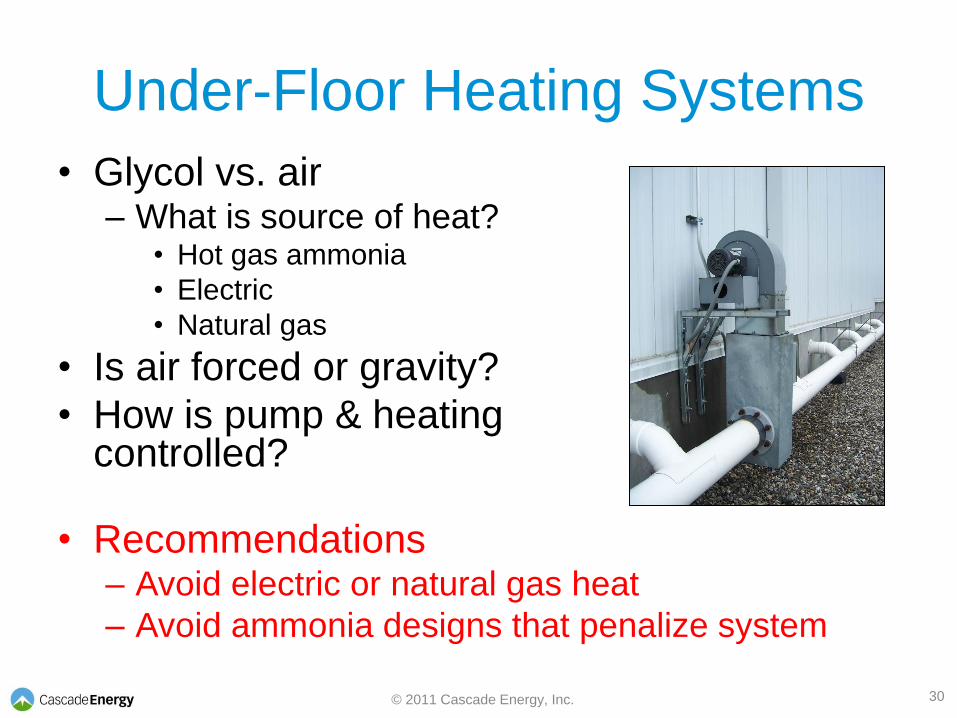
• Glycol vs. air – What is source of heat?
• Hot gas ammonia
• Electric
• Natural gas
• Is air forced or gravity?
• How is pump & heating controlled?
• Recommendations – Avoid electric or natural gas heat
– Avoid ammonia designs that penalize system
Under-Floor Heating Systems
30 © 2011 Cascade Energy, Inc.
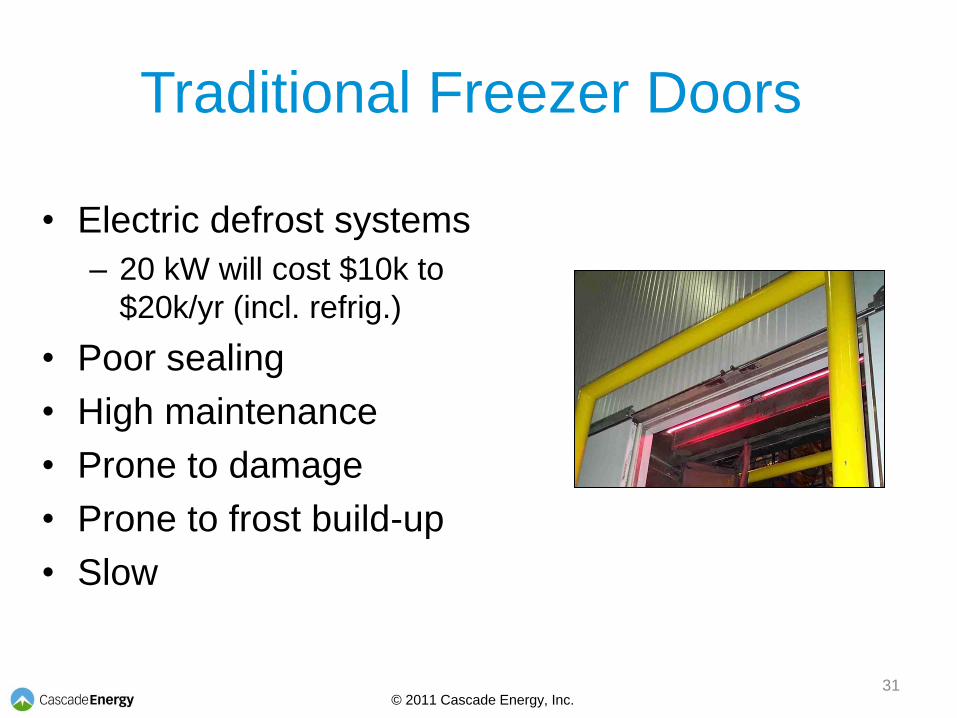
Traditional Freezer Doors
• Electric defrost systems
– 20 kW will cost $10k to
$20k/yr (incl. refrig.)
• Poor sealing
• High maintenance
• Prone to damage
• Prone to frost build-up
• Slow
31 © 2011 Cascade Energy, Inc.
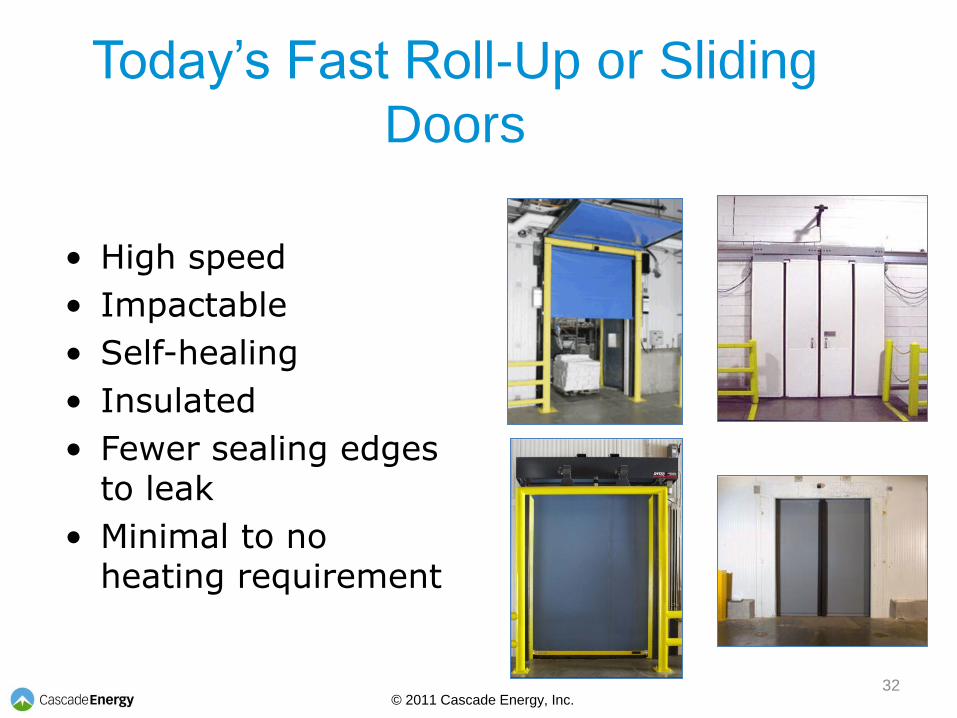
• High speed
• Impactable
• Self-healing
• Insulated
• Fewer sealing edges to leak
• Minimal to no heating requirement
Today’s Fast Roll-Up or Sliding
Doors
32 © 2011 Cascade Energy, Inc.
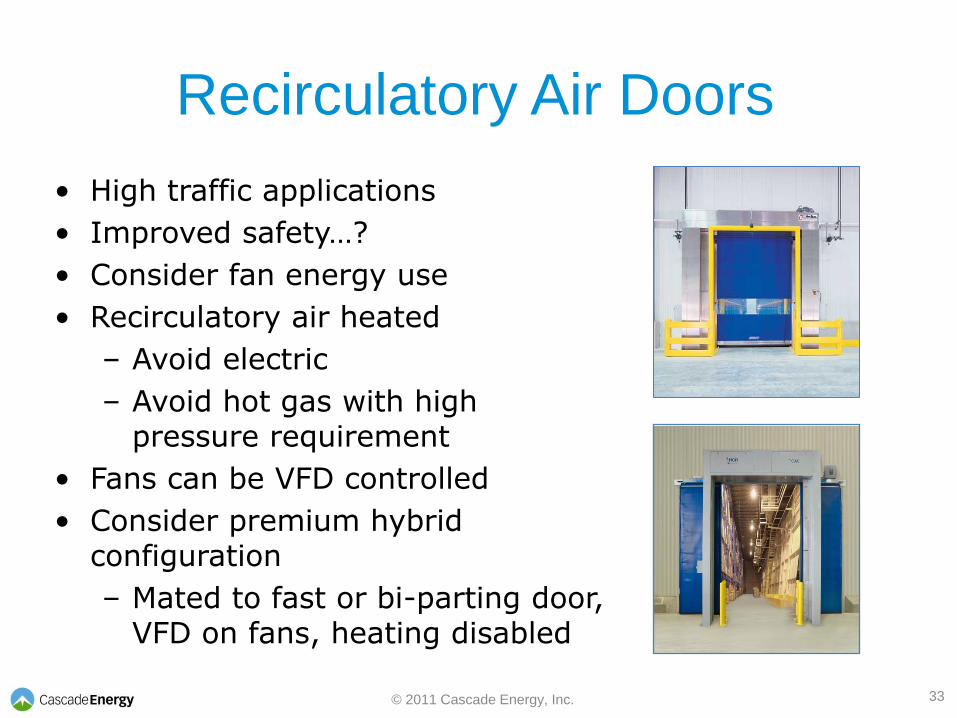
Recirculatory Air Doors
• High traffic applications
• Improved safety…?
• Consider fan energy use
• Recirculatory air heated
– Avoid electric
– Avoid hot gas with high pressure requirement
• Fans can be VFD controlled
• Consider premium hybrid configuration
– Mated to fast or bi-parting door, VFD on fans, heating disabled
33 © 2011 Cascade Energy, Inc.
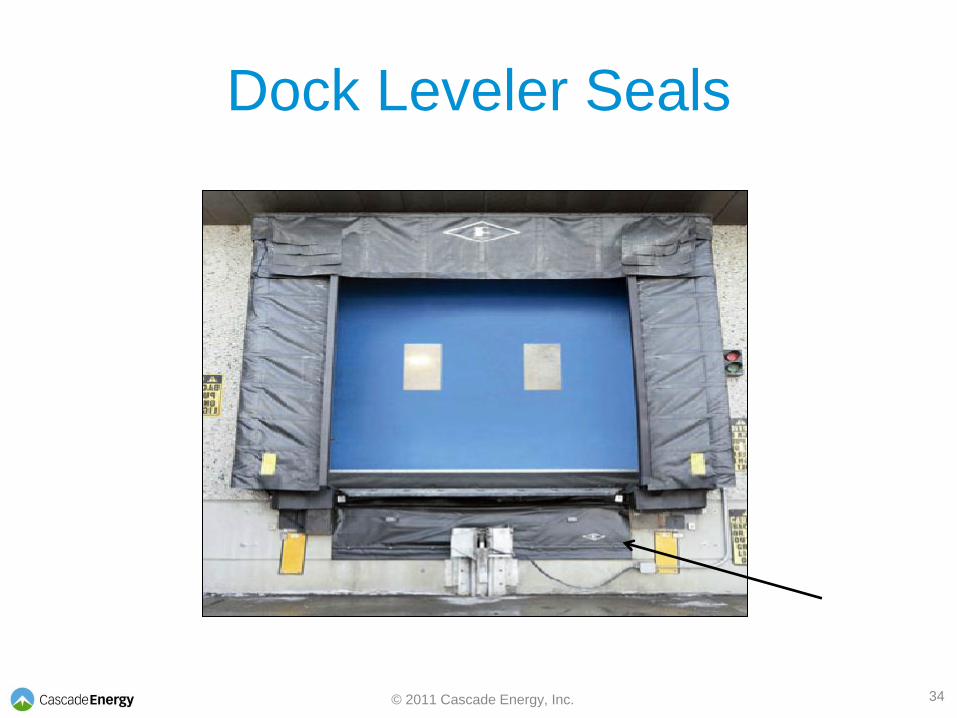
Dock Leveler Seals
34 © 2011 Cascade Energy, Inc.
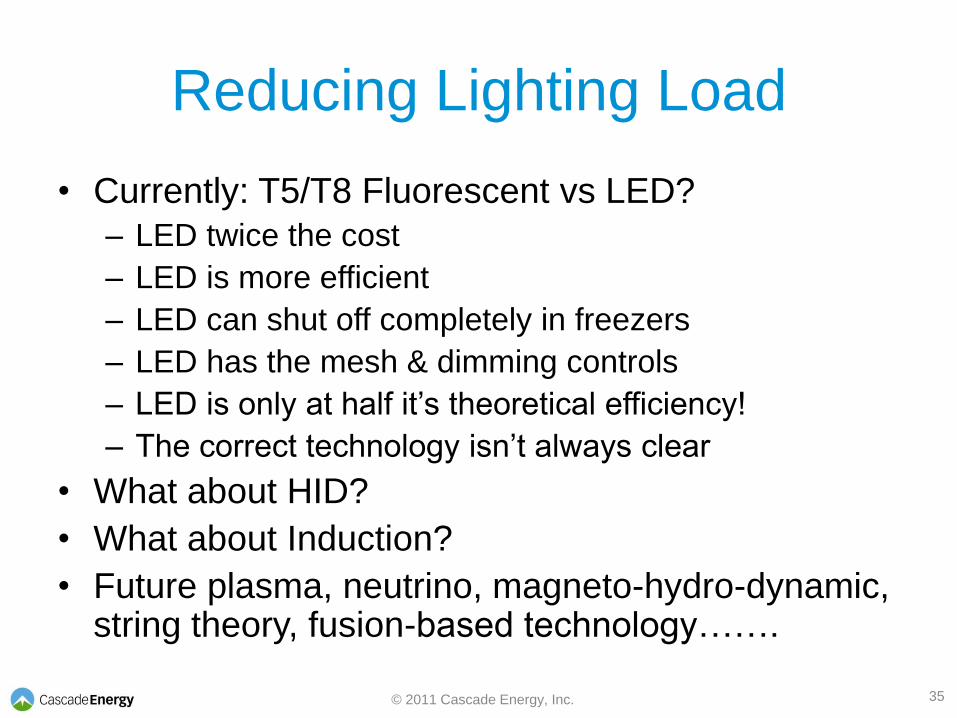
• Currently: T5/T8 Fluorescent vs LED?
– LED twice the cost
– LED is more efficient
– LED can shut off completely in freezers
– LED has the mesh & dimming controls
– LED is only at half it’s theoretical efficiency!
– The correct technology isn’t always clear
• What about HID?
• What about Induction?
• Future plasma, neutrino, magneto-hydro-dynamic, string theory, fusion-based technology…….
Reducing Lighting Load
35 © 2011 Cascade Energy, Inc.
Why Post-Construction Energy
Commissioning? • Functional ≠ Efficient
• The facility & people needs to settle in for a while – say 3
to 6 months
• Energy optimization requires experimentation, patience
& time
• Vendors or contractors may not have energy expertise
• The intent of the energy upgrade may not be known by
startup team
• It may be hard to get installer or setup staff to return after
sign-off
36 © 2011 Cascade Energy, Inc.
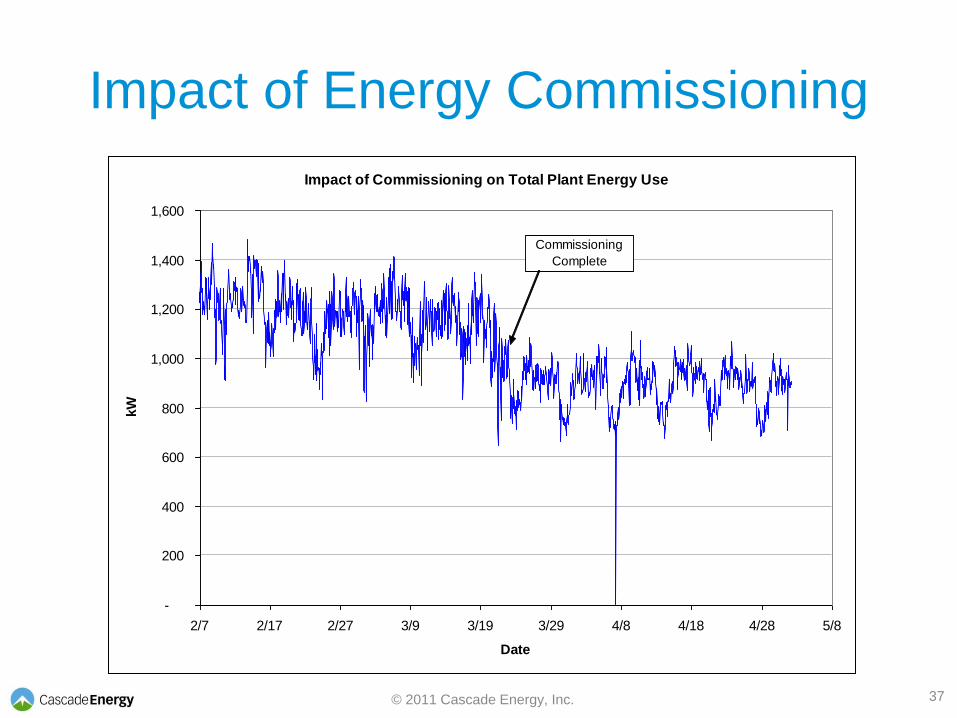
Impact of Energy Commissioning
37
Impact of Commissioning on Total Plant Energy Use
-
200
400
600
800
1,000
1,200
1,400
1,600
2/7 2/17 2/27 3/9 3/19 3/29 4/8 4/18 4/28 5/8
Date
kW
Commissioning
Complete
© 2011 Cascade Energy, Inc.
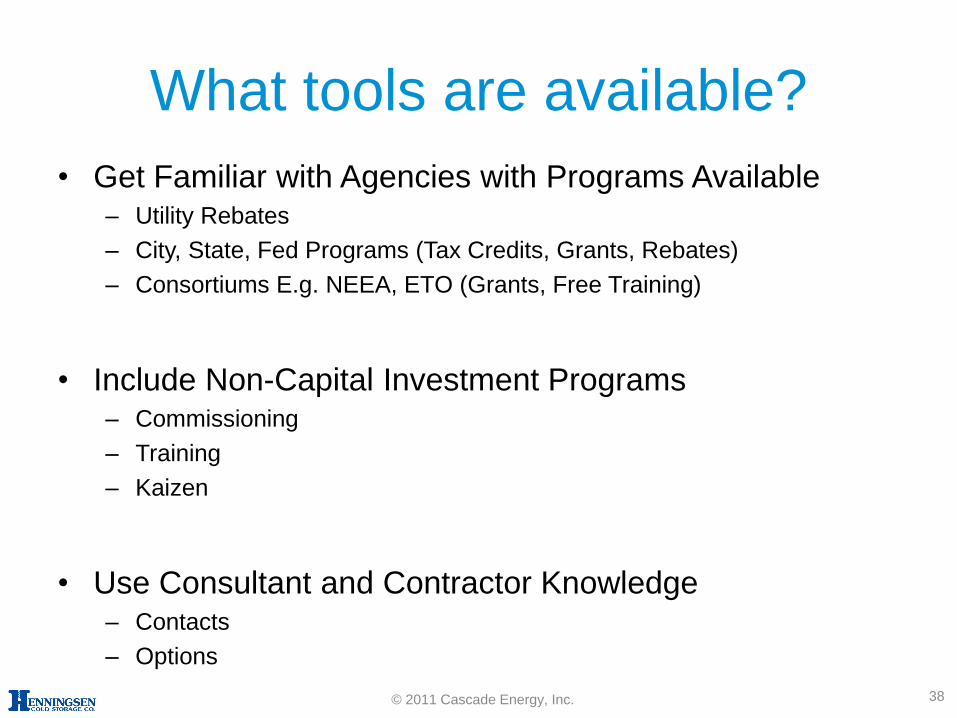
What tools are available?
• Get Familiar with Agencies with Programs Available – Utility Rebates
– City, State, Fed Programs (Tax Credits, Grants, Rebates)
– Consortiums E.g. NEEA, ETO (Grants, Free Training)
• Include Non-Capital Investment Programs – Commissioning
– Training
– Kaizen
• Use Consultant and Contractor Knowledge – Contacts
– Options
38 © 2011 Cascade Energy, Inc.
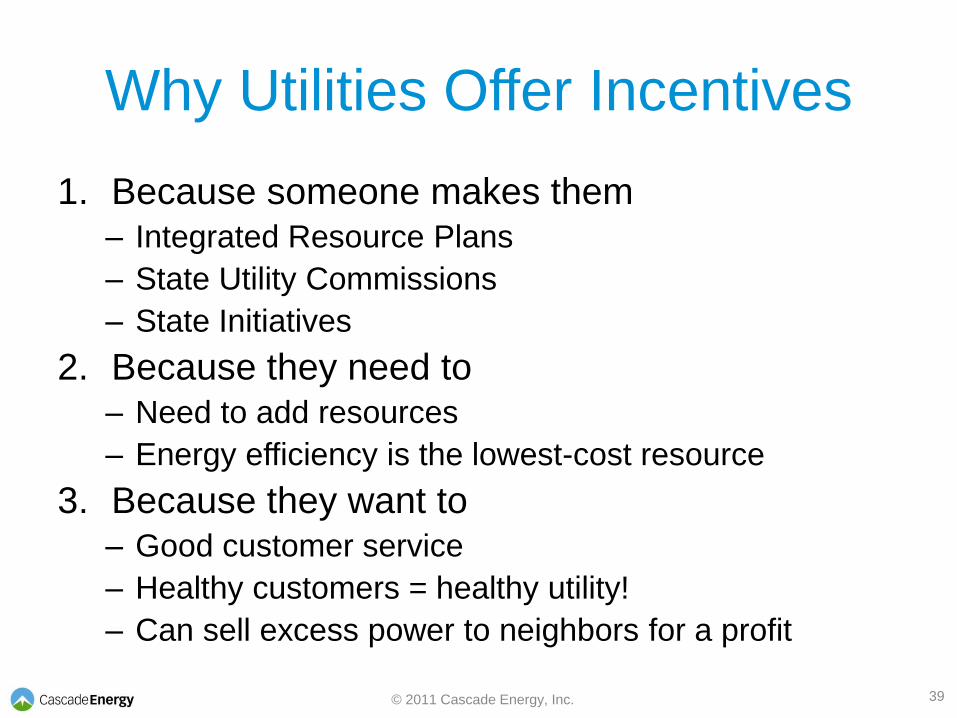
1. Because someone makes them – Integrated Resource Plans
– State Utility Commissions
– State Initiatives
2. Because they need to – Need to add resources
– Energy efficiency is the lowest-cost resource
3. Because they want to – Good customer service
– Healthy customers = healthy utility!
– Can sell excess power to neighbors for a profit
Why Utilities Offer Incentives
39 © 2011 Cascade Energy, Inc.
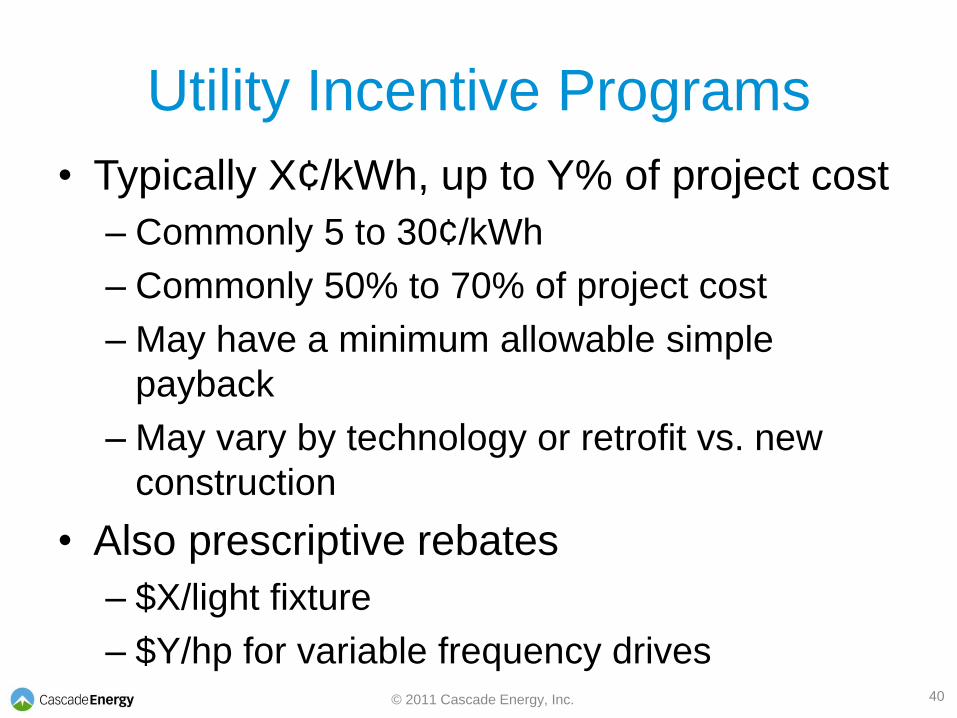
• Typically X¢/kWh, up to Y% of project cost
– Commonly 5 to 30¢/kWh
– Commonly 50% to 70% of project cost
– May have a minimum allowable simple
payback
– May vary by technology or retrofit vs. new
construction
• Also prescriptive rebates
– $X/light fixture
– $Y/hp for variable frequency drives
Utility Incentive Programs
40 © 2011 Cascade Energy, Inc.
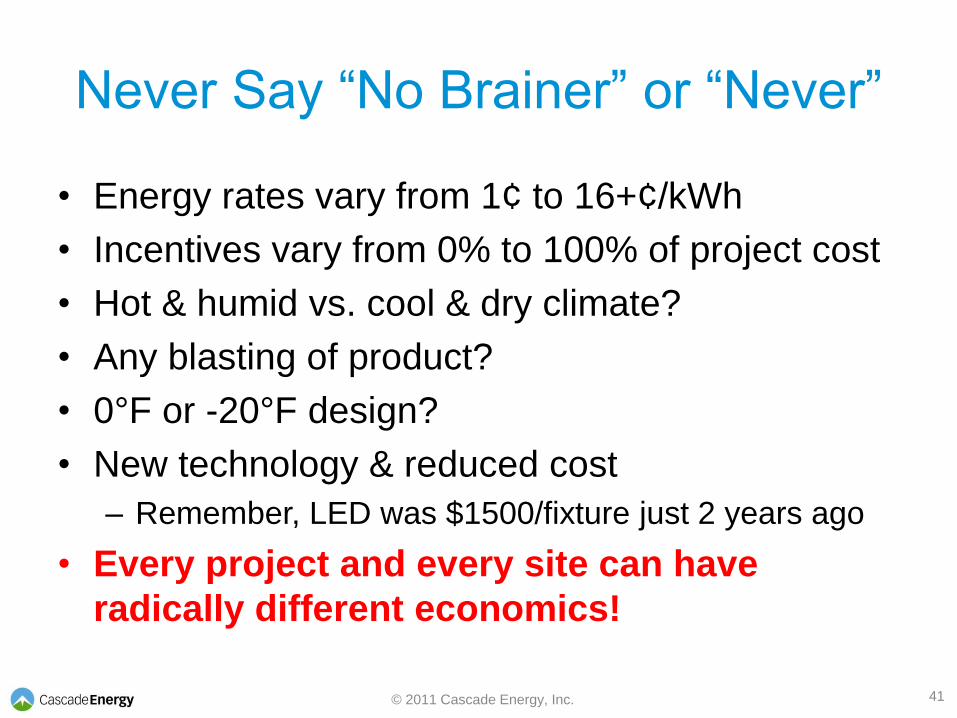
• Energy rates vary from 1¢ to 16+¢/kWh
• Incentives vary from 0% to 100% of project cost
• Hot & humid vs. cool & dry climate?
• Any blasting of product?
• 0°F or -20°F design?
• New technology & reduced cost
– Remember, LED was $1500/fixture just 2 years ago
• Every project and every site can have
radically different economics!
Never Say “No Brainer” or “Never”
41 © 2011 Cascade Energy, Inc.
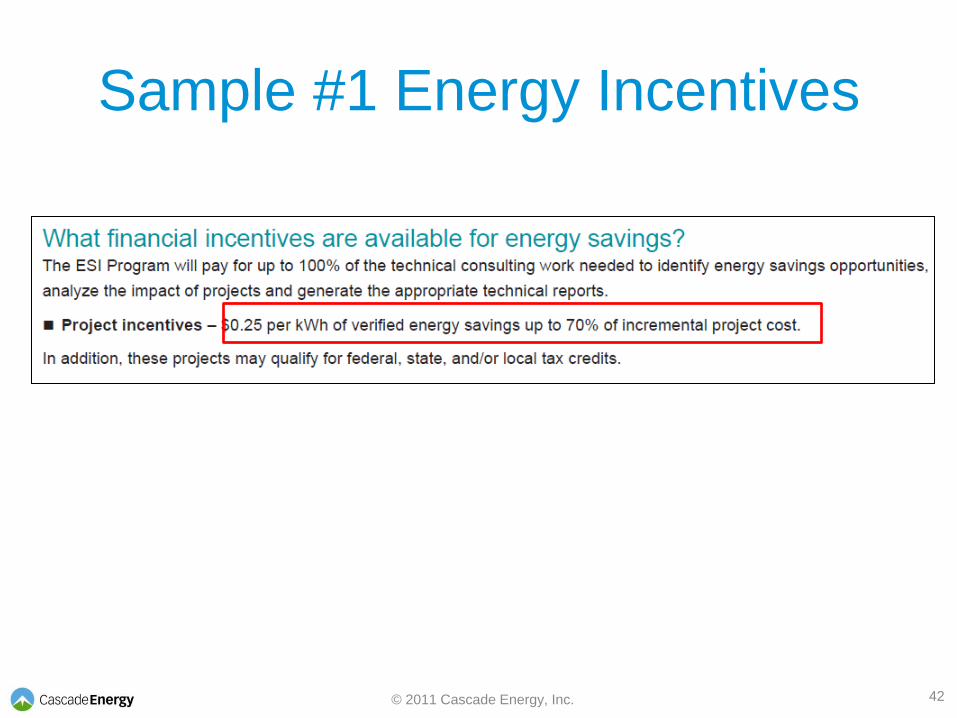
Sample #1 Energy Incentives
42 © 2011 Cascade Energy, Inc.
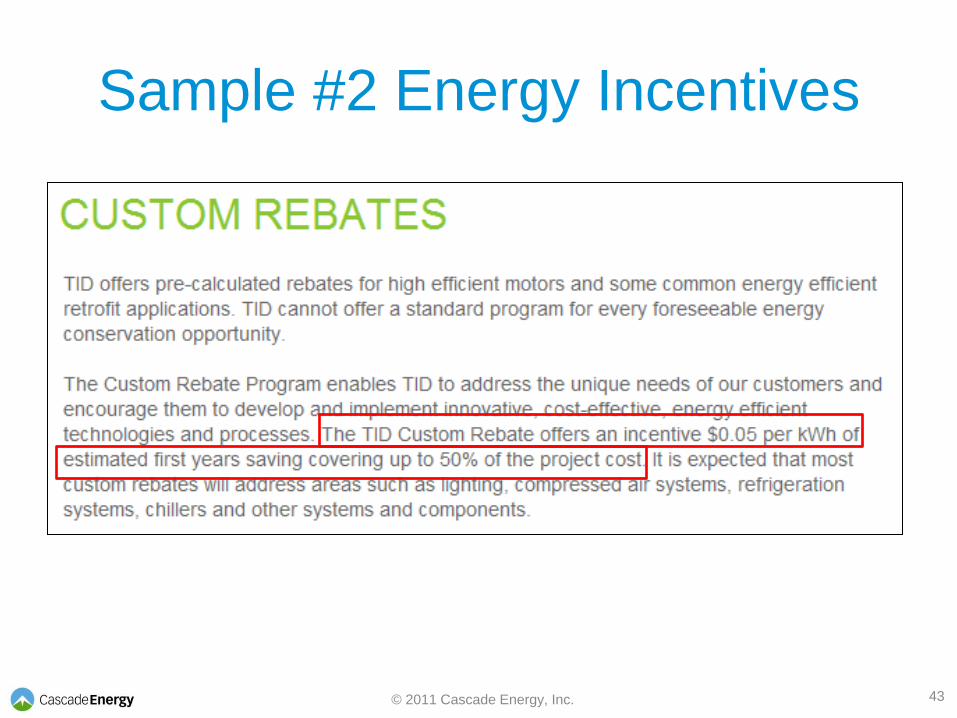
Sample #2 Energy Incentives
43 © 2011 Cascade Energy, Inc.
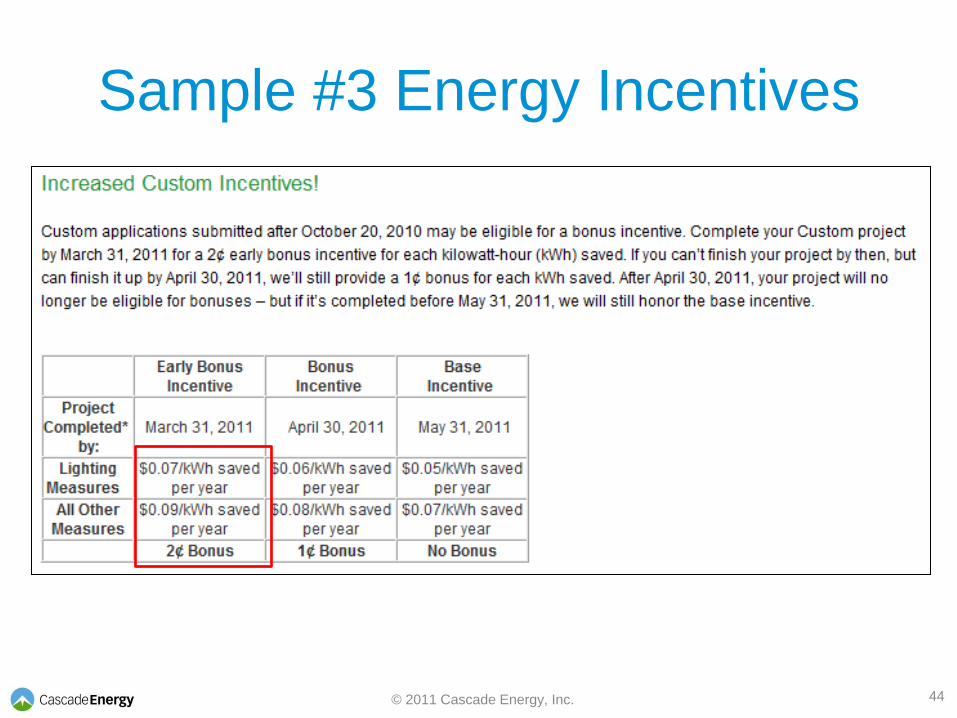
Sample #3 Energy Incentives
44 © 2011 Cascade Energy, Inc.
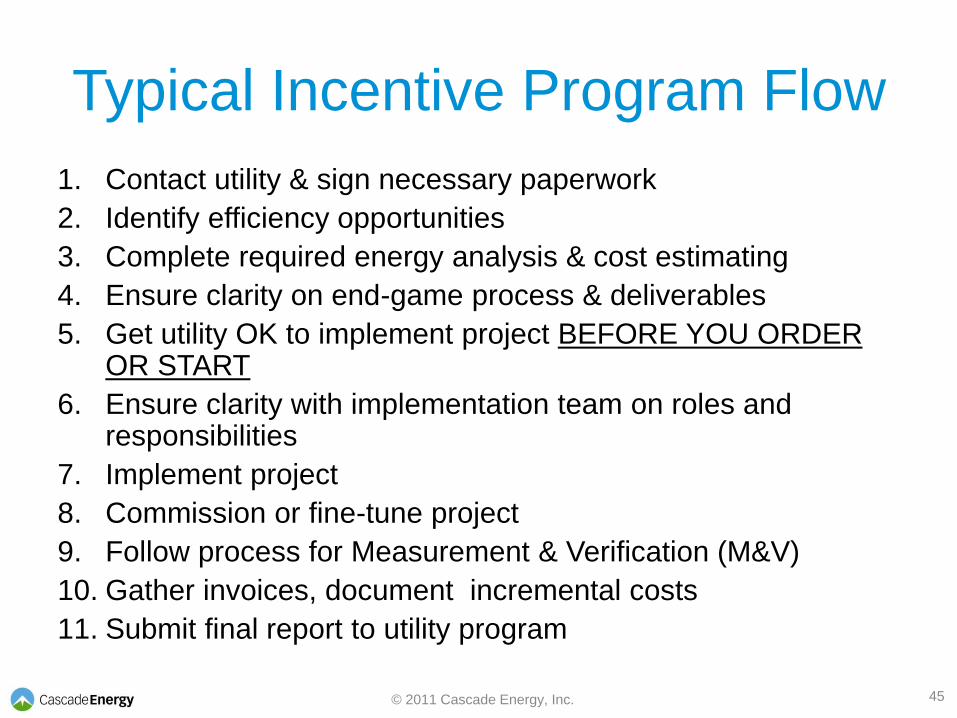
1. Contact utility & sign necessary paperwork
2. Identify efficiency opportunities
3. Complete required energy analysis & cost estimating
4. Ensure clarity on end-game process & deliverables
5. Get utility OK to implement project BEFORE YOU ORDER OR START
6. Ensure clarity with implementation team on roles and responsibilities
7. Implement project
8. Commission or fine-tune project
9. Follow process for Measurement & Verification (M&V)
10. Gather invoices, document incremental costs
11. Submit final report to utility program
Typical Incentive Program Flow
45 © 2011 Cascade Energy, Inc.
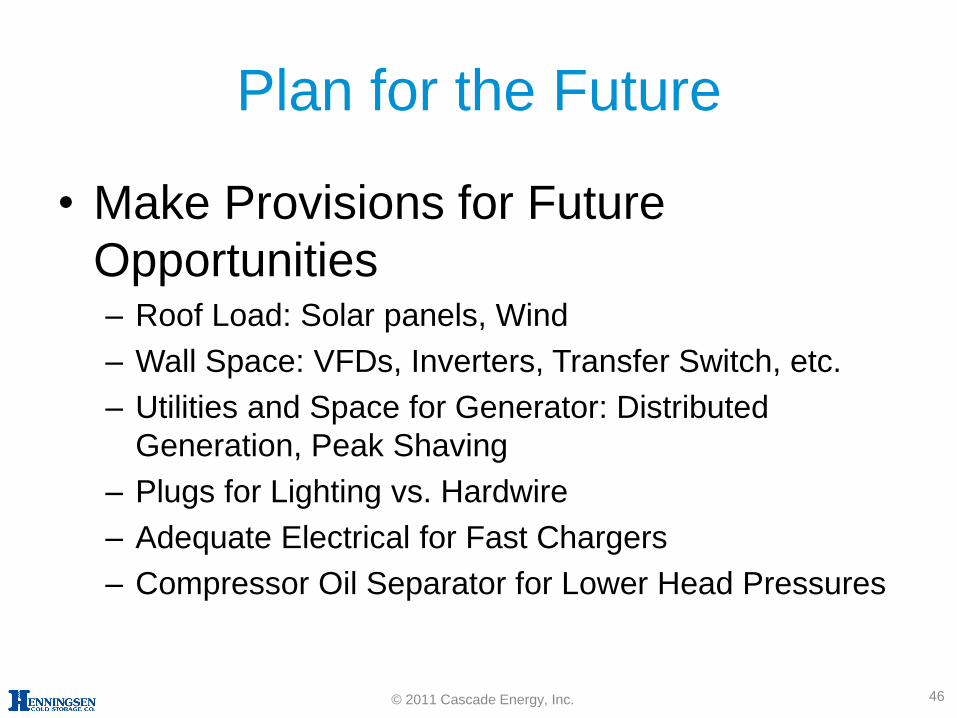
Plan for the Future
• Make Provisions for Future
Opportunities – Roof Load: Solar panels, Wind
– Wall Space: VFDs, Inverters, Transfer Switch, etc.
– Utilities and Space for Generator: Distributed
Generation, Peak Shaving
– Plugs for Lighting vs. Hardwire
– Adequate Electrical for Fast Chargers
– Compressor Oil Separator for Lower Head Pressures
46 © 2011 Cascade Energy, Inc.
Obtain qualified assistance
• Contractor and Consultant Selection – Familiar with the Incentive Program Processes
– Familiar with the Industry (Energy Usage Profile and
Trends)
– Familiar with the Company (Culture)
– Provides value engineering
– Demonstrate alternative costs and energy savings
– Understands the life-cycle cost of alternatives
– Proven track record
47 © 2011 Cascade Energy, Inc.
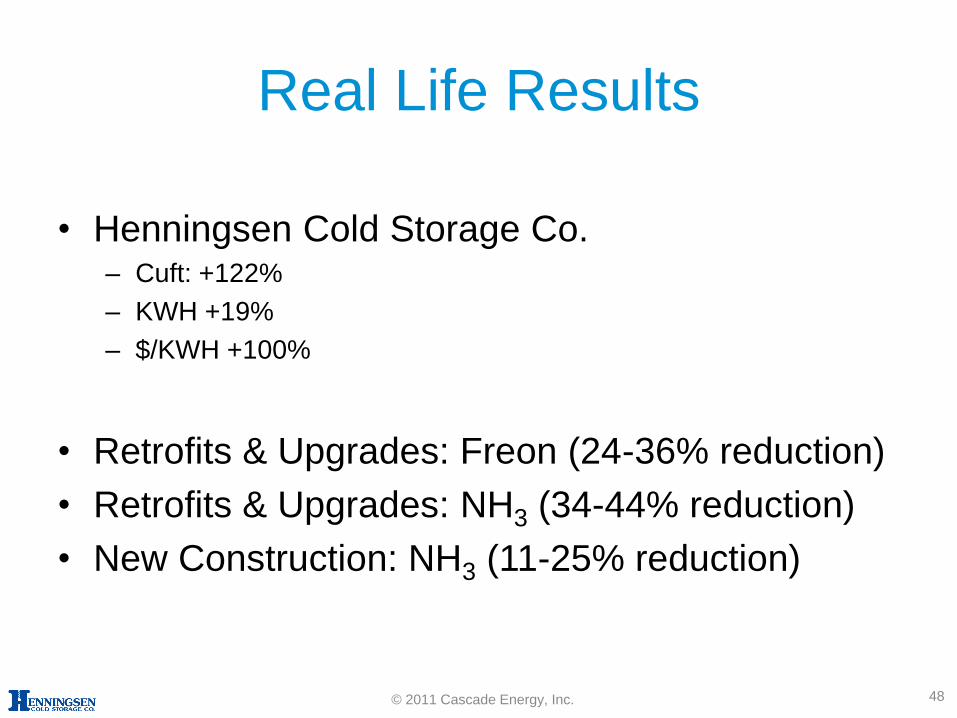
Real Life Results
• Henningsen Cold Storage Co. – Cuft: +122%
– KWH +19%
– $/KWH +100%
• Retrofits & Upgrades: Freon (24-36% reduction)
• Retrofits & Upgrades: NH3 (34-44% reduction)
• New Construction: NH3 (11-25% reduction)
48 © 2011 Cascade Energy, Inc.
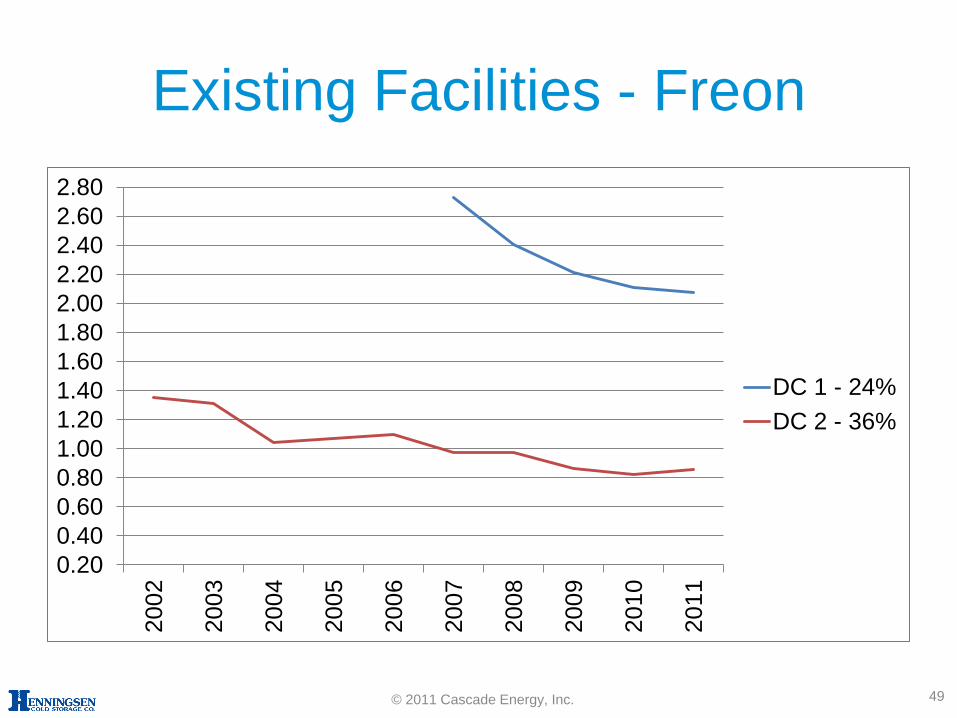
Existing Facilities - Freon
0.20
0.40
0.60
0.80
1.00
1.20
1.40
1.60
1.80
2.00
2.20
2.40
2.60
2.80
2002
2003
20
04
2005
2006
2007
2008
2009
2010
2011
DC 1 - 24%
DC 2 - 36%
49 © 2011 Cascade Energy, Inc.
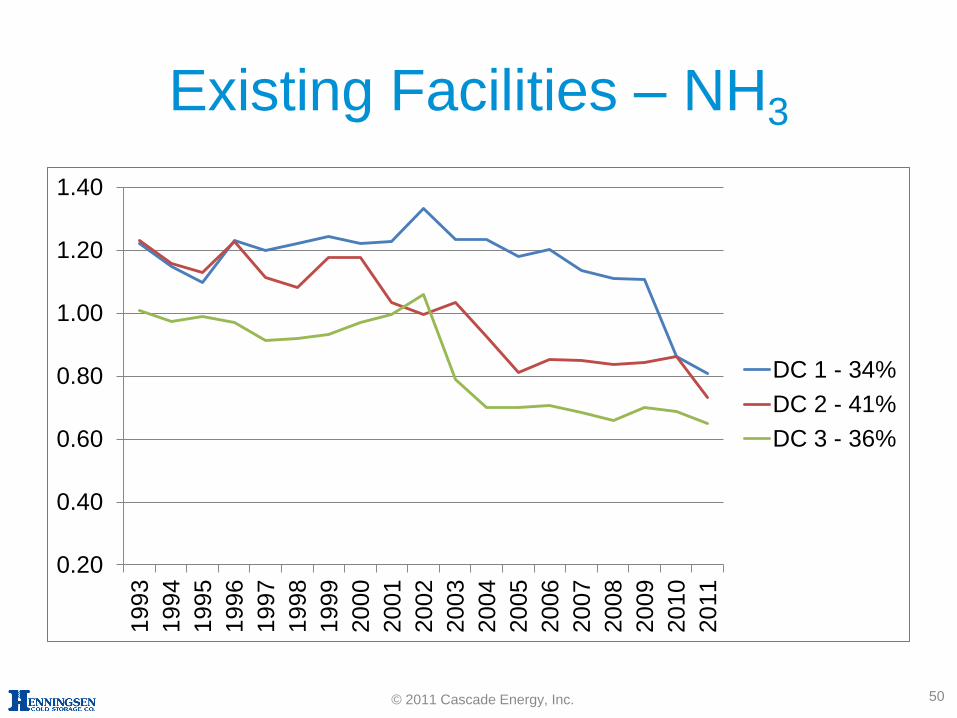
Existing Facilities – NH3
0.20
0.40
0.60
0.80
1.00
1.20
1.40
1993
1994
1995
1996
1997
1998
1999
20
00
2001
2002
2003
2004
2005
2006
2007
2008
2009
2010
20
11
DC 1 - 34%
DC 2 - 41%
DC 3 - 36%
50 © 2011 Cascade Energy, Inc.
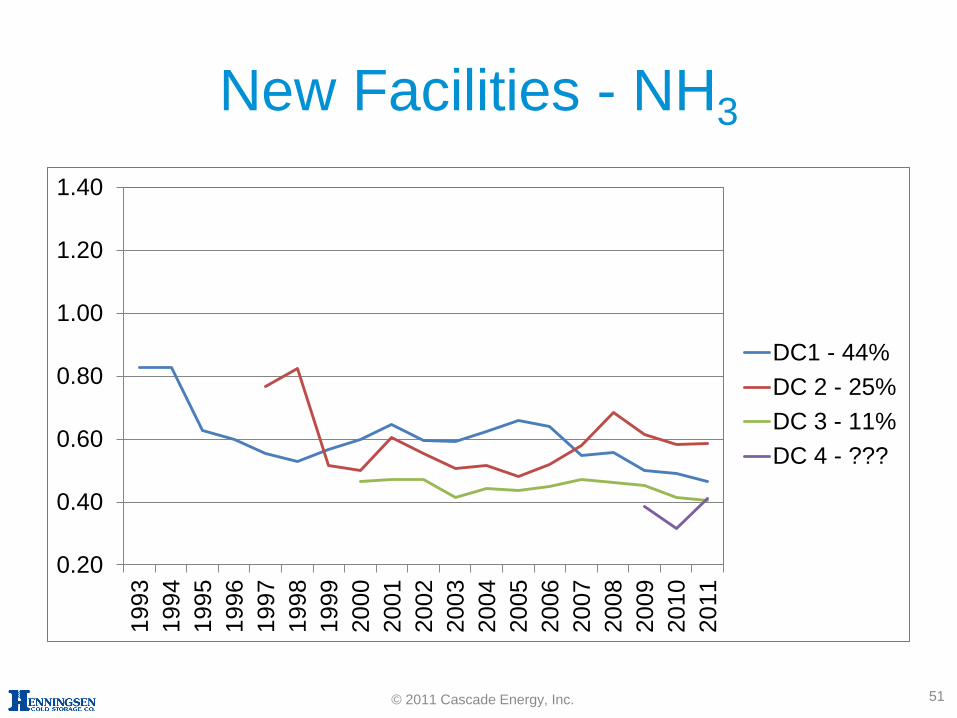
New Facilities - NH3
0.20
0.40
0.60
0.80
1.00
1.20
1.40
1993
1994
1995
1996
1997
1998
1999
20
00
2001
2002
2003
2004
2005
2006
2007
2008
2009
2010
20
11
DC1 - 44%
DC 2 - 25%
DC 3 - 11%
DC 4 - ???
51 © 2011 Cascade Energy, Inc.
Opportunity for Contractors • Become a value add partner
– Explore new technologies and bring them to the table
– Collect/Share success/failure information between projects
– Lobby manufacturers for improved products
– Keep an open mind on customer ideas
– Don’t be afraid of change
• Manage or actively participate in the process
• Save the customer money
• Make more money
– Sell bigger equipment
– Sell more equipment
• Take care of the customer
• Repeat sales
52 © 2011 Cascade Energy, Inc.
LEED? How much time do you have?!
• Energy & Atmosphere – Prereq: Minimum Energy Performance
– Prereq: Fundamental Refrigerant Mgmt
– Credit: Optimize Energy Performance (1-18 pts)
– Credit: Demand Response (1-2 pts)
– Credit: Renewable Energy (1-3 pts)
– Credit: Enhanced Refrigerant Mgmt (1 pt)
– Credit: Green Power & Carbon Offsets (1-2 pts)
• Performance – Prereq: Building-Level Energy Metering
– Prereq: Fundamental Commissioning & Verif.
– Credit: Enhanced Commissioning (3 pts)
– Credit: Monitoring Based Commissioning (1 pt)
– Credit: Advanced Energy Metering (1 pt)
– Credit: Reconcile Projected & Actual Energy Perf (1 pt)
53
Unfortunately, ASHRAE 90.1 doesn’t address
refrigerated warehouses very well……….
© 2011 Cascade Energy, Inc.
• Consider efficiency early in design & bid phase
• Owner, GC, subs, vendors, utility, energy consultant, are all part of the team
• Engage utility program early – Coming to them late will fail
• Let utility program know if the project scope or timeline has changed
• Always include contingency in budgets
• Ensure contractors and vendors track and document costs per needs of program
• Plan for energy commissioning 3 to 6 months after facility startup
New Construction Advice
54 © 2011 Cascade Energy, Inc.
Thanks!
55 © 2011 Cascade Energy, Inc.


![Cold storage [jkvs]](https://img.pdfslide.net/doc/110x75/5886509a1a28ab32768b721f/cold-storage-jkvs.jpg)