Embed Size (px)
Citation preview

Kennedy Space Center
Remediation Program Overview
Streamlined RCRA Remediation via Engineering Evaluation Process
Christopher Hook, PEApril 2015
https://ntrs.nasa.gov/search.jsp?R=20150010097 2018-05-11T14:31:14+00:00Z

• Typical RCRA Process
• Kennedy Space Center (KSC) Remediation Team
• Overview KSC Engineering Evaluation (EE) Process
– Preliminary Assessment/Possible Release Locations
– Step 1 EE – Characterization
– Step 2 EE – Remedy Alternative Screening
– Step 3 EE – Remedy Design
– Step 4 EE – Remedy Implementation
Objectives

RCRA Corrective Action
NASA KSC Process
Typical RCRA Process

• Interdisciplinary team:– NASA KSC Remediation Project Managers (RPMs)– Regulators (FDEP)– A/E Contractors:
• Tetra Tech• Jacobs• Geosyntec
• Each member reviews and comments on each EE and consensus for these submittals is requested at meeting
• A master KSC schedule for projects and deliverables used to track/coordinate meeting topics and maintain permit compliance
• Meet every 2 months at KSC
KSC Remediation Team (KSCRT)

• Multi-step process developed to ensure:– Adequate site characterization
– Participate in evaluation of remedial technologies
– Review preliminary designs
– Evaluate efficacy of interim measures
• Decouples RFI and CMS Work Plan process
• Remedy conducted through interim measures (IMs)
• IMs conducted such that Long Term Monitoring is final remedy
• Allows prompt action to mitigate and prioritize risks– 1 to 3 years versus 5 to 10+ years!
Engineering Evaluation Process

• Goals: – Is groundwater contamination fully delineated?
– Is sufficient data available for site conceptual model and remedial decision making?
• Content:– Objectives/Site History
– Site Conditions (e.g., terrain, hydrogeology, lithology)
– Assessment summary (results, locations, intervals, mass)
– Results Visualization (interval/COC plume maps, cross sections, electronic visualization software)
– Preliminary Remedial Technology Screening
Step 1 EE – Site Characterization
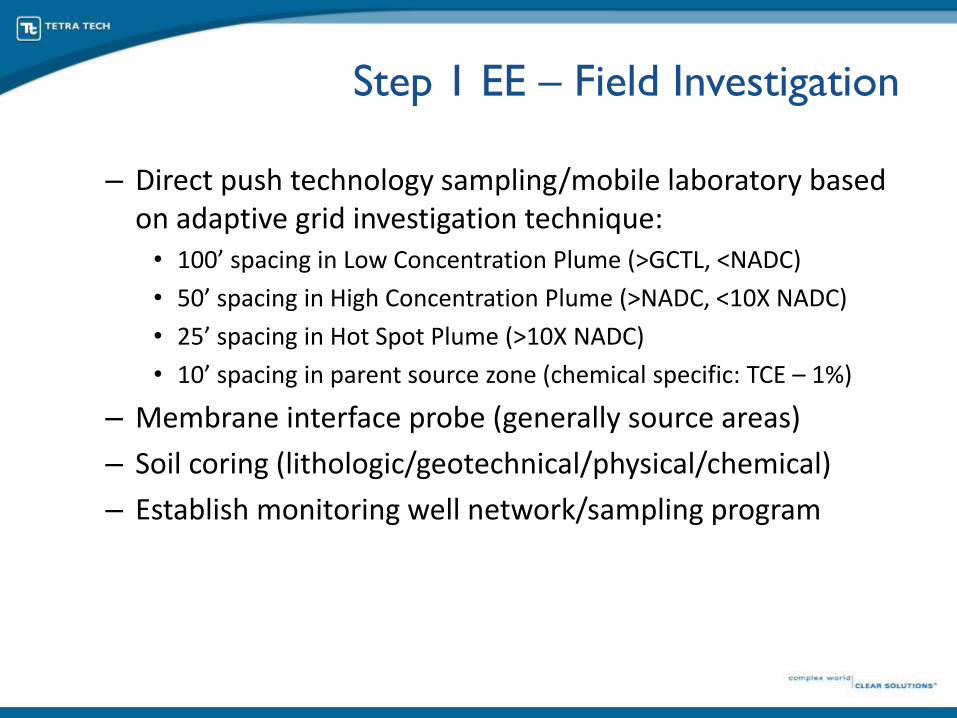
– Direct push technology sampling/mobile laboratory based on adaptive grid investigation technique:• 100’ spacing in Low Concentration Plume (>GCTL, <NADC)
• 50’ spacing in High Concentration Plume (>NADC, <10X NADC)
• 25’ spacing in Hot Spot Plume (>10X NADC)
• 10’ spacing in parent source zone (chemical specific: TCE – 1%)
– Membrane interface probe (generally source areas)
– Soil coring (lithologic/geotechnical/physical/chemical)
– Establish monitoring well network/sampling program
Step 1 EE – Field Investigation

Step 1 EE – Example Excerpts
• Example multi-plume site:

• DPT data obtained in near real-time– Future DPT location/spacing determined based
on result
• Final DPT data set compiled and visualized– Plan view plume contours (10’ vertical intervals)– Combined with lithologic data for cross section
view– MIPs data evaluated with DPT/lithologic data– 3D plume model created via EVS (krigging)
• Contaminant mass calculated• Engineering data to support preliminary
remedial technology screening (biological, chemical, geochemical, physical, etc)
• Data and conclusions compiled into a presentation (Advanced Data Package)
• ADP published to team for review/comment• Presented at meeting for discussion and
consensus
Step 1 EE – Data Interpretation

Step 1 EE – Example Excerpts• TCE plume slice at specific depth interval:

Step 1 EE – Example Excerpts• Example cross section:

Step 1 EE – Example Excerpts• MIP logs:

Step 1 EE – Example Excerpts• Sample engineering data:
Parameter Min. Max. Average Units
Dehalococcoides 1.4E+06 4.0E+08 1.3E+08 gene copy/L
TCE r-dase 6.6E+04 1.7E+08 3.2E+07 gene copy/L
BAV1 VC r-dase 0.5 U 5.4E+06 9.1E+05 gene copy/L
VC r-dase 2.5 U 3.4E+08 8.7E+07 gene copy/L
Ethane 0.17 U 2.4 1.1 μg/L
Ethene 2.9 140.0 46 μg/L
Methane 80 2,700 1,300 μg/L
Hydrogen 0.84 1.30 1.05 nmol
Total Organic Carbon 3.8 16 V 12.5 mg/L
Carbon Dioxide 210 V 980 605 mg/L
Hydrogen Sulfide (HS2) 0 (ND) 0.5 -- mg/L
Hydrogen Sulfide (S-2) 0 (ND) 0 (ND) -- mg/L
Chloride 51 410 258.5 mg/L
Nitrate-N 100 U 100 U 100 U μg/L
Nitirite-N 100 U 100 U 100 U μg/L
Sulfate 200U 35 11 mg/L
Sulfide 1000 U 1000 U 1000 U μg/L
Ferrous Iron 0.20 2.20 0.87 mg/L
Iron (total) 0.84 12 3.3 mg/L
Manganese 0 (ND) 130 36 mg/L
Alkalinity 50 U 450 375 mg/L
Conductivity 666 2,014 1,522 mS/cm2
DO – Field Kit 0.8 1.0 0.9 mg/L
DO – Meter 0.65 1.69 0.96 mg/L
ORP -80.6 -14.7 -46.5 mV
pH 6.5 7.1 6.9 S.U.
Temperature 22.7 26.1 24.5 C
Turbidity 4.2 8.7 5.8 μg/L

• EVS View:
Step 1 EE – Example Excerpts
Plumes: TCE (green), cDCE (blue), VC (red)Sample Locations:
Blue all parameters < 10x NADCRed one or more parameters >10x NADC

• Remedial technology screening
Step 1 EE Excerpts

• Goals:– Compile technologies into remedial alternatives
– Provide unbiased screening and comparison of technologies
– Select best suited remedial alternative
• Content:– Conceptual designs (layouts, design criteria, cost
estimates, etc.)
– Comparative analysis of alternatives (similar to RCRA selection criteria)
– Supplemental attachments: cost estimates, design calculations, models, alternative narratives
Step 2 EE – Remedial Alternative Evaluation

Step 2 EE – Example Excerpts• Alternative examples (diffuse plume):No. Alternative General Components
G-1 Air Sparging AS wells (6 shallow, 18 shallow-intermediate, and 40 intermediate), AS system
(rotary claw compressed air pump, heat exchanger, and instrumentation), and
conveyance trenching and piping.
G-2 Anaerobic Bioremediation
with Recirculation
Injection and extraction wells for application of substrate through recirculation (30
injection wells and 8 extraction wells). Extraction pumps, substrate mixing, and
conveyance piping/tubing.
G-3 Anaerobic Bioremediation
with Recirculation and EZVI
Injection in HS1 SZ
Injection and extraction wells for application of ethyl lactate through recirculation
(30 injection wells and 8 extraction wells). Extraction pumps, substrate mixing, and
conveyance piping/tubing. Injection of EZVI at 2 locations at HS1.
G-4 Anaerobic Bioremediation
with Recirculation and
Selective Treatment
Injection and extraction wells for application of ethyl lactate through recirculation
(30 injection wells and 8 extraction wells). Extraction pumps, infiltration gallery,
air stripper, substrate mixing, and conveyance piping/tubing.
G-5 Anaerobic Bioremediation
with Recirculation, Selective
Treatment, and EZVI
Injection in HS1 SZ
Injection and extraction wells for application of ethyl lactate through recirculation
(30 injection wells and 8 extraction wells). Extraction pumps, infiltration gallery,
air stripper, substrate mixing, and conveyance piping/tubing. Injection of EZVI at 2
locations at HS1.

Alternative G-2 Summary
• Biological and geochemical conditions favorable for enhanced anaerobic bioremediation
• Soluble electron donor substrate (e.g., LactOil) distributed by cycled groundwater recirculation
• Target substrate concentration of 550 mg/L
• Six recirculation zones, consisting of:
– 8 extraction wells within 3 extraction transects
– 30 injection wells within 4 injection transects
• Treatment zones would be operated in phases, under the below groupings:
– Sequence 1: Zone 1, 4, and 6
– Sequence 2: Zones 2 and 5
– Sequence 3: Zone 3
• 30 day sequence duration; 2 pore volumes for each sequence; 90 days per sequence cycle
Step 2 EE – Example Excerpts• Enhanced reductive dechlorination alternative example:

Alternative G-2 Summary
• Extracted fluids would be directed to one of two manifolds – a high concentration manifold and a
low concentration manifold
• Flexible manifold design allows all injection/extraction well laterals to be easily interchangeable
between low and high concentration manifolds
• Substrate mixing, injection equipment, tanks, and pumps would be housed in a trailer
• 5,300 gallons (~100 drums) 60% soybean water-in-oil emulsion injected through the recirculation
zones.
• Estimated time to reach treatment goals: ~3 years
• Estimated Cost: $879K (~$7.3K per pound of total TCE, cDCE, and VC mass)
Step 2 EE – Example Excerpts• Enhanced reductive dechlorination alternative example:

Step 2 EE – Example Excerpts• Enhanced reductive dechlorination example:

Step 2 EE – Example Excerpts• Cost evaluation:
$600,000
$650,000
$700,000
$750,000
$800,000
$850,000
$900,000
$950,000
$1,000,000
Capital Year 1 Year 2 Year 3
Cumulative Costs
Alt G-1
Alt G-2
Alt G-3
Alt G-4
Alt G-5

Step 2 EE – Example Excerpts• Alternative screening:
Comparative Analysis of IM Alternatives
ALTERNATIVE LIMITATIONS ADVANTAGES DISADVANTAGES SUSTAINABILITY COST
-Treatment of potential NAPL
ganglia dissolution limited
-Air distribution in
heterogeneous lithologies
-Effective technology widely
applied and understood at KSC
-Large mass reduction in short
timeframe
-Operations are easily adjustable
and flexible
-Capture of volatilized
COCs not feasible.
-Potential HS plume
expansion into HCP
-Fairly energy intense
-Preferential pathways
may result in pockets of
untreated zones
Capital:
$799K
Year 1 Costs:
$55K
Total Costs:
$889K
Cost/lb VOC Mass:
$7.4K
-Distribution uniformity of
substrate predicated by
lithology
-Treatment timeframe
generally unpredictable
-Treatment of potential NAPL
ganglia limited to dissolution
interface
-Proven technology at nearby
VAB area
-Flexible, substrate selection
and dosage can be modified
according to results
-Injection/extraction flow rates
can be optimized
-Easily expandable into HCP
-Closed loop recirculation
does not fully contain
plume footprint
-Competing microbes and
electron acceptors result
in higher substrate loading
-Alt. G-2 limitations
-Contact of potential NAPL
with EZVI requires NAPL to
transport into EZVI droplets.
-Distribution is variable and
general injection technologies
are complex
-Distribution of EZVI can
be preferential and viscous
properties can limit
distribution
-Potential secondary
groundwater quality
impacts by mobilization of
metals and sulfide
production.
-Alt. G-2 limitations
-Fluctuations in initial influent
concentrations may require
adaptive flow diversion to
maintain emission compliance.
-Inclusive of Alt. G-2 advantages
-Continuous operation of
recirculation zones
-Most conservative recirculation
scenario
-Hydraulic containment of plume
footprint
-Mass removal
-No treatment residuals generated
-Additional component of
discharge compliance
monitoring
-Additional equipment
operation and maintenance
CO2e: 157 tonnes
NOx: 0.34 tonnes
SOx: 0.33 tonnes
PM10: 0.0131 tonnes
Energy: 3,610 MMBTU
Water: 93,000 gal
CO2e: 142 tonnes
NOx: 0.31 tonnes
SOx: 0.28 tonnes
PM10: 0.0125 tonnes
Energy: 3,469 MMBTU
Water: 82,000 gal
CO2e: 263 tonnes
NOx: 0.45 tonnes
SOx: 0.59 tonnes
PM10: 0.0125 tonnes
Energy: 4,519 MMTBU
Water: 181,000 gal
CO2e: 134 tonnes
NOx: 0.31 tonnes
SOx: 0.28 tonnes
PM10: 0.0124 tonnes
Energy: 3,252 MMBTU
Water: 78,000 gal
-Inclusive of Alt. G-2
advantages
-Aggressive treatment of high
TCE concentrations
-Biotic and abiotic mechanisms
accelerated
Capital:
$650K
Year 1 Costs::
$109K
Total Costs:
$879K
Cost/lb VOC Mass:
$7.3K
Capital:
$689K
Year 1 Costs:
$108K
Total Costs:
$918K
Cost/lb VOC Mass:
$7.7K
Capital:
$675K
Year 1 Costs::
$114K
Total Costs:
$914K
Cost/lb VOC Mass:
$7.6K
Alternative G-1
Air Sparging
Alternative G-2
Anaerobic
Bioremediation with
Recirculation
Alternative G-3
Anaerobic
Bioremediation with
Recirculation and EZVI
Injection
Alternative G-4
Anaerobic
Bioremediation with
Recirculation and
Selective Treatment
-Alt. G-3 and G-4 limitations -Inclusive of Alt. G-3 and G-5
advantages
-Highest level of certainty
between biological alternatives
Alt. G-3 and G-5
disadvantages
CO2e: 165 tonnes
NOx: 0.34 tonnes
SOx: 0.33 tonnes
PM10: 0.0133 tonnes
Energy: 3,827 MMBTU
Water: 97,000 gal
Capital:
$714K
Year 1 Costs::
$114K
Total Costs:
$953K
Cost/lb VOC Mass:
$8.0K
Alternative G-5
Anaerobic
Bioremediation with
Recirculation, Selective
Treatment, and EZVI
Injection in HS1 SZ

• Goals:
– Present remedial design to KSCRT
– Opportunity to review and comment on focused design
• Content:
– Interim Measure Objectives
– Design and Process Calculations and Drawings
– Design description
– Performance specifications
– Detailed costing and duration modelling
– Performance monitoring/exist strategy
Step 3 EE – Remedial Design

Step 3 EE – Example Excerpts

Step 3 EE – Example Excerpts

Step 3 EE – Example Excerpts
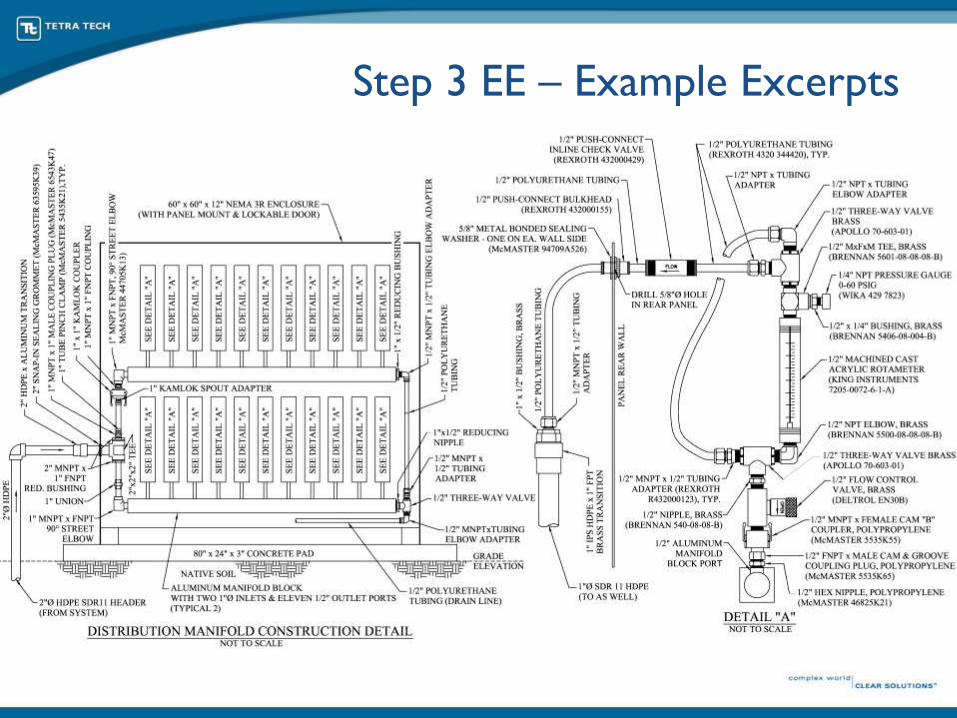
Step 3 EE – Example Excerpts
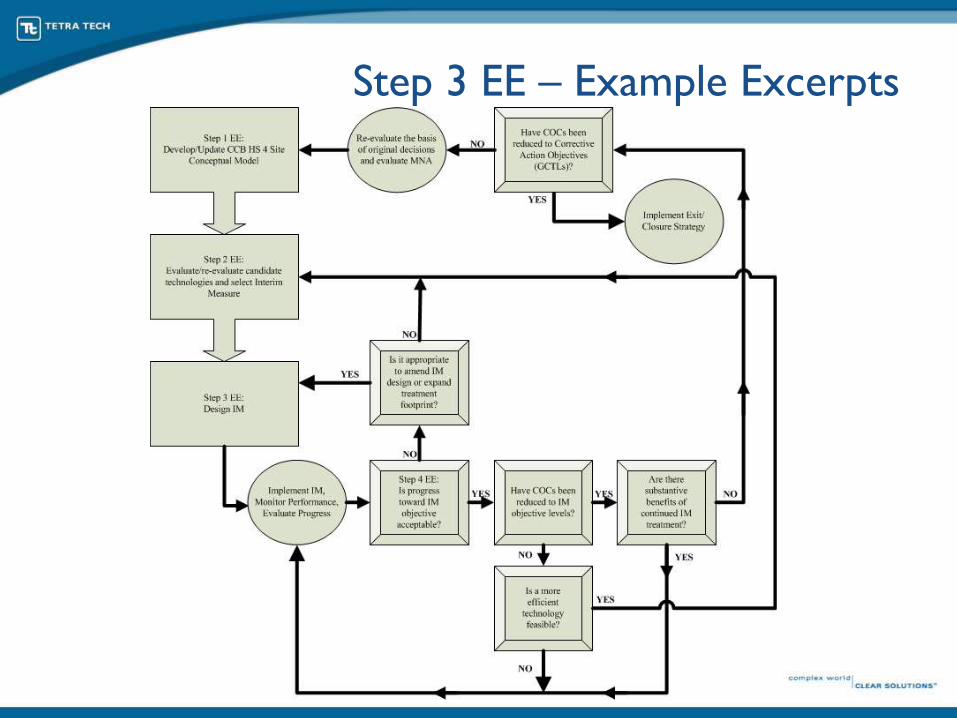
Step 3 EE – Example Excerpts

• Goals:– Present remedy construction/implementation– Optimize ongoing remedy– Refine exit strategy on updated data sets
• Step 4 EE (Construction Completion):– Overview of remedy design and construction– Lessons learned and health and safety– Baseline data
• Step 4 EE (Operation, Maintenance, and Monitoring): – Evaluation of performance metrics (GW data, run-time, …)– Cost evaluation and mass removal– IM optimization– Exit strategy update/refinement– Planned activities
Step 4 EE - Remedy Implementation

Step 4 EE - Construction Photos

Step 4 EE - Construction Photos

Step 4 EE - LDA/Steam/ZVI Photos
Photographs courtesy of Jacobs Engineering
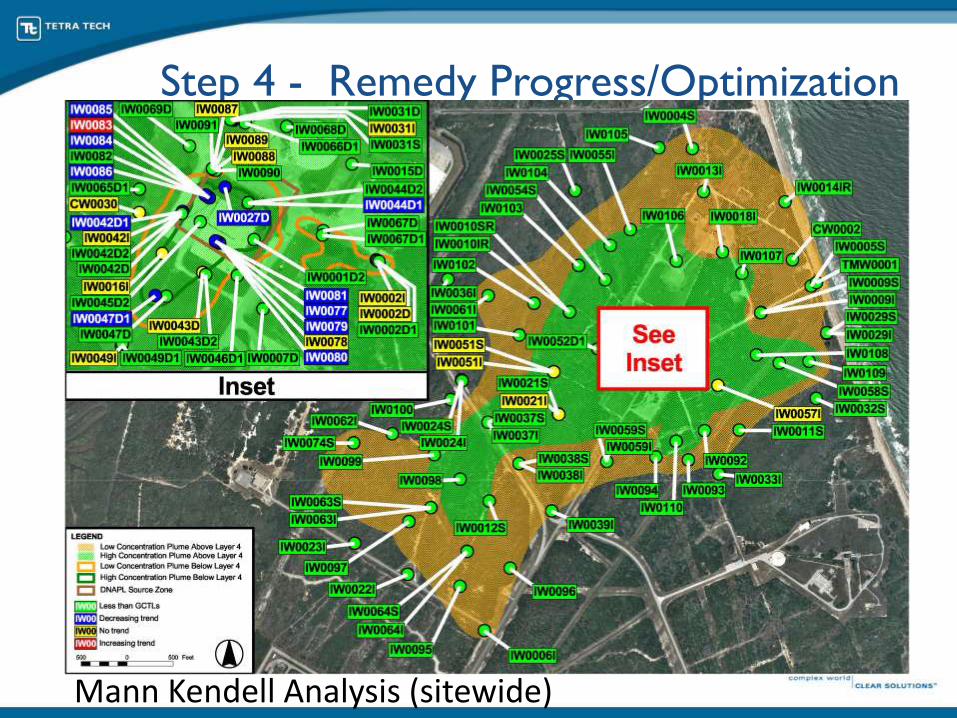
Step 4 - Remedy Progress/Optimization
Mann Kendell Analysis (sitewide)

Step 4 - Remedy Progress/Optimization
0
5
10
15
20
25
30
35
40
45
50
0
5
10
15
20
25
30
35
Vo
lum
e R
eco
ver
y (
1M
gal
)
Mas
s R
eco
ver
y (
1K
lb)
Mass Recovery
Recovery Volume
• cVOC Mass recovery: 32,042 lb (03/11/2013); 24 lb/d average (Yr 3)
• Cost per pound of cVOC mass recovered: $94/lb (Previous Yr: $119/lb)
− Capital cost driven, figure continues to decrease as operation continues
• Groundwater recovery: 44,601,839 gallons (03/11/2013)

Step 4 - Remedy Progress/Optimization
35
0
0.5
1
1.5
2
2.5
3
3.5
Jan-10 Jul-10 Jan-11 Jul-11 Jan-12 Jul-12 Jan-13 Jul-13 Jan-14 Jul-14 Jan-15
0%
10%
20%
30%
40%
50%
60%
70%
80%
90%
100%
Mola
r C
on
cen
trat
ion
, m
mo
l/L
Mo
lar
Dis
trib
uti
on
TCE, % cDCE, % VC, % Total, mmol/L TCE, mmol/L cDCE, mmol/L VC, mmol/L

Step 4 - Remedy Progress/Optimization
1,000
10,000
100,000
1,000,000
0 1 2 3 4 5 6 7 8 9 10
ΣT
CE
, cD
CE
, V
C C
once
ntr
atio
n (
ug
/l)
Year
Influent Data, Actual
Forecasted Influent, Average Trend Fit
Flushing Rate Calculation, Residual Concentration
CatOx Cost Efficient
Carbon Cost Efficient
36
Pumping
Rate
Modification
IM Progress

Step 4 - Remedy Progress/Optimization
37

Step 4 - Remedy Progress/Optimization
Layer 1: Sand (Upper sand unit; S zone; 30 LTM wells; 10 foot screen interval 1’-17’ range; 3 System Performance Wells 13’-23’)
Layer 2: Fine silty sand (Middle fine-grained unit; I zone; 39 LTM wells; 5 foot screen interval 20’-35’ range; 3 SPW 20’-28’)
Layer 3: Coarse to silty sand (Lower sand unit; D zone; 11 LTM wells; 5 foot screen interval 35’-45’ range; 3 SPW 28’-43’)
Layer 4: Silt and clay (Lower clay unit, ~ 5 feet thick; no wells in this layer)
Layer 5: Fine to coarse silty sand with shell fragments (3 SPW 45’-55’/47’-57’/52’-57’)
Layer 6: “Salt and pepper” sand (D1 zone; 10 LTM wells; 10 foot screen interval 50’-75’ range; 6 SPW 60’-70’/70’-80’)
Layer 7: Silty to clayey sand (IW42D2 screened 87’-92’)
Layer 8: Fine to coarse sand (D2 Zone; 5 LTM well; 10 foot screen interval 105’-115’ range)
Layer 9: Clay to sandy clay (Hawthorn confining unit; no wells in this layer)
Pre-IM Site Lithologic Model

Step 4 - Remedy Progress/Optimization

Step 4 - Remedy Progress/Optimization

Notable Current Activities at KSC
• Large diameter auger/steam/ZVI TCE source zone IM
• EZVI/bioremediation PCE source zone IM
• Enhanced anaerobic reductive dechlorination at several sites
• Air sparging successfully applied at many sites and continuing to be applied at new sites
• Centralized multi-site air sparging integration (now at 365 wells)
• Highly successful source zone containment/mass removal via pump and treat
• Planned electrical resistance heating project

• Engineering evaluations significantly streamline and enhance documentation and design process
– Multi-disciplinary team of stake-holders vested in a common goal of project success
– Investigation to remedy timeframe drastically shortened
– Adaptive and progressive investigation and design methods
– Savings from reduced reporting and enhanced designs applied to effective investigations and interim measures
Overview of KSC Interim Measure Process
Kennedy Space Center
Remediation Program Overview
Questions/Comments
Acknowledgements: KSC Remediation Program Branch

![Status of Active Debris Removal (ADR) developments at the ...[R1] “An active debris removal parametric study for LEO environment remediation”, J.-C. Liou, NASA Johnson Space Center,](https://img.pdfslide.net/doc/110x75/5f10e2dd7e708231d44b48e9/status-of-active-debris-removal-adr-developments-at-the-r1-aoean-active.jpg)