Embed Size (px)
Citation preview

PART 1116 Opportunity analysisPART 5PART 4PART 3PART 2
Chapter 5
M E AS U R I N G M A R K E T
O P P O R T U N I T I E S :
FO R EC AST I N G A N D M A R K E T
K N O W L E D G E
T E L ST R A T E L EC O M M U N I C AT I O N S I N
AU ST R A L I A 1
B AC KG R O U N D O F T E L S T R A The telecommunications industry in Australia is diverse and dynamic. The turbulent environ-
ment in which it operates has witnessed, and will continue to witness, the impact of globalisation,
deregulation, competition and new and improved technologies. In order to remain dominant,
telecommunications businesses must be proactive rather than reactive, anticipating changes in
consumer behaviour, rapid developments in technology and future trends.
➤ Telstra Corporation Limited (Telstra) is Australia’s leading telecommunications and information
services company. It competes in all telecommunications markets throughout Australia,
currently supplying 8.6 million fixed line services and 10.5 million mobile phone connections.
The mobile phone services division is expanding very fast and the majority of the users—8.2
million—have 3G (third generation) type of technology. Telstra’s revenue has been increasing
from $23.7 billion in 2007 to $24.8 billion in 2009–10. The earnings before income tax
depreciation and amortisation (EBITDA) in 2007 were $5.8 billion but increased in 2009–10
to $10.8 billion. Telstra has over 1.4 million shareholders and many more indirectly investing
through their superannuation funds, which makes it arguably one of the largest shareholding
companies in Australia. 2
In 2009, Telstra appointed a new chief executive officer, Mr David Thodey. His extensive ➤
management experience with IBM and mobile telephones enabled him to fit in very well with
the rapidly changing technological environment at Telstra. The new vision, which aims to
improve the way people live and work, is rather broad and ambitious, but it does make sense
because Telstra is in the communications business, which includes individual and business
telephone interactions. The mission is focused on creating and using technology services
Walker Chapter 05.indd Sec1:116Walker Chapter 05.indd Sec1:116 2011-05-14 6:52:00 AM2011-05-14 6:52:00 AM
The material is for promotional purposes only. No authorised printing or duplication is permitted. (c) McGraw-Hill AustraliaSam
ple ch
apter

117Measuring market opportunities: forecasting and market knowledge CHAPTER 5 117Measuring market opportunities: forecasting and market knowledge CHAPTER 5
that serve customers as best as they can. Telstra prides itself on being customer-centric and
service-focused and wants to build trust, respect, integrity and cooperative relationships with all
stakeholders. The corporate culture is all about being successful as a company, innovative and
collaborative and, above all, satisfying the customer needs by getting it right the first
time—whatever they do—being reliable, responsive, empathetic and helpful with all types of
business and consumer interactions. 3
As well as fixed-line phone services, Telstra offers mobile phone services, including voice services,
text and multimedia messaging and a range of information, entertainment and other services. It also
offers BigPond internet, Foxtel and Austar. Telstra operates Australia’s largest GSM, CDMA and 3G
mobile telephony networks, as well as a secondary wireless broadband network, branded Next G,
2GSM and 3GSM, and offers the largest network of wireless internet ‘hotspots’ in Australia. This vast
geographical coverage of both its fixed and mobile network infrastructure is one of Telstra’s major
strengths. In 2006 Telstra launched a new mobile broadband network, Next G broadband mobile,
which claims to cover 99 per cent of the Australian population, but this is not the same for all regions
and locations in Australia. The Next G and 3GSM 2100 broadband mobile services enable consumers
to access mobile voice, video calling and all broadband high-speed digital data access services, which
are supported by 6900 sites and enabled with world-class HSPA+ technology. 4 The network delivers
all types of mobile phone services, email, directory and other information services, news and enter-
tainment channels in more areas and many modes of delivery.
The sheer dominance of Telstra’s telecommunications network requires the efficient and effective
use of industry infrastructure and superstructure. The manufacturing sector in the telecommunica-
tions industry provides both infrastructure and end-user hardware—building and maintaining the
telecommunications network, as well as supplying handsets and other equipment to end users.
Telecommunications service providers supply these services using carrier network infrastructure, and
retailers offer these services to end users on behalf of telecommunications service providers. Retailers
can be categorised into three types: speciality outlets; outlets that sell mobile telecommunications
hardware and services as part of a broad range of products; and online retailers.
D E R E G U L AT I O N O F T H E AU S T R A L I A N T E L E C O M M U N I C AT I O N S I N D U S T R Y The Australian telecommunications industry was progressively deregulated during the 1990s,
leading to partial deregulation in November 1997, under which the government sold approximately
33 per cent of its Telstra shares to the public. A further offering of another 16.6 per cent of its
shares was made in September 1999. Then, in November 2006, the government sold its remaining
stake in Telstra as part of the ‘T3’ share offer. As a direct result of this micro-economic deregulation,
consumers have witnessed a number of newcomers to the Australian telecommunications market,
which has resulted in intensified competition and ‘price wars’ for telecommunications products and
services.
Today, competition in the Australian telecommunications industry is fierce. Telstra has over-
whelming dominance across the market and in almost every segment of that market. Optus,
Australia’s second-largest telecommunications company, is Telstra’s main competitor, followed by
a host of smaller providers, such as Vodafone, 3 Mobile and Virgin Mobile (Optus Mobile).
T E L S T R A I N T H E M O B I L E P H O N E M A R K E T Telstra is Australia’s largest mobile provider, in terms of both subscribers and coverage. In 2009–10,
Telstra provided the largest number of fixed telephone connections—8.7 million—and mobile phone
usage services—10.6 million. The number of local phone calls is estimated to be 4.1 billion, text mes-
sages is 9.4 billion and mobile phone calls is over 15 billion. The volume of transactions, including
the work Telstra contractors and contact call centres have carried out, demonstrates that huge
diversity of services provided to a huge customer base. 5
Walker Chapter 05.indd Sec1:117Walker Chapter 05.indd Sec1:117 2011-05-14 6:52:00 AM2011-05-14 6:52:00 AM
The material is for promotional purposes only. No authorised printing or duplication is permitted. (c) McGraw-Hill AustraliaSam
ple ch
apter
PART 1PART 1
118 Opportunity analysisPART 5PART 4PART 3PART 2
The main broad market segments in the mobile phone industry comprise personal users and
business users . The business division consists of services for both small/medium business (SMEs)
and enterprise/government segments. Business services include mobile plans, internet and data
transmission, payment and security products.
M O B I L E P H O N E M A R K E T T R E N D S Over the past few years, the telecommunications market has witnessed a trend of consumers
using their mobile phone as their main point of contact. A larger proportion of voice calls are now
carried over mobile networks compared to fixed-line networks. There has also been a decrease
in the number of fixed-line connections and a much higher increase in the number of mobile con-
nections. Increasingly, mobile consumer lifestyles are creating greater demand for more flexible
communications services, including mobile internet and video streaming. The decreasing prices
of mobile services are increasing the number of users switching from one provider to another.
In order to differentiate mobile phone services and product offerings from their competitors,
telecommunication businesses must provide increased sophistication of technology, variety and
quality of services at competitive prices.
Further, Voice over Internet Protocol (VoIP) software, such as Skype, now presents an alter-
native to traditional telecommunications businesses. This new and growing telecommunications
format using internet infrastructure provides extremely cheap local and international telecom-
munications, including connections to mobile phones at much lower prices. This trend is likely to
become a real threat to well-established companies like Telstra.
Telecommunications businesses are, therefore, facing a turbulent business environment
and need to constantly respond and innovate to deal with these changing consumer needs,
technological innovations and new competitors. Dominant businesses in their maturity stage of
the product life cycle, such as Telstra, must continuously adapt their product-service ranges and
seek to attract new markets with existing and new products. Customer relationships and perceived
value for money are essential strategies to pursue in order to maintain their market share. 1
STRATEGIC CHALLENGES ADDRESSED IN CHAPTER 5 Chief executive officers, such as Telstra’s David Thodey, and marketing managers in estab-lished businesses need to have in-depth knowledge of their consumer markets and the industry trends. They need to analyse and synthesise that knowledge into tangible operational plans that their organisations can act on. These strategic and tactical plans can take many forms. For Telstra’s marketing teams, a business plan was needed to raise the necessary capital (inter-nally and externally) and obtain the operating licences to start the mobile venture. For other new product managers in established businesses, marketing plans must be developed to win support and resources to permit the product’s launch. In organisations of all kinds, annual budgets are prepared to guide decision making for the coming year. 6 These decisions determine recruitment of staff, investments in productive capacity, levels of operating expense and so on. In almost every case, these planning and budgeting activities begin with a sales forecast. Once a sales figure has been agreed to, the various activities and investments needed to support the planned sales level are budgeted to make them a reality.
In this chapter, we deal with some key issues that enable managers and entrepreneurs to bring their dreams to life. First, we address the challenges in estimating market potential and forecasting sales , for both new and existing products or businesses. We provide a menu of evidence-based forecasting methods, each of which is useful in some situations but not in
Walker Chapter 05.indd Sec1:118Walker Chapter 05.indd Sec1:118 2011-05-14 6:52:00 AM2011-05-14 6:52:00 AM
The material is for promotional purposes only. No authorised printing or duplication is permitted. (c) McGraw-Hill AustraliaSam
ple ch
apter
119Measuring market opportunities: forecasting and market knowledge CHAPTER 5
others, and we discuss their limitations. We also examine the process by which innovative new products diffuse into the market over time, a source of insight into the particularly difficult task of forecasting sales of innovative new products. Finally, we brief ly address the informational needs of the forecasting task—as well as the tasks addressed in the earlier chapters of this book that enable managers and entrepreneurs to understand their market and competitive contexts—to provide guidance on how to gather, collect and report data relevant to marketing decision making (i.e. marketing research ). In this portion of the chapter, we assume that the reader has already learnt the basics of planning and conducting marketing research. Such research is essential in strategic decision making—to provide evidence on which to base the various corporate-level and business-level decisions discussed in Chapter 2. Depending solely on hunches, instead of on more carefully thought-out research inquiries—even modest ones done quickly—can be a risky proposition indeed. In the marketing plan exercise at the end of the chapter, we suggest an approach for planning the marketing research which must underpin any marketing plan. The outcome of that research delivers relevant qualitative and quantitative data, which ref lect an evidence-based approach that includes sales forecasts, based on consumer’s revealed behaviours and preferences. This is a more comprehensive way to strategically plan ahead and make important decisions with more confidence.
EVERY FORECAST IS WRONG! We know of no manager who has ever seen a forecast that came in exactly on the money. Some forecasts turn out too high, others too low. Forecasting is an inherently difficult task, because no one has a perfect crystal ball. The future is inherently uncertain, especially in today’s rapidly changing markets. Consumer wants and needs shift, buffeted by the winds of ever-changing macro trends. Competitors come and go. New technologies sweep old ones away. Some fore-casts are based on extensive and expensive research, others on small-scale inquiries, still others on uninformed hunches. As we have seen, however, forecasting plays a central role in all kinds of planning and budgeting in all kinds of businesses and other organisations. 7 Given the stakes and the risks entailed in being very wrong with a forecast, some effort to prepare an evidence-based forecast , instead of a wild guess, is almost always called for, even if time and money are scarce. So forecast we must—but how?
A FORECASTER’S TOOLKIT: A TOOL FOR EVERY FORECASTING SETTING Before choosing a method by which to prepare a forecast, one must first know what is to be estimated or forecasted. Firstly, there’s the size of the potential market, that is, the likely demand from all actual and potential buyers of a product or product class. An estimate of market potential often serves as a starting point for preparing a sales forecast, which we explore in more detail later in this chapter. For Telstra’s mobile phone marketing team, prospective investors will want to know how large the potential market for mobile phone services will be in the coming years, measured perhaps in several ways: in numbers of telephone users, in numbers and/or duration of calls, and in dollars. This market comprises those consumers who are likely to have both the willingness and the ability to buy and use a mobile phone or any of the other Telstra services. There is also the size of the currently penetrated market —those who are actually using mobile phones in Australia at the time of the forecast. Investors will also want to know these figures—the size of the potential and penetrated markets for the market segments that Telstra intends to serve—their target market . They will also need
Strategic issue
We provide a menu of evidence-based forecasting methods, each of which is useful in some situations but not in others.
Strategic issue
Established organisations employ two broad approaches for preparing a sales forecast: top-down and bottom-up.
Walker Chapter 05.indd Sec1:119Walker Chapter 05.indd Sec1:119 2011-05-14 6:52:00 AM2011-05-14 6:52:00 AM
The material is for promotional purposes only. No authorised printing or duplication is permitted. (c) McGraw-Hill AustraliaSam
ple ch
apter

PART 1PART 1
120 Opportunity analysisPART 5PART 4PART 3PART 2
a sales forecast , in which they predict sales revenues, for the next five years or so. So how might Telstra do these things?
Established organisations employ two broad approaches for preparing a sales forecast: top-down and bottom-up. Under the top-down approach, a central person or persons takes the responsibility for forecasting and prepares an overall forecast, perhaps using aggregate economic data, current sales trends or other methods that we will describe shortly. 8 Under the bottom-up approach, which is common in decentralised businesses, each part of the business prepares its own sales forecast, and the parts are aggregated to create the forecast for the busi-ness as a whole. For an example of how managers at international retailer Gap Inc.’s retailing divisions combine both methods to forecast next-year sales, see Exhibit 5.1.
EXHIBIT 5.1 Forecasting next year’s sales at Gap
At international retailer Gap Inc., forecasting sales for the next year for each of its divisions—Gap, Banana Republic and Old Navy—is an important process that drives a host of decisions, including how much merchandise to plan to buy for the coming year. Both top-down and bottom-up approaches are used. At Old Navy, for example, each merchandiser generates a forecast of what level of sales his or her category—women’s knit tops, men’s jeans and so on—can achieve for the next year. Group merchandise managers then provide their input and add these numbers to create a total forecast from a merchandising perspective. A second bottom-up forecast is generated by the store operations organisation,
adding stores and groups of stores. Simultaneously, a top-down figure is prepared at the company’s California headquarters, using macro-economic data, corporate growth objectives and other factors. The three forecasts are then compared, differences debated, and a final figure on which to base merchandise procurement and expense budgets is determined. Though the effort involved in preparing such a forecast is considerable, such broad involvement in the process helps to ensure both knowledgeable input into the forecast and subsequent commitment to ‘make the numbers’. Most importantly, Old Navy finds that the different processes, together with the ensuing discussions, lead to substantially better forecasts.
Source: Marshall L. Fisher, Ananth Raman and Anna Sheen McClelland, ‘Rocket Science Retailing Is Almost Here: Are You Ready?’, Harvard Business Review , July–August (2000).
The bottom-up logic also applies to Telstra’s marketing team. They can break their antici-pated demand into pieces and add the components to create the summary forecast. These pieces could be market segments, such as small retailers, mobile businesspeople, consumers and so on, or product lines, such as revenue from fixed-line home phones, phone cards or individual mobile phones, voicemail fees, pager fees and so on. Using the bottom-up approach presents a number of advantages. Firstly, this approach will force them to think clearly about the drivers of demand for each market segment or product line, and thus better understand the real potential of their business and its parts. 9 Secondly, they will be forced to make explicit assumptions about the drivers of demand in each category, assumptions that they can debate—and support with evidence gathered from their research—with prospective investors, and which they can later verify as the business unfolds. Thirdly, such an approach facilitates ‘what-if’ plan-ning. Various combinations of market segments and/or product lines can be combined to build a business plan that looks viable.
So what forecasting methods, or tools, can Telstra choose from? There are six major evidence-based methods for estimating market potential and forecasting sales: statistical methods; observation; surveys and other kinds of consumer research such as focus groups; analogy; judgment; and market tests. 10
Walker Chapter 05.indd Sec1:120Walker Chapter 05.indd Sec1:120 2011-05-14 6:52:00 AM2011-05-14 6:52:00 AM
The material is for promotional purposes only. No authorised printing or duplication is permitted. (c) McGraw-Hill AustraliaSam
ple ch
apter

121Measuring market opportunities: forecasting and market knowledge CHAPTER 5
Statistical and other quantitative methods Statistical methods use history and various statistical techniques, such as multiple regression or time series analysis, to forecast the future based on an extrapolation of the past. 11 This method is typically useful for an organisation such as Telstra, as there is a lot of historical data on which to base statistical forecasts, but less useful for entrepreneurs or new product managers charged with forecasting sales for a new product or new business, as there is no history in their venture on which to base a statistical forecast.
In established businesses, for established products, statistical methods are extremely useful. When Michelin, the tyre manufacturer, wants to forecast demand for the replace-ment car tyre market in Australia and New Zealand for the following year, it can build a statistical model using such factors as the number and age of vehicles currently on the road in Australia and New Zealand, predictions of GDP for both countries, the past few years’ demand and other relevant factors to forecast market potential as well as Michelin’s own replacement tyre sales for the coming year. Such a procedure is likely to result in a more accurate forecast than other methods, especially if Michelin has years of experience with which to calibrate its statistical model.
As with all forecasting methods, statistical methods have important limitations. Most important of these is that statistical methods generally assume that the future will look very much like the past. Sometimes this is not the case. US WEST (now Qwest Communications), the regional telephone company serving the Rocky Mountain and Northwest regions of the United States, ran into trouble in the 1990s when the statistical models it used to predict needs for telephone capacity failed to allow for the rapidly increasing use of computer modems, fax machines and second telephone lines for teenagers in American homes. Suddenly, the average number of telephone lines per home skyrocketed, and there was not enough physical plant—cable in the ground, switches and so on—to accommodate the growing demand. Consumers had to wait, sometimes for months, to get additional lines, and they were not happy about it! Similarly, if product or market characteristics change, statistical models used without adequate judgment may not keep pace. If a tyre manufacturer begins producing improved car tyres that last for 130 000 kilometres instead of for 50 000–80 000 kilometres, the annual demand for replacement tyres will be reduced. If vehicle manufacturers were to change the number of wheels on the typical family car from four to six, the existing statistical models used by car manufactures and tyre makers would have to be changed to include this major change.
Other quantitative forecasting methods, especially for new product forecasting, have also been developed. These include methods to mathematically model the diffusion of innovation process for consumer durables, 12 and conjoint analysis, 13 a method used to forecast the impact on consumer demand of different combinations of attributes that might be included in a new product.
Observation Another method for preparing an evidence-based forecast is to directly observe or gather existing data about what real consumers do in the product market of interest. Telstra has conducted a number of studies regarding all types of telephone users and their behavioural characteristics throughout metropolitan, regional and rural Australia.
Like statistical methods, observation-based forecasting is attractive because it is based on what people actually do. If behavioural or usage data can be found from existing secondary sources—in business files, market research survey data, at the library or on the internet—data collection is both faster and cheaper than new research studies that must be designed and carried out. Most large businesses, like Telstra, conduct ongoing market research to monitor current and future needs, and therefore identify first-hand those market trends that are worth pursuing before
Strategic issue
Statistical methods generally assume that the future will look very much like the past. Sometimes this is not the case.
Strategic issue
Observation-based forecasting is attractive because it is based on what people actually do.
Walker Chapter 05.indd Sec1:121Walker Chapter 05.indd Sec1:121 2011-05-14 6:52:00 AM2011-05-14 6:52:00 AM
The material is for promotional purposes only. No authorised printing or duplication is permitted. (c) McGraw-Hill AustraliaSam
ple ch
apter

PART 1PART 1
122 Opportunity analysisPART 5PART 4PART 3PART 2
other competitors do. For new-to-the-world products, however, observation is typically not possible and secondary data are not available, since the product often does not yet exist, except in concept form. Had there been no mobile phones in Australia or a similar country, observation would not have been possible. Market tests, which we discuss later in this section, are one way to get real purchase data about new-to-the-world products.
Empirical quantitative surveys and qualitative research Another common way to forecast sales or estimate market potential is to conduct empirical market surveys and qualitative research, such as focus groups and in-depth interviews. These surveys can be done with different groups of respondents, such as consumers, distributors or business users. In the case of consumer surveys, researchers can construct a questionnaire with statements regarding the product features, proposed services, new product concepts and price ranges that consumers would be prepared to pay. Through representative sampling methods, surveys can identify fairly reliably consumer intentions to buy and interest levels for different offerings. Consumer surveys can also measure current and future buying behaviour, including what consumers currently buy, how often, how much, their favourite brands and their pay-ment preferences. Distributors and salespeople can be asked how much they are likely to sell, what products and services are most likely to be successful, and their opinions on consumer attitudes and competitors’ attributes. Surveys as well as focus groups and in-depth interviews (qualitative research) can be used to find out from industry experts about all kinds of marketing issues and key trends. Industry experts can include high-level experienced professionals from distribution channels, suppliers, consultants, trade association executives and so on. The infor-mation they provide can help to develop plausible marketing scenarios for all aspects of the business, which can then be compared with empirical survey findings to help managers make strategic decisions that are evidence-based in all aspects of the marketing environment.
As part of their research into the mobile phone market, Telstra researched thoroughly all types of consumer segments to find out more about their demographic and behavioural characteristics. Young consumers have different lifestyles and, therefore, different mobile phone usage behaviour from older customers. Males and females with different occupational backgrounds use mobile phones differently from each other and differently from, for example, stay-at-home parents and older retired people. The majority of business phone calls are made during working hours, as opposed to the leisure-time use of mobile phones for personal calls. By combining these data with demographic data on the Australian population, Telstra had what they needed to prepare an evidence-based, bottom-up forecast of market potential, mar-ket segment by market segment.
However, empirical market surveys have limitations. Firstly, what people say is not always what they actually do . Consumer surveys of buyer intentions are always heavily discounted to allow for this discrepancy. For an example of this, see Exhibit 5.2. Secondly, the people who are surveyed may not be knowledgeable but, if asked for their opinion, they will prob-ably provide it! Thirdly, what people imagine about a product concept in a survey may not be what is actually delivered once the product is launched. When consumers are asked whether they will buy ‘an Italian pasta sauce with homemade wholesome f lavour’, they will surely provide some kind of response even when they cannot imagine what this f lavour is like in reality. Whether they will actually like the taste and texture of the sauce that is eventually released is another story all together! In general, statistical and observational methods are superior, when valid and representative survey data are available. Appropriate evidence-based data using valid sampling and survey methods are superior sources for forecasting and strategic decision-making purposes because such methods are based, at least in part, on what people have actually done or bought (e.g. the number of cars actually on the road, or the duration of mobile phone calls in Australia) and, therefore, on what they are likely
Strategic issue
Empirical market surveys have limitations. What people say is not always what they actually do. However, they are better than total ignorance or no relevant information at all.
Walker Chapter 05.indd Sec1:122Walker Chapter 05.indd Sec1:122 2011-05-14 6:52:00 AM2011-05-14 6:52:00 AM
The material is for promotional purposes only. No authorised printing or duplication is permitted. (c) McGraw-Hill AustraliaSam
ple ch
apter
123Measuring market opportunities: forecasting and market knowledge CHAPTER 5
to do in the near future. However, while survey methods assessing future buying intentions are not likely to be spot on (Are you likely to buy replacement tyres this year? How often would you use a mobile phone if you had one?), it is still possible to distil meaningful infor-mation and develop feasible probabilities using advanced statistical methods. Having some valid predictions of what is likely to happen next year is better than total ignorance or no relevant information at all when making important strategic decisions.
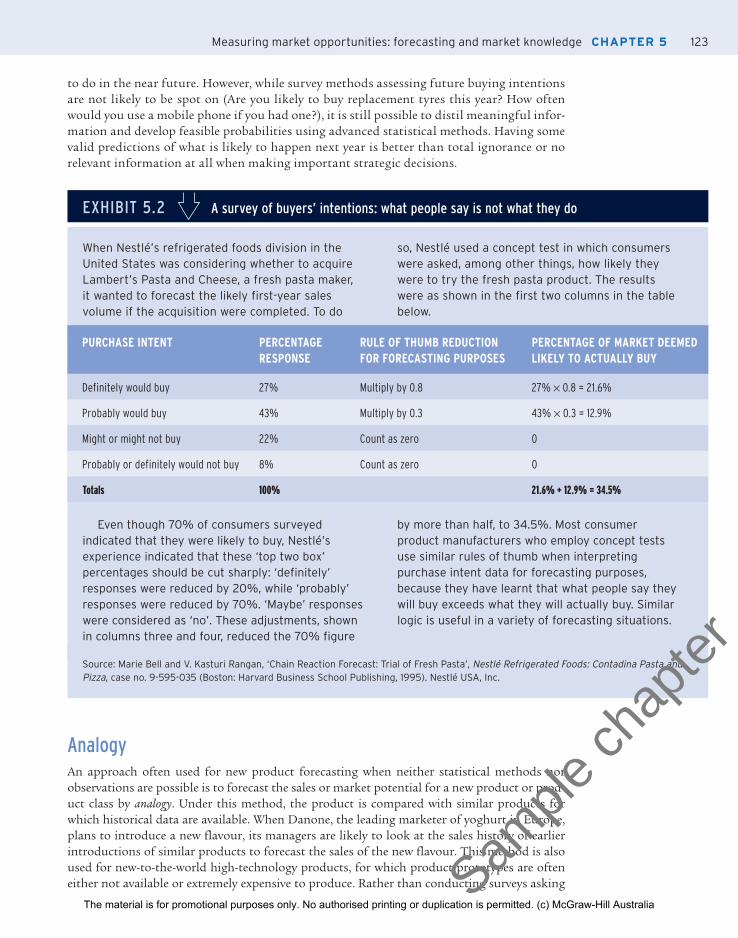
EXHIBIT 5.2 A survey of buyers’ intentions: what people say is not what they do
When Nestlé’s refrigerated foods division in the United States was considering whether to acquire Lambert’s Pasta and Cheese, a fresh pasta maker, it wanted to forecast the likely first-year sales volume if the acquisition were completed. To do
so, Nestlé used a concept test in which consumers were asked, among other things, how likely they were to try the fresh pasta product. The results were as shown in the first two columns in the table below.
PURCHASE INTENT PERCENTAGE RESPONSE
RULE OF THUMB REDUCTION FOR FORECASTING PURPOSES
PERCENTAGE OF MARKET DEEMED LIKELY TO ACTUALLY BUY
Definitely would buy 27% Multiply by 0.8 27% × 0.8 = 21.6%
Probably would buy 43% Multiply by 0.3 43% × 0.3 = 12.9%
Might or might not buy 22% Count as zero 0
Probably or definitely would not buy 8% Count as zero 0
Totals 100% 21.6% + 12.9% = 34.5%
Even though 70% of consumers surveyed indicated that they were likely to buy, Nestlé’s experience indicated that these ‘top two box’ percentages should be cut sharply: ‘definitely’ responses were reduced by 20%, while ‘probably’ responses were reduced by 70%. ‘Maybe’ responses were considered as ‘no’. These adjustments, shown in columns three and four, reduced the 70% figure
by more than half, to 34.5%. Most consumer product manufacturers who employ concept tests use similar rules of thumb when interpreting purchase intent data for forecasting purposes, because they have learnt that what people say they will buy exceeds what they will actually buy. Similar logic is useful in a variety of forecasting situations.
Source: Marie Bell and V. Kasturi Rangan, ‘Chain Reaction Forecast: Trial of Fresh Pasta’, Nestlé Refrigerated Foods: Contadina Pasta and Pizza , case no. 9-595-035 (Boston: Harvard Business School Publishing, 1995). Nestlé USA, Inc.
Analogy An approach often used for new product forecasting when neither statistical methods nor observations are possible is to forecast the sales or market potential for a new product or prod-uct class by analogy . Under this method, the product is compared with similar products for which historical data are available. When Danone, the leading marketer of yoghurt in Europe, plans to introduce a new flavour, its managers are likely to look at the sales history of earlier introductions of similar products to forecast the sales of the new flavour. This method is also used for new-to-the-world high-technology products, for which product prototypes are often either not available or extremely expensive to produce. Rather than conducting surveys asking
Walker Chapter 05.indd Sec1:123Walker Chapter 05.indd Sec1:123 2011-05-14 6:52:00 AM2011-05-14 6:52:00 AM
The material is for promotional purposes only. No authorised printing or duplication is permitted. (c) McGraw-Hill AustraliaSam
ple ch
apter

PART 1PART 1
124 Opportunity analysisPART 5PART 4PART 3PART 2
consumers about the likelihood that they will buy a product that they cannot imagine (what would people have said in 1978 about the likelihood that they would buy a personal compu-ter?), forecasters consider related product introductions with which the new product may be compared. Early forecasts for high-definition television (HDTV) were done this way, comparing HDTV with historical penetration patterns for colour televisions, videocassette recorders (VCRs), camcorders, DVDs, mobile phones and other consumer electronic products. 14
As always, there are limitations. Firstly, the new product is never exactly like that to which the analogy is drawn. For example, in the United States, early VCRs penetrated households at a much faster rate than did colour television sets. And what analogy should be used for a new hand-held mobile phone able to send emails and download files as fast as a modern PC? It is often difficult to make comparisons because some new products are simply original and, there-fore, are not comparable to existing ones. Another problem is the constant change occurring in consumer needs and in the competitive environment—competitive forces, legal, economic, envi-ronmental and political conditions may differ considerably from when the analogous product was launched. Such conditions need to be taken into account.
Judgment While we hesitate to call this a forecasting method of its own, since capable and informed judgment is required for all methods, sometimes forecasts are made solely on the basis of experienced judgment , or intuition (gut feeling). Some decision-makers are intuitive in their decision processes and cannot always articulate the basis for their judgments. According to one footwear buyer at Nine West Group, an international manufacturer and retailer of shoes and fashion accessories, ‘trend forecasting is a visceral thing that cannot be trained. I rely on my sense of colour and texture, but at times I cannot explain why I feel a certain way . . . I just know’. 15 Those with sufficient forecasting experience in a market or product category that they know well may be quite accurate in their intuitive forecasts, but they can also make mistakes. Unfortunately, it is often difficult to defend intuitive forecasts against the evidence-based forecasts which have actual data to support their predictions. Nonetheless, the importance of experienced intuitive judgment in forecasting, whether it is used with or without other evidence-based information, cannot be discounted because strategic marketers almost never have all the required information available to make forecasts.
Market tests Market tests of various kinds are the last of our most commonly used methods. Used largely for new products, market tests, such as experimental test markets , may be done under controlled experimental conditions in research laboratories, or in live test markets with real advertising and promotion and distribution in real retail stores.
The use of test markets has declined over the past few decades for two reasons. Firstly, they are expensive to conduct because significant quantities of the new product must be produced and marketing communications activities of various kinds must be paid for. More importantly, in today’s data-intensive environment, especially for consumer products sold through super-markets and mass merchants, competitors can buy the consumer research data collected through scanners at the checkout and learn from these test market results without bearing the expense. More diabolically, competitors can engage in marketing tactics to mislead the business conducting the market tests, such as by increasing their own sampling programs or offering high discounts or buy-one-get-one-free promotions, therefore distorting the normal purchasing patterns in the market-tested product category. Experimental test markets, on the other hand, are still commonly used because they are the ultimate reality simulation test that marketers can do to predict product performance.
Walker Chapter 05.indd Sec1:124Walker Chapter 05.indd Sec1:124 2011-05-14 6:52:00 AM2011-05-14 6:52:00 AM
The material is for promotional purposes only. No authorised printing or duplication is permitted. (c) McGraw-Hill AustraliaSam
ple ch
apter
125Measuring market opportunities: forecasting and market knowledge CHAPTER 5
The internet has made possible a new kind of market test: a direct offer to consumers on the web. Offers made through chat rooms, interest-group forums or email lists of current customers are approaches that are frequently used. The use of such techniques has increased because they allow businesses to carry out faster product tests at lower costs, and to evaluate the results and consumer feedback more effectively than in other kinds of market tests. We explore these and other internet marketing strategies in greater detail in Chapter 11.
Mathematics entailed in forecasting Regardless of the method used, the ultimate purpose of the forecasting exercise is to end up with numbers that reflect what the data tell the forecasters regarding the most likely outcome, scenarios or sometimes a range of outcomes under different assumptions, in terms of future sales, market potential or trends for a product brand or product line. The combination of management judgment and other methods often leads to the use of either of two mathematical approaches to determine the ultimate numbers: the chain ratio calculation or the use of indices . See Exhibits 5.3 and 5.4 for examples applying these mathematical calculations to arrive at sales forecasts. Both mathematical approaches begin with an estimate of market potential (the number of households in the target market in Exhibit 5.3; the national market potential for a product category in Exhibit 5.4). The market potential is then multiplied by various fractional factors which, taken together, predict the portion of the overall market potential that one business or product can expect to obtain. In Exhibit 5.3, which shows the more detailed approach, the factors reflect the appeal of the product to consumers, as measured by marketing research data, and the business’s planned marketing program.
Strategic issue
The use of test markets has declined over the past few decades, but the use of internet-based technique has increased.
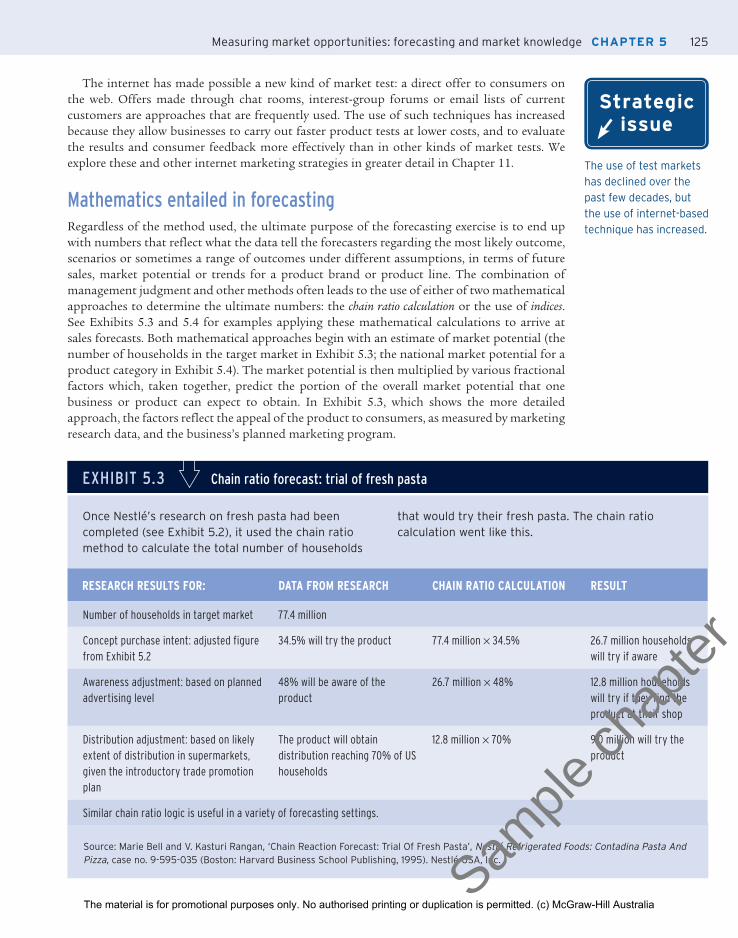
EXHIBIT 5.3 Chain ratio forecast: trial of fresh pasta
Once Nestlé’s research on fresh pasta had been completed (see Exhibit 5.2), it used the chain ratio method to calculate the total number of households
that would try their fresh pasta. The chain ratio calculation went like this.
Source: Marie Bell and V. Kasturi Rangan, ‘Chain Reaction Forecast: Trial Of Fresh Pasta’, Nestlé Refrigerated Foods: Contadina Pasta And Pizza , case no. 9-595-035 (Boston: Harvard Business School Publishing, 1995). Nestlé USA, Inc.
RESEARCH RESULTS FOR: DATA FROM RESEARCH CHAIN RATIO CALCULATION RESULT
Number of households in target market 77.4 million
Concept purchase intent: adjusted figure from Exhibit 5.2
34.5% will try the product 77.4 million × 34.5% 26.7 million households will try if aware
Awareness adjustment: based on planned advertising level
48% will be aware of the product
26.7 million × 48% 12.8 million households will try if they find the product at their shop
Distribution adjustment: based on likely extent of distribution in supermarkets, given the introductory trade promotion plan
The product will obtain distribution reaching 70% of US households
12.8 million × 70% 9.0 million will try the product
Similar chain ratio logic is useful in a variety of forecasting settings.
Walker Chapter 05.indd Sec1:125Walker Chapter 05.indd Sec1:125 2011-05-14 6:52:00 AM2011-05-14 6:52:00 AM
The material is for promotional purposes only. No authorised printing or duplication is permitted. (c) McGraw-Hill AustraliaSam
ple ch
apter

PART 1PART 1
126 Opportunity analysisPART 5PART 4PART 3PART 2
RATE OF DIFFUSION OF INNOVATIONS: ANOTHER PERSPECTIVE ON FORECASTING Before entrepreneurs or established marketers invest in the development and introduction of an innovation, they want to know how rapidly the innovation is likely to be adopted by the target market. The faster the adoption rate, the faster the rate at which the innovative new product’s sales will ramp up. Diffusion of innovation theory seeks to explain the adoption of an innovative product or service over time among a group of potential buyers. Lack of awareness and limited distribution typically limit early adoption. As positive word about the product spreads, the product is adopted by additional consumers. Diffusion theory is useful to managers in predicting the likely adoption rate for new and innovative goods or services.
The adoption process The adoption process involves the attitudinal changes experienced by individuals from the time they first hear about a new product, service or idea, until they adopt it. Not all individuals respond alike; some tend to adopt early, some late and some never. The five stages in the adop-tion process are awareness, interest, evaluation, trial and adoption.
Strategic issue
Diffusion theory is useful to managers in predicting the likely adoption rate for new and innovative goods or services.
EXHIBIT 5.4 Estimating market potential using indices
In many countries there are published indices of buying behaviour, including the Annual Survey of Buying Power published by Sales and Marketing Management in the United States. In Australia and New Zealand, O&M Horizons consultants conduct extensive surveys using the VALS (values and lifestyles, http://www.strategicbusinessinsights.com/vals/presurvey.shtml) international survey to understand and estimate different segments’ needs and market potentials. ACNielsen Homescan (http://au.acnielsen.com/site/index.shtml) is another business demand monitor, using panel service data to understand and predict demand for products and services in Australia.
The Buying Power Index (BPI) is a weighted sum of a geographical area’s percentage of national buying power for the area, based on Census income data (weight = 0.5), plus the percentage of national retail sales for the area (weight = 0.3), plus the percentage of national population located in the area (weight = 0.2). If this calculation comes to 3.50 for a given state or region, one might expect 3.5% of sales in a given category (e.g. toys, power tools) to come from that geographical area.
Category development indices (CDIs) are similar indices that report the ratio of consumption in a certain category (e.g. restaurant sales) to population in a defined geographical area. Trade associations or trade magazines relevant to the category typically publish such indices. Ratios greater than 1.0 for a particular geographic area, such as for a particular city, indicate that the area does more business than average (compared to the country as a whole) in that category. Brand development indices (BDIs) compare sales for a given brand (e.g. Pizza Hut restaurants) to population. Businesses that use BDI indices typically calculate them for their own use. The ratio of the BDI to the CDI for a given area is an indicator of how well a brand is doing, compared to its category overall, in that area. These various indices are useful for estimating market potential in defined geographic areas. They are, however, crude numbers, in that they do not consider differences in consumer behaviour from region to region. For example, the CDI or BDI for surfboards on the Gold Coast is far higher than in Alice Springs. Attempting to rectify this imbalance by increasing the surfboard advertising budget in Alice Springs would be difficult!
Walker Chapter 05.indd Sec1:126Walker Chapter 05.indd Sec1:126 2011-05-14 6:52:00 AM2011-05-14 6:52:00 AM
The material is for promotional purposes only. No authorised printing or duplication is permitted. (c) McGraw-Hill AustraliaSam
ple ch
apter

127Measuring market opportunities: forecasting and market knowledge CHAPTER 5
1. Awareness . In this stage, the person is only aware of the existence of the new product and is insufficiently motivated to seek information about it.
2. Interest . Here the individual becomes sufficiently interested in the new product but is not yet involved.
3. Evaluation . This is sometimes referred to as the mental rehearsal stage. At this point, the individual is mentally applying the new product to his or her own use requirements and anticipating the results.
4. Trial . Here the individual actually uses the product but, if possible, on a limited basis to minimise risk. Trial is not tantamount to adoption; only if the use experience is satisfactory will the product stand a chance of being adopted.
5. Adoption . In this stage, the individual not only continues to use the new product but also adopts it in lieu of substitutes.
The rate of adoption If plotted on a cumulative basis, the percentage of people adopting a new product over time resembles an S-shaped curve. Although the curve tends to have the same shape regardless of the product involved, the length of time required differs among products—often substantially.
The time dimension is a function of the rate at which people in the target group (those ultimately adopting) move through the five stages in the adoption process. Generally, the speed of the adoption process depends heavily on: (1) the risk (cost of product failure or dis-satisfaction); (2) the relative advantage over other products; (3) the relative simplicity of the new product; (4) its compatibility with previously adopted ideas and behaviour; (5) the extent to which its trial can be accomplished on a small-scale basis; and (6) the ease with which the central idea of the new product can be communicated. 16 Some new products move quickly through the adoption process (e.g. a new breakfast cereal), while others take years. Risk mini-misation in the form of guarantees and reliable and prompt service can be critical, as can the ability to demonstrate the product’s uniqueness in meeting the customer’s needs. Source credibility is also important and the influence of more informed consumer groups, such as market mavens, can accelerate the levels of awareness and the diffusion process between various market segments.
The rate at which an innovative new product category passes through the adoption process is also a function of the actions taken by the product’s marketers. Thus, the diffusion process is faster when there is strong competition among competitors, when they have favourable reputa-tions and when they allocate substantial sums to research and development (R&D) (to improve performance) and to marketing (to build awareness). 17 Early mobile phones scored high on most of the key adoption factors.
New product consumer adopter categories Early adopters differ from later adopters because they tend to share some of the characteristics of the innovators, opinion leaders and market mavens. Using time of adoption as a basis for classify-ing individuals, five major groups can be distinguished: innovators, early adopters, early majority, late majority and laggards. (Note that these are different from the five stages of adoption for a given individual just discussed.) See Exhibit 5.5 for the approximate size and characteristics of each group. 18 Because each category comprises individuals who have similar characteristics, and because individuals differ substantially across categories, these adopter groups can be considered market segments. Thus, one would use a different set of strategies to market a new product to the early adopter group than to market it to the late majority group. For a discussion of the challenges in transitioning marketing efforts from group to group, see Exhibit 5.6.
Strategic issue
Some new products move quickly through the adoption process (e.g. a new breakfast cereal), while others take years.
Walker Chapter 05.indd Sec1:127Walker Chapter 05.indd Sec1:127 2011-05-14 6:52:00 AM2011-05-14 6:52:00 AM
The material is for promotional purposes only. No authorised printing or duplication is permitted. (c) McGraw-Hill AustraliaSam
ple ch
apter

PART 1PART 1
128 Opportunity analysisPART 5PART 4PART 3PART 2
The differences cited in Exhibits 5.5 and 5.6 are important because they help in the develop-ment of strategic marketing programs. In organisational markets, suppliers can identify innovative businesses by reputation, profitability, size and the suppliers’ experiences in dealing with them. As is evident from the earlier discussion, information alone about the product or service is not usually a sufficient reason to adopt. Commercial sources of information (such as salespeople and mass media advertising) are important at the outset, but less-commercial and more-professional sources are sought to validate the proclaimed merits of the new product, especially during the evaluation stage. Advice from opinion leaders and market mavens is more critical as a legitimising agent than as a source of information. A classic study of how doctors reacted to the introduction of a new ‘miracle drug’ found that only 10 per cent adopted it on the basis of data provided by their initial source of information, indicating that data alone will not cause adoption. 19
EXHIBIT 5.5 Size and characteristics of individual adopter groups
Innovators ➤ represent the first 2.5 per cent of all individuals who ultimately adopt a new product. They are more venturesome than later adopters, more likely to be receptive to new ideas and tend to have high incomes, which reduces the risk of loss arising from an early adoption. Early adopters ➤ represent the next 13–14 per cent who adopt. They are more a part of the local scene, are often opinion leaders and market mavens, serve as vital links to members of the early majority group (because of their social proximity) and participate more in community organisations than do later adopters. The ➤ early majority includes 34 per cent of those who adopt. These individuals display less leadership than early adopters, tend to be active in community
affairs (thereby gaining respect from their peers), do not like to take unnecessary risks and want to be sure that a new product will prove successful before they adopt it. The ➤ late majority represents another 34 per cent. Frequently, these individuals adopt a new product because they are forced to do so for either economic or social reasons. They participate in community activities less than the previous groups and only rarely assume a leadership role. ➤ Laggards comprise the last 16 per cent of adopters. Of all the adopters, they are the most ‘local’. They participate less in community matters than members of the other groups and stubbornly resist change. In some cases, their adoption of a product is so late it has already been replaced by another new product.
EXHIBIT 5.6 Crossing the chasm: a difficult transition in the diffusion process
In Geoffrey Moore’s classic book on the marketing of high-technology products, Moore explores the challenges of crossing the ‘chasm’, as he calls it, in the diffusion process between the early adopters and the early majority. For many high-technology products, innovators and early adopters have quite different needs from early majority customers. They are often willing to adopt a revolutionary new product that is not yet very user-friendly or whose product features have not yet been fully developed. Their own technical skill enables them to adapt such a product to their needs and resolve some of
the uncertainties inherent in the product’s perhaps still-unclear potential. Their self-perception as an innovator gives them comfort in trying new products before others do. Early majority buyers, on the other hand, typically require easier-to-use products, whose benefits are clearly defined, and for which there is proof that the product will perform. Taking a product from the first group of buyers to the second is a difficult challenge, one that is compounded by the fact that buyers in the innovator and early adopter groups are not likely to associate or talk with buyers in the early majority group.
Source: Geoffrey A. Moore, Crossing the Chasm (New York: HarperCollins, 1991).
Walker Chapter 05.indd Sec1:128Walker Chapter 05.indd Sec1:128 2011-05-14 6:52:00 AM2011-05-14 6:52:00 AM
The material is for promotional purposes only. No authorised printing or duplication is permitted. (c) McGraw-Hill AustraliaSam
ple ch
apter
129Measuring market opportunities: forecasting and market knowledge CHAPTER 5
Thus, commercial sources are most important at the awareness stage in the adoption process, while personal and interpersonal influences are most important at the evaluation stage. In the interest stage, both are important. In the trial stage, marketers should attempt to make it relatively easy for a prospect to try a product under conditions that minimise risk. Therefore, strategic marketing programs should accommodate the various stages in the adoption process as well as the different adoption audiences.
Implications of diffusion of innovation theory for forecasting sales of new products and new businesses Optimistic entrepreneurs or new product managers sometimes wax euphoric about the prospects for the innovations they plan to bring to market. They naively forecast that their innovations will capture 10 per cent or 20 per cent of the market in its first year. How likely is it that a truly innovative new product, even a compellingly attractive one, will win all of the innovators plus most of the early adopters in its first year on the market? History suggests that such penetration levels are rare at the outset. More typically, first-year penetration levels include some but not all of the innovators, well under 2.5 per cent of those who, it is hoped, will ultimately adopt!
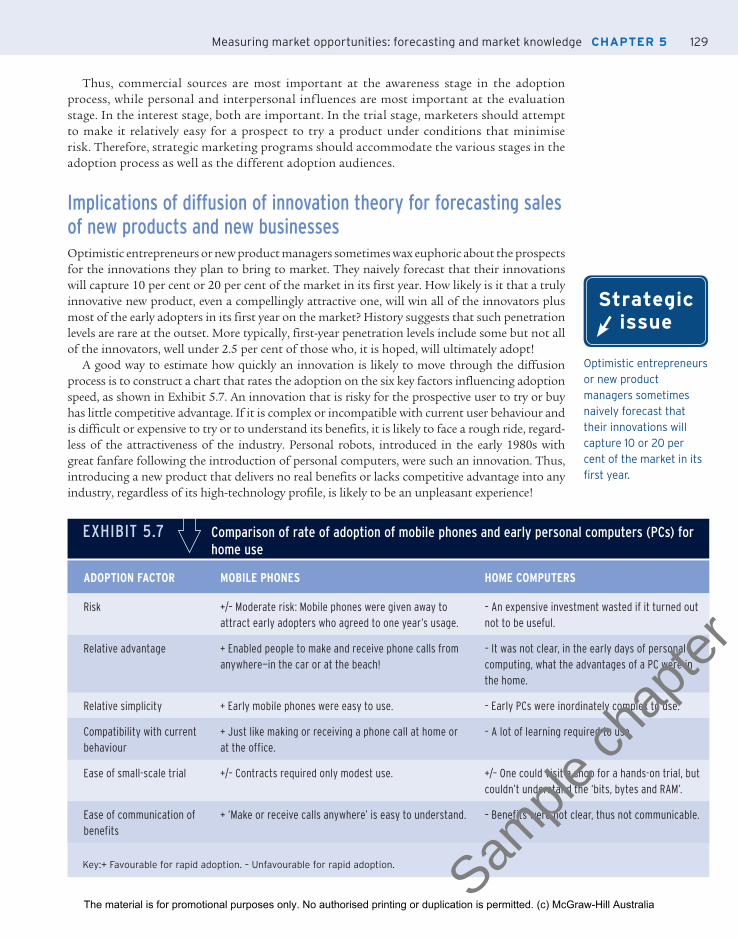
A good way to estimate how quickly an innovation is likely to move through the diffusion process is to construct a chart that rates the adoption on the six key factors influencing adoption speed, as shown in Exhibit 5.7. An innovation that is risky for the prospective user to try or buy has little competitive advantage. If it is complex or incompatible with current user behaviour and is difficult or expensive to try or to understand its benefits, it is likely to face a rough ride, regard-less of the attractiveness of the industry. Personal robots, introduced in the early 1980s with great fanfare following the introduction of personal computers, were such an innovation. Thus, introducing a new product that delivers no real benefits or lacks competitive advantage into any industry, regardless of its high-technology profile, is likely to be an unpleasant experience!
Strategic issue
Optimistic entrepreneurs or new product managers sometimes naively forecast that their innovations will capture 10 or 20 per cent of the market in its fi rst year.
EXHIBIT 5.7 Comparison of rate of adoption of mobile phones and early personal computers (PCs) for home use
ADOPTION FACTOR MOBILE PHONES HOME COMPUTERS
Risk +/– Moderate risk: Mobile phones were given away to attract early adopters who agreed to one year’s usage.
– An expensive investment wasted if it turned out not to be useful.
Relative advantage + Enabled people to make and receive phone calls from anywhere—in the car or at the beach!
– It was not clear, in the early days of personal computing, what the advantages of a PC were in the home.
Relative simplicity + Early mobile phones were easy to use. – Early PCs were inordinately complex to use.
Compatibility with current behaviour
+ Just like making or receiving a phone call at home or at the office.
– A lot of learning required to use.
Ease of small-scale trial +/– Contracts required only modest use. +/– One could visit a shop for a hands-on trial, but couldn’t understand the ‘bits, bytes and RAM’.
Ease of communication of benefits
+ ‘Make or receive calls anywhere’ is easy to understand. – Benefits were not clear, thus not communicable.
Key:+ Favourable for rapid adoption. – Unfavourable for rapid adoption.
Walker Chapter 05.indd Sec1:129Walker Chapter 05.indd Sec1:129 2011-05-14 6:52:00 AM2011-05-14 6:52:00 AM
The material is for promotional purposes only. No authorised printing or duplication is permitted. (c) McGraw-Hill AustraliaSam
ple ch
apter

PART 1PART 1
130 Opportunity analysisPART 5PART 4PART 3PART 2
CAUTIONS AND CAVEATS IN FORECASTING Keys to good forecasting There are two important keys to improving the credibility and accuracy of forecasts of sales and market potential. The first is to make explicit the assumptions on which the forecast is based. This way, if there is debate or doubt about the forecast, the assumptions can be debated, and data to support the assumptions can be obtained. The resulting conversation is far more use-ful than stating mere opinions about whether the forecast is too high or too low. For Telstra, the combination of observational and survey forecasting methods enabled the organisation to articulate the assumptions on which their revenue forecasts were based, and to support those assumptions with data. Evidence-based forecasting is instrumental in an organisation obtain-ing start-up capital to get their venture off the ground.
The second key to effective forecasting is to use multiple methods. When forecasts obtained by different methods converge near a common figure, greater confidence can be placed in that figure. The procedure used at Gap Inc. to forecast next-year sales (see Exhibit 5.1) is an example of such an approach. Where forecasts obtained by multiple methods diverge, the assumptions inherent in each can be examined to determine which set of assumptions can best be trusted. Ultimately, however, any forecast is almost certainly wrong. Contingency plans should be devel-oped to cope with the reality that ultimately unfolds. 20
Common sources of error in forecasting Several sources of potential error in forecasts should be recognised. Firstly, forecasters are sub-ject to anchoring bias , where forecasts are perhaps inappropriately ‘anchored’ in recent historical figures, even though market conditions have markedly changed, for better or worse. 21
Secondly, capacity constraints are sometimes misinterpreted as forecasts. For example, someone planning to open a car wash that can process one car every seven minutes would probably be optimistic in assuming sufficient demand to actually run at that rate all the time. A restaurant chain that is able to turn its tables 2.5 times each night, on average, must still do local market research to ascertain how much volume a new restaurant will really produce. Putting two similar 80-table restaurants in two trade areas with different population make-ups and densities, with different levels of competition, will result in varying sales levels.
Another source of bias in forecasting is incentive pay . Bonus plans can cause managers to artificially inflate or deflate forecasts, whether intentionally or otherwise. ‘Sandbagging’—setting the forecast or target at an easily achievable figure in order to earn bonuses when that figure is beaten—is common. Finally, unstated but implicit assumptions can overstate a well-intentioned forecast. While 34.5 per cent of those surveyed (after adjustments, as shown in Exhibit 5.2) might indicate their willingness to buy a new grocery product, such as fresh pasta, for such a forecast to pan out requires that consumers actually are made aware of the new product when it is introduced, and that the product can actually be found on supermarket shelves. Assumptions of awareness and distribution coverage at levels less than 100 per cent, depending on the nature of the planned marketing program for the product, should be applied to such a forecast, using the chain ratio method (see Exhibit 5.3).
WHY DATA? WHY MARKET KNOWLEDGE? In the first portion of this chapter, we provided several approaches to forecasting, each of which requires that data be collected. Similarly, the first four chapters of this book provide frame-works for gaining a better understanding of market and competitive conditions and of what buyers in a given market want and need—what we call market intelligence or market knowledge . 22 Obtaining market knowledge also requires data, and so far we’ve provided little discussion of
Strategic issue
There are two important keys to improving the credibility and accuracy of forecasts of sales and market potential.
Strategic issue
Capacity constraints are sometimes misinterpreted as forecasts.
Walker Chapter 05.indd Sec1:130Walker Chapter 05.indd Sec1:130 2011-05-14 6:52:00 AM2011-05-14 6:52:00 AM
The material is for promotional purposes only. No authorised printing or duplication is permitted. (c) McGraw-Hill AustraliaSam
ple ch
apter

131Measuring market opportunities: forecasting and market knowledge CHAPTER 5
exactly how one might best find the necessary data. Without relevant, reliable, valid and timely data, market knowledge is generally incomplete and often ill-informed, based perhaps on hunches or intuition that may or may not be correct.
Without adequate market knowledge, marketing decisions are likely to be misguided. Products for which there is little demand may be introduced, only to subsequently fail. New markets may be entered, despite market or industry conditions that make success unlikely. Attractive product markets may be overlooked. Products may be marketed to the wrong target market, when consum-ers in another market segment would like the product better. Pricing may be too high, reducing sales, or too low, leaving money on the table. Advertising and promotion monies may be poorly spent. Second-best distribution channels may be chosen. These outcomes are all too common. Most often, they result from ill- or under-informed marketing decisions. Thoughtfully designed, competently executed marketing research can mitigate the chances of such unpleasant outcomes.
Thus, in the remainder of this chapter we address the challenge of obtaining market knowl-edge, including the development of systems to track pertinent market information inside and outside the business, as well as the design and implementation of more targeted studies intended to collect information about a particular marketing problem. We begin by discussing the principal kinds of market knowledge systems used in businesses large and small, and we show how such systems can improve the timeliness and quality of marketing decisions.
MARKET INTELLIGENCE AND KNOWLEDGE SYSTEMS: CHARTING A PATH TOWARDS COMPETITIVE ADVANTAGE Marketing is rapidly becoming a game where information, rather than raw marketing muscle and resources, wins the race for competitive advantage. There are four commonly used market knowledge systems on which businesses rely to keep pace with daily developments: internal records regarding marketing performance in terms of sales and the effectiveness and efficiency of marketing programs; marketing databases; competitive intelligence systems; and systems to organise client contact. Effective use of such systems is likely to result in happier, higher volume, more loyal customers. Few of these systems existed in their current form until develop-ments in data processing and data transmission made them cost effective.
Internal marketing information systems Every Monday morning, each retail store director at the headquarters of Nine West Retail Stores, an international operator of shoe specialty stores, receives the ‘Godzilla Report’, a tabu-lation of detailed sales and inventory information about the fastest-selling items in Nine West stores from the previous week. 23 By style and colour, each director can see which items in his or her stores are selling fast and need to be reordered. A similar report provides information about all other styles currently in Nine West’s stores, so that slow sellers can be marked down or transferred to stores where those styles are in higher demand. Additional reports aggregate sales information by style and colour; by merchandise category (e.g. dress or casual); store, area or region; and for various time periods. The information provided by these reports constitutes the backbone of Nine West’s decision making about which shoes to offer in which of its stores. The same process occurs in all types of retail industries, whether independently owned outlets, chain stores or franchises. Every Coles supermarket manager in Australia is aware of the pre-vious week’s sales and of the market trends of all other stores throughout their state, with a detailed breakdown of which products are doing well and which are not. Imagine how much more difficult a retail director’s job would be without today’s point-of-sale systems to collect and report such data daily to so many decision-makers! And imagine the potential advantage
Strategic issue
Marketing is rapidly becoming a game where information, rather than raw marketing muscle and resources, wins the race for competitive advantage.
Walker Chapter 05.indd Sec1:131Walker Chapter 05.indd Sec1:131 2011-05-14 6:52:00 AM2011-05-14 6:52:00 AM
The material is for promotional purposes only. No authorised printing or duplication is permitted. (c) McGraw-Hill AustraliaSam
ple ch
apter

PART 1PART 1
132 Opportunity analysisPART 5PART 4PART 3PART 2
of well-organised internal marketing information systems to retailers such as David Jones, the Body Shop and Coles over other retailers who lack such precise market and sales information.
Every marketer, not just retailers, needs information about ‘what’s hot and what’s not’. Unfortunately, accounting systems generally do not collect such data. Typically, such systems just track dollars of revenue, with no information about which goods or services were sold. Thus, marketers need effective internal marketing information systems to track what is selling, how fast, in which locations, to which customers and so on. Providing input on the design of such systems so that the right data are provided to the right people at the right time is a critical marketing responsibility in any business. But what constitutes critical marketing information varies from business to business and industry to industry.
Nine West retail directors need to know which styles and colours are selling, in which stores, at what rate. Coles and Walmart believe that key suppliers need to know their store-by-store item and category sales data, so they provide password-protected online access to such data to those suppliers. Telemarketing businesses need to know which callers are pro-ducing sales, at what times of day, for which products. Marketers of kitchen gadgets through infomercials on late-night television need to know which advertisements on which stations in which cities are performing, in order to place media spending where it will be most produc-tive. Businesses selling their wares to industrial markets through outside sales forces need to know not only which products are selling to which customers, but also which salespeople are selling how much, at what margins and expense rates, to whom. The sales force, too, needs information about the status of current orders, customer purchasing history and so on.
For those responsible for developing or updating internal marketing intelligence record systems in their businesses, we provide, in Exhibit 5.8, a series of questions to help marketing decision-makers specify what internally generated sales data are needed, when, for whom, in what sequence, and at what level of aggregation.
Strategic issue
Every marketer, not just retailers, needs information about ‘what’s hot and what’s not’. Unfortunately, accounting systems generally do not collect such data.
EXHIBIT 5.8 Designing an internal marketing intelligence records system for marketing decision-makers
QUESTIONS TO ASK IMPLICATIONS FOR A CHAIN FOOTWEAR RETAILER
IMPLICATIONS FOR AN INFOMERCIAL MARKETER OF KITCHEN GADGETS
What information is key to providing our customers with what they want?
Need to know which shoes sell, in which stores and markets, at what rate.
Need to know which gadgets sell, in what markets, at what rate.
What regular marketing decisions are critical to our profitability?
Deciding which shoes and shoe categories to buy more of, which to buy less of or get rid of, in which stores and markets to sell them.
Deciding which TV stations, programs and times of day to place infomercials for which gadgets.
What data are critical to managing profitability?
Inventory turnover and gross margin. Contribution margin (gross margin less media cost) per gadget sold.
Who needs to know? Buyers and managers of merchandise categories.
Media buyers, product managers.
When do they need to know, for competitive advantage?
For hottest sellers, they need to know before competitors, to beat them to the reorder market. For dogs, need to know weekly, to mark them down.
Need to know daily, for prior night’s advertisements, to reallocate media dollars.
In what sequence and at what level of aggregation should data be reported?
Sequence of report: hot sellers first, in order of inventory turnover. Aggregation: by style and colour for buyers, by category for merchandise managers
Sequence of report: hot stations/programs first, in order of contribution margin per gadget sold. Aggregation: By stations/programs for media buyers, by gadget for product managers.
Walker Chapter 05.indd Sec1:132Walker Chapter 05.indd Sec1:132 2011-05-14 6:52:00 AM2011-05-14 6:52:00 AM
The material is for promotional purposes only. No authorised printing or duplication is permitted. (c) McGraw-Hill AustraliaSam
ple ch
apter
133Measuring market opportunities: forecasting and market knowledge CHAPTER 5
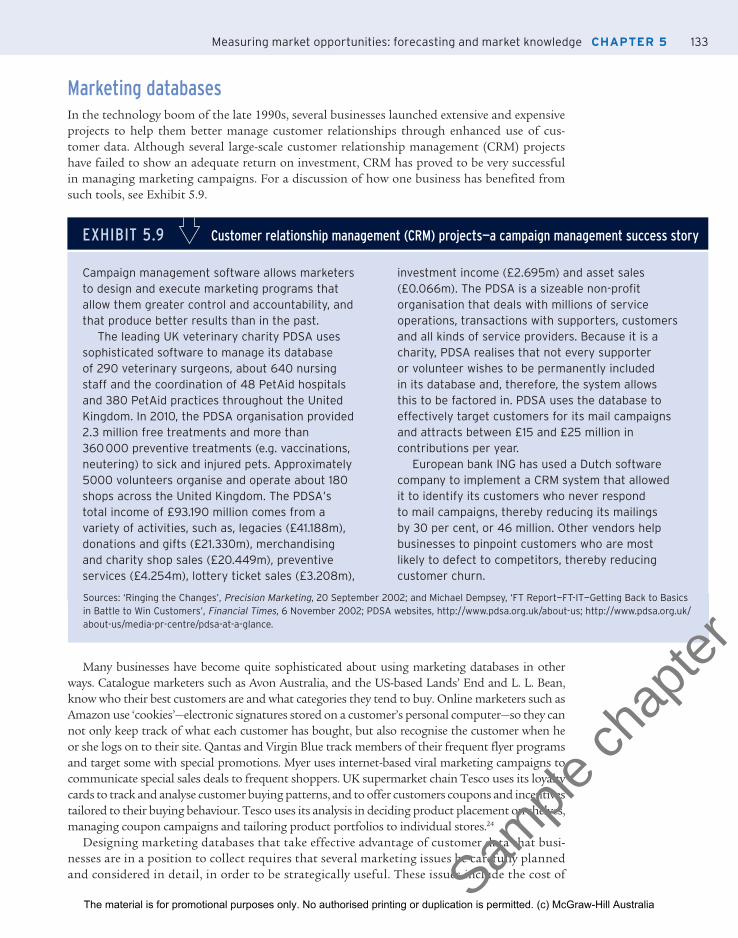
Marketing databases In the technology boom of the late 1990s, several businesses launched extensive and expensive projects to help them better manage customer relationships through enhanced use of cus-tomer data. Although several large-scale customer relationship management (CRM) projects have failed to show an adequate return on investment, CRM has proved to be very successful in managing marketing campaigns. For a discussion of how one business has benefited from such tools, see Exhibit 5.9.
EXHIBIT 5.9 Customer relationship management (CRM) projects—a campaign management success story
Campaign management software allows marketers to design and execute marketing programs that allow them greater control and accountability, and that produce better results than in the past.
The leading UK veterinary charity PDSA uses sophisticated software to manage its database of 290 veterinary surgeons, about 640 nursing staff and the coordination of 48 PetAid hospitals and 380 PetAid practices throughout the United Kingdom. In 2010, the PDSA organisation provided 2.3 million free treatments and more than 360 000 preventive treatments (e.g. vaccinations, neutering) to sick and injured pets. Approximately 5000 volunteers organise and operate about 180 shops across the United Kingdom. The PDSA’s total income of £93.190 million comes from a variety of activities, such as, legacies (£41.188m), donations and gifts (£21.330m), merchandising and charity shop sales (£20.449m), preventive services (£4.254m), lottery ticket sales (£3.208m),
investment income (£2.695m) and asset sales (£0.066m). The PDSA is a sizeable non-profit organisation that deals with millions of service operations, transactions with supporters, customers and all kinds of service providers. Because it is a charity, PDSA realises that not every supporter or volunteer wishes to be permanently included in its database and, therefore, the system allows this to be factored in. PDSA uses the database to effectively target customers for its mail campaigns and attracts between £15 and £25 million in contributions per year.
European bank ING has used a Dutch software company to implement a CRM system that allowed it to identify its customers who never respond to mail campaigns, thereby reducing its mailings by 30 per cent, or 46 million. Other vendors help businesses to pinpoint customers who are most likely to defect to competitors, thereby reducing customer churn.
Sources: ‘Ringing the Changes’, Precision Marketing , 20 September 2002; and Michael Dempsey, ‘FT Report—FT-IT—Getting Back to Basics in Battle to Win Customers’, Financial Times , 6 November 2002; PDSA websites, http://www.pdsa.org.uk/about-us; http://www.pdsa.org.uk/about-us/media-pr-centre/pdsa-at-a-glance.
Many businesses have become quite sophisticated about using marketing databases in other ways. Catalogue marketers such as Avon Australia, and the US-based Lands’ End and L. L. Bean, know who their best customers are and what categories they tend to buy. Online marketers such as Amazon use ‘cookies’—electronic signatures stored on a customer’s personal computer—so they can not only keep track of what each customer has bought, but also recognise the customer when he or she logs on to their site. Qantas and Virgin Blue track members of their frequent flyer programs and target some with special promotions. Myer uses internet-based viral marketing campaigns to communicate special sales deals to frequent shoppers. UK supermarket chain Tesco uses its loyalty cards to track and analyse customer buying patterns, and to offer customers coupons and incentives tailored to their buying behaviour. Tesco uses its analysis in deciding product placement on shelves, managing coupon campaigns and tailoring product portfolios to individual stores. 24
Designing marketing databases that take effective advantage of customer data that busi-nesses are in a position to collect requires that several marketing issues be carefully planned and considered in detail, in order to be strategically useful. These issues include the cost of
Walker Chapter 05.indd Sec1:133Walker Chapter 05.indd Sec1:133 2011-05-14 6:52:00 AM2011-05-14 6:52:00 AM
The material is for promotional purposes only. No authorised printing or duplication is permitted. (c) McGraw-Hill AustraliaSam
ple ch
apter
PART 1PART 1
134 Opportunity analysisPART 5PART 4PART 3PART 2
collecting the data, the economic benefits of using the data, the ability of the business to keep the data current and relevant in today’s mobile society and the rapid advances in technology that permit the data to be used to maximum advantage.
Collecting market intelligence information, then storing it and maintaining it to keep it up to date, always costs money. If a business wants to know more about the demographic and lifestyle factors of its best customers, in addition to their purchasing histories, it must obtain demographic, psychographic and lifestyle data about them. Doing this is more difficult than it sounds; most people are unwilling to spend much time filling out forms that ask nosy questions about education, income, whether they play tennis and what kind of car they drive. The cost of collecting such information must be weighed against its value. What will be done with the information once it is in hand?
Various commercial marketing databases are available, with varying depths and quality of information. For example, Pacific Micromarketing in Australia (www.pacmicro.com.au) collects extensive geodemographic and lifestyle data based on Census surveys, and sells this information to commercial businesses interested in targeting specific markets in Australia and overseas. In the United States, the Polk Company (www.Polk.com) sells data compiled from state driver’s licence records, as well as a demographic and lifestyle database compiled from questionnaires returned with warranty cards for consumer durables such as toasters, stereos and so on. Also in the United States, the Dex One Corporation (http://www.dexone.com/) covers more than 150 million individual US consumers and 90 million US households, and includes more than 1600 demographic, lifestyle, purchasing power and creditworthiness variables, among others. The Nielsen Claritas PRIZM (Potential Rating Index for Zip Markets) service (http://www.nielsen.com/us/en.html) classifies US consumers into one of 62 distinct demographic and behavioural clusters according to the zip (postal) code and postal carrier route where they live. For the UK market, geodemographic databases can be purchased from CACI, 25 known for its ACORN database, and Experian, 26 which offers its MOSAIC database. These databases are useful tools for targeting consumers based on the area they live in. An important caveat for all geodemographic databases, however, is that the accuracy of the data decreases as the granularity of the area increases; that is, customers may share the same post-code, but may belong to very disparate psychographic segments, which may have the same income but totally different needs and personality self-image preferences.
Many businesses that sell to or deal directly with consumers, such as credit-card issuers, magazine publishers and customer affinity or membership groups, maximise the usefulness of their databases by selling their customer databases. Marketers who consider buying such lists or other services from commercial database providers should enquire exactly how, where and when the data were collected. The reliability and accuracy of the data should be verified—for example, have 20 per cent of the people on the list moved to another address or job in the five years since the data were collected? The relative costs between databases should also be com-pared. Databases containing names of customers as well as information about their lifestyles and psychographic preferences are more informative and helpful in constructing differenti-ated market segments. A higher cost per record (per person listed in the database) is justifiable if each record includes a higher rate of market reach, which could be expected to produce higher sales value for target marketers. Direct marketing and target marketing campaigns are notoriously difficult, and response rates usually very low, so the availability of good-quality psy-chographic information is important as it is likely to achieve higher responses than databases of names taken, for example, from the telephone directory or from vehicle registration records. Marketers planning to build their own databases need also to consider several increasingly important ethical issues, as discussed in Ethical Perspective 5.1.
For businesses with deep pockets, advances in computing power and database technology, including new data-mining technology, 27 are allowing businesses to combine databases from different sources to enable a more complete understanding of any member of the database. Keeping current with what is possible in database technology is important as technological advances often make possible that which was only a dream a short time ago.
Strategic issue
Designing marketing databases that take effective advantage of customer data that businesses are in a position to collect requires that several marketing issues be carefully planned and considered.
Walker Chapter 05.indd Sec1:134Walker Chapter 05.indd Sec1:134 2011-05-14 6:52:00 AM2011-05-14 6:52:00 AM
The material is for promotional purposes only. No authorised printing or duplication is permitted. (c) McGraw-Hill AustraliaSam
ple ch
apter

135Measuring market opportunities: forecasting and market knowledge CHAPTER 5
Ethical Issues in Database Marketing, Internet Marketing and Marketing Research
New technologies relating to the gathering and use of information about consumers and their behaviour, interests and intentions raise a number of legal and ethical questions. These new technologies have the potential to harm individuals when such information ‘is used without their knowledge and/or consent, leading them to be excluded from or included in activities in such a way that they are harmed economically, psychologically or physically’. Examples include the improper disclosure of a person’s credit rating, denying medical insurance to an individual based on confidential information and a person’s being placed on target lists for direct mail and telemarketing. In Australia, a ‘Do Not Call Register’ has been introduced and businesses are now obliged by law to refrain from direct calling people listed on this register. The depth of privacy concerns varies from country to country, a critical issue for internet marketers, given their global reach.
Ethical issues in marketing research stem, in large part, from the interaction between the researcher and respondents, clients and the general public. For instance, respondents should not be pressured to participate, should have the right to remain anonymous and should not be deceived by fake sponsorship.
Client issues involve the confidentiality of the research findings and the obligation to strive to provide unbiased and honest results regardless of client expectations. The public is very much involved when they are exposed to a sales solicitation disguised as a marketing research study or issuing from data obtained from ‘volunteer surveys’ using write-ins or call-ins.
In discussing the reliability of, and ethical issues involved with, marketing research studies, a Wall Street Journal article noted that many studies ‘are little more than vehicles for pitching a product or opinion. An examination of hundreds of recent studies indicated that the business of research has become pervaded by bias and distortion. More studies are being sponsored by businesses or groups with a financial interest in the results. This too often leads to a bias in the way questions are asked.’
Because of shortages in time and money, sample sizes are being reduced to the point that, when groups are further broken into subgroups, the margin of error becomes unacceptable—assuming a probability sample was used. In addition to sample size, the way the sampling universe is defined can bias the results. Thus, in a Chrysler study showing that people preferred Chrysler’s cars to Toyota’s, a sample of only 100 US respondents was used in each of two tests, and none owned a foreign car. Thus, the respondents may well have been biased in favour of US cars.
In addition to the problems noted above, subjective sampling procedures are often used, data analysis may be flawed, or only the best conclusions are reported. Frequently, researchers are hired whose views on the subject area being researched are known to be similar to those of the client. In an attempt to regulate the marketing research industry, several codes of conduct and ethics have been developed. For the United States, these include published codes produced by the American Marketing Association, the American Association for Public Opinion Research, the Marketing Research Association and the Council of American Survey Research Organizations. In the United Kingdom, the Market Research Society (http://www.mrs.org.uk/) has developed an ethical Code of Conduct that all members are required to adhere to. Similar organisations have developed more locally relevant guidelines in other countries. In Australia, the Australian Market and Social Research Society (AMSRS) has equivalent stringent ethical rules that safeguard and govern the conduct of all market research business’s activities.
Sources: Paul N. Bloom, Robert Adler and George R. Milne, ‘Identifying the Legal and Ethical Risks and Costs of Using New Information Technologies to Support Marketing Programs’, in The Marketing Information Revolution , Robert C. Blattberg, Rashi Glazer and John D. C. Little, eds (Boston: Harvard Business School Press, 1994), p. 294; Cynthia Crossen, ‘Studies Galore Support Products and Positions, But Are They Reliable?’, The Wall Street Journal , 14 November 1991, pp. A1 and A8; and Thomas E. Weber, ‘Europe and U.S. Reach Truce on Net Privacy, But What Comes Next?’, The Wall Street Journal , 19 June 2000, p. B1.
ETHICAL PERSPECTIVE
5.1
Walker Chapter 05.indd Sec1:135Walker Chapter 05.indd Sec1:135 2011-05-14 6:52:01 AM2011-05-14 6:52:01 AM
The material is for promotional purposes only. No authorised printing or duplication is permitted. (c) McGraw-Hill AustraliaSam
ple ch
apter

PART 1PART 1
136 Opportunity analysisPART 5PART 4PART 3PART 2
Competitive intelligence systems 28 In today’s fast-paced business climate, keeping up with competitors and the changing macro environment is no easy task. Competitive intelligence (CI) is a systematic and ethical approach for gathering and analysing information about competitors’ activities and related business trends. It is based on the idea that more than 80 per cent of all information is public knowledge. The most important sources of CI information include business’s annual and other financial reports, speeches by business executives, government documents, online databases and trade organisations, as well as popular and business magazines and newspapers. The challenge is to find the relevant knowledge, analyse it and share it with the decision-makers in the organisation so they can use it. The critical questions that managers setting up a CI system should ask are:
How rapidly does the competitive climate in our industry change? How important is it that ➤
we keep abreast of such changes?
What are the objectives for CI in our business? ➤
Who are the best internal clients for CI? To whom should the CI effort report? ➤
What budget should be allocated to CI? Will it be staffed full time or part time? ➤
In businesses that operate in industries with dynamic competitive contexts, the use of full-time CI staff is growing.
Client contact and sales force automation systems Sales force automation software helps businesses to disseminate real-time product information to salespeople to enable them to be more productive and more able to satisfy customer needs. Such software also allows businesses to effectively capture customer intelligence from sales-people, keep track of it for use in later sales calls, and even transfer it to other salespeople in the event of a salesperson leaving the business. Several low-cost software applications that run on PCs are available. Sage ACT! and GoldMine CRM are two of the best-known programs in this arena, and Salesforce.com offers a web-based product (see www.salesforce.com for a free trial). These programs keep a track of clients’ names, addresses, telephone and fax numbers, email addresses and other details—along with all kinds of personal information, such as their spouse’s and children’s names and the kind of wine they like to drink—and also provide an organised way to make notes about each contact with the customer.
MARKETING RESEARCH: A FOUNDATION FOR STRATEGIC DECISION MAKING We now turn briefly to the marketing research task: the design, collection, analysis and reporting of research intended to gather data pertinent to a particular marketing challenge or situation. The word particular is very important here. Marketing research is intended to address carefully defined marketing problems or opportunities. Research carried out without carefully thought-out objectives usually means time and money down the tubes! Some marketing problems commonly addressed through marketing research include tracking customer satisfaction from unit to unit or year to year ( tracking studies ); testing consumer responses to elements of market-ing programs, such as prices or proposed advertising campaigns; and assessing the likelihood that consumers will buy proposed new products.
The steps in the marketing research process are shown in Exhibit 5.10. As this exhibit shows, the marketing research process is fraught with numerous opportunities for error. That’s why it’s so important that all who play influential roles in setting strategy for their
Walker Chapter 05.indd Sec1:136Walker Chapter 05.indd Sec1:136 2011-05-14 6:52:01 AM2011-05-14 6:52:01 AM
The material is for promotional purposes only. No authorised printing or duplication is permitted. (c) McGraw-Hill AustraliaSam
ple ch
apter

137Measuring market opportunities: forecasting and market knowledge CHAPTER 5
businesses, or who use marketing research results for decision making, are well-informed and critical users of the information that results from market research studies.
It is beyond the scope of this book, however, to instruct the reader in how to design market-ing research studies. For those wishing to read more on this topic, numerous textbooks on marketing research are available. 29
EXHIBIT 5.10 Steps in the marketing research process: what can go wrong?
STEPS WHAT FREQUENTLY GOES WRONG?
1. Identify managerial problem and establish research objectives.
1. Management identifies no clear objective, no decision to be made based on the proposed research.
2. Determine data sources (primary or secondary) and types of data and research approaches (qualitative or quantitative) required.
2. Primary data are collected when cheaper and faster secondary data will do. Quantitative data are collected without first collecting qualitative data.
3. Design research: type of study, data collection approach, sample, etc.
3. These are technical issues best managed by skilled practitioners. Doing these steps poorly can generate misleading or incorrect results.
4. Collect data. 4. Collector bias: hearing what you want to hear.
5. Analyse data. 5. Tabulation errors or incorrect use or interpretation of statistical procedures may mislead the user.
6. Report results to the decision-maker. 6. Some users do not really want objective information—they want to prove what they already believe to be true.
WHAT USERS OF MARKETING RESEARCH SHOULD ASK The steps identified in Exhibit 5.10 clarify a number of potential stumbling blocks in terms of designing and conducting marketing research. The informed and critical user of marketing research should ask the following questions, ideally before implementing the research or if neces-sary subsequent to its completion, to ensure that the research is unbiased and the results reliable.
What are the objectives of the research? Will the data to be collected meet those 1. objectives?
Are the data sources appropriate? Are cheaper, faster secondary data used where possible? 2. Is qualitative research planned to ensure that quantitative research, if any, is on target?
Are the planned qualitative and/or quantitative research approaches suited to the 3. objectives of the research? Qualitative research is better for deep insights into consumer behaviour, while quantitative research is better for measurement of a population’s attitudes and likely responses to products or marketing programs.
Is the research designed well? Will questionnaire scales permit the measurement necessary 4. to meet the research objectives? Are the questions on a survey or in an interview or focus group unbiased? (‘Isn’t this a great new product? Do you like it?’) Do the contact method and sampling plan entail any known bias? Is the sample size large enough to meet the research objectives?
Are the planned analyses appropriate? They should be specified before the research is 5. conducted.
Walker Chapter 05.indd Sec1:137Walker Chapter 05.indd Sec1:137 2011-05-14 6:52:01 AM2011-05-14 6:52:01 AM
The material is for promotional purposes only. No authorised printing or duplication is permitted. (c) McGraw-Hill AustraliaSam
ple ch
apter

PART 1PART 1
138 Opportunity analysisPART 5PART 4PART 3PART 2
Prepare a detailed plan for conducting the primary research required to complete your project. The research plan needs to do the following three things.
Precisely spell out the research objectives the research is intended to meet. ➤
Design the research to get you there. Identify your methods, your sample and any ➤
statistics (means, etc.) you will employ. Prepare drafts of questionnaires, guides for focus group sessions or in-depth interviews, plans for how you will conduct observational research, etc.
Describe how the combination of your secondary research and your planned primary ➤
research will lead to your estimate of target market size and your sales forecast for your marketing plan. Precisely spell out the mathematics that will do this, connecting it to specific secondary data or specific answers to questions or observations from your primary data.
Your research design should clearly identify and satisfy your research objectives, and ➤
appropriate qualitative and/or quantitative research should be competently designed, using what you have learnt in previous coursework or any supplementary readings necessary.
Given that absolute market potential almost always exceeds actual industry sales, 1. why do marketers bother to make potential estimates? Discuss four decisions that a marketer of industrial grinding machinery might make based on such potential estimates.
To more effectively allocate promotion expenditures and sales efforts, the marketing 2. manager for a business marketing frozen food entrées would like to know the relative market potential for such products in every state and territory in Australia. What variables would you include in a multifactor index for measuring relative potential? Explain your rationale for including each variable. Where might you find up-to-date information about each of the variables in your index?
Suppose you are the product manager responsible for General Electric’s line of garbage 3. disposal units. After several years, the product has yet to gain acceptance by many consumers. Use the diffusion of innovations theory discussed in the text to explain why garbage disposal units have achieved such poor market penetration. What does this imply concerning the shape of the rest of the garbage disposal unit’s life-cycle curve? What actions might you consider taking to increase the market penetration for this product?
Additional self-diagnostic questions to test your ability to apply the analytical tools and concepts in this chapter to strategic decision making may be found at this book’s website at www.mhhe.com/au/walker .
This overview of Telstra was compiled by John Gountas and Sandra Lombardo, research student, 1. La Trobe University. Telstra website, ‘The Next G Network’, viewed 29 March 2011, http://www.telstra.com.au/mobile/nextg/. 2. Telstra website, ‘Vision and Mission’, viewed 8 October 2010, http://www.telstra.com.au/abouttelstra/3. company-overview/vision-and-mission/. Telstra website, ‘Mobile Fact Sheets’, viewed 29 March 2011, http://www.telstra.com.au/abouttelstra/4. company-overview/fast-facts/?red=fact-sheets-mobiles. our-broadband.
Marketing plan exercise
ENDNOTES
DISCUSSION QUESTIONS
Walker Chapter 05.indd Sec1:138Walker Chapter 05.indd Sec1:138 2011-05-14 6:52:01 AM2011-05-14 6:52:01 AM
The material is for promotional purposes only. No authorised printing or duplication is permitted. (c) McGraw-Hill AustraliaSam
ple ch
apter

139Measuring market opportunities: forecasting and market knowledge CHAPTER 5
Telstra website, ‘Fast Facts’, viewed 8 October 2010, http://www.telstra.com.au/abouttelstra/company-5. overview/fast-facts/?red=fact-sheets-mobiles. Charles Wardell, ‘High-Performance Budgeting’, 6. Harvard Management Update , January 1999. ibid. 7. Peter L. Bernstein and Theodore H. Silbert, ‘Are Economic Forecasters Worth Listening To’, 8. Harvard Business Review , July–August 1982. F. William Barnett, ‘Four Steps to Forecast Total Market Demand’, 9. Harvard Business Review , July–August 1988. For a more detailed look at forecasting methods, see David M. Georgeoff and Robert G. Murdick, 10. ‘Manager’s Guide to Forecasting’, Harvard Business Review , January–February 1986; and John C. Chambers, Satinder K. Mullick and Donald D. Smith, ‘How to Choose the Right Forecasting Technique’, Harvard Business Review , July–August 1971. Arthur Schleifer, Jr, 11. Forecasting with Regression Analysis (Boston: Harvard Business School Publishing, 1996). See Frank M. Bass, ‘A New Product Growth Model for Consumer Durables’, 12. Management Science , January 1969, pp. 215–27; and Trichy V. Krishnan, Frank M. Bass and V. Kumar, ‘Impact of a Late Entrant on the Diffusion of a New Product/Service’, Journal of Marketing Research , May 2000, pp. 269–78. For more on conjoint analysis, see Robert J. Dolan, 13. Conjoint Analysis: A Manager’s Guide (Boston: Harvard Business School Publishing, 1990). Fareena Sultan, 14. Marketing Research for High Definition Television (Boston: Harvard Business School Publishing, 1991). Colin Welch and Ananth Raman, 15. Merchandising at Nine West Retail Stores (Boston: Harvard Business School Publishing, 1998). Everett M. Rogers, 16. Diffusion of Innovations (New York: Free Press, 1983). Thomas S. Robertson and Hubert Gatignon, ‘Competitive Effects on Technological Diffusion’, 17. Journal of Marketing , July 1986, pp. 1–12. Rogers, 18. Diffusion of Innovations . Frederick E. Webster, Jr, 19. Industrial Marketing Strategy (New York: John Wiley & Sons, 1991), pp. 158–74. A key challenge for manufacturers is to be able to quickly adjust production schedules to adapt to 20. demand that differs from the forecast. To read more about how to enable production to respond quickly in the face of unforeseen changes in demand, see Marshall L. Fisher, Janice H. Hammond, Walter R. Obermeyer and Ananth Raman, ‘Making Supply Meet Demand in an Uncertain World’, Harvard Business Review , May–June 1994. Amos Tversky and Daniel Kahneman, ‘Judgment under Uncertainty’, 21. Science , 185 (1974), pp. 1124–31. Li and Calantone define market knowledge as ‘organized and structured information about the market’. 22. See Tiger Li and Roger J. Calantone, ‘The Impact of Market Knowledge Competence on New Product Advantage: Conceptualization and Empirical Examination’, Journal of Marketing , October 1998, pp. 13–29. Welch and Raman, 23. Merchandising at Nine West Retail Stores . ‘Marketing—Clubbing Together’, 24. Retail Week , 8 November 2002. For more details see CACI’s website at www.caci.co.uk. 25. For more details see Experian UK’s website at www.experian.co.uk. 26. For more on data mining and related topics, see Peter Jacobs, ‘Data Mining: What General Managers Need 27. to Know’, Harvard Management Update , October 1999; and Jeff Papows, Enterprise.com: Market Leadership in the Information Age (Cambridge, MA: Perseus Publishing, 1998). Information in this section comes from the Strategic and Competitive Intelligence Professionals website at 28. www.scip.org. For more on marketing research, see any business school marketing research text, such as William R. 29. Dillon, Thomas J. Madden and Neil H. Firtle, Marketing Research in a Marketing Environment (Burr Ridge, IL: Irwin/McGraw-Hill, 1993). Also see Pamela L. Alreck and Robert B. Settle, The Survey Research Process (Burr Ridge, IL: Irwin/McGraw-Hill, 1994). The survey research methods section of the American Statistical Association offers useful guides to conducting focus groups and surveys. See their website at http://www.amstat.org/.
Walker Chapter 05.indd Sec1:139Walker Chapter 05.indd Sec1:139 2011-05-14 6:52:01 AM2011-05-14 6:52:01 AM
The material is for promotional purposes only. No authorised printing or duplication is permitted. (c) McGraw-Hill AustraliaSam
ple ch
apter


![YEARBOOK 2019 4PART - nust.na Yearbook... · Faculty of Computing and Informatics - Yearbook 2019 [ ii ] NOTE The Yearbook for the Faculty of Computing and Informatics is valid for](https://img.pdfslide.net/doc/110x75/5e0da9273f14eb44dd3706a5/yearbook-2019-4part-nustna-yearbook-faculty-of-computing-and-informatics.jpg)