Embed Size (px)
Citation preview
Midbrain dopamine neurons encode decisions forfuture action
Genela Morris1,2, Alon Nevet2, David Arkadir2, Eilon Vaadia1,2 & Hagai Bergman1,2
Current models of the basal ganglia and dopamine neurons emphasize their role in reinforcement learning. However, the role of
dopamine neurons in decision making is still unclear. We recorded from dopamine neurons in monkeys engaged in two types of
trial: reference trials in an instructed-choice task and decision trials in a two-armed bandit decision task. We show that the
activity of dopamine neurons in the decision setting is modulated according to the value of the upcoming action. Moreover,
analysis of the probability matching strategy in the decision trials revealed that the dopamine population activity and not the
reward during reference trials determines choice behavior. Because dopamine neurons do not have spatial or motor properties,
we conclude that immediate decisions are likely to be generated elsewhere and conveyed to the dopamine neurons, which play a
role in shaping long-term decision policy through dynamic modulation of the efficacy of basal ganglia synapses.
The art of associating sensory information with appropriate behavioror decision making has been investigated through the prisms of amultitude of fields. The search for psychological1,2 and neural corre-lates3–8 of decision making was paralleled by machine learning research.One form of machine learning, reinforcement learning, has achievedpopularity because of its efficiency and its resemblance to real-lifesituations. Developments in reinforcement learning have led to apowerful learning algorithm known as temporal difference (TD)learning9. TD learning, originally used for modeling classical condi-tioning, is based on evaluating sensory inputs, or states, by assigningthem a value according to the anticipation of reward. Learning tooptimize this evaluation is achieved by constant comparison of thevalue of the current state with its previous estimation. When adiscrepancy arises, this difference, termed the TD error, is used toimprove estimation of the state value.
The classical conditioning context provides an inadequate descrip-tion of the typical reinforcement learning setting in which agents actupon sensory information to execute behavioral decisions. Movingfrom passive TD learning to active control requires modification of thecomputational algorithm, as the aim of learning has now shifted tooptimization of actions in different states to maximize the long-termaccumulated reward. The actions affect not only reward, but also thetransition from one state to another, an outcome that must also belearned. This challenge is resolved by reinforcement learning modelsthat incorporate actions into different variations of TD algorithms9,10
using the TD error to update the state evaluation and to adjust the setof rules that govern the decisions in each state, or the policy.
Policy optimization can be achieved in a number of fashions.One way is through the design of specialized actor/critic networkarchitecture. In these networks, the TD error is used to teach two
separate elements, which, when combined, result in efficient actionselection. The critic estimates the values of all encountered states (asin the classical conditioning context), whereas the actor stores thepolicy and performs actions. Each action can lead to a different state.This may cause a deviation from the estimated value of the previousstate. The resulting change, the TD error, is fed back to the actor by thecritic and is used to shape the desired policy. An alternative class ofalgorithms does not involve explicit representation of the policy butrelies on direct assessment of the value of state-action pairs (alsotermed action values or Q values) rather than the value of the statealone9–12. Thus, both the actor-critic and Q-value estimation modelsare taught by a TD error. This error signal is independent of the actionin the actor-critic architecture, whereas a Q-value error signal isaffected by the chosen action.
The phasic response of midbrain dopamine neurons located in thesubstantia nigra pars compacta (SNc) and the ventral tegmental area(VTA) is a likely neural correlate of the TD error, thus underscoring theapplicability of the TD learning algorithm to neural learning8,13–18.Because the basal ganglia network, the main target of dopamine inner-vation, is commonly regarded as an action selection and generationsystem19,20, the dopamine signal is incorporated as the critique in actor/critic TD models of the basal ganglia19,21,22. In these models, the dopa-mine signal is used to reinforce behavior by adjusting synaptic efficacy inthe appropriate neuronal circuits of the input layer of the basal ganglianetworks—that is, the striatum23,24. Some models also use the dopa-mine signal to directly select possible actions24. Earlier electrophysiolo-gical recordings of dopamine neurons typically involved classical condi-tioning14,25 or instructed-choice instrumental conditioning15–17 tasks,but the role of dopamine in behavioral decisions involving competingactions and in policy formation has not been explored experimentally.
Received 27 March; accepted 28 June; published online 23 July 2006; doi:10.1038/nn1743
1Interdisciplinary Center for Neural Computation (ICNC), Hebrew University, Jerusalem, Israel. 2Hebrew University, Department of Physiology, PO Box 12272, Jerusalem91220, Israel. Correspondence should be addressed to G.M. ([email protected]).
NATURE NEUROSCIENCE VOLUME 9 [ NUMBER 8 [ AUGUST 2006 1057
ART ICLES©
2006
Nat
ure
Pub
lishi
ng G
roup
ht
tp://
ww
w.n
atur
e.co
m/n
atur
eneu
rosc
ienc
e
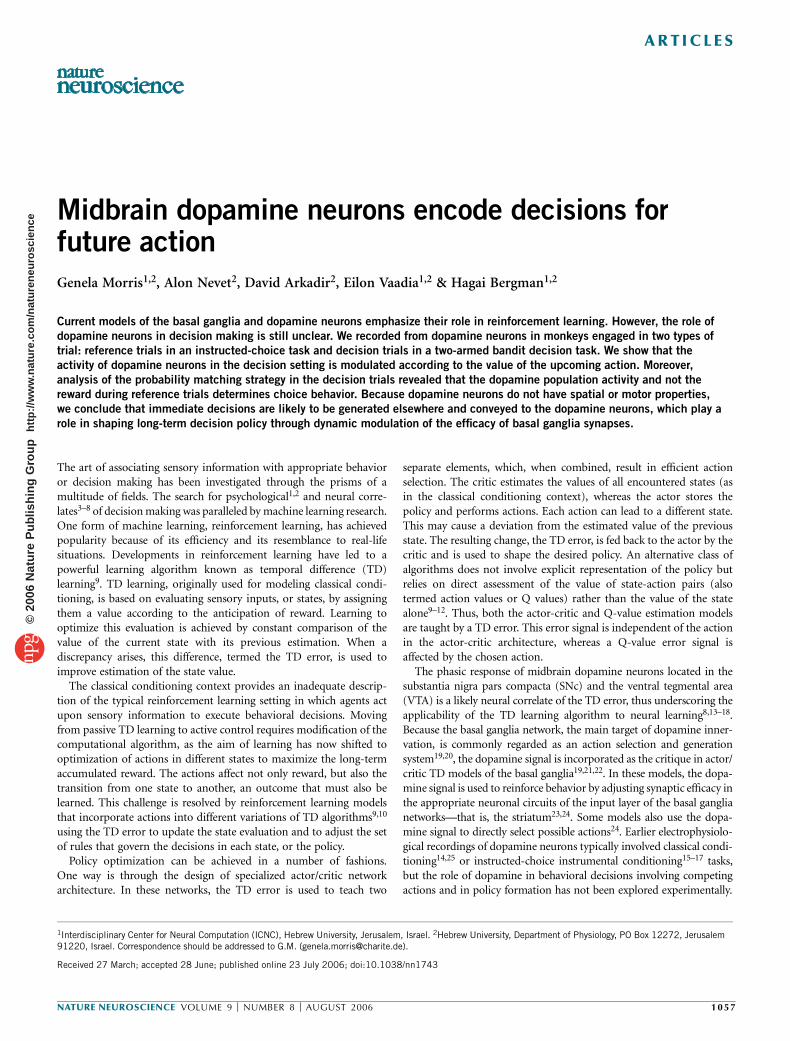
To elucidate the role of SNc dopamine neurons in decision making,we recorded their activity in three monkeys performing trials ofa two-armed bandit task (decision); these trials were randomlyembedded in reference trials of a probabilistic instructed-choicetask (reference) (Fig. 1, task details in Methods). Briefly, in referencetrials (80–90% of all trials), monkeys were presented with one offour possible visual conditioned stimuli. The stimulus was a randomgeometrical shape occupying the right or left half of a computerscreen. The location of the stimulus indicated the correct directionof the arm movement, and the stimulus identity indicated theprobability of receiving a reward upon correct completion of thetrial. In decision trials, monkeys were simultaneously presentedwith a pair of conditioned stimuli from the reference set, allowingthem a choice of action and, consequently, a choice of rewardprobability. This behavioral setting therefore allowed us to map theTD error responses emitted by dopamine neurons in the reference taskand to use them as a reference for the study of behavior in a decision
situation, as well as to study dopamine responses in the decisionprocess itself.
RESULTS
Reference dopamine responses determine decision policy
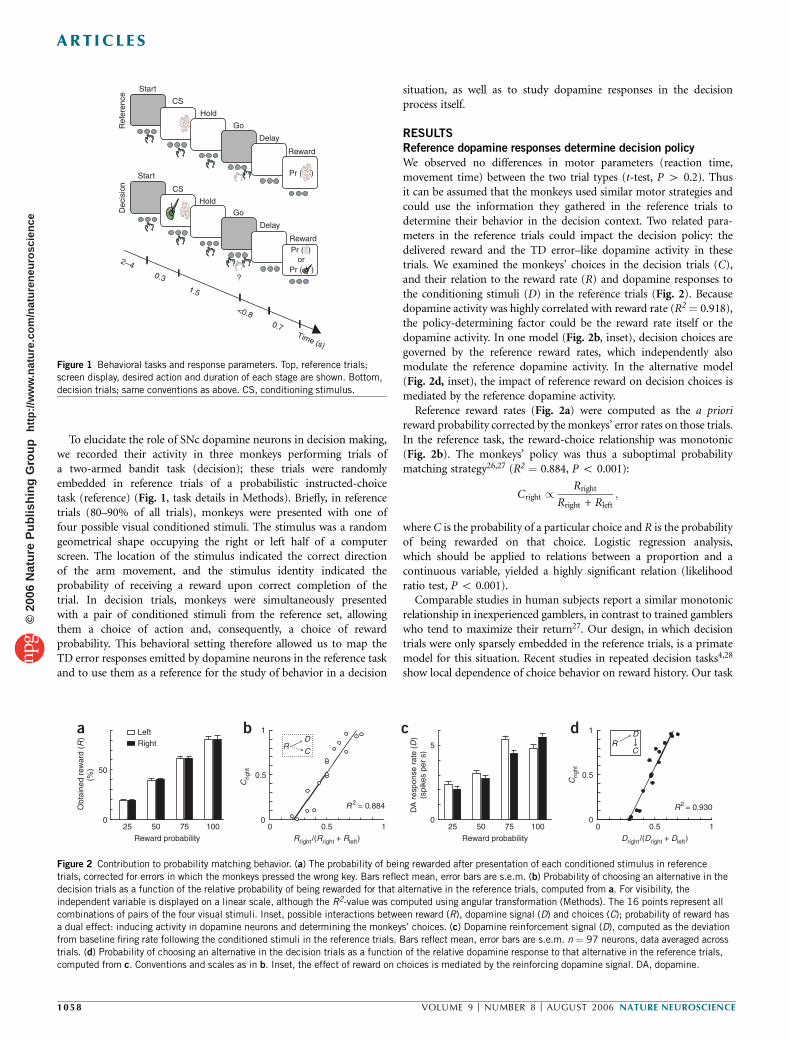
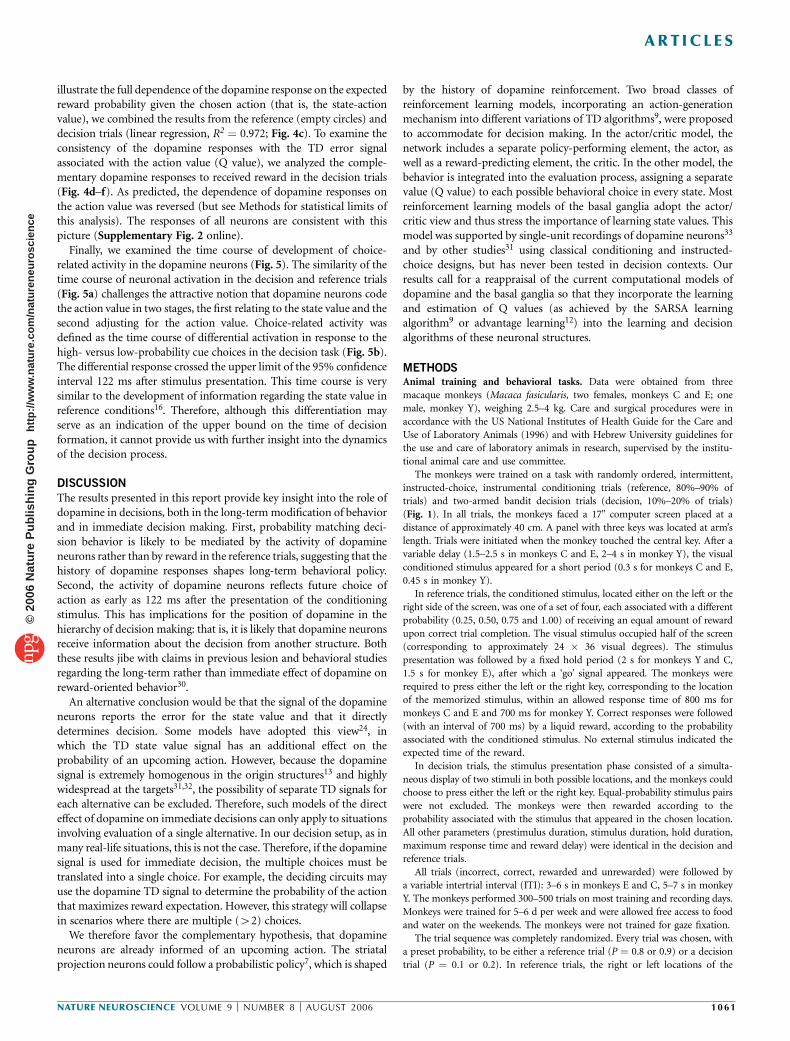
We observed no differences in motor parameters (reaction time,movement time) between the two trial types (t-test, P 4 0.2). Thusit can be assumed that the monkeys used similar motor strategies andcould use the information they gathered in the reference trials todetermine their behavior in the decision context. Two related para-meters in the reference trials could impact the decision policy: thedelivered reward and the TD error–like dopamine activity in thesetrials. We examined the monkeys’ choices in the decision trials (C),and their relation to the reward rate (R) and dopamine responses tothe conditioning stimuli (D) in the reference trials (Fig. 2). Becausedopamine activity was highly correlated with reward rate (R2¼ 0.918),the policy-determining factor could be the reward rate itself or thedopamine activity. In one model (Fig. 2b, inset), decision choices aregoverned by the reference reward rates, which independently alsomodulate the reference dopamine activity. In the alternative model(Fig. 2d, inset), the impact of reference reward on decision choices ismediated by the reference dopamine activity.
Reference reward rates (Fig. 2a) were computed as the a priorireward probability corrected by the monkeys’ error rates on those trials.In the reference task, the reward-choice relationship was monotonic(Fig. 2b). The monkeys’ policy was thus a suboptimal probabilitymatching strategy26,27 (R2 ¼ 0.884, P o 0.001):
Cright /Rright
Rright + Rleft;
where C is the probability of a particular choice and R is the probabilityof being rewarded on that choice. Logistic regression analysis,which should be applied to relations between a proportion and acontinuous variable, yielded a highly significant relation (likelihoodratio test, P o 0.001).
Comparable studies in human subjects report a similar monotonicrelationship in inexperienced gamblers, in contrast to trained gamblerswho tend to maximize their return27. Our design, in which decisiontrials were only sparsely embedded in the reference trials, is a primatemodel for this situation. Recent studies in repeated decision tasks4,28
show local dependence of choice behavior on reward history. Our task
Delay
Reward
Go
Start
CS
HoldR
efer
ence
Dec
isio
n
?
Go
Delay
Start
CS
Reward
Hold
2–40.3
1.5
<0.80.7
Time (s)
Pr ( )
Pr ( )or
Pr ( )
Figure 1 Behavioral tasks and response parameters. Top, reference trials;screen display, desired action and duration of each stage are shown. Bottom,
decision trials; same conventions as above. CS, conditioning stimulus.
25 50 75 1000
50
Reward probability
Obt
aine
d re
war
d (R
)(%
)
25 50 75 1000
5
DA
res
pons
e ra
te (
D)
(spi
kes
per
s)
Reward probability
a c
0 0.5 10
0.5
1
Rright /(Rright + Rleft) Dright /(Dright + Dleft)
0 0.5 10
0.5
1
Crig
ht
Crig
ht
LeftRight
R2 = 0.884 R2 = 0.930
dbR
D
CR
D
C
Figure 2 Contribution to probability matching behavior. (a) The probability of being rewarded after presentation of each conditioned stimulus in reference
trials, corrected for errors in which the monkeys pressed the wrong key. Bars reflect mean, error bars are s.e.m. (b) Probability of choosing an alternative in the
decision trials as a function of the relative probability of being rewarded for that alternative in the reference trials, computed from a. For visibility, the
independent variable is displayed on a linear scale, although the R2-value was computed using angular transformation (Methods). The 16 points represent all
combinations of pairs of the four visual stimuli. Inset, possible interactions between reward (R), dopamine signal (D) and choices (C); probability of reward hasa dual effect: inducing activity in dopamine neurons and determining the monkeys’ choices. (c) Dopamine reinforcement signal (D), computed as the deviation
from baseline firing rate following the conditioned stimuli in the reference trials. Bars reflect mean, error bars are s.e.m. n ¼ 97 neurons, data averaged across
trials. (d) Probability of choosing an alternative in the decision trials as a function of the relative dopamine response to that alternative in the reference trials,
computed from c. Conventions and scales as in b. Inset, the effect of reward on choices is mediated by the reinforcing dopamine signal. DA, dopamine.
1058 VOLUME 9 [ NUMBER 8 [ AUGUST 2006 NATURE NEUROSCIENCE
ART ICLES©
2006
Nat
ure
Pub
lishi
ng G
roup
ht
tp://
ww
w.n
atur
e.co
m/n
atur
eneu
rosc
ienc
e
design precludes such a behavioral strategy and indeed, choice-triggered analysis did not reveal any local history effects (Supplemen-tary Fig. 1 online).
We studied the monkeys’ decision behavior as predicted by therelative dopamine population reinforcement signal in the referencetrials (Fig. 2c,d). Dopamine population responses were quantified asthe difference in firing rate between the baseline activity and theresponses to the visual conditioned stimuli (Fig. 2c). These responseswere used to predict choice behavior in the decision task (Fig. 2d). Thehighly significant linear correlation between reference dopamine anddecision choice behavior (R2 ¼ 0.930) was corroborated by logisticregression analysis (likelihood ratio test, P o 0.001). Moreover, thelogistic fit of choice behavior to dopamine activity was significantlybetter than the fit to reward rate (likelihood ratio test, P o 0.05). Toexamine the interplay between the three variables R, D and C, weconducted a logistic regression analysis on the full model. In thisanalysis, decision choice behavior is described in terms of the con-tributions of both the reference reward rates and reference dopamineactivity. The full model contained only one significant predictor,dopamine activity (P o 0.05); reward rate was not a significant factor(P 4 0.3). Thus, the correlation between choices and dopaminereinforcement is not a byproduct of the common dependence onreward rate in the reference task. Rather, the reference dopamineresponse can be viewed as the mediator between reward and choicebehavior. Partial correlation analysis yielded similar results (Supple-mentary Note online).
Decision choices are not predicted by early gaze shifts
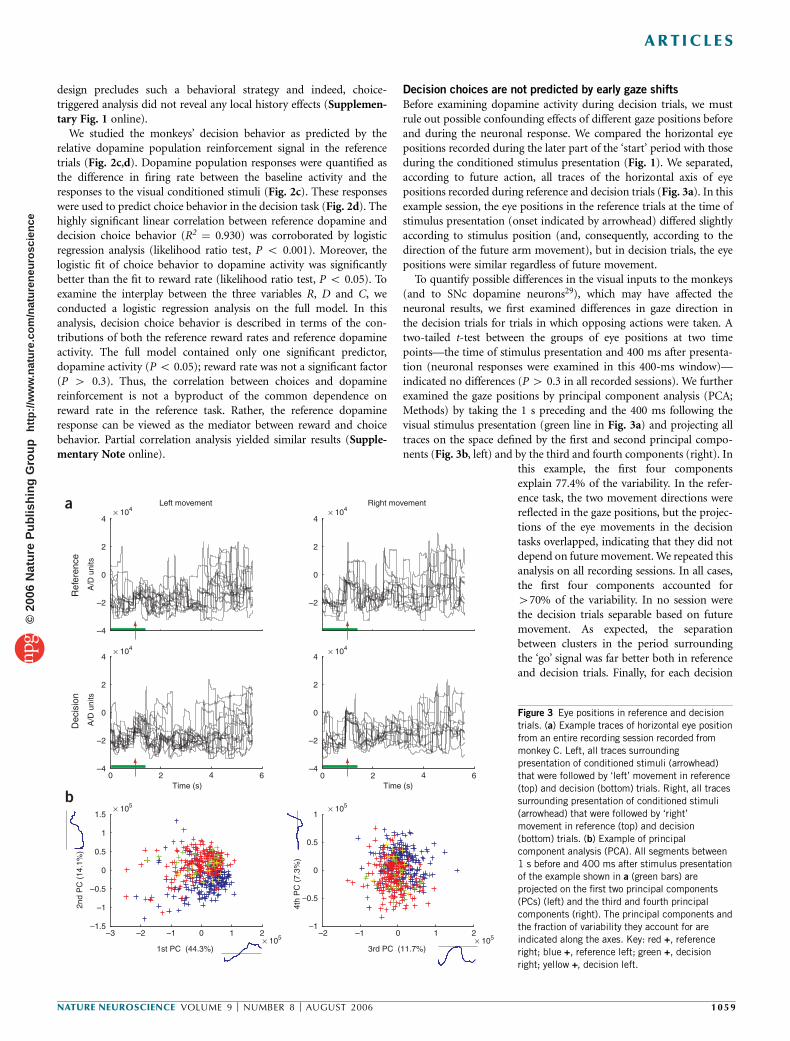
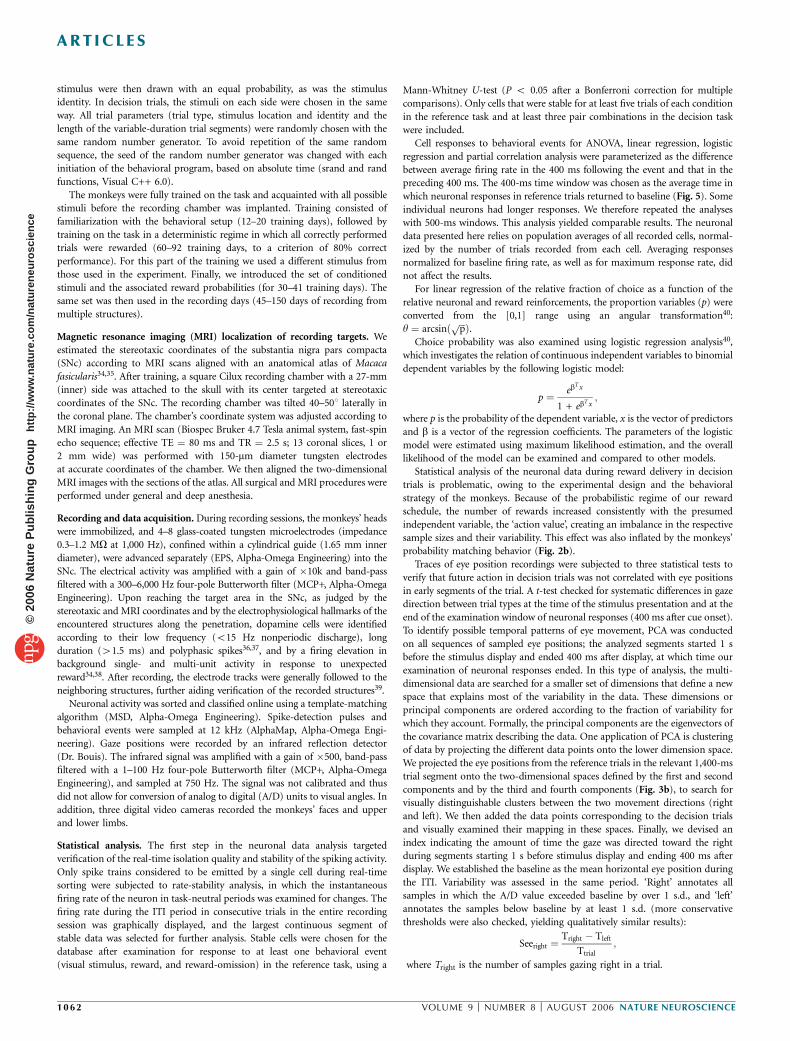
Before examining dopamine activity during decision trials, we mustrule out possible confounding effects of different gaze positions beforeand during the neuronal response. We compared the horizontal eyepositions recorded during the later part of the ‘start’ period with thoseduring the conditioned stimulus presentation (Fig. 1). We separated,according to future action, all traces of the horizontal axis of eyepositions recorded during reference and decision trials (Fig. 3a). In thisexample session, the eye positions in the reference trials at the time ofstimulus presentation (onset indicated by arrowhead) differed slightlyaccording to stimulus position (and, consequently, according to thedirection of the future arm movement), but in decision trials, the eyepositions were similar regardless of future movement.
To quantify possible differences in the visual inputs to the monkeys(and to SNc dopamine neurons29), which may have affected theneuronal results, we first examined differences in gaze direction inthe decision trials for trials in which opposing actions were taken. Atwo-tailed t-test between the groups of eye positions at two timepoints—the time of stimulus presentation and 400 ms after presenta-tion (neuronal responses were examined in this 400-ms window)—indicated no differences (P 4 0.3 in all recorded sessions). We furtherexamined the gaze positions by principal component analysis (PCA;Methods) by taking the 1 s preceding and the 400 ms following thevisual stimulus presentation (green line in Fig. 3a) and projecting alltraces on the space defined by the first and second principal compo-nents (Fig. 3b, left) and by the third and fourth components (right). In
this example, the first four componentsexplain 77.4% of the variability. In the refer-ence task, the two movement directions werereflected in the gaze positions, but the projec-tions of the eye movements in the decisiontasks overlapped, indicating that they did notdepend on future movement. We repeated thisanalysis on all recording sessions. In all cases,the first four components accounted for470% of the variability. In no session werethe decision trials separable based on futuremovement. As expected, the separationbetween clusters in the period surroundingthe ‘go’ signal was far better both in referenceand decision trials. Finally, for each decision
0 2 4 6–4
–2
0
2
4
–4
–2
0
2
4
Time (s)0 2 4 6
Time (s)
A/D
uni
ts
Dec
isio
n
–4
–2
0
2
4× 104
× 104
× 105
× 104
× 104
× 105
× 105 × 105
–2
0
2
4
Ref
eren
ce
Left movement Right movement
A/D
uni
ts
–2 –1 0 1 2–1
–0.5
0
0.5
1
–3 –2 –1 0 1 2–1.5
–1
–0.5
0
0.5
1
1.5
1st PC (44.3%) 3rd PC (11.7%)
2nd
PC
(14
.1%
)
4th
PC
(7.
3%)
a
b
Figure 3 Eye positions in reference and decision
trials. (a) Example traces of horizontal eye position
from an entire recording session recorded from
monkey C. Left, all traces surrounding
presentation of conditioned stimuli (arrowhead)
that were followed by ‘left’ movement in reference
(top) and decision (bottom) trials. Right, all traces
surrounding presentation of conditioned stimuli
(arrowhead) that were followed by ‘right’
movement in reference (top) and decision
(bottom) trials. (b) Example of principal
component analysis (PCA). All segments between
1 s before and 400 ms after stimulus presentationof the example shown in a (green bars) are
projected on the first two principal components
(PCs) (left) and the third and fourth principal
components (right). The principal components and
the fraction of variability they account for are
indicated along the axes. Key: red +, reference
right; blue +, reference left; green +, decision
right; yellow +, decision left.
NATURE NEUROSCIENCE VOLUME 9 [ NUMBER 8 [ AUGUST 2006 1059
ART ICLES©
2006
Nat
ure
Pub
lishi
ng G
roup
ht
tp://
ww
w.n
atur
e.co
m/n
atur
eneu
rosc
ienc
e
trial, we calculated an index indicating the relative time the monkeygazed to the right during the 1.4-s period described above. Thez-transformation of this index (Methods) in left-movement trials wascompared to that in right-movement trials by t-test. In all examineddays, no difference was found between right- and left-movementdecisions (P 4 0.2 in all sessions).
Decision dopamine responses reflect future action
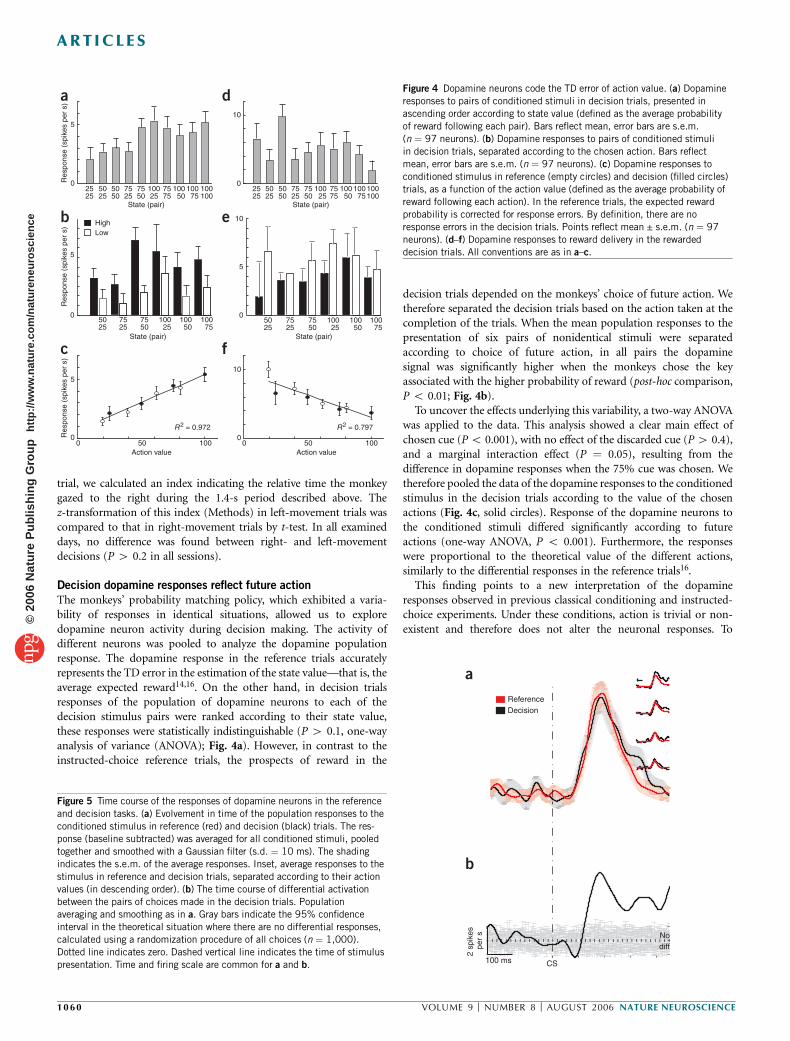
The monkeys’ probability matching policy, which exhibited a varia-bility of responses in identical situations, allowed us to exploredopamine neuron activity during decision making. The activity ofdifferent neurons was pooled to analyze the dopamine populationresponse. The dopamine response in the reference trials accuratelyrepresents the TD error in the estimation of the state value—that is, theaverage expected reward14,16. On the other hand, in decision trialsresponses of the population of dopamine neurons to each of thedecision stimulus pairs were ranked according to their state value,these responses were statistically indistinguishable (P 4 0.1, one-wayanalysis of variance (ANOVA); Fig. 4a). However, in contrast to theinstructed-choice reference trials, the prospects of reward in the
decision trials depended on the monkeys’ choice of future action. Wetherefore separated the decision trials based on the action taken at thecompletion of the trials. When the mean population responses to thepresentation of six pairs of nonidentical stimuli were separatedaccording to choice of future action, in all pairs the dopaminesignal was significantly higher when the monkeys chose the keyassociated with the higher probability of reward (post-hoc comparison,P o 0.01; Fig. 4b).
To uncover the effects underlying this variability, a two-way ANOVAwas applied to the data. This analysis showed a clear main effect ofchosen cue (Po 0.001), with no effect of the discarded cue (P4 0.4),and a marginal interaction effect (P ¼ 0.05), resulting from thedifference in dopamine responses when the 75% cue was chosen. Wetherefore pooled the data of the dopamine responses to the conditionedstimulus in the decision trials according to the value of the chosenactions (Fig. 4c, solid circles). Response of the dopamine neurons tothe conditioned stimuli differed significantly according to futureactions (one-way ANOVA, P o 0.001). Furthermore, the responseswere proportional to the theoretical value of the different actions,similarly to the differential responses in the reference trials16.
This finding points to a new interpretation of the dopamineresponses observed in previous classical conditioning and instructed-choice experiments. Under these conditions, action is trivial or non-existent and therefore does not alter the neuronal responses. To
5025
7525
7550
10025
100 50
100 75
0
5
State (pair) State (pair)
State (pair)
Res
pons
e (s
pike
s pe
r s)
5
0
State (pair)
0
5
Action value100500
50 25
75 25
75 50
100 25
100 50
100 75
a
b
c
R2 = 0.972 R2 = 0.797
2525
5050
7575
100100
Res
pons
e (s
pike
s pe
r s)
Res
pons
e (s
pike
s pe
r s)
0
10
Action value100500
f
50 25
75 25
75 50
100 25
100 50
100 75
25 25
50 50
75 75
100100
10
0
d
50 25
75 25
75 50
100 25
100 50
100 75
5
10
0
eHighLow
ReferenceDecision
a
CS
Nodiff
100 ms
2 sp
ikes
per
s
b
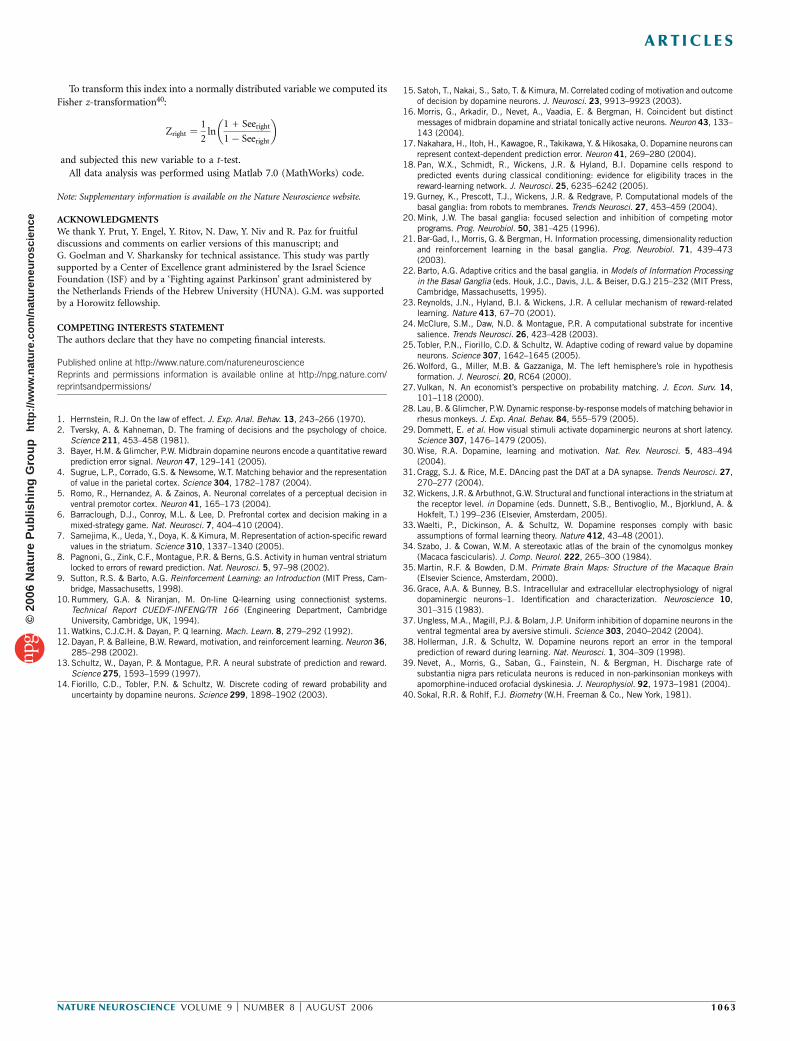
Figure 5 Time course of the responses of dopamine neurons in the reference
and decision tasks. (a) Evolvement in time of the population responses to the
conditioned stimulus in reference (red) and decision (black) trials. The res-
ponse (baseline subtracted) was averaged for all conditioned stimuli, pooled
together and smoothed with a Gaussian filter (s.d. ¼ 10 ms). The shading
indicates the s.e.m. of the average responses. Inset, average responses to the
stimulus in reference and decision trials, separated according to their action
values (in descending order). (b) The time course of differential activation
between the pairs of choices made in the decision trials. Populationaveraging and smoothing as in a. Gray bars indicate the 95% confidence
interval in the theoretical situation where there are no differential responses,
calculated using a randomization procedure of all choices (n ¼ 1,000).
Dotted line indicates zero. Dashed vertical line indicates the time of stimulus
presentation. Time and firing scale are common for a and b.
Figure 4 Dopamine neurons code the TD error of action value. (a) Dopamine
responses to pairs of conditioned stimuli in decision trials, presented in
ascending order according to state value (defined as the average probability
of reward following each pair). Bars reflect mean, error bars are s.e.m.
(n ¼ 97 neurons). (b) Dopamine responses to pairs of conditioned stimuli
in decision trials, separated according to the chosen action. Bars reflect
mean, error bars are s.e.m. (n ¼ 97 neurons). (c) Dopamine responses to
conditioned stimulus in reference (empty circles) and decision (filled circles)
trials, as a function of the action value (defined as the average probability of
reward following each action). In the reference trials, the expected reward
probability is corrected for response errors. By definition, there are no
response errors in the decision trials. Points reflect mean ± s.e.m. (n ¼ 97
neurons). (d–f) Dopamine responses to reward delivery in the rewarded
decision trials. All conventions are as in a–c.
1060 VOLUME 9 [ NUMBER 8 [ AUGUST 2006 NATURE NEUROSCIENCE
ART ICLES©
2006
Nat
ure
Pub
lishi
ng G
roup
ht
tp://
ww
w.n
atur
e.co
m/n
atur
eneu
rosc
ienc
e
illustrate the full dependence of the dopamine response on the expectedreward probability given the chosen action (that is, the state-actionvalue), we combined the results from the reference (empty circles) anddecision trials (linear regression, R2 ¼ 0.972; Fig. 4c). To examine theconsistency of the dopamine responses with the TD error signalassociated with the action value (Q value), we analyzed the comple-mentary dopamine responses to received reward in the decision trials(Fig. 4d–f). As predicted, the dependence of dopamine responses onthe action value was reversed (but see Methods for statistical limits ofthis analysis). The responses of all neurons are consistent with thispicture (Supplementary Fig. 2 online).
Finally, we examined the time course of development of choice-related activity in the dopamine neurons (Fig. 5). The similarity of thetime course of neuronal activation in the decision and reference trials(Fig. 5a) challenges the attractive notion that dopamine neurons codethe action value in two stages, the first relating to the state value and thesecond adjusting for the action value. Choice-related activity wasdefined as the time course of differential activation in response to thehigh- versus low-probability cue choices in the decision task (Fig. 5b).The differential response crossed the upper limit of the 95% confidenceinterval 122 ms after stimulus presentation. This time course is verysimilar to the development of information regarding the state value inreference conditions16. Therefore, although this differentiation mayserve as an indication of the upper bound on the time of decisionformation, it cannot provide us with further insight into the dynamicsof the decision process.
DISCUSSION
The results presented in this report provide key insight into the role ofdopamine in decisions, both in the long-term modification of behaviorand in immediate decision making. First, probability matching deci-sion behavior is likely to be mediated by the activity of dopamineneurons rather than by reward in the reference trials, suggesting that thehistory of dopamine responses shapes long-term behavioral policy.Second, the activity of dopamine neurons reflects future choice ofaction as early as 122 ms after the presentation of the conditioningstimulus. This has implications for the position of dopamine in thehierarchy of decision making: that is, it is likely that dopamine neuronsreceive information about the decision from another structure. Boththese results jibe with claims in previous lesion and behavioral studiesregarding the long-term rather than immediate effect of dopamine onreward-oriented behavior30.
An alternative conclusion would be that the signal of the dopamineneurons reports the error for the state value and that it directlydetermines decision. Some models have adopted this view24, inwhich the TD state value signal has an additional effect on theprobability of an upcoming action. However, because the dopaminesignal is extremely homogenous in the origin structures13 and highlywidespread at the targets31,32, the possibility of separate TD signals foreach alternative can be excluded. Therefore, such models of the directeffect of dopamine on immediate decisions can only apply to situationsinvolving evaluation of a single alternative. In our decision setup, as inmany real-life situations, this is not the case. Therefore, if the dopaminesignal is used for immediate decision, the multiple choices must betranslated into a single choice. For example, the deciding circuits mayuse the dopamine TD signal to determine the probability of the actionthat maximizes reward expectation. However, this strategy will collapsein scenarios where there are multiple (42) choices.
We therefore favor the complementary hypothesis, that dopamineneurons are already informed of an upcoming action. The striatalprojection neurons could follow a probabilistic policy7, which is shaped
by the history of dopamine reinforcement. Two broad classes ofreinforcement learning models, incorporating an action-generationmechanism into different variations of TD algorithms9, were proposedto accommodate for decision making. In the actor/critic model, thenetwork includes a separate policy-performing element, the actor, aswell as a reward-predicting element, the critic. In the other model, thebehavior is integrated into the evaluation process, assigning a separatevalue (Q value) to each possible behavioral choice in every state. Mostreinforcement learning models of the basal ganglia adopt the actor/critic view and thus stress the importance of learning state values. Thismodel was supported by single-unit recordings of dopamine neurons33
and by other studies31 using classical conditioning and instructed-choice designs, but has never been tested in decision contexts. Ourresults call for a reappraisal of the current computational models ofdopamine and the basal ganglia so that they incorporate the learningand estimation of Q values (as achieved by the SARSA learningalgorithm9 or advantage learning12) into the learning and decisionalgorithms of these neuronal structures.
METHODSAnimal training and behavioral tasks. Data were obtained from three
macaque monkeys (Macaca fasicularis, two females, monkeys C and E; one
male, monkey Y), weighing 2.5–4 kg. Care and surgical procedures were in
accordance with the US National Institutes of Health Guide for the Care and
Use of Laboratory Animals (1996) and with Hebrew University guidelines for
the use and care of laboratory animals in research, supervised by the institu-
tional animal care and use committee.
The monkeys were trained on a task with randomly ordered, intermittent,
instructed-choice, instrumental conditioning trials (reference, 80%–90% of
trials) and two-armed bandit decision trials (decision, 10%–20% of trials)
(Fig. 1). In all trials, the monkeys faced a 17" computer screen placed at a
distance of approximately 40 cm. A panel with three keys was located at arm’s
length. Trials were initiated when the monkey touched the central key. After a
variable delay (1.5–2.5 s in monkeys C and E, 2–4 s in monkey Y), the visual
conditioned stimulus appeared for a short period (0.3 s for monkeys C and E,
0.45 s in monkey Y).
In reference trials, the conditioned stimulus, located either on the left or the
right side of the screen, was one of a set of four, each associated with a different
probability (0.25, 0.50, 0.75 and 1.00) of receiving an equal amount of reward
upon correct trial completion. The visual stimulus occupied half of the screen
(corresponding to approximately 24 � 36 visual degrees). The stimulus
presentation was followed by a fixed hold period (2 s for monkeys Y and C,
1.5 s for monkey E), after which a ‘go’ signal appeared. The monkeys were
required to press either the left or the right key, corresponding to the location
of the memorized stimulus, within an allowed response time of 800 ms for
monkeys C and E and 700 ms for monkey Y. Correct responses were followed
(with an interval of 700 ms) by a liquid reward, according to the probability
associated with the conditioned stimulus. No external stimulus indicated the
expected time of the reward.
In decision trials, the stimulus presentation phase consisted of a simulta-
neous display of two stimuli in both possible locations, and the monkeys could
choose to press either the left or the right key. Equal-probability stimulus pairs
were not excluded. The monkeys were then rewarded according to the
probability associated with the stimulus that appeared in the chosen location.
All other parameters (prestimulus duration, stimulus duration, hold duration,
maximum response time and reward delay) were identical in the decision and
reference trials.
All trials (incorrect, correct, rewarded and unrewarded) were followed by
a variable intertrial interval (ITI): 3–6 s in monkeys E and C, 5–7 s in monkey
Y. The monkeys performed 300–500 trials on most training and recording days.
Monkeys were trained for 5–6 d per week and were allowed free access to food
and water on the weekends. The monkeys were not trained for gaze fixation.
The trial sequence was completely randomized. Every trial was chosen, with
a preset probability, to be either a reference trial (P ¼ 0.8 or 0.9) or a decision
trial (P ¼ 0.1 or 0.2). In reference trials, the right or left locations of the
NATURE NEUROSCIENCE VOLUME 9 [ NUMBER 8 [ AUGUST 2006 1061
ART ICLES©
2006
Nat
ure
Pub
lishi
ng G
roup
ht
tp://
ww
w.n
atur
e.co
m/n
atur
eneu
rosc
ienc
e
stimulus were then drawn with an equal probability, as was the stimulus
identity. In decision trials, the stimuli on each side were chosen in the same
way. All trial parameters (trial type, stimulus location and identity and the
length of the variable-duration trial segments) were randomly chosen with the
same random number generator. To avoid repetition of the same random
sequence, the seed of the random number generator was changed with each
initiation of the behavioral program, based on absolute time (srand and rand
functions, Visual C++ 6.0).
The monkeys were fully trained on the task and acquainted with all possible
stimuli before the recording chamber was implanted. Training consisted of
familiarization with the behavioral setup (12–20 training days), followed by
training on the task in a deterministic regime in which all correctly performed
trials were rewarded (60–92 training days, to a criterion of 80% correct
performance). For this part of the training we used a different stimulus from
those used in the experiment. Finally, we introduced the set of conditioned
stimuli and the associated reward probabilities (for 30–41 training days). The
same set was then used in the recording days (45–150 days of recording from
multiple structures).
Magnetic resonance imaging (MRI) localization of recording targets. We
estimated the stereotaxic coordinates of the substantia nigra pars compacta
(SNc) according to MRI scans aligned with an anatomical atlas of Macaca
fasicularis34,35. After training, a square Cilux recording chamber with a 27-mm
(inner) side was attached to the skull with its center targeted at stereotaxic
coordinates of the SNc. The recording chamber was tilted 40–501 laterally in
the coronal plane. The chamber’s coordinate system was adjusted according to
MRI imaging. An MRI scan (Biospec Bruker 4.7 Tesla animal system, fast-spin
echo sequence; effective TE ¼ 80 ms and TR ¼ 2.5 s; 13 coronal slices, 1 or
2 mm wide) was performed with 150-mm diameter tungsten electrodes
at accurate coordinates of the chamber. We then aligned the two-dimensional
MRI images with the sections of the atlas. All surgical and MRI procedures were
performed under general and deep anesthesia.
Recording and data acquisition. During recording sessions, the monkeys’ heads
were immobilized, and 4–8 glass-coated tungsten microelectrodes (impedance
0.3–1.2 MO at 1,000 Hz), confined within a cylindrical guide (1.65 mm inner
diameter), were advanced separately (EPS, Alpha-Omega Engineering) into the
SNc. The electrical activity was amplified with a gain of �10k and band-pass
filtered with a 300–6,000 Hz four-pole Butterworth filter (MCP+, Alpha-Omega
Engineering). Upon reaching the target area in the SNc, as judged by the
stereotaxic and MRI coordinates and by the electrophysiological hallmarks of the
encountered structures along the penetration, dopamine cells were identified
according to their low frequency (o15 Hz nonperiodic discharge), long
duration (41.5 ms) and polyphasic spikes36,37, and by a firing elevation in
background single- and multi-unit activity in response to unexpected
reward34,38. After recording, the electrode tracks were generally followed to the
neighboring structures, further aiding verification of the recorded structures39.
Neuronal activity was sorted and classified online using a template-matching
algorithm (MSD, Alpha-Omega Engineering). Spike-detection pulses and
behavioral events were sampled at 12 kHz (AlphaMap, Alpha-Omega Engi-
neering). Gaze positions were recorded by an infrared reflection detector
(Dr. Bouis). The infrared signal was amplified with a gain of �500, band-pass
filtered with a 1–100 Hz four-pole Butterworth filter (MCP+, Alpha-Omega
Engineering), and sampled at 750 Hz. The signal was not calibrated and thus
did not allow for conversion of analog to digital (A/D) units to visual angles. In
addition, three digital video cameras recorded the monkeys’ faces and upper
and lower limbs.
Statistical analysis. The first step in the neuronal data analysis targeted
verification of the real-time isolation quality and stability of the spiking activity.
Only spike trains considered to be emitted by a single cell during real-time
sorting were subjected to rate-stability analysis, in which the instantaneous
firing rate of the neuron in task-neutral periods was examined for changes. The
firing rate during the ITI period in consecutive trials in the entire recording
session was graphically displayed, and the largest continuous segment of
stable data was selected for further analysis. Stable cells were chosen for the
database after examination for response to at least one behavioral event
(visual stimulus, reward, and reward-omission) in the reference task, using a
Mann-Whitney U-test (P o 0.05 after a Bonferroni correction for multiple
comparisons). Only cells that were stable for at least five trials of each condition
in the reference task and at least three pair combinations in the decision task
were included.
Cell responses to behavioral events for ANOVA, linear regression, logistic
regression and partial correlation analysis were parameterized as the difference
between average firing rate in the 400 ms following the event and that in the
preceding 400 ms. The 400-ms time window was chosen as the average time in
which neuronal responses in reference trials returned to baseline (Fig. 5). Some
individual neurons had longer responses. We therefore repeated the analyses
with 500-ms windows. This analysis yielded comparable results. The neuronal
data presented here relies on population averages of all recorded cells, normal-
ized by the number of trials recorded from each cell. Averaging responses
normalized for baseline firing rate, as well as for maximum response rate, did
not affect the results.
For linear regression of the relative fraction of choice as a function of the
relative neuronal and reward reinforcements, the proportion variables (p) were
converted from the [0,1] range using an angular transformation40:
y ¼ arcsinð ffiffiffip
p Þ.Choice probability was also examined using logistic regression analysis40,
which investigates the relation of continuous independent variables to binomial
dependent variables by the following logistic model:
p ¼ ebTx
1 + ebTx;
where p is the probability of the dependent variable, x is the vector of predictors
and b is a vector of the regression coefficients. The parameters of the logistic
model were estimated using maximum likelihood estimation, and the overall
likelihood of the model can be examined and compared to other models.
Statistical analysis of the neuronal data during reward delivery in decision
trials is problematic, owing to the experimental design and the behavioral
strategy of the monkeys. Because of the probabilistic regime of our reward
schedule, the number of rewards increased consistently with the presumed
independent variable, the ‘action value’, creating an imbalance in the respective
sample sizes and their variability. This effect was also inflated by the monkeys’
probability matching behavior (Fig. 2b).
Traces of eye position recordings were subjected to three statistical tests to
verify that future action in decision trials was not correlated with eye positions
in early segments of the trial. A t-test checked for systematic differences in gaze
direction between trial types at the time of the stimulus presentation and at the
end of the examination window of neuronal responses (400 ms after cue onset).
To identify possible temporal patterns of eye movement, PCA was conducted
on all sequences of sampled eye positions; the analyzed segments started 1 s
before the stimulus display and ended 400 ms after display, at which time our
examination of neuronal responses ended. In this type of analysis, the multi-
dimensional data are searched for a smaller set of dimensions that define a new
space that explains most of the variability in the data. These dimensions or
principal components are ordered according to the fraction of variability for
which they account. Formally, the principal components are the eigenvectors of
the covariance matrix describing the data. One application of PCA is clustering
of data by projecting the different data points onto the lower dimension space.
We projected the eye positions from the reference trials in the relevant 1,400-ms
trial segment onto the two-dimensional spaces defined by the first and second
components and by the third and fourth components (Fig. 3b), to search for
visually distinguishable clusters between the two movement directions (right
and left). We then added the data points corresponding to the decision trials
and visually examined their mapping in these spaces. Finally, we devised an
index indicating the amount of time the gaze was directed toward the right
during segments starting 1 s before stimulus display and ending 400 ms after
display. We established the baseline as the mean horizontal eye position during
the ITI. Variability was assessed in the same period. ‘Right’ annotates all
samples in which the A/D value exceeded baseline by over 1 s.d., and ‘left’
annotates the samples below baseline by at least 1 s.d. (more conservative
thresholds were also checked, yielding qualitatively similar results):
Seeright ¼Tright � Tleft
Ttrial;
where Tright is the number of samples gazing right in a trial.
1062 VOLUME 9 [ NUMBER 8 [ AUGUST 2006 NATURE NEUROSCIENCE
ART ICLES©
2006
Nat
ure
Pub
lishi
ng G
roup
ht
tp://
ww
w.n
atur
e.co
m/n
atur
eneu
rosc
ienc
e
To transform this index into a normally distributed variable we computed its
Fisher z-transformation40:
Zright ¼1
2ln
1 + Seeright
1 � Seeright
� �
and subjected this new variable to a t-test.
All data analysis was performed using Matlab 7.0 (MathWorks) code.
Note: Supplementary information is available on the Nature Neuroscience website.
ACKNOWLEDGMENTSWe thank Y. Prut, Y. Engel, Y. Ritov, N. Daw, Y. Niv and R. Paz for fruitfuldiscussions and comments on earlier versions of this manuscript; andG. Goelman and V. Sharkansky for technical assistance. This study was partlysupported by a Center of Excellence grant administered by the Israel ScienceFoundation (ISF) and by a ‘Fighting against Parkinson’ grant administered bythe Netherlands Friends of the Hebrew University (HUNA). G.M. was supportedby a Horowitz fellowship.
COMPETING INTERESTS STATEMENTThe authors declare that they have no competing financial interests.
Published online at http://www.nature.com/natureneuroscience
Reprints and permissions information is available online at http://npg.nature.com/
reprintsandpermissions/
1. Herrnstein, R.J. On the law of effect. J. Exp. Anal. Behav. 13, 243–266 (1970).2. Tversky, A. & Kahneman, D. The framing of decisions and the psychology of choice.
Science 211, 453–458 (1981).3. Bayer, H.M. & Glimcher, P.W. Midbrain dopamine neurons encode a quantitative reward
prediction error signal. Neuron 47, 129–141 (2005).4. Sugrue, L.P., Corrado, G.S. & Newsome, W.T. Matching behavior and the representation
of value in the parietal cortex. Science 304, 1782–1787 (2004).5. Romo, R., Hernandez, A. & Zainos, A. Neuronal correlates of a perceptual decision in
ventral premotor cortex. Neuron 41, 165–173 (2004).6. Barraclough, D.J., Conroy, M.L. & Lee, D. Prefrontal cortex and decision making in a
mixed-strategy game. Nat. Neurosci. 7, 404–410 (2004).7. Samejima, K., Ueda, Y., Doya, K. & Kimura, M. Representation of action-specific reward
values in the striatum. Science 310, 1337–1340 (2005).8. Pagnoni, G., Zink, C.F., Montague, P.R. & Berns, G.S. Activity in human ventral striatum
locked to errors of reward prediction. Nat. Neurosci. 5, 97–98 (2002).9. Sutton, R.S. & Barto, A.G. Reinforcement Learning: an Introduction (MIT Press, Cam-
bridge, Massachusetts, 1998).10. Rummery, G.A. & Niranjan, M. On-line Q-learning using connectionist systems.
Technical Report CUED/F-INFENG/TR 166 (Engineering Department, CambridgeUniversity, Cambridge, UK, 1994).
11. Watkins, C.J.C.H. & Dayan, P. Q learning. Mach. Learn. 8, 279–292 (1992).12. Dayan, P. & Balleine, B.W. Reward, motivation, and reinforcement learning. Neuron 36,
285–298 (2002).13. Schultz, W., Dayan, P. & Montague, P.R. A neural substrate of prediction and reward.
Science 275, 1593–1599 (1997).14. Fiorillo, C.D., Tobler, P.N. & Schultz, W. Discrete coding of reward probability and
uncertainty by dopamine neurons. Science 299, 1898–1902 (2003).
15. Satoh, T., Nakai, S., Sato, T. & Kimura, M. Correlated coding of motivation and outcomeof decision by dopamine neurons. J. Neurosci. 23, 9913–9923 (2003).
16. Morris, G., Arkadir, D., Nevet, A., Vaadia, E. & Bergman, H. Coincident but distinctmessages of midbrain dopamine and striatal tonically active neurons. Neuron 43, 133–143 (2004).
17. Nakahara, H., Itoh, H., Kawagoe, R., Takikawa, Y. & Hikosaka, O. Dopamine neurons canrepresent context-dependent prediction error. Neuron 41, 269–280 (2004).
18. Pan, W.X., Schmidt, R., Wickens, J.R. & Hyland, B.I. Dopamine cells respond topredicted events during classical conditioning: evidence for eligibility traces in thereward-learning network. J. Neurosci. 25, 6235–6242 (2005).
19. Gurney, K., Prescott, T.J., Wickens, J.R. & Redgrave, P. Computational models of thebasal ganglia: from robots to membranes. Trends Neurosci. 27, 453–459 (2004).
20. Mink, J.W. The basal ganglia: focused selection and inhibition of competing motorprograms. Prog. Neurobiol. 50, 381–425 (1996).
21. Bar-Gad, I., Morris, G. & Bergman, H. Information processing, dimensionality reductionand reinforcement learning in the basal ganglia. Prog. Neurobiol. 71, 439–473(2003).
22. Barto, A.G. Adaptive critics and the basal ganglia. in Models of Information Processingin the Basal Ganglia (eds. Houk, J.C., Davis, J.L. & Beiser, D.G.) 215–232 (MIT Press,Cambridge, Massachusetts, 1995).
23. Reynolds, J.N., Hyland, B.I. & Wickens, J.R. A cellular mechanism of reward-relatedlearning. Nature 413, 67–70 (2001).
24. McClure, S.M., Daw, N.D. & Montague, P.R. A computational substrate for incentivesalience. Trends Neurosci. 26, 423–428 (2003).
25. Tobler, P.N., Fiorillo, C.D. & Schultz, W. Adaptive coding of reward value by dopamineneurons. Science 307, 1642–1645 (2005).
26. Wolford, G., Miller, M.B. & Gazzaniga, M. The left hemisphere’s role in hypothesisformation. J. Neurosci. 20, RC64 (2000).
27. Vulkan, N. An economist’s perspective on probability matching. J. Econ. Surv. 14,101–118 (2000).
28. Lau, B. & Glimcher, P.W. Dynamic response-by-response models of matching behavior inrhesus monkeys. J. Exp. Anal. Behav. 84, 555–579 (2005).
29. Dommett, E. et al. How visual stimuli activate dopaminergic neurons at short latency.Science 307, 1476–1479 (2005).
30. Wise, R.A. Dopamine, learning and motivation. Nat. Rev. Neurosci. 5, 483–494(2004).
31. Cragg, S.J. & Rice, M.E. DAncing past the DAT at a DA synapse. Trends Neurosci. 27,270–277 (2004).
32. Wickens, J.R. & Arbuthnot, G.W. Structural and functional interactions in the striatum atthe receptor level. in Dopamine (eds. Dunnett, S.B., Bentivoglio, M., Bjorklund, A. &Hokfelt, T.) 199–236 (Elsevier, Amsterdam, 2005).
33. Waelti, P., Dickinson, A. & Schultz, W. Dopamine responses comply with basicassumptions of formal learning theory. Nature 412, 43–48 (2001).
34. Szabo, J. & Cowan, W.M. A stereotaxic atlas of the brain of the cynomolgus monkey(Macaca fascicularis). J. Comp. Neurol. 222, 265–300 (1984).
35. Martin, R.F. & Bowden, D.M. Primate Brain Maps: Structure of the Macaque Brain(Elsevier Science, Amsterdam, 2000).
36. Grace, A.A. & Bunney, B.S. Intracellular and extracellular electrophysiology of nigraldopaminergic neurons–1. Identification and characterization. Neuroscience 10,301–315 (1983).
37. Ungless, M.A., Magill, P.J. & Bolam, J.P. Uniform inhibition of dopamine neurons in theventral tegmental area by aversive stimuli. Science 303, 2040–2042 (2004).
38. Hollerman, J.R. & Schultz, W. Dopamine neurons report an error in the temporalprediction of reward during learning. Nat. Neurosci. 1, 304–309 (1998).
39. Nevet, A., Morris, G., Saban, G., Fainstein, N. & Bergman, H. Discharge rate ofsubstantia nigra pars reticulata neurons is reduced in non-parkinsonian monkeys withapomorphine-induced orofacial dyskinesia. J. Neurophysiol. 92, 1973–1981 (2004).
40. Sokal, R.R. & Rohlf, F.J. Biometry (W.H. Freeman & Co., New York, 1981).
NATURE NEUROSCIENCE VOLUME 9 [ NUMBER 8 [ AUGUST 2006 1063
ART ICLES©
2006
Nat
ure
Pub
lishi
ng G
roup
ht
tp://
ww
w.n
atur
e.co
m/n
atur
eneu
rosc
ienc
e