Embed Size (px)
Citation preview

National Capital Region
Federal Parking Study
An Accessibility-Based Approach for Federal Facilities Parking Policies
September 2017
ii
Notice
This document was prepared by the U.S. Department of Transportation for the National
Capital Planning Commission. The United States Government assumes no liability for the
contents or use thereof.
The United States Government does not endorse products or manufacturers. Trade or
manufacturers’ names appear herein solely because they are considered essential to the
objective of this report.

iii
Page Intentionally Left Blank
iv
Acknowledgements
The U.S. Department of Transportation John A. Volpe National Transportation Systems Center (Volpe Center)
prepared this study on behalf of the National Capital Planning Commission (NCPC). The project team consisted
of David Daddio (team leader), Jessica Baas, and Drew Quinton of the Transportation Planning Division,
Stephen Zitzow-Childs of the Organization Performance Division, and Scott Smith of the Technology Innovation
& Policy Division.
Kael Anderson of NCPC’s Planning Research and Policy Division was the project lead. Michael Weil, Michael
Sherman, Jennifer Hirsch, and Paul Jutton contributed to the effort.
NCPC and the Volpe Center would like to thank the Metropolitan Washington Council of Governments for
providing access to the regional transportation model. Dusan Vuksan, Roland Milone, and Meseret Seifu
fielded questions and supplied model outputs.

v
Table of Contents
Executive Summary ............................................................................................................ 1
Study Purpose and Scope .................................................................................................................................. 1
Study Findings..................................................................................................................................................... 3
Key Study Conclusions ....................................................................................................................................... 6
Recommendations ............................................................................................................................................. 8
Background and Context ................................................................................................. 12
Introduction ....................................................................................................................................................... 12
NCPC Parking Policy ......................................................................................................................................... 12
Current and Projected Land Use and Transportation Conditions in the National Capital Region ............... 13
Historical Context of Parking Policy ................................................................................................................. 18
Parking Policies at Principal Federal Agencies ............................................................................................... 23
Study Assumptions ........................................................................................................................................... 27
Literature Review ............................................................................................................. 28
Introduction ....................................................................................................................................................... 28
Developing Parking Policy ................................................................................................................................ 28
Case Studies ..................................................................................................................................................... 33
Literature Review Findings ............................................................................................................................... 36
Local Parking Comparison ............................................................................................... 38
Introduction ....................................................................................................................................................... 38
Background and Approach ............................................................................................................................... 38
Recent Zoning Code Updates .......................................................................................................................... 39
Parking Provision and Variance Processes in the NCR .................................................................................. 40
Overview of Local Jurisdiction Parking Regulations/Guidelines .................................................................... 42
Local Parking Comparison Findings ................................................................................................................ 46
Modeling Analysis ............................................................................................................ 49
Introduction ....................................................................................................................................................... 49
Methodology...................................................................................................................................................... 49
Analysis ............................................................................................................................................................. 57
Developing New Parking Policies using the Accessibility Analysis ................................................................. 69
Modeling Analysis Findings .............................................................................................................................. 74
Appendix A: NCPC Master Plan Review Process Summary .................................................... 76
Appendix B: NCPC’s Transportation Management Plan Standards ....................................... 79
Appendix C: Historic Context of NCPC’s Parking Policies ....................................................... 81
Appendix D: Federal Employee Commuting Policies .............................................................. 85
Appendix E: Transportation Demand Management Strategies .............................................. 88
Appendix F: Traffic Impact Assessments ................................................................................ 93
Appendix G: Detailed Descriptions of Jurisdictional Parking Regulations .............................. 95
District of Columbia .......................................................................................................................................... 95

vi
Montgomery County .......................................................................................................................................... 97
Prince George’s County .................................................................................................................................. 102
City of Alexandria ............................................................................................................................................ 105
Arlington County .............................................................................................................................................. 107
Fairfax County ................................................................................................................................................. 110
Loudoun County .............................................................................................................................................. 112
Prince William County ..................................................................................................................................... 114
Appendix H: Development and Limitations of the Volpe Model ........................................... 117
Model Limitations ........................................................................................................................................... 119
Bibliography .......................................................................................................................... 121

vii
List of Figures
Figure 1: NCPC Parking Policy Map ............................................................................................................................ 2 Figure 2: Map of Suggested New NCPC Parking Ratio Policies ................................................................................ 9 Figure 3: Map of Expected Land Use and Transportation Changes in the Region (2016-2030) ......................... 14 Figure 4: Change in Accessibility to Jobs by Automobile (2016-2040) .................................................................. 15 Figure 5: Change in Accessibility to Jobs by Transit (2016-2040) ......................................................................... 15 Figure 6: Current and Future Commute Mode Shares Across the Region ............................................................. 16 Figure 7: Evolution of Parking Policy Nationally ....................................................................................................... 18 Figure 8: NCPC Parking Policy Milestones ............................................................................................................... 20 Figure 9: Excerpt from 1969 Comprehensive Plan ................................................................................................. 21 Figure 10: 1989 Comprehensive Plan Parking Ratio Zone Map ............................................................................ 22 Figure 11: Map Depicting MWCOG and NCPC Boundaries ..................................................................................... 50 Figure 12: Map of Expected Land Use and Transportation Changes in the Region (2016-2030) ....................... 51 Figure 13: Calculating the Accessibility Ratio .......................................................................................................... 52 Figure 14: Transit and Automobile Accessibility Concept ....................................................................................... 52 Figure 15: Accessibility Ratio Concept Applied to Regional Examples ................................................................... 53 Figure 16: NCPC Parking Policy Map and Federal Facilities ................................................................................... 55 Figure 17: Comparison of Observed (Current) and Comprehensive Plan Parking Ratios at Select Federal
Facilities ....................................................................................................................................................... 57 Figure 18: Map of the Accessibility Ratio for the NCR (2016) ................................................................................ 59 Figure 19: Observed (Current) Parking Ratio Compared to Accessibility Ratio (Volpe Model) ............................. 60 Figure 20: Map of the Change in the Accessibility Ratio from Regional Transportation Improvements (2016-
2030) ........................................................................................................................................................... 62 Figure 21: Map of the Accessibility Ratio for the NCR (2030) ................................................................................ 63 Figure 22: Observed (2016) and Predicted (2030) Parking Ratios for Select Federal Facilities Using the Volpe
Model ........................................................................................................................................................... 64 Figure 23: Map of the Accessibility Ratio in the NCR Core (2030) ......................................................................... 65 Figure 24: Accessibility Ratios Across the Metrorail System (2016) ...................................................................... 66 Figure 25: Map of Predicted (Future) Parking Ratios (2030) ................................................................................. 70 Figure 26: Proposed NCPC Parking Policy Map ....................................................................................................... 71 Figure 27: Observed (2016) and Predicted (2030) Parking Ratios Compared to Proposed Parking Ratio Policies
72 Figure 28: Washington in the Metro Region ............................................................................................................ 95 Figure 29: DC Zoning Map (DC Office of Zoning) ..................................................................................................... 95 Figure 30: Montgomery County in the Metro Region ............................................................................................... 97 Figure 31: Map of Montgomery County Parking Lot Districts (in red) .................................................................... 99 Figure 32: Prince George's County in the Metro Region ....................................................................................... 102 Figure 33: City of Alexandria in the Metro Region ................................................................................................. 105 Figure 34: Map of Alexandria Parking Districts ..................................................................................................... 106 Figure 35: Arlington County in the Metro Region ................................................................................................... 107 Figure 36: Arlington County in the Metro Region ................................................................................................... 107 Figure 37: Fairfax County in the Metro Region ...................................................................................................... 110 Figure 38: Loudoun County in the Metro Region ................................................................................................... 112 Figure 39: Prince William County in the Metro Region .......................................................................................... 114 Figure 40: Calculating Final Predicted Parking Ratio ............................................................................................ 117 Figure 41: Calculating the Shuttle Adjustment ...................................................................................................... 118 Figure 42: Adjusting Volpe Model predictions for additional parameters ............................................................ 119

viii
List of Tables
Table 1: Summary Comparison of NCR Local Parking Standards .......................................................................... 41 Table 2: List of Ratios ................................................................................................................................................ 54 Table 3: Selected Facility TMP Details ..................................................................................................................... 56 Table 4: Description of Shuttle Services by Facility ................................................................................................. 67 Table 5: Prospective Impact of New Employee Shuttle Services ............................................................................ 68 Table 6: Existing Versus Proposed Policy Zones at Sampled Facilities .................................................................. 73 Table 7. Minimum Parking Standards Table for Select Uses in the District of Columbia ..................................... 96 Table 8: Parking Standards for Commercial/Employment Zones and Parking Benefit Districts in Montgomery
County ........................................................................................................................................................ 100 Table 9: Parking Standards Table for Agricultural, Rural, Residential, and Industrial Zones ............................. 101 Table 10: Prince George’s County Minimum Parking Standards for Select Uses ................................................ 104 Table 11: City of Alexandria Minimum Parking Standards for Select Uses .......................................................... 106 Table 12: Arlington County Parking Standards for Select Uses ............................................................................ 109 Table 13: Fairfax County Parking Standards for Select Uses ............................................................................... 111 Table 14: Loudoun County Parking Standards for Select Uses ............................................................................ 113 Table 15: Parking Minimums for Prince William County ....................................................................................... 115
List of Abbreviations
APA American Planning Association
DC Washington, DC
CEA Washington, DC Central Employment Area
CLRP Constrained Long-Range Transportation Plan
GFA Gross Floor Area
HOT/HOV High Occupancy Toll/High Occupancy Vehicle
MPO Metropolitan Planning Organization
MWCOG Metropolitan Washington Council of Governments
NSF Naval Support Facility
NCPC National Capital Planning Commission
NCR National Capital Region
NSF Naval Support Facility
SOV Single-Occupant-Vehicle
TAZ Transportation Analysis Zones
TIA Traffic Impact Assessments
TDM Transportation Demand Management
TMP Transportation Management Plan or Program
TPB Transportation Planning Board
U.S. DOT United States Department of Transportation

1
Executive Summary
Study Purpose and Scope
Background
The National Capital Planning Commission (NCPC or Commission) is responsible for comprehensive planning
and development oversight for federal properties and interests in the National Capital Region (NCR). The NCR
includes Washington, DC; Montgomery and Prince George’s Counties in Maryland; Arlington, Fairfax, Loudoun,
and Prince William Counties in Virginia; and the cities contained within. NCPC’s mission is to preserve and
enhance the extraordinary historical, cultural, and natural resources and federal assets of the National Capital
Region to support the needs of the federal government and enrich the lives of the region’s visitors, workers,
and residents. The Federal Elements of the Comprehensive Plan for the National Capital (Comprehensive Plan)
are the blueprint on which NCPC evaluates plans and proposals for federal development. The core principles of
the Comprehensive Plan include:
1. Accommodate federal and national capital activities.
2. Reinforce smart growth and sustainable development planning principles.
3. Support local and regional planning and development objectives.
NCPC’s parking policies are provided in the Comprehensive Plan’s federal Transportation Element. The
element serves to develop and maintain a multi-modal regional transportation system that meets the travel
needs of workers, residents, and visitors, while
improving regional mobility and accessibility
through expanded transportation alternatives and
transit-oriented development.
While travel time, cost, and demographics
ultimately determine transportation mode
choices that individuals make, perhaps no aspect
of the built environment affects travel decisions
more than the availability of parking. When
coupled with the provision of transit and
carpooling infrastructure, financial incentives,
and other Transportation Demand Management
(TDM) approaches, reducing parking is an
effective means to manage travel behavior. Local
governments, institutions, and companies across
the country utilize a variety of approaches to
reduce single-occupant-vehicle (SOV) commuting.
For NCPC, parking policies are essential to
fulfilling its planning role related to managing air
and water quality, energy security, costs, and
efficient development in the region.
Study Purpose:
Assess NCPC’s parking policies in
light of industry best practices
and available data.
NCPC tasked the U.S. Department of Transportation’s John A.
Volpe National Transportation Systems Center (Volpe Center)
with conducting a review of its parking policies. NCPC has not
updated these policies in over a decade.
The assessment includes an analysis of NCPC Comprehensive
Plan parking ratio policies in light of current and predicted
future transportation accessibility at a range of federal facility
locations throughout the NCR. The underlying analysis is
intended to inform potential updates to NCPC’s policies,
guidelines, and plan development processes.

2
One primary policy mechanism by which NCPC guides federal facility and transportation planning is through
explicit, geographically-based parking ratio policies (see Figure 1). This mechanism has significant implications
for travel across the region, significantly increasing regional transit use and carpooling. There are
approximately 120 federal properties in the NCR, including approximately 40 major installations and
campuses that are subject to this policy. The area’s more than 400,000 civilian and military federal employees
make up almost 12 percent of the region’s workforce.1 Approximately 40 percent of Metrorail’s riders during
peak travel times are federal employees.2
Figure 1: NCPC Parking Policy Map
Zone Location Parking Ratio
Policies
Central Employment Area 1:5
Historic District of Columbia Boundary 1:4
Suburban Washington within 2,000 feet of a Metrorail station 1:3
Suburban Washington more than 2,000 feet from a Metrorail station 1:15 - 1:2
(site dependent)
Each zone approximates regional accessibility based on the distance to downtown Washington, DC and
proximity to Metrorail stations and high occupancy vehicle/toll (HOV/HOT) lanes. These policies are designed
to reduce parking availability in areas where transit accessibility is high and employee carpooling is more likely,
while allowing for more parking spaces in outlying suburban areas. They are intended to be aspirational goals,
with 20-30 year time horizons. They range from one parking space per five employees at Downtown
Washington facilities, to one space per 1.5 employees at facilities where transit and carpooling may be less
practical.

3
Study Scope
This report is organized into four chapters:
Background and Context reviews key information about existing NCPC policies, current and projected
regional land use and transportation conditions, the history and evolution of parking policy both
nationally and at NCPC, and the parking policies of NCPC’s principal federal partners to inform overall
assumptions for the study.
Literature Review examines transportation academic literature, industry best practices, and case
studies to understand the state of the practice for determining parking supply and instituting
transportation demand management (TDM) policies.
Local Parking Comparison details and contrasts NCPC’s parking policies and processes to jurisdictions
throughout the region.
Modeling Analysis analyzes NCPC parking policies at a representative sample of federal facilities in the
NCR based on transportation accessibility data from the regional transportation model.
Study Findings
The Volpe Center identified several key findings for each study component, summarized below.
Literature Review
The transportation academic literature, industry best practices, and case study examples provide important
context for the Commission to consider when revising its transportation and parking policies. The study team
identified the following key themes from this research:
Accessibility Paradigm: Since the mid-1990s, the transportation industry is increasingly moving
towards an accessibility paradigm focused on moving people to destinations. This is a significant
departure from the previous paradigm focused on moving vehicles; resulting in important policy
implications for transportation planning, policy, and engineering. This paradigm shift is broadly
consistent with NCPC’s current approach to transportation and parking policy.
Determinants of Mode Choice: Parking availability, paired with travel time and out-of-pocket costs, is
key to mode choice decisions. As such, jurisdictions and large institutions like hospital and
universities are limiting parking availability and instituting TDM. Consistent with NCPC’s policy
framework, prevailing approaches to moderating parking demand include developing transportation
alternatives, subsidizing transit commuting, and pricing parking.
Use of Analytical Tools: Parking policy should be considered in light of both data and broader
sustainability and multi-modal transportation goals. Therefore, in making parking supply decisions,
NCPC and its federal partners should carefully analyze quantitative estimates of parking demand, the
relative convenience of alternative transportation modes, and the long-term costs of parking. These
tools are designed to inform, rather than prescribe, what parking supply is appropriate for a given
location.

4
Ongoing Performance Monitoring: Consistent oversight and monitoring is key to the success of TDM
programs. Without performance monitoring, there is no way to ensure achievement of mode share
goals. Most successful TDM programs rely on annual or biennial reporting to ensure compliance.
NCPC and its federal partners have limited capacity to engage in ongoing monitoring activities, but
ongoing performance monitoring is an essential element of any TDM program.
Local Parking Comparison
NCPC has different review tools and authorities than local jurisdictions. That said, NCR jurisdictions are
national leaders in encouraging transit use and more efficient land use patterns. Local jurisdictions are
increasingly adopting provisions to reduce the amount of parking built. The study team’s survey identified the
following local trends, which may be helpful reference points for NCPC:
Limiting/Eliminating Parking Requirements: Local jurisdictions are shifting from parking minimums,
which have historically caused parking to be overbuilt, to maximums. In some locations, jurisdictions
are eliminating parking requirements altogether (e.g., Downtown Washington).
Allowing Flexibility: Most local jurisdictions have streamlined and transparent variance policies. These
data-driven processes allow developers to depart from parking requirements and, pursuant to
established criteria, construct less parking than is required by a jurisdictions policy (e.g., Arlington
County).
Implementing Ongoing Transportation Demand Management Monitoring: Some jurisdictions set mode
share goals in transit rich areas. Successful programs routinely monitor progress towards mode share
targets by regularly surveying commuters (e.g., Montgomery County).
Pricing/Sharing Parking: Most jurisdictions price parking in high demand areas or encourage shared
parking between nearby developments. These strategies are particularly prevalent in areas where
transportation alternatives are available (e.g., Fairfax County).
Modeling Analysis
In some cases, federal facilities in the region are providing significantly more parking per employee than
established under NCPC’s Comprehensive Plan parking ratio policies. The study team sought to explain the
variability in parking supply at federal facilities using available, objective data that describes transportation
access across the region. This analysis has important implications for NCPC’s ability to achieve the core
principles in its Comprehensive Plan:

5
Accessibility Predicts Parking: Using the
Metropolitan Washington Council of
Government’s (MWCOG) regional
transportation model, the study team
calculated the relative convenience of
reaching each location in the region by
transit and automobile. Termed the
“accessibility ratio,” the study team
divided the number of households
accessible via transit to a particular
federal facility by the number of
households accessible via automobiles
during peak commuting times. Using
this ratio, the study team developed a
model (termed the Volpe Model) to
explain over 90 percent of the variation
in parking at 20 sampled federal
facilities. The Volpe Model provides an
important baseline for understanding
parking provision at federal facilities and developing policy. Using this model, the Volpe Center
developed an NCPC Parking Supply Tool to assist NCPC staff in determining parking supply at
individual federal facilities. The tool can be updated with new accessibility data as MWCOG updates
the regional transportation model.
Variability within the Historic DC Boundary: Accessibility varies widely within the Historic DC Boundary
Zone (1 parking space: 4 employees) from urban, transit-accessible locations adjacent to the Central
Employment Area (CEA), to suburban, largely auto-dependent locations further from downtown. This
indicates that some federal facilities are more equipped to meet NCPC Comprehensive Plan parking
ratio policies than others, depending on their proximity to transportation infrastructure and
households. This finding suggests a need to reconsider NCPC policies within this zone to ensure they
are not only aspirational, but also realistic and achievable.
A Changing Regional Core: Accessibility will change significantly by 2030 in the region’s core due to
planned transportation improvements, projected household growth, and changes in congestion. While
transit accessibility will increase in suburban locations near planned transit improvements like the
Metrorail Silver Line extension and Purple Line light rail, Downtown Washington will experience the
most significant increases. This has important implications for federal facilities in or near these
locations.
Adjusting for Employee Shuttles, Teleworking, and Alternative Work Schedules: Using the Volpe Model,
the NCPC Parking Supply Tool enables staff to estimate parking needs at individual facilities based on
regional accessibility metrics during peak commute times. This tool includes adjustments to help
NCPC staff and federal partners to estimate the impact of employee shuttles, teleworking, and
alternative work schedules on a facility’s ability to meet Comprehensive Plan parking ratio policies.
Employee Shuttles to Metrorail can provide a significant accessibility boost for some federal facilities,
particularly those that are near shoulder Metrorail stations. The Volpe Center’s preliminary analysis
based on outputs from the MWCOG model show that federal facilities located near, but not adjacent
to, shoulder Metrorail stations benefit the most from shuttles. Therefore, Naval Support Facility (NSF)
Accessibility:Number of households that can travel to a particular
location, within a given time threshold, during peak
commuting times by transit compared to automobile.
6
Carderock, NSF Arlington, Joint Base Anacostia-Bolling, and the Food and Drug Administration (FDA)
White Oak campus could benefit significantly from employee shuttles that connect to nearby Metrorail
stations. Facilities near core stations are already in high accessibility ratio areas and therefore do not
significantly benefit from additional connections to the Metrorail. Facilities near the edges of the
Metrorail, including end-of-line stations, may see some incremental benefit from a shuttle connection,
but the potential benefit is small because these Metrorail stations are relatively inaccessible. This
analysis is based on the current transit network. Future improvements to the transit network would
tend to improve the effectiveness of employee shuttles. NCPC and its federal partner agencies would
need to conduct a more robust site-level analysis to predict the long-term impact of prospective
shuttle services. Shuttle routes and schedules can be programmed into the MWCOG model to directly
estimate accessibility changes. NCPC can use the Volpe Model to predict associated reductions in
parking.
Key Study Conclusions
In developing this study, the Volpe Center identified the following key conclusions regarding NCPC parking
policy and processes:
NCPC is a national leader in sustainable transportation and parking policy. Jurisdictions across the country are
increasingly employing parking policy approaches that NCPC first adopted almost thirty years ago.
NCPC first adopted parking ratio policies, or parking maximums, in 1989. These policies focus on limiting
parking and managing demand to achieve broader sustainability and economic efficiency policy goals. Taken
together, these policies ultimately influence the travel choices of some 400,000 federal employees across the
NCR. Undoubtedly, these policies are having a major effect. More traditional approaches tend to oversupply
parking at the expense of transit, carpooling, and non-motorized transportation modes; ultimately contributing
to congestion, air pollution, and the inefficient use of land and resources. NCPC’s approach represented a
departure from parking policy and engineering approaches at the time. Since the mid-2000s, land use and
transportation planners across the country are increasingly advocating for “efficiency-based” policies similar to
NCPC’s approach.
The cost and convenience of using different transportation modes are the key determinants of travel mode
choice. Using accessibility metrics, NCPC’s parking policies could more closely align with regional travel
conditions.
The geographic structure of NCPC’s Comprehensive Plan parking ratio policies is designed to reflect regional
accessibility. Accessibility metrics are a type of analytical tool that policymakers use to understand and
communicate the ease of travel between households and workplaces via different modes of transportation.
They quantify existing and future travel conditions in the region based on travel time, and other factors. NCPC
can use this objective data to inform updates to its parking policies. These updates should ensure that policies
reflect both the complexity of transportation access and anticipate future land use and transportation
conditions in the NCR. This approach is consistent with NCPC’s mission, analytically defensible, and firmly
grounded in regional and local transportation and land use plans and policies.
NCPC’s plan review process should account for the unique needs and missions of its federal partners through
a predictable, flexible, data-driven, and transparent process.
The missions and needs of NCPC’s federal partner agencies are varied and complex. While regional models
can estimate and predict the accessibility of particular locations, they cannot and will not account for all the
7
site-specific and installation-specific variables that may affect each facility’s parking needs. Facilities should be
able to respond rationally to site-specific drivers of parking demand; unique conditions; mission needs; and
estimated future demand. To that end, NCPC should consider developing a more standardized and formalized
variance process. This could include integrating analytical approaches and data requirements into the master
planning process with specific data requirements for master plans and Transportation Management Plans or
Programs (TMP). For example, staff could use the NCPC Parking Supply Tool to estimate the impact of potential
employee shuttles and account for the prevalence of teleworking, and alternative work schedules for specific
facilities. These analyses would enable federal partner agencies to justify requests for parking variances
pursuant to industry-standard approaches with analyses performed by private sector contractors.
Technological change is likely to significantly alter the transportation industry over the next 10-20 years. NCPC
should consider policies recognizing how technology could change regional travel patterns and reduce the
need for parking.
The automobile industry is on the verge of a major technological transformation with the development of
advanced automated vehicle technologies. Connected and automated will transform the way people commute
and travel in the next 10-20 years, with potentially major implications for parking policy, personal vehicle
ownership, congestion, and accessibility. The adoption of autonomous vehicles, coupled with increasing use of
ridesharing, may increase the need for designated drop-off areas. These trends could significantly reduce the
amount of parking that is needed at federal facilities in the NCR. Pursuant to these trends, many universities
are emphasizing transportation demand management strategies to reduce the need for parking spaces that
may be obsolete in the next decades. In some cases, universities are building structured parking that can be
easily repurposed for other uses.
NCPC is in a unique position to continue to drive federal and local mobility, efficiency, and sustainability goals
in the Region. Continued success depends on realistically achievable targets, ongoing partner coordination
and performance monitoring.
Data from federal facilities and the Metropolitan Washington Council of Governments (MWCOG) regional model
demonstrate that travel time and costs are important determinants of mode choice. When coupled with other
transportation options and transportation demand management approaches, NCPC and its federal partners
have achieved significant reductions in single occupant vehicle (SOV) use and parking, while increasing transit
use, carpooling, and non-motorized transportation. In a federal context, managing parking supply is a critical
component of reducing long-term agency costs, mitigating congestion, encouraging efficient land use patterns,
and improving regional air and water quality.

8
Recommendations
The Volpe Center conducted a thorough review of the transportation literature and industry best practices;
researched the parking policies and transportation demand management approaches of NCR jurisdictions; and
analyzed available data from federal facilities in the region and the regional transportation model. Based on
this research and the key findings described above, the study team developed recommendations for the
Commission to consider as NCPC explores updates to its policies, guidelines, and plan development processes.
NCPC should carefully consider parking supply in the context of available data, site-specific conditions, and the
feasibility of using alternative transportation modes. Based on this analysis, the Volpe Center organized its
recommendations for NCPC’s parking policies and processes into the following categories:
Data-Driven Policies
Standardized Modification Process
Performance-Based Monitoring
Data-Driven Policies
NCPC should consider adjusting its parking ratio
policies to track more closely with regional
accessibility, both current and projected. The
project team noted that, in some cases, federal
facilities are providing two to three times more
parking than indicated under NCPC’s
Comprehensive Plan parking ratio policies. This is particularly true in the Historic DC Boundary Zone (one
parking space: four employees), which covers a wide range of built environment contexts. This area includes
urban, transit-accessible locations adjacent to the CEA, and suburban, largely auto-dependent locations further
from downtown.
While NCPC’s Comprehensive Plan parking ratio policies are intended to be aspirational, they should also be
realistically achievable. The modeling exercise indicates that the Historic DC Boundary Zone should be broken
up into multiple zones based on accessibility. Based on the modeling analysis, NCPC could adjust this zone
into two or three zones based on projected 2030 regional land use and transportation changes and/or merged
with existing suburban zones (see Figure 2):
1:5+ – Regional Core: The L’Enfant City.
1:4 – Transit-Rich Corridors: Highly Metro-accessible portions of the Historic DC Boundary Zone.
1:3 – Transit Accessible: The remainder of the Historic DC Boundary Zone and suburban locations
within 2,000 feet of a Metrorail station.
1:1.5 - 1:2 – Suburban Areas Beyond Metrorail: All other locations in the region, including areas
served by HOT/HOV lanes or high-frequency commuter rail.
Parking policies should be both aspirational
and realistically achievable.The analysis indicates that NCPC’s Comprehensive Plan
ratio policies are too aggressive, including in some parts of
the 1:4 Historic DC Boundary Zone.

9
Figure 2: Map of Suggested New NCPC Parking Ratio Policies

10
Standardized Modification Process
NCPC’s parking policies could be more standardized.
Federal facilities in the region have unique needs,
including nationally significant research, military,
intelligence, and medical functions. Even with the
adjustments to parking ratio policies described above, a
regional policy map cannot distill the unique needs and
context of each of federal facility in the NCR. The study
team observed that many local jurisdictions use
transparent and data-driven parking variance processes
to allow private developers to provide less parking than
is required. However, federal agencies typically request
that NCPC allow them to have more parking than that
outlined under NCPC parking ratio policies.
Variance processes account for unique site-level
circumstances, use patterns, and needs of each agency
based on data. Indeed, the Commission has received and granted requests that allow applicant agencies to
provide more parking than specified in its parking ratio policies over the years.
NCPC could standardize this approach as a formal variance process; one that is consistent with the
Commission’s goals, available transportation data, and that accounts for the distinct missions of its federal
partners. For example, NCPC could modify parking ratios for particular installations pursuant to an objective,
criteria-based scoring system. The applicant agency would have to request a variance based on the following:
Accessibility Analysis: The applicant would demonstrate that the Comprehensive Plan parking ratio
policy is inappropriate for the facility. This analysis would show that the facility is more inaccessible by
transit than indicated by the NCPC Comprehensive Plan policies, even with a reliable employee
shuttle. NCPC staff would use the NCPC Parking Supply Tool to estimate parking needs at individual
facilities, exploring adjustments to the Comprehensive Plan parking ratio policies. The tool enables
staff to take into account the impact of prospective employee shuttles, teleworking, and alternative
work schedules at individual facilities. This analysis would include site-specific factors like security
perimeters, the potential for carpooling, and other factors. For example, the applicant agency might
show that that an employee shuttle is not feasible because of distance from Metrorail or that
employee household locations are too dispersed to feasibly carpool.
Mission Analysis: The applicant would demonstrate that the Comprehensive Plan parking ratio policy
impedes the unique mission of the facility. This analysis would show that the facility has parking
patterns and needs that are not accounted for in the policies. For example, the applicant might use a
demand study to demonstrate that employees have unusual shifts that require extra parking.
Lifecycle Cost Analysis: The applicant would quantify the capital and long-term operations cost to
taxpayers of providing surface or structured parking to employees. For example, the applicant might
show that it has taken steps to reduce the lifecycle cost of providing parking through a partnership
with a local jurisdiction.
While the Commission routinely
approves modified parking ratios,
NCPC does not have a standardized
process for agencies seeking
variances from Comprehensive Plan
parking ratio policies. The analysis points towards opportunities to
develop a process that is transparent,
predictable, and data-driven.
11
Performance-Based Monitoring
The effectiveness of NCPC’s parking and transportation
policies could be significantly strengthened with more
continuous, performance-based monitoring. Typically,
successful TDM programs rely on annual or biennial
monitoring and surveys to ensure progress towards
goals. In NCPC’s case, federal partner agencies typically
produce TMPs when master plans or projects increase
employment levels at a facility by 500 or more. The
average age of the data from the selected TMPs in this
study was four years, ranging in age from one to eight
years. According to NCPC staff, other major facilities in
the region have not engaged in the master planning
process in over a decade. More continuous follow-up and monitoring, data collection, and commuter surveys
are necessary to ensure that agencies are making progress towards achieving performance targets.
To that end, the Volpe Center recommends that NCPC staff collect data annually or biennially to assess each
affected federal facility’s progress towards Comprehensive Plan parking ratio policies. At a minimum, this data
collection would include an updated inventory of employee parking spaces and the number of full-time federal
employees who commute regularly to each site. A more robust monitoring program would include commuter
surveys from each facility, with uniform questions regarding mode split and travel patterns. This data could be
assembled into a periodic parking and transportation performance report to discuss during Commission
meetings and share with the public.
Successful transportation demand
management programs rely on
continuous monitoring programs. The analysis indicates that NCPC needs annual
or biennial monitoring to ensure that partner
agencies are making progress towards
Comprehensive Plan parking ratio policies.
12
Background and Context
Introduction
To place the study in context, the Volpe Center and NCPC staff sought to frame the study in light of existing
NCPC policies, current and projected regional land use and transportation conditions, the history and evolution
of parking policy nationally and at NCPC, and the parking policies of NCPC’s principal federal partners.
NCPC Parking Policy
The National Capital Planning Act (40 U.S.C. §8701 et seq.) requires federal agencies to consult with NCPC
when preparing plans and programs which affect NCPC’s Comprehensive Plan. The Comprehensive Plan is a
statement of principles, goals, and planning policies for the growth and development of the national capital
during the next 20 years. The Comprehensive Plan’s eight Federal Elements include Urban Design, Federal
Workplace, Foreign Missions & International Organizations, Transportation, Parks & Open Space, Environment,
Historic Preservation, and Visitors & Commemoration. With the exception of the Parks & Open Space Element,
which is currently in the process of an update, the Commission adopted the elements in 2016. While each
element addresses a specific planning topic, the elements work together to guide federal development in the
region.
The Transportation Element establishes the following goal: to develop and maintain a multi-modal regional
transportation system that meets the travel needs of workers, residents, and visitors while improving regional
mobility and accessibility through expanded transportation alternatives and transit-oriented development. The
NCR faces important transportation challenges which impact where people live and work, development
patterns, environmental quality, and the overall quality of life. The region is among the most congested in the
country and is served by an aging transportation system that operates near capacity. The federal government
has long played an influential role in the region’s transportation network, including helping to plan and fund the
Metrorail system. With employees, federal facilities, and other assets in the NCR, the federal government has a
strong interest in improving regional transportation services and infrastructure.
Within this policy context, approximately 40 federal installations and campuses periodically develop master
plans. These are comprehensive development proposals covering a planning horizon of at least 20 years.
Master plans have important implications for transportation and parking at these facilities. Agencies produce
Transportation Management Programs or Plans (TMPs) as part of the master planning process. TMPs
document a facility’s efforts to foster more efficient employee commuting patterns and meet Comprehensive
Plan parking ratio policies through transportation demand management (TDM) techniques.
Master plans consider facility conditions; mission needs; new or changing activities, transportation, workforce
and visitor populations; urban design and security; and environmental and cultural resources. NCPC and the
federal facilities use master plans to communicate future projects and work with local planning departments to
address potential on and off-site impacts. Typically, agencies use these documents to meet compliance
responsibilities under National Environmental Policy Act (NEPA) and Section 106 of the National Historic
Preservation Act (NHPA). Appendix A describes the master plan review process in more detail.
NCPC’s existing Comprehensive Plan parking ratio policies are set on an employee basis for primarily office
facilities. The ratios do not specifically address other types of federal uses, such as visitor destinations, retail,
or service (hospital) uses.

13
NCPC requires a TMP for new or updated master plans or when individual projects increase employment at a
facility to 500 or more people. NCPC also strongly encourages agencies to prepare TMPs for projects that will
increase employment to 100 or more. TMPs includes specific strategies to meet parking ratio policies in
NCPC’s Comprehensive Plan by encouraging changes in travel modes and routes, and the timing, frequency,
and length of trips. The purpose of these strategies is to reduce traffic congestion and improve regional air
quality. While master plans typically include a Traffic Impact Assessment that forecasts transportation
conditions external to the facility, TMPs do not consider unconstrained parking demand. Appendix B describes
NCPC standards for TMPs.
Taken together, master plans and TMPs are the primary mechanism by which NCPC influences employee
commuting at federal facilities. Every five years, federal facilities are expected to review master plans and
ensure they reflect anticipated changes. If changes are minor, agencies do a modification. If they are major,
agencies conduct a full update to their facility master plan and TMP. As agencies update TMPs, NCPC receives
new data about commute mode share, parking inventories, and employment levels at different facilities.
Current and Projected Land Use and Transportation Conditions
in the National Capital Region
Based on travel surveys and modeling conducted by MWCOG, the study team identified the following trends
and key themes regarding current and projected (2040) regional land use and transportation conditions.
According to MWCOG:3
The region will experience significant growth in households and jobs by 2040 (particularly in outer
jurisdictions), and changes to the transportation network. These changes, combined with associated
congestion, will result in increased accessibility in the western part of the region and decreased accessibility in
the east.
By 2040, the region’s population is expected to increase by 24 percent while the workforce is expected to
increase by 36 percent. The majority of growth will occur in the outer jurisdictions, but the inner jurisdictions
will retain the majority of the region’s population (see Figure 3).

14
Figure 3: Map of Expected Land Use and Transportation Changes in the Region (2016-2030)
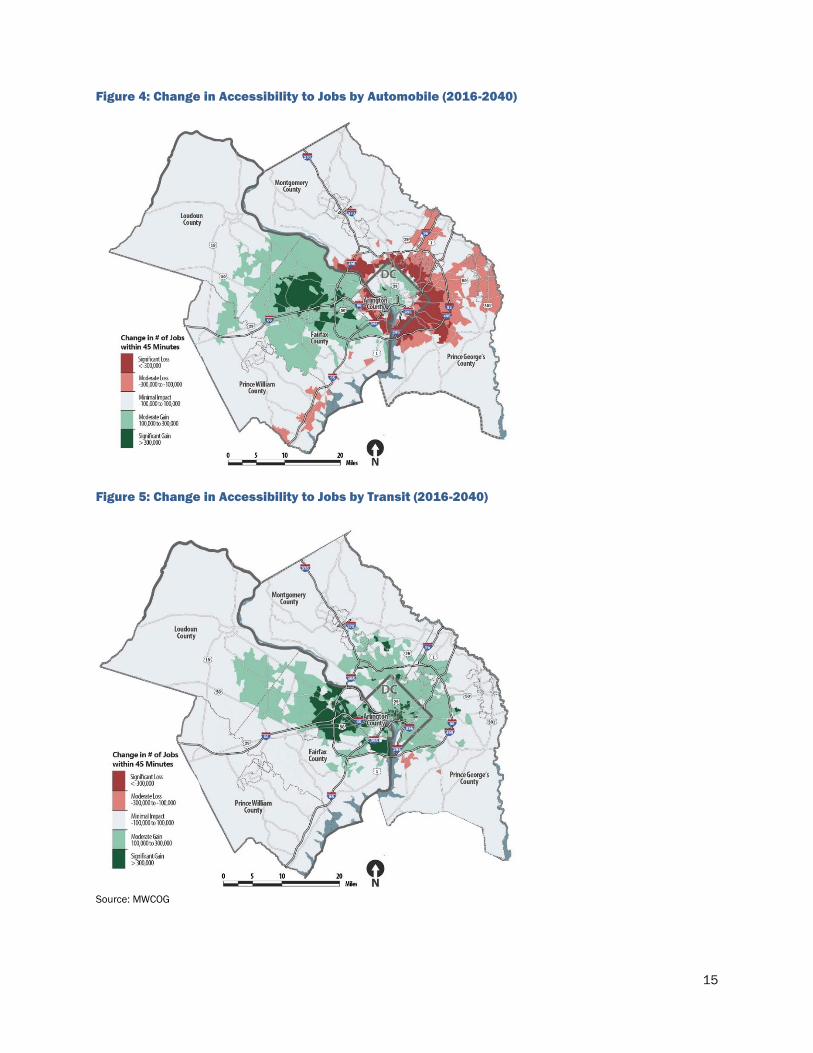
The average number of jobs accessible within a 45-minute automobile commute is expected to decrease
slightly over the next 30 years, with the greatest reduction in job accessibility expected to be on the region’s
eastern side. This is due to a combination of projected increases in automobile congestion in the eastern
portion of the region and anticipated greater job growth in the west. Average accessibility by transit is forecast
to increase, although overall accessibility to jobs by automobile remain significantly higher (see Figure 4 and
Figure 5).
15
Figure 4: Change in Accessibility to Jobs by Automobile (2016-2040)
Figure 5: Change in Accessibility to Jobs by Transit (2016-2040)
Source: MWCOG

16
MWCOG adopted its Region Forward Vision, in large part, in response to these trends. The plan is focused on
“creating a more prosperous, accessible, livable, and sustainable metropolitan Washington.” The plan includes
goals and targets to guide decision-making and measure progress. As part of the coalition that developed and
endorsed this plan, NCPC is encouraged to support the region in meeting performance targets related to
regional prosperity, affordability, and wage growth; concentration of household growth in designated activity
centers; and other livability and sustainability targets.
The number of commute trips will increase by 2040. Although there is significant regional variation, overall
commute mode shares will remain similar.
The majority of the region’s current commute trips are drive alone trips (61 percent), followed by transit (23
percent), carpooling (11 percent), and non-motorized (4 percent). Commute mode share is not expected to
change significantly by 2040. However, there is considerable variation in commute mode share across the
region. For example, in the regional core (DC, Arlington County, and Alexandria), 58 percent of work trips are
made by bus or rail and 13 percent by walking or biking. In the inner suburbs (Fairfax, Montgomery, and Prince
George’s Counties) Single occupant vehicle (SOV) trips account for the largest share of work trips (63 percent)
and nearly a quarter of work trips are taken by transit (see Figure 6).
Figure 6: Current and Future Commute Mode Shares Across the Region
Regional Core: Washington, DC, Arlington, and Alexandria Va.
Inner Suburbs: Montgomery: Prince George’s, and Fairfax Counties.
Outer Suburbs: Prince William, Loudoun, Frederick, and Charles Counties. Source: MWCOG
MWCOG projects annual work trips will increase from 3.5 million per day to 4.4 million per day by 2040. At the
same time, models estimate that the share of trips by driving and carpooling will decrease slightly (three
percent and one percent, respectively), while transit and non-motorized trips will increase slightly (both two
percent).
In the regional core, the share of transit trips is expected to drop in favor of more walking and bicycle trips. In
the inner suburbs, SOV trips are expected to drop slightly, while both transit and non-motorized trips will
increase. In the outer suburbs single driver trips are expected to drop, while carpool and transit trips are
expected to increase significantly. Projects like expansion of the Silver Line to Dulles Airport, which will bring
Metrorail to Loudoun County, and the high occupancy toll (HOT) lanes in northern Virginia, will contribute to this
shift in mode choice.

17
The region will have significant increases in trips, congestion, and emissions. These conditions will be
worst in inner suburban jurisdictions but will change most dramatically in outer suburban jurisdictions.
The number of daily trips made by area residents is expected to grow by more than 25 percent between 2013
and 2040, and the number of miles driven will increase by about 25 percent. The increase in demand on the
region’s roads is expected to outpace increases in roadway capacity, leading to a significant increase in
congestion. Funding constraints will limit the increase in new roadway investments. Severe stop-and-go
congestion is expected throughout the entire region, although planned HOT lane projects in Virginia will relieve
some of the congestion. Outer suburban jurisdictions will experience the greatest increase in congestion, while
the already congested inner suburban jurisdictions will experience the worst overall congestion. Making
matters worse, congestion will increasingly extend beyond rush-hour periods and affect off-peak weekday and
weekend trips.
Increases in traffic volumes, travel distances, and congestion contribute to other problems, including air
pollution. This is because ground-level ozone, the prime ingredient in smog, is formed when gases in
automobile exhaust react with oxygen. As the number of trips increase in quantity and length, the resulting
higher emission levels cause an increase in ozone and smog. These effects will be somewhat mitigated by
improvements in fuel efficiency and new fuel technologies.
The region’s federal employees drive alone slightly less, and take transit significantly more,
than the general population.
MWCOG’s Household Travel Survey indicates that, in 2009, 54 percent of federal employees in the region
drove alone, which is similar to all employment sectors. At the same time, 33 percent of federal employees
commuted by transit, which is two thirds higher than the region as a whole in 2016. Metrorail was designed to
serve major federal employment centers and federal employees have generous transit subsides. According to
these two data points, carpooling and non-motorized travel is roughly similar between federal employees and
other sectors.
The average commute times are longer for transit and carpool commutes.
The average commute time in the region is 39 minutes one-way. Metrorail and carpool commutes average
slightly longer (48 and 42 minutes respectively), and drive alone trips are on average slightly shorter (35
minutes). Walk/bike trips are significantly shorter (17 and 22 minutes respectively), while commuter rail trips
average significantly longer (72 minutes).
Telework is an increasingly significant factor in regional commuting, particularly for the
federal workforce and transit riders.
Approximately one-third of area commuters telework an average of 1.5 days a week. Federal employees have
the highest incidence of teleworking of any sector in the region (45 percent of all federal employees surveyed).
The federal sector also has the fastest growth in teleworking arrangements, increasing from 16 percent of
federal employees in 2007 to 45 percent today. Non-SOV commuters are most likely to telework. MWCOG
estimates that approximately 10 percent of potential work trips are eliminated through telework and
compressed work schedules.
18
Historical Context of Parking Policy
Evolution of Parking Policy Nationally
Transportation technology and travel patterns have changed dramatically over the last century, moving from
more localized travel (walking, horse and buggy, streetcar, etc.) to more regional travel (privately-owned
automobiles and regional transit systems). Beginning in the 1990s, the transportation industry began to shift
from a focus on “mobility” (moving cars) to “accessibility” (getting people to destinations). This new paradigm
does not prioritize a particular mode, but instead emphasizes multi-modal transportation options, supportive
land use and urban design. Within this broader context, policymakers, engineers, and planners in the United
States have grappled with parking supply and management since the early 1900s. This is particularly true in
large cities and metropolitan areas. Like transportation policy, urban parking policy is increasingly data-driven,
market-based, and connected to broader multi-modal transportation policy and goals. Furthermore, parking
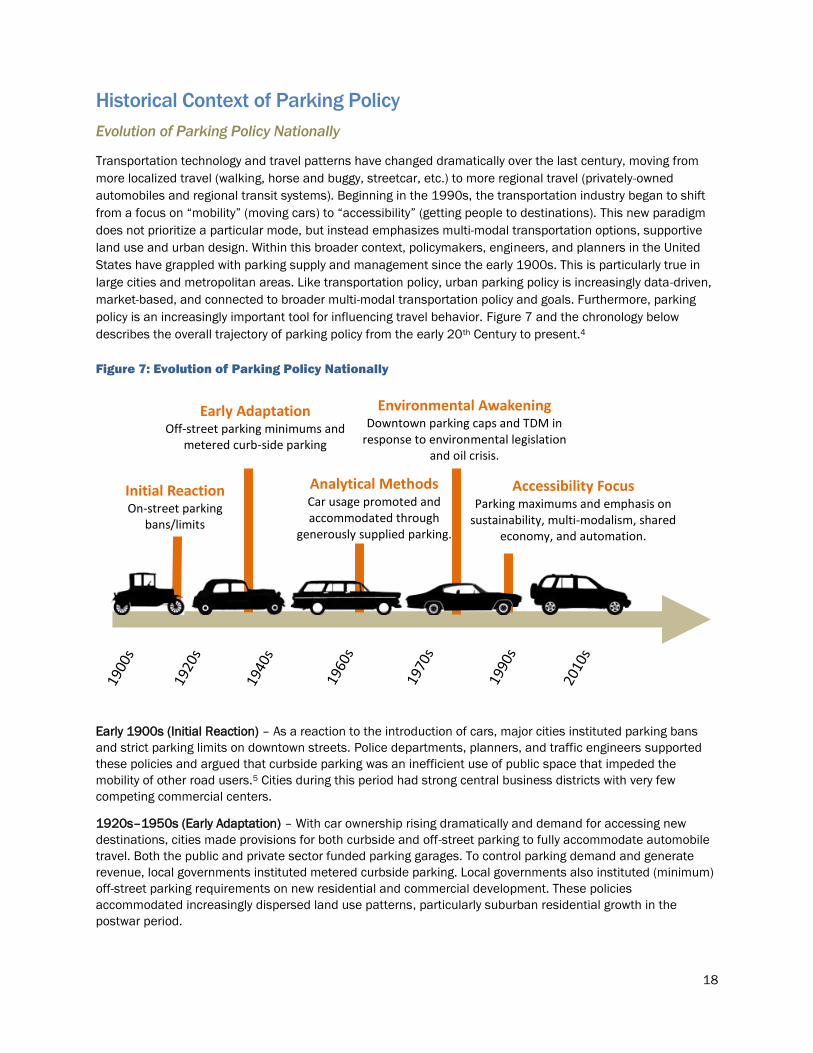
policy is an increasingly important tool for influencing travel behavior. Figure 7 and the chronology below
describes the overall trajectory of parking policy from the early 20th Century to present.4
Figure 7: Evolution of Parking Policy Nationally
Early 1900s (Initial Reaction) – As a reaction to the introduction of cars, major cities instituted parking bans
and strict parking limits on downtown streets. Police departments, planners, and traffic engineers supported
these policies and argued that curbside parking was an inefficient use of public space that impeded the
mobility of other road users.5 Cities during this period had strong central business districts with very few
competing commercial centers.
1920s–1950s (Early Adaptation) – With car ownership rising dramatically and demand for accessing new
destinations, cities made provisions for both curbside and off-street parking to fully accommodate automobile
travel. Both the public and private sector funded parking garages. To control parking demand and generate
revenue, local governments instituted metered curbside parking. Local governments also instituted (minimum)
off-street parking requirements on new residential and commercial development. These policies
accommodated increasingly dispersed land use patterns, particularly suburban residential growth in the
postwar period.
Initial Reaction On-street parking
bans/limits
Early Adaptation Off-street parking minimums and
metered curb-side parking
Analytical Methods Car usage promoted and accommodated through
generously supplied parking.
Environmental Awakening Downtown parking caps and TDM in
response to environmental legislation and oil crisis.
Accessibility Focus Parking maximums and emphasis on
sustainability, multi-modalism, shared economy, and automation.

19
1950s–1970s (Analytical Methods) – Concurrent with the development of the Interstate Highway System, the
U.S. Bureau of Public Roads published an influential pamphlet in 1956 that promoted car use and increased
highway capacity. To support parking minimum requirements and avoid spillover parking from adjoining land
uses, engineers developed and refined analytical methods to estimate unconstrained parking demand. These
tools sought to accommodate peak parking demand, under the assumption that all visitors would arrive by
private vehicle and that parking would be free. Urban areas during this period became more “polycentric,” with
multiple activity centers spread through metropolitan areas.
1970s–2000s (Environmental Awakening) – With the era’s environmental movement, policymakers began
recognizing a link between the practice of supplying unlimited parking with other policy concerns, including
congestion, air pollution, and urban sprawl. Litigation brought under the Clean Air Act forced some major cities
to limit the supply of downtown off-street parking. Environmental concerns combined with the 1970s energy
crisis pushed policymakers to develop new transit systems and transportation demand management
approaches like carpooling. Despite some policy changes, including the adoption of parking maximums in
some cities, there was relatively little innovation in parking policy. During this period, most jurisdictions
adopted analytical approaches like the Institute for Transportation Engineers’ Parking Generation to estimate
parking demand and set parking policy. Urban areas became increasingly polycentric during this period and
dual income households emerged as a major influence on travel patterns and household location.
2000s–Present (Accessibility Focus) – A growing focus on sustainability and increasing interest in urban living,
land scarcity, and associated higher costs for developing parking led many cities to change parking policies.
Cities started experimenting with variable parking pricing, instituting parking maximums, constructing bicycle
infrastructure, and expanding the use of other transportation demand management approaches like districts,
parking cash-outs, and transit subsidies. These trends coincide with critiques and enhancements to traditional
analytical approaches for determining parking demand and identifying parking minimums. Researchers began
testing adjustment factors and locally collected data to account for transit and non-motorized modes.
Policymakers began supplementing these tools with cost-benefit analyses, parking surveys, and other policy-
oriented approaches.
With rising construction costs and stagnant gas tax revenue, jurisdictions today are struggling to maintain
existing transportation infrastructure. Their focus is increasingly on repairing existing infrastructure and
pursuing relatively low-cost transit system expansions like light rail and bus rapid transit. Private sector
innovations like app-based ride hailing services, automated vehicles, and electric vehicles are creating new
mobility and accessibility options but also presenting new challenges for policymakers. These trends have
significant implications for large transit agencies.
Evolution of NCPC’s Parking Policy
NCPC participated in, or sponsored, a variety of transportation surveys, proceedings, and reports over the
years. Consistent with trends in parking policy across the country, NCPC and its predecessor developed a
series of increasingly sophisticated parking and transportation policies over the 20th century. This included
advancing the creation of the Metrorail system, freeway expansion and arterial street enhancement, and
express/local bus service to form an integrated circulation network. For parking, NCPC’s policies shifted from
restricting on-street parking and constructing off-site parking, to encouraging federal facilities to limit parking,
prioritize employee use of transit, and pursue transportation demand management techniques. Parking
policies were increasingly tied to the location of facilities and proximity to transit and carpooling options. Figure
8 and the chronology below describe major NCPC parking policy milestones. Appendix C describes the history
of NCPC’s parking policy in more detail.

20
Figure 8: NCPC Parking Policy Milestones
Early 20th century – The 1901 McMillan Plan predated the automotive age, and therefore did not include
provisions for automobiles. By the 1920s, NCPC’s predecessor, the National Capital Park and Planning
Commission (NCPPC), dealt directly with regulatory and zoning changes in the District of Columbia, including
parking and physical changes to the transportation network and restricting on-street parking. By the 1940s,
congestion problems in Washington were acute. On-street parking and a lack of off-street parking impeded the
movement of traffic. In 1942, Congress authorized the federal body governing the city to ensure adequate
parking and called for the creation of public off-street parking facilities, with review from NCPPC.
1950 Comprehensive Plan – NCPC’s first Comprehensive Plan identified three transportation strategies:
1. Cut down on the amount of travel needed to get home and to work.
2. Make public transportation so quick and convenient that…fewer will drive; and
3. Create a system of collector and distributor roads…that will redistribute traffic through the region and
diminish the volume demand within the Central Area.
Recognizing that these strategies would result in a deficit of vehicular parking spaces in Washington’s Central
Area, the plan outlined several types of transit- and pedestrian-accessible places suitable to develop vehicle
parking spaces.
Subsequent to the 1950 Comprehensive Plan, a 1955-1956 report on federal employee parking ratios6
surveyed federal parking ratios during an overhaul of Washington’s zoning code. It reported that of all federal
employees working in buildings under the General Services Administration (GSA) control with 1,000 or more
employees per building:7
4.0 percent had a parking ratio of 1 parking space:3 employees or better
32.4 percent had a parking ratio of 1:4 or better
44.1 percent had a parking ratio of 1:8 or better
62.3 percent had a parking ratio of 1:10 or better
Retrofitting
NCPC integrating
parking into Federal
Triangle and nearby
areas
Congressional Law
Congress requires
development of parking
facilities: subject to NCPC
review Balanced Transit
1950 and 1969 NCPC
Comprehensive Plans:
specifies parking and transit
facilities for specific zones
within the NCR
Concentric Ratio Zones
1989 NCPC Comprehensive Plan:
parking space amount depends on
distance from downtown
Refined Ratio Zones
2004 Comprehensive Plan:
parking zones are refined;
tied to Metrorail stations

21
The Central Employment Area incorporates the federal establishments symbolic and physical heart encompasses the hub of the
Metro system, and commuter rail. The Comprehensive Plan specifies that the federal government
should prioritize workplace locations within the official Central Employment Area. In accordance with
Executive Order 12072, GSA uses the CEA boundary as the delineated area for federal leasing in
the District of Columbia. The District also focuses on infrastructure needs within the CEA.
1969 Comprehensive Plan – This plan proposed an integrated circulation network for Washington and
advanced the concept for the Metrorail system, a major freeway expansion program, improvements to arterial
streets, and improvements in the network of both express and local bus service. The plan specified policies for
two types of areas - the center of Washington (“Central Area Parking”) and inner suburban and uptown
Washington (“Fringe and Uptown Center Parking”) (see Figure 9). For each area type, the plan had three
categories of policies: 1. basic plan policies, 2. specific numerical targets applicable before Metrorail began
operations, and 3. specific numerical targets applicable for after Metrorail began operations.
The basic parking policies for center of Washington were:
Parking space in the Central Employment Area should be provided in structures located close to
freeways and arterial streets.
The total central area parking system should be managed to encourage equilibrium of parking space,
congestion-free highways, and highly utilized transit.
Central Employment Area parking should be managed to insure reasonable availability of parking space
to serve non-work as well as work trips.
The central area parking system should include parking in high-density residential areas.
Figure 9: Excerpt from 1969 Comprehensive Plan
22
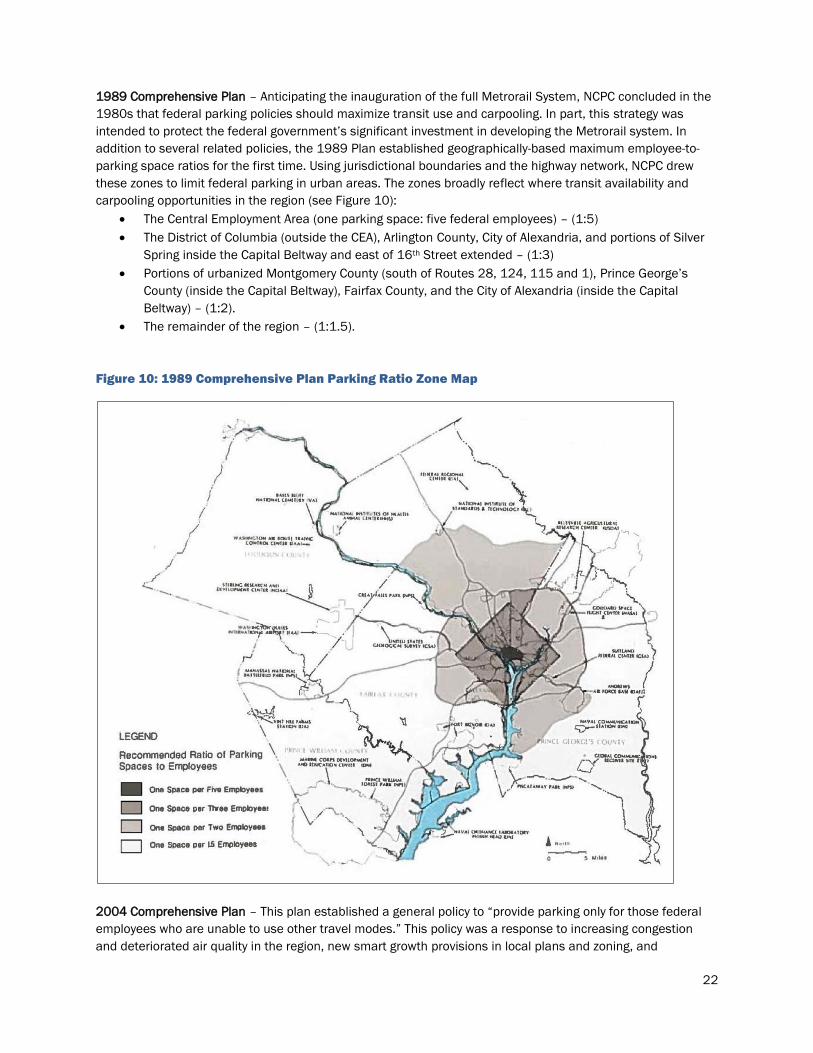
1989 Comprehensive Plan – Anticipating the inauguration of the full Metrorail System, NCPC concluded in the
1980s that federal parking policies should maximize transit use and carpooling. In part, this strategy was
intended to protect the federal government’s significant investment in developing the Metrorail system. In
addition to several related policies, the 1989 Plan established geographically-based maximum employee-to-
parking space ratios for the first time. Using jurisdictional boundaries and the highway network, NCPC drew
these zones to limit federal parking in urban areas. The zones broadly reflect where transit availability and
carpooling opportunities in the region (see Figure 10):
The Central Employment Area (one parking space: five federal employees) – (1:5)
The District of Columbia (outside the CEA), Arlington County, City of Alexandria, and portions of Silver
Spring inside the Capital Beltway and east of 16th Street extended – (1:3)
Portions of urbanized Montgomery County (south of Routes 28, 124, 115 and 1), Prince George’s
County (inside the Capital Beltway), Fairfax County, and the City of Alexandria (inside the Capital
Beltway) – (1:2).
The remainder of the region – (1:1.5).
Figure 10: 1989 Comprehensive Plan Parking Ratio Zone Map
2004 Comprehensive Plan – This plan established a general policy to “provide parking only for those federal
employees who are unable to use other travel modes.” This policy was a response to increasing congestion
and deteriorated air quality in the region, new smart growth provisions in local plans and zoning, and

23
completion of the Metrorail system. NCPC retained the concept of concentric zones from the 1989 Plan but
adjusted parking ratio policies to more closely align with the location of Metrorail stations and High Occupancy
Vehicle (HOV) lanes (see Figure 1). The 2004 plan created requirements for agencies to submit TMPs and institute TDM techniques to encourage non-SOV modes.
Changes to parking zones in the 2004 plan included more aggressive parking goals in the more suburban
sections of Washington (non-CEA), Arlington County, and the City of Alexandria, while simultaneously relaxing
goals in suburban areas not proximate to Metrorail or HOV lanes. These new policies:
Retained the CEA zone of (1:5).
Created a new 1:4 zone inside the Historic DC boundary, including the District of Columbia, Arlington,
and portions of Alexandria.
Revised the 1:3 zone to include only locations within 2,000 feet of all suburban Metrorail stations.
Revised the 1:2 zone for suburban areas served by HOV lanes.
Retained the 1:1.5 for the remainder of the region.
When submitting plans and projects, agencies may propose alternative (or adjusted) long-term (20-30 year)
parking goals pursuant to technical analysis and documentation. These 2004 policies remain in effect today.
Parking Policies at Principal Federal Agencies
The federal government maintains broad parking policies and directives. Specific practices and
implementation programs at individual facilities vary due to several factors, including mission requirements,
delegation authorities, geographic conditions, and site development patterns. Section 2.5.1 outlines some
general federal policies; more background on parking, pricing and related commuting policies is provided in
Appendix D. General practices at the three largest landholding agencies, the GSA, Department of Defense
(DOD), and National Park Service (NPS) are highlighted in Sections 2.5.2-4.
Government-wide/Nation-wide
Many of the large federal facilities in the NCR were developed before Metrorail, when ample parking was a
priority. Two examples are the Pentagon and Suitland Federal Center, which were developed in the early
1940s. Designed to reduce vehicular congestion in central DC and to consolidate facilities, these campuses
would influence future federal campus planning within the NCR.
During the past half century, provisions for federal employee parking became increasingly restrictive, reflecting
broader policy and transportation developments. An agency now may provide employee parking facilities only if
it determines that the lack of parking facilities will significantly impair the operating efficiency of the agency
and will be detrimental to the hiring and retention of personnel. However, federal policy continues to allow
employees to use parking spaces not required for official needs.
Agencies generally must obtain parking accommodations through the General Services Administration unless
they have independent statutory authority or a delegation from GSA. The federal government has long
considered employee parking, like other general commuting expenses, a personal expense of the employee.
Appropriated funds are generally not available for the purpose of expenses considered personal in nature.

24
Over the past three decades, Congress and federal agencies are increasingly incentivizing employee
alternatives to SOV commuting. Agencies must provide a commuting program. Congress has repeatedly
expanded the federal transit benefit program established in 1991 to discourage SOV commuting.
While commuting programs such as the transit subsidy are becoming more popular, their effectiveness is
variable and somewhat limited. Agencies are effectively prohibited from using parking revenues to offset other
TDM programs, which is a successful strategy used by companies and other organizations. Most agencies do
not have an incentive to charge for parking because agencies generally cannot augment their appropriations
from outside sources.
Each federal agency allocates transit and parking spaces differently. The value of a transit subsidy is directly
associated with the reliability and availability of public transportation in a particular area. Since parking at
federal facilities is typically free, the utilization of spaces is determined by supply and demand.8 Not all
employees necessarily are aware of the benefit program.
The federal government also has policies regarding the management of parking spaces. Federal agencies must
take all feasible measures to improve parking facility use, including:
Conducting surveys and studies;
Periodic review of parking space allocations;
Providing parking information to occupant agencies;
Implementing parking incentives that promote ridesharing;
Using stack parking practices, where appropriate; and
Employing parking management contractors and concessionaires, where appropriate.9
Additionally, GSA’s Facilities Standards for the Public Buildings Service specifies that local regulations must be
followed without exception in the design of systems that have a direct impact on off-site terrain or
infrastructure: including storm water runoff, erosion control, sanitary sewers and storm drains, roads, and
bridges.10
General Services Administration
The General Services Administration’s core mission is to assist federal agencies “buy smarter, reduce their real
estate footprint, provide efficient, cost saving technology and create a better, faster federal government.”11
Setting out ambitious goals, GSA seeks to achieve “net zero” energy usage for all new buildings in as little as
three years.12 GSA is purchasing fuel-efficient fleet vehicles, including electric vehicles.13,14 GSA is also
partnering with car sharing services to provide federal employees with short-term access to vehicles.15
Since 2012, GSA has maintained a policy of not providing free parking to GSA employees who work in facilities
under its jurisdiction, custody, or control in the National Capital Region, except in very limited circumstances as
described below. This policy is designed to increase the sustainability of the federal government by
discouraging the use of motor vehicles, encourage the use of public transportation and mobile work
arrangements, reduce traffic congestion, and improve environmental conditions.16

25
Employees using federal parking facilities who meet the following exceptions are not required to pay for
parking:
GSA employees with bicycles.
GSA employees with severe disabilities.
GSA employees who work at facilities not reasonably accessible to public transportation.
GSA employees who work at facilities where public transportation is not available between the hours
of 6:00 am to 7:00 pm may park at no cost in facilities under GSA's jurisdiction, custody, or control in
the National Capital Region, as space is available. This provision applies to the accessibility of
transportation at the GSA work facility and not the employee's home.
GSA employees whose job responsibilities involve management or security for a government-owned
building and whose functions require that the employee be physically present in the building for
maintenance, emergency or security functions, as needed, on a 24 hours a day, 7 days a week basis.
GSA has worked closely with MWCOG and local jurisdictions to locate its facilities in “Activity Centers,” winning
MWCOG’s Regional Partnership Award in 2016, These Centers are recognized because they are aligned with
the region’s transit network and typically are walkable, reducing vehicle parking demand.
Department of Defense
The DOD Unified Facilities Criteria (UFC) 2-000-02AN Installation Master Planning prescribes the DOD
minimum requirements for master planning processes.17 Among the instructions, installations:
Must conserve their land resources. This can be achieved through compact development patterns that
support an appropriate mix of uses, encourage walking and other alternative modes of transportation,
accommodate appropriate residential and commercial densities, and incorporate a more integrated
grid network of streets and sidewalks.18
Use on-site natural features to control stormwater runoff quantity and quality in lieu of traditional ‘end-
of-the-pipe’ solutions. These controls include not only open space and natural features, but also
manmade features such as building roofs, streets, and parking surfaces. Other examples include
bioswales, car parks, and on-street parking, which use substantially less paving per car than off-street
parking.19
Shall strive to minimize parking to the maximum extent possible through land-use practices that
support shared-use parking, transit, and alternative modes of transportation.20
The DOD’s Transportation Engineering Agency specifies that short- and long-term parking areas should not be
more than 85 and 90 percent full, respectively. If the parking utilization rate exceeds these figures, more
parking should be considered.21 Future parking demand can be determined by using parking generation rates,
such as in the Institute of Transportation Engineers’ Parking Generation manual.
Apart from sustainability reasons, the DOD is also scrutinizing its bases’ layouts from an active
design perspective and how vehicle parking facilities and other barriers may deter walking, cycling, and
working out. For this Healthy Base Initiative, designers developed a rating tool that commanders can use,
scoring bases on how well they support active living. Marine Corps Base Quantico, the Defense Logistics
Agency at Fort Belvoir, Virginia, and the Defense Health Headquarters in Falls Church were among the fourteen
installations in the study.22

26
The DOD has additional guidance documents such as SDDCTEA Pamphlet 55-15 – Traffic and Safety
Engineering for Better Entry Control Facilities. UFC 4-022-01 states that the visitor center at an installation
main gate should be able to process twelve to twenty visitors per hour per processor. This equals three to five
minutes per visitor. In reality, the amount of parking needed at a visitor center depends on three things:
The amount of visitor traffic during the peak hour of visitor activity.
The amount of staffing at the visitor center.
Duration for visitors to be processed (dependent on staffing and operating procedures).23
Service-specific regulations provide further guidance. The Air Force’s Manual 32-1084 lists the number of
parking spaces authorized for various facilities, including:
Administration, headquarters, and office buildings – 60 percent of assigned personnel
Child development centers – 10 percent of children, 80 percent of staff
Dormitories – 70 percent of design capacity
Family housing – 2.5 spaces per living unit
Guard houses, brigs, military police stations – 30 percent of guard and staff strength
The manual provides that parking spaces for facilities, whether existing or programmed, may be increased
where special traffic analyses substantiate the need. Facilities with multiple functions may provide parking for
each function.
National Park Service
The National Park Service, one of the largest land holding agencies in the NCR, “preserves park resources
unimpaired for the enjoyment of current and future generations by reducing [its] environmental impact through
sustainable operations, design, decisions, and management."24 The National Park Service released its
inaugural Green Parks Plan in 2012, setting sustainability goals targeting aggressive greenhouse gas emission
and other issues. These goals were reaffirmed and further developed in its most recent, 2016 plan.25
NPS’ sustainability focus increasingly emphasizes transit, non-motorized transportation, and parking
management. The Transportation Planning Guidebook calls for reductions in parking spaces by offering a
variety of transit alternatives. Removing existing parking spaces, the guidebook advises, can be offset by
increasing pedestrian and bicycle access and by providing increased transit services such as shuttle buses for
travel to and within the parks.26 NPS’s Management Policies (2006) further advocate for the use of transit
alternatives, including the improvement of connections to a variety of sustainable, external transportation
systems and “a mix of buses, trains, ferries, trams, and–preferably–non-motorized modes of access” to extend
their mission of limiting vehicle use and promoting greener transit alternatives.27 The NPS Congestion
Management Toolkit (2014) provides a list of tools for managing congestion.
NPS advocates not only for the modification of transit routes and parking services for visitors, but also for the
adaptation of new technologies and promotion of transportation sustainability among employees. NPS’s Green
Parks Plan, Advancing Our Mission through Sustainable Operations (2016) encourages alternative commuting
methods such as employee telework. The plan conveys that the “NPS will prioritize active transportation
(human-powered transportation like walking and biking) in planning and design of new transportation-related
opportunities, facilities, and infrastructure.”28
Within the NCR, NPS completed the National Mall and Memorial Parks Tour Bus Study in 2015. Recognizing
numerous problems associated with tour bus operations, including traffic congestion, residential neighborhood

27
disruption, air pollution, excessive noise, obstruction of view corridors and major landmarks, the study set forth
a plan of action for short-term and long-term improvements in operational efficiency.
Recognizing the increasing demand for non-motorized corridors with in the region, the NCR Paved Trail Plan
(2016) identifies achievable goals, provides 121 capital and programmatic recommendations, and prioritizes
opportunities to expand multi-use trails in NCR national parks.
Study Assumptions
In light of NCPC policy and regional trends identified above, NCPC staff and the Volpe Center coordinated with
MWCOG to develop the following list of assumptions for this study:
1. The study’s planning horizon will be approximately 15 years (2030) to reflect NCPC’s master planning
update process.
2. This study is focused on federal facilities in the NCR.
3. NCPC policy will continue to encourage modes other than SOV, such as transit, walking/bicycling, or ride
sharing.
4. Given the lack of financial incentives for agencies to charge for parking, parking will remain free of charge
to employees at those facilities where it is currently free.
5. Congress will continue to act to ensure that the amount of transit expense that may be excluded from
wages matches the amount of parking expense that may be excluded from wages.29 The latter is indexed
for inflation. Federal agencies will continue to offer a transit subsidy capped at this amount (currently
$255/month). Therefore, in real dollar terms (adjusted for inflation), the transit subsidy for federal
employees will not significantly change.
6. In real dollar terms, auto operating costs will not significantly change (now assumed in the MWCOG model
to be $0.10/mile)
7. In real dollar terms, transit fares will change gradually.
8. The study will rely on the MWCOG model, which uses the following assumptions:
a. Total employment at federally-owned facilities will continue to modestly increase, following the
MWCOG land use and employment projections (approximately 1.5 percent per year in the near
term).
b. Future changes in employee home locations based on the land use, trip generation, and trip
distribution forecasts.
c. Employee home locations for a federal facility will be based on overall household distribution.
d. The amount of walking and bicycling will follow the trip-generation assumptions.
e. Attractiveness of various modes (auto, shared auto, various forms of transit) will follow the mode-
choice results.
f. In accordance with the model’s assumptions, Metrorail in Downtown Washington will be capacity-
constrained starting in 2020, thus limiting the number of travelers able to choose that mode.
9. Telework policies and practices will continue to be a major factor for federal commuting the region.
10. The desirability of SOV for employees will depend on
a. Type and culture of agency (for example, some agencies may place a greater emphasis on non-
SOV use than other agencies)
b. Employee working hours (irregular or nighttime working hours may make SOV more desirable)
c. Employee home locations

28
Literature Review
Introduction
This chapter identifies and explores industry best practices and case studies for developing parking policies
and determining parking supply.
This literature review examines critical transportation concepts and analytical approaches that inform parking
supply decisions of both jurisdictions and institutions. After that, the chapter documents case studies with
particular applicability to federal campuses, including institutional examples from academic, corporate, and
scientific campuses and local jurisdictions with transportation demand management districts/associations.
The Volpe Center synthesized this research into findings for NCPC to consider in future updates to parking
policies.
Developing Parking Policy
Developing parking policies is part art, part science, and part politics.30 Traditionally, planners, engineers,
developers, institutions, and companies sought to build enough off-street parking to satisfy unconstrained
parking demand. This approach ensured that there was adequate parking for employees, visitors, and
customers, while avoiding ‘spillover’ parking at adjoining properties. These policies are supported by analytical
tools designed to provide enough spaces for parking for peak demand on the peak hour of the peak day of a
year for a particular facility. While many organizations and jurisdictions continue to use this approach, others
are implementing transportation demand management (TDM) techniques to actively reduce parking demand
(see Appendix E) and encourage non-single occupancy vehicle (SOV) travel. These new approaches help
achieve environmental benefits and economic efficiencies by limiting and pricing parking, sharing parking
facilities between adjacent land uses, and otherwise encouraging transit use, carpooling, and non-motorized
transportation.
Inadequate parking, when other transportation modes are not available or convenient, means that people are
either unable to reach their destinations or spend excessive amounts of time circling parking lots in search of
available spaces. At the same time, excessive parking supply increases vehicle use and adds to on-site and off-
site infrastructure construction and maintenance costs borne by the property owner and/or local jurisdiction.31
With too much supply, particularly when parking is free, travelers are less likely to carpool, walk, or bicycle to
their destinations.32 Supplying too much parking is also expensive. Land used for empty parking spaces could
otherwise be preserved or developed.33 For example, given that the potential cost of land can be from $1 to
$25 per square foot, the land consumed by just one parking space represents an opportunity cost between
$300 and $10,000.34
This section explores the determinants of trip generation, analytical tools to estimating parking demand, and
policies and approaches for managing parking demand.

29
Determinants of Trip Generation
Parking demand and mode choice are primarily a function of travel time and costs. Costs depend on land use
density and mix; transit availability and quality; parking availability and price; and walkability, both at the trip
origin and destination. Characteristics of the local area such as weather, culture, and geography can also
affect parking demand. Therefore, local data is most useful in developing effective parking regulations.35 Below
are some local-level characteristics that influence mode share.
Demographics – Due to the high cost of automobile ownership relative to the cost of taking public
transit, households with lower incomes have lower rates of automobile ownership.36 Furthermore,
studies show that urban dwelling “millennials” have a much lower rate of automobile ownership.37 If a
locality has a disproportionately high population of a demographic with a low automobile ownership
rate, the number of vehicle trips will be lower than otherwise anticipated. Taking into account
demographics such as age and income can help more accurately determine expected parking
demand.38
Public transportation – It is important to understand the modal options of people traveling to different
destinations. In dense urban environments, public transportation can contribute to a large reduction in
parking demand.39
Climate – Local weather patterns can affect mode choice. A warm, sunny environment may incentivize
walking and bicycling more than an inclement climate which encourages driving.40
Price of parking – There is no single formula that will determine how much drivers are willing to pay for
parking; driver behavior can vary widely between cities.41 Municipalities measure the price of parking
in dollars per hour for meters and public garages.
Usage times – Different uses may generate parking demand at different times of day. If different uses
with different peak hours are situated on the same site, or in close proximity, the same parking supply
can satisfy both sites’ peak demand.42
Accessibility to other uses – If a site is located in a high-density environment close to a variety of other
land uses, users will generate fewer trips by parking only once and walking the rest of the trips. In a
low-density environment without public transit, where one cannot walk from one destination to
another, people must drive to each subsequent destination and more parking is needed.43

30
Estimating Unconstrained Parking Demand
Professional trade groups and academic institutions use a number of parking reference manuals and
analytical processes to estimate unconstrained parking demand. These industry resources and approaches are
imperfect. They are designed to inform, not determine, the development of policies that govern parking supply.
While the distinctions between NCPC and local jurisdictions are significant, the principles, goals, analytical
approaches, and processes employed by these entities provide a useful context for NCPC’s policies.
When tasked to develop parking guidelines for a particular municipality’s zoning code, planners have limited
tools, short of a comprehensive parking demand study.44 Planners generally take one of two standard
approaches when developing parking regulations:45,46
Adopt the standards of a neighboring or similar municipality.
Use industry reference documents to estimate parking demand (see Section 6).
Developing an accurate parking demand assessment is one component of developing appropriate parking
standards, but can be expensive and time-intensive.47 If a demand estimate is only needed to provide a
general idea of how many users might require parking and the facility type is common, it is acceptable to use
data available in a published study that surveys a similar facility. However, if the estimate is being used for a
unique facility or to determine something more concrete like the size of a parking facility or a financial analysis,
a more accurate and precise estimate is necessary.48
To determine unconstrained parking demand, transportation professionals generally turn to one of two widely
cited sources on the topic:49,50,51
Institute of Traffic Engineers’ (ITE) Parking Generation (currently in its 4th edition)
American Planning Association’s (APA) Parking Standards
3.1.1.1 ITE Parking Generation (4th Edition)
Parking Generation is a large collection of parking demand studies that utilize vehicle counts and intercept
surveys. Data collected by ITE is provided by land use type and 107 distinct land uses are represented, with
the majority of data collected over the last 30 years. The data provided varies based on land use but usually
contains parking demand, measured as a percentage of peak demand, by hour and weekday and weekend.
Some land uses provide data of demand by month as well. In nearly all cases, descriptive statistics are
provided showing the number of study sites, average peak demand, standard deviation, and coefficient of
variation among others. Parking Generation then provides a chart with the independent variable on the x-axis
(i.e. gross square footage, number of employees), peak demand on the y-axis, as well as data points, a line of
best fit, and r-squared values.
The publication is an “informational report,” with the notice that it “does not provide authoritative findings,
recommendations, or standards on parking.”52 In other words, Parking Generation is a descriptive collection of
what is, not a prescriptive definition of what should be. After compiling the data, ITE provides descriptive
statistics for specific land uses. For example, elementary schools and high schools are examined
independently. The publication outlines two particular limitations of the data:
Orientation to single-use, suburban land uses where parking is free. The first drawback is that the
source of the parking demand studies are often from suburban areas where parking is free.53,54 The
problem this presents is that demand will be inflated when the price is zero. Similarly, a District
Department of Transportation (DDOT) study found that the ITE model, as well as other similar
approaches that pivot off ITE estimates, were inadequate in predicting trips by mode in an urban
context, specifically Washington, DC.55

31
Small sample size, particularly for unique or uncommon land uses. Due to the extreme specificity of
land uses presented, some land uses have a very small sample size. The sample size of common land
uses can be relatively large: “Office Building” has a sample size of 176 and “Shopping Center” has a
sample of 86. This suggests that a variety of sites were sampled and an average can be
representative of the whole population. However, the majority of land uses represented illustrate
parking demand based on fewer than 20 sampled sites. It is impossible to infer the average parking
demand for any given elementary school in the United States (of which there are over 86,000)56 based
on a parking study with a sample size of five. Readers may conclude that the average demand
presented is representative of all sites developed for the given land use.57 For example, the average
parking demand for a suburban drive-in bank is taken out to two decimal places, 1.60 vehicles per
employee, but the sample size is only two sites and the coefficient of variation is 44 percent.58
ITE openly acknowledges the drawback of this resource. For example, Parking Generation makes clear that it is
not a manual and does not predict parking demand; it is merely a point of reference meant to assist planners
in making decisions related to parking. It also makes clear that although the report presents some numbers
with a high degree of accuracy, many of the land uses have only a small sample size and that broader
conclusions cannot, and should not, be drawn from the data.
3.1.1.2 American Planning Association Parking Standards
Parking Standards by the APA is a similar publication in that it is a large collection of data categorized by land
use. While ITE collects data and presents it in an aggregated form of averages and standard deviations of
parking demand, APA provides disaggregated data. For example, APA categorizes more than a dozen land uses
under educational institutions, including business school, college/university, high school, and private high
school, among others. Under each land use, APA listed different regulations found throughout the country that
apply to the land use in question. For each regulation, the municipality and the municipality’s population are
listed. Six to twelve different regulations are listed for most land uses.
The advantage of Parking Standards is that there is no risk of misinterpreting the statistics. Instead of focusing
on a single parking ratio, APA presents many studies from different contexts. This allows readers to draw their
own conclusions on what an appropriate parking ratio might be for the unique context of the subject property.
3.1.1.3 Internal Capture in Mixed-Use Developments
One important element in calculating parking demand is internal trip capture. Internal capture and shared
parking between adjacent properties (see section 5.1.1.14) go hand in hand. Internal trip capture measures
the percentage of total trips within a large development, when a driver visits multiple places within the same
development while only parking once and/or using roads internal to the site in question.59 Most frequently
applied to driving trips, this metric can also be applied to other modes as well; for example, if someone were to
take one trip on the subway to visit multiple locations. Internal capture is usually expressed as a percentage of
total trips or as a rate.

32
Efficiency-Based Standards
Efficiency-based standards take into account factors such as geographic, demographic, and economic
characteristics of the site that affect parking demand. These standards also incorporate a cost-benefit analysis
of options such as supplying less parking where it would be relatively more expensive to build parking or where
transportation demand management programs are easy to put in place.60 For example, an efficiency-based
approach to developing parking standards allows developers to build less parking in dense, urban areas where
structured parking would otherwise be necessary. Instead, developers could propose a mix of transportation
demand management strategies, such as the provision of an employee shuttle, car sharing service, or parking
“cash out” program.
Efficiency-based standards can be applied in both urban and suburban areas, but the effect of these standards
are different in each context.61 In urban areas, these standards enable jurisdictions to leverage existing public
investment in transit and mitigate potential negative externalities such as congestion and air pollution
associated with more vehicles. At the same time, developers avoid the high cost of constructing parking and
can more fully utilize the site. Suburban sites can also lend themselves to efficiency-based standards. When it
comes to TDM and SOV reduction, these areas generally have more room for improvement than urban sites.62
Ultimately, efficiency-based standards are designed to support local strategic planning objectives such as
encouraging dense, transit-oriented development. In effect, NCPC is already applying an efficiency-based
approach to parking through a combination of parking maximums and requiring transportation management
plans.
Contingency-Based Planning
Contingency-based planning entails supplying a lower amount of parking, instead of supplying the amount of
parking sufficient to satisfy peak demand. This approach is also helpful in addressing the uncertainty in the
effectiveness of other demand management programs employed on the site. Various strategies to increase
parking or otherwise mitigate demand are identified in advance, conditions are monitored, and if increased
parking becomes necessary, one of the pre-identified strategies is implemented. Having a contingency plan in
place that can be implemented relatively quickly allows developers and planners the confidence to build a
lower amount of parking than they would be otherwise inclined to provide.63
Estimating unconstrained parking demand and using efficiency-based standards and contingency-based
planning are not mutually exclusive. When developing parking standards, it is crucial to estimate demand in
light of efficiency-based standards and contingency-based approaches. This combined approach leads to
informed policy decisions while reducing the need for parking overall and building in flexibility if conditions
change.

33
Case Studies
To further examine parking policy, particularly practical applications to NCPC’s review role, the study team
reviewed case studies. There are a very limited number of wholly analogous cases applicable NCPC, given its
unique federal authority, type of facilities, and location in a growing, highly-urbanized area. Additionally, the
scope of the project limited the review to readily-comparable cases in the United States.
The following case studies highlight examples of current parking management approaches at educational,
corporate, and health campuses and local government. Underlying these cases studies are efforts to manage
parking/vehicular demand in suburban locations that are not within walking distance of rail stations.
Successful programs require active coordination with partnering organizations, communication with
commuters, fostering employee support, and performance monitoring. Institutions are uniquely positioned to
manage transportation and parking demand by limiting parking and providing incentives to employees.
Educational Campus – University of California, Los Angeles
The University of California, Los Angeles (UCLA) currently has 29,000 employees, 29,000 commuting students,
13,000 residential students. Reflecting a campus with public transit access limited to several bus routes, the
campus had a 74 percent drive-alone rate, similar to the surrounding region, as late as 1987.64 In 1990, partly
as a response to community concerns, the university agreed to a “trip cap” of 139,500 vehicles per day and a
parking space cap of 25,169.
The University recognized that a “blending the provision of TDM programs with parking policy—the means—
leads more directly towards the desired end, which is to balance the provision of parking and the number of
parking customers with the use, and increasing use, of alternative modes by commuters. In essence, while
customer demand is difficult to predict, it can be swayed by using both ends of the service and program
offerings under direct control of the [UCLA Transportation] Department, namely parking policy and TDM
program provision.”
UCLA is now significantly under the 1990 parking and trip caps. It has reduced the percent of employees
driving alone to campus to 51 percent and students to 25 percent. For the first time in campus history, more
students who live off campus walk to UCLA than drive.65 UCLA meets the National Standard of Excellence in
commuter benefits—a standard created by the National Center for Transit Research and the US Environmental
Protection Agency. It is recognized with Gold Status as 2017’s Best Workplaces for Commuters, a program of
the Center for Urban Transportation Research.
For UCLA students, faculty and staff who use alternative transportation, the Bruin Commuter Club provides
complimentary access to benefits, including 50 percent off daily parking fees, 4 hours of free Zipcar usage per
month, monthly prize drawings for logging your commute, monetary biking incentives, and a walking welcome
kit that includes monetary incentives
UCLA’s program also features:
a need-based permit allocation process;
discounted parking and an online ride matching service for carpooling and vanpooling;
developed several master plans including for parking, bicycles, sustainable transportation, fleet &
transit, and a climate action;
an emerging parking meter system to encourage turnover and maximize space utilization; and
free bicycle repair and rental.

34
Corporate Campus – Microsoft Corporation
Microsoft Corporation’s commute program for its suburban Seattle, Washington campuses encompasses more
than 44,400 full-time Microsoft employees and contingent staff commuters. Microsoft reduced daily SOV
commuting by nearly 20 percent from 2004 to 2016.66 Over the past seven years, Microsoft eliminated more
than 4.2 million single-rider trips: or 59 million fewer miles of travel and 56 million fewer pounds of carbon
dioxide emitted.67
Microsoft has a particularly robust bus and shuttle service for employees, vendors, and guests. Shuttles can be
booked via phone or app for a customized trip. As of 2016, Microsoft offered 198 shuttles and an average
seven-minute wait time at all scheduled stops, alleviating the need for people to drive personal cars across
campus for meetings.
Microsoft’s program also features:
free regional transit passes for all workers (full-time employees, vendors, and contractors),
accommodating fifteen percent of employees;
a subsidy and matching services for its vanpooling program, which accommodates 13 percent of
employees;68
a bike/walk reimbursement program, covered and uncovered bicycle parking, a shuttle option, and
locker/shower facilities (used by five percent of employees);
telework facilities, which are used by five percent of employees;69 and
a flexible work culture, which permits a large number of employees to arrive after 10 AM and work
until 9 PM.70
Medical Campus – Providence Portland Medical Center
The Providence Portland Medical Center (PPMC) located east of downtown Portland, Oregon, has more than
1,000 daily commuters. PPMC reduced the SOV mode share from 85 percent in 1996 to 66 percent in 2016.71
PPMC has a Good Neighbor Agreement with the surrounding communities and maintains a Transportation
Working Group that partner with neighborhoods on transportation improvements. To efficiently use its parking
supply, PPMC operates valet service at the parking garages for patients and visitors.
PPMC’s program also features:
shuttle service to the closest transit venter for use by employees, patients, and visitors; and
secure bicycle parking, changing/showering facilities, self-service bike repair areas, and a periodic
free bicycle tune-up service for employees.
Research Campus – Texas Instruments
Texas Instruments (TI) was honored nationally and locally for its Employee Trip Reduction program, including
recognition as among the top “Best Workplaces for Commuters” by the U.S. Environmental Protection Agency.
TI’s trip-reduction efforts kept an estimated 8,400 vehicles off North Texas roads daily, averting ozone-forming
NOx as well as CO2 emissions.72 In 2008, public transit and vanpool/carpool activities combined resulted in
nearly 58,000 total travel miles averted every day in the Dallas area.73

35
Texas Instrument’s program also features:
TI offers free shuttle service within TI's Dallas area campuses and to light-rail train stations;
coordination of riding pools, which receive premium parking spaces;
TI offers considerable bike-to-work services (the League of American Bicyclists designated TI a
"Bicycle-Friendly Business);"74
on-site cafeterias, gyms, and ATMs (to reduce demand for lunch-hour trips); and
on-site concierge service (assists employees with errands, reservations, event planning, and other
services, and sells certain items on premises, such as gift cards and candy).
Military Campus – Hanscom Air Force Base
Hanscom Air Force Base is a non-flying base located twenty miles from Boston. The base supports an Air Force
command and several DoD-related organizations: the Massachusetts National Guard, Massachusetts Institute
of Technology Lincoln Laboratory, and MITRE Federally Funded Research and Development Centers.
In July 2014, Hanscom Air Force Base and its neighbors, along with MIT Lincoln Laboratory, created a
combined commuter management program called "HanscomRIDES." Over the next 18 months, the three
entities spent an average of 65 hours each week to build and promote the program through transportation
fairs, appreciation picnics, an online ride matching service, newspaper articles, brochures and in-house
education. The number of vanpools increased from six in 2014 to 48 as of 2016. This represents nearly half of
the 107 registered vanpools in the state.
In 2016, Hanscom Air Force Base was recognized at the 5th Annual Excellence in Commuter Options Awards
Ceremony as a Massachusetts Department of Transportation “Rising Star Spotlight Award” recipient. The
award recognized the base for significant progress in promoting sustainable transportation options through
resourceful actions such as employee outreach and education; commuter options and incentives; innovative
concepts; and collaborative efforts.
Hanscom’s program also features:
a Transportation Incentive Program providing employees with funds to cover transportation costs such
as bus, train, subway, and vanpool fees; and
an E-Shuttle service for employees going to Logan Airport on official business.75
Hanscom’s program also coordinates other services available to employees, including:
Local bus service;
shuttle services, organized by the local business district and MIT, provide additional transit access;
Base Taxi Service sponsored by one of the base units, which is ideal for those who carpool, during
inclement weather, or where high-volume parking lots limit parking; and the
Alternative Commuting Rewards Program sponsored by Massachusetts, where employees receive
rewards when they telecommute, walk, bike, carpool, take public transit or work a compressed week.
Rewards accrue towards discounts on sporting events, ski lift tickets, restaurants, and other
retailers.76

36
Local Government – Montgomery County, Maryland
Montgomery County established Transportation Management Districts (TMD) in the late 1980s, which is a
national model for implementing TDM strategies. The county’s TMDs provide services that encourage the
transit use and other commuting options in major business districts. There are six districts: Bethesda, North
Bethesda, Friendship Heights, Silver Spring, Shady Grove, and White Oak (future). Starting in 2002, all
employers with 25 or more employees located in these areas are required to actively work with TMD staff.
Approximately 95 percent of employers comply with this requirement.77
As part of the program, employers designate a coordinator to service the company’s employees, implement a
traffic mitigation plan to reduce drive along rates, submit annual reports, and participate in the county’s annual
commuter survey. For their mitigation plans, companies commit to a variety of TDM strategies. These range
from distributing and displaying information on transportation alternatives, to free and reduced parking for
car/vanpools, and subsidized transit passes. The county also negotiates agreements with developers who are
constructing buildings to ensure trip reduction. These agreements run in perpetuity and contain specific
performance targets and timelines.
Each district has aggressive targets for non-auto driver mode share, which some are already meeting:
Bethesda (38.3 percent), North Bethesda (28.2 percent), Friendship Heights (38.9 percent), Silver Spring
(52.2 percent), and Shady Grove (16 percent).78 Cost of implementing these strategies are borne by
employers. Each district provides services and assistance to employers. These services are ultimately paid for
through parking revenue and fees assessed on commercial office space in each district.
Literature Review Findings
This literature review underscores the following key themes regarding NCPC’s parking policies:
Jurisdictions across the country are increasingly adopting policies that limit parking, particularly where
transportation alternatives are available. NCPC employed this approach beginning in the 1980s.
NCPC adopted employee-based parking ratios, or parking maximums, in the 1980s. Most jurisdictions have
parking minimums and focus on providing ample and free parking to avoid “spillover” parking at adjacent
developments and to maximize access to retail and businesses. NCPC’s approach represented a departure
from parking policy and engineering approaches at the time. Critics contend that the practical impact of
parking minimums is an oversupply of parking, which leads to negative externalities including congestion, air
pollution, and inefficient use of land and resources. Since the mid-2000s, land use and transportation
planners across the country are following parking approaches similar to NCPC’s parking maximums to achieve
in order to counteract the negative effects of over-supplying parking. This “efficiency-based” approach reflects
broader NCPC goals of reducing traffic and achieving a more compact, economically efficient federal footprint
in the region.
There are a variety of analytical tools available to inform parking policies, both new and old. Traditional
tools for estimating parking demand are not well-suited for complex federal campuses.
Transportation practitioners use analytical tools to inform, not determine, how much parking to supply at a
given location. They are designed to help decision makers assess what parking supply is appropriate given
parking demand; the lifecycle cost of providing parking; and the relative cost and convenience of transit,
carpooling, and non-motorized commute modes. Typically, parking demand estimates are a primary starting
point for determining parking policy. In estimating demand for parking at unique federal facilities and
campuses, NCPC’s federal partners should conduct site-level demand studies. These studies should measure

37
existing parking demand and occupancy at the subject site (or similar facilities elsewhere) and account for
transit accessibility in the location and account for other policy goals.
Traditionally, local jurisdictions use estimates of unconstrained parking demand to inform parking standards.
Typically they are based on reference reports like the Institute for Transportation Engineers’ Parking
Generation, which catalogs empirical parking demand surveys for different land use types from sites across
the country. These tools do not take into account transit accessibility and regionally-specific demographic and
economic factors. Although ITE and others are collecting more data and testing adjustment factors, surveys are
typically based on common land use types in suburban settings where data is more generally available.
Urban jurisdictions and institutions like universities are moving towards limiting parking supply and using
pricing to moderate demand. While parking pricing is not currently feasible as a travel demand strategy on
federal properties, limiting parking can be an effective tool if used properly.
Parking supply policies are often paired with pricing schemes to manage parking demand and ensure that
spaces are available for drivers who are willing to pay. This movement is particularly prevalent in urban areas
in the National Capital Region, where transit is plentiful and development pressure is high. The District of
Columbia recently updated its Comprehensive Plan to reduce parking minimums throughout the city and
eliminate parking requirements downtown and near Metrorail stations. Universities are increasingly
experimenting with lifecycle cost accounting of parking spaces, trip reduction agreements with partners, and
tiered pricing for parking. However, federal law does not incentivize NCPC’s partner agencies to price parking
or enable them to change underlying transit subsidies for federal employees. Since parking at most federal
facilities is and will continue to be free, the effect of NCPC’s parking policies is that agencies directly supply a
finite number of free parking spaces. The remaining employees either seek out parking elsewhere (both paid
and unpaid, on-street or off-street), or take alternative modes, particularly carpooling and transit. Limiting
parking should be pursued in light of the availability and relative convenience of non-SOV modes.

38
Local Parking Comparison
Introduction
This chapter summarizes parking requirements and processes for Washington, DC, the City of Alexandria, and
the surrounding counties (Arlington, Fairfax, Loudoun, Montgomery, Prince George’s, and Prince William),
comparing the jurisdictions and synthesizing relevant findings. Although federal facilities are not subject to
these policies, these jurisdictions share NCPC’s goal of reducing the number of SOV on the transportation
network. National Capital Region (NCR) jurisdictions are considered national leaders in land use and parking
policy. This analysis identifies policy trends, analytical approaches, and model processes that can inform
updates to the National Capital Planning Commission’s (NCPC) parking policies.
Typically, parking standards are developed and administered at the local level through planning and zoning
activities within individual jurisdictions. These jurisdictions develop parking policy to manage commercial
development in the context of local livability and economic development goals, transit accessibility, and are
informed by analytical tools. Depending on the jurisdiction, these standards include some combination of
parking supply requirements or guidelines paired with transportation demand management (TDM)
tools/strategies that moderate parking demand.
While NCPC is similar to other local jurisdictions and agencies in setting planning policy and reviewing
developments and plans, NCPC’s mission, authorities, functions, and constraints create important distinctions.
Similarly, the applicant federal agencies NCPC works with have distinct characteristics from other private
sector developers and asset managers. NCPC is responsible for protecting federal interests and a suite of
unique, non-contiguous, nationally significant installations and campuses across a large geographic area.
NCPC and its partner agencies are subject to and constrained by federal law, rather than state law or local
ordinances. Despite these differences, NCPC and the region’s jurisdictions have shared interests and goals
regarding the National Capital Region’s development. There are relevant lessons NCPC can take from the best
practices of regional jurisdictions, including goals, analytical approaches, and processes.
Background and Approach
Reflecting differing authorities, roles, and interests, NCPC and local jurisdictions’ policies are not readily
comparable. Due to the differences between how NCPC and local jurisdictions approach and develop parking
guidelines, the Volpe Center and NCPC staff determined that a quantitative comparison was not feasible or
appropriate. Therefore, the Volpe Center undertook a qualitative parking comparison, with a focus on local
parking policies and processes.
Parking Policy Frameworks
NCPC’s general approach to setting parking policy is both similar to, and different from, local jurisdictions.
NCPC’s employee parking policies are intended to encourage a gradual shift from SOV commuting to transit,
carpooling, and non-motorized transportation. NCPC’s Comprehensive Plan parking ratios reflect regional
transit availability and distance to Downtown Washington, DC. This translates to less parking where transit
accessibility is high, with guidelines for more parking spaces in outlying suburban areas.
NCPC’s overall approach is mirrored in local comprehensive plans, zoning codes, and TDM programs, where
access to major transportation infrastructure (including transit and highways) and land use/density at a
particular location are often the overriding factor in developing parking policies. In addition to transit

39
accessibility, local jurisdictions use estimates of unconstrained parking demand to inform parking policy and
make geographically-based adjustments.
While NCPC’s Comprehensive Plan parking ratios generally serve as maximum parking standards, most of the
local jurisdictions within the NCR set minimum parking standards. NCPC parking space policies are based on
the number of employees. In most jurisdictions, there is a special development review process for larger sites,
which are more similar in scale to some of properties under NCPC’s jurisdiction. Beyond properties that go
through special review processes, most local jurisdiction policies are generally based on gross floor area (GFA).
Market pressure and economic development are key driving forces for local jurisdictions. In dense areas with
high land values, developers have incentives not to build parking because land is relatively scarce and
structured parking is expensive. Conversely, federal facilities often have considerable undeveloped land, and
prevailing considerations include environmental sustainability, impacts on the regional transportation network,
and availability of financial resources.
Organization Roles and Functions
NCPC is responsible for setting parking policy for federal properties within the NCR. Composed of members
from diverse federal and local organizations across the region, including local officials, heads of federal
agencies, and members appointed by the President, NCPC is structured to consider both federal and local
interests within the region. Federal properties are generally not obligated to abide by local zoning regulations.
Instead, through policies in the Comprehensive Plan, NCPC advises federal agencies how to develop their
property in a manner that is compatible with local planning policies, programs, and goals. Most federal
facilities were built with parking that can be allocated to some employees. Because each facility has a unique
mission, ranging from national security to managing federal lands, the Commission must account for distinct
parking needs and use patterns.
Local jurisdictions tend to focus on managing residential and commercial growth, pricing or supplying excess
parking to ensure access to destinations, and economic development. Local jurisdictions are compact and
mostly contiguous; whereas NCPC oversee discrete properties located throughout the region. While NCPC and
the surrounding jurisdictions share the common goal of reducing single occupant vehicle trips, particularly
during peak commute times, NCPC primarily reviews institutional uses, including large office buildings and
research complexes, military installations, educational campuses, and hospitals. Local planning boards are
generally composed of elected officials or appointed members that are accountable to interests within one
jurisdiction. They are subject to state law and local ordinances.
Recent Zoning Code Updates
Several local jurisdictions are currently, or have recently, updated their comprehensive plans and zoning codes
to reduce parking requirements. This change reflects national trends in planning, such as a shift towards
promotion of transit, walking, and bicycling; dense, mixed-use development; and a general adoption of the
tenets of sustainability.
Taken together, the goal of these comprehensive plan updates is to create transparent, flexible, predictable,
and easy to understand parking ratios. The result is reduced parking minimums in most cases. For example,
the District of Columbia completed an update of its zoning code in 2016 with the goal of simplifying the
parking standards to make them based on proximity to transit and zone (instead of use and zone, and
characteristics). Similarly, Montgomery County updated its parking standards in 2014 after a study found that
parking is overbuilt and that the standards were overly complicated. In 2013, Arlington County created a
Commercial Parking Working Group that was tasked with devising a transparent and predictable methodology

40
for its parking requirements. The City of Alexandria and Prince George’s County are currently in the process of
updating and simplifying their zoning codes and parking requirements.
Parking Provision and Variance Processes in the NCR
NCPC uses Transportation Management Programs (TMP) to evaluate a federal facility’s ability to comply with
prescribed Comprehensive Plan parking ratios at facilities over 100 employees. Factors such as the relative
proximity of high occupancy vehicle/toll lanes, the position of the facility’s nearest Metrorail station within the
overall Metrorail system, facility work hours and shifts, and employee residence locations are considered.
When TMPs are submitted to NCPC, the agency consults with applicants to review the document and its
recommendations. Modified parking ratios are considered based on site-specific circumstances such as
installation land use site access, duty hour schedules, security, and transit proximity. NCPC provides some
agencies with specific direction, including long- and short-range parking ratios.
Alternatively, most local jurisdictions have criteria and variance processes where developers can request to
build less parking than required by established minimum standards. The degree to which a developer can
reduce the amount of parking required for a building or development varies by jurisdiction. These variance
requests are often based on criteria such as access to transit and the provision of car-sharing spaces. Each
jurisdiction differs in terms of the extent to which the variance process is explicitly laid out in policy, or “by-
right,” versus at the discretion of staff and local elected officials.
For larger developments, or developments that go outside of the typical review process, some of the local
jurisdictions require the creation of TDM plans, which are similar to NCPC’s TMPs. Arlington and Montgomery
Counties, and the City of Alexandria implement enforceable requirements for TDM Plans on larger
developments. These TDM plans have the common goal of reducing vehicle trips during the am and pm peak.
Of all the jurisdictions, the District’s parking standards are the most aggressive in limiting the amount of new
parking that is built. This is consistent with the District’s relatively high transit accessibility and more limited
developable land. For example, the District does not require any parking in most of downtown and in other
special purpose and campus area zones. Outside of downtown, developers can reduce required parking based
on the following criteria: proximity to transit, provision of car sharing, neighborhood historic character, and the
presence of a tree canopy. To gain permission to reduce parking, developers must submit a TDM plan for
approval to the District Department of Transportation.
Arlington County takes a similar approach for certain land uses in particular locations. For example, there are
no parking requirements for grocery stores and restaurants within 1,000 feet of Metrorail stations. Developers
can apply for reductions to the parking minimums for other uses, but must submit a traffic impact assessment
(TIA), which generally consists of an analysis of the existing traffic conditions around a proposed development
site, with a forecast for future traffic volumes and impact on the surrounding area. The TIA also includes
projected bicycle, pedestrian, and transit trips (if applicable), and any TDM strategies that will be used to
mitigate future traffic impacts (see Appendix F for more information on TIAs). The applicant must also submit a
stormwater management and compliance plan, meet requirements for affordable development units, and pay
a fee to the County in lieu of providing parking.
Montgomery County takes a more use-based approach. The county has a standard table of parking minimums
for rural, industrial, and agricultural areas, and another set of lower minimums that are used for commercial
and employment uses, and areas close to transit. The county also has four active Parking Benefit Districts,
which are shared parking areas where a developer can opt out of building parking and pay into a county-run
public parking fund. Developers can apply for parking reductions in these areas based on the following criteria:
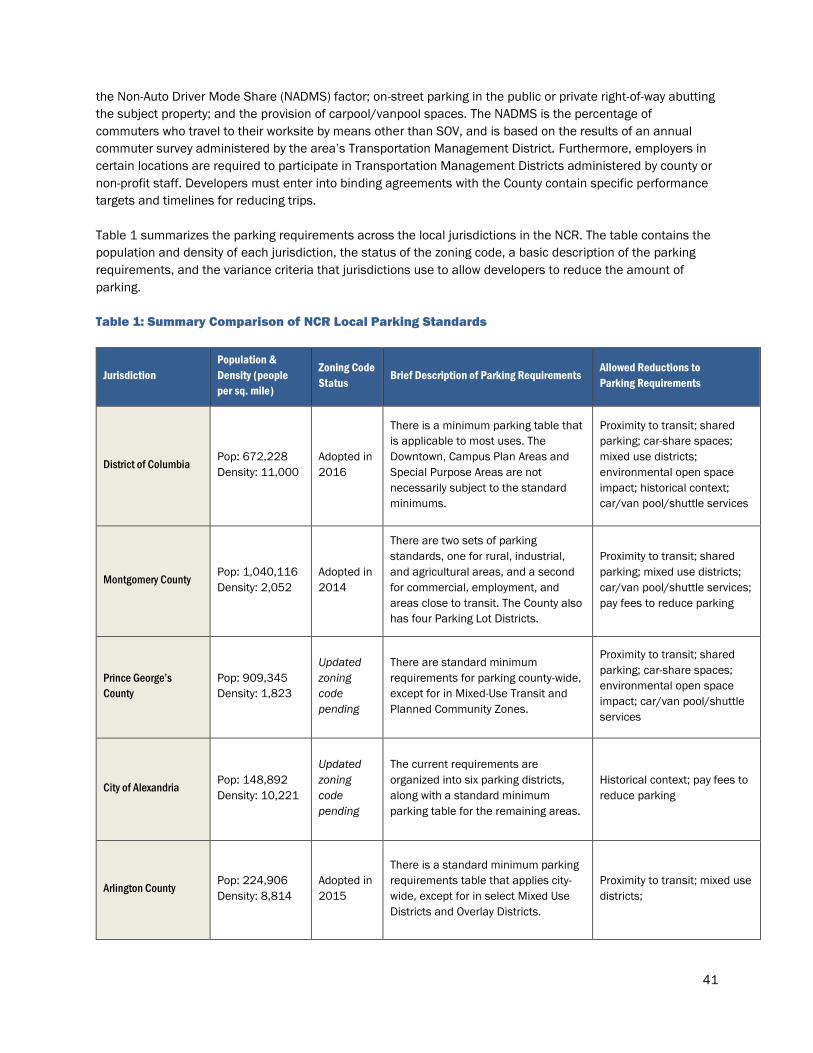
41
the Non-Auto Driver Mode Share (NADMS) factor; on-street parking in the public or private right-of-way abutting
the subject property; and the provision of carpool/vanpool spaces. The NADMS is the percentage of
commuters who travel to their worksite by means other than SOV, and is based on the results of an annual
commuter survey administered by the area’s Transportation Management District. Furthermore, employers in
certain locations are required to participate in Transportation Management Districts administered by county or
non-profit staff. Developers must enter into binding agreements with the County contain specific performance
targets and timelines for reducing trips.
Table 1 summarizes the parking requirements across the local jurisdictions in the NCR. The table contains the
population and density of each jurisdiction, the status of the zoning code, a basic description of the parking
requirements, and the variance criteria that jurisdictions use to allow developers to reduce the amount of
parking.
Table 1: Summary Comparison of NCR Local Parking Standards
Jurisdiction
Population &
Density (people
per sq. mile)
Zoning Code
Status Brief Description of Parking Requirements
Allowed Reductions to
Parking Requirements
District of Columbia Pop: 672,228
Density: 11,000
Adopted in
2016
There is a minimum parking table that
is applicable to most uses. The
Downtown, Campus Plan Areas and
Special Purpose Areas are not
necessarily subject to the standard
minimums.
Proximity to transit; shared
parking; car-share spaces;
mixed use districts;
environmental open space
impact; historical context;
car/van pool/shuttle services
Montgomery County Pop: 1,040,116
Density: 2,052
Adopted in
2014
There are two sets of parking
standards, one for rural, industrial,
and agricultural areas, and a second
for commercial, employment, and
areas close to transit. The County also
has four Parking Lot Districts.
Proximity to transit; shared
parking; mixed use districts;
car/van pool/shuttle services;
pay fees to reduce parking
Prince George’s
County
Pop: 909,345
Density: 1,823
Updated
zoning
code
pending
There are standard minimum
requirements for parking county-wide,
except for in Mixed-Use Transit and
Planned Community Zones.
Proximity to transit; shared
parking; car-share spaces;
environmental open space
impact; car/van pool/shuttle
services
City of Alexandria Pop: 148,892
Density: 10,221
Updated
zoning
code
pending
The current requirements are
organized into six parking districts,
along with a standard minimum
parking table for the remaining areas.
Historical context; pay fees to
reduce parking
Arlington County Pop: 224,906
Density: 8,814
Adopted in
2015
There is a standard minimum parking
requirements table that applies city-
wide, except for in select Mixed Use
Districts and Overlay Districts.
Proximity to transit; mixed use
districts;
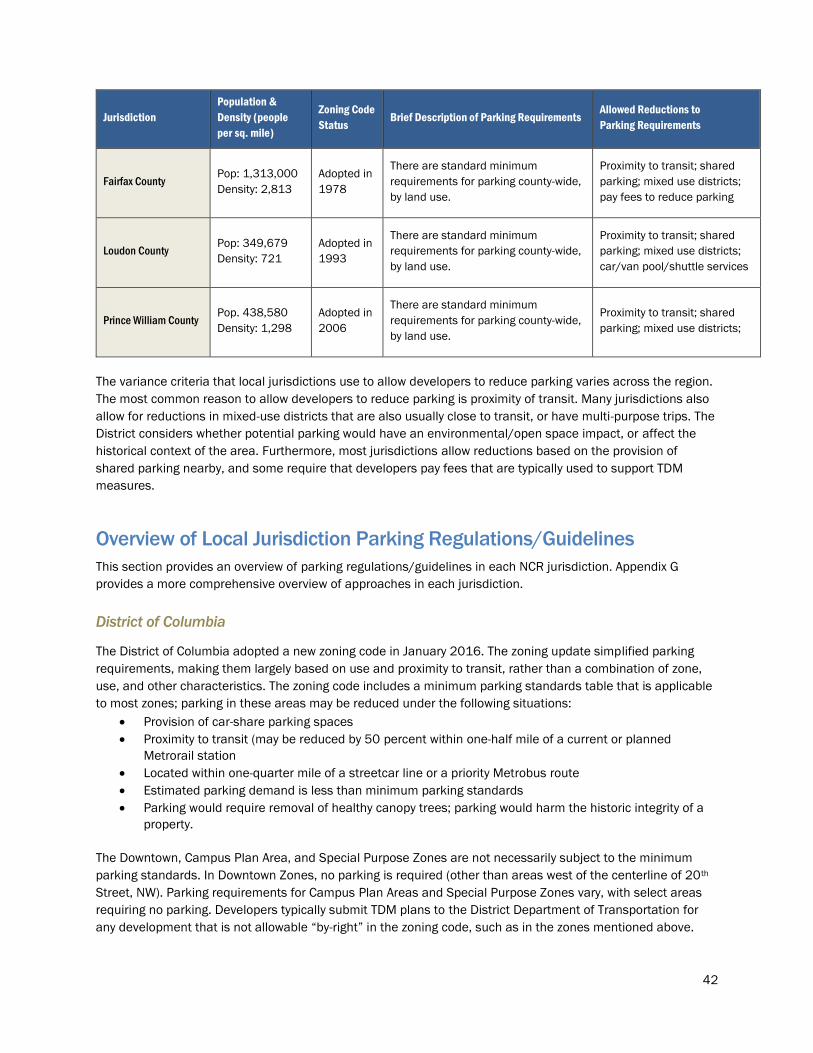
42
Jurisdiction
Population &
Density (people
per sq. mile)
Zoning Code
Status Brief Description of Parking Requirements
Allowed Reductions to
Parking Requirements
Fairfax County Pop: 1,313,000
Density: 2,813
Adopted in
1978
There are standard minimum
requirements for parking county-wide,
by land use.
Proximity to transit; shared
parking; mixed use districts;
pay fees to reduce parking
Loudon County Pop: 349,679
Density: 721
Adopted in
1993
There are standard minimum
requirements for parking county-wide,
by land use.
Proximity to transit; shared
parking; mixed use districts;
car/van pool/shuttle services
Prince William County Pop. 438,580
Density: 1,298
Adopted in
2006
There are standard minimum
requirements for parking county-wide,
by land use.
Proximity to transit; shared
parking; mixed use districts;
The variance criteria that local jurisdictions use to allow developers to reduce parking varies across the region.
The most common reason to allow developers to reduce parking is proximity of transit. Many jurisdictions also
allow for reductions in mixed-use districts that are also usually close to transit, or have multi-purpose trips. The
District considers whether potential parking would have an environmental/open space impact, or affect the
historical context of the area. Furthermore, most jurisdictions allow reductions based on the provision of
shared parking nearby, and some require that developers pay fees that are typically used to support TDM
measures.
Overview of Local Jurisdiction Parking Regulations/Guidelines
This section provides an overview of parking regulations/guidelines in each NCR jurisdiction. Appendix G
provides a more comprehensive overview of approaches in each jurisdiction.
District of Columbia
The District of Columbia adopted a new zoning code in January 2016. The zoning update simplified parking
requirements, making them largely based on use and proximity to transit, rather than a combination of zone,
use, and other characteristics. The zoning code includes a minimum parking standards table that is applicable
to most zones; parking in these areas may be reduced under the following situations:
Provision of car-share parking spaces
Proximity to transit (may be reduced by 50 percent within one-half mile of a current or planned
Metrorail station
Located within one-quarter mile of a streetcar line or a priority Metrobus route
Estimated parking demand is less than minimum parking standards
Parking would require removal of healthy canopy trees; parking would harm the historic integrity of a
property.
The Downtown, Campus Plan Area, and Special Purpose Zones are not necessarily subject to the minimum
parking standards. In Downtown Zones, no parking is required (other than areas west of the centerline of 20th
Street, NW). Parking requirements for Campus Plan Areas and Special Purpose Zones vary, with select areas
requiring no parking. Developers typically submit TDM plans to the District Department of Transportation for
any development that is not allowable “by-right” in the zoning code, such as in the zones mentioned above.

43
Montgomery County
Montgomery County’s current zoning code was adopted in 2014. Montgomery County updated its parking
standards after a study found that the county’s parking minimum standards resulted in an oversupply of
parking, and that parking could be shared in mixed-use areas. The Montgomery County Department of
Transportation and the Maryland-National Capital Park and Planning Commission, along with a consultant,
conducted the study. The updated parking standards—a combination of parking minimums and maximums—
are based on land use and transit availability, with parking minimums outlined for three different land use and
density types:
Parking standards for rural, industrial, and agricultural areas are based on the assumption that the
employees/residents in those areas will largely be driving and will park at their destination for most of
the day.
Parking standards for commercial and employment areas, and areas close to transit, are based on
lowered minimums, with a range of parking minimums and maximums used for Parking Lot Districts.
Parking Lot Districts feature a shared parking, where developers may choose to opt out of constructing
parking if they pay into a county-run public parking fund.
Parking reductions may also be made in the mixed-use and Parking Lot District areas based on several factors:
The “Non-Auto Driver Mode Share (NADMS) factor”
On-street parking in the public or private right-of-way abutting the subject property
The provision of carpool/vanpool spaces
The NADMS factor is the percentage of commuters who travel to their worksite by means other than SOV.
NADMS is calculated is based on the results of an Annual Commuter Survey administered by the county’s
Transportation Management Districts. Depending on the location, each district is managed either by a non-
profit or Montgomery County Department of Transportation staff.
As described in section 0, Montgomery County has six Transportation Management Districts where employers
with more than 25 employees must work to reduce vehicle trips. These employers must implement TDM
strategies to meet modal targets. Example strategies include designating a transportation benefits coordinator,
implementing a Traffic Mitigation Plan, submitting an annual report of activities, and participating in the Annual
Commuter Survey.
Additional variances to the parking requirements throughout the entire county may be granted if an alternative
compliance plan is approved (there is little detail available about what such a plan entails).
Prince George’s County
Prince George’s County is currently in the process of a comprehensive update. The update process began in
2014, with the goal of adopting the new code in the fall of 2017. The updated zoning will be “more modern
and user-friendly.”
The current parking standards include:
A standard table of minimum parking requirements for all zones, except for Mixed-Use-Transit (M-X-T)
Zones and Metro Planned Community Zones.
The standards are based on the gross floor area for all uses, except institutional/educational uses
where standards are based on number of building occupants, seats, beds, etc.
Parking minimums reductions are considered if the site would have a high percentage of impervious
surfaces. Reductions for shared parking are allowed in select cases for small sites.
44
The parking standards in the M-X-T and Metro Planned Community Zones are established in general parking
standards. These standards permit relaxed minimums depending on expected trip reductions from different
land uses in close proximity (internal capture) and transit availability. Developers request a reduction to
minimums and must submit detailed site plans to the Planning Board. The package must include the data,
methodology, and assumptions used to calculate the estimated demand parking during each hour of the day
and number of proposed parking spaces.
Prince George’s County has several Transit District Development Plans—either approved or in progress—in
College Park, Prince George’s Plaza, New Carrolton, and the West Hyattsville area. In these transit districts, the
county has a goal to reduce vehicle trips during the am and pm peaks, and developers may be asked to
provide transit amenities and incentives for transit use.
City of Alexandria
In 2014, the City of Alexandria began a study to establish updated parking requirements. Alexandria’s last
comprehensive update to its zoning code was in 1992 (while the last comprehensive review of the parking
standards was in the 1960s). Alexandria is updating its parking standards to reflect an increase in transit,
bicycling, and walking, changing demographics, and market trends. The study has two phases:
Phase 1 resulted in new parking standards for multi-family residential developments, which were
approved in 2015.
Phase 2 of the study, now in progress, will result in updated parking requirements for commercial,
office, and retail parking.
In the current parking standards, the Alexandria is divided into six Parking Districts, in addition to the King
Street Parking District, the Central Business District, and the Mount Vernon Overlay Zone. For many uses, the
parking requirements are standardized across all of the districts. However, there are different parking
minimums for retail, office, commercial, governmental, and industrial areas. District 6 surrounds the Metrorail
stations and has the lowest parking requirements. In addition, there is no off-street parking requirements for
properties abutting the Potomac River in the Federal Waterfront Settlement Restricted Parking Area.
For non-residential uses, the required parking may be reduced through a special use permit, which requires
detailed plans of the proposed development site, proposed parking, and an analysis of the use and capacity of
the site. For developments that will cause a disproportionately negative traffic impact, developers may be
required to obtain a transportation management special use permit. These permits require the creation of a
TMP, and applicants may also have to pay fees to the city, which are used in the city-wide TDM funds.
For developments that are over a certain size—50,000 SF for office, 40,000 SF for retail— applicants must also
create a TMP and apply for special use permit. The transportation management plan includes a TIA. The TMP
remains in place throughout the life of the building, and the city may revoke the special use permit if
compliance is not maintained.
Arlington County
Arlington County’s current zoning code was adopted in 2015, after an update process that began in 2011. The
goal of the update was to make the zoning code easier to understand and administer, and move to a new land
use classification system.
As part of the update process, the county completed a Commercial Parking Study in 2013. This study led to the
Reduced Parking Policy for Site Plan Offices, which outlines a flexible and consistent approach for developers
proposing to build less parking than is required by the zoning code. The policy outlines a contribution formula

45
for developers to help pay for TDM programs, and potentially transit operating costs, to help offset the
additional traffic that will be generated by the new office developments.
A county-sponsored Residential Parking Working Group is currently working with county staff to finalize new
policy recommendations for parking at permit projects in Arlington’s Rosslyn-Ballston and Jefferson Davis
Metrorail corridors. The working group recommended reducing parking minimums for condominiums and
apartment buildings based on distance from Metrorail stations. The working group also suggested provisions
for 100 percent of residential parking to be provided in shared parking structures and that developments
which exceed certain parking thresholds be required to implement TMD strategies.79
A general description of Arlington County’s current parking requirements follows:
Parking minimums are based on gross floor area.
A jurisdiction-wide parking standard is maintained, however, parking minimums are reduced in certain
Mixed Use Districts and Overlay Districts.
There is no parking required for sites within 1,000 feet of a Metrorail station and for restaurant and
grocery stores that meet specific hours-of-operation and square footage criteria.
Any developer can request to supply parking below the parking minimums. Applicants are required to
submit a TDM Program, a TIA, a Stormwater Management and Compliance Plan; and meet applicable
Affordable Dwelling Units requirements.
Beyond the parking requirements in the zoning code, Arlington County also has a Site Plan Development
process, which includes a TDM Program. Participation in the site plan development process is voluntary, but
the county provides density bonuses as an incentive to participate. If a developer goes through the site plan
development process, they must also include a TDM plan in their application.
Fairfax County
Fairfax County’s zoning code was last updated in 1976; the county is currently in the beginning phases of
modernizing its zoning code. In Fairfax County, parking standards are governed by one jurisdiction-wide
minimum that varies by land use type, rather than geographically-based zoning districts. Parking minimums are
based on gross floor area with few exceptions. The zoning board may approve a reduction to the defined
minimums for the following reasons:
If a site is situated “within a reasonable walking distance” to public transit.
If a site is situated in an area designated as a “Community Business Center” (neighborhood shopping
areas) and the developer pays a price per space determined at the discretion of the Zoning Board.
If public parking is in close proximity to the site and the developer pays a fee to the County.
If peak periods of demand are non-concurrent, adjacent sites may share parking.
Loudoun County
Loudon County last updated its zoning code in 1993. Similar to Fairfax County, Loudoun County parking is not
governed by zoning districts; rather Loudoun County establishes county-wide minimums by land use.
Developers may not reduce parking supply by more than 35 percent. Reductions are permissible if:
Two separate uses occupy the same site and their peak hours of demand are non-concurrent (shared
parking).
Retail and restaurants uses are located within 400 feet of each other (internal capture).
Nearby public parking is demonstrably under-used and will be so into the foreseeable future.
The site is located within 1,000 feet of a “regularly scheduled bus stop” sufficient to cover anticipated
usage of patronage.
A building is over 50,000 square feet of GFA and developer maintains a carpooling or vanpooling
program.

46
Developer maintains a shuttle service.
The above reductions can be combined as long as the total amount of parking reduced does not
exceed 35 percent.
Developers applying for a parking reduction must:
Submit a Parking Demand Analysis.
Submit a plan illustrating the proposed arrangement of parking spaces.
Enter a covenant of 20 years guaranteeing that the owner will provide additional spaces if the Zoning
Board subsequently finds that the reduction shall be modified or revoked.
Prince William County
Prince William County’s zoning code was adopted in 2006. Similar to parking in Loudoun and Fairfax Counties,
Prince William County’s parking is not governed by zoning district. Prince William specifies county-wide
minimums by land use. While the County provides limited circumstances whereby a developer can request a
reduction in the parking supply, potential reductions are quite significant. For example:
When the land use is “so intense that normal individual demand will not be generated,” parking may
be reduced up to 30 percent. Consideration is given to proximity to public transit, nearby public
parking, and commercial and employment activities in the area.
Adjacent uses may use shared parking in two circumstances. In each case, a legal agreement is
required when multiple property owners are involved:
o If operating hours are non-concurrent, parking may be reduced up to 75 percent.
o If operating hours overlap, parking may be reduced up to 25 percent.
If additional land is readily available, construction of up to 50 percent of parking can be deferred (e.g.
land banking). Additional parking must be constructed when Director of Transportation deems
additional parking necessary.
The zoning code requires that new developments submit a TIA and TDM plan, including applications requesting
reduced parking. The requirements of these documents are thoroughly outlined in the Design and Construction
Manual.
Local Parking Comparison Findings
This comparative analysis of local parking standards highlights the following key themes that may inform
NCPC’s parking policies as the agency considers revisions to its Transportation Element:
NCPC is a regional leader in promoting non-SOV commuting. The agency’s parking policies are a significant tool
to achieve these goals.
NCPC’s Comprehensive Plan parking ratio policies ensure that parking is not overbuilt at federal properties.
This has a powerful and direct effect on how federal employee travel. The parking ratios also help federal
agencies build in a more efficient, secure manner, which enhances the federal portfolio’s urban design quality.
Local jurisdictions are in the process of, or have recently completed, updating their parking policies to meet
sustainability goals, encourage travel options, and reduce private development costs. In the future, NCPC
should highlight its regional leadership in parking policy while ensuring that there is a clear analytical
foundation for how parking policies are determined.
NCPC is unique from local jurisdictions. Local policies and approaches can inform NCPC parking policies, but
are not directly applicable to a federal context.

47
NCPC’s mission, function, constraints, approach to parking, and federal partner agencies have some
similarities to, but are ultimately unique from other institutions and local jurisdictions. NCPC is responsible for
federal interests and a suite of unique, non-contiguous, nationally significant facilities across a large
geographic area. Federal installations or campuses have very different parking requirements than more
traditional land uses that local jurisdictions regulate. The Commission is composed of members from diverse
federal and local organizations across the region, including local officials, heads of federal agencies, and
members appointed by the President. NCPC and its partner agencies are subject to and constrained by federal
law. In contrast, local jurisdictions regulate commercial development. Local planning boards are generally
composed of elected officials or appointed members that are accountable to interests within one jurisdiction.
They are subject to state law and local ordinances.
Local jurisdictions throughout NCR are revising parking policies and reducing parking requirements. These
policies are increasingly flexible and streamlined.
Jurisdictions across the NCR are implementing both lower and more flexible parking minimums, with greater
emphasis on transit and non-SOV modes. While NCPC’s parking maximum policies have a different basis than
local jurisdictions, the intent and effect of its policies are generally the same. The agency may be able to use
local policy approaches and processes as models. Recent revisions to local jurisdiction standards point to an
opportunity to refine and modernize NCPC’s parking guidelines. For example, it is notable that several local
jurisdictions have defined and data-driven parking variance processes that allows flexibility in response to site-
specific conditions and needs. Such an approach may enable NCPC to implement broad-based standards while
accounting for site-specific variability and individual facility needs that cannot be captured in a regional policy
map.
NCPC should consider a more formal parking variance process. Similar to local jurisdictions, this process could
be data-driven, predictable, and transparent.
Variance processes differ greatly by jurisdiction. Some are more explicit, allowing developers to change parking
provision by-right: according to factors such as proximity to transit, area transportation mode share, or land use
types. Others are more discretionary, whereby applicants must document conditions at the site, and are
subject to case-by-case recommendations and decisions made by jurisdiction staff and local planning boards.
While NCPC has a similar case-by-case approach, the Commission’s review process may benefit from greater
definition and predictability. NCPC could consider implementing policies in certain geographic areas and/or for
particular facility types. NCPC could also institute thresholds and limits for modifying parking policies. For
example, a facility or campus may be eligible to apply for a modification if they exceed a certain number of
employees or are not proximate to transit. Allowable modifications may be capped at a certain percentage
above the underlying parking maximum.
Typically, a county or local jurisdiction has its own guidelines for a TIA, which include a description of the
proposed development site, the current traffic conditions, a forecast of the trips that will be generated from
travel to the new site, and the impacts of the traffic (which includes any changes to the level of service, or
delay). Similarly, federal facilities could be eligible for a modified parking ratio based on a TIA, mitigation
measures outlined in an agency’s Transportation Management Program, or data garnered from commuter
surveys and the regional transportation model. Non-SOV trips could be included in a TIA, along with any TDM
strategies that are proposed to mitigate the impact of the traffic that the site will generate.

48
Going forward, NCPC can continue to consider current and future trends that may reduce parking demand at
federal facilities. These include alternative workplace arrangements and automated vehicles.
While not mentioned explicitly in any of the local zoning codes reviewed for this analysis, local jurisdictions and
the transportation industry are grappling with emerging technologies and new workforce trends. It is currently
unclear if the trends below will reduce the need for parking at federal facilities, but NCPC should continue
evaluate them:
Automated vehicles: Fully automated vehicles, which operate without human input, have the potential
to transform the way people travel. There are two distinct visions for automated vehicles that are often
used to understand what may happen if the entire vehicle fleet changes to automated vehicles. In one
scenario, the vehicle fleet would consist mostly of shared-automated vehicles, which would reduce the
number of vehicles on the road, and reduce private vehicle ownership. In this scenario, there would be
a reduced need for parking as more vehicles are shared. In the second scenario, most people would
own an automated private vehicle, and have the ability to live farther away from where they work since
they will be able to work during their commutes. Although there is no clear consensus on if/when the
majority of vehicles on the road will be automated, NCPC can still begin to consider this trend’s
potential wider impacts on parking and transportation planning.
Alternative Workplace Arrangements: Alternative workplace arrangements include teleworking,
hoteling, hot desking, and desk sharing. These arrangements are used when employees work from
alternate locations on various schedules, or do not work full time in one facility, and do not necessarily
have assigned, permanent work spaces. These alternative workplace arrangements can affect the
need for parking due to employees traveling between facilities during the day, or by creating a more
inconsistent demand for parking if different numbers of employees are on-site daily. When working
with its federal partners to determine parking needs, NCPC should how these policies impact parking
utilization.

49
Modeling Analysis
Introduction
This chapter lays out the methodology, limitations, analysis, and findings from the Volpe Center’s quantitative
review of NCPC’s parking policies, specifically those prescribing a numeric ratio system.
Although NCPC’s Comprehensive Plan establishes a broad set of parking-related policies, the subset that
establishes parking ratios are uniquely suited to a quantitative analysis. Moreover, this set of policies are
among NCPC’s most significant policies, prompting continual interest from federal applicants, the Commission,
local jurisdictions, and members of the public. These policies indirectly affect environmental (air quality, air
temperature, stormwater management, aesthetics, etc.), budgetary (funding sources, capital costs, ongoing
maintenance burdens), workplace, transportation, and opportunity cost considerations. Therefore this study
particularly focuses on parking ratios.
When considering parking policy, understanding accessibility is fundamental. Conceptually, travelers seek to
minimize travel time and cost. For destinations that are easier to reach by transit (either bus, rail, or a
combination of both), employees require less parking than those that lack transit accessibility. Conversely, for
destinations where automobile access is more convenient, employees will use their own vehicles, resulting in a
higher demand for parking. The more parking demand exceeds supply, the more difficult it will be for facilities
to comply with Comprehensive Plan parking ratio policies.
This chapter assesses NCPC’s parking policies and parking inventories at sampled federal facilities in the
National Capital Region (NCR) in light of current (2016) and projected future (2030) accessibility in the region.
The next section describes the analysis methodology and the underlying data in more detail.
Methodology
The transportation industry defines and measures ‘accessibility’ in many different ways. In general, the term
describes the proximity of origins and destinations via different transportation options. In this study,
accessibility is defined as the number of households that can travel to a particular location, within a given time
threshold, during morning rush hour (6:00 to 9:00 am)80 by either transit or automobile. Volpe analyzed peak
period travel since this study focuses on daily commuter behavior to and from federal facilities. Using the
Metropolitan Washington Council of Government’s (MWCOG) regional transportation model, the study team
generated an “accessibility ratio” by dividing the number of households accessible via transit by the number of
households accessible via automobile. The study team then compared the accessibility ratio for twenty federal
facilities with available parking data to explain the variation in parking at different locations (termed the “Volpe
Model”). The following section outlines underlying data sets used for this effort. Appendix H describes
development of the Volpe Model and its limitations in more detail.
Underlying Data Sets
The study team assessed NCPC’s parking policies in light of current (2016) and future (2030) land use and
transportation conditions within the NCR. This analysis is grounded in:
Transit and automobile accessibility data from the MWCOG regional transportation model. This data is
one output of MWCOG’s model, which is used for regional transportation planning.
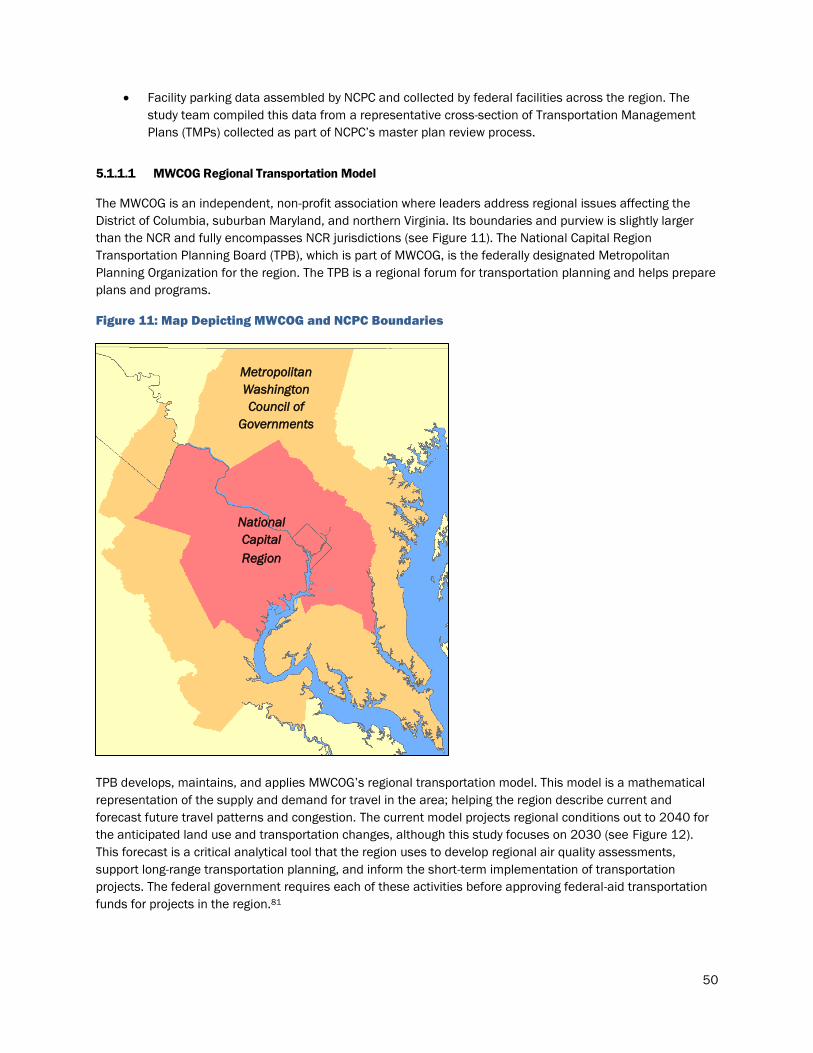
50
Facility parking data assembled by NCPC and collected by federal facilities across the region. The
study team compiled this data from a representative cross-section of Transportation Management
Plans (TMPs) collected as part of NCPC’s master plan review process.
5.1.1.1 MWCOG Regional Transportation Model
The MWCOG is an independent, non-profit association where leaders address regional issues affecting the
District of Columbia, suburban Maryland, and northern Virginia. Its boundaries and purview is slightly larger
than the NCR and fully encompasses NCR jurisdictions (see Figure 11). The National Capital Region
Transportation Planning Board (TPB), which is part of MWCOG, is the federally designated Metropolitan
Planning Organization for the region. The TPB is a regional forum for transportation planning and helps prepare
plans and programs.
Figure 11: Map Depicting MWCOG and NCPC Boundaries
TPB develops, maintains, and applies MWCOG’s regional transportation model. This model is a mathematical
representation of the supply and demand for travel in the area; helping the region describe current and
forecast future travel patterns and congestion. The current model projects regional conditions out to 2040 for
the anticipated land use and transportation changes, although this study focuses on 2030 (see Figure 12).
This forecast is a critical analytical tool that the region uses to develop regional air quality assessments,
support long-range transportation planning, and inform the short-term implementation of transportation
projects. The federal government requires each of these activities before approving federal-aid transportation
funds for projects in the region.81
National
Capital
Region
Metropolitan
Washington
Council of
Governments

51
Figure 12: Map of Expected Land Use and Transportation Changes in the Region (2016-2030)
The MWCOG model uses two key inputs:
Forecasts of population, households, and employment that are regularly updated through a
collaborative process with local officials through MWCOG’s Cooperative Forecasting Program. The
model uses forecasts updated in 2016.
Planned changes to the region’s transit and highway network, which are collaboratively developed in
the region’s Financially Constrained Long-Range Plan (CLRP). The model uses the most recent CLRP,
which MWCOG adopted in 2015.82
The MWCOG model relies on discrete zones, known as Transportation Analysis Zones (TAZ), to separate the
region into sub-areas, each with demographic and land use information. These data are used to estimate
travel demand between TAZs for a given model year. NCPC staff chose to use the 2030 model year for this

52
analysis because a 15- period is most consistent with the master planning process. Figure 12 shows the extent
of the MWCOG model TAZs and expected land use and transportation changes through 2030, and the location
of the case study facilities used for this analysis.
The model uses an ‘origin-destination matrix’ which estimates travel between TAZs across the region. This
matrix is then applied to the transit and highway network, assigning trips to each in order to estimate mode-
based travel patterns, congestion, and travel times between households and jobs. Furthermore, the model
uses travel time to measure current and projected future accessibility in each TAZ based on the number of
households reachable to a given TAZ via automobile or transit.83,84 Using this data, the Volpe Center generated
a ratio comparing the number of households reachable within a certain amount of time for automobile versus
transit (see Figure 13).
Figure 13: Calculating the Accessibility Ratio
An accessibility ratio of one indicates that the same number of households can be reached by either car or
transit. Accessibility ratios under one mean that more households can reach the location by automobile, while
accessibility ratios above one mean that more households can reach the location by transit. For example,
Figure 14 depicts a TAZ that is accessible to more households by automobile compared to transit (during peak
commute periods).
Figure 14: Transit and Automobile Accessibility Concept
Accessibility Ratio = 𝐻𝑜𝑢𝑠𝑒ℎ𝑜𝑙𝑑𝑠 𝑎𝑐𝑐𝑒𝑠𝑠𝑖𝑏𝑙𝑒 𝑏𝑦 𝑡𝑟𝑎𝑛𝑠𝑖𝑡
𝐻𝑜𝑢𝑠𝑒ℎ𝑜𝑙𝑑𝑠 𝑎𝑐𝑐𝑒𝑠𝑠𝑖𝑏𝑙𝑒 𝑏𝑦 𝑎𝑢𝑡𝑜𝑚𝑜𝑏𝑖𝑙𝑒
Zones with automobile
access to target zone
Zones with transit access to target zone

53
Accessibility depends upon a specific travel time window. For example, a longer travel time, means that more
households can reach a particular destination. The MWCOG model provides accessibility data for travel times
of 5, 15, 25, 35, 45, and 60 minutes. This analysis uses two different travel times based on average
commuting times in the Washington, DC area.85 Transit accessibility is evaluated using a 45-minute travel time
while automobile accessibility is evaluated using a 35-minute travel time. Figure 15 applies the accessibility
ratio to regional examples.
Figure 15: Accessibility Ratio Concept Applied to Regional Examples
5.1.1.2 Federal Facility Transportation Management Plans
Facility-specific data for this analysis comes from TMPs provided to NCPC for a representative cross-section of
federal facilities in the region. Current NCPC guidelines require federal facilities to produce TMPs when
facilities update master plans or propose large projects (increase employment levels by 500 or more). TMPs
detail parking inventory and traffic conditions at each site, commuting patterns of employees and visitors,
transportation demand management (TDM) programs pursued by each facility (including shuttles to transit,
programs encouraging transit or ridesharing, etc.), program goals, action steps, and implementation timetables
for short-term (five years) and long-term (20+ years) improvements. In particular, the study team utilized the
following measures:86
Observed (or current) parking inventory
Current employment
Share of employee commuting via single occupancy vehicle (SOV) mode
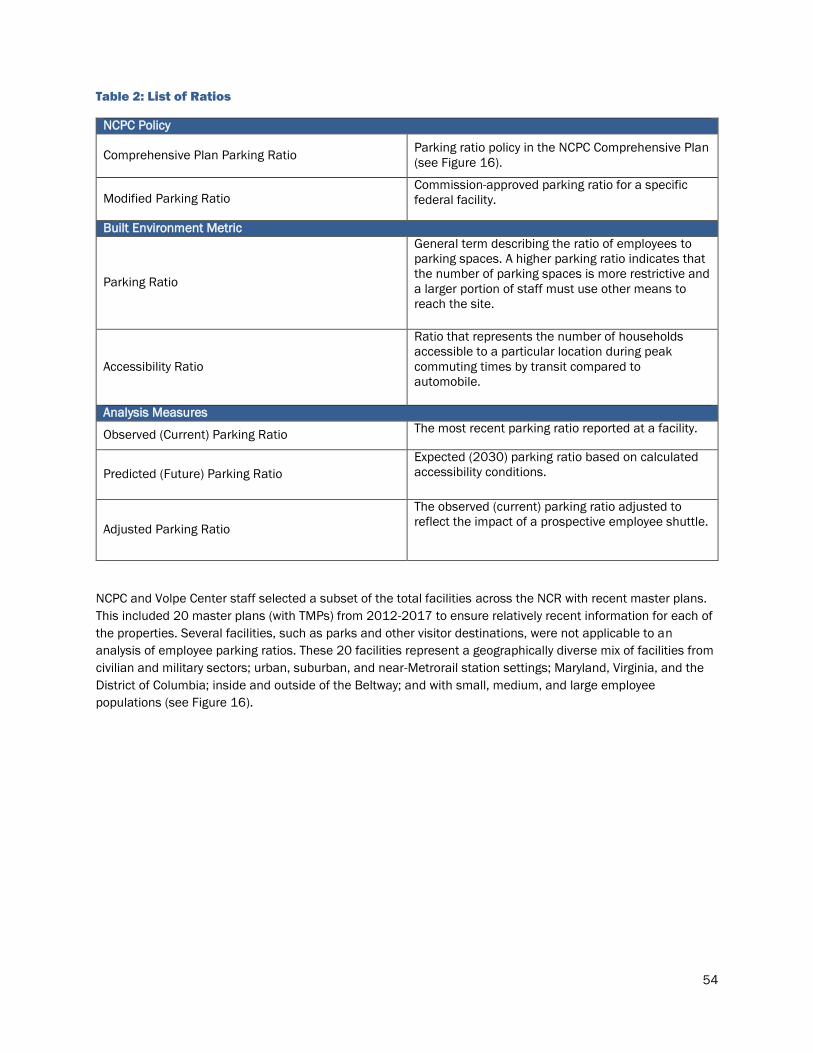
54
Table 2: List of Ratios
NCPC Policy
Comprehensive Plan Parking Ratio Parking ratio policy in the NCPC Comprehensive Plan
(see Figure 16).
Modified Parking Ratio Commission-approved parking ratio for a specific
federal facility.
Built Environment Metric
Parking Ratio
General term describing the ratio of employees to
parking spaces. A higher parking ratio indicates that
the number of parking spaces is more restrictive and
a larger portion of staff must use other means to
reach the site.
Accessibility Ratio
Ratio that represents the number of households
accessible to a particular location during peak
commuting times by transit compared to
automobile.
Analysis Measures
Observed (Current) Parking Ratio The most recent parking ratio reported at a facility.
Predicted (Future) Parking Ratio
Expected (2030) parking ratio based on calculated
accessibility conditions.
Adjusted Parking Ratio
The observed (current) parking ratio adjusted to
reflect the impact of a prospective employee shuttle.
NCPC and Volpe Center staff selected a subset of the total facilities across the NCR with recent master plans.
This included 20 master plans (with TMPs) from 2012-2017 to ensure relatively recent information for each of
the properties. Several facilities, such as parks and other visitor destinations, were not applicable to an
analysis of employee parking ratios. These 20 facilities represent a geographically diverse mix of facilities from
civilian and military sectors; urban, suburban, and near-Metrorail station settings; Maryland, Virginia, and the
District of Columbia; inside and outside of the Beltway; and with small, medium, and large employee
populations (see Figure 16).
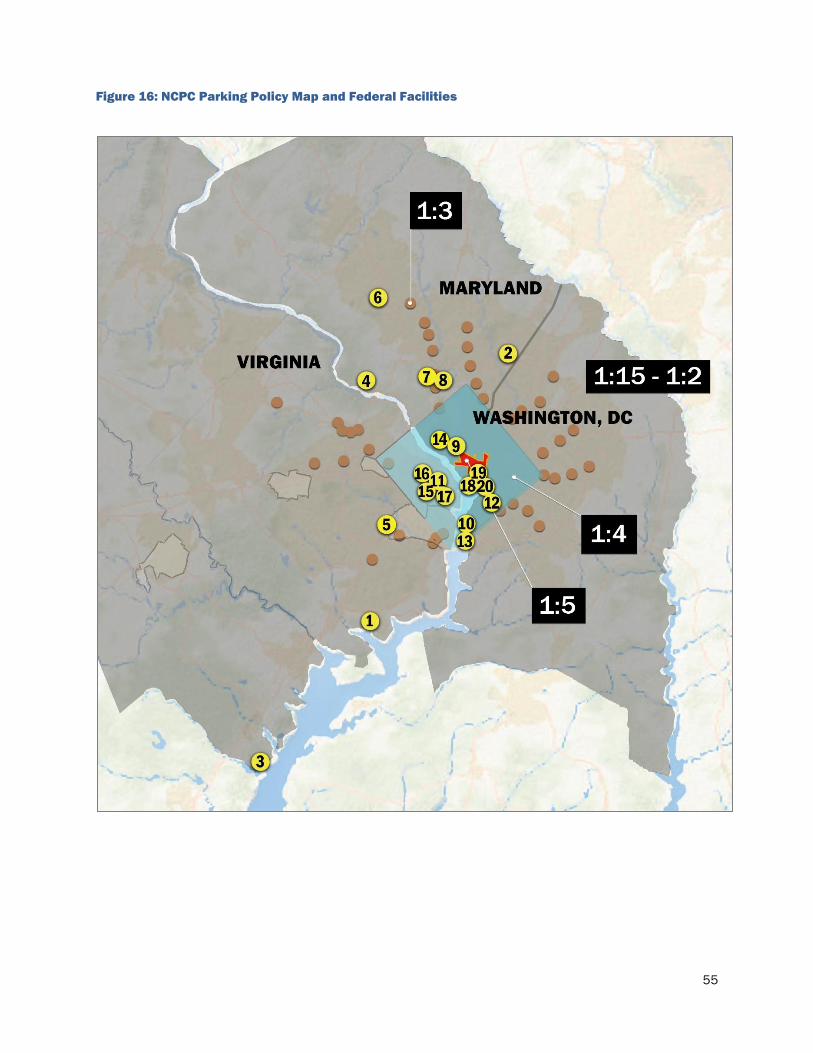
55
Figure 16: NCPC Parking Policy Map and Federal Facilities

56
Table 3 summarizes the relevant statistics used for analysis for each of the sampled study facilities.
Table 3: Selected Facility TMP Details87
No. Facility Name TMP
Year
Comprehensive
Plan Parking
Ratio
Modified
Parking
Ratio
Observed
(Current)
Parking Ratio
Current
SOV
Mode
Share
1 Fort Belvoir 2013 1.5 - 2.0 2 1.22 81%
2 Food and Drug Administration (FDA)
White Oak 2009 1.5 - 2.0 1.5
1.31 80%
3 Marine Corps Base Quantico 2013 1.5 - 2.0 2 1.36 83%
4 Naval Support Facility Carderock 2014 1.5 - 2.0 2 1.55 86%
5 Mark Center 2010 1.5 - 2.0 2 1.82 55%
6 National Institute of Standards and
Technology 2009 1.5 - 2.0
2
1.54 68%
7 National Institutes of Health 2013 3 - 2.15 61%
8 Naval Support Activity Bethesda 2013 3 - 3.32 40%
9 United States Naval Observatory 2014 4 3 1.00 84%
10 Joint Base Anacostia-Bolling 2014 4 - 1.67 81%
11 Naval Support Facility Arlington 2014 4 3 1.72 74%
12 St. Elizabeths Hospital 2012 4 - 1.75 31%
13 Naval Research Laboratory 2015 4 - 1.77 83%
14 Department of Homeland Security
(DHS) Nebraska Avenue Complex 2011 4
-
1.93 35%
15 National Foreign Affairs Training
Center 2016 4
-
1.95 51%
16 Joint Base Myer-Henderson Hall 2013 4 - 2.68 73%
17 The Pentagon 2015 4 - 2.71 16%
18 Fort McNair 2013 4 - 2.77 73%
19 Marine Barracks Washington DC 2015 4 - 4.27 42%
20 Washington Navy Yard 2014 5 4.5-5.0 3.77 50%
Typically, TMPs define the observed ‘parking inventory’ available for staff use. However, it is important to note
that there is some variation between the parking allocation schemes used by the different study facilities, and
employees/staff are categorized differently by the TMPs. For example, some TMPs only provide the total
amount of parking and do not specify if certain spaces are reserved for visitors or staff, making it difficult to
discern the precise observed (current) parking ratio at a given facility. In addition, TMPs generally provide a
total ‘current employment’ that is inclusive of all facility staff while some TMPs differentiate between full-time
and part-time staff or commuting staff (as opposed to ‘on-site’ or ‘on-base’ staff that are not commuting from
off-site). SOV mode share data was derived from facility population surveys that generally took responses from
all staff on site, although one TMP incorporated visitor surveys.
Many of the selected facilities also have some form of shuttle service to encourage staff to use transit options.
Shuttle service varies considerably between the various study facilities – some with both internal and external
service, some with internal service only, and others with external service only. Quality of service also varies
based on wait time (known as “headways”) between shuttle vehicles, use restrictions, and route connectivity.

57
The impact of these shuttle services, or possible addition of shuttle service to those without current options, is
explored in a later section.
Analysis
Basic Relationships
Before considering accessibility or other data for each site, Volpe compared the observed (current) parking
ratios at each of the sampled federal facilities against the associated NCPC Comprehensive Plan parking ratio
policy (see Figure 17).
Figure 17: Comparison of Observed (Current) and Comprehensive Plan Parking Ratios at Select
Federal Facilities
This analysis indicates that facilities vary considerably in the parking ratios they are able to achieve. For
example, there are a number of facilities that fall short of policies within the Historic District of Columbia
Boundary Zone (1:4 ratio). There are likely a number of site-specific factors, including policy decisions and TMP
implementation decisions that influence parking supply outcomes at these facilities. Nonetheless, it suggests
0
1
2
3
4
5
6
Parking Ratio
Observed (Current) Parking Ratio Comprehensive Plan Parking Ratio
Modified Parking Ratio

58
the simplified ratio zone based on a historical political boundary may not be the most appropriate determinant
of parking ratios, rather than for example, a boundary more defined by land use patterns or transportation
accessibility.
NCPC’s Comprehensive Plan parking ratios are applied across a series of concentric zones roughly centered on
the United States Capitol (see Figure 16). Therefore, the Volpe Center compared the relationship between
observed (current) parking ratios at each facility and the distance of each facility from the US Capitol Building.
This analysis showed that there is weak relationship between these parameters, with higher parking ratios
observed at smaller distances from the Capitol. However, as the distance increases, this relationship is not as
clear and, possibly, hits a minimum somewhere between 1 and 1.5 parking spaces per employee. This is
expected since the parking for employees need only be as large as the total staff on site – a parking ratio of 1
to 1. However, this relationship is not strong enough to model parking ratios.
Next, the Volpe Center compared the observed (current) parking ratio at each facility to SOV mode share at
each facility. If the staff at a facility tend to drive alone, the study team expected that the total parking demand
on site would be a higher, and the parking ratio will drop. As other transportation modes are available and SOV
mode share drops, parking demand decreases, leading to a higher observed parking ratio. This analysis
showed that the relationship is also observable but not strong.
Accessibility
Analyzing accessibility data against observed (current) parking ratios at
each facility is one way to explain the variation in parking at each
facility. As described in the methodology section, the Volpe Center used
the MWCOG model to calculate an accessibility ratio for each TAZ in
the region (see Figure 18).
The accessibility ratio is much higher in
the regional core during peak commute
times, particularly near the convergence
of different Metrorail lines.
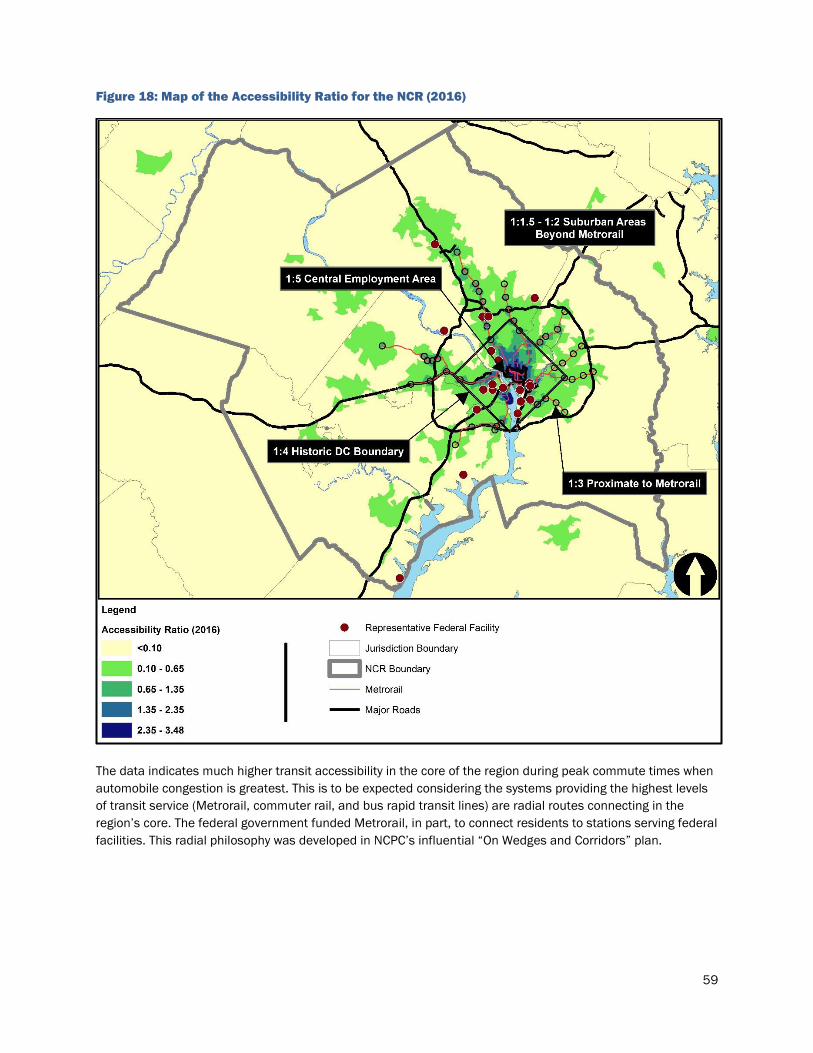
59
Figure 18: Map of the Accessibility Ratio for the NCR (2016)
The data indicates much higher transit accessibility in the core of the region during peak commute times when
automobile congestion is greatest. This is to be expected considering the systems providing the highest levels
of transit service (Metrorail, commuter rail, and bus rapid transit lines) are radial routes connecting in the
region’s core. The federal government funded Metrorail, in part, to connect residents to stations serving federal
facilities. This radial philosophy was developed in NCPC’s influential “On Wedges and Corridors” plan.

60
Comparing against only transit accessibility or automobile accessibility individually,
observed (current) parking ratios at the sampled federal facilities do not
demonstrate a strong relationship (22 percent and 2 percent respectively). However,
there is a much stronger relationship between observed (current) parking ratios and
the accessibility ratio (see Figure 19).
Figure 19: Observed (Current) Parking Ratio Compared to Accessibility Ratio
(Volpe Model)
The Volpe Model, which defines the relationship between two variables (observed parking ratio and 2016
accessibility ratio), shows an R-squared value of 0.70. R-squared is a statistical measure that describes how
closely a data set follows a model, fit, or trend line. If all data fall directly on the fitted model, R-squared is
equal to 1.0; deviations of data away from the fit decrease the R-squared. The Volpe Model uses a linear
NSF Naval Observatory
Fort Belvoir
FDA White Oak
Marine Corps Base Quantico
National Institute of Standards and Technology
NSF Carderock
Joint Base Anacostia-Bolling
NSF Arlington
Naval Research Laboratory
Mark Center
DHS Nebraska Avenue Complex
National Foreign Affairs Training Center
National Institutes of Health
Joint Base Myer-Henderson Hall
The Pentagon
Fort McNair
NSA Bethesda
Washington Navy Yard
St. Elizabeths Hospital
Marine Barracks Washington DC
y = 1.2488x + 1.3813R² = 0.7047
0
0.5
1
1.5
2
2.5
3
3.5
4
4.5
0.0 0.5 1.0 1.5 2.0 2.5
Observed(Current)Parking
Ratio
Accessibility Ratio (Transit v. Auto) [2016]
Federal Facility Linear (Federal Facility)
Facility parking ratios exhibit
a strong relationship with the
accessibility ratio.
More Auto
Accessible
More Transit
Accessible

61
regression and the resulting R-squared indicates a relatively high degree (70 percent) of correlation between
parking provision and regional accessibility.
The analysis indicates that facilities are systematically not meeting NCPC’s Comprehensive Plan ratio policies.
In many cases, facilities also fall short of policies where the Commission agreed to modify parking ratios (see
Figure 17). Indeed, the regression indicates that the accessibility ratio is a much better predictor of parking at
federal facilities than NCPC’s policies.
Although most of the study locations fall near the line of best fit, the model shows two “outlier” facilities—the
Naval Observatory and Naval Support Activity (NSA) Bethesda. The Naval Observatory is an outlier with its high
parking supply compared to its modeled accessibility level. The Naval Observatory serves as the official
residence of the Vice President of the United States and has a significant Secret Service presence. NCPC staff
note that parking policies are driven by overriding national security concerns. Conversely, the NSA Bethesda is
an outlier with its limited parking compared to its accessibility level.88 The Volpe Center noted that while NSA
Bethesda is proximate to a Metrorail transit station, the facility is bounded by an Interstate and has fewer bus
connections than other similarly situated facilities. This results in a lowered accessibility ratio while, due to the
adjacent Metrorail station, parking can be effectively restricted to achieve a high parking ratio. If the model
does not consider these two facilities, the model is able to predict 92 percent of the data variation: which, from
a modeling standpoint, is very strong.
Predicting Future Parking Ratios Based on Changes in Accessibility
As described above, the MWCOG model incorporates projected land use and planned transportation
improvements for 2030 (see Figure 12). Based on associated changes in the accessibility ratio, the Volpe
Center inferred potential improvements in parking ratios where transit accessibility increased relative to
automobile accessibility.
Projected land use changes include significant household growth in all NCR
jurisdictions, particularly along major transportation corridors. Transportation
improvements include major transit investments like Silver Line Metrorail
extension and the Purple Line light rail connecting inner Maryland suburbs
between Bethesda and New Carrollton. Significant roadway capacity
investments include new and expanded roads and planned HOT/HOV lanes in
Maryland and Virginia. These changes are expected to change accessibility
across the region (see Figure 20).
Household growth and
transportation investments will
increase transit accessibility,
particularly in the region’s core
and along existing and planned
transit lines.
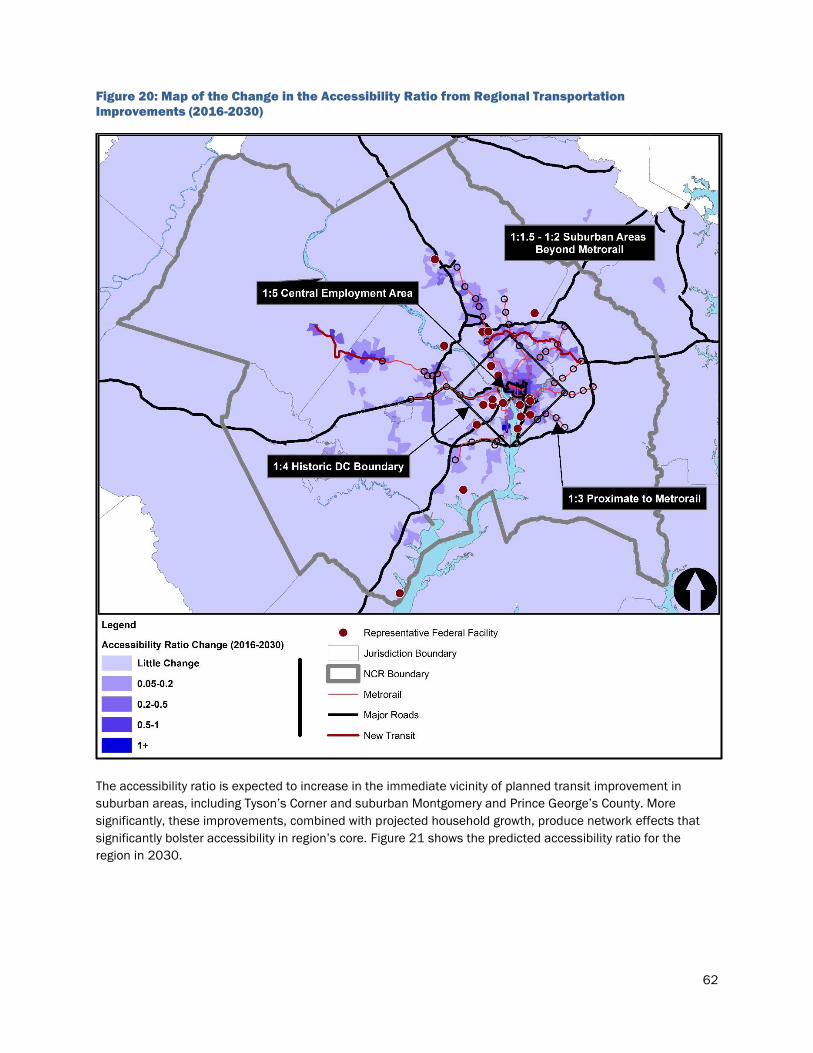
62
Figure 20: Map of the Change in the Accessibility Ratio from Regional Transportation
Improvements (2016-2030)
The accessibility ratio is expected to increase in the immediate vicinity of planned transit improvement in
suburban areas, including Tyson’s Corner and suburban Montgomery and Prince George’s County. More
significantly, these improvements, combined with projected household growth, produce network effects that
significantly bolster accessibility in region’s core. Figure 21 shows the predicted accessibility ratio for the
region in 2030.

63
Figure 21: Map of the Accessibility Ratio for the NCR (2030)
Based on this analysis, the Volpe Center predicted 2030 parking ratios for the sampled federal facilities.
Figure 22 shows these estimates, sorted according to the projected change in parking ratio (ordered left to
right from least to greatest change).

64
Figure 22: Observed (2016) and Predicted (2030) Parking Ratios for Select Federal Facilities Using
the Volpe Model
According to these estimates, projected changes in land use and planned transportation improvements have
varied implications for the sampled facilities:
Facilities in the region’s core: Facilities that show accessibility improvement in 2030 are centrally
located. The three facilities that show the greatest increases (Fort McNair, Washington Navy Yard, and
Marine Corps Barracks Washington) are near Downtown Washington and have direct access to the
central portions of the Metrorail system. Parking at these facilities could decrease between
approximately 15 percent and 20 percent. While the actual parking supply may be relatively static at
these facilities over the next several years, the analysis indicates that they could realistically achieve
more aggressive parking ratios with existing TDM techniques.
Facilities benefiting from suburban transit improvements: Suburban transit investments benefit
adjacent federal facilities, but to a lesser extent than facilities in the core. Six facilities fall in this
category, including the National Institutes of Health, the Mark Center, St. Elizabeths Hospital, the
Department of Homeland Security Nebraska Avenue Complex, the Naval Observatory, and the
National Institute of Science and Technology. Parking at these facilities could decrease between
approximately four percent and five percent using existing TDM techniques.
Other facilities: Many of the facilities show predicted (future) parking ratios for 2030 that are very
close to their current value. For these locations, the transportation system is not changing significantly
– transit and roadway improvements are minimal or roughly balanced out, leading to no shift in the
0
1
2
3
4
5
6
ParkingRatio
Predicted (Future) Parking Ratio Observed (Current) Parking Ratio
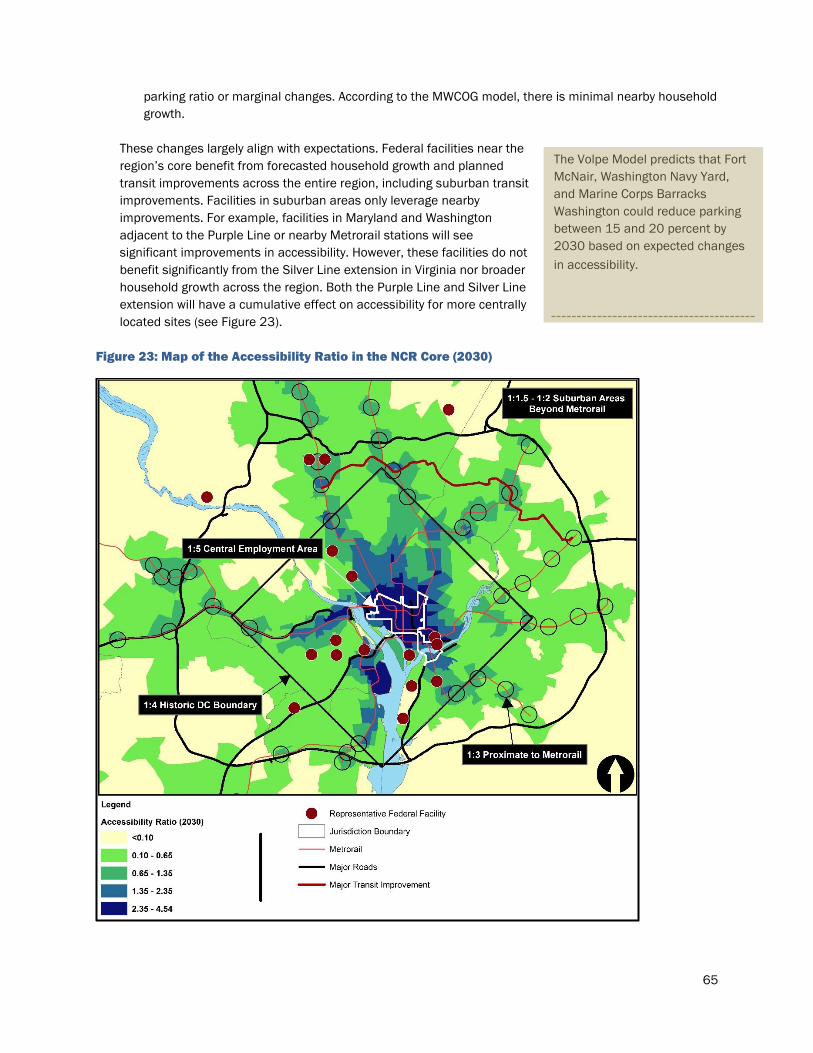
65
parking ratio or marginal changes. According to the MWCOG model, there is minimal nearby household
growth.
These changes largely align with expectations. Federal facilities near the
region’s core benefit from forecasted household growth and planned
transit improvements across the entire region, including suburban transit
improvements. Facilities in suburban areas only leverage nearby
improvements. For example, facilities in Maryland and Washington
adjacent to the Purple Line or nearby Metrorail stations will see
significant improvements in accessibility. However, these facilities do not
benefit significantly from the Silver Line extension in Virginia nor broader
household growth across the region. Both the Purple Line and Silver Line
extension will have a cumulative effect on accessibility for more centrally
located sites (see Figure 23).
Figure 23: Map of the Accessibility Ratio in the NCR Core (2030)
The Volpe Model predicts that Fort
McNair, Washington Navy Yard,
and Marine Corps Barracks
Washington could reduce parking
between 15 and 20 percent by
2030 based on expected changes
in accessibility.

66
Examination of Accessibility Across the Metrorail System
Metrorail is a key component of regional accessibility. Making direct connections
between federal campuses and the Metrorail system, as with the employee shuttles
described in the next section, strongly influences the transportation decisions.
Figure 24 shows the accessibility ratio at each Metrorail station (averaged using a
2,000 foot catchment) along each line peaks in the downtown core near Metro
Center and Gallery Place/Chinatown. A secondary peak on the Blue/Yellow Lines
indicates the secondary hub around Crystal City and Ronald Reagan Washington
National Airport (the two spikes are in different places on the figure because the
number of stops along each route varies, but the peaks refer to the same location).
Figure 24: Accessibility Ratios Across the Metrorail System (2016)
Figure 24 indicates that the Metrorail stations fall into three general categories:
1. Core Stations – stations near Metro Center/Gallery Place, accessibility ratio at or near the regional
peak
2. Shoulder Stations – stations generally between the core and the edge of historic DC, with strong
accessibility to transit but not as high a ratio as the core
3. Edge/End-of-Line Stations – stations generally outside historic DC with low accessibility ratios
(generally under one, indicating that vehicle accessibility is stronger).
These groups become important, and display different characteristics, when examining the impact of potential
employee shuttle services in the following section.
0
0.5
1
1.5
2
2.5
3
3.5
4
Near Edge ofHistoric DC
MetroCenter/Gallery
Place
Near Edge ofHistoric DC
Acc
essi
bili
ty R
atio
Stations along each Metrorail line - NOT to scale.
Blue Green Orange Red Silver Yellow
Edge/End-ofLine
Shoulder Core Shoulder Edge/End-ofLine
The accessibility
ratio peaks in the
downtown core, in
Crystal City, and at
the Ronald Reagan
Washington
National Airport.

67
Adjusting the Model for Employee Shuttles
Many of the facilities in this study offer some form of external shuttle service. However, a closer examination of
these services reveal that many have limited commuting value (do not provide access to Metrorail stations,
have limited frequency, and low capacity) based on current (2016) regional conditions (land use patterns,
demographic characteristics, and existing transportation network) and service constraints (i.e., existing user
limitations/prohibitions). Table 4 describes each service in more detail.
Table 4: Description of Shuttle Services by Facility
No. Facility Name
Commute-
Oriented
Shuttle
Description of Service from TMP
1 Fort Belvoir No External shuttles were discontinued for commuting use
2
FDA White Oak Yes*
Shuttles were operating at the time of the TMP, but
plans were being pursued to replace shuttle service
with expanded public transit which, if implemented,
would be captured in the MWCOG 2016 model
3 Marine Corps Base
Quantico No
No shuttle services
4 Naval Support Facility
Carderock No
Limited or no shuttles provided for commuting access
5 Mark Center No
Shuttle services being planned for commuting but not
in operation at the time of TMP
6 National Institute of
Standards and Technology Yes
Shuttles on 30-minute headway to Shady Grove station
7 National Institutes of
Health No
Internal circulators and some external connections,
but NIH is already on a Metrorail station limiting the
need for shuttles to the rail network
8 Naval Support Activity
Bethesda No
Shuttles mainly for on-campus circulation; NSA
Bethesda already on Metrorail
9 United States Naval
Observatory No
No shuttle services
10 Joint Base Anacostia-
Bolling Yes*
Shuttle only operated at one hour headway, providing
insufficient service to improve transit accessibility
11 Naval Support Facility
Arlington No
No shuttle services
12
St. Elizabeths Hospital Yes
Shuttle services planned in the TMP; parking ratio of
1.75 estimated based on current operations with
shuttles running
13 Naval Research Laboratory No No shuttle services
14 DHS Nebraska Avenue
Complex Yes
10-15 minute headway shuttle to the Red Line
Metrorail
15 National Foreign Affairs
Training Center Yes*
Shuttles do connect to Metrorail, but have limited on
board capacity and long headways
16 Joint Base Myer-
Henderson Hall Yes*
Shuttle to the Pentagon station in operation, but
headways may be too long; additional service on the
north side of the facility may be useful
17 The Pentagon No
Shuttles connecting DOD facilities; Pentagon already
on Metrorail
18 Fort McNair No No shuttle services
19 Marine Barracks
Washington DC No
No shuttles provided for commuting access
20 Washington Navy Yard No No shuttles provided for commuting access
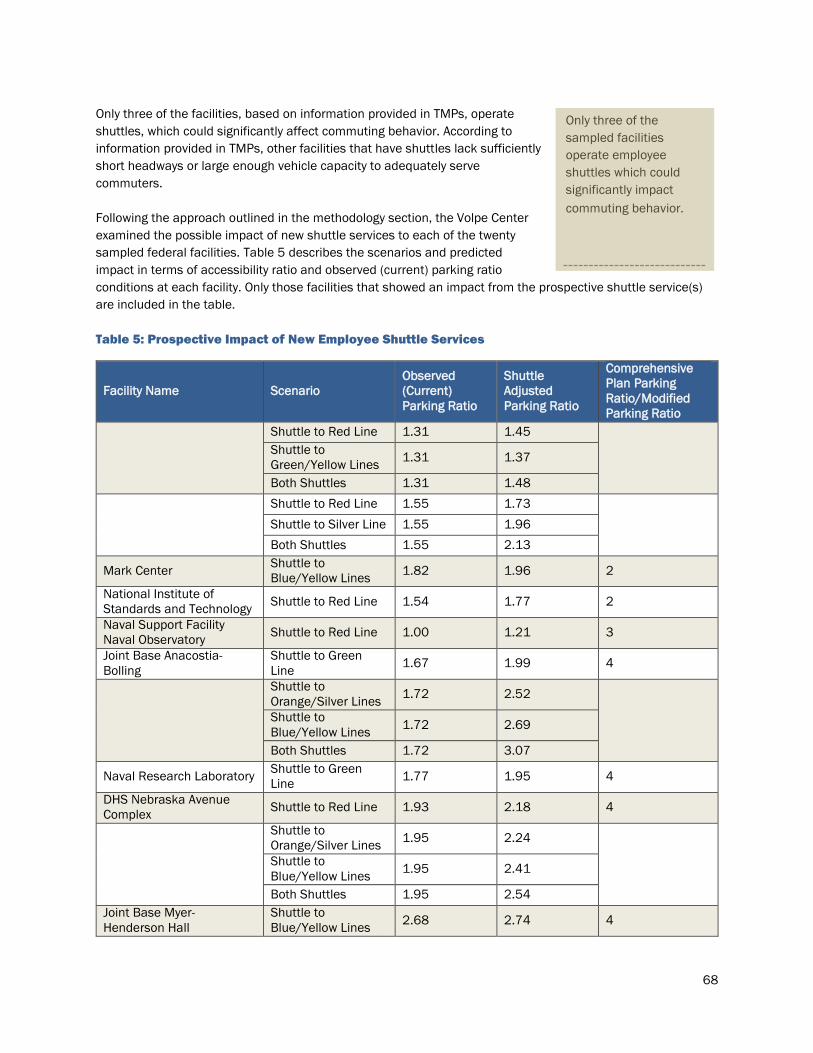
68
Only three of the facilities, based on information provided in TMPs, operate
shuttles, which could significantly affect commuting behavior. According to
information provided in TMPs, other facilities that have shuttles lack sufficiently
short headways or large enough vehicle capacity to adequately serve
commuters.
Following the approach outlined in the methodology section, the Volpe Center
examined the possible impact of new shuttle services to each of the twenty
sampled federal facilities. Table 5 describes the scenarios and predicted
impact in terms of accessibility ratio and observed (current) parking ratio
conditions at each facility. Only those facilities that showed an impact from the prospective shuttle service(s)
are included in the table.
Table 5: Prospective Impact of New Employee Shuttle Services
Facility Name Scenario
Observed
(Current)
Parking Ratio
Shuttle
Adjusted
Parking Ratio
Comprehensive
Plan Parking
Ratio/Modified
Parking Ratio
Shuttle to Red Line 1.31 1.45
Shuttle to
Green/Yellow Lines 1.31 1.37
Both Shuttles 1.31 1.48
Shuttle to Red Line 1.55 1.73
Shuttle to Silver Line 1.55 1.96
Both Shuttles 1.55 2.13
Mark Center Shuttle to
Blue/Yellow Lines 1.82 1.96 2
National Institute of
Standards and Technology Shuttle to Red Line 1.54 1.77 2
Naval Support Facility
Naval Observatory Shuttle to Red Line 1.00 1.21 3
Joint Base Anacostia-
Bolling
Shuttle to Green
Line 1.67 1.99 4
Shuttle to
Orange/Silver Lines 1.72 2.52
Shuttle to
Blue/Yellow Lines 1.72 2.69
Both Shuttles 1.72 3.07
Naval Research Laboratory Shuttle to Green
Line 1.77 1.95 4
DHS Nebraska Avenue
Complex Shuttle to Red Line 1.93 2.18 4
Shuttle to
Orange/Silver Lines 1.95 2.24
Shuttle to
Blue/Yellow Lines 1.95 2.41
Both Shuttles 1.95 2.54
Joint Base Myer-
Henderson Hall
Shuttle to
Blue/Yellow Lines 2.68 2.74 4
Only three of the
sampled facilities
operate employee
shuttles which could
significantly impact
commuting behavior.

69
Roughly, half of the sampled facilities show improved accessibility from a prospective shuttle service to a
nearby Metrorail station. In the cases that showed no improvement, either existing public transit services were
already sufficient within the MWCOG model to accommodate transit commuters, or the distances from
Metrorail are such that a shuttle commute is not viable. For example, there is limited benefit from connecting
an edge/end-of-line station to a federal facility if the distances greater than five to seven miles.
The highest performing facility in this analysis was NSF Carderock. A
prospective employee shuttle connecting the facility to both the Red and
Silver Lines would increase the number of households accessible by transit
by more than 30 times. Public bus service to Carderock is extremely limited,
so connecting to local Metrorail transit hubs opened large areas to potential
transit use. Other facilities which showed notable improvements from a
prospective shuttle include Joint Base Anacostia-Bolling (more than 5 times
as many transit-accessible households), the Food and Drug Administration
(FDA) White Oak campus (a factor of 4.2 with two shuttle options), and Naval
Support Facility (NSF) Arlington (nearly a 4-times improvement with both
shuttle options explored).
By using the Volpe Model, these impacts to accessibility conditions were translated into an impact on parking
ratios (for the 2016 conditions). In the case of NSF Carderock, implementing these shuttle options is predicted
to help the facility achieve much of the gap between observed (current) parking ratio and the NCPC
Comprehensive Plan parking ratio policies. Similarly, NSF Arlington and FDA White Oak could achieve their
NCPC Comprehensive Plan parking ratio policies with employee shuttle services.
Returning to the groups of stations identified in the previous section (core stations, shoulder stations, and
edge/end-of-line stations), federal facilities located near, but not adjacent to, shoulder stations benefit the
most from shuttles. These facilities are located in relatively transit-poor areas, but near Metrorail stations with
a high accessibility ratio. Facilities near core stations are already in high accessibility-ratio areas and therefore
do not significantly benefit from additional connections to the Metrorail. Facilities near the edges of the
Metrorail, including end-of-line stations, may see some incremental benefit from a shuttle connection, but the
potential benefit is small because these Metrorail stations are relatively inaccessible.
This analysis used the 2016 MWCOG model, but improvements to the transit network through 2030 or beyond
would tend to push the shoulder of the Metrorail network further and widen the core of the region. Additional
transit lines, such as the Purple Line, could open additional areas to shuttle operations by providing greater
access to the mid-point of Metrorail lines connected to the core.
Developing New Parking Policies using the Accessibility Analysis
As shown in previous sections of this chapter, the major issue with NCPC’s Comprehensive Plan parking ratio
policies is that the 1:4 Historic DC Boundary Zone does not account for wide-ranging built environments and
accessibility conditions of the area. Previous master plan reviews resulted in the Commission approving
modified parking ratios at seven of the 20 sampled facilities. As such, Volpe believes that there is an
opportunity to adjust the parking ratio zones to better reflect existing and future projected regional accessibility
conditions.
Using the projected 2030 accessibility ratio from the MWCOG model, the project team applied the Volpe Model
to develop a map that visualizes predicted parking ratios. These predicted (future) parking ratios were rounded
up to an ‘even’ value of 1.5, 2, 3, 4, or 5 to represent a realistic target value for each zone. The Volpe Center
Three facilities could institute
an employee shuttle to
nearby Metrorail stations
that would significantly
impact commuting behavior,
including NSF Carderock,
FDA White Oak, and NSF
Arlington.

70
developed a map with these parking ratio prospective target values to compare with existing NCPC’s parking
ratio zones (see Figure 25).
Figure 25: Map of Predicted (Future) Parking Ratios (2030)
The accessibility mapping and predicted (future) parking ratios suggest that NCPC could add significant nuance
to its parking policy zones to reflect accessibility across the region. Ideally, zones should include homogeneous
regions. Areas with similar predicted parking ratios can be expected to behave similarly and thus achieve
similar parking ratios.
The TAZs which were modeled as 1:5 generally represent the core, but exceed the boundaries of the Central
Employment Area (CEA) to encompass most of the L’Enfant City. A significant area north of the CEA, and along
the two Metrorail corridors to the south and west are also at, near, or significantly above 1:5 and could logically

71
be grouped with the core of DC. Zones with a predicted (future) parking ratio of 1:4 do not represent a cohesive
single area. Instead, these TAZs are spread along Metrorail rail lines radiating out from the L’Enfant City but
within the historic DC boundary. For the remainder of the historic DC boundary, and areas near suburban
Metrorail stations, TAZs are predominantly in the 1:3 category. Some of these areas are in the 1:2 zone but
near to the shoulder of Metrorail lines, which could potentially benefit from shuttle services to improve transit
access. The remainder of the suburban area is predominantly within the 1:1.5 zone, with certain corridors
maintaining a 1:2 predicted (future) parking ratio.
Reviewing the location of the federal facilities that were used for this analysis, a possible revised NCPC parking
ratio policy could have four revised zones:
1:5+ – Regional Core: The L’Enfant City.
1:4 – Transit-Rich Corridors: Highly Metro-accessible portions of the Historic DC Boundary.
1:3 – Transit Accessible: The remainder of the Historic DC Boundary Zone and suburban locations
within 2,000 feet of a Metrorail station.
1:1.5 - 1:2 – Suburban Areas Beyond Metrorail: All other locations in the region, including areas
served by HOT/HOV lanes or high-frequency commuter rail.
These revised zones translate the predicted accessibility of each part of the region into easily described
geographies. The Volpe Center recommends NCPC continue to use stable geographies like Census-designated
places and the transportation network to set policy zones. This proposed approach is depicted in Figure 26.
Figure 26: Proposed NCPC Parking Policy Map

72
This policy map results in more realistically achievable parking ratio policies for the sampled federal facilities.
Figure 27 compares the observed (current) parking ratios at each facility to predicted (future) parking ratios
(based on anticipated accessibility changes in the region) and proposed new policies.
Figure 27: Observed (2016) and Predicted (2030) Parking Ratios Compared to Proposed Parking
Ratio Policies
The proposed policy map would keep NCPC’s Comprehensive Plan parking ratio policies aspirational, while
making them more realistically achievable than current policy. Table 6 compares existing and proposed
parking ratio policies to observed (current) and predicted (future) parking ratios at each sampled facility.
0
1
2
3
4
5
6
ParkingRatio
Predicted (Future) Parking Ratio
Observed (Current) Parking Ratio
Proposed Revised Comprehensive Plan Parking Ratio

73
Table 6: Existing Versus Proposed Policy Zones at Sampled Facilities
No. Facility Name
Observed
(Current)
Parking
Ratio
(2016)
Comprehensive
Plan Parking
Ratio*
Predicted
(Future)
Parking
Ratio
(2030)
Proposed
Revised
Comprehensive
Plan Parking
Ratio
1 Fort Belvoir 1.22 1.5 - 2 (2) 1.24 No Change
2 Food and Drug Administration (FDA)
White Oak 1.31 1.5 - 2 (1.5) 1.31 No Change
3 Marine Corps Base Quantico 1.36 1.5 - 2 (2) 1.36 No Change
4 Naval Support Facility Carderock 1.55 1.5 - 2 (2) 1.55 No Change
5 Mark Center 1.82 1.5 - 2 (2) 1.98 No Change
6 National Institute of Standards and
Technology 1.54 1.5 - 2 (2) 1.60 No Change
7 National Institutes of Health 2.15 3 2.32 No Change
8 Naval Support Activity Bethesda 3.32 3 3.39 No Change
9 Naval Support Facility Naval
Observatory 1 4 (3) 1.02 3
10 Joint Base Anacostia-Bolling 1.67 4 1.68 3
11 Naval Support Facility Arlington 1.72 4 (3) 1.76 3
12 St. Elizabeths Hospital 1.75 4 1.95 3
13 Naval Research Laboratory 1.77 4 1.79 3
14 Department of Homeland Security
(DHS) Nebraska Avenue Complex 1.93 4 2.01 3
15 National Foreign Affairs Training
Center 1.95 4 1.94 3
16 Joint Base Myer-Henderson Hall 2.68 4 2.76 No Change
17 The Pentagon 2.71 4 2.77 No Change
18 Fort McNair 2.77 4 3.42 5
19 Marine Barracks Washington DC 4.27 4 5.12 5
20 Washington Navy Yard 3.77 5 (4.5-5) 4.59 5
* - For facilities with modified parking ratios or in the 1.5-2 zone, the approved ratio is included in
parenthesis.
Facilities currently in the 1:4 Historic DC boundary Zone are separated into two groups. The first group includes
facilities that lack transit accessibility despite their location in the Historic DC Boundary. These facilities are
moved to the lower 1:3 goal, which is more realistically achievable. The second group includes facilities nearer
to the core or the two strong transit corridors to the south and east of the Capitol, which are moved into an
expanded 1:5 zone.

74
Modeling Analysis Findings
This modeling analysis highlights the following key themes that may inform future revisions to NCPC’s parking
policies and processes:
NCPC can utilize accessibility metrics to evaluate its parking policies against current and future conditions.
These estimates can inform updates to NCPC’s parking policies.
Accessibility metrics help policymakers determine how convenient particular locations are via different modes
of transportation. In lieu of more site-specific demand estimates, NCPC can utilize regionally-specific
accessibility metrics to determine transit access for federal facilities. Using outputs from MWCOG’s Regional
Transportation Demand Model, the Volpe Center evaluated NCPC’s Comprehensive Plan parking ratios policies
against existing and projected accessibility in the region. By breaking data down to the TAZ level, federal
facilities can be isolated and their connections to the transit and roadway networks examined. The MWCOG
model also produces these data in an easy-to-use format that can be manipulated for analysis. This analysis
will help NCPC understand the feasibility of transit access to federal facilities in the region, estimate the impact
of its parking policies, and adjust them for different parts of the region for the year 2030.
NCPC can refine its parking policies using data to more closely reflect regional transportation accessibility. In
particular, the Historic DC Boundary Zone does not accommodate the wide range of accessibility levels across
this geography.
The geographic implementation of NCPC’s Comprehensive Plan parking ratio policies is designed to reflect
regional accessibility. Transit accessibility is highly dependent upon distance to the Metrorail and other major
transit lines and hubs. NCPC can use these metrics to update its parking policies to more closely reflect the
complexity of transit access in the region, both now and in the future. Even with employee shuttles connecting
to Metrorail, some locations, which are geographically close to Downtown Washington, are difficult to access by
transit. These facilities have notably lower accessibility ratios. In several cases, these facilities are falling
significantly short of NCPC Comprehensive Plan parking ratio policies.
A consistent relationship between transit and automobile accessibility and observed (current) parking ratios
can be used to predict future parking ratios and future conditions
The ratio of transit accessibility to auto accessibility is a strong predictor of facility parking ratio. As noted in the
methodology, the Volpe Model using the 20 case study facilities produced an R-squared value of 0.70, which is
reasonably strong. When excluding certain unusual facilities, this value rises above 0.92 indicating a very
strong correlation. Whether the ‘outlier’ facilities are included or not, the linear regression between
accessibility ratio and parking ratio is stable, further suggesting that the relationship is meaningful.
With a linear relationship between accessibility data and parking ratio defined, NCPC can predict the impact of
regional accessibility changes. Transit and roadway improvements in the 2030 MWCOG model are based on
projects laid out in the CLRP. NCPC should adjust NCPC Comprehensive Plan parking ratio policies to account
for transportation system improvements.
Employee Shuttles to Metrorail can provide a significant accessibility boost for some federal facilities,
particularly those that are near shoulder Metrorail stations.
The Volpe Center’s preliminary analysis based on outputs from the MWCOG model show that federal facilities
located near, but not adjacent to, Metrorail stations benefit the most from shuttles. This is particularly true for
facilities located near shoulder stations between the core of the Metrorail system (Metro Center and Gallery

75
Place) and the terminus of each Metrorail line. For example, NSF Carderock, NSF Arlington, Joint Base
Anacostia-Bolling, and the FDA White Oak campus could benefit significantly from employee shuttles that
connect to nearby Metrorail stations. Facilities located near core stations are already in highly accessible areas
and therefore do not significantly benefit from additional connections to the Metrorail. Facilities near the edges
of the Metrorail system, including end-of-line stations, may see some incremental benefit from a shuttle
connection, but the potential benefit is small because these Metrorail stations are relatively inaccessible. This
analysis is based on the current transit network. Future improvements to the transit network would tend to
improve the effectiveness of employee shuttles. NCPC and these facilities would need to conduct a more
robust site-level analysis to predict the long-term impact of prospective shuttle services. Shuttle routes and
schedules can be programmed into the MWCOG model to directly estimate accessibility changes. NCPC can
use the Volpe Model to predict associated reductions in parking.
76
Appendix A: NCPC Master Plan Review Process
Summary
NCPC’s Comprehensive Plan sets broad policies. During the master plan review process, the Commission,
using staff recommendations, establishes the approved parking ratio. Typically, legacy federal campuses do
not meet the comp plan parking ratio, but through the review process and preparation of the TMP, the campus
commits to a higher parking ratio policy than is currently provided, and often a longer-term ratio closer to the
policy goal. While no formal criteria are used, the Commission considers various factors in setting these
approved ratios. Over time, facilities generally improve their observed parking ratio, and this is reinforced by
the continuing review of the master plan.
Overview
A master plan is a comprehensive development proposal for federal installations or campuses on which more
than one building, structure, or activity is located or is proposed to be located. Master plans consider mission
needs and anticipate new or changing activities, workforce and visitor projections, and facility conditions,
typically over a 20 year planning horizon. They consider complex planning issues related to accommodating
future changes in urban design, perimeter security, landscape, visual and cultural resources, stormwater
management, flood protection, transportation, and sustainability. NCPC, the sponsoring agency, and local
planning departments use master plans to understand future building and site development projects and
potential impacts on and off-site.
Review Authority
40 U.S.C. (a)-(b)(1), the National Capital Planning Act referred to as the Planning Act, requires that each federal
and District of Columbia agency consult with the National Capital Planning Commission “in preparation of plans
and programs in successive stages, which would affect the Comprehensive Plan for the National Capital.” A
master plan is a preliminary planning tool for the Commission to view development of an installation as a sum
of its parts rather than just individual pieces. This comprehensive view provides a context for individual
development projects; examines the relationship of an installation’s entire development program in
accordance with the planning principles and policies of the Comprehensive Plan; and allows an assessment of
cumulative, external impacts of the installation within the general vicinity of the installation.
NEPA and Section 106
NCPC’s authority for the review of master plans—both in Washington, DC and in the region—is advisory.
Therefore, NCPC does not have a National Environmental Policy Act (NEPA) or Section 106 of the National
Historic Preservation Act responsibility for master plan submissions. However, NCPC strongly encourages
applicant agencies to perform NEPA and Section 106 analyses for the following reasons:
Several of NCPC’s requirements for a master plan submission include analyses typically performed
during the NEPA and Section 106 processes (such as viewshed and transportation studies).
The applicant agency is likely to have its own NEPA and Section 106 responsibilities for the master plan.
If this is the case, the applicant should not submit for final review until it has met its NEPA and Section
106 responsibilities. This prevents the applicant from having to come to the Commission if the NEPA or
Section 106 outcomes alter the project.
NCPC has approval authority (and NEPA and Section 106 responsibilities) for individual projects within
Washington, DC. If the applicant conducts NEPA and Section 106 analyses on a master plan for land
within Washington, they will not need to perform individual NEPA analyses on projects that are

77
implemented within five years of the final master plan approval by the Commission unless a significant
change is proposed.
Typically, master plans are analyzed through an Environmental Impact Statement (EIS) study. However, if the
submitting agency determines that an EIS is not required, then an Environmental Assessment (EA) study may
be undertaken instead. The decision regarding whether to perform an EIS or EA is based on a number of site-
related factors including site size (both area and population), geographic location, planned future
development, visibility, and environmental conditions at the site. The applicant agency’s environmental review
process should be discussed early with NCPC staff to ensure a mutual understanding of the applicant’s
environmental policies and procedures.
Master plans are typically divided into short-term (approximately five years) and long-term (20 plus years)
components with more probable funded projects contained within the short-term component and more
aspirational, unfunded projects in the long-term component. NCPC recommends that the NEPA document
detail the master plan’s short-term component to help plan for potential impacts and necessary mitigation
within the framework of the longer-range development. Final master plan submissions should also provide
guidance for future project compliance with historic preservation requirements by identifying federal/state
preservation guidelines, historic resources (e.g. buildings, landscapes, objects, districts, etc.), standard
operating procedures, and campus/installation-wide preservation strategies.
Typical Process
Master plans should be regularly updated and reviewed89 by the Commission before an agency designs and
funds future development. A master plan should be a “living” document that helps guide a federal
campus/installation’s transition from its current condition into the future. It should address how the proposed
plan will serve the agency’s mission, meet local and federal planning goals, address changes in number of
employees, and protect the natural and built environment.
Applicants should use the following guidance to ensure that a final master plan was developed in a
collaborative, effective manner with federal and local stakeholders. Unlike the submission guideline process
for individual projects, there are typically only two stages for the review of master plans. These include Draft
Review and Final Review. In rare cases, staff may request a Concept Review in addition to Preliminary and
Final when a master plan is unusually complex or controversial.
There is also some flexibility with regard to submission requirements for master plans. NCPC’s executive
director may extend, modify, or waive a requirement pertaining to the scope and content of a master plan on
sites when certain requirements cannot be met because of the unique characteristics or quality of the affected
federal property. In this circumstance, the executive director shall provide notice to potentially affected public
agencies and, if appropriate, provide opportunity for consultation.
There are two stages of review, as described below. In advance of formal submissions, there are typically
several consultation meetings or discussions with NCPC staff. These typically focus on the purpose of the
master plan or update, the NCPC review process, important issues or interests to be addressed, the NEPA and
Section 106 process, and the referral process, if necessary. The level of agency interaction with NCPC staff can
vary between master plans.
Draft Review
Draft Review offers the Commission the opportunity to critique and evaluate the plan in detail. The
Commission will provide comments and recommendations on the draft that are intended to help guide
the applicant agency in the development of the final plan. The applicant should develop general

78
massing for future buildings and a general landscape plan from the “preferred” alternative in the
National Environmental Policy Act analysis to allow meaningful Commission comment. The submission
should highlight how future development will attain federal and local goals, objectives, and policies,
with metrics/performance measures, if possible.
Final Review
The purpose of Final Review is for NCPC to review any changes based on previous Commission
comments and any developments since the Draft Review. Following the Commission’s final review, the
master plan will be used as a planning tool as part of NCPC’s review process for future projects.
Typically, the Final Master Plan will include proposed building sites and development envelopes, along
with design standards/policies, which will ensure that future development is coordinated in its design.
Referrals
NCPC refers all master plans to affected local planning agencies and regional and state clearinghouses for an
intergovernmental review. This process typically requires 90 days. If an affected stakeholder identifies an issue
of concern, NCPC staff will engage all parties, including the applicant, to resolve the issue.
Master Plan Updates
Agencies are required to review master plans at least every five years to ensure they accurately reflect
anticipated changes to the campus/installation. Applicant agencies should advise the Commission of the
results of such reviews, and provide the Commission a proposed schedule to update a master plan if the
applicant has determined an update is necessary.
Up-to-date master plans that have fully completed NCPC’s review process provide several benefits to
applicants:
Serve as a valuable planning tool for applicants, NCPC, and state and local jurisdictions.
Allow applicant agencies to forego the 60-day referral process to state and local agencies for individual
projects prior to NCPC’s regular 35-day review period.
Result in favorable assessments of projects in NCPC’s Federal Capital Improvement Program, which is
used by the Office of Management and Budget to prepare the President's annual budget.
Reduce the amount of information needed to review specific projects since the more contextual
information is already included in the up-to-date master plan for the federal property.
The process outlined above may also apply to master plan modifications; however, a modification may only
require an abbreviated process compared to a complete update of the master plan, depending on the nature
of the change, scale, and its anticipated environmental impacts.

79
Appendix B: NCPC’s Transportation Management
Plan Standards
What is Required of the Federal Agency?
Federal agencies are encouraged to use existing roles and responsibilities to help influence employee and
visitor travel behavior. The National Capital Planning Commission requires Transportation Management Plans
(TMP) submissions with all Master Plan updates and for all projects that will increase employment by 100 or
more workers. Agencies are encouraged to do the following:
Meet at an early date with NCPC staff about applicable NCPC policies and guidelines at a consultation
meeting during a project’s early planning phase. Master Plans and projects, along with their
associated TMP’s, will likely require multiple consultations due to their comprehensive scale and
relative complexity. Applicable NCPC policies and guidelines are available at NCPC’s website, both on
the Submission Guidelines page and in the Comprehensive Plan’s Transportation Element. Early
consultation with NCPC is mandated by NCPC’ Section 5(a) of the National Capital Planning Act, which
requires federal agencies to “advise and consult with NCPC in the preparation of agency plans prior to
preparation of construction plans.”
Consult with local jurisdiction planning and transportation officials, either separately or jointly with
NCPC staff, to identify current plans and programs, congestion mitigation/travel management
techniques, and requisite TMP-related implementation commitments. The Comprehensive Plan
encourages federal agencies to coordinate projects, Master Plans, and TMPs with local jurisdictions in
its Federal Workplace Element through the following policy.
Prepare a TMP for all Master Plan updates and relatively large projects, as previously noted. The TMP
should be fully integrated with Master Plans for campuses and installations and subsequent projects,
directly influencing land use patterns, project orientation, and provision of on-site amenities (e.g. bike
racks). If a federal agency—typically the General Services Administration (GSA)—is serving as an agent
on behalf of another federal applicant by managing project planning and/or construction, the agent
should manage the TMP preparation.
Submit the TMP as part of the required Master Plan update or project submission for NCPC review and
potential referral to appropriate local, regional and state agencies. The applicant should be prepared
to consider all comments made by the Commission and local/state agencies as part of the region’s
federal planning process, and to incorporate new strategies and programs as funding availability,
federal requirements, and off-site infrastructure permits. The mandatory federal referral process is
described in more detail in NCPC’s submission guidelines, under Master Plans
What are Necessary Commitments?
The federal agencies’ necessary commitments to TMP implementation (referred to above in section 2.1 A 2)
may include some or all of the following:
Develop a written policy statement that demonstrates the federal agency’s commitment to reducing
Single Occupant Vehicle (SOV) travel and to show consistency between the TMP and agency mission.
Provide substantive decision-making authority and strong support to the Employee Transportation
Coordinator (ETC) from agency management. Authority can be influenced by agency size, mission,
management support, and organizational structure.
Allocate adequate funding to enable the ETC to conduct regular employee commuter surveys; hold
informational meetings/fairs for employees; design and distribute marketing materials; coordinate
programs with other nearby federal campus installations, and actively participate in local, regional and
national continuing education and training efforts to foster professional development in

80
Transportation Demand Management (TDM) efforts. These activities are only some of a successful
ETC’s duties, which are described in detail in Section B.
Adopt policies that:
o Encourage employees and visitors to use alternatives to driving alone when traveling between
home and the work-site, and on work-related business during the day.
o Encourage and participate in joint public-private initiatives for managing traffic concerns, such
as Transportation Management Associations (TMAs), business improvement districts, and
regional or local trip reduction programs.
o Allow greater flexibility in using agency funding to permit investment in infrastructure,
facilities, and services related to non-SOV travel that offers the most cost-effective solutions.
An example of this would be the reinvestment of parking revenues into traffic mitigation
projects and programs.
o Explore incentives for cost-effective use of the agency’s transportation assets, such as
parking pricing differentials for carpools and vanpools.
o Encourage effective management and use of transportation assets by requiring the
evaluation of alternative options and management techniques that enhance performance and
capacity of parking and impacted roadways. A usable and effective TMP will enable a federal
agency to fully implement this policy.
81
Appendix C: Historic Context of NCPC’s Parking
Policies
Development of Parking Policies and Ratios
Since the automobile emerged as a popular mode of transportation, NCPC has participated and sponsored a
variety of transportation surveys, proceedings, and reports focusing on the range of issues, from aesthetics to
transportation management plans. A review of the comprehensive plans and parking studies illustrates the
iterative development of NCPC parking policies.
Emergence of Parking in Project Submissions
Between 1920 and 1930, automobile registrations in Washington, DC quadrupled. Meetings of NCPC’s
predecessor, the National Capital Park and Planning Commission (NCPPC), dealt directly with street widenings,
new road-planning proposals, bridge construction, parking arrangements, and more fundamentally, with
regulatory and zoning changes.90 Regulations were needed to provide direct accommodation—in the form of
parking—and to recognize the pervasive shifts in population location and density that were primarily motivated
by adjustments to the automobile.
The McMillan Plan91
NCPPC weighed heavily into automobile parking in the 1920s when implementing the McMillan Plan. Because
the 1901 McMillan Plan predated the automotive age, it didn’t include provisions to accommodate cars.
As plans were being drawn up to implement the plan, forecasts projected a need for 7,415 parking spaces.
Speaking for the U.S. Commission of Fine Arts, Charles Moore in an annual report termed the parking situation
a “nuisance that could well nigh destroy the beauty of the National Capital”. As one solution, NCPPC suggested
that the north-south thoroughfares pass under the Mall, that a streetcar line form a loop within the Federal
Triangle, and that the Federal Triangle be “self-contained to parking.” 92
A proposal commissioned by the Board of Architectural Consultants suggested that provisions be allowed in
spaces under the Ellipse (the park area located between the White House and the Washington Monument),
under the Federal Triangle, under the Mall, and in two spaces north of Pennsylvania Avenue. John Russell Pope
objected to the suggestion that 1,300 spaces be designed under a large plaza. NCPPC Chairman Frederic
Delano Roosevelt suggested that a parking lot, enclosed by an eight-foot wall and planted with shrubbery and
trees, be allowed at the base of the Washington Monument.
In the last analysis, parking was incorporated into the Federal Triangle building scheme only on a highly
restricted basis (as in the Federal Trade Commission’s Apex Building basement). Ultimately, it was assumed
that 65 percent of the nearly thirty thousand employees then to be located in Federal Triangle would use mass
transportation or walk to work. Contributing factors for the limited underground parking were the additional
costs and the fear of dangerous ramps and underground driving. Solutions were severely limited by poor soil
and drainage conditions in the area.
1940s Congressional Declaration Regarding Parking and NCPPC Review
By the 1940s, the issue of automobile congestion in the central area of DC had become acute. Congress
passed the District of Columbia Motor Vehicle Parking Facility Act of 1942, declaring:
“…that the parking of motor vehicles on the highways of the District has contributed to this congestion to such
an extent as to interfere seriously with the primary use of such highways for the movement of traffic ; that
such parking prevents the free circulation of traffic in, through, and from said District impedes rapid and
effective fighting of fires and the disposition of police forces in the District, threatens irreparable loss in
valuations of property in the District, which can no longer be readily reached by vehicular traffic, and

82
endangers the health, safety, and welfare of the general public; that this parking nuisance can be reduced by
providing sufficient offstreet parking facilities conveniently located in the several residential, commercial,
industrial, and governmental areas of the District ; that adequate off-street parking facilities have not been
provided by private enterprise ; that it may be necessary to supplement private parking spaces by off-street
parking facilities provided by public undertaking; and that the enactment of this Act, as well as the use of land
for the purposes set forth in this Act, is hereby declared to be a public necessity…”
Congress’ legislation authorized the body governing the District to ensure that adequate parking provisions are
provided – subject to NCPC review:
The Commissioners [of the District of Columbia]…are authorized to exercise all powers necessary and
convenient to carry out the purposes of this Act, the said purposes being hereby declared to be the acquisition,
creation, and operation, in any manner hereinafter provided, under public regulation, of public off-street
parking facilities in the District as a necessary incident to insuring in the public interest the free circulation of
traffic in and through said District…Before acquiring any area for parking facilities the Commissioners shall
request the National Capital Park and Planning Commission for its recommendations and it shall be the duty
of said Commission to report thereon within thirty days of such request.93
Comprehensive Plan, 1950
NCPC’s first Comprehensive Plan advanced three general transportation strategies:
Cut down on the amount of travel needed by getting home and work closer.
Make public transportation so quick and convenient that…fewer will drive.
Create a system of collector and distributor roads…that will redistribute traffic through the region and
diminish the volume demand within the Central Area.
With respect to parking, the plan found a deficit of 9,400 spaces in DC’s Central Area and outlined several
types of transit- and pedestrian-accessible places for spaces.
1955-1956 Report on Federal Employee Parking ratios94
The first comprehensive survey of federal parking ratios was conducted when an overhaul of DC’s zoning code
was being studied in the 1950s. It reported that of Federal buildings under GSA control with more than 1,000
employees had the following parking ratios:95
4.0 per cent have a parking ratio of 1:3 or better
32.4 per cent have a parking ratio of 1:4 or better
44.1 per cent have a parking ratio of 1:8 or better
62.3 per cent have a parking ratio of 1:10 or better
The report documented parking ratios for specific civilian facilities were as follows:
Pentagon: 3.42
Suitland (Federal Office Building #3, #4): 3.9
Navy Annex (Federal Office Building #2): 7.9
Identified parking ratios at installations under military or comparable control were as follows:
Naval Ordinance Laboratory: 1.67
National Institute of Health: 1.75
Army Map Service (now the Corp of Engineers' Dalecarlia Reservoir site): 1.93
National Naval Medical Center (Walter Reed National Military Medical Center site): 2.096
Bolling Air Force Base (Joint Base Anacostia-Bolling): 2.197
Nebraska Avenue site: 3.0
Arlington Hall (now George P. Shultz National Foreign Affairs Training Center site): 3.5
Naval Gun Factory (Washington Navy Yard): 7.0.
The Smithsonian reported it had a 3.1 ratio for its five buildings on the Mall.
83
Fringe Parking National Capital Region, 1965
To help alleviate parking demand in congested areas, reduce traffic congestion, and induce users to take
transit rather than drive, NCPC developed Fringe Parking National Capital Region. This 1965 study
recommended developing commuter parking lots in fringe (suburban) locations.
Comprehensive Plan, 1969
NCPC’s second comprehensive plan conveyed that “T[t]he Commission has clear and unmistakable planning
responsibilities, both to ensure the efficiency and to preserve the amenities of the Nation’s Capital…The
automobile, for all its immense contributions to the good life, must be carefully controlled…Too many
automobiles overtaking the capacity of central streets can choke the economic heart of the city…can cause
severe problems of health…can blight and even destroy neighborhoods.” 98
As a solution, the Commission’s 1969 comprehensive plan advanced “a comprehensive mass transit program
(Metrorail) and a major freeway expansion program…This, coupled with improvements in arterial streets for the
increased flow of local traffic and improvements in the network of both express and local buses, form an
integrated circulation network.”
The Plan established Basic Plan Policies For The Components Of The Parking System
Central Area Parking
1. Parking space in the Central Employment Area should be provided in structures located close
to freeways and arterial streets.
2. The total central area parking system should be managed to encourage equilibrium of
parking space, congestion-free highways, and highly utilized transit.
3. Central Employment Area parking should be managed to insure reasonable availability of
parking space to serve non-work as well as work trips.
4. The central area parking system should include parking in high-density residential areas.
Fringe and Uptown Center Parking
1. Fringe parking for bus riders should be expanded, some at sites of rail transit stations.
2. Parking space should be provided in structures in uptown centers and local business
districts.
In addition to the Basic Plan Policies, the Plan also identified Specific Proposals for Components of the Parking
System by Stages for each of the area types. Stage 1 corresponded with 1970-1975 and Stage 2 with 1976-
1985 period as the transit system (Metrorail/Metrobus) expanded.99
Comprehensive Planning, 1980s
In the processes of preparing a new comprehensive plan, NCPC published a planning report in 1982. It
determined:
Parking policies and parking standards for federal facilities should be included that encourage use of public
transit and all forms of ride sharing. The parking standards should reflect performance that can be achieved
through application of policies for provision and operation of transportation services. Thus, parking ratios
should take into account the effects of available transit service and usage of programs of car and van pooling
while, at the same time, protecting adjacent neighborhoods from spillover of Federal employee parking. Since
much of the regional transportation system is operated by state and local governments or other authorities,
recommendations pertaining to the Federal interest in the facilities serving federal should be included.100
Factoring the prevailing traffic congestion and environmental pollution with inauguration of full service on the
basic Metrorail system, NCPC concluded that federal parking policies “should encourage maximum use of
transit and all forms of ride sharing.” In addition to several related policies101, the resultant 1983
Comprehensive Plan established the following geographic policies:
84
In the Central Employment Area, parking ratios should not exceed one space for five employees
(1:5).102
At outlying federal facilities, parking for federal employee parking should not exceed the following
ratios.103
o In the District of Columbia, Arlington County, the City of Alexandria, and the Silver Spring area of
Montgomery County between the Prince George's County Line and 16th Street Extended, south of
the Capital Beltway, one space for three employees (1:3).
o In Montgomery County south of Routes 28, 124, 115 and 1 in Prince George's County inside the
Capital Beltway and west Route 4 and north of Route 223, and Fairfax County and the City of
Alexandria inside the Capital Beltway, one space t0 two employees (1:2).
o In the remainder of the region, not to exceed one to one-and-one half (1:1.5).
Study of Visitor Circulation, Parking and Access in the Monumental Core, 1985
In anticipation of what would become Extending the Legacy: Planning America's Capital for the 21st Century,
NCPC studied visitor circulation, parking and access in the monumental core. This study reviewed both existing
and future parking demand as well as previous and ongoing efforts to increase parking supply.
The study found that while the prevailing parking shortage may result in higher visitor parking prices, it hasn’t
significantly impacted visitation. Instead of increasing parking supply, the study recommended allowing the
parking scarcity to induce more Metrorail trips. At the same time, the study recognized that many visitors
wouldn’t ride Metro under prevailing conditions, so NCPC proposed a transit service circulating through the
area (an idea which resulted in the DC Circulator).
Comprehensive Plan, 2004
NCPC’s 2004 Comprehensive Plan found that since the 1989 version, the number of congested lane-miles in
the region doubled, the region exceeded federally-mandated air quality levels, and the originally-planned 103-
station Metrorail system was complete. The 2004 plan also recognized improvements in the overall quality of
available transit services; distribution of commercial parking facilities, walking distances and conditions; and
new guidelines established by local zoning ordinances.
Due to these factors, NCPC established a general policy to “provide parking only for those federal employees
who are unable to use other travel modes.”104 The 1989 parking ratios were adjusted to reflect the location of
federal workplaces relative to the Metrorail system as follows.
Within the Central Employment Area, the parking ratio should not exceed one space for every five
employees. Outside of the Central Employment Area, but within the Historic District of Columbia
boundaries, the parking ratio should not exceed one space for every four employees.
For suburban federal facilities within 2,000 feet of a Metrorail station, the parking ratio should not
exceed one space for every three employees.
For suburban federal facilities beyond 2,000 feet of a Metrorail station, the parking ratio will reflect a
phased approach linked to planned improvements over time (one parking space to 1.5-1:2
employees).
85
Appendix D: Federal Employee Commuting Policies
Federal Agency Obligations to Provide Parking Spaces for Employee Commuting
Following determinations clarifying that commuting costs are the responsibility of the employee,105 the
Government Accountability Office has long maintained that parking incident to ordinary commuting is also a
personal expense.106 Otherwise payment for parking and other commuting costs would constitute an increase
in the employee’s regular salary.107 Therefore, the government may not be required to provide parking facilities
for its employees.108
A government employee does not have a right to a parking space, with or without charge, and an agency is
under no obligation to furnish one.109 However an agency may provide employee parking facilities if it
determines that the lack of parking facilities will significantly impair the agency’s operating efficiency and will
be detrimental to the hiring and retention of personnel.110 From the availability of appropriations perspective, it
makes no difference whether the employees work in government-owned space or in leased space.111
Agencies are directed to assign spaces in the following order of priority: 1. Official needs, 2. Handicapped, 3.
Executive personnel and persons who work unusual hours, 4. Vanpools and carpools, 5. Persons who use their
private vehicle regularly for government business, and 6.Other employees. In major metropolitan areas, federal
agencies alternatively may determine that allocations by zone would make parking more efficient or more
equitably available.
Agencies must generally obtain parking accommodations through the General Services Administration under
the Federal Property and Administrative Services Act of 1949, as amended (ch. 288, 63 Stat. 377 (June 30,
1949)), unless they have independent statutory authority or a delegation from GSA.112 When GSA is leasing
office space pursuant to its statutory authority in 40 U.S.C. § 585, it may include parking facilities, and the
tenant agency’s appropriations are available to reimburse GSA for the parking space to the same extent as for
the office space itself.113
Federal Agency Authorities to Charge and Collect Revenue for Parking Facilities
The government has the discretionary authority under the Federal Property and Administrative Services Act to
charge employees for parking space furnished for their use.114 However if an agency lacks authority to retain
parking fees, this may serve as a disincentive to increase existing parking.
As a general proposition, an agency may not augment its appropriations from outside sources without specific
statutory authority. When Congress makes an appropriation, it is establishing an authorized program level, and
it is telling the agency that it cannot operate beyond the level. To permit an agency to operate beyond this level
with funds derived from some other source without specific congressional authorization amounts to a
usurpation of the congressional prerogative or the so called “power of the purse”.115 If an agency derives funds
from an outside source without express statutory authority to do so, it must treat the funds as “miscellaneous
receipts” and deposit the funds in the General Fund of the U. S. Treasury.116
Applying the prohibition against augmentation to parking, an agency may not charge employees for parking
and retain the money unless it has express statutory authority to do so. If it has such authority, the ability to
charge for parking may serve as a disincentive for a federal agency to reduce parking. It may also encourage
investment of money in the provision of additional parking if easily accessible parking facilitates an agency’s
mission by enhancing employees’ accessibility to work. To the contrary, it may also serve as an incentive to
reduce parking to render land occupied by parking facilities available for other mission needs.
86
Development of Federal Government Policies Encouraging Non-SOV Commuting
The following timeline of policies demonstrates the federal government’s progression of programs and
incentives toward non-SOV commuting.
1980 – Executive Order 12191, Federal Facility Ridesharing Program (3 CFR, 1980 Comp., p. 138) specified
that executive agencies must actively promote the use of ridesharing (carpools, vanpools, privately leased
buses, public transportation, and other multi-occupancy modes of travel) by personnel working at federal
facilities to conserve energy, reduce congestion, improve air quality, and provide an economical way for federal
employees to commute to work.
1991 – The 1991 Treasury, Postal Service, and General Government Appropriation Act (P. L. 101-509)
authorizes federal agencies to participate in state or local government programs designed to encourage
employees to use public transportation. Thus, an agency could use its general operating appropriations to
subsidize the use of discounted transit passes by its employees. The “subsidy” is not additional pay for
purposes of the prohibition in 5 U.S.C. § 5536. Id. See also B-243677, B-243674, May 13, 1991. The
legislation had a sunset date of December 31, 1993.
1992 – The Energy Policy Act of 1992 (P. L. 102-486) contained provisions which affect the tax treatment of
transportation benefits provided by an employer. The measures are intended to encourage use of public
transportation, reduce highway congestion, and improve air quality. One of these provisions affects employer-
provided parking subsidies. Starting January 1, 1993, the value of parking provided by an employer to an
employee may be excluded from taxation up to $155 per month. Any amount over this allowable exclusion is a
taxable benefit. The exclusion will be indexed for inflation in later years.
1992 – Treatment of Employer Provided Transportation Benefits (P. L. 102-486) expanded the term qualified
transportation fringe to include transit passes and transportation in commuter highway vehicles (e.g. vanpools)
in addition to qualified parking.
1993 – The Federal Employees Clean Air Incentives Act (P. L. 103-172) authorized the head of each agency to
establish a program to encourage employees of such agency to use means other than single-occupancy motor
vehicles to commute to or from work.
1993 - Programs to encourage commuting by means other than single-occupancy motor vehicles (P. L. 102–
486) authorized each agency head to establish a program to encourage employees to use means other than
single occupancy motor vehicles to commute to and from work. The purposes of this authority are to improve
air quality and reduce traffic congestion. 5 U.S.C. § 7905 note. Programs established under section 7905 may
include such options as transit passes or cash reimbursements for transit passes; furnishing space, facilities,
or services to bicyclists; and nonmonetary incentives. 5 U.S.C. § 7905(b)(2).
1997 – Taxpayer Relief Act (P. L. 105-34) allowed parking benefits to be taken in lieu of salary. With this
authorization agencies could offer their employees the option of accepting taxable cash income in lieu of a
parking space at work, while maintaining the tax-free status of the parking benefit. The employer would only
have to pay taxes on the cash payment, not the parking benefit.
1998 – The Transportation Equity Act for the 21st Century (P. L. 105-178) required employers, including the
federal government, to offer employees transportation fringe benefits.

87
Transit and vanpool benefits may be offered in lieu of compensation payable to an employee for
taxable years beginning after December 31, 1997. This gives transit and vanpool benefits the same
tax treatment that parking benefits receive under the Taxpayer Relief Act of 1997.
The limit on nontaxable transit and vanpool benefits is increased from $65 to $100 per month for
taxable years beginning after December 31, 2001.
All benefits are indexed for inflation; however, the indexing mechanism is suspended during the
taxable year beginning after December 31, 1998. Therefore, the maximum transit/vanpool benefits
will remain at $65 per month and parking will remain at $175 per month for calendar year 1999. The
indexing mechanism will resume for the taxable year beginning after December 31, 1999.
Employers (for taxable years beginning after December 31, 1997) will be able to offer employees
several options for qualified transportation fringe benefits. These benefits are not, however, permitted
to be part of "cafeteria" plans or flexible spending accounts.
Employers can offer any combination of these benefits (up to the specified limits), either in addition to
present compensation or in lieu of compensation, tax-free.
Employers can also offer a parking cash out program whereby employees may choose to cash out the
value of employer-provided parking, forego parking, and receive the taxable cash value of the parking,
or receive a tax-free transit or vanpool benefit of up to $65 per month.
2000 – Executive Order 13150, Federal Workforce Transportation requires federal agencies located in
Washington, DC to implement a transit subsidy fringe benefit pursuant to 5 U.S.C. § 7905 to further the public
policy of discouraging commuting by single-occupancy vehicle in order to improve air quality and reduce traffic
congestion.117
2007 – The Energy Independence and Security Act (42 U.S.C. § 17094) places legal requirements on new
agency construction projects (i.e., development and redevelopment projects involving a Federal facility with a
footprint that exceeds 5,000 square feet) to manage stormwater and preserve and/or restore natural site
hydrology. This guidance encourages minimizing parking as part of future building projects, as well as gradually
removing existing parking by using previously-developed sites for future projects.
2008 – The Bicycle Commuter Act added bicycle commuting to the list of transportation modes eligible for
transportation fringe benefits under the US Tax Code. Under this act, bicycle commuters are eligible for a $20
per month pre-tax benefit for costs incurred by bicycle commuting.
2015 – Executive Order (EO) 13693, Planning for Federal Sustainability in the Next Decade expands upon
requirements established by the 2007 energy act by among other things directing federal agencies to install
appropriate green infrastructure features on federally owned property to help with stormwater and wastewater
management.
88
Appendix E: Transportation Demand Management
Strategies
There are myriad techniques used to manage parking demand. While the number of tools far exceeds those
explored here, the strategies below may be particularly relevant to NCPC and its federal partner agencies.
Policies and Programs
5.1.1.3 Parking Maximums and Minimums
Citing an increase in development costs, among other consequences, some transportation professionals argue
that minimum parking requirements are misguided.118 Many jurisdictions around the country have replaced
minimum parking requirements with maximum parking requirements.119,120 Others implemented parking
maximums in addition to parking minimums, a practice particularly popular in the Northwest over the past two
decades.121,122 When both minimums and maximums are used, it creates a range of acceptable parking
supply, while providing room for flexibility. If the developer would like to build outside of that range, they may
be required to provide a transportation impact assessment to justify the variance from code.
There are three primary ways to establish a parking maximum:
Regulate based on the square-footage of the building the parking serves.
Set the maximum on a percentage of the minimum.
Establish caps on the total maximum number of parking spaces in a particular geographic area.
Even more flexibility can be built in to exempt certain sites from a parking maximum if the development meets
specific criteria, for example, including a parking lot with pervious pavement.123
Municipalities employ parking maximums for a variety of reasons. In Portland, Oregon, the standard began with
the Department of Environmental Quality.124 Portland implemented a maximum on parking to reduce vehicle
trips and therefore limit emissions with the intent to meet air quality standards. Suburban Beaverton, Oregon
wanted to increase development density and limit sprawl; they did so by limiting the amount of land area
developers were allowed to allocate to parking. Eugene, Oregon implemented parking maximums to reduce
impermeable surfaces, reduce storm water runoff, and improve water quality. Seattle introduced maximum
parking regulations to incentivize transit-oriented development.
5.1.1.4 Commute Trip Reduction Programs
Commute Trip Reduction (CTR) programs incentivize commuters to reduce Single Occupancy Vehicle (SOV)
trips through various incentive programs, such as financial incentives and teleworking policies. State or local
governments either encourage or require businesses to participate in these programs, which are generally run
by a local government or a geographically based non-profit. In implementing a CTR program, employers
establish goals to reduce the number of SOV trips and program evaluation procedures, such as travel surveys,
to monitor progress. Some governments implement CTR programs to encourage their own employees to
reduce their dependence on SOV.125
The State of Washington has one of the longest-running Commute Trip Reduction programs. Established in
1991, businesses located in counties with a population over 150,000 and with 100 or more full-time
employees are subject to the law. To date, there are more than 1,000 work sites participating in Washington’s
CTR program and over 530,000 individual commuters.126

89
Incentives and Disincentives to Change Transportation Choices
5.1.1.5 Encourage Active Commuting
Employees arriving to work by bicycle or walking reduce the demand for parking. Employer, local government,
and advocacy groups encourage non-motorized commute modes through both the provision of infrastructure
by local and supportive programming. For example, non-profit organizations dedicated to active transportation
advocacy organize incentive programs for employers to encourage their employees to take active
transportation. Active Commute Week Challenge is one example in Grand Rapids, Michigan where employers
can pay to register themselves as participants. Employees who use non-automobile modes of transit are
rewarded with daily prizes.127 The League of American Bicyclists provides technical assistance to employers on
how to become more bicycle friendly through their Bicycle Friendly Businesses program.128
5.1.1.6 Transit/Parking Allowances
The current transit and parking benefit for federal employees is capped at $255 a month Consolidated
Appropriations Act (H.R. 2029) was signed into law on December 18, 2015, which permanently establishes
parity between parking benefit and transit/vanpool benefits.
Previously, transit and commuter highway vehicles were limited to $130 per month. With this law, the
exclusion amount for 2016, parking, transit and commuter highway vehicles are $255 per month. Commuters
can receive both the transit and parking benefits (i.e., up to $510 per month).
The Sustainable DC Omnibus Amendment Act of 2014 includes the DC Commuter Benefits Law, which
provides tax incentives for non-federal employees who take public transportation, vanpool, or bike to work. This
law requires non-federal employers to offer one or more of the following benefits to employees:129
Pre-tax Benefit – This benefit allows employees to allocate up to $255 per month on a pre-tax basis to
cover costs associated with commuting by public transportation and vanpools.
Direct Benefit – This benefit is a tax-free employer subsidy of up to $255 per month for employees to
cover the cost of public transportation or up to $20 per month to cover the costs associated with
bicycling.
Provided Transportation – Employers must provide a shuttle service free to employees.
5.1.1.7 Parking Cash out/Unbundling
Employer-subsidized parking increases the number of commuters in SOV. However, employer-sponsored
incentives for other modes of transportation can reduce this.130 For example, parking cash-out incentives allow
drivers to receive cash in lieu of free parking. Seattle Children’s Hospital employees this policy. Seattle
Children’s Hospital values each day an employee does not commute by car at $4, allowing employees to earn
over $1,000 in additional income in the course of a year by relinquishing their parking space.131 Transit
benefits, such as those offered to federal employees, which provide a fully or partially subsidized public
transportation pass, can help reduce the amount of parking supply necessary.132
“Unbundling” parking is when the cost of leasing a property does not include the cost of leasing the associated
parking facilities. By allowing occupants to pay for parking separately (or allow them to opt not to pay for and
not use the parking), occupants will only use and pay for the parking that they need. This reduces overall
parking demand and distributes the parking supply more equitably.133 This technique is often used in
residential developments through rental agreements or condominium associations, although it can also be
used in commercial and office development.134

90
Improved Transportation Options
5.1.1.8 Bicycle Parking and Other Provisions
Providing indoor, long-term bicycle parking is a good way to incentivize bicycle use and reduce the need for car
parking. Less than one percent of all trips in the United States are made by bicycle and 48 percent of these
trips are shorter than three miles.135 Thus, there is a large potential for a dramatic mode shift. Some cities
such as New York, Minneapolis, and San Francisco require bicycle parking for residential and commercial
buildings.136 Minneapolis, for example, requires bicycle parking for all residential and non-residential uses in
every part of the city. The only exceptions are residential uses of four units or fewer and non-residential uses
less than 1,000 square feet. Schools are required to provide three spaces of bicycle parking per classroom,
and offices are required to provide three spaces or one space per 15,000 square feet.137 Short of requiring
bicycle parking, regulators can incentivize developers to provide bicycle parking by reducing the minimum
required parking.138
5.1.1.9 Improve Walking Conditions
One way to reduce the need for a large parking supply in NCR facilities is to encourage those travelling to them
to want to get there by a mode other than an automobile. This can be achieved by making other modes more
attractive. One context in which there is regularly heavy congestion during a very narrow window of peak
volume is at schools during drop-off and pick-up times. One of the goals of the national Safe Routes to Schools
Program, established in 2005, is to reduce automobile congestion.139 One way that they achieve this goal is by
ameliorating the walking and biking conditions in the area around schools. These techniques are largely
transferrable and not restrictive to school zones. Rather, they can be used in any setting where walking trips
can directly replace automobile trips. Taking a bottom-up approach, the Safe Routes to School Guidebook
recommends holding meetings with local stakeholders, agreeing on problem areas and approaches to address
them. In addition to policy changes, the program encourages the improvement of sidewalks, painting
crosswalks, and improving bicycle infrastructure.140 Outside of the Safe Routes to School Program, few studies
have been done to empirically assess the impact of the encouragement of walking on levels of automobile
congestion. However, in a few, mostly international case studies, there has been some success in reducing
traffic congestion through pedestrian improvements.141
5.1.1.10 Telework/Alternative Working Arrangements
Employers can use teleworking arrangements to reduce the number of commute trips that an employee needs
to make by allowing the employee to work from home on a regular basis and forego a trip to the office.
Likewise, flexible scheduling allows the employees to shift their commute to non-peak hours, reducing traffic
congestion.142 Federal agencies can take advantage of the Telework Enhancement Act of 2010. This act
applies to all employees of executive agencies, and requires federal agencies to establish a telework program
for their employees.143 Employee participation in a telework agreement is voluntary which might make it
difficult to predict the number of employees who will not need to commute on any given day. However, the
number of employees taking advantage of a telework agreement will reduce the amount of parking supply
necessary.
5.1.1.11 Traffic Calming
Traffic calming is a technique by which the physical characteristics of a road segment are altered to improve
safety for pedestrians by encouraging more responsible driving as well as improving the flow of traffic. Studies
have shown that reducing the speed at which vehicles travel by introducing traffic calming measures have

91
reduced crashes, injuries, and fatalities.144 Using inexpensive design materials such as surface paint, traffic
bollards, and planters can keep the costs of redesigning a space low. There are many ways to redesign a road
segment to reduce the speed of traffic resulting in improved safety. Changing streets from two-way to one-way,
including diagonal parking spaces, widening sidewalks, and installing speed humps and other road treatments
are common ways to reduce the vehicle speeds.145
5.1.1.12 Transit Improvements
Improvements to a city’s public transportation system can be an effective way to reduce an individual’s
dependence on automobiles, and thus reduce parking demand. For example, the introduction of express
transit service in Kingston, Ontario resulted in a ridership increase among Queen’s University employees, a site
that the express service served.146 Conversely, the biggest indicator of who takes public transit is automobile
ownership. It has been shown that increasing the frequency and the area that a transit system covers
increases ridership in areas where there is latent demand. Specifically, Edmonton, Alberta found that the most
efficient way to boost bus ridership was to service neighborhoods with the lowest car ownership. 147 Another
effective way to increase the usage of public transportation infrastructure is to ameliorate the ingress and
egress areas of the stations themselves. San Francisco Metro Area’s Bay Area Rapid Transit system found that
by improving walking, biking, and even parking facilities in the areas immediately adjacent to public transit
stations resulted in an increase in system ridership.148, 149
Land Use Management
Land use management tools that contribute to a built environment less dependent on automobiles can reduce
parking demand. Many local jurisdictions are adopting tenets of return to the “traditional” development pattern
of walkable, connected and diverse cities. They seek to achieve these ends through emphasizing compact land
use development and a more traditional neighborhood structure.150
One way to mitigate the use of automobiles is at the neighborhood level. Street reclaiming is when a
neighborhood physically and psychologically reclaims the neighborhood at the local level to increase social,
cultural, and economic activities as well as change the way the public thinks about local streets. This can
happen through using the street for neighborhood events, or physically changing the streetscape by replacing
asphalt with brick and installing works of art.151 Changes in streetscapes can be paired with car-free planning,
which is when a particular area or areas are designed for minimal automobile use. These areas are generally in
more dense, urban areas and are designed such that automobiles are unnecessary and/or restricted.
Restrictions can be permanent or only on certain days or during events.
Some land use management tools that address parking supply more directly are shared parking and land
banking.
5.1.1.13 Shared Parking
When neighboring sites have different uses and different peak demand periods, shared parking can be a
useful strategy to employ. Shared parking refers to adjacent or neighboring sites using the same parking
spaces, but at different times of the day or week.152 Traditionally, shared parking is not allowed in most local
zoning codes. If two distinct uses are located within the same structure or on the same lot, the parking
requirements are cumulative.153 In many cases, such as an office building adjacent to a bar or restaurant
where the peak parking demand of each is not concurrent, a non-shared parking policy leads to oversupply.
Some municipalities allow approval by the organization that enforces zoning to implement shared parking. 154
For example, both San Diego and Seattle can approve shared parking if sites are located within 600 or 800
feet of each other respectively.155

92
5.1.1.14 Land Banking
There are formal land banking operations established in many cities across the country with a number of
different purposes and objectives.156 However, land banking as a practice can also be applied to parking. This
is an excellent example of a contingency-based planning technique. This technique reserves undeveloped or
lightly-developed space to be used for parking if such a need arises. Specifically, this technique can be used
during development for projects that are developed in stages. It can also be used in low- or medium-density
areas where development moves more slowly and undeveloped land can remain undeveloped for longer
periods of time.157
Palo Alto, California allows developers to take advantage of land banking, specifically to defer construction of
up to 50 percent of the required off-street parking spaces. The land area needed to provide the required
parking must be appropriately landscaped pursuant to zoning code and approved by Palo Alto’s Architectural
Review Board. After ten years, the land area set aside for additional parking may then be developed as an
alternate use as long as it does not generate more parking demand.158

93
Appendix F: Traffic Impact Assessments
Traffic Impact Assessments (TIAs) estimate the impact that new developments will have on the traffic
conditions in the adjacent area, and propose measures to mitigate those impacts if they are found to be
significant. For small developments that will generate few trips, a TIA may not be required. Many jurisdictions
have thresholds (trips per hour, etc.) that they use to determine when a development applicant must submit a
TIA. For many of the jurisdictions in the NCR, a TIA is required when a developer is proposing to build less
parking than the zoning requires. Through the TIA, the applicant must demonstrate that the demand for
parking can be met with a reduced supply.
TIAs generally consist of an analysis of the existing traffic conditions around a proposed development site. The
primary purpose is to forecast future traffic volumes and estimate impacts to the performance of nearby roads
and intersections. TIAs also include projected bicycle, pedestrian, and transit trips (if applicable), and any
Transportation Demand Management (TDM) strategies that will be used to mitigate future traffic impacts. TIAs
use Level of Service (LOS) measures for roadway segments and intersections to determine whether the traffic
from a new development is projected to change the LOS. LOS is measured on a scale of A to F: LOS A indicates
that traffic is free flowing, while an LOS F indicates that there is heavy, stop and go traffic that exceeds the
capacity of the roadway.159 When a TIA indicates that there is a change in LOS to the area surrounding the
proposed development, engineering mitigation measures such as widening the roadway, changing signal
timing or intersection configuration, or introducing a new traffic light, and/or TDM measures that focus on
shifting trips to non-SOV modes may be proposed.
While each jurisdiction’s requirements for TIAs vary, they are generally similar. As an example, VDOT’s
requirements for TIAs are outlined below:
Introduction and Executive Summary: This section includes a description of the site location and study
area, details of the proposed development, findings, conclusions, and recommendations.
Background Information: Includes a description of the on-site development, the current or proposed
zoning, the traffic study area’s geographic scope, information about nearby uses, maps of the existing
roadways, and information about any planned improvements to transportation facilities in the area.
Analysis of Existing Conditions: This section includes the current daily and peak hour traffic in the
area; current LOS and delay; and walking, biking, or transit trips if the new development would have
any significant potential for these modes.
Analysis of Future Conditions without Development: This section is an analysis of what the future
conditions at the site would be without the development, to serve as a baseline indicator for projecting
what the future conditions would be with the proposed development.
Trip Generation: This section includes the estimation of how many trips the proposed development
would generate based on rates from the ITE.
Site Traffic Distribution and Assignment: This section shows how the trips generated from the site
would be distributed and assigned to the road network throughout the appropriate time periods.
Analysis of Future Conditions with Development: This section is a forecast of the daily and peak-hour
traffic around the proposed development, with LOS analyses for the intersections and roadways in the
study area. Pedestrian, bicyclist, and transit trips are also included if relevant.
Recommended Improvements: This section includes any proposed roadway or intersection improvements
with cost estimates, and TDM measures if proposed. Also included are descriptions and diagrams of the
location, nature, and extent of the proposed improvements, with preliminary cost estimates.
Conclusions: Conclusions from the study presented in an easily understood manner.
The assumptions and methodologies used in a TIA must also be identified throughout the assessment.
Sources:

94
Prince William County’s Requirements for TIAs and TDM Plans in the Design and Construction Manual
http://www.pwcgov.org/government/dept/development/ld/Documents/13417.pdf
VODT Level of Service
http://www.virginiadot.org/projects/resources/LOS-defined.pdf
VDOT Traffic Impact Analysis Regulations
http://www.vdot.virginia.gov/info/traffic_impact_analysis_regulations.asp

95
Appendix G: Detailed Descriptions of Jurisdictional
Parking Regulations
District of Columbia
Population: 672,228 (2015 estimate)
Density: 11,000 people per sq. mi.
Area: 68 sq. mi.
Representative Federal Facilities: Joint Base Anacostia-Bolling;
Washington Navy Yard; St. Elizabeth’s, West Campus; Department of
Homeland Security, Nebraska Avenue Complex; Marine Corps Barracks,
Washington
Current Zoning Ordinance Adopted: 2016
Background
The District of Columbia (see Figure 28) adopted a new zoning code in
January 2016, after an update process that began in 2007. The zoning
update simplified parking requirements, basing them largely on use and proximity to transit, rather than a
combination of zone, use, and other characteristics. The zoning includes a chapter devoted to parking with a
minimum standards table that is applicable to the Residential, Residential Flat, Residential Apartment, Mixed
Use, Neighborhood Mixed Use, and Production, Distribution, and Repair zones.
The Downtown, Campus Plan Areas, and Special Purpose zones are not necessarily subject to the minimum
parking standards. In Downtown Zones, no parking is required (other than areas west of the centerline of 20th
Street, NW), while parking requirements for Campus Plan Areas and Special Purpose zones vary, with select
areas requiring no parking.
Zoning Districts
Parking standards are generally applied across the following zones:
Residential; Residential Flat; Residential Apartment; Mixed Use;
Neighborhood Mixed Use; and Production, Distribution, and Repair Zones.
Special parking standards apply to Downtown, Special Purpose Zones,
and Campus Plan Areas:
Downtown Zones: Vehicle parking spaces are not required in
Downtown Zones, other than areas west of the centerline of 20th
Street, NW (Downtown Zones are the areas in pink on Figure 29)
Special Purpose Zones and Campus Plan Areas: The purpose of
the Special Purpose Zones is to provide for single large sites that
require a cohesive, self-contained set of regulations to guide site
design, building height and bulk, land uses, or other aspects of
development. Some of these zones have no parking
requirements, while others are subject to the minimum
parking standards. Similarly to Special Purpose Zones, Figure 29: DC Zoning Map (DC Office
of Zoning)
Figure 28: Washington in the
Metro Region
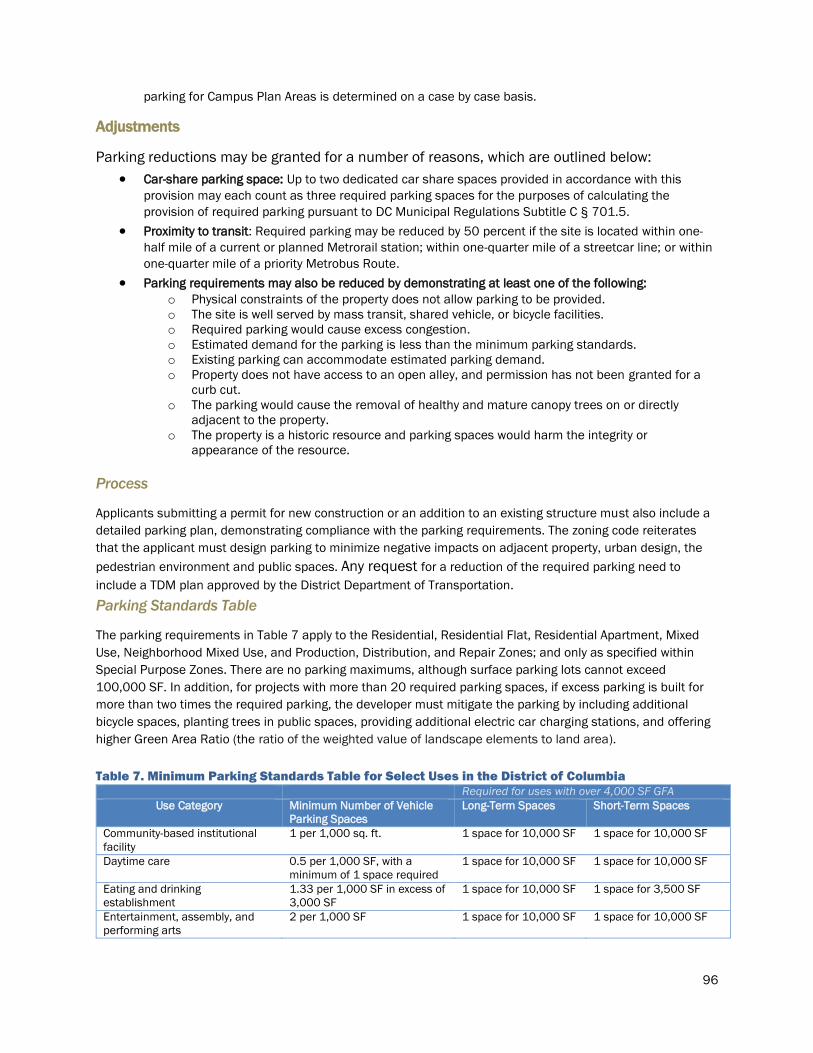
96
parking for Campus Plan Areas is determined on a case by case basis.
Adjustments
Parking reductions may be granted for a number of reasons, which are outlined below:
Car-share parking space: Up to two dedicated car share spaces provided in accordance with this
provision may each count as three required parking spaces for the purposes of calculating the
provision of required parking pursuant to DC Municipal Regulations Subtitle C § 701.5.
Proximity to transit: Required parking may be reduced by 50 percent if the site is located within one-
half mile of a current or planned Metrorail station; within one-quarter mile of a streetcar line; or within
one-quarter mile of a priority Metrobus Route.
Parking requirements may also be reduced by demonstrating at least one of the following: o Physical constraints of the property does not allow parking to be provided.
o The site is well served by mass transit, shared vehicle, or bicycle facilities.
o Required parking would cause excess congestion.
o Estimated demand for the parking is less than the minimum parking standards.
o Existing parking can accommodate estimated parking demand.
o Property does not have access to an open alley, and permission has not been granted for a
curb cut.
o The parking would cause the removal of healthy and mature canopy trees on or directly
adjacent to the property.
o The property is a historic resource and parking spaces would harm the integrity or
appearance of the resource.
Process
Applicants submitting a permit for new construction or an addition to an existing structure must also include a
detailed parking plan, demonstrating compliance with the parking requirements. The zoning code reiterates
that the applicant must design parking to minimize negative impacts on adjacent property, urban design, the
pedestrian environment and public spaces. Any request for a reduction of the required parking need to
include a TDM plan approved by the District Department of Transportation.
Parking Standards Table
The parking requirements in Table 7 apply to the Residential, Residential Flat, Residential Apartment, Mixed
Use, Neighborhood Mixed Use, and Production, Distribution, and Repair Zones; and only as specified within
Special Purpose Zones. There are no parking maximums, although surface parking lots cannot exceed
100,000 SF. In addition, for projects with more than 20 required parking spaces, if excess parking is built for
more than two times the required parking, the developer must mitigate the parking by including additional
bicycle spaces, planting trees in public spaces, providing additional electric car charging stations, and offering
higher Green Area Ratio (the ratio of the weighted value of landscape elements to land area).
Table 7. Minimum Parking Standards Table for Select Uses in the District of Columbia Required for uses with over 4,000 SF GFA
Use Category Minimum Number of Vehicle
Parking Spaces
Long-Term Spaces Short-Term Spaces
Community-based institutional
facility
1 per 1,000 sq. ft. 1 space for 10,000 SF 1 space for 10,000 SF
Daytime care 0.5 per 1,000 SF, with a
minimum of 1 space required
1 space for 10,000 SF 1 space for 10,000 SF
Eating and drinking
establishment
1.33 per 1,000 SF in excess of
3,000 SF
1 space for 10,000 SF 1 space for 3,500 SF
Entertainment, assembly, and
performing arts
2 per 1,000 SF 1 space for 10,000 SF 1 space for 10,000 SF

97
Government, large-scale None 1 space for 7,500 SF 1 space for 40,000 SF
but no less than 6
spaces
Government, local 0.5 space per 1,000 SF in
excess of 2,0000 SF with a
minimum of 1 space required,
except:
Public recreation and
community center: 0.25 space
per 1,000 SF in excess of
2,000 SF with a minimum of 1
space required
Kiosk public library – no
requirement
1 space for 7,500 SF 1 space for 40,000 SF
but no less than 6
spaces
Medical care 1 per 1,000 SF in excess of
3,000 SF with a minimum of 1
space required
1 space for 10,000 SF 1 space for 40,000 SF
Institutional, general 1.67 per 1,000 SF in excess of
5,000 SF
1 space for 7,500 SF 1 space for 2,500 SF but
no less than 8 spaces
Office 0.5 per 1,000 SF in excess of
3,000 SF, except a medical or
dental office, clinic, or
veterinary hospital: 1 per
1,0000 SF in excess of 3,000
SF
1 space for 2,500 SF 1 space for 40,000 SF
Parks and recreation 0.5 per 1,000 SF None 1 space for each 10,000
SF but no less than 6
spaces
Retail 1.33 per 1,000 SF in excess of
3,000 SF
1 for each 10,000 SF 1 space for each 3,500
SF
Service, general 1.33 per 1,000 SF in excess of
3,000 SF
1 for each 10,000 SF 1 space for each 3,500
SF
Service, financial 1.33 per 1,000 SF in excess of
3,000 SF
1 for each 10,000 SF 1 space for each 3,500
SF
Source:
DC Zoning Handbook
http://handbook.dcoz.dc.gov/
Montgomery County
Population: 1,040,116 (2015 estimate)
Density: 2,052 people per sq. mi.
Area: 507 sq. mi. – immediately north of Washington ~ 5-30 miles
from the city center (see Figure 30)
Representative Federal Facilities: National Institutes of Health, Main
Campus; Food and Drug Administration, White Oak; National
Institute of Standards and Technology
Current Zoning Adopted: 2014
Background
The Montgomery County Transportation (MCDOT) and the
Maryland-National Capital Park and Planning Commission (M-
NCPPC) undertook a parking study, completed in 2015, to revise
parking standards to better align with policies that promote travel by non-SOV modes.
Figure 30: Montgomery County in the
Metro Region

98
Study objectives:
o Update the county’s parking requirements for urban, mixed use districts to reduce current
requirements (if appropriate); promote shared parking; support local business; increase
flexibility of standards; make standards clear and predictable
o Update the county’s Parking Lot District (PLD) program to assess performance and identify
opportunities for improvement. PLDs are located in Bethesda, Montgomery Hills, Silver Spring,
and Wheaton. These districts provide public parking spaces, and are funded by the public
parking revenue collected in each PLD.
Study Scope:
o Examined the parking requirements, reviewed leading and emerging approaches to parking
requirement reformation, identified goals and objectives, gathered stakeholder input,
identified approach options, and assessed approach options.
o Once a framework was selected, the approach was applied in three steps: identify land uses,
set baseline standards, and weigh the mode share goal impact.
Findings and Recommendations – Parking Standards
o Minimum parking standards resulted in an oversupply of parking.
o Create market incentives to generate efficient, flexible, shared parking supplies within Parking
Lot Districts.
o Increase role of private developers in the provision of publicly-available parking.
o Make shared spaces the least expensive for developer to provide, and excess reserved
spaces the most expensive to provide.
Current Standards Overview
The study informed the current parking standards in Montgomery County, which differ based on land use and
density. Montgomery County employs a range of allowable parking standards based on whether the proposed
project is located in a commercial, residential, or employment zones. Different standards apply in special
Parking Lot Districts. Furthermore, the county allows for parking reductions through shared parking and the
provision transit. See Table 8 for the parking standards for the Parking Lot Districts and
commercial/residential/employment zones.
5.1.1.15 Commercial/Residential & Employment Zones
These zones encourage shared parking environments where spaces are used collectively by people
who work or live in these areas, and the properties are close to each other.
The zoning code sets a baseline minimum parking requirement that is lower than it was previously
before the zoning update to discourage building underutilized parking.
Parking requirements can be reduced based on available shared parking, non-auto driver mode-share
factor, carpool/vanpool spaces, and unbundled residential parking space (spaces are offered at
market rates separately from the purchase or lease of a residential unit).
5.1.1.16 Parking Lot Districts
PLDs have market incentives for the creation of shared parking supplies in high-density, mixed use
environments.
PLD locations include Bethesda, Montgomery Hills, Silver Spring, and Wheaton where the County
owns/can obtain property for the operation of shared public parking (see Figure 31). Parking
minimums in these locations do not need to be met on site. Instead, a property owner can provide
fewer spaces than required if the owner pays a tax to help pay for the County-provided public parking.

99
Figure 31: Map of Montgomery County Parking Lot Districts (in red)
Source: http://mcatlas.org/zoning/
5.1.1.17 Bicycle Parking
Bicycle parking requirements are included for certain uses or use groups. Long-term spaces are
focused on residents and employees, while short-term spaces are required for patrons.
5.1.1.18 Adjustments
Parking in these zones may be reduced through any applicable Non-Auto Driver Mode Share (NADMS)
factor, and on-street parking in the public or private right-of-way abutting the subject property. The
NADMS factor is the percentage of commuters who travel to their worksite by means other than SOV.
NADMS is calculated based on the results of an Annual Commuter Survey administered by one of the
county’s six Transportation Management Districts. Depending on the location, each district is
managed by a non-profit or by Montgomery County Department of Transportation staff. Parking may also be reduced by providing preferential carpool/vanpool spaces, which can replace up
to six commercial spaces and do not count against the parking maximum. In addition, no parking is
required for outdoor patron seating for restaurants located within one mile of transit.

100
Table 8: Parking Standards for Commercial/Employment Zones and Parking Benefit Districts in
Montgomery County Vehicle Parking Spaces Bicycle Parking Spaces
Parking Lot Districts
(PLDs)
All Other
Locations
All Locations
Required Parking Metric Baseline
Minimum
Baseline
Maximum
Baseline
Minimum
Metric Spaces
Required
% Long Term
(for employees)
Civic and Institutional
Cultural Institution 1,000 SF of GFA 0.50 2.00 1.25 10,000 SF of GFA 1.0 15%
Hospital 1,000 SF of GFA 1.75 5.00 1.75 10,000 SF of GFA 2.0 85%
Day Care Facility 1,000 SF of GFA 3.00 4.00 3.00 10,000 SF of GFA 1.0 85%
Charitable,
Philanthropic
Institution
1,000 SF of GFA 2.00 4.00 4.00 10,000 SF of GFA 2.0 85%
Commercial
Office &
Professional
1,000 SF of GFA 2.00 4.00 4.00 10,000 SF of GFA 2.0 85%
Eating & Drinking 1,000 SF for Patron
Use
4.00 12.00 4.00 10,000 SF of GFA 1.0 15%
Medical Dental 1,000 SF of GFA 2.00 4.00 4.00 10,000 SF of GFA 2.0 85%
Recreation &
Entertainment
1,000 SF of GFA 1.00 5.00 2.50 10,000 SF of GFA 1.0 15%
Retail Sales &
Service
1,000 SF of GFA 3.5 6.00 5.00 10,000 SF of GFA 1.0 15%
5.1.1.19 Agricultural, Rural, Residential, & Industrial Zones
Parking in these zones is assumed to be in a non-sharing parking environment where spaces are
typically used by people that live or work at the property for the entire day.
The code sets a baseline minimum parking requirement for each use in the allowed use table (see
Table 9.)
The minimum parking requirements can be reduced by providing on-street space, car share space,
and the presence of moderately priced dwelling units, per review of the Director of Permitting Services.

101
Table 9: Parking Standards Table for Agricultural, Rural, Residential, and Industrial Zones Vehicle Parking Spaces Bicycle Parking Spaces
Metric Baseline
Minimum
Metric Spaces Required % Long Term (for
employees)
Civic and Institutional
Cultural
Institution
1,000 SF of GFA 4.00 10,000 SF of
GFA
1.00 15%
Hospital 1,000 SF of GFA 1.75 10,000 SF of
GFA
2.00 85%
Day Care Facility 1,000 SF of GFA 3.00 10,000 SF of
GFA
1.00 15%
Charitable,
Philanthropic
Institution
1,000 SF of GFA 5.00 10,000 SF of
GFA
2.00 85%
Commercial
Office &
Professional
1,000 SF of GFA 2.80 10,000 SF of
GFA
2.00 85%
Eating & Drinking 1,000 SF for
Patron Use
10.00 10,000 SF of
GFA
1.00 15%
Medical Dental 1,000 SF of GFA 4.00 10,000 SF of
GFA
2.00 85%
Recreation &
Entertainment
1,000 SF of GFA 10.00 10,000 SF of
GFA
1.00 15%
Retail Sales &
Service
1,000 SF of GFA 5.00 10,000 SF of
GFA
1.00 15%
Additional variances to the parking requirements throughout the entire county may be granted to if an
alternative compliance plan is approved.
Sources:
Montgomery County Zoning
http://www.montgomeryplanning.org/development/zoning/documents/FULLCh59APPROVEDclean3.5.14.pdf
Montgomery County Parking Study
https://www.montgomerycountymd.gov/DOT-Parking/Resources/Files/study_summary.pdf

102
Prince George’s County
Population: 909,345 (2015 estimate)
Density: 1,823 people per sq. mi.
Area: 499 sq. mi. immediately north, east, and south of Washington ~
4-30 miles from the city center (see Figure 32)
Representative Federal Facilities: Suitland Federal Center
Current Zoning Adopted: 2015
Background
Prince George County is currently undergoing a comprehensive
rewrite of its Zoning Ordinance and Subdivision Regulations. A
process to update the zoning code began in January 2014, and the
goal is to have the new zoning code implemented in the fall of 2017.
The goals of the zoning code rewrite are to:
Streamline and simplify the regulations and development
approval process.
Modernize and consolidate our zones and development
standards.
Incentivize economic and transit-oriented, mixed-use development.
Protect and enhance stable residential neighborhoods.
Specific information on how parking standards will change is not readily available, but the standards will likely
be simplified, with more incentives to reduce parking in transit-oriented zones.
Zoning Districts
Prince George’s County’s current standards establish the number of parking spaces as follows:
Institutional/Educational Uses: number of building occupants, seats, beds etc.
Recreational/Entertainment/Social/Cultural Uses: sq. ft. of gross of floor area
Commercial Trade (Generally Retail) Services Uses: sq. ft. of gross of floor area
The general parking minimums apply to all zones, with exceptions outlined for the Mixed Use-Transportation
Oriented Zone (M-X-T Zone) and Metro Planned Community Zones.
Parking requirements in M-X-T Zones and Metro Planned Community Zones are based on the general
minimums outlined below, with reductions allowed to account for multipurpose trips and the availability of
transit. Developers must submit detailed site plans with proposed number of parking spaces to the Planning
Board. The data, methodology, and assumptions used to calculate the number of parking spaces must be
included in the application. To calculate the number of parking spaces required in these zones, developers
must do the following:
Calculate the base requirement, using the minimum Parking Standards (see Table 10.). This amount is
assumed to be the maximum number of parking spaces occupied at any hour as the peak demand for
each use. The applicant must also calculate the number of parking spaces occupied during each hour
the day.
The total number of parking spaces shall be the greatest number of spaces in any one hour for the combined
total uses of the proposed, based on the calculations above.
Reductions
Figure 32: Prince George's County
in the Metro Region

103
Impervious Surfaces: Parking may be reduced by up to a maximum of 15 percent to fulfill
requirements to reduce impervious surfaces at a site in certain areas (where impervious surfaces are
40 percent of the net lot area in a Developed Tier, Corridor Node or Center, and by when impervious
surface exceeds 80 percent of the net lot area of site in a Developing Tier area).
Shared Parking: Parking may be reduced by 20 percent when two or more uses provide a joint parking lot—provided the normal requirement for each use is not more than 20 spaces, and the total reductions does not exceed 40 spaces. This reduction does not apply to integrated shopping centers that have a gross leasable area of 25,000 SF, office buildings, office building complexes, or medical practitioners' offices.
Multi-Purpose Trips: The parking requirements calculated above may be reduced in M-X-T Zones by the number of trips that are estimated to be multi-purpose. The parking spaces must be convenient to all the uses they are serving, and is subject the Planning Board’s discretion. The required off-street parking spaces may be required in a lot other than the one a mixed-use development site is located in, given the spaces are in a convenient and safe location.
Transit/Carpool/Vanpool: The base number of parking spaces may be reduced if the site is accessible by transit, carpool, or van pool, and developer-provided services.
Car Sharing: For development proposals between .25 and .5 miles of transit, required parking spaces may be reduced by eight and six spaces, respectively, for each designated car-share space. Net overall reductions are limited to 15 percent.

104
Parking Standards Table
Table 10 contains parking minimums for uses relevant to NCPC properties:
Table 10: Prince George’s County Minimum Parking Standards for Select Uses Vehicle Parking Space
Required Parking Metric Baseline
Minimum
Civic and Institutional
Cultural Institution 1,000 SF of GFA 2.50
Hospital Bed 1.50
Day Care Facility 8 children 8.00
Charitable, Philanthropic Institution 1,000 SF of GFA 1.50
Commercial
250 SF of first 2,000 GFA 1.00
400 SF above first 2,000 SF +1.00
Eating & Drinking 3 seats 1.00
Medical/ Dental 200 SF of GFA 1.00
Recreation & Entertainment (varies) 4 seats 1.00
150 SF of the first 3,000 SF GFA 1.00
200 SF of GFA above first 3,000 SF +1.0
Sources:
Prince George’s County Zoning Rewrite
http://zoningpgc.pgplanning.com/
Prince George’s County Zoning
https://www.municode.com/library/md/prince_george's_county/codes/code_of_ordinances?nodeId=THE_CO
_CODEPRGECOMA

105
City of Alexandria
Population: 148,892 (2013 estimate)
Density: 10,221 people per sq. mi.
Area: 15.5 sq. mi. immediately southwest of Washington ~ 9 miles from
the city center (see Figure 33)
Representative Federal Facility: Mark Center
Current Zoning Adopted: 1992
Background
The City of Alexandria’s last comprehensive update to its zoning code
was in 1992, and in 2014, the city began a study to establish updated
parking requirements. Alexandria is updating its parking standards to
reflect an increase transit, bicycling, and walking, changing
demographics, and market trends. The study has two phases, the first
of which is complete. Phase 1, approved in 2015, resulted in new
standards for multi-family residential developments. Phase 2 is in progress and will result in updated parking
requirements for commercial, office and retail parking.
Zoning Districts
The parking standards for Alexandria are city-wide, rather than by zoning district or overlay; they are defined in
the Off-Street Parking and Loading section of the zoning code. The City of Alexandria is divided into six Parking
Districts (1-6) as well as the King Street Parking District, the Central Business District, and the Mount Vernon
Overlay Zone. District 6 surrounds the Metrorail stations and has the strictest parking requirements. For many
uses, the parking requirements are standardized across all of the districts. However, for retail, office,
commercial, governmental, and industrial there are different parking minimums for each district (see Table
11.). In addition, there is no off-street parking requirements for properties abutting the Potomac River, in the
“Federal Waterfront Settlement Restricted Parking Area.”
Reductions
There are no pre-determined criteria that can be met to allow a reduction in off-street parking as there is with
other jurisdictions in the area. All reductions in parking are achieved through a special use permit, however
there are some exceptions with respect to low- and moderate-income housing development and historic
buildings.
To be granted a special use permit, a developer must show that providing the required amount of parking is
infeasible. If the requested reduction is for more than five parking spaces, a parking management plan is
required. The parking management plan must include measures to mitigate the impacts of the proposed
reduction in parking.
All special use permit applications require the following elements:
A map of the property, including a 300 foot buffer, which shows existing uses, zoning, land use
designation in the Master Plan.
A detailed description of the operation of the proposed use.
Plans to mitigate negative impacts of changes in noise, trash, safety, etc.
For developments that will cause a disproportionately negative traffic impact, developers may be required to
obtain a Transportation Management Special Use Permit. These permits require that a transportation
management plan be submitted, with a focus on reducing SOV trips, while encouraging transit use, ridesharing,
walking, and bicycling. Applicants may also have to pay fees to the city, which are used for the city-wide TDM
funds.
Figure 33: City of Alexandria in
the Metro Region

106
Process
Applications for special use permits are first reviewed by the director of the zoning board who will also share
the application with all relevant departments. After review, a public hearing is held in front of the Planning
Commission.
Parking Standards Table and District Map
Figure 34 shows the Alexandria’s six Parking Districts, and overlay zones. The Mount Vernon Overlay zone is in
pink; the King Street Parking District is in green; and, the Central Business District is in blue.
Figure 34: Map of Alexandria Parking Districts
Source: https://www.alexandriava.gov/tes/info/default.aspx?id=76333
Table 11 contains parking minimums for uses relevant to NCPC properties:
Table 11: City of Alexandria Minimum Parking Standards for Select Uses
Land Uses Subject to Parking Districts Use Type Minimum Parking Requirements Parking District 1 2 3 4 5 6
Office: Commercial,
Governmental,
Professional
1 space per
150 sq. ft.
1 space per
450 sq. ft.
1 space per
470 sq. ft.
1 space per
475 sq. ft.
1 space per
475 sq. ft.
1 space per
160 sq. ft.
All parking districts for this use require 5% of spaces to be set aside for carpool
Land Uses Not Subject to Parking Districts Use Type Minimum Parking Requirements
Hospitals 1 space per 2 beds
Community Buildings, Civic Clubs, etc 1 space per 200 sq. ft.
Medical and Dental Clinics 1 space per 200 sq. ft.
Sources:
Alexandria Zoning Code
https://www.municode.com/library/va/alexandria/codes/zoning

107
Alexandria Parking Study
https://www.alexandriava.gov/ParkingStudies
https://www.alexandriava.gov/tes/info/default.aspx?id=76333
Arlington County
Population: 224,906 (2013 estimate)
Density: 8,814 people per sq. mi.
Area: 25.98 sq. mi. – SW of Washington ~ 5 miles from the
city center (see Figure 35)
Representative Federal Facilities: Pentagon, Joint Base Myer-
Henderson Hall
Current Zoning Adopted: 2015
Background
Arlington County’s current zoning code was adopted in 2015,
after an update process that began in 2011. The goal of the update was to make the zoning code easier to
understand and administer, and move to adopt a new use classification system.
As part of the update process, the county completed a Commercial Parking Study in 2013. This study examines
the impacts of developers proposing to build less parking than required for new office buildings, and how to
offset the potential impacts. This study led to the Reduced Parking Policy for Site Plan Offices, which outlines a
flexible and consistent approach for developers proposing to build less parking than is required by the zoning
code. The policy outlines a contribution formula for developers to help pay for TDM programs, and potentially
transit operating costs, to help offset the additional traffic that will be generated by the new office
developments.
A county-sponsored Residential Parking Working Group is currently working with staff to finalize new policy
recommendations for parking at Site Plan and Unified Commercial/Mixed Use Development use permit
projects in Arlington’s Rosslyn-Ballston and Jefferson Davis Metrorail corridors. The Working Group is
evaluating using parking ratios (spaces per residential unit) based on proximity to Metrorail stations in these
corridors. The final recommendations are pending and should be available sometime in 2017.
Zoning Districts
Arlington has five standard zoning use districts: Public, Residential, Multiple-Family, Commercial/Mixed Use,
and Industrial, and within each district there are a number of specific zones outlined in detail. For these
districts, the standard minimum parking requirements table applies (see Table 12.).
In addition to these standard districts, there are also Special Planning Areas, Overlay and Form Based Code
Districts, and Unified Residential, Commercial/Mixed Use, and Residential Cluster Developments. For these
special planning districts, the parking requirements may vary from what is required in the standard parking
minimum table.
Adjustments
Figure 35: Arlington County in the
Metro Region Figure 36: Arlington County in the
Metro Region

108
Arlington’s zoning code cites the promotion of pedestrian-related commercial activity as a justification for
eliminating parking requirements in certain situations. No parking is required for uses meeting certain criteria
when located within 1,000 feet of a Metrorail station. Examples include:
Restaurants with daytime operating hours, or restaurants with evening and nighttime hours that have
over 200 seats.
Grocery stores smaller than 15,000 square feet of floor area.
Phased Development Site Plans and Crystal City Block Plans are additional ways the zoning code provides
flexibility to provide less parking. These tools are generally limited to hotels, residential, office, and mixed-use
developments in the Crystal City area or another high-density zoning district. Each application submitted by a
developer to reduce parking is required to include the following:
A TDM program
A TIA
A Stormwater Management and Compliance Plan
Other requirements pertaining to Affordable Dwelling Units
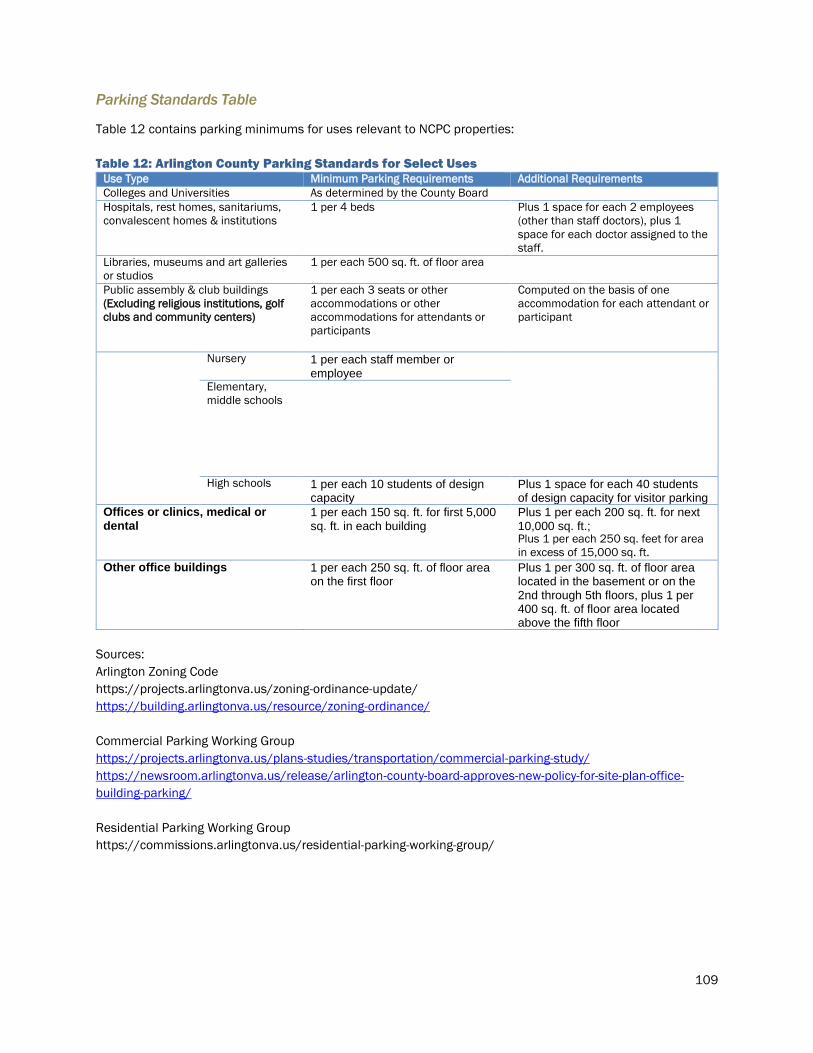
109
Parking Standards Table
Table 12 contains parking minimums for uses relevant to NCPC properties:
Table 12: Arlington County Parking Standards for Select Uses Use Type Minimum Parking Requirements Additional Requirements
Colleges and Universities As determined by the County Board
Hospitals, rest homes, sanitariums,
convalescent homes & institutions
1 per 4 beds Plus 1 space for each 2 employees
(other than staff doctors), plus 1
space for each doctor assigned to the
staff.
Libraries, museums and art galleries
or studios
1 per each 500 sq. ft. of floor area
Public assembly & club buildings
(Excluding religious institutions, golf
clubs and community centers)
1 per each 3 seats or other
accommodations or other
accommodations for attendants or
participants
Computed on the basis of one
accommodation for each attendant or
participant
Nursery 1 per each staff member or employee
Elementary,
middle schools
High schools 1 per each 10 students of design capacity
Plus 1 space for each 40 students of design capacity for visitor parking
Offices or clinics, medical or dental
1 per each 150 sq. ft. for first 5,000 sq. ft. in each building
Plus 1 per each 200 sq. ft. for next 10,000 sq. ft.; Plus 1 per each 250 sq. feet for area
in excess of 15,000 sq. ft.
Other office buildings 1 per each 250 sq. ft. of floor area on the first floor
Plus 1 per 300 sq. ft. of floor area located in the basement or on the 2nd through 5th floors, plus 1 per 400 sq. ft. of floor area located above the fifth floor
Sources:
Arlington Zoning Code
https://projects.arlingtonva.us/zoning-ordinance-update/
https://building.arlingtonva.us/resource/zoning-ordinance/
Commercial Parking Working Group
https://projects.arlingtonva.us/plans-studies/transportation/commercial-parking-study/
https://newsroom.arlingtonva.us/release/arlington-county-board-approves-new-policy-for-site-plan-office-
building-parking/
Residential Parking Working Group
https://commissions.arlingtonva.us/residential-parking-working-group/

110
Fairfax County
Population: 1.131 million (2013 estimate)
Density: 2,813 people per sq. mi.
Area: 406 sq. mi. – west of Washington ~ 6-30 miles from the city
center (see Figure 37)
Representative Federal Facility: Fort Belvoir
Current Zoning Adopted: 1978
Background
Fairfax County last updated its zoning code in 1976; the county is
currently in the beginning phases of modernization of its zoning code.
Zoning Districts
The Fairfax Zoning Code organizes land uses into five types of districts:
Residential, Commercial, Industrial, Planned Development, and Overlay Districts. Within each district are
specific land uses; all of which are governed under the general, countywide parking standards by use.
Adjustments
The Zoning Board may allow the reduction of parking under the conditions outlined below:
The site is situated “within reasonable walking distance” to public transit. Specific criteria are outlined
in the code: generally, any Metrorail, streetcar, bus rapid transit, or city bus operating at a certain
frequency.
Sites situated in areas designated as “Community Business Centers” (neighborhood shopping centers)
may reduce parking or provide parking non-contiguously or off-site if certain criteria are met and the
developer pays the county a price determined by the Zoning Board.
If public parking is—or will soon be—constructed in close proximity to the site and the developer pays a
fee to be determined by the Zoning Board.
If two adjacent uses can share parking—in particular if their peak periods of demand do not coincide.
Zoning Board approval and a fee to be determined by the Zoning Board are required.
Figure 37: Fairfax County in the
Metro Region

111
Parking Standards Table
Table 13 below contains parking minimums for uses relevant to NCPC properties:
Table 13: Fairfax County Parking Standards for Select Uses
Use Requirement Financial Institution Four (4) spaces per 1,000 square feet of gross floor area for customer
service, lobby and teller area; plus additional spaces as required herein for
any associated offices
<50,000 GFA Three and six-tenths (3.6) spaces per 1000 square feet of gross floor area
50,000 GFA < x < 125,000
GFA
Three (3.0) spaces per 1,000 square feet of gross floor area
>125,000 GFA Two and six-tenths (2.6) spaces per 1,000 square feet of gross floor area
Manufacturing Establishment One (1) space per one (1) employee on major shift, plus one (1) space per
company vehicle and piece of mobile equipment
Mini-Warehousing Establishment 3.2 spaces / 1,000 sq ft GFA of office space associated with the use plus
one (1) space per employee, and two (2) spaces for a resident manager. The
width of travel aisles for vehicular access and loading and unloading shall
be subject to the approval of the Director
Scientific R&D Establishment One (1) space per 1.5 employees based on the occupancy load, plus one (1)
space per company vehicle
<100 children 0.19 space per child
>=100 children 0.16 space per child
College or University
Based on a review by the director of each proposal including such factors as
the occupancy load of all classroom facilities, auditoriums and stadiums, the
availability of mass transportation, and the availability of areas on site that
can be used for auxiliary parking in times of peak demand; but in no
instance less than one (1) space per faculty and staff member and other
full-time employee, plus a sufficient number of spaces to accommodate the
anticipated number of students and visitors who will drive to the institution
at any one time
Elementary or
Intermediate
Based on a review… [see above]… but in no instance less than one (1)
space per faculty and staff member and other full-time employee, plus four
(4) spaces for visitors
High School Based on a review… [see above]… but in no instance less than three-tenths
(0.3) space per student, based on the maximum number of students
attending classes at any one time
Source:
Fairfax County Zoning Code
http://www.fairfaxcounty.gov/dpz/zoningordinance/
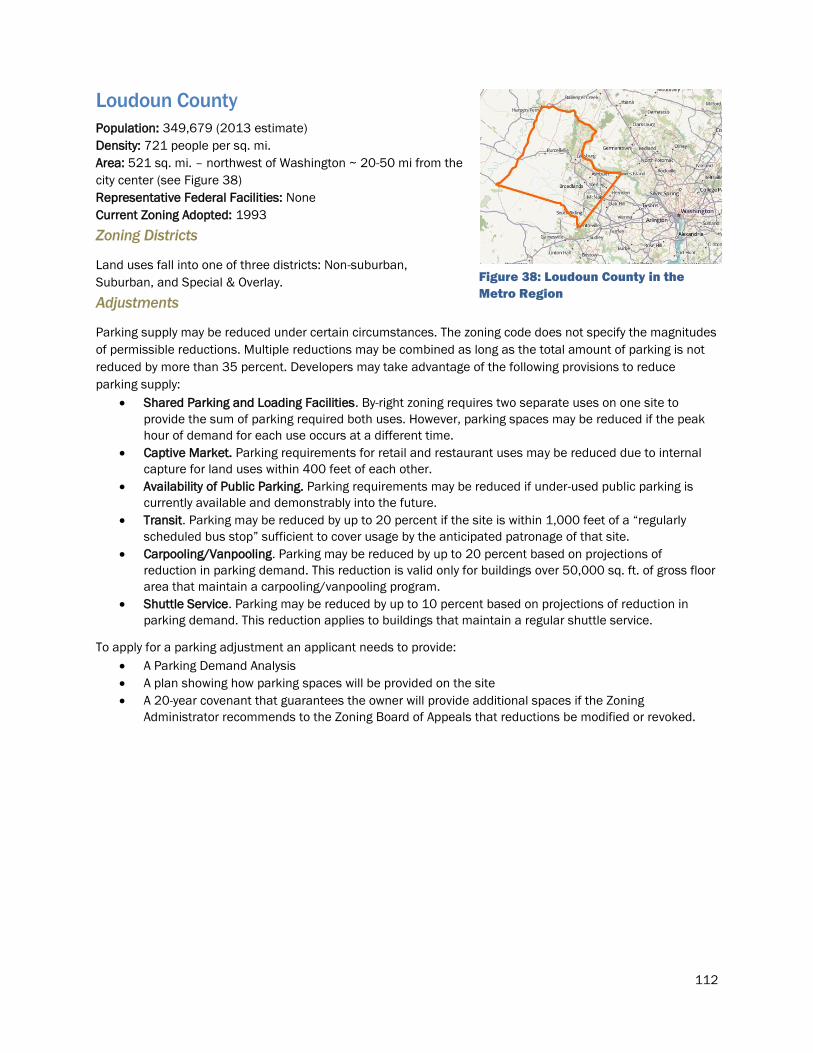
112
Loudoun County
Population: 349,679 (2013 estimate) Density: 721 people per sq. mi.
Area: 521 sq. mi. – northwest of Washington ~ 20-50 mi from the
city center (see Figure 38)
Representative Federal Facilities: None
Current Zoning Adopted: 1993
Zoning Districts
Land uses fall into one of three districts: Non-suburban,
Suburban, and Special & Overlay.
Adjustments
Parking supply may be reduced under certain circumstances. The zoning code does not specify the magnitudes
of permissible reductions. Multiple reductions may be combined as long as the total amount of parking is not
reduced by more than 35 percent. Developers may take advantage of the following provisions to reduce
parking supply:
Shared Parking and Loading Facilities. By-right zoning requires two separate uses on one site to
provide the sum of parking required both uses. However, parking spaces may be reduced if the peak
hour of demand for each use occurs at a different time.
Captive Market. Parking requirements for retail and restaurant uses may be reduced due to internal
capture for land uses within 400 feet of each other.
Availability of Public Parking. Parking requirements may be reduced if under-used public parking is
currently available and demonstrably into the future.
Transit. Parking may be reduced by up to 20 percent if the site is within 1,000 feet of a “regularly
scheduled bus stop” sufficient to cover usage by the anticipated patronage of that site.
Carpooling/Vanpooling. Parking may be reduced by up to 20 percent based on projections of
reduction in parking demand. This reduction is valid only for buildings over 50,000 sq. ft. of gross floor
area that maintain a carpooling/vanpooling program.
Shuttle Service. Parking may be reduced by up to 10 percent based on projections of reduction in
parking demand. This reduction applies to buildings that maintain a regular shuttle service.
To apply for a parking adjustment an applicant needs to provide:
A Parking Demand Analysis
A plan showing how parking spaces will be provided on the site
A 20-year covenant that guarantees the owner will provide additional spaces if the Zoning
Administrator recommends to the Zoning Board of Appeals that reductions be modified or revoked.
Figure 38: Loudoun County in the
Metro Region
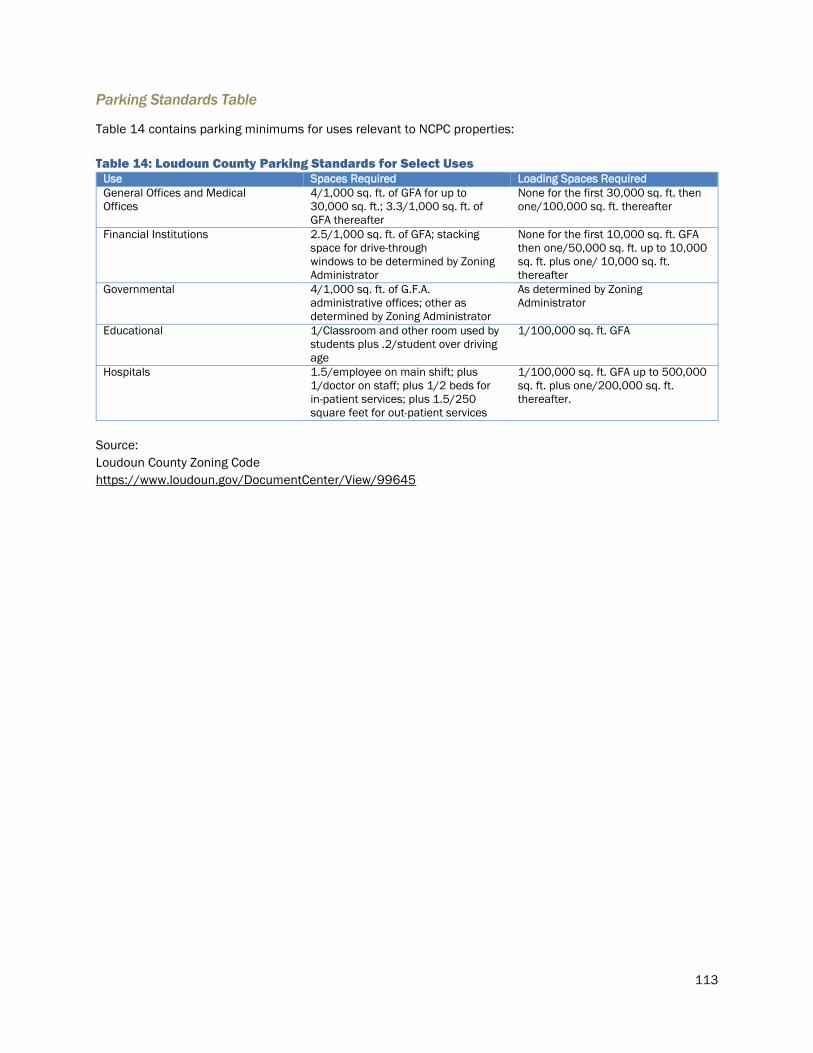
113
Parking Standards Table
Table 14 contains parking minimums for uses relevant to NCPC properties:
Table 14: Loudoun County Parking Standards for Select Uses Use Spaces Required Loading Spaces Required
General Offices and Medical
Offices
4/1,000 sq. ft. of GFA for up to
30,000 sq. ft.; 3.3/1,000 sq. ft. of
GFA thereafter
None for the first 30,000 sq. ft. then
one/100,000 sq. ft. thereafter
Financial Institutions 2.5/1,000 sq. ft. of GFA; stacking
space for drive-through
windows to be determined by Zoning
Administrator
None for the first 10,000 sq. ft. GFA
then one/50,000 sq. ft. up to 10,000
sq. ft. plus one/ 10,000 sq. ft.
thereafter
Governmental 4/1,000 sq. ft. of G.F.A.
administrative offices; other as
determined by Zoning Administrator
As determined by Zoning
Administrator
Educational 1/Classroom and other room used by
students plus .2/student over driving
age
1/100,000 sq. ft. GFA
Hospitals 1.5/employee on main shift; plus
1/doctor on staff; plus 1/2 beds for
in-patient services; plus 1.5/250
square feet for out-patient services
1/100,000 sq. ft. GFA up to 500,000
sq. ft. plus one/200,000 sq. ft.
thereafter.
Source:
Loudoun County Zoning Code
https://www.loudoun.gov/DocumentCenter/View/99645

114
Prince William County
Population: 438,580 (2013 estimate)
Density: 1,298 people per sq. mi.
Area: 348 sq. mi. – southwest of Washington ~20-35
mi from the city center (see Figure 39)
Representative Federal Facilities: Marine Corps Base
Quantico
Current Zoning Adopted: 2006
Zoning Districts
Parking requirements are not addressed by district;
rather they are governed county-wide by land use.
Furthermore, the Director of Transportation has the
discretion to require additional off street parking when
the operation of a site shows a “repeated need for
more spaces”.
Adjustments
Up to 50 percent of the required parking may be located on an adjacent or abutting property.
The following credit allowances are authorized by the Director of Transportation after requests are submitted in
writing. Requests should include “studies, surveys, reports or other evidence to support the request”:
Land Use Intensity - Up to 30 percent of required parking may be waived when the land use is “so
intense that normal individual demand will not be generated.” The factors considered are proximity to
public transit, nearby public parking, and commercial and employment activities in the area.
Shared parking - Parking may be reduced when adjacent lots of different uses share the same
parking. Code permits up to a 75 percent parking space reduction for two uses with no overlap in
operating hours, or 25 percent if the overlap in operating hours is less than four hours. A legal
agreement is required when multiple property owners are involved.
Land Banking – Construction of up to 50 percent of the otherwise required parking can be deferred if
additional land is readily available. Deferred parking must be constructed if (and when) the Director of
Transportation deems necessary.
Process
A TDM plan is required if a development proposal consists of mixed-use urban/suburban activity centers and
the applicant is seeking a trip generation credit or reduction. A TIA is required to be submitted in conjunction
with or be included within a TDM plan.
Requirements of TDM and TIA are outlined in detail in sections 620 and 630 of the Prince William County
Design and Construction Manual. In general, TIAs include the following components:
The study area, which consists of the proposed development area and the impacted transportation
network.
Existing traffic conditions, and the estimated trip generation for the development (based on the
Institute of Transportation Engineers Trip Generation Manual).
Any potential for trip reductions based on availability of transit service, pedestrian/bicyclist facilities,
and TDM programs.
The projected future traffic conditions, and analysis of impact based on the Highway Capacity
Software.
The trip distribution and assignment to the traffic network, and
Recommendations for how mitigate significant impacts on the study area.
Figure 39: Prince William County in the Metro
Region

115
Parking Standards Table
Table 15 contains parking minimums for uses relevant to NCPC properties:
Table 15: Parking Minimums for Prince William County Use Loading Parking
Note: units are measured in net floor area – net floor area = 75% of gross floor area
Hospital – major
surgical or short
term visits
1 plus 1 per 75,000 net sq. ft. 1.25 per bed
Medical center,
offices and
clinics
1 up to 75,000 net sq. ft., then 2 1 per 150 net sq. ft. up to 15,000 net
sq. ft., then 1 per 200 net sq. ft. up to
30,000 net sq. ft., then
1 per 250 net sq. ft. above 30,000 net
sq. ft.
Nursing,
convalescent or
personal care
facility
1 up to 75,000 net sq. ft., then 2 1 per 2 beds, by licensed capacity
Office, financial institutions None for buildings with less than
20,000 net sq. ft. of building
area; then 1 for each additional
20,000 net sq. ft. Maximum of 5
loading spaces for each building
1 per 250 net sq. ft. of building area; 10 minimum
Office with ancillary retail or service
uses
1 per 20,000 net sq. ft. up to
100,000 net sq. ft., then 1 per
50,000 net sq. ft.
1 per 250 net sq. ft. plus 5%
Learning center 1 1/seat
Elementary or
middle schools
2 1 space for every 20 classroom seats plus 5 visitor
spaces, plus one space for every 5 seats in an
auditorium or multipurpose room
High schools 2 1 space for every 5 students, plus one per faculty
member, plus 10 spaces for visitors, plus one
space for every 4
seats in an auditorium or multipurpose room
Junior colleges,
colleges,
universities
2 1 space for every 5 classroom seats, plus 20
spaces for visitors, plus one space for every 3
seats in an auditorium or multipurpose room
Suburban/urban
facility
1 1 per 200 net sq. ft.
Rural facility 1 1 per 400 net sq. ft.

116
Medical or dental laboratory 1 plus 1 per 50,000 net sq. ft. 1 per 300 net sq. ft. to 10,000 net sq. ft., then 1
per 500 net sq. ft.
Research and development 1 plus 1 per 50,000 net sq. ft. 1 per 300 net sq. ft. to 10,000 net sq. ft.; then 1
per 500 net sq. ft.
If office space exceeds fifty (50)
percent of net floor area
none 1 per 300 net sq. ft. up to 100,000 net sq. ft.; then
as provided above
Sources:
Prince William Zoning Code
http://www.pwcgov.org/government/dept/planning/zoning/pages/zoning-ordinance.aspx
https://www.municode.com/library/va/prince_william_county/codes/code_of_ordinances
Prince William County Design and Construction Manual
http://www.pwcgov.org/government/dept/development/ld/Documents/13417.pdf

117
Appendix H: Development and Limitations of the
Volpe Model
The appendix described development and limitations of the Volpe Model.
Developing the Volpe Model
The Volpe Center sought to define the relationship between observed parking at each facility and the
underlying accessibility ratio. Termed the Volpe Model, this analysis defined a linear relationship between
accessibility ratio (transit to car) and observed (current) parking ratio (number of employees per parking space
provided). NCPC could use this mathematical relationship to:
Explain the variation in parking at the sampled facilities.
Estimate the observed (current) parking ratio at non-sampled facilities.
Predict future (2030) parking ratios based on anticipated changes in the accessibility ratio across the
region.
Projecting Future Parking Ratios
In light of projected land use and transportation changes in the region, the Volpe Center adjusted the observed
(current) parking ratio values for the facilities in the study to predict future parking ratios. This was done by
applying the Volpe Model to produce predicted (future) parking ratios for both 2016 and 2030 and then
comparing the 2016 prediction to the actual observed 2016 parking ratio. This proportion (observed parking
ratio divided by the modeled 2016 parking ratio) was then applied to the 2030 prediction to adjust for the
facility’s existing performance. Therefore, facilities which have less parking than predicted by the regression
analysis will continue to do better than facilities that have more parking than predicted. Figure 40 shows the
equations underlying this process.
Figure 40: Calculating Final Predicted Parking Ratio
For a facility where the observed (current) parking ratio is unknown, the model can still be used to develop a
predicted (future_ parking ratio for the future condition. In that case, the future accessibility is used directly
and no adjustment is made for the facility’s current performance.
To determine the confidence intervals for the predicted (future) parking ratios, the Volpe Center tested various
combinations of parameters within each of these ranges and found maximum and minimum predicted (future)
parking ratios.
Observed (Current) Parking
Ratio (Observed) Predicted 2016 Parking Ratio:
f(2016 accessibility ratio) =
1.2488 * accessibility ratio + 1.3813
Predicted (Future) Parking Ratio:
f(2030 accessibility ratio) =
1.2488 * accessibility ratio + 1.3813
Cur =
CurPr =
FutPr =
FutFinal = FutPr * (Cur / CurPr)
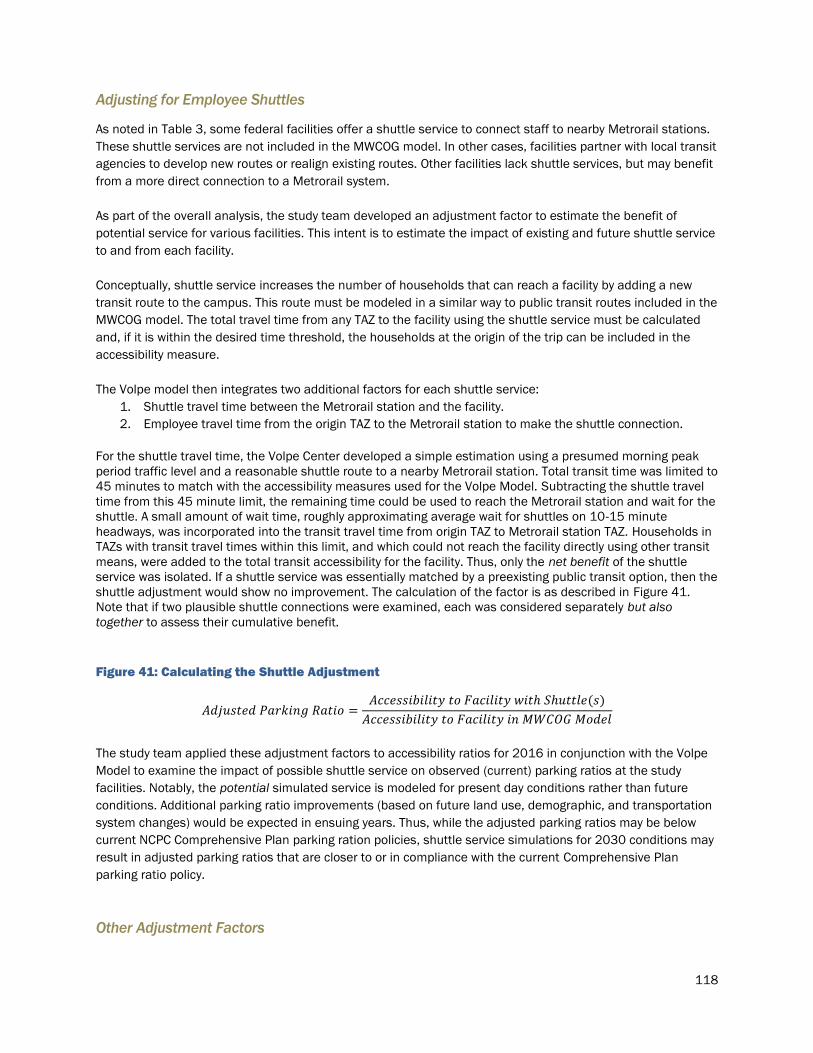
118
Adjusting for Employee Shuttles
As noted in Table 3, some federal facilities offer a shuttle service to connect staff to nearby Metrorail stations.
These shuttle services are not included in the MWCOG model. In other cases, facilities partner with local transit
agencies to develop new routes or realign existing routes. Other facilities lack shuttle services, but may benefit
from a more direct connection to a Metrorail system.
As part of the overall analysis, the study team developed an adjustment factor to estimate the benefit of
potential service for various facilities. This intent is to estimate the impact of existing and future shuttle service
to and from each facility.
Conceptually, shuttle service increases the number of households that can reach a facility by adding a new
transit route to the campus. This route must be modeled in a similar way to public transit routes included in the
MWCOG model. The total travel time from any TAZ to the facility using the shuttle service must be calculated
and, if it is within the desired time threshold, the households at the origin of the trip can be included in the
accessibility measure.
The Volpe model then integrates two additional factors for each shuttle service:
1. Shuttle travel time between the Metrorail station and the facility.
2. Employee travel time from the origin TAZ to the Metrorail station to make the shuttle connection.
For the shuttle travel time, the Volpe Center developed a simple estimation using a presumed morning peak
period traffic level and a reasonable shuttle route to a nearby Metrorail station. Total transit time was limited to
45 minutes to match with the accessibility measures used for the Volpe Model. Subtracting the shuttle travel
time from this 45 minute limit, the remaining time could be used to reach the Metrorail station and wait for the
shuttle. A small amount of wait time, roughly approximating average wait for shuttles on 10-15 minute
headways, was incorporated into the transit travel time from origin TAZ to Metrorail station TAZ. Households in
TAZs with transit travel times within this limit, and which could not reach the facility directly using other transit
means, were added to the total transit accessibility for the facility. Thus, only the net benefit of the shuttle
service was isolated. If a shuttle service was essentially matched by a preexisting public transit option, then the
shuttle adjustment would show no improvement. The calculation of the factor is as described in Figure 41.
Note that if two plausible shuttle connections were examined, each was considered separately but also
together to assess their cumulative benefit.
Figure 41: Calculating the Shuttle Adjustment
𝐴𝑑𝑗𝑢𝑠𝑡𝑒𝑑 𝑃𝑎𝑟𝑘𝑖𝑛𝑔 𝑅𝑎𝑡𝑖𝑜 =𝐴𝑐𝑐𝑒𝑠𝑠𝑖𝑏𝑖𝑙𝑖𝑡𝑦 𝑡𝑜 𝐹𝑎𝑐𝑖𝑙𝑖𝑡𝑦 𝑤𝑖𝑡ℎ 𝑆ℎ𝑢𝑡𝑡𝑙𝑒(𝑠)
𝐴𝑐𝑐𝑒𝑠𝑠𝑖𝑏𝑖𝑙𝑖𝑡𝑦 𝑡𝑜 𝐹𝑎𝑐𝑖𝑙𝑖𝑡𝑦 𝑖𝑛 𝑀𝑊𝐶𝑂𝐺 𝑀𝑜𝑑𝑒𝑙
The study team applied these adjustment factors to accessibility ratios for 2016 in conjunction with the Volpe
Model to examine the impact of possible shuttle service on observed (current) parking ratios at the study
facilities. Notably, the potential simulated service is modeled for present day conditions rather than future
conditions. Additional parking ratio improvements (based on future land use, demographic, and transportation
system changes) would be expected in ensuing years. Thus, while the adjusted parking ratios may be below
current NCPC Comprehensive Plan parking ration policies, shuttle service simulations for 2030 conditions may
result in adjusted parking ratios that are closer to or in compliance with the current Comprehensive Plan
parking ratio policy.
Other Adjustment Factors
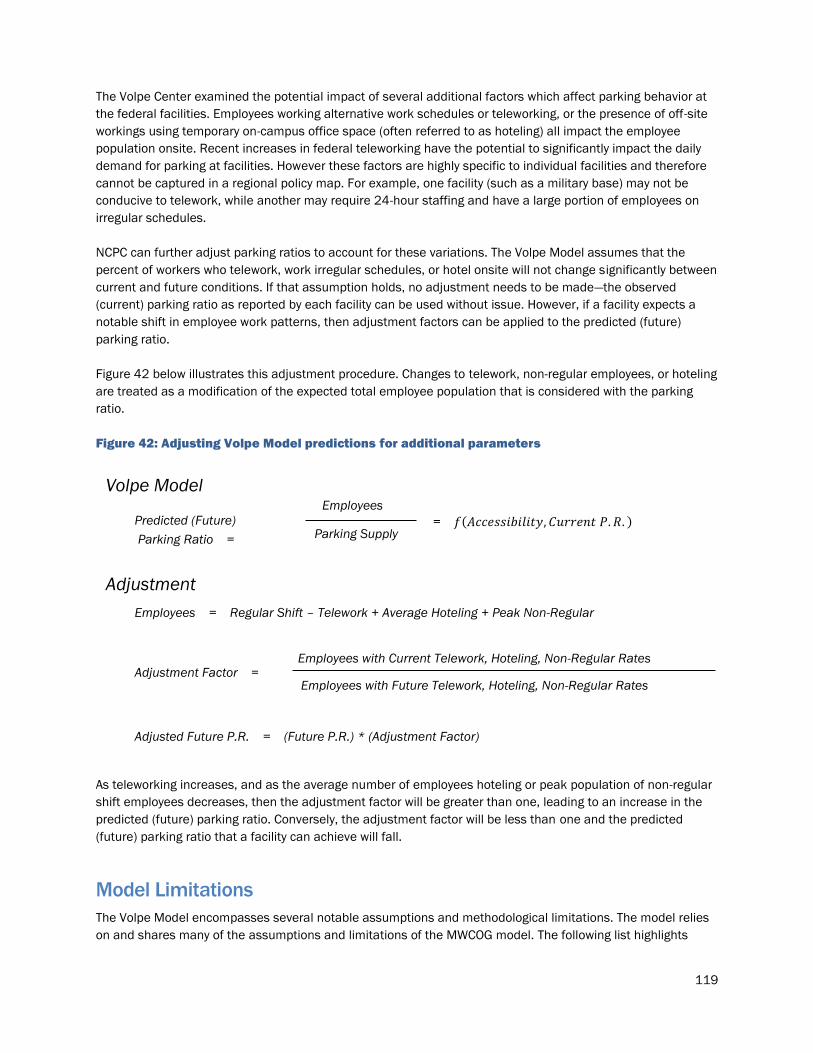
119
The Volpe Center examined the potential impact of several additional factors which affect parking behavior at
the federal facilities. Employees working alternative work schedules or teleworking, or the presence of off-site
workings using temporary on-campus office space (often referred to as hoteling) all impact the employee
population onsite. Recent increases in federal teleworking have the potential to significantly impact the daily
demand for parking at facilities. However these factors are highly specific to individual facilities and therefore
cannot be captured in a regional policy map. For example, one facility (such as a military base) may not be
conducive to telework, while another may require 24-hour staffing and have a large portion of employees on
irregular schedules.
NCPC can further adjust parking ratios to account for these variations. The Volpe Model assumes that the
percent of workers who telework, work irregular schedules, or hotel onsite will not change significantly between
current and future conditions. If that assumption holds, no adjustment needs to be made—the observed
(current) parking ratio as reported by each facility can be used without issue. However, if a facility expects a
notable shift in employee work patterns, then adjustment factors can be applied to the predicted (future)
parking ratio.
Figure 42 below illustrates this adjustment procedure. Changes to telework, non-regular employees, or hoteling
are treated as a modification of the expected total employee population that is considered with the parking
ratio.
Figure 42: Adjusting Volpe Model predictions for additional parameters
As teleworking increases, and as the average number of employees hoteling or peak population of non-regular
shift employees decreases, then the adjustment factor will be greater than one, leading to an increase in the
predicted (future) parking ratio. Conversely, the adjustment factor will be less than one and the predicted
(future) parking ratio that a facility can achieve will fall.
Model Limitations
The Volpe Model encompasses several notable assumptions and methodological limitations. The model relies
on and shares many of the assumptions and limitations of the MWCOG model. The following list highlights
Predicted (Future)
Parking Ratio =
Volpe Model Employees
Parking Supply
Adjustment
Adjusted Future P.R. = (Future P.R.) * (Adjustment Factor)
Employees = Regular Shift – Telework + Average Hoteling + Peak Non-Regular
= 𝑓(𝐴𝑐𝑐𝑒𝑠𝑠𝑖𝑏𝑖𝑙𝑖𝑡𝑦, 𝐶𝑢𝑟𝑟𝑒𝑛𝑡 𝑃. 𝑅. )
Adjustment Factor = Employees with Future Telework, Hoteling, Non-Regular Rates
Employees with Current Telework, Hoteling, Non-Regular Rates

120
several factors to consider when reviewing the study. Nevertheless, it is important to understand that all
regional Metropolitan Planning Organizations (MPOs) use similar regional models (based on assumptions, with
various limitations) which are accepted by the transportation industry:
Models change: The MWCOG model is built on component models which estimate changes to the
region in terms of demographics, jobs, planned network changes, etc. These variables are constantly
updated to reflect the best knowledge of the region’s likely growth and change. This analysis is
particularly susceptible to changes to planned transportation improvements, which directly impact the
accessibility of portions of the region. While we have confidence that the majority of changes planned
in the region’s Financially Constrained Long-Range Plan will be implemented for 2030, it is possible
that some improvements will be added, removed, or scaled back.
Geographic granularity: Regional transportation models are zone based, so federal facilities across the
region are often grouped with other homes or businesses. Each zone aggregates land use and
demographic data and makes estimations rather than modeling every individual household or
business separately. This can lead to slight deviations in behavior.
Modal limitations: While the MWCOG model incorporates travel modes other than automobile and
transit, the Volpe Model does not incorporate those data. As such, carpooling or ride-sharing
commuting options and non-motorized modes, such as bicycling or walking, are not considered. In
more urbanized areas, these may contribute significantly to the overall mode share for any given
facility and have an impact on parking demand.
Employer shuttles: The MWCOG model incorporates public transportation options throughout the
region, but some federal facilities in the NCR also have on-site shuttle services to connect with major
train or bus stations. These can significantly increase transit accessibility for a facility, but they are not
incorporated into the routine accessibility measures produced by the MWCOG model. The Volpe Model
does not account for these additional transit services directly, but the Volpe Center developed
adjustment factors for off-model analysis at individual facilities.
NCPC’s data from federal facilities also presents limitations:
Sample size: As discussed earlier, this model uses data from federal facilities in the NCR that are
subject to NCPC review. NCPC staff selected 20 recent master plans (with TMPs). Although the sample
size (20) is small for modeling purposes, the number of master plans used in the study represents a
majority (77 percent) of NCPC-reviewed master plans within the last five years. Thus, the Volpe Model
is sufficient for considering parking ratios of NCPC reviewed facilities, but would require further data to
produce a robust generalized model for application to other facilities in other regions. Nevertheless,
the underlying relationships revealed show promising descriptive power.
Data age: The transportation data provided by each facility are not all contemporaneous with the
MWCOG model. The current conditions provided by each facility range from the late 2000s through to
the middle 2010s. The MWCOG ‘current conditions’ represents 2016 conditions. As such, facility
parking condition data do not perfectly align with the accessibility data.

121
Bibliography
ADP Research Institute. (2016, January 12). IRS Issues Guidance for Retroactive 2015 Increase in Excludable
Transit Benefits. Retrieved from ADP: https://www.adp.com/tools-and-resources/adp-research-
institute/insights/insight-item-detail.aspx?id=%7bE3A00A37-2441-46AD-A9EB-6F7A606F7C0B%7d
American Planning Association. (2002). Parking Standards. (M. D. Dolnick, Ed.) Chicago, IL: American Planning
Association.
Association for Commuter Transportation. (2017). Getting to Work. Sharon, MA: ACT.
BART Planning, Development, and Construction. (2015). BART Station Access Policy Update.
Bochner, B. (2016, July). Advances in Urban Trip Generation Estimation. Retrieved from
digitaleditions.sheridan.com:
http://digitaleditions.sheridan.com/article/Advances_in_Urban_Trip_Generation_Estimation/252258
1/317111/article.html
Bochner, B., & Sperry, B. (2010). Internal Trip Capture Estimator for Mixed-Use Developments. College Station,
TX: Texas Transportation Institute.
Bochner, B., Hooper, K., Sperry, B., Dunphy, R., & Board, T. R. (2011). Enhancing Internal Trip Capture
Estimation for Mixed-Use Developments. Washington, DC: Transportation Research Board.
Caltrans Division of Research, Innovation and System Information. (2016). Quantifying Passenger Rail Access
Mode Shift . CTC & Associates LLC.
Chicago Metropolitan Agency for Planning. (2016). Parking Supply Management Strategies. Retrieved from
cmap.illinois.gov: http://www.cmap.illinois.gov/about/2040/supporting-materials/process-
archive/strategy-papers/parking/supply-management-strategies
City of Minneapolis. (2009). Minneapolis Bike Parking Regulations Guide. Minneapolis, MN: Department of
Public Works.
City of Palo Alto. (2007). Zoning Regulations of the City of Palo Alto. Palo Alto, CA: ProCode.
Collins, P., & Agarwal, A. (2015). Impacts of public transit improvements on ridership, and implications for
physical activity, in a low-density Canadian city. Preventive Medicine Reports.
Congress for the New Urbanism. (2017). What is New Urbanism? Retrieved from The Charter of New Urbanism:
https://www.cnu.org/resources/what-new-urbanism
Crim, S. (2013, October 10). Residential Building Transportation Performance Monitoring Study. Retrieved
from mobilitylab.org: http://mobilitylab.org/2013/10/10/residential-building-transportation-
performance-monitoring-study
Department of Defense. (2016). Strategic Sustainability Performance Plan. Department of Defense.
Destin, Florida, City of. (2016, June 14). 6.05.00. - Quantitative methods for transportation concurrency.
Retrieved from municode.com:
https://www.municode.com/library/fl/destin/codes/land_development_code?nodeId=DELADECO_AR
T6COMASY_6.05.00QUMETRCO
District Department of Transportation. (2014). Trip Generation Data Collection in Urban Areas. Washington,
DC: Nelson\Nygaard.

122
District Department of Transportation. (2015). Evaluation of Trip Generation in Highly Urbanized Areas.
Retrieved from dc.gov: https://sites.google.com/a/dc.gov/ddot-research-program/projects-and-
studies/current-research/trip-gen
Executive Order 13693 3 C.F.R p281. (2015).
General Services Administation. (n.d.). Car Sharing. Retrieved from GSA.gov:
https://www.gsa.gov/portal/content/199127
General Services Administration. (2017, January 19). GSA provides the best value for government and the
American people in real estate, acquisition, and technology. Retrieved from GSA.gov:
https://gsa.gov/portal/content/154498
General Services Administration. (n.d.). Buy Green Vehicles. Retrieved from GSA.gov:
https://www.gsa.gov/portal/content/105378
General Services Administration. (n.d.). Electric Vehicle Pilot Program. Retrieved from GSA.gov:
https://www.gsa.gov/portal/content/281581
General Services Administration. (n.d.). Fast Forward. Retrieved from GSA.gov:
https://www.gsa.gov/sustainability/#/fleet
General Services Administration. (n.d.). The Structure of Tomorrow. Retrieved from GSA.gov:
https://www.gsa.gov/sustainability/#/buildings
goDCgo. (2016). Employer Commuter Benefits Toolkit. Washington, DC: District Department of Transportation.
Greater Grand Rapids Bicycle Coalition. (2017). Active Commute Week Challenge. Retrieved from acwgr:
http://acwgr.org/
Institute of Transportation Engineers. (2010). Parking Generation (4 ed.). Washington, DC: Institute of
Transportation Engineers.
Koska, T., & Rudolph, F. (2016). The Role of Walking and Cycling in Reducing Congestion: A Portfolio of
Measures.
League of American Bicyclists. (2017). Becoming a Bicycle Friendly Business. Retrieved from Bike League:
http://bikeleague.org/business
Litman, T. (2016). Parking Management, Strategies, Evaluation, and Planning. Victoria Transport Policy
Institute.
McCahil, C., Garrick, N., Atkinson-Palombo, C., & Polinski, A. (2015). Effects of Parking Provision on Automobile
Use in Cities: Inferring Causality. Transportation Research Board.
McKenzie, B. (2013). Who Drives to Work? Commuting by Automobile in the United States: 2013. United
States Census Bureau.
Metropolitan Area Planning Council. (2010, February 5). Unbundled Parking. Retrieved from Metropolitan Area
Planning Council: http://www.mapc.org/resources/parking-toolkit/strategies-topic/unbundled-parking
Millard-Ball, A. (2002). Putting on Their Parking Caps. American Planning Association.
National Center for Education Statistics. (2011-2012). Digest of Education Statistics. Retrieved from Table
105.50. Number of educational institutions, by level and control of institution: Selected years, 1980-
81 through 2012-13: https://nces.ed.gov/programs/digest/d14/tables/dt14_105.50.asp
National Center for Safe Routes to School. (2009). Assessing Walking and Bicycling Routes: A Selection of
Tools.

123
National Center for Safe Routes to School. (2011). Safe Routes to School Noteworthy Practices Guide.
Nelson\Nygaard. (2012). Transportation Demand Management Manual Final Report. California State
University.
Nelson\Nygaard Consulting Associates. (October 2015). Parking Matters Technical Report 4.1 Parking
Demand Estimates from Existing and Future Land Use. Chatham County-Savannah Metropolitan
Planning Commission.
NewUrbanism.org. (2017). Principles of Urbanism. Retrieved from New Urbanism:
http://www.newurbanism.org/newurbanism/principles.html
NYC Department of City Planning. (2011). Parking Best Practices: A Review of Zoning Regulations and Policies
in Select US and International Cities. New York City.
NYC Mayor's Office of Environmental Coordination. (2010). CEQR Technical Manual.
Oak Ridge National Laboratory . (2009). Mobility Challenges for Households in Poverty. National Household
Travel Survey.
Pardon, N., & Average, C. (2012). The Effectiveness of Traffic Calming Measures in Reducing Road Carnage in
Masvingo Urban. International Journal of Scientific Knowledge.
Project for Public Spaces. (2009, January 1). Traffic Calming 101. Retrieved from PPS:
http://www.pps.org/reference/livememtraffic/
Revell, J., & Rich, R. (2001, May 1). Calculating your parking needs. Retrieved from American City and County:
http://americancityandcounty.com/mag/government_calculating_parking_needs
Shirouzu, N. (2016, February 9). Millennials are shifting car ownership model; ask Toyota. Retrieved from
Reuters: http://www.reuters.com/article/us-autos-toyota-millennials-idUSKCN0VI295
Shoup, D. (1999). The trouble with minimum parking requirements. Transportation Research Record, Part A
33, 549-574.
Shoup, D. (2002). Roughly Right or Precisely Wrong. Access, 20- 25.
Shoup, D. (2005). The High Cost of Free Parking.
Shoup, D., Yuan, Q., & Jiang, X. (2016). Charging for Parking to FInance Public Services. Journal of Planning
Education and Research, 1 - 14.
Smart Growth America. (2013). Transportation Demand Management State of the Practice. Nelson\Nygaard.
Smith, T. (1983). Flexible Parking Requirements. American Planning Association.
The City of Edmonton. (2016). Factors Affecting Transit Ridership.
The Great Lakes Environmental Finance Center. (2005). Best Practices in Land Bank Operation. Cleveland, OH:
The Ohio Urban University Program.
Transportation Research Board. (2016, March 3). Enhancing Internal Trip Capture Estimation for Mixed-Use
Developments. Retrieved from Transportation Research Board:
http://www.trb.org/Publications/Blurbs/165014.aspx
U.S. Department of Transportation. (2016, September 26). Greenhouse Gas Emissions, Scope 3. Retrieved
from Transportation.gov: https://www.transportation.gov/mission/sustainability/greenhouse-gas-
emissions-scope-3
United States Office of Personnel Management. (2011). Guide to Telework in the Federal Government.
124
Urban Land Institute. (2000). Dimensions of Parking (fourth ed.). Washington, DC.
Victoria Transport Policy Institute. (2015, April 17). Street Reclaiming: Encouraging Community Interaction on
Neighborhood Streets. Retrieved from TDM Encyclopedia: http://www.vtpi.org/tdm/tdm30.htm
Victoria Transport Policy Institute. (2017, January 2). Commute Trip Reduction (CTR). Retrieved from Victoria
Transport Policy Institute: http://www.vtpi.org/tdm/tdm9.htm
Victoria Transport Policy Institute. (2017, February 27). Parking Management Strategies for More Efficient Use
of Parking Resources. Retrieved from Victoria Transport Policy Institute:
http://www.vtpi.org/tdm/tdm28.htm
Washington County, Oregon. (2015). Rightsizing the Parking Code, Technical Memorandum #3: Parking
Management Best Practices. Washington County Long Range Planning Division.
Washington State Department of Transportation. (2017). CTR Law & Program Requirements. Retrieved from
WSDOT: http://www.wsdot.wa.gov/Transit/CTR/law.htm
Wilson, R., & Shoup, D. (1990). Parking Subsidies and Travel Choices: Assessing the Evidence. Berkeley, CA:
University of California Transportation Center.
Zimbler, R. (2002). Driving Urban Environments: Smart Growth Parking Best Practices. Annapolis, MD:
Governor’s Office of Smart Growth.
125
1 Bureau of Economic Analysis (2015). Local Areas Personal Income and Employment: Total Full-Time and Part-Time
Employment by Industry.
2 Washington Metropolitan Area Transit Authority (2017). Metro Facts 2017.
3 MWCOG 2016 State of the Commute Survey – Technical Survey Report. https://www.mwcog.org/assets/1/28/Item__5_-
_2016_SOC_Draft_Technical_Report_092016.pdf
4 https://www.itdp.org/wp-content/uploads/2014/07/ITDP_US_Parking_Report.pdf
5 Norton, Peter, Fighting Traffic (Cambridge: MIT Press, 2008), p. 175. 6 “Off Street Parking and Loading in the District of Columbia Preliminary Report Number 6 of the Rezoning Study of the District
of Columbia;” prepared by Harold M. Lewis for the Washington Zoning Revision Office: April 1956.
7 In the 1956 study (see footnote 6), of the 34 largest buildings under GSA control, only five are outside the District of
Columbia. They are Bureau of Yards end Docks, Tempo 7 (Gravelly Point), the Pentagon, Federal Office Buildings 3 and 4
(Suitland), and Federal Office Building 2 (Navy Annex). Of the remaining 29, two are located in the potential C-5 or
Central Office District. These are the Lafayette Building at H Street and Vermont Avenue, N. w., and the Veterans
Administration, on the opposite side of Vermont at H Street, N.W. Most of the GSA buildings are located in the Federal
Triangle, Federal Rectangle, and north and south Mall areas.
8 http://www.govexec.com/pay-benefits/pay-benefits-watch/2013/03/commuter-benefit-chase/62126/
9 Subchapter C—Real Property §102-74.310
10 General Services Administration PBS-P100 Facilities Standards for the Public Buildings Service Issued April 2017 11 General Services Administration. (2017, January 19). GSA provides the best value for government and the American
people in real estate, acquisition, and technology. Retrieved from GSA.gov:
https://gsa.gov/portal/content/154498
12 General Services Administration. (n.d.). The Structure of Tomorrow. Retrieved from GSA.gov:
https://www.gsa.gov/sustainability/#/buildings
13 General Services Administration. (n.d.). Buy Green Vehicles. Retrieved from GSA.gov:
https://www.gsa.gov/portal/content/105378
14 General Services Administration. (n.d.). Electric Vehicle Pilot Program. Retrieved from GSA.gov:
https://www.gsa.gov/portal/content/281581
15 General Services Administation. (n.d.). Car Sharing. Retrieved from GSA.gov:
https://www.gsa.gov/portal/content/199127 16 GSA Instructional Letter OAS IL-12-1 (Extended) Paid Parking for GSA Employees in the National Capital Region
17 https://www.wbdg.org/FFC/DOD/UFC/ufc_2_100_01_2012.pdf
18 DoD UFC 2-000-02AN Installation Master Planning – 2-2.1 Compact Development.
19 DoD UFC 2-000-02AN Installation Master Planning – 2-2.8 Low Impact Development and Stormwater Management
20 DoD UFC 2-000-02AN Installation Master Planning – 2-6.1 Capacity Planning and Parking.
21 Better Military Traffic Engineering: Parking Calculator
https://www.sddc.army.mil/sites/TEA/Functions/SpecialAssistant/TrafficEngineeringBranch/BMTE/calcParking/parking
Tutorials/Pages/parkingDemand.aspx
22 https://www.citylab.com/design/2017/06/the-military-declares-war-on-sprawl/530529/
23 SDDCTEA Pamphlet 55-15 Traffic and Safety Engineering for Better Entry Control Facilities 2014 US Army Military
Surface Deployment and Distribution Command Transportation Engineering Agency
24 U.S. Department of the Interior | National Park Service. 2015 Green Parks Performance Brief
25 U.S. Department of the Interior | National Park Service. Green Parks Plan: Advancing Our Mission Through Sustainable
Operations. Spring 2016
26 U.S. Department of the Interior | National Park Service. Transportation Planning Guidebook 1999
27 U.S. Department of the Interior | National Park Service Management Policies 2006
28 U.S. Department of the Interior | National Park Service. Green Parks Plan: Advancing Our Mission Through Sustainable
Operations. Spring 2016
29 See page 19 of IRS Pub 15-B, Employer’s Tax Guide to Fringe Benefits, https://www.irs.gov/pub/irs-pdf/p15b.pdf 30 American Planning Association. (2002). Parking Standards. (M. D. Dolnick, Ed.) Chicago, IL: American Planning
Association. 31 McCahil, C., Garrick, N., Atkinson-Palombo, C., & Polinski, A. (2015). Effects of Parking Provision on Automobile Use in
Cities: Inferring Causality. Transportation Research Board. 32 American Planning Association. (2002). Parking Standards. (M. D. Dolnick, Ed.) Chicago, IL: American Planning
Association. 33 Zimbler, R. (2002). Driving Urban Environments: Smart Growth Parking Best Practices. Annapolis, MD: Governor’s Office
of Smart Growth.

126
34 Institute of Transportation Engineers. (2010). Parking Generation (4 ed.). Washington, DC: Institute of Transportation
Engineers
35 Revell, J., & Rich, R. (2001, May 1). Calculating your parking needs. Retrieved from American City and County:
http://americancityandcounty.com/mag/government_calculating_parking_needs 36 Oak Ridge National Laboratory . (2009). Mobility Challenges for Households in Poverty. National Household Travel
Survey. 37 Shirouzu, N. (2016, February 9). Millennials are shifting car ownership model; ask Toyota. Retrieved from Reuters:
http://www.reuters.com/article/us-autos-toyota-millennials-idUSKCN0VI295
38 Zimbler, R. (2002). Driving Urban Environments: Smart Growth Parking Best Practices. Annapolis, MD: Governor’s Office
of Smart Growth.
39 Revell, J., & Rich, R. (2001, May 1). Calculating your parking needs. Retrieved from American City and County:
http://americancityandcounty.com/mag/government_calculating_parking_needs
40 Ibid.
41 Zimbler, R. (2002). Driving Urban Environments: Smart Growth Parking Best Practices. Annapolis, MD: Governor’s Office
of Smart Growth.
42 Revell, J., & Rich, R. (2001, May 1). Calculating your parking needs. Retrieved from American City and County:
http://americancityandcounty.com/mag/government_calculating_parking_needs
43 Zimbler, R. (2002). Driving Urban Environments: Smart Growth Parking Best Practices. Annapolis, MD: Governor’s Office
of Smart Growth. 44 Shoup, D. (2005). The High Cost of Free Parking. 45 American Planning Association. (2002). Parking Standards. (M. D. Dolnick, Ed.) Chicago, IL: American Planning
Association. 46 Chicago Metropolitan Agency for Planning. (2016). Parking Supply Management Strategies. Retrieved from
cmap.illinois.gov: http://www.cmap.illinois.gov/about/2040/supporting-materials/process-archive/strategy-
papers/parking/supply-management-strategies 47 Chicago Metropolitan Agency for Planning. (2016). Parking Supply Management Strategies. Retrieved from
cmap.illinois.gov: http://www.cmap.illinois.gov/about/2040/supporting-materials/process-archive/strategy-
papers/parking/supply-management-strategies
48 Urban Land Institute. (2000). Dimensions of Parking (fourth ed.). Washington, DC. 49 Shoup, D. (2002). Roughly Right or Precisely Wrong. Access, 20- 25. 50 Nelson\Nygaard Consulting Associates. (October 2015). Parking Matters Technical Report 4.1 Parking Demand
Estimates from Existing and Future Land Use. Chatham County-Savannah Metropolitan Planning Commission. 51 Zimbler, R. (2002). Driving Urban Environments: Smart Growth Parking Best Practices. Annapolis, MD: Governor’s Office
of Smart Growth.
52 Institute of Transportation Engineers. (2010). Parking Generation (4 ed.). Washington, DC: Institute of Transportation
Engineers
53 Ibid.
54 Shoup, D. (1999). The trouble with minimum parking requirements. Transportation Research Record, Part A 33, 549-
574.
55 District Department of Transportation. (2014). Trip Generation Data Collection in Urban Areas. Washington, DC:
Nelson\Nygaard 56 National Center for Education Statistics. (2011-2012). Digest of Education Statistics. Retrieved from Table 105.50.
Number of educational institutions, by level and control of institution: Selected years, 1980-81 through 2012-13:
https://nces.ed.gov/programs/digest/d14/tables/dt14_105.50.asp 57 Shoup, D. (2002). Roughly Right or Precisely Wrong. Access, 20- 25. 58 Institute of Transportation Engineers. (2010). Parking Generation (4 ed.). Washington, DC: Institute of Transportation
Engineers .
59 Bochner, B., Hooper, K., Sperry, B., Dunphy, R., & Board, T. R. (2011). Enhancing Internal Trip Capture Estimation for
Mixed-Use Developments. Washington, DC: Transportation Research Board. 60 Litman, T. (2016). Parking Management, Strategies, Evaluation, and Planning. Victoria Transport Policy Institute. 61 Washington County, Oregon. (2015). Rightsizing the Parking Code, Technical Memorandum #3: Parking Management
Best Practices. Washington County Long Range Planning Division.
62 Ibid. 63 Litman, T. (2016). Parking Management, Strategies, Evaluation, and Planning. Victoria Transport Policy Institute.
64 https://www.sustain.ucla.edu/wp-content/uploads/STP-Report-FINAL-v3.pdf
65 https://www.sustain.ucla.edu/our-initiatives/transportation/
66 http://www.naiop.org/en/Magazine/2016/Winter-2016-2017/Development-Ownership/Microsofts-Commute-Program-
Keeps-Employees-Moving.aspx
67 https://www.microsoft.com/about/csr/environment/carbon/operations/

127
68
http://wstc.wa.gov/Meetings/AgendasMinutes/agendas/2010/July13/documents/20100713_BP8_MicrosoftConnecto
rCommuteFactSheet.pdf
69 Ibid.
70 https://www.nctr.usf.edu/pdf/77604.pdf
71
http://oregon.providence.org/~/media/Files/Providence%20OR%20PDF/Transportation%20management%20plan%20f
or%20Providence%20Portland%20Medical%20Center.pdf 72 http://www.ti.com/corp/docs/csr/2007/environment/AlternativeTransportation.shtml
73 http://actweb.org/wp-content/uploads/2014/12/TDM_Review_XVIII_1.pdf
74 http://www.ti.com/corp/docs/csr/2012/environment/TransCommutingPrograms.shtml
75 http://www.hanscom.af.mil/About-Us/Fact-Sheets/Display/Article/379465/hanscom-commuters/
76 Ibid.
77 https://ddot.dc.gov/sites/default/files/dc/sites/ddot/publication/attachments/tdm-final-report.pdf
78 https://www.montgomerycountymd.gov/dot-
dir/Resources/Files/commuter/GSGTMD%20Advisory%20Committee/TMD%20Overview%20for%20GSGTMDAC%2020
160504.pdf
79 https://arlingtonva.s3.dualstack.us-east-1.amazonaws.com/wp-
content/uploads/sites/5/2016/09/ResidentialParkingWorkingGroup_RecommendationReport.pdf
80 The am and pm peak commuters are typically treated as identical (but with reversed direction) in transportation
engineering. For the purposes of this effort, am and pm travel peaks are referred to simply as “commuting peaks.”
81 For more information about COG (https://www.mwcog.org/) or its travel demand model forecasting process, please
reference the following website: www1.mwcog.org/transportation/activities/models/process.asp.
82 MWCOG 2015 Financially Constrained Long-Range Transportation Plan.
https://www.mwcog.org/documents/2015/10/21/the-financially-constrained-long-range-transportation-plan-clrp-clrp/
83 For information about the MWCOG modeling process, please refer to the MWCOG website at:
www.mwcog.org/transportation/data-and-tools/modeling/.
84 The MWCOG Model differentiates between a SOV, high-occupancy vehicle (HOV), and various truck types, but generates
a single automobile accessibility measure is generated. Similarly, the model differentiates transit accessibility based on
the initial mode used to reach transit (e.g., walking or driving). Here, only the total transit accessibility (using any initial
mode) is considered.
85 Average travel times for the region were identified in the TPB’s 2016 State of the Commute Survey 86 Here ‘current’ refers to the latest data available when each TMP was published, which varies between facilities, as noted
in Table 3.
87 Note that Joint Base Myer Henderson Hall includes the Joint Base McNair facility, but are physically and operationally
separate. 88 The Naval Observatory recently adopted its first Transportation Management Plan in 2014, and the Naval Support
Activity Bethesda committed to attaining NCPC’s 1:3 parking ratio goal through an aggressive TMP, implemented by the
installation in 2009.
89 The Commission “approves master plans for use by the Commission as a guide for future reviews of individual site and
building projects” per U.S.C. §8722(a) and (b)(1)
90 Excerpts from: Gutheim, Frederick and Antoinette J. Lee; Worthy of the Nation; Johns Hopkins University Press; Second
Edition 2006.
91 Ibid.
92 Ibid
93 District of Columbia Motor Vehicle Parking Facility Act of 1942, approved February 16, 1942 (56 Stat. 90). 94 “Off Street Parking and Loading in the District of Columbia Preliminary Report Number 6 of the Rezoning Study of the
District of Columbia;” prepared by Harold M. Lewis for the Washington Zoning Revision Office: April 1956.
95 Of the 34 largest buildings under GSA control, only five are outside the District of Columbia. They are Bureau of Yards
end Docks, Tempo 7 (Gravelly Point), the Pentagon, Federal Office Buildings 3 and 4 (Suitland), and Federal Office
Building 2 (Navy Annex). Of the remaining 29, two are located in the potential C-5 or Central Office District. These are the
Lafayette Building at H Street and Vermont Avenue, N. w., and the Veterans Administration, on the opposite side of
Vermont at H Street, N.W. Naturally most of the GSA buildings are located in the Federal Triangle, Federal Rectangle,
and north and south Mall areas.
96 Employees include patients; parking spaces include visitors’ parking.
97 Employees include base population except dependents.
128
98 Elements of the Comprehensive Plan for the National Capital; September 30, 1969: NCPC 99 For example, Stage 1 Central Area Parking policies specified:
1. Control should be established over the amount, kind and location of parking by means of a public parking
authority. The program should be managed to balance parking space with the capacity of highways entering the
central area.
2. The number of off-street parking spaces in the Central Employment Area should be increased from the existing
70,000 to approximately 90,000 by 1985.
3. Parking should be provided as early as feasible for tourists (4,000 spaces at the National Visitor Center at Union
Station and 3,000 spaces under the Mall) and for workers in the Southwest Employment Area (12,000 spaces).
The remainder of the Central Employment Area parking program should include 4,000 spaces in the Capitol Hill
area, 30,000 spaces for shoppers and downtown worker west of the White House 25,000 spaces for workers,
shoppers and visitors in the areas north, south, and west of the White House and 12,000 spaces for residents in
the Central Employment Area.
4. Approximately 61,000 spaces would be provided in new off-street parking structures including 41,000 spaces replacing
existing surface parking lots and obsolete garage structures. About half of these spaces should be provided through a
public parking program; the remainder is expected to be provided as part of private development or in Federal building
programs.
100 Comprehensive Plan for the National Capital Federal Employment and Federal Facilities Planning Report; September
24, 1982: NCPC.
101 Additional policies:
At Federal Facilities where parking is provided, spaces shall be set aside for Visitors and others conducting
business at the site. The appropriate number of visitor spaces will vary depending upon the nature of the Federal
operation and availability of public transit and commercial parking nearby.
In the Monumental Core, parking for tourists and Visitors, as well as Federal employees, should be provided in
accordance with a long range parking plan developed for the entire Core Area. This plan should include provision
for tourists and visitors at the Union Station Complex.
Employee parking, when provided at Federal Facilities, should be at a level that assumes maximum use of mass
transit, a ratio of car/van pools, and a high number of occupants per car/van pool.
In the deployment of Federal employees, special consideration should be given to employment areas in close
proximity to Metrorail stations.
102 Policy continues: “…Federal employee parking should be provided only to the extent that employees’ needs cannot be
served by public transit or commercial parking. Parking requirements will vary by site and should be established by
technical analysis of site characteristics and location.”
103 Policy continues: “…automobiles should be accommodated on-site to the extent possible. A technical analysis should be
made of the site characteristics, location, and available transit service to determine appropriate parking ratios.”
104 NCPC. Comprehensive Plan for the National Capital: Federal Elements. 1989
105 27 Comp. Gen. 1 (1947); 16 Comp. Gen. 64 (1936).
106 63 Comp. Gen. 270 (1984); 43 Comp. Gen. 131 (1963); B-162021, July 6, 1977
107 16 Comp. Gen. 64 (1936); 3 Comp, Gen. 433 (1924); 5-216602, Jan. 4, 1985.
108 GAO-04-261SP Appropriations Law—Vol. I
109 United States Government Accountability Office, Office of the General Counsel, Principles of Federal Appropriations Law,
Third ED., Vol III, pp. 13-145
110 A 2012 Government Accountability Office decision (72 Comp. Gen. 139 (1993); 49 Comp. Gen. 476 (1970); B-168946,
Feb. 26, 1970; B-155372-O.M., Nov. 6, 1964) clarifies that agencies may use appropriated funds to provide parking to
its employees when necessary to avoid a “significant impairment to the agency’s operating efficiency.” In such
circumstances, the employee parking expense is considered to be a necessary expense of the agency and the agency
head must provide an administrative determination of significant impairment that considers the following factors: (1)
The requirement that executive agencies actively promote the use of ridesharing (carpools, vanpools, privately leased
buses, public transportation, and other multi-occupancy modes of travel) to conserve energy, reduce congestion,
improve air quality, and provide an economical way for federal employees to commute to work. (2) The requirement that
federal agencies located in Washington, DC implement a transit subsidy fringe benefit pursuant to 5 U.S.C. § 7905 to
further the public policy of discouraging commuting by single-occupancy vehicle to improve air quality and reduce traffic
congestion. (3) The requirement that executive agencies make use of their authority to offer flexible arrangements
through telework or flexible work schedules. (4) Assess the impact on recruitment and retention in the face of a smaller
pool of eligible workers. (5) The extent to which parking is subsidized in like circumstances in the non-federal workplace.
(6) Additional GSA factors to consider: the daily hours of employment; the amount of overtime work likely to be
necessary; frequency of public transportation during peak periods; the cost of public transportation; the location of the
residences of the majority of employees in relation to their place of employment and the estimated time required for
travel between home and work; the amount of parking available in the area; and any other relevant factors, including
those concerning the safety of the employees using public transportation. If severely disabled employees are forced to
129
pay parking costs higher than those paid by nondisabled employees working at the same facility, the agency can
subsidize the difference. 63 Comp. Gen. 270 (1984).
111 United States Government Accountability Office, Office of the General Counsel, Principles of Federal Appropriations Law,
Third ED., Vol III, pp. 13-145
112 See generally 40 U.S.C. §§ 581 et seq. GSA regards a delegation of authority to lease parking facilities as a delegation
of authority to enter into a service contract, which can be approved at the regional level, rather than a delegation of
leasing authority. 41 C.F.R. § 102- 73.235 (2003). If an agency has independent statutory or delegated authority to
procure space and facilities and has made the requisite morale and efficiency determinations, it may provide for
employee parking in a collective bargaining. (US General Accountability Office Decision U.S. International Trade
Commission–Use of Appropriated Funds to Subsidize Employee Parking Permits
B-322337: Aug 3, 2012.
113 United States Government Accountability Office, Office of the General Counsel, Principles of Federal Appropriations Law,
Third ED., Vol III, pp. 13-212
114 Id. At 13.146.
115 United States Government Accountability Office, Office of the General Counsel, Principles of Federal Appropriations Law,
Third ED., Vol II, pp. 6-162-163 Appropriations Law, Vo. II, pgs. 6-162 – 6-163
116 Id. At 6-166-6-167.
117 65 Fed. Reg. 24613 (April 21, 2000) 118 Shoup, D. (1999). The trouble with minimum parking requirements. Transportation Research Record, Part A 33, 549-
574. 119 Chicago Metropolitan Agency for Planning. (2016). Parking Supply Management Strategies. Retrieved from
cmap.illinois.gov: http://www.cmap.illinois.gov/about/2040/supporting-materials/process-archive/strategy-
papers/parking/supply-management-strategies
120 NYC Department of City Planning. (2011). Parking Best Practices: A Review of Zoning Regulations and Policies in Select
US and International Cities. New York City.
121 Zimbler, R. (2002). Driving Urban Environments: Smart Growth Parking Best Practices. Annapolis, MD: Governor’s Office
of Smart Growth.
122 American Planning Association. (2002). Parking Standards. (M. D. Dolnick, Ed.) Chicago, IL: American Planning
Association.
123 Ibid. 124 Millard-Ball, A. (2002). Putting on Their Parking Caps. American Planning Association. 125 Victoria Transport Policy Institute. (2017, January 2). Commute Trip Reduction (CTR). Retrieved from Victoria Transport
Policy Institute: http://www.vtpi.org/tdm/tdm9.htm 126 Washington State Department of Transportation. (2017). CTR Law & Program Requirements. Retrieved from WSDOT:
http://www.wsdot.wa.gov/Transit/CTR/law.htm
127 Greater Grand Rapids Bicycle Coalition. (2017). Active Commute Week Challenge. Retrieved from acwgr:
http://acwgr.org/ 128 League of American Bicyclists. (2017). Becoming a Bicycle Friendly Business. Retrieved from Bike League:
http://bikeleague.org/business 129 goDCgo. (2016). Employer Commuter Benefits Toolkit. Washington, DC: District Department of Transportation. 130 Wilson, R., & Shoup, D. (1990). Parking Subsidies and Travel Choices: Assessing the Evidence. Berkeley, CA: University
of California Transportation Center.
131 Association for Commuter Transportation. (2017). Getting to Work: Spotlight on employer-sponsored commuter
programs.
132 Chicago Metropolitan Agency for Planning. (2016). Parking Supply Management Strategies. Retrieved from
cmap.illinois.gov: http://www.cmap.illinois.gov/about/2040/supporting-materials/process-archive/strategy-
papers/parking/supply-management-strategies 133 Victoria Transport Policy Institute. (2017, February 27). Parking Management Strategies for More Efficient Use of
Parking Resources. Retrieved from Victoria Transport Policy Institute: http://www.vtpi.org/tdm/tdm28.htm 134 Metropolitan Area Planning Council. (2010, February 5). Unbundled Parking. Retrieved from Metropolitan Area Planning
Council: http://www.mapc.org/resources/parking-toolkit/strategies-topic/unbundled-parking
135 American Planning Association. (2002). Parking Standards. (M. D. Dolnick, Ed.) Chicago, IL: American Planning
Association
136 NYC Department of City Planning. (2011). Parking Best Practices: A Review of Zoning Regulations and Policies in Select
US and International Cities. New York City. 137 City of Minneapolis. (2009). Minneapolis Bike Parking Regulations Guide. Minneapolis, MN: Department of Public
Works.
138 American Planning Association. (2002). Parking Standards. (M. D. Dolnick, Ed.) Chicago, IL: American Planning
Association.

130
139 National Center for Safe Routes to School. (2011). Safe Routes to School Noteworthy Practices Guide 140 National Center for Safe Routes to School. (2009). Assessing Walking and Bicycling Routes: A Selection of Tools. 141 Koska, T., & Rudolph, F. (2016). The Role of Walking and Cycling in Reducing Congestion: A Portfolio of Measures. 142 Smart Growth America. (2013). Transportation Demand Management State of the Practice. Nelson\Nygaard. 143 United States Office of Personnel Management. (2011). Guide to Telework in the Federal Government. 144 Pardon, N., & Average, C. (2012). The Effectiveness of Traffic Calming Measures in Reducing Road Carnage in Masvingo
Urban. International Journal of Scientific Knowledge. 145 Project for Public Spaces. (2009, January 1). Traffic Calming 101. Retrieved from PPS:
http://www.pps.org/reference/livememtraffic/ 146 Collins, P., & Agarwal, A. (2015). Impacts of public transit improvements on ridership, and implications for physical
activity, in a low-density Canadian city. Preventive Medicine Reports. 147 The City of Edmonton. (2016). Factors Affecting Transit Ridership. 148 Caltrans Division of Research, Innovation and System Information. (2016). Quantifying Passenger Rail Access Mode
Shift . CTC & Associates LLC.
149 BART Planning, Development, and Construction. (2015). BART Station Access Policy Update. 150 NewUrbanism.org. (2017). Principles of Urbanism. Retrieved from New Urbanism:
http://www.newurbanism.org/newurbanism/principles.html 151 Victoria Transport Policy Institute. (2015, April 17). Street Reclaiming: Encouraging Community Interaction on
Neighborhood Streets. Retrieved from TDM Encyclopedia: http://www.vtpi.org/tdm/tdm30.htm 152 Chicago Metropolitan Agency for Planning. (2016). Parking Supply Management Strategies. Retrieved from
cmap.illinois.gov: http://www.cmap.illinois.gov/about/2040/supporting-materials/process-archive/strategy-
papers/parking/supply-management-strategies
153 Zimbler, R. (2002). Driving Urban Environments: Smart Growth Parking Best Practices. Annapolis, MD: Governor’s Office
of Smart Growth.
154 NYC Department of City Planning. (2011). Parking Best Practices: A Review of Zoning Regulations and Policies in Select
US and International Cities. New York City.
155 Ibid. 156 The Great Lakes Environmental Finance Center. (2005). Best Practices in Land Bank Operation. Cleveland, OH: The
Ohio Urban University Program.
157 NYC Department of City Planning. (2011). Parking Best Practices: A Review of Zoning Regulations and Policies in Select
US and International Cities. New York City
158 City of Palo Alto. (2007). Zoning Regulations of the City of Palo Alto. Palo Alto, CA: ProCode.
159 Virginia Department of Transportation’s (VDOT). Level of Service Definitions. Retrieved from VDOT
http://www.virginiadot.org/projects/resources/LOS-defined.pdf