Embed Size (px)
Citation preview

NMR STUDIES OF STRUCTURE AND FUNCTIONOF BIOLOGICAL MACROMOLECULES
Nobel Lecture, December 8, 2002
by
KURT WÜTHRICH
Eidgenössische Technische Hochschule Zürich, CH-8093 Zürich, Switzer-land, and The Scripps Research Institute, 10550 N. Torrey Pines Rd., La Jolla,CA 92037, USA.
INTRODUCTION
Nuclear magnetic resonance (NMR) spectroscopy is unique among the methodsavailable for three-dimensional structure determination of proteins and nucleic acids at atomic resolution, since the NMR data can be recorded in so-lution. Considering that body fluids such as blood, stomach liquid and salivaare protein solutions where these molecules perform their physiological func-tions, knowledge of the molecular structures in solution is highly relevant. Inthe NMR experiments, solution conditions such as the temperature, pH andsalt concentration can be adjusted so as to closely mimic a given physiologicalfluid. Conversely, the solutions may also be changed to quite extreme non-physiological conditions, for example, for studies of protein denaturation.Furthermore, in addition to protein structure determination, NMR applica-tions include investigations of dynamic features of the molecular structures,as well as studies of structural, thermodynamic and kinetic aspects of interac-tions between proteins and other solution components, which may either be
235
Figure 1. NMR structure of theAntennapedia homeodomain(1). A bundle of 20 superim-posed conformers representsthe polypeptide backbone. Forthe polypeptide segment 7–59the tight fit of the bundle indi-cates that the structure is de-fined with high precision,whereas the two chain ends aredisordered.
other macromolecules or low molecular weight ligands. Again, for these sup-plementary data it is of keen interest that they can be measured directly in so-lution.
The NMR structure of the Antennapedia homeodomain (Figure 1) illus-trates one of the exciting features of being able to perform structural studiesin solution. The polypeptide chain in this protein is only partially folded, withboth chain ends showing pronounced disorder (1). In the complex with itsoperator DNA (Figure 2) the N-terminal chain end is located in the minorgroove of the DNA, where it adopts a well-defined structure (2). This mode ofintermolecular recognition illustrates the functional importance of partiallystructured polypeptide chains. Mammalian prion proteins are an even morestriking example of partial polypeptide folding, since the three-dimensionalstructure of the benign “cellular” form (PrPC) includes a flexibly disordered100-residue tail linked to the N-terminal end of a globular domain (Figures 3and 4) (3). Considering that the mechanism of transformation of PrPC intothe aggregated, disease-related form of mammalian prion proteins is still sub-ject to speculation, the observation of this flexible tail has been highly in-triguing.
Partially folded polypeptide chains are usually difficult to crystallize.Furthermore, if crystals can be obtained, the chain segments that are disor-dered in solution will either be ordered by intermolecular contacts in thecrystal lattice, or they will not be visible by diffraction methods. As a conse-quence, NMR has in many cases been the only method capable of providingstructural information on partially folded polypeptides. Although a standardprotocol for NMR structure determination provides a static picture of the un-structured chain segments (Figures 1 and 4) (4), additional NMR experi-
236
Figure 2. NMR struc-ture of the complexformed between theAntennapedia home-odomain (blue, withfunctionally impor-tant residues in red,yellow, green andbrown) and its opera-tor DNA (yellow andred) (2).

ments can provide information on the frequencies of the rate processes thatmediate transitions between discrete states of the molecule within the con-formation space spanned by the static bundle of NMR-conformers (5, 6).
The ability of NMR techniques to characterize macromolecular structuresand their intermolecular interactions with high spatial and temporal resolu-tion has long attracted keen interest. This article reports on experiencegained with NMR studies of proteins in my laboratory during the past 35years (7).
237
Figure 3. NMR struc-ture of the bovineprion protein (3).In the C-terminalglobular domain ofresidues 126–230, �-helices are green,an antiparallel �-sheet is blue, andnon-regular sec-ondary structure isyellow; the “unstruc-tured” N-terminaltail of residues23–125 is white.
Figure 4. Visual im-pression of the varia-tion of the bovineprion protein struc-ture (Figure 3) dur-ing a time period ofabout 1 nanosecond.The superposition of20 snapshots illus-trates that the globu-lar domain main-tains its meangeometry, whereasthe tail undergoeslarge-scale changeswith time.

NMR SPECTRA OF PROTEINS IN SOLUTION
When I joined the field of biomacromolecular NMR spectroscopy in 1967,important qualitative NMR features of amino acids and proteins had alreadybeen noted and tentatively rationalized (8–12). Most important, it had beenwell documented that the spectrum of a globular protein is more complexthan the sum of the NMR lines from the constituent amino acid residues inthe polypetide chain (Figure 5), and the differences between the 1H NMRspectra of folded and unfolded (“random coil”) forms of a polypeptide chainhad been tentatively explained by different interactions with the solvent(Figure 6). The spectral analysis was primarily focused on the positions of theindividual NMR lines in the 1H NMR spectrum, as given by the “chemicalshift”, �, in parts per million (ppm) relative to a reference compound (Figure5). Although the chemical shift is primarily determined by the covalent struc-ture of the amino acid residue, it can also be significantly affected by the in-teractions with the solvent. Therefore, the exclusion of the solvent water fromthe interior of a globular protein (Figure 6) causes the chemical shifts of thecore residues to be different from those of the water-exposed amino acidresidues, so that even NMR lines originating from multiple residues of thesame amino acid type can be distinguished. This “conformation-dependentchemical shift dispersion” was found to be sufficiently large to enable 1HNMR studies of protein denaturation (Figure 7) (12). This then indicated theexciting prospect of using NMR for detailed studies of protein folding, and inparticular for distinguishing between two-state and multiple-state folding andunfolding transitions. For me, the observations and ideas illustrated byFigures 5 to 7 also showed that one would need the ability of resolving and an-alyzing highly complex NMR spectra (upper trace in Figure 5) in order to ob-tain information about physiologically active, folded forms of proteins. Thiswas a clearly defined problem that appeared sufficiently challenging to be at-tractive for my own research.
238
Figure 5. One-dimensional (1D) 1H NMRspectra of the small protein bovine pancre-atic trypsin inhibitor (BPTI, M ≈ 6000).Top: Experimental spectrum of folded, ac-tive BPTI in a freshly prepared 2H2O-solu-tion. Bottom: Simulated spectrum for theunfolded, random coil form of the BPTIpolypeptide chain.

In attempts at rationalizing in more detail the observations of Figures 5and 7, it had been suggested that local magnetic fields generated by “ring cur-rents” in the aromatic amino acid side chains (Figure 8) should cause out-standingly large conformation-dependent chemical shifts of hydrogen atomslocated near the rings in the three-dimensional protein structure. This wasqualitatively confirmed by comparison of the largest observed deviationsfrom random coil chemical shifts (4) in hen egg white lysozyme (Figure 7)with calculations of the “ring current shifts” based on the then-available low-resolution crystal structure of this protein (12). It had also been pointed outthat hemoproteins could be expected to have particularly large ring currentshifts for hydrogen atoms located near the heme groups (Figure 9) (10,12).
For my start in the field of NMR with proteins, the prediction of unique,large heme ring current shifts seemed to be an attractive feature of hemo-
239
Figure 6. Scheme illustratingthat the solvent (blue) hasfree access to all parts of a ran-dom coil polypeptide chain(rc), whereas it is excludedfrom the core of a foldedglobular protein.
Figure 7. Low-field and high-field regions of 1D 1H NMRspectra of the protein lysozymeat different temperatures, re-flecting the transition from thefolded form at 56 °C to therandom coil form of thepolypeptide chain at 73 °C(220 MHz, H2O-solution)(adapted from ref. 12).

proteins, and the presence of the heme iron (Figure 9) was appealing in viewof my background in inorganic chemistry. As an additional advantage, low-resolution crystal structures for several hemoproteins were already availablein 1967. It turned out that for several years nearly all my research projectswere focused on the heme iron and its coordinatively linked ligands, and onthe non-bonding interactions of the heme groups with their immediate envir-onment in the hemoproteins.
240
Figure 8. Local “ring current field” aroundaromatic rings in solution induced by an ex-ternal, static magnetic field. The shape ofthe ring current field is indicated by the reddouble-cone and by broken magnetic-field-lines. The minus-sign indicates that theNMR lines of hydrogen atoms located in-side the cone in the three-dimensional pro-tein structure are shifted “upfield” (to theright in the spectra of Figure 5), whereasfor atoms outside of the cone the shifts are“downfield”.
Figure 9. Chemical structure of heme c,which is the prosthetic group in cyto-chromes c. The red arrows connect groupsof hydrogen atoms in the covalent structureof heme c that are separated by a sufficient-ly short distance to be connected by nuclearOverhauser effects (NOE).

As anticipated, the large heme ring current field generates a small numberof well-separated resonance lines in the spectra of folded, globular hemopro-teins (Figure 10). For the paramagnetic states of hemoproteins, additionalwell-resolved lines result from interactions with the unpaired electrons of theheme iron. Although they represented less than 3% of all the hydrogenatoms in any given hemoprotein, the well-resolved resonances were of crucialimportance, because these lines could be selectively irradiated in 1D 1H NMRexperiments. For example, performing some simple ligand exchange and re-dox reactions with cytochrome c (Figure 11) resulted in the identification ofone of the axial ligands bound to the heme iron, which had not been seen inthe low resolution X-ray crystal structure available in 1969.
The experiments in Figure 11 (13) started with the oxidised form of cyto-chrome c. As was then learned through this study (see below), ferricyto-
241
Figure 10. 1D 1H NMR spectrum (360 MHz, 52°C, solvent 2H2O) of horse ferrocytochrome c (M ≈ 12000).
Figure 11. Three chemical reaction steps with cytochrome c that were used to identify me-thionine as one of the axial ligands of the heme iron (13). The roman numerals indicatethe oxidation state of the heme iron, and His stands for the amino acid residue histidine.The solid and broken arrows indicate rapid and slow reaction steps, respectively. Colourcode: black, heme iron with ligands, where the horizontal line through Fe represents a sideview of the heme c ring (Figure 9); blue, chemicals added to the protein solution; red, newstructural features resulting from the preceding reaction.

chrome c contains a methionine side chain of its polypeptide chains in one ofthe axial heme iron coordination sites. Upon addition of KCN to the proteinsolution, this methionine is replaced in the binding site on the heme iron bya cyanide ion, and therefore moves out of the heme ring current field. Thecompletion of this reaction can readily be monitored, since different patternsof well-resolved resonance lines are present in the 1H NMR spectra of ferricyto-chrome c and its cyanide complex, respectively. After reduction of the hemeiron to the ferrous state, the cyanide complex is thermodynamically less stablethan the native form of cytochrome c, and in a slow reaction the cyanide inthe axial coordination site of the heme iron is again replaced with the naturalmethionine ligand. The return of the axial methionine into the heme ringcurrent field was monitored in real time (Figure 12) by the appearance of itstypical high-field lines in the 1H NMR spectrum (Figure 10). This experimentresulted in the identification of the nature of this axial ligand in the native, ac-tive form of cytochrome c, and further yielded information on the relativethermodynamic stabilities of the four different structures in Figure 11.
As a sideline, comparison of the figures 10 and 12 illustrates the influenceof various experimental factors on the appearance of the NMR spectra. Thehigher resonance frequency and the high temperature used in the experi-ment of Figure 10, which was recorded around 1980 with Fourier transformspectroscopy, resulted in narrower and more clearly separated peaks in theregion 0 to -5 ppm than the experiment in Figure 12, which was recorded in1968 with continuous-wave NMR spectroscopy at low temperature.
Other early experiments based on the observation of well-resolved reso-nances in the 1H NMR spectra of hemoproteins resulted in the characteriza-tion of conformation changes during the oxygenation of myoglobin and he-
242
Figure 12. Changes with time in the 1D 1H NMR spec-trum of cytochrome c after reducing the ferriccyanide complex with dithionite (220 MHz, 9°C, sol-vent 2H2O).

moglobin (14, 15), and to detailed characterization of the electronic struc-ture of the heme groups in different classes of hemoproteins (16–18).
THE WAY TO NMR STRUCTURES OF PROTEINS
Around 1970 there was a lot of enthusiasm in my laboratory and elsewhereabout the success of experiments of the types illustrated by Figures 5 to 12.During the following years, however, there was little further progress towardan NMR method for de novo structure determination of proteins. In hindsightthis can readily be rationalized: Early successful structural interpretations ofNMR data invariably supplemented a previously known low resolution X-raycrystal structure of the same protein. In spite of the high symmetry of thering current fields (Figure 8) and other sources of local conformation-de-pendent chemical shifts, including natural paramagnetic centers and extrin-sic “paramagnetic shift reagents” (17, 19), the observed chemical shifts couldthus in some instances yield exciting new information. In a de novo proteinstructure determination, however, the high symmetry of the local magneticfields would lead to ambiguities in the structural interpretation of the result-ing chemical shifts. Different approaches were therefore called for, and even-tually a NMR method for protein structure determination could be based onthe following four principal elements:
1. Measurement of NOE upper distance limits as conformational constraintsNuclear Overhauser effects (NOE) are due to dipolar interactions betweendifferent nuclei. The intensity of the NOE is related to the product of the in-verse sixth power of the internuclear distance and a correlation function,f(�c), which describes the modulation of the dipole–dipole coupling by sto-chastic rate processes, with an effective correlation time �c :
243
Although the NOE is a common phenomenon for all combinations ofclosely spaced nuclear spins, NOEs between pairs of hydrogen atoms are ofprime interest for structural studies. A 1H–1H NOE is related to the “through-space” distance between a pair of atoms that are either not at all linked by co-valent bonds (intermolecular NOE), or that may be far apart in the aminoacid sequence of a polypeptide chain. 1H–1H NOEs can be observed in dou-ble-irradiation 1D NMR experiments as the fractional change in intensity of aNMR line that results from preirradiation of another resonance (inset inFigure 13). Although NOE distance measurements had successfully beenused for studies of small organic molecules (20), including oligopeptides(21), and observation of NOEs in proteins had also been reported (22, 23), itwas not clear whether the desired distance information could actually be ob-tained in proteins (20, 24, 25). This uncertainty arose because the Brownianmotions of large structures in solution are slow, with long effective correla-

tion times, �c, for this stochastic process, and proteins contain a dense net-work of hydrogen atoms. With the combination of these two features, “spindiffusion” could partially or fully deteriorate distance measurements basedon 1H–1H NOE experiments (24 – 28).
In the solution NMR experiments discussed here, spin diffusion arises as aconsequence of the dependence of the NOE on the inverse sixth power ofthe internuclear distance, since magnetization transfer between two spinsthrough multiple short steps may be more efficient than a one-step transferover the longer, direct distance (Figure 14). We used 1D transient NOE dif-ference experiments (inset in Figure 13) (26) and 1D truncated-driven NOE(TOE) difference experiments (27) to record “NOE build-up curves” (Figure13), which then provided a basis for 1H–1H distance measurements in macro-molecules. These studies showed that even more favourable conditions forNOE distance measurements can be found in macromolecules, which havelong effective correlation times for the modulation of dipole–dipole coup-lings, than in low-molecular-weight compounds, for which the condition of“extreme motional narrowing” applies (24, 28).
Analysis of 1H–1H NOE build-up curves recorded with 1D transient NOEexperiments (Figure 13) is based on the consideration that during the earlyphase of the mixing period, direct magnetization transfer from spin 1 to spin3 (Figure 14) will result in a linear increase of the magnetization on spin 3with time. In contrast, transfer to atom 3 via an intermediate step throughatom 2 will have a lag period, even though for long mixing periods, �, the ex-tent of the magnetization transfer by such “spin diffusion” may for individualpairs of hydrogen atoms exceed that of the direct transfer (Figure 13).
244
Figure 13. NOE build-up curves observed with 1D transient [1H,1H]-NOE measurements(26). The relative intensities, Irel, of the pre-irradiated resonance line (broken curve) andof the lines experiencing NOEs (solid curves) are plotted versus the duration of the mixingperiod, �. The experimental scheme used to record transient NOE spectra (inset in the up-per right) includes a selective 180° radio-frequency pulse applied to the “pre-irradiated” 1HNMR line, and a non-selective 90°-pulse applied to the entire 1H NMR spectrum. The twopulses are separated by the mixing period, �, and followed by signal acquisition. Whenworking with the crowded spectra of proteins, one records the difference between two spec-tra obtained with the pre-irradiation 180°(1H)-pulse applied on- and off-resonance, re-spectively.

Corresponding considerations apply for the analysis of NOE build-up curvesrecorded with truncated-driven NOE experiments (27). With proper selec-tion of the duration of the mixing period, one can thus measure highly se-lective 1H–1H NOEs between distinct pairs of hydrogen atoms, or groups ofchemical shift-equivalent hydrogen atoms in proteins in solution.
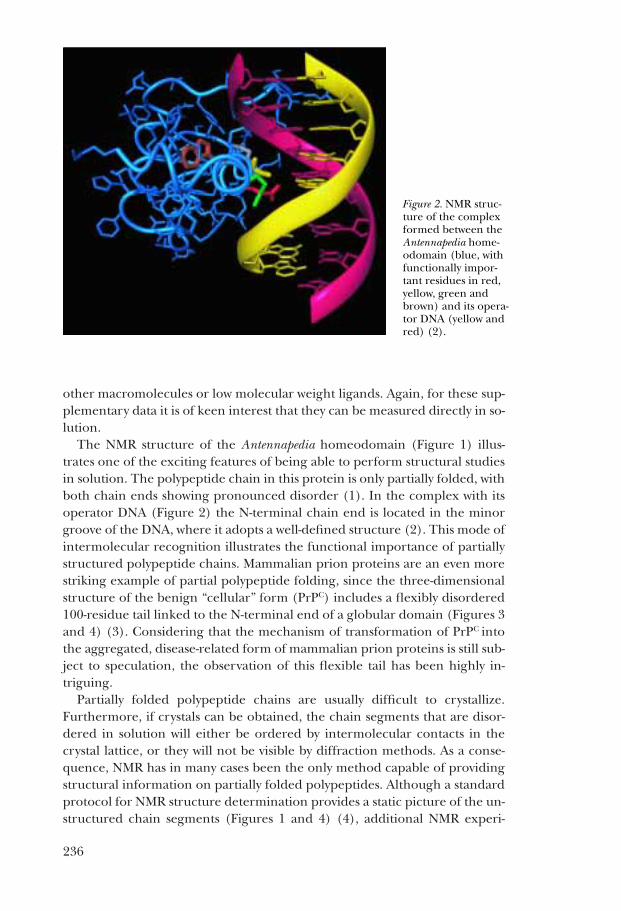
There is a second criterion that needs to be satisfied for obtaining selectiveNOEs with 1D NMR experiments, i.e., at least one of the two lines that are con-nected by the NOE must be sufficiently well resolved (i.e, separated from allother lines in the spectrum) to enable selective radio-frequency pre-irradia-tion (inset in Figure 13). The previously discussed well-resolved lines in the 1HNMR spectrum of ferrocytochrome c (Figure 10) thus had again an importantrole in enabling us to study the spin physics in the interior of this globular pro-tein with 1D 1H NMR experiments, as well as to obtain novel structural infor-mation. The figure 15 shows a series of highly selective 1D truncated-drivenNOE measurements, which were used to determine 1H NMR assignments forthe heme group in a c-type cytochrome (Figure 9) (29).
2. Sequence-specific resonance assignments Similar to the situation in heme groups (Figure 9), there are closely spacedpairs of hydrogen atoms in neighbouring residues of a polypeptide chain(Figure 16). These can be connected by the observation of “sequentialNOEs”. The figure 16 illustrates that NOE-based 1H NMR assignments for apolypeptide chain can conceptually be considered as a 2-step process. Eachamino acid residue represents a “spin system” (4), i.e., it consists of an array ofhydrogen atoms including an amide proton (HN), an �-proton (H�), and theside chain protons, which can be connected by steps over three or less cova-lent bonds through the observation of scalar spin–spin (“through-bond”)couplings (see (4) for the exceptions represented by proline and the aromat-ic side chains). In contrast, hydrogen atoms located in sequentially neigh-bouring amino acid residues are separated by at least four covalent bonds.Pairs of neighbouring residues in the sequence can therefore only be con-nected via NOEs manifesting short through-space distances, such as d�N anddNN. Suitable combinations of intraresidual 1H–1H connectivities establishedby scalar spin–spin couplings, and inter-residue connectivities established bysequential NOEs enable progressive resonance assignments while “walking
245
Figure 14. Spin diffusion.Transfer of magnetizationbetween two hydrogenatoms 1 and 3 in the pres-ence of additional hydrogenatoms goes through twocompeting paythways, i.e.,the direct NOE across thedistance r1,3, and two- ormultiple-step spin diffusionvia intervening hydrogenatoms.
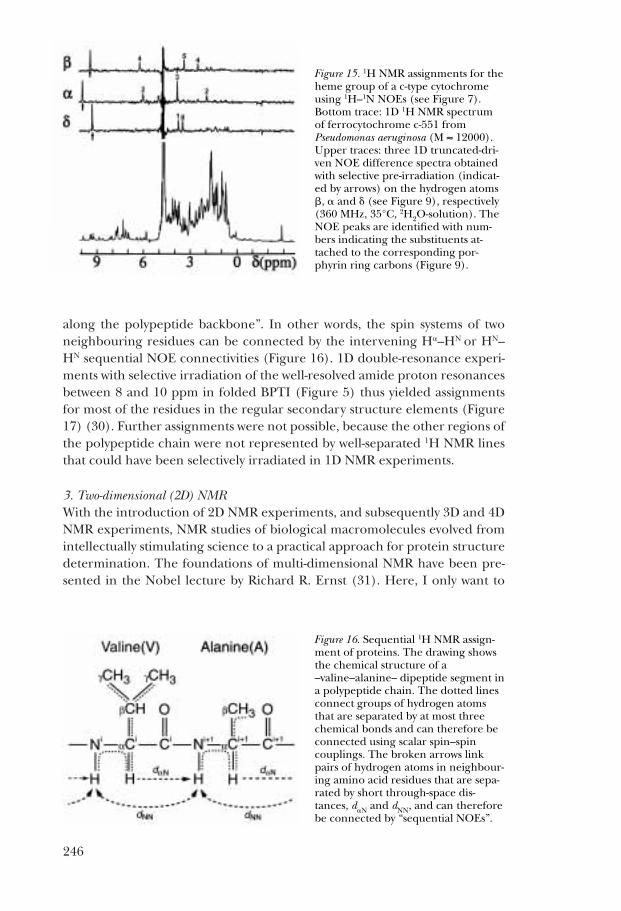
along the polypeptide backbone”. In other words, the spin systems of twoneighbouring residues can be connected by the intervening H�–HN or HN–HN sequential NOE connectivities (Figure 16). 1D double-resonance experi-ments with selective irradiation of the well-resolved amide proton resonancesbetween 8 and 10 ppm in folded BPTI (Figure 5) thus yielded assignmentsfor most of the residues in the regular secondary structure elements (Figure17) (30). Further assignments were not possible, because the other regions ofthe polypeptide chain were not represented by well-separated 1H NMR linesthat could have been selectively irradiated in 1D NMR experiments.
3. Two-dimensional (2D) NMRWith the introduction of 2D NMR experiments, and subsequently 3D and 4DNMR experiments, NMR studies of biological macromolecules evolved fromintellectually stimulating science to a practical approach for protein structuredetermination. The foundations of multi-dimensional NMR have been pre-sented in the Nobel lecture by Richard R. Ernst (31). Here, I only want to
246
Figure 15. 1H NMR assignments for theheme group of a c-type cytochromeusing 1H–1N NOEs (see Figure 7).Bottom trace: 1D 1H NMR spectrumof ferrocytochrome c-551 fromPseudomonas aeruginosa (M ≈ 12000).Upper traces: three 1D truncated-dri-ven NOE difference spectra obtainedwith selective pre-irradiation (indicat-ed by arrows) on the hydrogen atoms�, � and � (see Figure 9), respectively(360 MHz, 35°C, 2H2O-solution). TheNOE peaks are identified with num-bers indicating the substituents at-tached to the corresponding por-phyrin ring carbons (Figure 9).
Figure 16. Sequential 1H NMR assign-ment of proteins. The drawing showsthe chemical structure of a–valine–alanine– dipeptide segment ina polypeptide chain. The dotted linesconnect groups of hydrogen atomsthat are separated by at most threechemical bonds and can therefore beconnected using scalar spin–spincouplings. The broken arrows linkpairs of hydrogen atoms in neighbour-ing amino acid residues that are sepa-rated by short through-space dis-tances, d�N and dNN, and can thereforebe connected by “sequential NOEs”.

comment on two crucial consequences of multi-dimensional NMR for studiesof proteins. First, 2D 1H NMR enables the recording of selective interactionsbetween pairs of hydrogen atoms, or groups of chemical shift-equivalent hy-drogen atoms, without selective irradiation of individual resonance lines. Itthus enables a detailed analysis of the entire 1H NMR spectrum of a protein,which contrasts with the 1D NMR situation of being limited to using only asmall number of resolved lines at the periphery of the spectrum. Second, thedispersion of the resonances in a two-dimensional frequency plane affordsgreatly improved separation of the individual peaks. For example, in Figure18 the intense lines on the diagonal from the lower left to the upper rightcorrespond to the 1D NMR spectrum, and the weak “cross peaks” in theplane outside of the diagonal manifest selective NOEs between pairs of
247
Figure 17. Sequence-spe-cific resonance assign-ments for BPTI thatwere obtained using 1D1H NMR experiments(30). The polypeptidebackbone is shown, andthe assigned residuesare identified by indica-tion of hydrogen bondswith their amide pro-tons (the colour codeindicates variable ex-change rates of theamide protons with thesolvent; drawing by JaneRichardson, 1980).
Figure 18. Two-dimen-sional (2D) [1H,1H]-NOE spectroscopy([1H,1H]-NOESY). Astacked plot representa-tion of a spectrum ofthe small protein bullseminal proteinase in-hibitor IIA (BUSI IIA,M ≈ 6000) is shown(500 MHz, 45°C, H2O-solution).

248
Figure 19. 2D [1H,1H]-NOESY spectrum of theplant pathogenesis-relatedprotein P14A (M ≈ 15000).A contour plot of the spec-tral region [�1(
1H) = 0 – 4.3ppm, �2(
1H) = 6.3 – 9.5ppm] is shown (750 MHz,30°C, H2O-solution).
Figure 20. Measurement ofNOE build-up curves using2D [1H,1H]-NOESY experi-ments. (A) Six NOESY spec-tra of BPTI recorded withdifferent mixing times, asindicated on the left. Thesame 1D cross-section alongthe �1 frequency axisthrough the diagonal peakof the Phe 33 amide protonis plotted for each spec-trum. (B) NOE build-upcurves obtained from theanalysis of the data in (A);same presentation as inFigure 13, with the relativeintensities of the NOESYcross peaks plotted versusthe length of the mixingtime, �m, and the brokenline representing the decayof the magnetization on thediagonal peak of the Phe 33amide proton.

249
hydrogen atoms, which are represented in the NMR spectrum by two distinct(but not necessarily “resolved”) chemical shift positions along the diagonal.The greatly improved separation of the individual cross peaks is best seen incontour plots of 2D NMR spectra (Figure 19), which is the presentation usedfor detailed analysis. The 1D decoupling experiments for the identification ofscalar spin–spin couplings were thus replaced by 2D correlation experiments,such as COSY, SECSY and FOCSY, and the 1D NOE difference experimentswere replaced by 2D [1H,1H]-NOESY, which yielded similar NOE build-upcurves for each NOESY cross peak (Figure 20) as the 1D transient NOE tech-nique (Figure 13) (4, 32, 33). Using these 2D 1H NMR experiments, com-plete sequence-specific resonance assignments could be obtained for the pro-tein BPTI (Figure 21) (34).
The “NOESY-COSY connectivity diagram” in Figure 22 (4, 35) makes use ofthe fact that standard 2D [1H,1H]-COSY and 2D [1H,1H]-NOESY spectra aresymmetrical with respect to the diagonal peaks. Combining the upper lefthalf of a NOESY spectrum with the lower right half of a COSY spectrumtherefore enables a straightforward visualization of assignments by a succes-sion of d�N sequential NOEs and intraresidual HN–H� scalar coupling con-nectivities. The data were recorded in a freshly prepared solution of BPTI in2H2O, where only the resonances of the slowly exchanging amide protons areseen (35). The assignments start with the COSY cross peak identified by ablack square and, as indicated by the arrows, go clockwise to the sequentiallypreceding isoleucine residue, and counter-clockwise to a sequence of fourresidues. It is customary that the data leading to the 1H NMR assignments ofa protein are collected in a plot versus the amino acid sequence (Figure 23).The figure 23 shows that most of the sequential connectivities are indepen-dently documented by two or three different sequential NOEs (4, 36), andthat possible remaining gaps in the assignment pathway are readily recog-nized in this presentation.
Figure 21.Complete se-quence-specific res-onance assign-ments for BPTIobtained using 2DNMR experiments(34). Assignedresidues are identi-fied by colouredpatches coveringtheir amide pro-tons. (The colourcode indicates vari-able amide protonexchange rates;drawing by JaneRichardson, 1982).

4. Structural interpretation of NOE distance constraintsA polypeptide chain with 100 amino acid residues has a length of about 400 Å, whereas NOE-observable distances are shorter than about 5 Å.Observation of a NOE between a pair of hydrogen atoms with assigned chem-ical shift positions therefore enforces the formation of a ring-like structure(Figure 24). A successful structure determination generates three-dimen-sional arrangements of the polypeptide chain that simultaneously contain all
250
Figure 23. Standard presentation of 1H NMR data leading to sequence-specific resonance as-signments and the identification of regular secondary structures in proteins. Experimentaldata plotted versus the amino acid sequence are shown for the small pheromone protein Er -1from Euplotes raikovii (M ≈ 4500). JHN� are scalar spin–spin coupling constants, with smalland big values indicated by filled and empty circles, respectively. dNN, d�N and d�N are dis-tances manifested in sequential NOEs, where strong and weak sequential NOEs are indi-cated by a thick or a thin line, respectively. Small values of the distances d�N(i,i+3),d��(i,i+3) and d�N(i,i+4) are observed by medium-range NOEs linking the given atom typesbetween residues spaced as indicated in the parentheses, and by the short horizontal lines.The locations of three �-helices are indicated at the bottom.
Figure 22. NOESY-COSYconnectivity diagram forsequential 1H NMR as-signments using the d�Nsequential NOEs. Thedata was recorded withBPTI in 2H2O solution.(see text).

the small and large circular structures imposed by the ensemble of all NOESYcross peaks.
Partial structure determination has been be obtained by an empirical ap-proach for the identification of regular secondary structures in polypeptidechains, which relies on recognizing distinct patterns of NOEs (4, 37). For ex-ample, in Figure 23 a succession of strong sequential dNN NOEs in combina-tion with the observation of medium-range NOEs in the same polypeptidesegment identifies three �-helical structures, which are independently also in-dicated by successions of small values for the scalar spin–spin couplings 3JHN�
(4, 38). For the calculation of complete three-dimensional protein structures from
NMR data (39), it was quite clear from the outset that an input of quantitativeNOE distance measurements would be difficult to obtain. The observedNOEs depend on the proton–proton distance, r, as well as on the effective ro-tational correlation times, �c (Equation [1]). Since for each pair of hydrogenatoms the effective �c-value is governed not only by the overall rotational mol-ecular tumbling (Brownian motions), which depends on the size and shapeof the protein as well as on the viscosity of the solvent, but can also be affect-ed by intramolecular motions, f (�c) may vary for different pairs of hydrogenatoms in a protein molecule. Additional ambiguities could arise from partialquenching of individual 1H–1H NOEs by competitive spin relaxation process-es, for example, spin diffusion (Figure 14), chemical or conformational ex-change, and interactions with other nuclear or electronic spins. Furthermore,as a result of rapid intramolecular mobility, a given NOE may be the result ofsampling over a range of distances between the two hydrogen atoms of inter-est (40). In view of these intrinsic limitations for efficient quantitative NOEdistance measurements, we decided to use a constant value of the correlation
251
Figure 24. Scheme indicating the rela-tions between an experimental 2D[1H,1H]-NOESY spectrum, a polypep-tide with the chain ends indicated byN and C, sequence-specific assign-ments for two hydrogen atoms in thepolypeptide chain indicated by cir-cles, and the NOE upper distanceconstraint derived from the NOESYcross-peak connecting the chemicalshift positions of the two assigned hydrogen atoms (see text).

function, f (�c) (Equation [1]), for all 1H–1H combinations in a protein, andto derive only upper limits on the 1H–1H distances from the NOE measure-ments. In practice, the input for a structure calculation then consists of al-lowed distance ranges, which are bounded by a NOE upper limit of 3.0 to 5.0 Å,depending on the intensity of the NOE, and a lower limit of 2.0 Å, which rep-resents the sum of the van der Waals radii of the two NOE-connected hydro-gen atoms. Although each individual entry in the input data thus has onlylimited precision, this procedure is robust and can conceptually account forthe influence of intramolecular mobility in most of the situations that arecommonly expected for the structured parts of globular proteins.
For the initial globular protein structure calculations from NMR data(Figure 25), we used a metric matrix distance geometry algorithm to searchfor molecular geometries that are consistent with the ensemble of all experi-mentally determined NOE distance constraints (41–43). Each such calcula-tion ends with the minimization of an error function, and the residual errorfunction value represents a straightforward measure for the success of havingfound a molecular geometry that satisfies the experimental input data. Inview of the aforementioned distance-range format of the input, it is further ofkeen interest to evaluate the uniqueness of the calculated structure. To thisend, the structure calculation is repeated with identical input data but differ-ent boundary conditions, and the uniqueness of the resulting NMR structureis judged from the tightness of the fit among the resulting ensemble of con-formers. Typically, about 100 conformers are generated, and a sub-group ofthe 20 conformers with the smallest residual error function values is selectedto represent the NMR structure of the protein. The average of the pairwiseroot-mean-square distances (RMSD) calculated for this bundle of conformers(Figure 1) is then taken as a measure for the precision of the structure deter-mination. Visually, a tight fit of the bundle of conformers indicates regions
252
Figure 25. NMR struc-ture of BUSI IIA (43).

where the structure is defined with high precision by the NMR data, whereasstructurally disordered polypeptide segments show a large dispersion amongthe members of the bundle, as exemplified by the two chain ends of theAntennapedia homeodomain in Figure 1. In the absence of long-range NOEdistance constraints, a properly functioning algorithm for the structure cal-culation will sample the entire conformation space that is accessible with thegiven length of the polypeptide chain, as exemplified by the “unstructured”tail of the bovine prion protein in Figure 4.
NMR IN STRUCTURAL BIOLOGY
Standard protocol for NMR structure determination of biological macromoleculesThe protocol for NMR structure determination includes the preparation of ahomogeneous protein solution, the recording and handling of the NMR da-ta sets, and the structural interpretation of the NMR data (Table 1). The tech-niques used in 1984 for the structure determination of bull seminal pro-teinase inhibitor IIA are listed in Table 1; the four steps of the structuralinterpretation (III in Table 1) were performed separately, although the resultof the first round of constraint collection and structure calculation was sub-sequently used for additional checks on the sequence-specific resonance as-signments as well as on the collection of conformational constraints. Since1984, the protocol outlined in Table 1 has been used in over 3’000 NMRstructure determinations of proteins and nucleic acids, and greatly improvedexperimental techniques have been incorporated into this general scheme.
Major advances in the experimental techniques for NMR structure de-termination were spurned by the introduction of methods for the produc-tion of recombinant proteins labelled with stable isotopes, in particular
253
Table 1. Standard protocol for NMR structure determination of proteins
Step a BUSI IIA b
I Sample preparation Protein isolated from natural source; naturalisotope distribution; 16 mM solutions in H2Oand in 2H2O, respectively
II NMR spectroscopy 2D 1H NMRIIIa Resonance assignments Sequential NOEsIIIb Conformational constraints [1H,1H]-NOEs, 3JHN�, 3J��
IIIc Structure calculation Metric matrix distance geometryIIId Structure refinement Restrained energy minimization
a The structural interpretation of the NMR data, III, is somewhat arbitrarily divided up into foursteps; in practice, one goes though multiple cycles of collection of conformational constraints(IIIb) and structure calculation (IIIc), and the completion of the sequence-specific assignments(IIIa) as well as the structure refinement (IIId) may also be part of this iterative approach.
b This column lists the techniques used in the first structure determination of a globular proteinin 1984 (43).

carbon-13, nitrogen-15 and deuterium (44, 45). For example, this opened theway for efficient use of heteronuclear NMR techniques with proteins, such as 3D [1H,13C,15N]-triple resonance experiments, 3D 13C- or 15N-resolved[1H,1H]-NOESY (Figure 26) (46, 47), and the use of heteronuclear filters(48). Important advances have also been made with the methods of structurecalculation, where the c.p.u. time needed for the calculation of a small pro-tein structure has been reduced from about one day in 1984 (41, 42) to a fewseconds (49). Currently, intense work is focused on the automation and com-bined execution of the individual steps in the structural interpretation of theNMR data (50, 51). It is beyond the scope of this article to present in detailthe wide range of beautiful novel experimental approaches developed by thecommunity of macromolecular NMR spectroscopists during the past 15 years,which now enable studies with ever more complex systems (Figures 1–4).
Globular protein structures in solutionThe static picture of a protein molecule obtained from the standard protocolfor structure determination (Table 1) typically shows variable precision of thestructure determination along the polypeptide chain, as manifested by thevariations in the closeness of the fit among the bundle of conformers used torepresent the NMR structure (Figure 1). Even in proteins where the entirepolypeptide chain is part of the global fold, increased disorder is observed to-ward the periphery of the surface side chains (Figure 27). This pronouncedsurface disorder, which typically also involves the ends of the polypeptidechain, is in most instances the only significant difference between corre-sponding globular protein structures in single crystals and in solution (5). Inpart the increased disorder in solution arises because of a scarcity of packingconstraints, when compared with the protein core, and a concomitant scarci-ty of NOE distance constraints. With the additional use of NMR spin relax-ation measurements (24, 28, 33, 52), one can distinguish between static dis-order, which would then presumably arise from the scarcity of constraints,
254
Figure 26. Three-dimensional (3D) 15N-resolved [1H,1H]-NOESY spectrum (600 MHz, 28°C,H2O-solution) of the DNA-binding domain of the P22 c2 repressor (M ≈ 10000, uniformly15N-labeled).

and dynamic disorder, with intramolecular motions on the nanosecond andsub-nanosecond time scale. Overall, quite independent of the dynamics issue,the observation of partially folded polypeptide chains in solution (Figures 1,4 and 27) is important complementary information to the data that can beobtained by studies in crystals. It is also the main reason why the quality of aNMR structure determination is not usually characterized by a single, globalparameter (4–6).
An important extension of the characterization of proteins in solution re-sulted from high resolution NMR studies of protein hydration. Thereby thelocation of hydration waters is determined by the observation of NOEs be-tween water protons and hydrogen atoms of the polypeptide chain (53).Because of the dependence of the NOE on the inverse sixth power of the1H–1H distance, only one layer of hydration water molecules is observed(Figure 28). For the hydration studies, the dependence of the NOE intensity
255
Figure 27. NMRstructure of BPTIrepresented by abundle of 20 con-formers superim-posed for best fit ofthe polypeptidebackbone. Thepolypeptide back-bone is green, coreside-chains are blue,and solvent-accessi-ble surface side-chains are red.
Figure 28. Molecularmodel of hydratedBPTI in H2O solu-tion. The drawingshows an all-heavy-atom-presentationof one of the con-formers in Figure27 (yellow) coveredwith a layer of hy-dration water mole-cules (dotted bluespheres).

on the correlation function describing the stochastic modulation of the di-pole–dipole coupling between the interacting protons (Equation [1]) has akey role. The value of f(�c) may be governed either by the Brownian rotation-al tumbling of the hydrated protein molecule, or by interruption of the dipo-lar interaction through translational diffusion of the water molecules relativeto the protein surface, whichever is faster. On this basis it could be establishedthat surface hydration of peptides and proteins is characterized by very shortresidence times of the water molecules in the hydration sites, in the rangefrom about 20 to 300 picoseconds at 10°C. This result presents an intuitive ra-tionale for the generally observed dynamic disorder of the protein surfacestructure (Figure 27), and indicates that the dehydration of the polypeptidesurface will hardly ever be a rate-limiting step either in protein folding or inintermolecular interactions with proteins.
The BPTI crystal structure contains four interior hydration water mole-cules. These are an integral part of the molecular architecture and are inac-cessible to the solvent in a rigid model of the three-dimensional structure(Figure 29). The chemical shift dispersion anticipated for these four watermolecules on the basis of the considerations in Figures 5–8 was not observed.This degeneracy of the chemical shifts of bound water and bulk water wasfound to be due to rapid exchange of water molecules in and out of the pro-tein molecule, with an upper limit on the life-time of about 1 millisecond (53;as indicated in Figure 29 by the number in parentheses, the actual life times
256
Figure 29. Intramolecular rate processes in BPTI. The polypeptide backbone is representedby a grey spline function through the �-carbon positions, with the thickness of the line rep-resenting the spread of the bundle of 20 conformers in Figure 27. Individual rate process-es and their frequencies are indicated with the following colour code: dark blue, magentaand red: ring flips of phenylalanine and tyrosine; yellow, exchange between the R- and S-chiral forms of the disulfide bond at the top; cyan, interior hydration water molecules, withindication of the exchange rates with the bulk water.

for individual waters may be significantly shorter). Rapid exchange of interiorhydration water molecules appears to be a general property of globular pro-teins, and was also observed for water molecules located in protein–DNA in-terfaces, for example, in the DNA complex with the Antennapedia home-odomain (Figure 2).
Another intriguing NMR observation of internal protein mobility are the180°-ring flipping motions of phenylalanine and tyrosine (54). Observation ofthese “ring flips” on the millisecond to microsecond time scale (Figure 29) wasa genuine surprise for the following reasons: in the refined X-ray crystal struc-ture of BPTI reported in 1975, the aromatic rings of phenylalanine and tyro-sine are among the best-defined side chains, with the smallest temperature fac-tors. In each ring the relative values of the temperature factors for theindividual atoms increase toward the periphery, so that the largest positionaluncertainty is indicated for the peripheral �-carbon atom on the symmetry axis through the C�–C� bond, rather than for the four �- and �-ring carbonatoms, which undergo extensive movements during the ring flips. Theoreticalstudies then resolved this apparent contradiction: the crystallographic tem-perature factors sample multiple rotation states about the C�–C� bond, butthey do not manifest the ring flips because the populations of all non-equilib-rium rotational states about the C�–C� bond are vanishingly small. Althoughthe flipping motions about the C�–C� bond have low frequencies (Figure 29),they are very rapid 180°-rotations connecting two indistinguishable equilib-rium orientations of the ring. Similar to the exchange of internal hydrationwaters, the ring flip phenomenon is a general feature of globular proteins, ma-nifesting ubiquitous low-frequency internal motions that have activation ener-gies of 60 to 100 kJM-1, amplitudes larger than 1 Å, activation volumes of about50 Å3, and involve concerted displacement of numerous groups of atoms.Combined with sequence-specific NMR assignments, these experiments pro-vide high spatio-temporal resolution for the description of rate processes inproteins. In Figure 29 this is illustrated by a mapping of the frequencies forring flips and water exchange onto the NMR structure of BPTI.
In addition to the ring flips and the exchange of internal hydration watermolecules, the figure 29 includes data on the exchange of a disulfide bondbetween the R and S chiral states. In contrast to the other two phenomena,this rate process connects two different molecular structures.
Although all the data collected in Figure 29 have been known for morethan a decade, and some of them for nearly three decades, no widely accept-ed functional interpretation of these low-frequency motional processes hasbeen advanced. The same holds for the conformational equilibria manifestedby the “protection factors” governing the amide proton exchange rates infolded proteins (Figures 17 and 21). Quite possibly these NMR measure-ments are ahead of their times, and represent a source for future novel in-sights into structure–function correlations in proteins.
257

OUTLOOK TO NMR APPLICATIONS IN STRUCTURAL AND FUNCTIONAL PROTEOMICS
With the availability of a rapidly increasing number of completely sequencedgenomes, new challenges arise for the methods used for three-dimensionalstructure determination. On the one hand, “structural genomics” initiativesin several leading research centers focus on the development of technologyfor high-throughput structure determination to generate a comprehensive at-las of protein folds, so that remaining gaps could be filled by structure pre-diction methods. There is clearly a lot of room to further enhance the effi-ciency of each step of the NMR structure determination procedure (Table 1).On the other hand, we face the situation that newly determined proteinstructures should enable us to predict novel functions, whereas in classicalstructural biology one encounters more typically the challenge of rationaliz-ing known functions on the basis of the three-dimensional structure. Thissection describes some recent work in our laboratory that may eventually con-tribute to future strategies for the discovery of new physiological functionsfrom molecular structure data.
It has been widely recognized that supplementing the determination ofnew protein folds with data on intermolecular interactions may provide a keyfor the identification of unknown gene functions. Since efficient use of con-ventional NMR spectroscopy in solution had been limited to particle sizeswith molecular weights up to about 30’000 (Figure 30, left side), a new chal-
258
Figure 30. NMR structure determination and molecular weight. The horizontal axis coversthe molecular weight-range 0 – 110’000. The left side shows the molecular weight distribu-tion of the NMR structures in the protein databank (December 2000). On the right, thestructure of the protein OmpX from E. coli (M ≈ 18000) in DHPC micelles (M ≈ 70 000 forthe mixed micelles) indicates along the horizontal axis the approximate molecular weightrange for NMR structure determination of mixed micelles with membrane proteins that ispresently accessible with the NMR techniques of Figures 31 – 33.

lenge for solution NMR techniques then arose from the fact that thesupramolecular structures resulting from interactions of two or several pro-teins, or of other macromolecular components tend to have high molecularweights. Although a 30’000-Dalton size limit allowed to work with a large poolof physiologically interesting proteins, it was hardly compatible with extensiveuse of NMR for studies of such supramolecular structures. For example, thissize limit would severely narrow down the range of potential receptor systemsaccessible to NMR in drug discovery projects (55, 56), restrict studies of pro-tein–nucleic acid complexes (Figure 2) to a small number of systems withmodest size, and prevent the use of solution NMR for studies of membraneproteins, since these have to be reconstituted and solubilized in mixed mi-celles with detergents or lipids (Figure 30, right side). A few years ago this lim-itation was successfully challenged, since the size-range for applications of so-lution NMR techniques could be significantly extended through theintroduction of transverse relaxation-optimized spectroscopy (TROSY) (57).As an illustration, the figure 31 shows a [15N,1H]-TROSY correlation spectrumof a membrane protein reconstituted in detergent micelles. Sharp, well-sepa-rated peaks are obtained in spite of the large size of the mixed micelles(Figure 30, right side). With the use of the TROSY-principle, the more com-plex NMR experiments needed for a structure determination with[2H,13C,15N]-labelled proteins can also be obtained with high quality (58), sothat solution NMR can now be used for de novo membrane protein structuredetermination (59).
The improved quality of the NMR spectra of large structures with the useof TROSY can be qualitatively rationalized by the following considerations. Ashas previously been indicated in the discussion on NOEs (Equation [1]), theappearance of solution NMR spectra is intimately related to the effective cor-
259
Figure 31. Transverse relax-ation-optimized [15N,1H]-correlation spectroscopy(TROSY). A spectrum ofthe uniformly 2H- and 15N-labeled membrane proteinOmpX reconstituted inDHPC micelles is shown(750 MHz, 30°C, H2O-solu-tion).

relation time, �c, which characterizes the thermal motions of the moleculeconsidered. The increase of the �c-values in larger structures results in linebroadening due to rapid transverse spin-relaxation. For example, if the spec-trum of Figure 31 had been recorded with conventional NMR techniques,most of the resonance lines would not be individually resolved due to severeline broadening, and one would have experienced a severe loss of sensitivityfor detection of the NMR signals. The reduced sensitivity can be readily ap-preciated by examination of the “free induction decays” (FID) in the time do-main data. The figure 32 shows that rapid loss of magnetization in a conven-tional NMR experiment with a large structure can be slowed down by the useof TROSY, which corresponds to the reduction of the line width in the fre-quency domain spectrum. The impact on the sensitivity is visualized in Figure33 with a simplified scheme for a 2D correlation experiment, which includestwo magnetization transfer periods, and the evolution and acquisition periods.During evolution and acquisition, the system is not subjected to external perturbations, and loss of magnetization occurs at a rate determined by the“transverse relaxation time”. It is readily apparent that rapid loss of magneti-zation in a conventional NMR experiment (upper trace in Figure 32) leads toweak or even vanishing signal intensity at the end of the evolution period,and accordingly the sensitivity for detection of the signal during the acquisi-tion period is very low. In contrast, one can obtain much improved sensitivitywith the use of TROSY (lower trace in Figure 32), since plenty of signal in-tensity will be preserved at the end of the evolution period, and the signal canbe recorded with high signal-to-noise ratio during a large portion of the ac-
260
Figure 32. Schematic drawing of the free induction decay (FID) for a large protein with andwithout the use of TROSY. The period covered along the time axis is of the order of 100milliseconds. The FID represents the primary recording of the NMR data in the “time do-main”, from which the frequency domain spectrum (for example, Figures 18, 19 and 31) isobtained by Fourier transformation (31, 33).
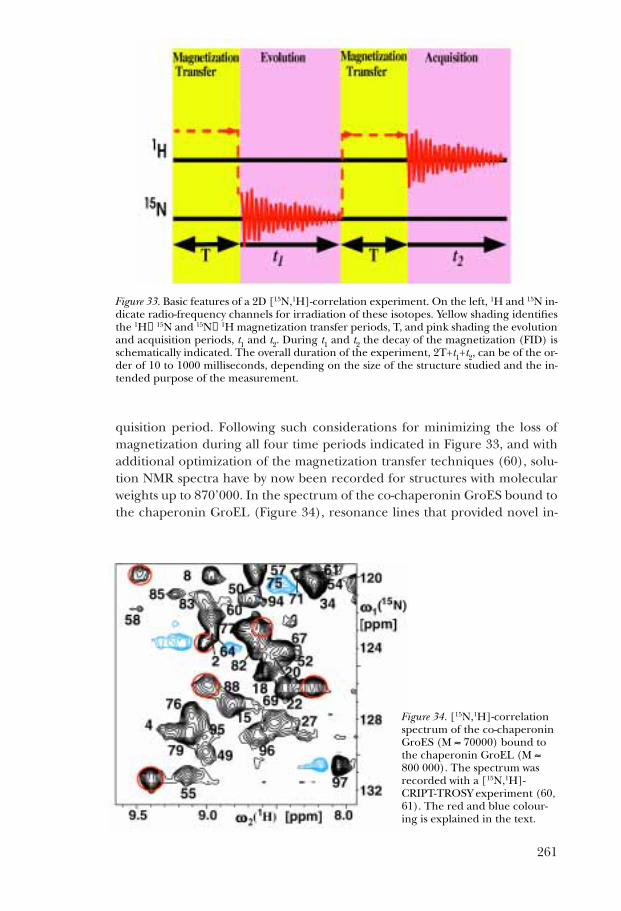
quisition period. Following such considerations for minimizing the loss ofmagnetization during all four time periods indicated in Figure 33, and withadditional optimization of the magnetization transfer techniques (60), solu-tion NMR spectra have by now been recorded for structures with molecularweights up to 870’000. In the spectrum of the co-chaperonin GroES bound tothe chaperonin GroEL (Figure 34), resonance lines that provided novel in-
261
Figure 33. Basic features of a 2D [15N,1H]-correlation experiment. On the left, 1H and 15N in-dicate radio-frequency channels for irradiation of these isotopes. Yellow shading identifiesthe 1H→15N and 15N→1H magnetization transfer periods, T, and pink shading the evolutionand acquisition periods, t1 and t2. During t1 and t2 the decay of the magnetization (FID) isschematically indicated. The overall duration of the experiment, 2T+t1+t2, can be of the or-der of 10 to 1000 milliseconds, depending on the size of the structure studied and the in-tended purpose of the measurement.
Figure 34. [15N,1H]-correlationspectrum of the co-chaperoninGroES (M ≈ 70000) bound tothe chaperonin GroEL (M ≈800 000). The spectrum wasrecorded with a [15N,1H]-CRIPT-TROSY experiment (60,61). The red and blue colour-ing is explained in the text.

formation on structural and dynamic features of the GroES–GroEL interfaceare colored in red and blue (61).
The principal contributions to the rate of transverse spin-relaxation can betraced to two different types of interactions, i.e., dipole–dipole coupling ofthe observed spin with other, nearby spins, and chemical shift anisotropy(CSA) (28). These interactions are modulated by the stochastic rotationalmotions in solution, and as a consequence the rate of transverse relaxation in-creases for larger structures with slower Brownian motions. TROSY exploitsconstructive interference between the two relaxation mechanisms, and actu-ally uses CSA-relaxation at high fields to cancel the dipolar relaxation (57). Inthis way the appearance of the NMR spectrum is effectively uncoupled fromthe Brownian motions, which then enables the recording of solution NMRspectra with large structures.
It remains to be seen how these new NMR techniques will be employedmost profitably in the future. Intriguing possibilities include that NMR cannow be employed in drug discovery projects with very large receptors (55,56). Combined with suitable isotope-labelling strategies, TROSY-based NMRtechniques have also been shown to provide a powerful approach for investi-gations of intermolecular interactions in supramolecular structures with twoor several macromolecular components (62, 63). In these applications, a de-tailed structural interpretation of the NMR data will in most instances be de-pendent on the availability of an independently determined atomic-resolu-tion structure for one or multiple components, which may have beenobtained either by NMR in solution or by diffraction methods in single crys-
262
Figure 35. NMR structure of the membrane protein OmpX reconstituted in DHPC micelles.Front and back views of a space-filling model of OmpX are shown, with pink and green col-oring identifying the surface area of the protein that is in contact with DHPC molecules inthe mixed micelles. The two broken horizontal lines indicate the thickness of the lipidphase in the E. coli cell membrane.

tals. Applications of the new NMR techniques for de novo determination oflarge structures appears to be particularly attractive for, but not limited to,nucleic acid–protein complexes and small membrane proteins reconstitutedin soluble detergent or lipid micelles. The characterization of a membraneprotein structure has also been extended to include the detergents in themixed micelles (Figure 35) (64), since the areas of the protein surface in con-tact with the detergent molecules could be delineated by the observation ofintermolecular NOEs between hydrogen atoms of the protein and the deter-gent. In these particular mixed micelles this surface area is virtually identicalto the protein surface in contact with the lipid phase in the biological mem-brane. Since this leaves both ends of the �-barrel of OmpX freely accessibleto the aqueous solvent, this reconstitution system should also be suitable forfunctional studies of the membrane protein with NMR.
This last section of my presentation certainly indicates only a narrow rangeof potential further developments of solution NMR techniques and their ap-plications in structural biology and structural proteomics. I look forward withgreat expectations to the future evolution of this awesome and beautiful tech-nique, which has given me so many years of joy and excitement in studies ofthe molecules of life.
ACKNOWLEDGMENTS
From 1970 through 2002, 229 students, postdoctoral research associates, andtechnical and administrative staff worked with me at the ETH Zürich. I amdeeply indebted to all of them for their enthusiasm and dedication, which re-sulted in the work summarized in this article. Their names are collected inFigure 36, and individual contributions can be recognized in the referencelist. Although human minds stand behind all progress in science, the success
263
Figure 36. My collaborators at the ETH Zürich from 1970 to 2002.

of our research projects also depended critically on financial resources. Iwould like to acknowledge the ETH Zürich, the Swiss National ScienceFoundation, the Kommission für Technologie und Innovation (KTI), Bruker-Biospin AG, and the Scripps Research Institute in La Jolla, CA, USA, for theirsupport.
REFERENCES
1. Qian, Y.Q., Billeter, M., Otting, G., Müller, M., Gehring, W.J. and Wüthrich, K. (1989)Cell 59, 573–580. The structure of the Antennapedia homeodomain determined byNMR spectroscopy in solution: comparison with prokaryotic repressors.
2. Otting, G., Qian, Y.Q., Billeter, M., Müller, M., Affolter, M., Gehring, W.J. andWüthrich, K. (1990) EMBO J. 9, 3085–3092. Protein–DNA contacts in the structure ofa homeodomain–DNA complex determined by nuclear magnetic resonance spec-troscopy in solution.
3. Lopez Garcia, F., Zahn, R., Riek, R. and Wüthrich, K. (2000) Proc. Natl. Acad. Sci. USA97, 8334–8399. NMR structure of the bovine prion protein.
4. Wüthrich, K. (1986) NMR of Proteins and Nucleic Acids, Wiley, New York.5. Wüthrich, K. (1995) Acta Cryst. D 51, 249–270. NMR–this other method for protein
and nucleic acid structure determination.6. Wüthrich, K. (1995) NMR in Structural Biology: A Collection of Papers by Kurt Wüthrich,
World Scientific, Singapore.7. Wüthrich, K. (2001) Nature Struct. Biol. 8, 923–925. The way to NMR structures of pro-
teins.8. Saunders, M. and Wishnia, A. (1958) Ann. N.Y. Acad. Sci. 70, 870–874. Nuclear mag-
netic resonance spectra of proteins.9. Jardetzky, O. and Jardetzky, C.D. (1958) J. Biol. Chem. 233, 383–387. Proton magnetic
resonance spectra of amino acids.10. Kowalsky, A. (1962) J. Biol. Chem. 237, 1807–1819. Nuclear magnetic resonance studies
of proteins.11. Mandel, M. (1965) J. Biol. Chem. 240, 1586–1592. Proton magnetic resonance spectra
of some proteins.12. McDonald, C.C. and Phillips, W.D. (1967) J. Amer. Chem. Soc. 89, 6332–6341.
Manifestations of the tertiary structures of proteins in high-frequency nuclear mag-netic resonance.
13. Wüthrich, K. (1969) Proc. Natl. Acad. Sci. USA 63, 1071–1078. High resolution protonnuclear magnetic resonance spectroscopy of cytochrome c.
14. Shulman, R.G., Ogawa, S., Wüthrich, K., Yamane, T., Peisach, J. and Blumberg, W.E.(1969) Science 165, 251–257. The absence of “heme–heme” interactions in hemoglo-bin.
15. Davis, D.G., Lindstrom, T.R., Mock, N.H., Baldassare, J.J., Charache, S., Jones, R.T.and Ho, C. (1971) J. Mol. Biol. 60, 101–111. NMR studies of hemoglobins VI: hemeproton spectra of human deoxyhemoglobins and their relevance to the nature of co-operative oxygenation of haemoglobin.
16. Kurland, R.J., Davis, D.G. and Ho, C. (1968) J. Amer. Chem. Soc. 90, 2700–2701.Paramagnetic proton NMR shifts of metmyoglobin, methemoglobin, and hemin de-rivatives.
17. Wüthrich, K. (1970) Structure and Bonding 8, 53–121. Structural studies of hemes andhemoproteins by nuclear magnetic resonance spectroscopy.
18. Shulman, R.G., Glarum, S.H. and Karplus, M. (1971) J. Mol. Biol. 57, 93–115.Electronic structure of cyanide complexes of hemes and heme proteins.
19. Wüthrich, K. (1976) NMR in Biological Research: Peptides and Proteins, North Holland,Amsterdam.
264

20. Noggle, J.H. and Schirmer, R.E. (1971) The Nuclear Overhauser Effect, Academic Press,New York.
21. Gibbons, W.A., Alms, H., Bockman, R.S. and Wyssbrod, H.R. (1972) Biochemistry 11,1721–1725. Homonuclear INDOR spectroscopy as a means of simplifying and analyz-ing proton magnetic resonance spectra of peptides and as a basis for determining sec-ondary and tertiary conformations of complex peptides.
22. Gupta, R.K. and Redfield, A.G. (1970) Science 169, 1204–1206. Double resonanceNMR observation of electron exchange between ferri- and ferrocytochrome c.
23. Balaram, P., Bothner-By, A.A. and Dadok, J. (1972) J. Amer. Chem. Soc. 94, 4015–4017.Negative nuclear Overhauser effects as probes of macromolecular structure.
24. Solomon, I. (1955) Phys. Rev. 99, 559–565. Relaxation processes in a system of twospins.
25. Kalk, A. and Berendsen, H.J.C. (1976) J. Magn. Reson. 24, 343–366. Proton magneticrelaxation and spin diffusion in proteins.
26. Gordon, S.L. and Wüthrich, K. (1978) J. Amer. Chem. Soc. 100, 7094–7096. Transientproton–proton Overhauser effects in horse ferrocytochrome c.
27. Wagner, G. and Wüthrich, K. (1979) J. Magn. Reson. 33, 675–680. Truncated drivennuclear Overhauser effect (TOE): a new technique for studies of selective 1H–1HOverhauser effects in the presence of spin diffusion.
28. Abragam, A. (1961) Principles of Nuclear Magnetism, Clarendon Press, Oxford.29. Keller, R.M. and Wüthrich, K. (1978) Biochem. Biophys. Res. Comm. 83, 1132–1139.
Evolutionary change of the heme c electronic structure: ferricytochrome c-551 fromPseudomonas aeruginosa and horse heart ferricytochrome c.
30. Dubs, A., Wagner, G. and Wüthrich, K. (1979) Biochim. Biophys. Acta 577, 177–194.Individual assignments of amide proton resonances in the proton NMR spectrum ofthe basic pancreatic trypsin inhibitor.
31. Ernst, R.R. (1992) Angew. Chemie –Int. Ed. 31, 805-823. Nuclear magnetic resonanceFourier transform spectroscopy.
32. Wider, G., Macura, S., Anil Kumar, Ernst, R.R. and Wüthrich, K. (1984) J. Magn. Reson.56, 207–234. Homonuclear two-dimensional 1H NMR of proteins: experimental pro-cedures.
33. Ernst, R.R., Bodenhausen, G. and Wokaun, A. (1987) Principles of Nuclear MagneticResonance in One and Two Dimensions, Oxford University Press, Oxford.
34. Wagner, G. and Wüthrich, K. (1982) J. Mol. Biol. 155, 347–366. Sequential resonanceassignments in protein 1H nuclear magnetic resonance spectra: basic pancreatictrypsin inhibitor.
35. Wagner, G., Anil-Kumar and Wüthrich, K. (1981) Eur. J. Biochem. 114, 375–384.Systematic application of two-dimensional 1H nuclear magnetic resonance techniquesfor studies of proteins 2: combined use of correlated spectroscopy and nuclearOverhauser spectroscopy for sequential assignments of backbone resonances and elu-cidation of polypeptide secondary structures.
36. Billeter, M., Braun, W. and Wüthrich, K. (1982) J. Mol. Biol. 155, 321–346. Sequentialresonance assignments in protein 1H nuclear magnetic resonance spectra: computa-tion of sterically allowed proton–proton distances and statistical analysis ofproton–proton distances in single crystal protein conformations.
37. Wüthrich, K., Billeter, M. and Braun, W. (1984) J. Mol. Biol. 180, 715–740. Polypeptidesecondary structure determination by nuclear magnetic resonance observation ofshort proton–proton distances.
38. Pardi, A., Billeter, M. and Wüthrich, K. (1984) J. Mol. Biol. 180, 741–751. Calibrationof the angular dependence of the amide proton–Ca proton coupling constants,3JHNa, in a globular protein: use of 3JHN� for identification of helical secondary struc-ture.
39. Wüthrich, K., Wider, G., Wagner, G. and Braun, W. (1982) J. Mol. Biol. 155, 311–319.Sequential resonance assignments as a basis for determination of spatial protein struc-tures by high resolution proton nuclear magnetic resonance.
265

40. Braun, W., Bösch, C., Brown, L.R., Go, N. and Wüthrich, K. (1981) Biochim. Biophys.Acta 667, 377–396. Combined use of proton–proton Overhauser enhancements anda distance geometry algorithm for determination of polypeptide conformations: ap-plication to micelle-bound glucagon.
41. Havel, T.F. and Wüthrich, K. (1984) Bull. Math. Biol. 46, 673–698. A distance geometryprogram for determining the structures of small proteins and other macromoleculesfrom nuclear magnetic resonance measurements of intramolecular 1H–1H proximitiesin solution.
42. Havel, T.F. and Wüthrich, K. (1985) J. Mol. Biol. 182, 281–294. An evaluation of thecombined use of nuclear magnetic resonance and distance geometry for the deter-mination of protein conformations in solution.
43. Williamson, M.P., Havel, T.F. and Wüthrich, K. (1985) J. Mol. Biol. 182, 295–315.Solution conformation of proteinase inhibitor IIA from bull seminal plasma by 1H nu-clear magnetic resonance and distance geometry.
44. Wagner, G. (1993) J. Biomol. NMR 3, 375–385. Prospects for NMR of large proteins.45. Kay, L.E. and Gardner, K.H. (1997) Curr. Opin. Struct. Biol. 7, 564–570. Solution NMR
spectroscopy beyond 25 kDa.46. Bax, A. and Grzesiek, S. (1993) Accounts Chem. Res. 26, 131–138. Methodological
advances in protein NMR.47. Wider, G. (1998) Prog. Nucl. Magn. Reson. Spectr. 32, 193–275. Technical aspects of NMR
spectroscopy with biological macromolecules and studies of hydration in solution.48. Otting, G. and Wüthrich, K. (1990) Q. Rev. Biophys. 23, 39–96. Heteronuclear filters in
two-dimensional [1H,1H]-NMR spectroscopy: combined use with isotope labelling forstudies of macromolecular conformation and intermolecular interactions.
49. Güntert, P. (1998) Q. Rev. Biophys. 31, 145–237. Structure calculation of biologicalmacromolecules from NMR data.
50. Moseley, H.N.B. & Montelione, G.T. (1999) Curr. Opin. Struct. Biol. 9, 635–642.Automated analysis of NMR assignments and structures for proteins.
51. Herrmann, T., Güntert, P. and Wüthrich, K. (2002) J. Biomol. NMR 24, 171–189.Protein NMR structure determination with automated NOE-identification in theNOESY spectra using the new software ATNOS.
52. Luginbühl, P. and Wüthrich, K. (2002) Progr. Nucl. Magn. Reson. Spectr. 40, 199–247.Semi-classical nuclear spin relaxation theory revisited for use with biological macro-molecules.
53. Otting, G., Liepinsh, E. and Wüthrich, K. (1991) Science 254, 974–980. Protein hydra-tion in aqueous solution.
54. Wüthrich, K. and Wagner, G. (1975) FEBS Lett. 50, 265–268. NMR investigations of thedynamics of the aromatic amino acid residues in the basic pancreatic trypsin inhibitor.
55. Shuker S.B., Hajduk P.J., Meadows R.P. and Fesik S.W. (1996) Science 274, 1531–1534.Discovering high-affinity ligands for proteins: SAR by NMR.
56. Pellecchia, M., Sem, D.S. and Wüthrich, K. (2002) Nature Rev. Drug Disc. 1, 211–219.NMR in drug discovery.
57. Pervushin, K., Riek, R., Wider, G. and Wüthrich, K. (1997) Proc. Natl. Acad. Sci. USA94, 12366–12371. Attenuated T2 relaxation by mutual cancellation of dipole–dipolecoupling and chemical shift anisotropy indicates an avenue to NMR structures of verylarge biological macromolecules in solution.
58. Salzmann, M., Pervushin, K., Wider, G., Senn, H. and Wüthrich, K. (1998) Proc. Natl.Acad. Sci. USA 95, 13585–13590. TROSY in triple-resonance experiments: new per-spectives for sequential NMR assignment of large proteins.
59. Fernández, C., Hilty, C., Bonjour, S., Adeishvili, K., Pervushin, K. and Wüthrich, K.(2001) FEBS Lett. 504, 173–178. Solution NMR studies of the integral membrane pro-teins OmpX and OmpA from Escherichia coli.
60. Riek, R., Wider, G., Pervushin, K. and Wüthrich, K. (1999) Proc. Natl. Acad. Sci. USA96, 4918–4923. Polarization transfer by cross-correlated relaxation in solution NMRwith very large molecules.
266

61. Fiaux, J., Bertelsen, E., Horwich, A. and Wüthrich, K. (2002) Nature 418, 207–211.NMR analysis of a 900K GroEL–GroES complex.
62. Pellecchia, M., Sebbel, P., Hermanns, U., Wüthrich, K. and Glockshuber, R. (1999)Nature Struct. Biol. 6, 336–339. Pilus chaperone FimC–adhesin FimH interactionsmapped by TROSY-NMR.
63. Frickel, E.M., Riek, R., Jelesarov, I., Helenius, A., Wüthrich, K. and Ellgaard, L. (2002)Proc. Natl. Acad. Sci. USA 99, 1954–1959. TROSY-NMR reveals interaction betweenERp57 and the tip of the calreticulin P-domain.
64. Fernández, C., Hilty, C., Wider, G. and Wüthrich, K. (2002) Proc. Natl. Acad. Sci. USA99, 13533–13537. Lipid–protein interactions in DHPC micelles containing the inte-gral membrane protein OmpX investigated by NMR spectroscopy.
267