Embed Size (px)
Citation preview
AHAR2014
The U.S. Department of Housing and Urban DevelopmentOFFICE OF COMMUNITY PLANNING AND DEVELOPMENT
The 2014 Annual Homeless Assessment Report (AHAR) to CongressOCTOBER 2014
PART 1 Point-in-Time Estimates of Homelessness
Acknowledgements
AUTHORS
Meghan Henry, Dr. Alvaro Cortes, Azim Shivji, and Katherine Buck, Abt Associates
PRINCIPAL INVESTIGATORS
Dr. Jill Khadduri, Abt Associates and Dr. Dennis Culhane, National Center on Homelessness among Veterans, University of Pennsylvania.
DATA MANAGERS
Meghan Henry and Azim Shivji, Abt Associates
DATA COLLECTORS
Katherine Buck, Lauren Dunton, Thuan Huynh, Sean Morris, Whitney Patterson, Louise Rothschild, Galen Savidge-Wilkins, Mark Silverbush, and Jeff Ward, Abt Associates
PROGRAMMERS/ANALYSTS
Azim Shivji, Abt Associates Jon-Paul Oliva, GIS and Data Quality Consultant
REVIEWERS
Karen Deblasio, Michael Roanhouse, and William Snow, U.S. Department of Housing and Urban DevelopmentDr. Larry Buron, Abt Associates Dr. Ann Elizabeth Montgomery, National Center on Homelessness among Veterans, University of Pennsylvania
DESIGN AND PRODUCTION
Cara Capizzi, Abt Associates
ContentsKey Findings . . . . . . . . . . . . . . . . . . . . . . . . . . . . . . . . . . . .1
Definition of Terms . . . . . . . . . . . . . . . . . . . . . . . . . . . . . .2
Progress on the Federal Strategic Plan to Prevent and End Homelessness . . . . . . . . . . . . .3
About this Report . . . . . . . . . . . . . . . . . . . . . . . . . . . . . . .4
SECTION 1
Homelessness in the United States . . . . . . . . . . . . . . . . .6National Estimates . . . . . . . . . . . . . . . . . . . . . . . . . . . . . . . . . . . . . . . . 6State Estimates . . . . . . . . . . . . . . . . . . . . . . . . . . . . . . . . . . . . . . . . . . . 8Estimates by CoC . . . . . . . . . . . . . . . . . . . . . . . . . . . . . . . . . . . . . . . . 10
SECTION 2
Homeless Individuals . . . . . . . . . . . . . . . . . . . . . . . . . . . .14National Estimates . . . . . . . . . . . . . . . . . . . . . . . . . . . . . . . . . . . . . . . 14State Estimates . . . . . . . . . . . . . . . . . . . . . . . . . . . . . . . . . . . . . . . . . . 16Estimates by CoC . . . . . . . . . . . . . . . . . . . . . . . . . . . . . . . . . . . . . . . . 18
SECTION 3
Homeless Families . . . . . . . . . . . . . . . . . . . . . . . . . . . . . .22National Estimates . . . . . . . . . . . . . . . . . . . . . . . . . . . . . . . . . . . . . . . 22State Estimates . . . . . . . . . . . . . . . . . . . . . . . . . . . . . . . . . . . . . . . . . . 24Estimates by CoC . . . . . . . . . . . . . . . . . . . . . . . . . . . . . . . . . . . . . . . . 28
SECTION 4
Unaccompanied Homeless Children and Youth . . . . . .32National Estimates . . . . . . . . . . . . . . . . . . . . . . . . . . . . . . . . . . . . . . . 32State Estimates . . . . . . . . . . . . . . . . . . . . . . . . . . . . . . . . . . . . . . . . . . 34Estimates by CoC . . . . . . . . . . . . . . . . . . . . . . . . . . . . . . . . . . . . . . . . 36
SECTION 5
Homeless Veterans . . . . . . . . . . . . . . . . . . . . . . . . . . . . .40National Estimates . . . . . . . . . . . . . . . . . . . . . . . . . . . . . . . . . . . . . . . 40State Estimates . . . . . . . . . . . . . . . . . . . . . . . . . . . . . . . . . . . . . . . . . . 42Estimates by CoC . . . . . . . . . . . . . . . . . . . . . . . . . . . . . . . . . . . . . . . . 46
SECTION 6
Chronically Homeless People . . . . . . . . . . . . . . . . . . . . .50National Estimates . . . . . . . . . . . . . . . . . . . . . . . . . . . . . . . . . . . . . . . 50State Estimates . . . . . . . . . . . . . . . . . . . . . . . . . . . . . . . . . . . . . . . . . . 52Estimates by CoC . . . . . . . . . . . . . . . . . . . . . . . . . . . . . . . . . . . . . . . . 55
SECTION 7
National Inventory of Beds . . . . . . . . . . . . . . . . . . . . . . .58

1
Key Findings
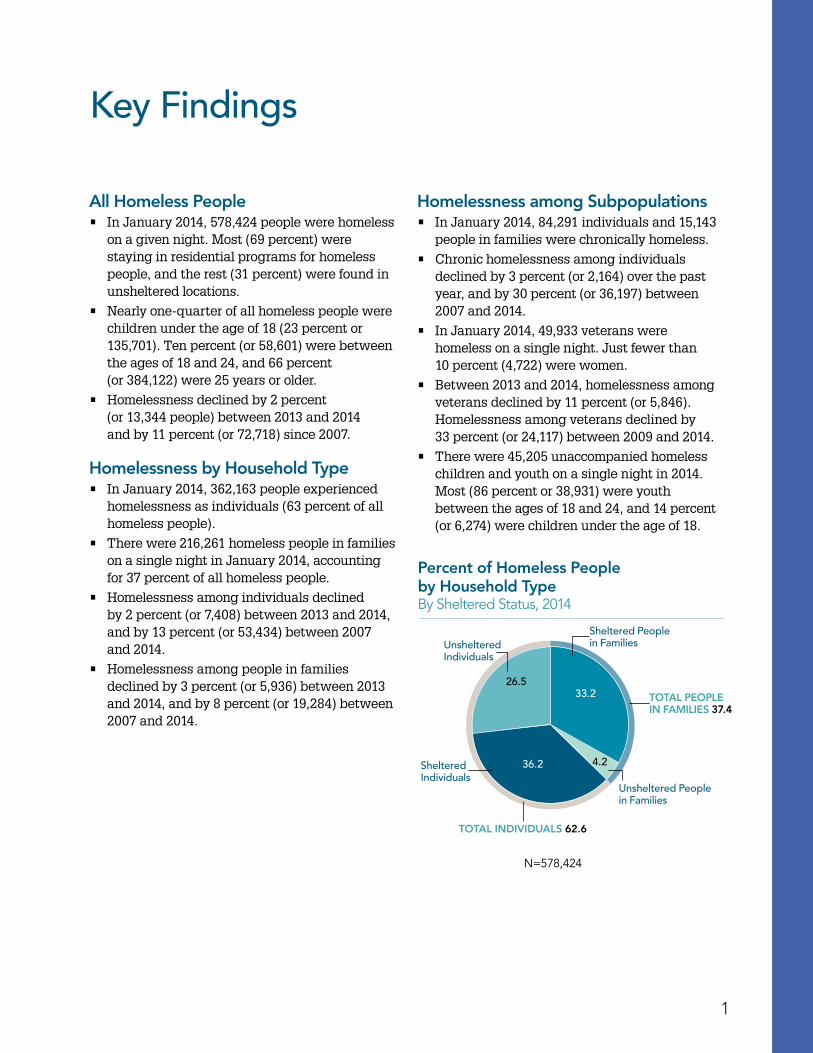
All Homeless People• In January 2014, 578,424 people were homeless
on a given night. Most (69 percent) were staying in residential programs for homeless people, and the rest (31 percent) were found in unsheltered locations.
• Nearly one-quarter of all homeless people were children under the age of 18 (23 percent or 135,701). Ten percent (or 58,601) were between the ages of 18 and 24, and 66 percent (or 384,122) were 25 years or older.
• Homelessness declined by 2 percent (or 13,344 people) between 2013 and 2014 and by 11 percent (or 72,718) since 2007.
Homelessness by Household Type• In January 2014, 362,163 people experienced
homelessness as individuals (63 percent of all homeless people).
• There were 216,261 homeless people in families on a single night in January 2014, accounting for 37 percent of all homeless people.
• Homelessness among individuals declined by 2 percent (or 7,408) between 2013 and 2014, and by 13 percent (or 53,434) between 2007 and 2014.
• Homelessness among people in families declined by 3 percent (or 5,936) between 2013 and 2014, and by 8 percent (or 19,284) between 2007 and 2014.
Homelessness among Subpopulations• In January 2014, 84,291 individuals and 15,143
people in families were chronically homeless.
• Chronic homelessness among individuals declined by 3 percent (or 2,164) over the past year, and by 30 percent (or 36,197) between 2007 and 2014.
• In January 2014, 49,933 veterans were homeless on a single night. Just fewer than 10 percent (4,722) were women.
• Between 2013 and 2014, homelessness among veterans declined by 11 percent (or 5,846). Homelessness among veterans declined by 33 percent (or 24,117) between 2009 and 2014.
• There were 45,205 unaccompanied homeless children and youth on a single night in 2014. Most (86 percent or 38,931) were youth between the ages of 18 and 24, and 14 percent (or 6,274) were children under the age of 18.
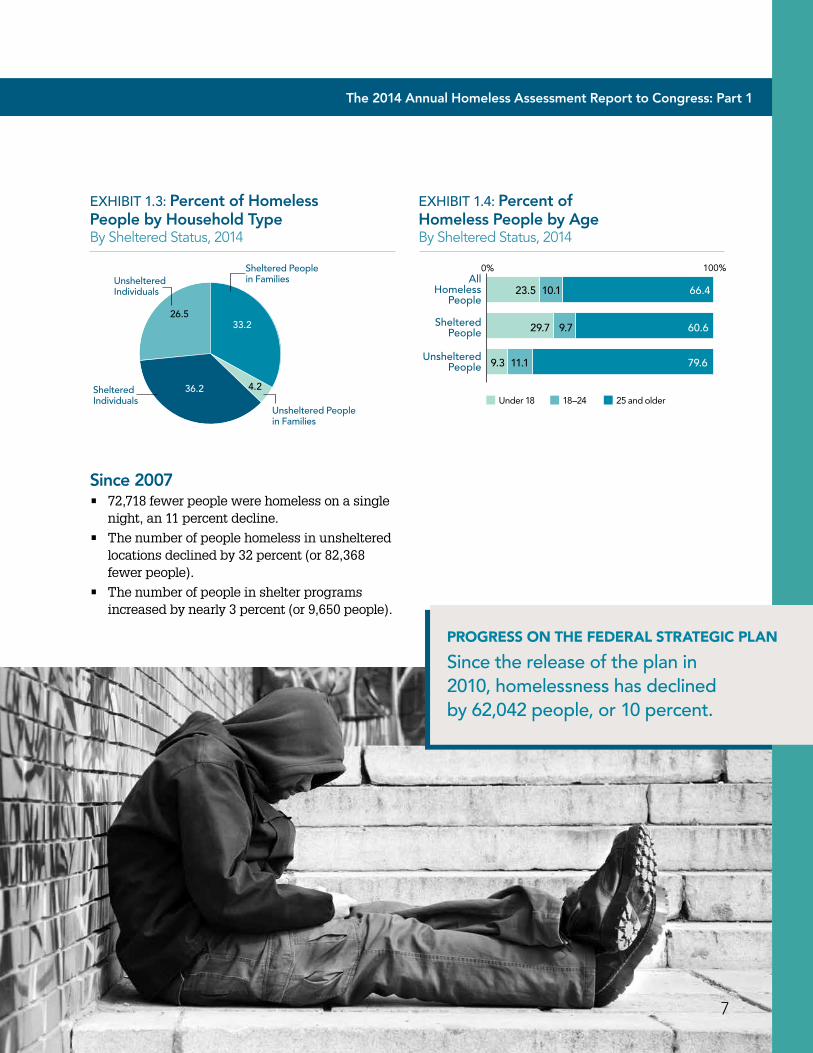
Percent of Homeless People by Household TypeBy Sheltered Status, 2014
Sheltered People in FamiliesUnsheltered
Individuals
Sheltered Individuals
Unsheltered Peoplein Families
33.2
36.2
26.5
4.2
N=578,424
TOTAL PEOPLE IN FAMILIES 37.4
TOTAL INDIVIDUALS 62.6
2
Continuums of Care (CoC) are local planning bodies responsible for coordinating the full range of homelessness services in a geographic area, which may cover a city, county, metropolitan area, or an entire state.
Chronically Homeless People in Families are people experiencing homelessness in families in which the head of household has a disability and has either been continuously homeless for a year or more or has experienced at least four episodes of homelessness in the last three years.
Chronically Homeless Individuals are unaccompanied homeless individuals with disabilities who have either been continuously homeless for a year or more or have experienced at least four episodes of homelessness in the last three years.
Emergency Shelter is a facility with the primary purpose of providing temporary shelter for homeless people.
Individuals are people who are not part of a family during their episode of homelessness. They are homeless as single adults, unaccompanied youth, or in multiple-adult or multiple-child households.
Other Permanent Housing is housing with or without services that is specifically for formerly homeless people, but that does not require people to have a disability.
Rapid Rehousing is a housing model designed to provide temporary housing assistance to people experiencing homelessness, moving them quickly out of homelessness and into permanent housing.
Permanent Supportive Housing is designed to provide housing and supportive services on a long-term basis for formerly homeless people, who have disabilities.
People in Families are people who are homeless as part of households that have at least one adult and one child.
Point-in-Time Counts are unduplicated one-night estimates of both sheltered and unsheltered homeless populations. The one-night counts are conducted by Continuums of Care nationwide and occur during the last week in January of each year.
Safe Havens provide private or semi-private long-term housing for people with severe mental illness and are limited to serving no more than 25 people within a facility.
Sheltered Homeless People are individuals who are staying in emergency shelters, transitional housing programs, or safe havens.
Transitional Housing Program provides homeless people a place to stay combined with supportive services for up to 24 months in order to help them overcome barriers to moving into and retaining permanent housing.
Unaccompanied Children are people who are not part of a family or in a multi-child household during their episode of homelessness, and who are under the age of 18.
Unaccompanied Youth are people who are not part of a family during their episode of homelessness and who are between the ages of 18 and 24.
Unsheltered Homeless People are people who stay in places not meant for human habitation, such as the streets, abandoned buildings, vehicles, or parks.
Definition of Terms
3
In June 2010, the Administration released Opening Doors: Federal Strategic Plan to Prevent and End Homelessness, a comprehensive plan to prevent and end homelessness in America. With Opening Doors, the Administration set forth a bold agenda to prevent and end homelessness with four core goals as its focal point. The U.S. Department of Housing and Urban Development and its Federal partners have engaged in unprecedented collaborations and partnerships with Federal, State and local partners to work towards meeting these critical goals. While these efforts have resulted in significant progress, the latest national estimates also remind us that hundreds of thousands of Americans each year are homeless.
Finish the job of ending chronic homelessness by 2015
Progress to Date• In January 2014, more than 84,000 individuals
experiencing homelessness were reported as chronically homeless (84,291 people), and almost two-thirds of them were living on the streets (63 percent or 53,088 chronically homeless people).
• The number of individuals experiencing chronic homelessness declined by 21 percent, or 22,892 people, between 2010 and 2014.
Prevent and end homelessness among Veterans by 2015
Progress to Date• In January 2014, there were nearly 50,000
veterans experiencing homelessness (49,933), including almost 5,000 women (4,722).
• The number of homeless veterans declined by 33 percent (or 24,837 people) since 2010, and most of the decline was in the number of veterans staying in unsheltered locations.
Prevent and end homelessness for families, youth, and children by 2020
Progress to Date• In January 2014, more than 216,000 people in
families experienced homelessness (216,261), including more than 194,000 homeless children and youth. An additional 45,205 homeless children and youth experienced homelessness on their own, roughly 8 percent of the total homeless population.
• Year-to-year changes in family homelessness have been uneven. However, since 2010 the number of homeless people in families has declined by 11 percent (or 25,690 people).
Set a path to ending all types of homelessness
Progress to Date• In January 2014, more than 578,000 people
were homeless on a single night (578,424), with most staying in the nation’s shelter system (69%). The percentage of homeless people who are unsheltered decreased from 40 percent in 2007 to 31 percent in 2014.
• Overall, homelessness has declined by more than 62,000 people since 2010 (62,042), a 10 percent reduction since the release of Opening Doors.
GOAL
GOAL
GOAL
GOAL
Progress on the Federal Strategic Plan to Prevent and End Homelessness
4
The Department of Housing and Urban Development (HUD) releases the Annual Homeless Assessment Report to Congress (AHAR) in two parts. Part 1 provides Point-in-Time (PIT) estimates, offering a snapshot of homelessness—of both sheltered and unsheltered homeless populations—on a single night. The one-night counts are conducted in late January of each year. The PIT counts also provide an estimate of the number of homeless persons within particular subpopulations, such as chronically homeless people and veterans, as well as counts of people in specific age ranges. This report also provides counts of beds in emergency shelters, transitional housing programs, safe havens, rapid rehousing programs, permanent supportive housing programs, and other permanent housing.
In 2014, the PIT estimates of both homeless people and beds were reported by 414 Continuums of Care (CoC) nationwide, covering virtually the entire United States. While sheltered counts are mandatory each year, unsheltered counts are required every other year. Unsheltered counts were not required in 2014. Nonetheless, 323 CoCs (or 78 percent of all CoCs) reported unsheltered counts in 2014. For the CoCs that did not report unsheltered counts, the unsheltered counts from 2013 were rolled over into 2014.
HUD has standards for conducting the PIT counts, and CoCs use a variety of approved methods to produce the counts. HUD reviews the data for accuracy and quality prior to creating the estimates for this report.
The PIT estimates from 2007-2013 are slightly lower than those reported in past AHARs. The reduction reflects an adjustment to the estimates of unsheltered homeless individuals submitted by the Los Angeles City and County Continuum of Care. The adjustment removed: 20,746 from 2007 and 2008; 9,451 people in 2009 and 2010; 10,800 people in 2011 and 2012; and 18,274 people from 2013.
About This Report
5
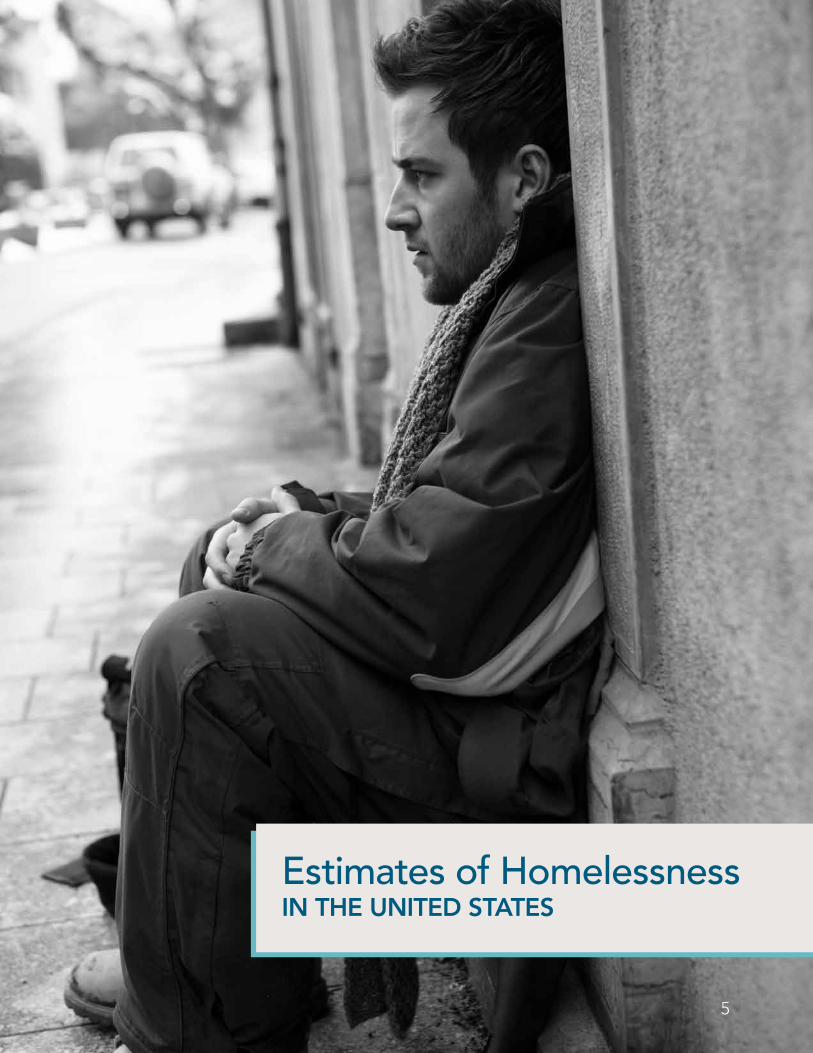
Estimates of HomelessnessIN THE UNITED STATES
6
1651,142
391,401
259,741 257,307230,308 236,923 232,901
197,070 177,373
386,361 403,308 403,543 392,316 394,698 401,051390,155
643,668 633,616 640,466 625,217 622,982591,768 578,424
2007 2008 2009 2010 20122011
All Homeless People
Sheltered People
Unsheltered People
2013 2014
232,827
EXHIBIT 1.2: Change in the Numbers of Homeless People By Sheltered Status, 2007–2014
National Estimates Homelessness in the United States
EXHIBIT 1.1: Estimates of Homeless People By Sheltered Status, 2007–2014
Data source: PIT 2007–2014
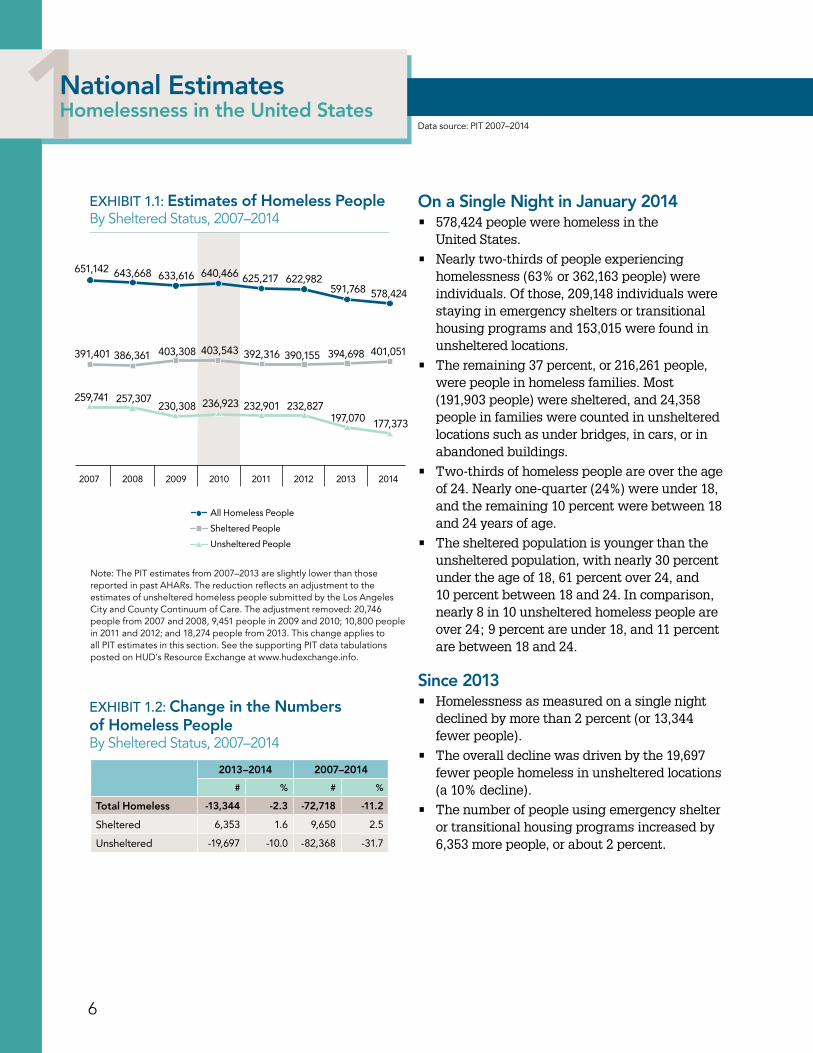
On a Single Night in January 2014• 578,424 people were homeless in the
United States.
• Nearly two-thirds of people experiencing homelessness (63% or 362,163 people) were individuals. Of those, 209,148 individuals were staying in emergency shelters or transitional housing programs and 153,015 were found in unsheltered locations.
• The remaining 37 percent, or 216,261 people, were people in homeless families. Most (191,903 people) were sheltered, and 24,358 people in families were counted in unsheltered locations such as under bridges, in cars, or in abandoned buildings.
• Two-thirds of homeless people are over the age of 24. Nearly one-quarter (24%) were under 18, and the remaining 10 percent were between 18 and 24 years of age.
• The sheltered population is younger than the unsheltered population, with nearly 30 percent under the age of 18, 61 percent over 24, and 10 percent between 18 and 24. In comparison, nearly 8 in 10 unsheltered homeless people are over 24; 9 percent are under 18, and 11 percent are between 18 and 24.
Since 2013• Homelessness as measured on a single night
declined by more than 2 percent (or 13,344 fewer people).
• The overall decline was driven by the 19,697 fewer people homeless in unsheltered locations (a 10% decline).
• The number of people using emergency shelter or transitional housing programs increased by 6,353 more people, or about 2 percent.
Note: The PIT estimates from 2007–2013 are slightly lower than those reported in past AHARs. The reduction reflects an adjustment to the estimates of unsheltered homeless people submitted by the Los Angeles City and County Continuum of Care. The adjustment removed: 20,746 people from 2007 and 2008, 9,451 people in 2009 and 2010; 10,800 people in 2011 and 2012; and 18,274 people from 2013. This change applies to all PIT estimates in this section. See the supporting PIT data tabulations posted on HUD’s Resource Exchange at www.hudexchange.info.
2013–2014 2007–2014
# % # %
Total Homeless -13,344 -2.3 -72,718 -11.2
Sheltered 6,353 1 .6 9,650 2 .5
Unsheltered -19,697 -10 .0 -82,368 -31 .7
The 2014 Annual Homeless Assessment Report to Congress: Part 1
EXHIBIT 1.4: Percent of Homeless People by AgeBy Sheltered Status, 2014
EXHIBIT 1.3: Percent of Homeless People by Household TypeBy Sheltered Status, 2014
7
PROGRESS ON THE FEDERAL STRATEGIC PLAN
Since the release of the plan in 2010, homelessness has declined by 62,042 people, or 10 percent.
Since 2007 • 72,718 fewer people were homeless on a single
night, an 11 percent decline.
• The number of people homeless in unsheltered locations declined by 32 percent (or 82,368 fewer people).
• The number of people in shelter programs increased by nearly 3 percent (or 9,650 people).
AllHomeless
People
ShelteredPeople
UnshelteredPeople
0% 100%
23.5
29.7
10.1
9.7
11.19.3
66.4
60.6
79.6
Under 18 18–24 25 and older
Sheltered People in FamiliesUnsheltered
Individuals
Sheltered Individuals
Unsheltered Peoplein Families
33.2
36.2
26.5
4.2
8
1State EstimatesHomelessness in the United States
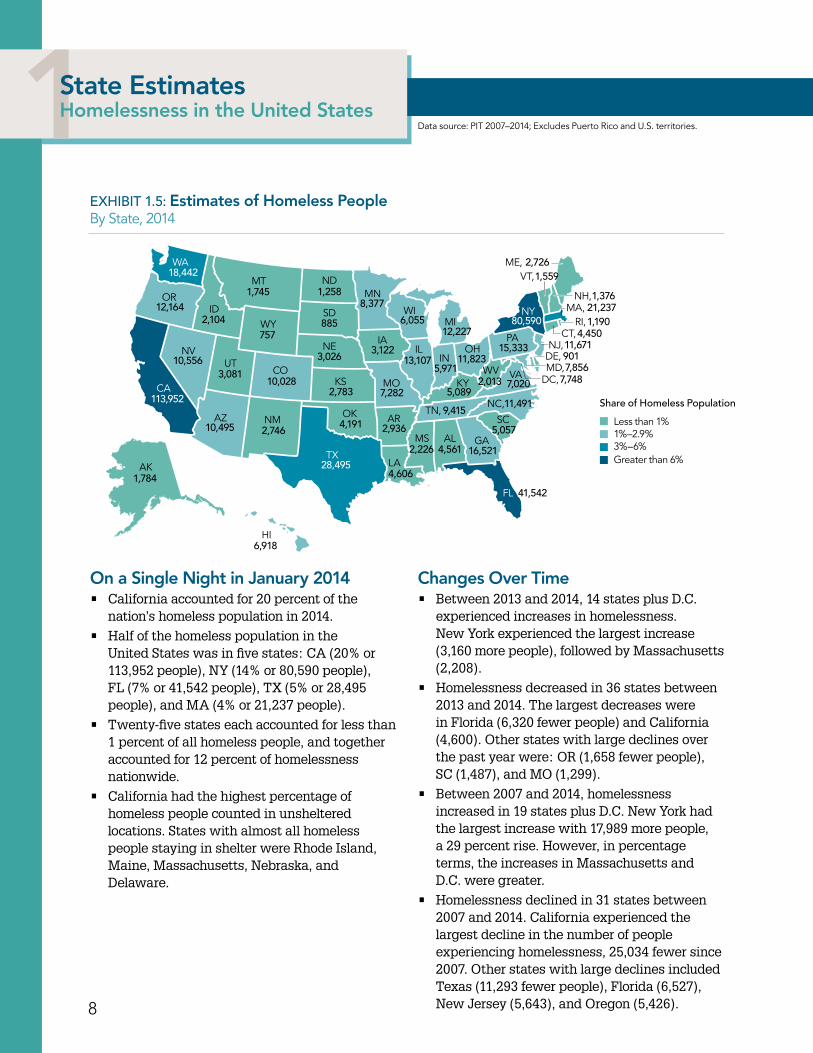
EXHIBIT 1.5: Estimates of Homeless People By State, 2014
757885
2,013
16,521
41,542
11,823
7,020
11,4915,089
9,415
5,971
6,05512,227
13,107
8,377
5,057
2,226 4,561
1,258
3,122
7,282
3,026
10,028
10,556
10,495
2,783
4,191
28,495
2,936
4,606
1,74512,164
18,442
113,952
2,746
6,918
2,104
3,081
1,784
901
7,7487,856
1,19021,237
4,45080,590
11,67115,333
1,376
1,5592,726ME,
NH,
VT,
NY MA,RI,
CT,NJ,
DE,
DC,
PA
VAWV
NC,
SC
GA
FL
AL
TN,
KY
OHIL
MIWI
MN
IA
MO
AR
LATX
OK
KS
NE
SD
NDMT
WA
OR
CA
AK
HI
WY
CO
NMAZ
UTNV
ID
IN
MS
MD,
Share of Homeless Population
Less than 1%1%–2.9%
Greater than 6%3%–6%
Data source: PIT 2007–2014; Excludes Puerto Rico and U.S. territories.
On a Single Night in January 2014• California accounted for 20 percent of the
nation’s homeless population in 2014.
• Half of the homeless population in the United States was in five states: CA (20% or 113,952 people), NY (14% or 80,590 people), FL (7% or 41,542 people), TX (5% or 28,495 people), and MA (4% or 21,237 people).
• Twenty-five states each accounted for less than 1 percent of all homeless people, and together accounted for 12 percent of homelessness nationwide.
• California had the highest percentage of homeless people counted in unsheltered locations. States with almost all homeless people staying in shelter were Rhode Island, Maine, Massachusetts, Nebraska, and Delaware.
Changes Over Time• Between 2013 and 2014, 14 states plus D.C.
experienced increases in homelessness. New York experienced the largest increase (3,160 more people), followed by Massachusetts (2,208).
• Homelessness decreased in 36 states between 2013 and 2014. The largest decreases were in Florida (6,320 fewer people) and California (4,600). Other states with large declines over the past year were: OR (1,658 fewer people), SC (1,487), and MO (1,299).
• Between 2007 and 2014, homelessness increased in 19 states plus D.C. New York had the largest increase with 17,989 more people, a 29 percent rise. However, in percentage terms, the increases in Massachusetts and D.C. were greater.
• Homelessness declined in 31 states between 2007 and 2014. California experienced the largest decline in the number of people experiencing homelessness, 25,034 fewer since 2007. Other states with large declines included Texas (11,293 fewer people), Florida (6,527), New Jersey (5,643), and Oregon (5,426).
9
The 2014 Annual Homeless Assessment Report to Congress: Part 1
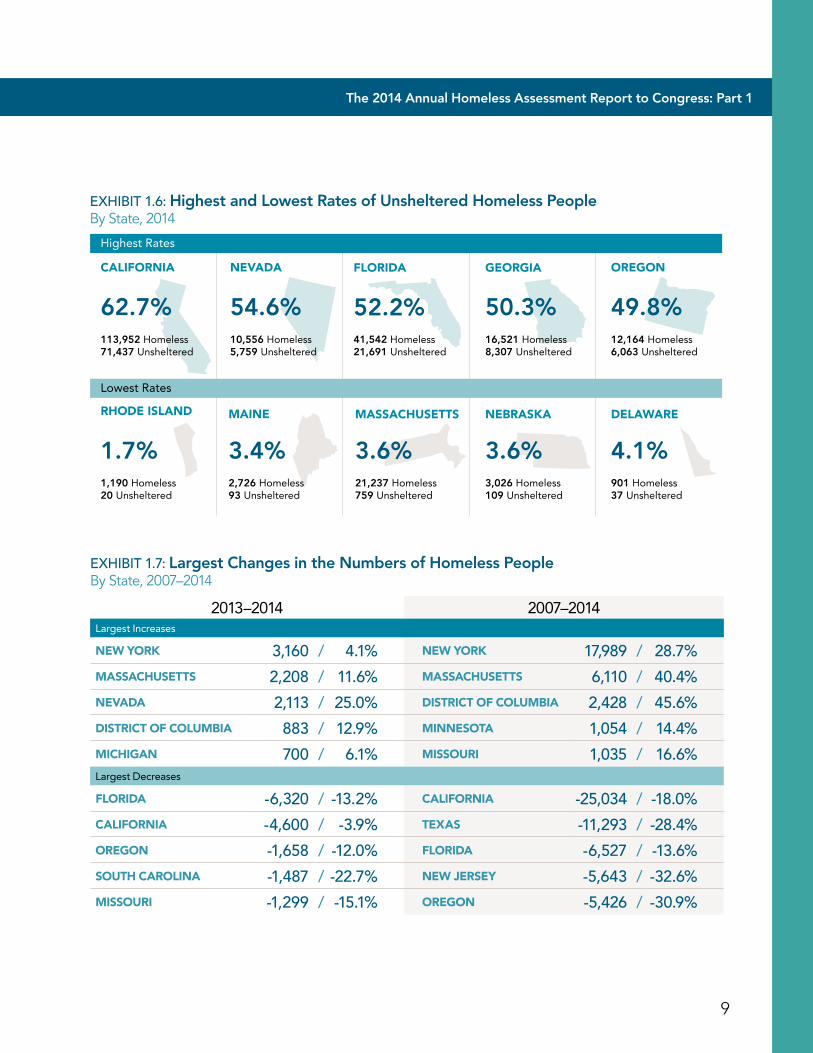
EXHIBIT 1.6: Highest and Lowest Rates of Unsheltered Homeless PeopleBy State, 2014
EXHIBIT 1.7: Largest Changes in the Numbers of Homeless People By State, 2007–2014
CALIFORNIA
113,952 Homeless71,437 Unsheltered
62.7%
RHODE ISLAND
1,190 Homeless20 Unsheltered
1.7%2,726 Homeless93 Unsheltered
3.4%21,237 Homeless759 Unsheltered
3.6%
FLORIDA GEORGIA
41,542 Homeless21,691 Unsheltered
52.2%16,521 Homeless8,307 Unsheltered
50.3%
NEVADA
10,556 Homeless5,759 Unsheltered
54.6%
OREGON
12,164 Homeless6,063 Unsheltered
49.8%
DELAWAREMAINE MASSACHUSETTS
3,026 Homeless109 Unsheltered
3.6%901 Homeless37 Unsheltered
4.1%
NEBRASKA
Lowest Rates
Highest Rates
2013–2014 2007–2014Largest Increases
NEW YORK 3,160 / 4.1% NEW YORK 17,989 / 28.7%
MASSACHUSETTS 2,208 / 11.6% MASSACHUSETTS 6,110 / 40.4%
NEVADA 2,113 / 25.0% DISTRICT OF COLUMBIA 2,428 / 45.6%
DISTRICT OF COLUMBIA 883 / 12.9% MINNESOTA 1,054 / 14.4%
MICHIGAN 700 / 6.1% MISSOURI 1,035 / 16.6%Largest Decreases
FLORIDA -6,320 / -13.2% CALIFORNIA -25,034 / -18.0%
CALIFORNIA -4,600 / -3.9% TEXAS -11,293 / -28.4%
OREGON -1,658 / -12.0% FLORIDA -6,527 / -13.6%
SOUTH CAROLINA -1,487 / -22.7% NEW JERSEY -5,643 / -32.6%
MISSOURI -1,299 / -15.1% OREGON -5,426 / -30.9%
10
1Estimates by CoCHomelessness in the United States
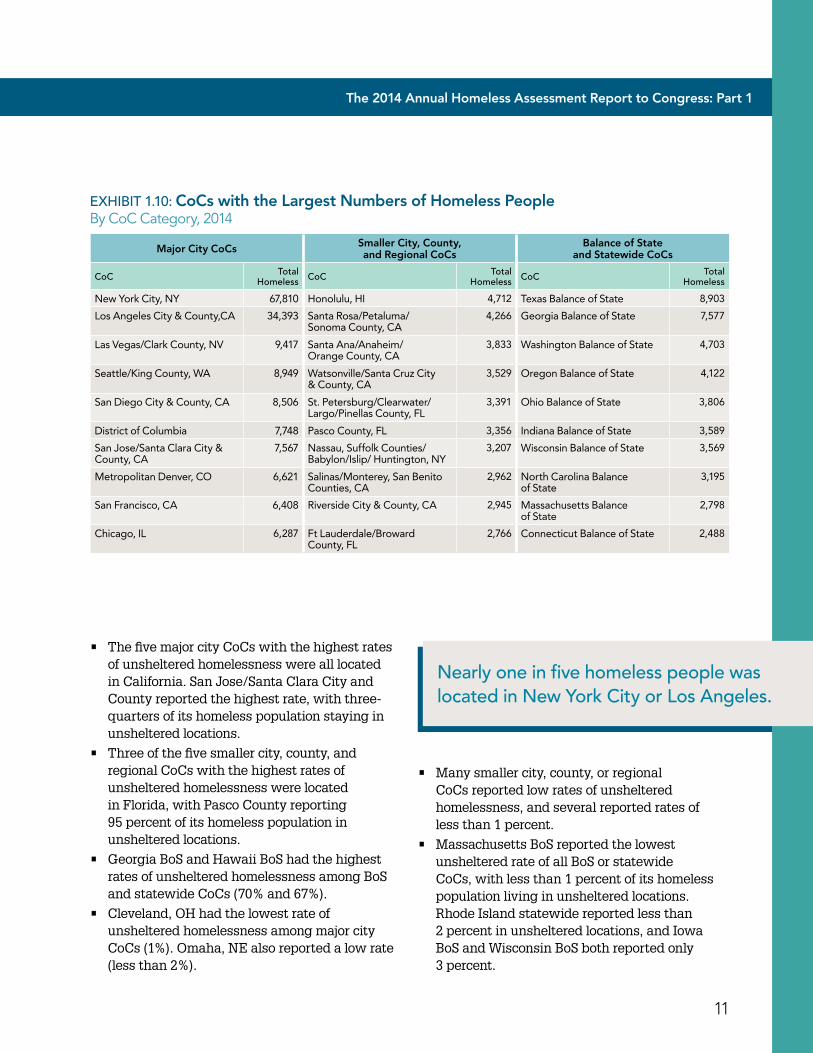
EXHIBIT 1.8: Homeless PeopleBy CoC Category and Sheltered Status, 2014
All HomelessPeople
ShelteredPeople
UnshelteredPeople
0% 100%
45.8
47.9
41.0 43.7
38.4
40.0 14.2
13.8
15.3
Major City CoCs
Smaller City, County, and Regional CoCs
Balance of State or Statewide CoCs
Data source: PIT 2007–2014; Excludes Puerto Rico and U.S. territories.
Continuums of Care (CoC) were Divided into Three Geographic Categories:
1. Major city CoCs (n=48) cover the 50 largest cities in the U.S. In two cases, two large cities were located in the same CoC.
2. Smaller city, county, and regional CoCs (n=323) are jurisdictions that are neither one of the 50 largest cities nor Balance of State or Statewide CoCs.
3. Balance of State (BoS) or statewide CoCs (n=39) are typically composed of multiple rural counties or represent an entire state.
On a Single Night in January 2014• Nearly one in five homeless people was located
in New York City (67,810 people or 12%) or Los Angeles (34,393 people or 6%).
• The 48 major city CoCs accounted for 46 percent of homeless people in the United States, or 262,058 people.
• The 10 major city CoCs with the largest numbers of homeless people nationwide accounted for 28 percent of the nation’s homeless population (163,706 people).
• Four in 10 homeless people were living in smaller cities, suburbs or regional CoCs (228,931 people).
• 14 percent of people experiencing homelessness (81,499 people) were in Balance of State (BoS) or statewide CoCs.
EXHIBIT 1.9: Change in the Numbers of Homeless PeopleBy CoC Category, 2013–2014
Total Change Sheltered Change Unsheltered Change
# % # % # %
Total Homeless -13,399 -2.3 6,385 1.6 -19,784 -10.3
Major Cities 1,825 0 .7 6,599 3 .6 -4,774 -6 .3
Smaller Cities, Counties, and Regional CoCs
-11,716 -4 .9 -1,377 -0 .9 -10,339 -12 .0
Balance of State and Statewide CoCs -3,508 -4 .1 1,163 2 .2 -4,671 -15 .0
The 2014 Annual Homeless Assessment Report to Congress: Part 1
11
EXHIBIT 1.10: CoCs with the Largest Numbers of Homeless People By CoC Category, 2014
Major City CoCs Smaller City, County, and Regional CoCs
Balance of State and Statewide CoCs
CoC Total Homeless CoC Total
Homeless CoC Total Homeless
New York City, NY 67,810 Honolulu, HI 4,712 Texas Balance of State 8,903
Los Angeles City & County,CA 34,393 Santa Rosa/Petaluma/ Sonoma County, CA
4,266 Georgia Balance of State 7,577
Las Vegas/Clark County, NV 9,417 Santa Ana/Anaheim/ Orange County, CA
3,833 Washington Balance of State 4,703
Seattle/King County, WA 8,949 Watsonville/Santa Cruz City & County, CA
3,529 Oregon Balance of State 4,122
San Diego City & County, CA 8,506 St . Petersburg/Clearwater/Largo/Pinellas County, FL
3,391 Ohio Balance of State 3,806
District of Columbia 7,748 Pasco County, FL 3,356 Indiana Balance of State 3,589
San Jose/Santa Clara City & County, CA
7,567 Nassau, Suffolk Counties/Babylon/Islip/ Huntington, NY
3,207 Wisconsin Balance of State 3,569
Metropolitan Denver, CO 6,621 Salinas/Monterey, San Benito Counties, CA
2,962 North Carolina Balance of State
3,195
San Francisco, CA 6,408 Riverside City & County, CA 2,945 Massachusetts Balance of State
2,798
Chicago, IL 6,287 Ft Lauderdale/Broward County, FL
2,766 Connecticut Balance of State 2,488
Nearly one in five homeless people was located in New York City or Los Angeles.
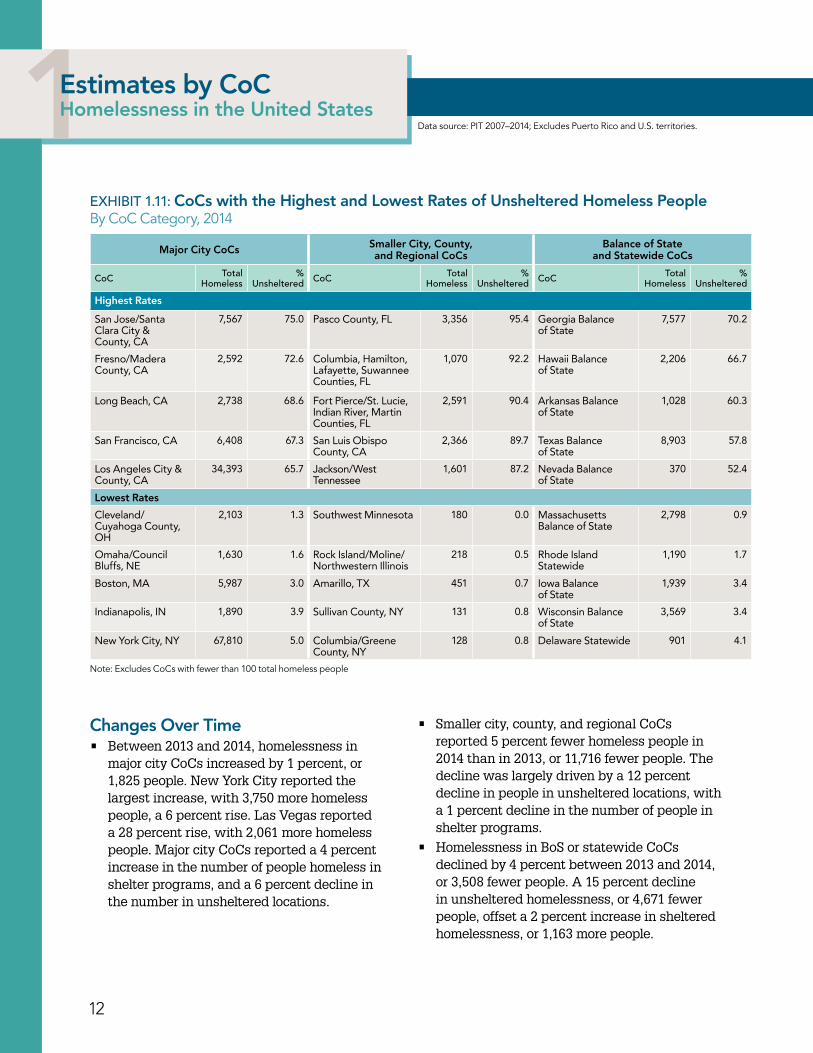
• The five major city CoCs with the highest rates of unsheltered homelessness were all located in California. San Jose/Santa Clara City and County reported the highest rate, with three-quarters of its homeless population staying in unsheltered locations.
• Three of the five smaller city, county, and regional CoCs with the highest rates of unsheltered homelessness were located in Florida, with Pasco County reporting 95 percent of its homeless population in unsheltered locations.
• Georgia BoS and Hawaii BoS had the highest rates of unsheltered homelessness among BoS and statewide CoCs (70% and 67%).
• Cleveland, OH had the lowest rate of unsheltered homelessness among major city CoCs (1%). Omaha, NE also reported a low rate (less than 2%).
• Many smaller city, county, or regional CoCs reported low rates of unsheltered homelessness, and several reported rates of less than 1 percent.
• Massachusetts BoS reported the lowest unsheltered rate of all BoS or statewide CoCs, with less than 1 percent of its homeless population living in unsheltered locations. Rhode Island statewide reported less than 2 percent in unsheltered locations, and Iowa BoS and Wisconsin BoS both reported only 3 percent.
12
National Estimates Homelessness in the United States
EXHIBIT 1.11: CoCs with the Highest and Lowest Rates of Unsheltered Homeless People By CoC Category, 2014
Major City CoCs Smaller City, County, and Regional CoCs
Balance of State and Statewide CoCs
CoC Total Homeless
% Unsheltered CoC Total
Homeless%
Unsheltered CoC Total Homeless
% Unsheltered
Highest Rates
San Jose/Santa Clara City & County, CA
7,567 75 .0 Pasco County, FL 3,356 95 .4 Georgia Balance of State
7,577 70 .2
Fresno/Madera County, CA
2,592 72 .6 Columbia, Hamilton, Lafayette, Suwannee Counties, FL
1,070 92 .2 Hawaii Balance of State
2,206 66 .7
Long Beach, CA 2,738 68 .6 Fort Pierce/St . Lucie, Indian River, Martin Counties, FL
2,591 90 .4 Arkansas Balance of State
1,028 60 .3
San Francisco, CA 6,408 67 .3 San Luis Obispo County, CA
2,366 89 .7 Texas Balance of State
8,903 57 .8
Los Angeles City & County, CA
34,393 65 .7 Jackson/West Tennessee
1,601 87 .2 Nevada Balance of State
370 52 .4
Lowest Rates
Cleveland/Cuyahoga County, OH
2,103 1 .3 Southwest Minnesota 180 0 .0 Massachusetts Balance of State
2,798 0 .9
Omaha/Council Bluffs, NE
1,630 1 .6 Rock Island/Moline/Northwestern Illinois
218 0 .5 Rhode Island Statewide
1,190 1 .7
Boston, MA 5,987 3 .0 Amarillo, TX 451 0 .7 Iowa Balance of State
1,939 3 .4
Indianapolis, IN 1,890 3 .9 Sullivan County, NY 131 0 .8 Wisconsin Balance of State
3,569 3 .4
New York City, NY 67,810 5 .0 Columbia/Greene County, NY
128 0 .8 Delaware Statewide 901 4 .1
Data source: PIT 2007–2014; Excludes Puerto Rico and U.S. territories.1Estimates by CoCHomelessness in the United States
Changes Over Time• Between 2013 and 2014, homelessness in
major city CoCs increased by 1 percent, or 1,825 people. New York City reported the largest increase, with 3,750 more homeless people, a 6 percent rise. Las Vegas reported a 28 percent rise, with 2,061 more homeless people. Major city CoCs reported a 4 percent increase in the number of people homeless in shelter programs, and a 6 percent decline in the number in unsheltered locations.
• Smaller city, county, and regional CoCs reported 5 percent fewer homeless people in 2014 than in 2013, or 11,716 fewer people. The decline was largely driven by a 12 percent decline in people in unsheltered locations, with a 1 percent decline in the number of people in shelter programs.
• Homelessness in BoS or statewide CoCs declined by 4 percent between 2013 and 2014, or 3,508 fewer people. A 15 percent decline in unsheltered homelessness, or 4,671 fewer people, offset a 2 percent increase in sheltered homelessness, or 1,163 more people.
Note: Excludes CoCs with fewer than 100 total homeless people

The 2014 Annual Homeless Assessment Report to Congress: Part 1
13
14
1National Estimates Homelessness in the United States2National Estimates Homeless Individuals
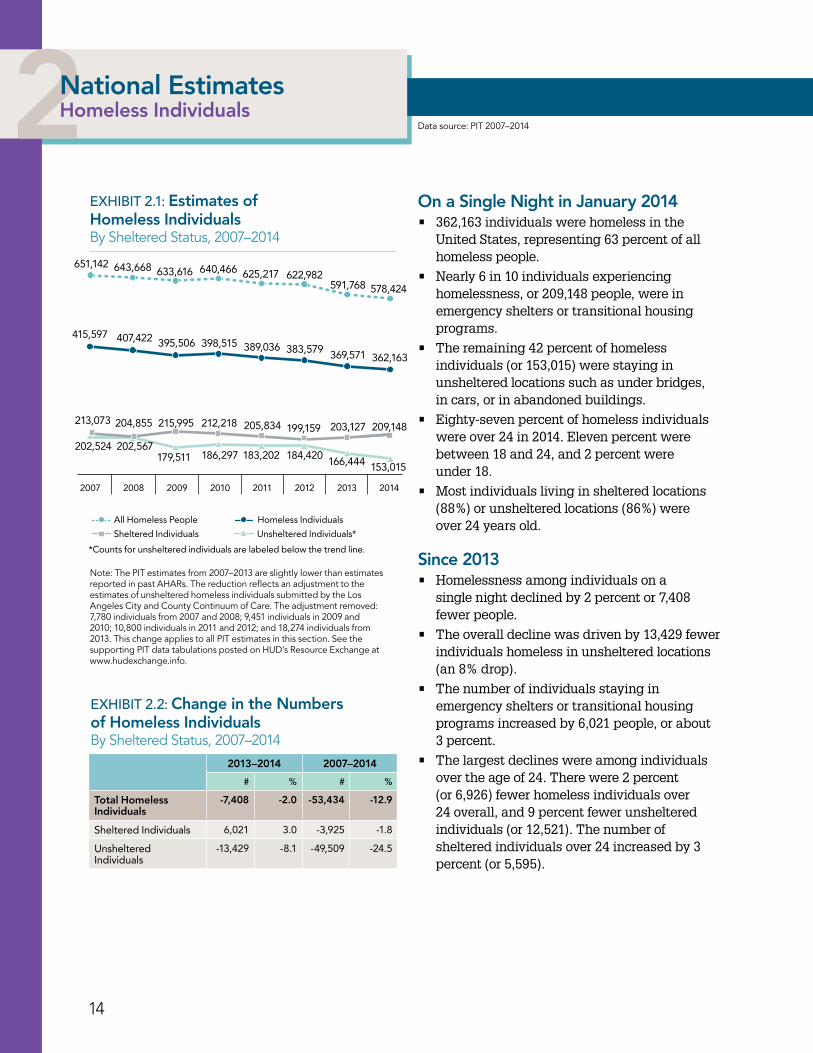
On a Single Night in January 2014• 362,163 individuals were homeless in the
United States, representing 63 percent of all homeless people.
• Nearly 6 in 10 individuals experiencing homelessness, or 209,148 people, were in emergency shelters or transitional housing programs.
• The remaining 42 percent of homeless individuals (or 153,015) were staying in unsheltered locations such as under bridges, in cars, or in abandoned buildings.
• Eighty-seven percent of homeless individuals were over 24 in 2014. Eleven percent were between 18 and 24, and 2 percent were under 18.
• Most individuals living in sheltered locations (88%) or unsheltered locations (86%) were over 24 years old.
Since 2013• Homelessness among individuals on a
single night declined by 2 percent or 7,408 fewer people.
• The overall decline was driven by 13,429 fewer individuals homeless in unsheltered locations (an 8% drop).
• The number of individuals staying in emergency shelters or transitional housing programs increased by 6,021 people, or about 3 percent.
• The largest declines were among individuals over the age of 24. There were 2 percent (or 6,926) fewer homeless individuals over 24 overall, and 9 percent fewer unsheltered individuals (or 12,521). The number of sheltered individuals over 24 increased by 3 percent (or 5,595).
EXHIBIT 2.1: Estimates of Homeless Individuals By Sheltered Status, 2007–2014
2007 2008 2009 2010 20122011
All Homeless People
Sheltered Individuals Unsheltered Individuals*
Homeless Individuals
2013 2014
213,073
202,524 202,567179,511 186,297 183,202 184,420 166,444 153,015
204,855 215,995 212,218 205,834 199,159 203,127 209,148
*Counts for unsheltered individuals are labeled below the trend line.
415,597 407,422 395,506 398,515 389,036 383,579 369,571 362,163
651,142 643,668 633,616 640,466 625,217 622,982591,768 578,424
Data source: PIT 2007–2014
EXHIBIT 2.2: Change in the Numbers of Homeless IndividualsBy Sheltered Status, 2007–2014
2013–2014 2007–2014
# % # %
Total Homeless Individuals
-7,408 -2.0 -53,434 -12.9
Sheltered Individuals 6,021 3 .0 -3,925 -1 .8
Unsheltered Individuals
-13,429 -8 .1 -49,509 -24 .5
Note: The PIT estimates from 2007–2013 are slightly lower than estimates reported in past AHARs. The reduction reflects an adjustment to the estimates of unsheltered homeless individuals submitted by the Los Angeles City and County Continuum of Care. The adjustment removed: 7,780 individuals from 2007 and 2008; 9,451 individuals in 2009 and 2010; 10,800 individuals in 2011 and 2012; and 18,274 individuals from 2013. This change applies to all PIT estimates in this section. See the supporting PIT data tabulations posted on HUD’s Resource Exchange at www.hudexchange.info.
The 2014 Annual Homeless Assessment Report to Congress: Part 1
15
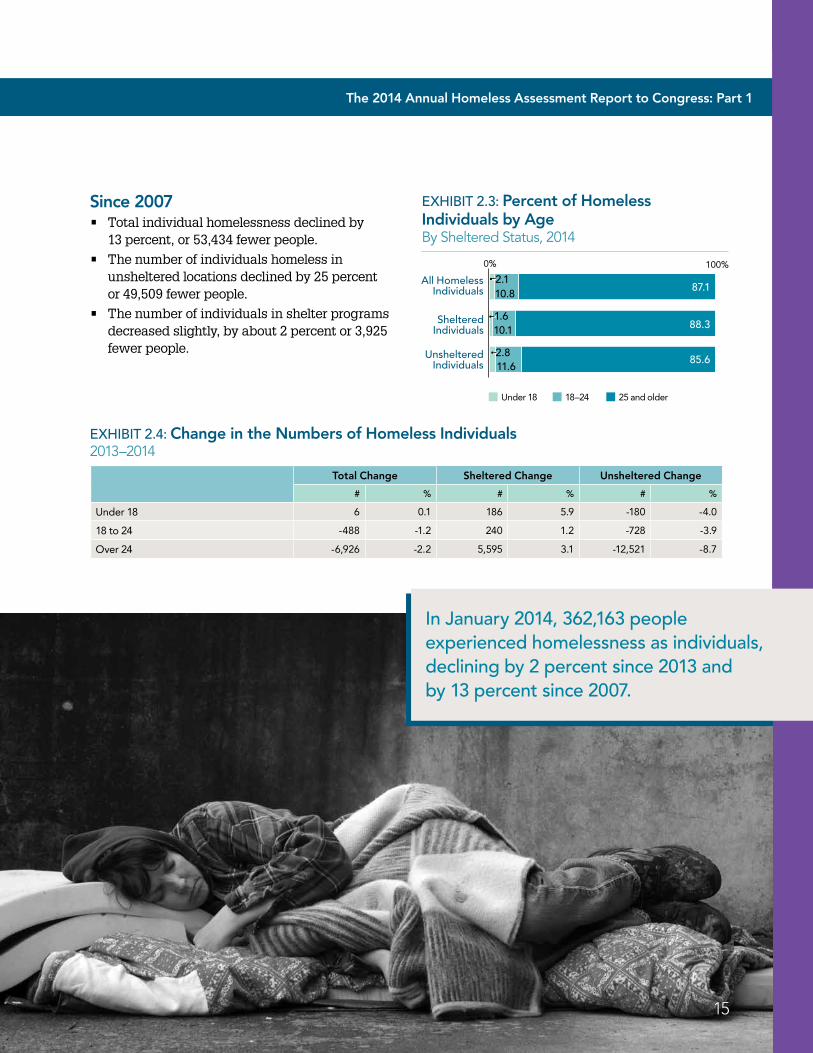
Since 2007 • Total individual homelessness declined by
13 percent, or 53,434 fewer people.
• The number of individuals homeless in unsheltered locations declined by 25 percent or 49,509 fewer people.
• The number of individuals in shelter programs decreased slightly, by about 2 percent or 3,925 fewer people.
EXHIBIT 2.4: Change in the Numbers of Homeless Individuals2013–2014
EXHIBIT 2.3: Percent of Homeless Individuals by Age By Sheltered Status, 2014
All HomelessIndividuals
ShelteredIndividuals
UnshelteredIndividuals
0% 100%
87.1
88.3
85.6
2.1
1.6
2.8
10.8
10.1
11.6
Under 18 18–24 25 and older
Total Change Sheltered Change Unsheltered Change
# % # % # %
Under 18 6 0 .1 186 5 .9 -180 -4 .0
18 to 24 -488 -1 .2 240 1 .2 -728 -3 .9
Over 24 -6,926 -2 .2 5,595 3 .1 -12,521 -8 .7
In January 2014, 362,163 people experienced homelessness as individuals, declining by 2 percent since 2013 and by 13 percent since 2007.
16
1National Estimates Homelessness in the United States2State Estimates Homeless Individuals
EXHIBIT 2.4: Estimates of Homeless Individuals By State, 2014
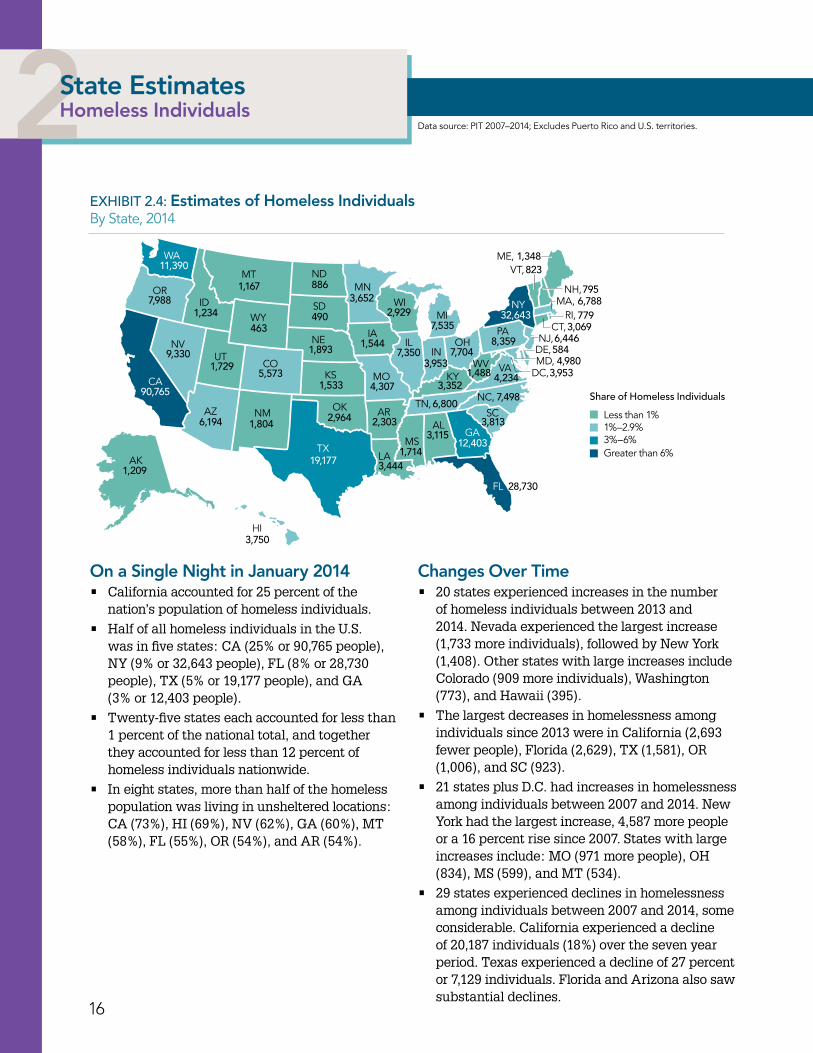
On a Single Night in January 2014• California accounted for 25 percent of the
nation’s population of homeless individuals.
• Half of all homeless individuals in the U.S. was in five states: CA (25% or 90,765 people), NY (9% or 32,643 people), FL (8% or 28,730 people), TX (5% or 19,177 people), and GA (3% or 12,403 people).
• Twenty-five states each accounted for less than 1 percent of the national total, and together they accounted for less than 12 percent of homeless individuals nationwide.
• In eight states, more than half of the homeless population was living in unsheltered locations: CA (73%), HI (69%), NV (62%), GA (60%), MT (58%), FL (55%), OR (54%), and AR (54%).
463
1,729
1,804
490
1,893
5,573
6,194
1,533
2,964
3,750
1,544
4,307
2,9297,535
3,652
3,4441,714
3,1152,303
8861,167
1,234
11,390
90,765
1,209
584
3,9534,980
8,359
4,234
7,498
7796,788
3,0696,446
795
8231,348
1,488
3,813
12,403
28,730
19,177
32,643
3,9537,7047,350
6,800
7,988
9,330
3,352
ME,
NH,
VT,
NY MA,RI,
CT,NJ,
DE,
DC,
PA
VAWV
NC,
SC
GA
FL
AL
TN,
KY
OHIL
MIWI
MN
IA
MO
AR
LATX
OK
KS
NE
SD
NDMT
WA
OR
CA
AK
HI
WY
CO
NMAZ
UTNV
ID
IN
MS
MD,
Share of Homeless Individuals
Less than 1%1%–2.9%
Greater than 6%3%–6%
Changes Over Time• 20 states experienced increases in the number
of homeless individuals between 2013 and 2014. Nevada experienced the largest increase (1,733 more individuals), followed by New York (1,408). Other states with large increases include Colorado (909 more individuals), Washington (773), and Hawaii (395).
• The largest decreases in homelessness among individuals since 2013 were in California (2,693 fewer people), Florida (2,629), TX (1,581), OR (1,006), and SC (923).
• 21 states plus D.C. had increases in homelessness among individuals between 2007 and 2014. New York had the largest increase, 4,587 more people or a 16 percent rise since 2007. States with large increases include: MO (971 more people), OH (834), MS (599), and MT (534).
• 29 states experienced declines in homelessness among individuals between 2007 and 2014, some considerable. California experienced a decline of 20,187 individuals (18%) over the seven year period. Texas experienced a decline of 27 percent or 7,129 individuals. Florida and Arizona also saw substantial declines.
Data source: PIT 2007–2014; Excludes Puerto Rico and U.S. territories.
17
The 2014 Annual Homeless Assessment Report to Congress: Part 1
EXHIBIT 2.7: Largest Changes in the Numbers of Homeless IndividualsBy State, 2007–2014
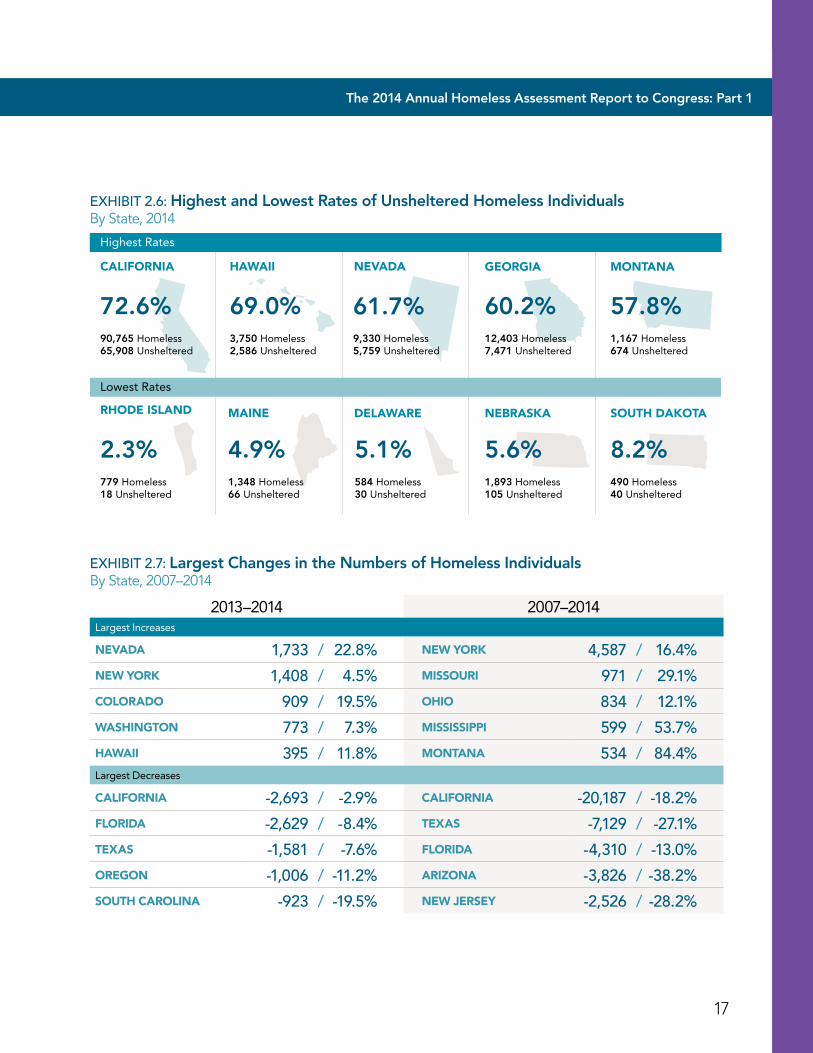
2013–2014 2007–2014Largest Increases
NEVADA 1,733 / 22.8% NEW YORK 4,587 / 16.4%
NEW YORK 1,408 / 4.5% MISSOURI 971 / 29.1%
COLORADO 909 / 19.5% OHIO 834 / 12.1%
WASHINGTON 773 / 7.3% MISSISSIPPI 599 / 53.7%
HAWAII 395 / 11.8% MONTANA 534 / 84.4%Largest Decreases
CALIFORNIA -2,693 / -2.9% CALIFORNIA -20,187 / -18.2%
FLORIDA -2,629 / -8.4% TEXAS -7,129 / -27.1%
TEXAS -1,581 / -7.6% FLORIDA -4,310 / -13.0%
OREGON -1,006 / -11.2% ARIZONA -3,826 / -38.2%
SOUTH CAROLINA -923 / -19.5% NEW JERSEY -2,526 / -28.2%
EXHIBIT 2.6: Highest and Lowest Rates of Unsheltered Homeless IndividualsBy State, 2014
CALIFORNIA
90,765 Homeless65,908 Unsheltered
72.6%
RHODE ISLAND
779 Homeless18 Unsheltered
2.3%1,348 Homeless66 Unsheltered
4.9%584 Homeless30 Unsheltered
5.1%
GEORGIA MONTANA
9,330 Homeless5,759 Unsheltered
61.7%12,403 Homeless7,471 Unsheltered
60.2%
HAWAII NEVADA
3,750 Homeless2,586 Unsheltered
69.0%1,167 Homeless674 Unsheltered
57.8%
SOUTH DAKOTADELAWAREMAINE
1,893 Homeless105 Unsheltered
5.6%490 Homeless40 Unsheltered
8.2%
NEBRASKA
Lowest Rates
Highest Rates
18
1National Estimates Homelessness in the United States2Estimates by CoCHomeless Individuals
EXHIBIT 2.8: Homeless Individuals By CoC Category and Sheltered Status, 2014
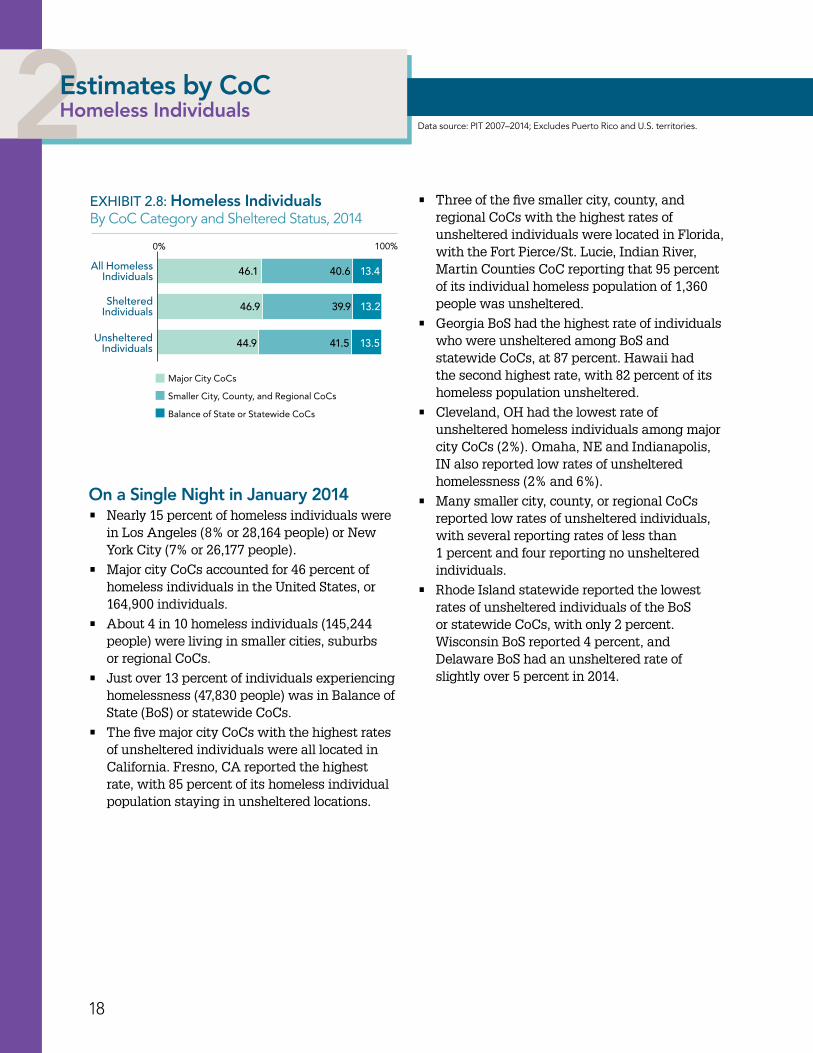
On a Single Night in January 2014• Nearly 15 percent of homeless individuals were
in Los Angeles (8% or 28,164 people) or New York City (7% or 26,177 people).
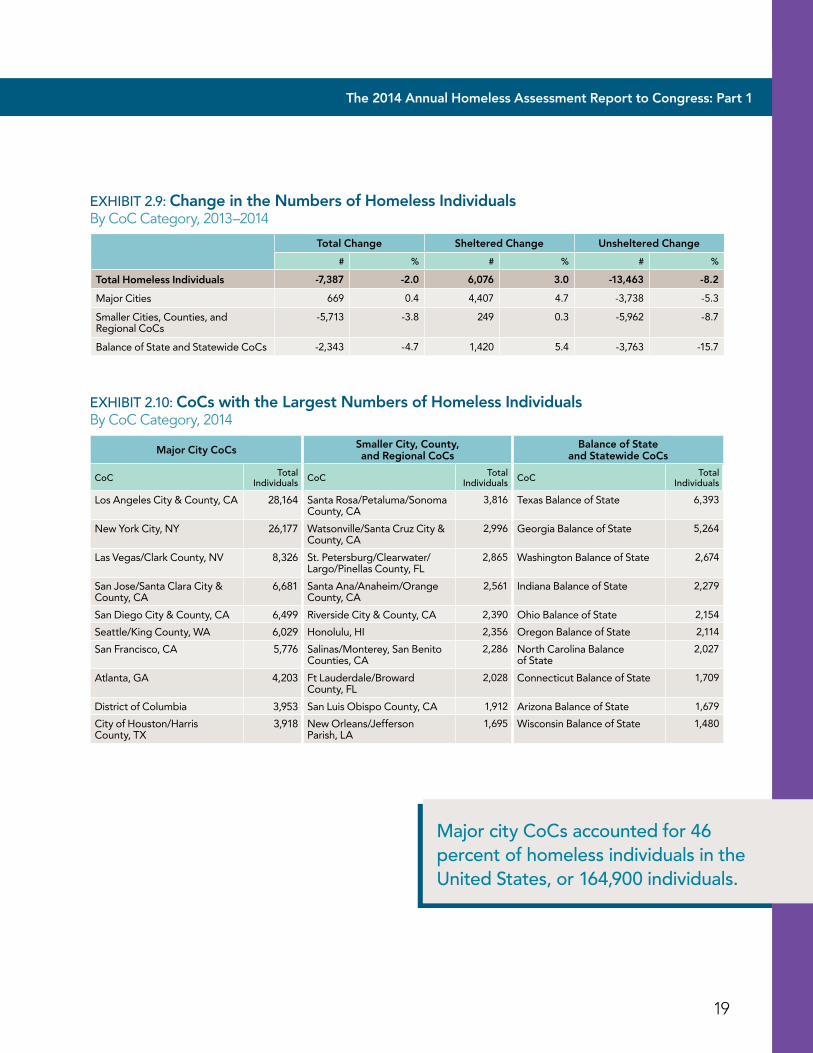
• Major city CoCs accounted for 46 percent of homeless individuals in the United States, or 164,900 individuals.
• About 4 in 10 homeless individuals (145,244 people) were living in smaller cities, suburbs or regional CoCs.
• Just over 13 percent of individuals experiencing homelessness (47,830 people) was in Balance of State (BoS) or statewide CoCs.
• The five major city CoCs with the highest rates of unsheltered individuals were all located in California. Fresno, CA reported the highest rate, with 85 percent of its homeless individual population staying in unsheltered locations.
• Three of the five smaller city, county, and regional CoCs with the highest rates of unsheltered individuals were located in Florida, with the Fort Pierce/St. Lucie, Indian River, Martin Counties CoC reporting that 95 percent of its individual homeless population of 1,360 people was unsheltered.
• Georgia BoS had the highest rate of individuals who were unsheltered among BoS and statewide CoCs, at 87 percent. Hawaii had the second highest rate, with 82 percent of its homeless population unsheltered.
• Cleveland, OH had the lowest rate of unsheltered homeless individuals among major city CoCs (2%). Omaha, NE and Indianapolis, IN also reported low rates of unsheltered homelessness (2% and 6%).
• Many smaller city, county, or regional CoCs reported low rates of unsheltered individuals, with several reporting rates of less than 1 percent and four reporting no unsheltered individuals.
• Rhode Island statewide reported the lowest rates of unsheltered individuals of the BoS or statewide CoCs, with only 2 percent. Wisconsin BoS reported 4 percent, and Delaware BoS had an unsheltered rate of slightly over 5 percent in 2014.
All HomelessIndividuals
ShelteredIndividuals
UnshelteredIndividuals
0% 100%
46.1
46.9
44.9 41.5
39.9
40.6 13.4
13.2
13.5
Major City CoCs
Smaller City, County, and Regional CoCs
Balance of State or Statewide CoCs
Data source: PIT 2007–2014; Excludes Puerto Rico and U.S. territories.
The 2014 Annual Homeless Assessment Report to Congress: Part 1
19
EXHIBIT 2.10: CoCs with the Largest Numbers of Homeless Individuals By CoC Category, 2014
Major City CoCs Smaller City, County, and Regional CoCs
Balance of State and Statewide CoCs
CoC Total Individuals CoC Total
Individuals CoC Total Individuals
Los Angeles City & County, CA 28,164 Santa Rosa/Petaluma/Sonoma County, CA
3,816 Texas Balance of State 6,393
New York City, NY 26,177 Watsonville/Santa Cruz City & County, CA
2,996 Georgia Balance of State 5,264
Las Vegas/Clark County, NV 8,326 St . Petersburg/Clearwater/Largo/Pinellas County, FL
2,865 Washington Balance of State 2,674
San Jose/Santa Clara City & County, CA
6,681 Santa Ana/Anaheim/Orange County, CA
2,561 Indiana Balance of State 2,279
San Diego City & County, CA 6,499 Riverside City & County, CA 2,390 Ohio Balance of State 2,154
Seattle/King County, WA 6,029 Honolulu, HI 2,356 Oregon Balance of State 2,114
San Francisco, CA 5,776 Salinas/Monterey, San Benito Counties, CA
2,286 North Carolina Balance of State
2,027
Atlanta, GA 4,203 Ft Lauderdale/Broward County, FL
2,028 Connecticut Balance of State 1,709
District of Columbia 3,953 San Luis Obispo County, CA 1,912 Arizona Balance of State 1,679
City of Houston/Harris County, TX
3,918 New Orleans/Jefferson Parish, LA
1,695 Wisconsin Balance of State 1,480
EXHIBIT 2.9: Change in the Numbers of Homeless IndividualsBy CoC Category, 2013–2014
Total Change Sheltered Change Unsheltered Change
# % # % # %
Total Homeless Individuals -7,387 -2.0 6,076 3.0 -13,463 -8.2
Major Cities 669 0 .4 4,407 4 .7 -3,738 -5 .3
Smaller Cities, Counties, and Regional CoCs
-5,713 -3 .8 249 0 .3 -5,962 -8 .7
Balance of State and Statewide CoCs -2,343 -4 .7 1,420 5 .4 -3,763 -15 .7
Major city CoCs accounted for 46 percent of homeless individuals in the United States, or 164,900 individuals.
20
1National Estimates Homelessness in the United States2
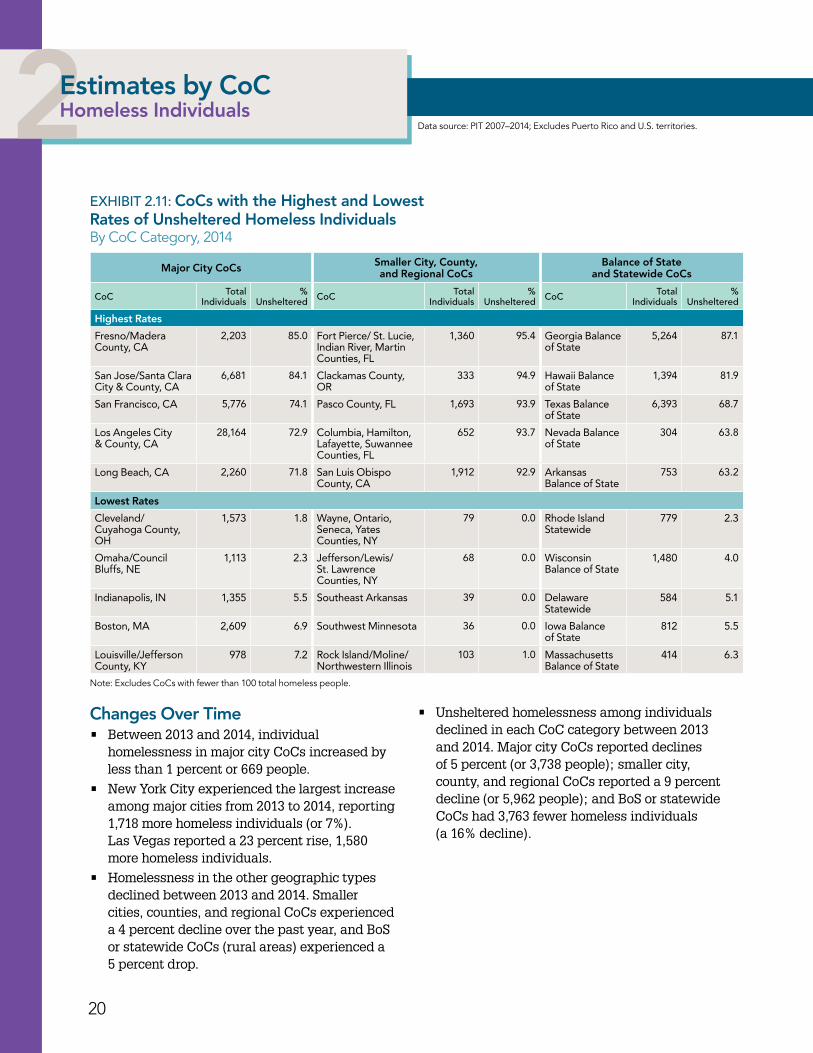
Changes Over Time• Between 2013 and 2014, individual
homelessness in major city CoCs increased by less than 1 percent or 669 people.
• New York City experienced the largest increase among major cities from 2013 to 2014, reporting 1,718 more homeless individuals (or 7%). Las Vegas reported a 23 percent rise, 1,580 more homeless individuals.
• Homelessness in the other geographic types declined between 2013 and 2014. Smaller cities, counties, and regional CoCs experienced a 4 percent decline over the past year, and BoS or statewide CoCs (rural areas) experienced a 5 percent drop.
EXHIBIT 2.11: CoCs with the Highest and Lowest Rates of Unsheltered Homeless Individuals By CoC Category, 2014
• Unsheltered homelessness among individuals declined in each CoC category between 2013 and 2014. Major city CoCs reported declines of 5 percent (or 3,738 people); smaller city, county, and regional CoCs reported a 9 percent decline (or 5,962 people); and BoS or statewide CoCs had 3,763 fewer homeless individuals (a 16% decline).
Major City CoCs Smaller City, County, and Regional CoCs
Balance of State and Statewide CoCs
CoC Total Individuals
% Unsheltered CoC Total
Individuals%
Unsheltered CoC Total Individuals
% Unsheltered
Highest Rates
Fresno/Madera County, CA
2,203 85 .0 Fort Pierce/ St . Lucie, Indian River, Martin Counties, FL
1,360 95 .4 Georgia Balance of State
5,264 87 .1
San Jose/Santa Clara City & County, CA
6,681 84 .1 Clackamas County, OR
333 94 .9 Hawaii Balance of State
1,394 81 .9
San Francisco, CA 5,776 74 .1 Pasco County, FL 1,693 93 .9 Texas Balance of State
6,393 68 .7
Los Angeles City & County, CA
28,164 72 .9 Columbia, Hamilton, Lafayette, Suwannee Counties, FL
652 93 .7 Nevada Balance of State
304 63 .8
Long Beach, CA 2,260 71 .8 San Luis Obispo County, CA
1,912 92 .9 Arkansas Balance of State
753 63 .2
Lowest Rates
Cleveland/ Cuyahoga County, OH
1,573 1 .8 Wayne, Ontario, Seneca, Yates Counties, NY
79 0 .0 Rhode Island Statewide
779 2 .3
Omaha/Council Bluffs, NE
1,113 2 .3 Jefferson/Lewis/ St . Lawrence Counties, NY
68 0 .0 Wisconsin Balance of State
1,480 4 .0
Indianapolis, IN 1,355 5 .5 Southeast Arkansas 39 0 .0 Delaware Statewide
584 5 .1
Boston, MA 2,609 6 .9 Southwest Minnesota 36 0 .0 Iowa Balance of State
812 5 .5
Louisville/Jefferson County, KY
978 7 .2 Rock Island/Moline/ Northwestern Illinois
103 1 .0 Massachusetts Balance of State
414 6 .3
Estimates by CoCHomeless Individuals
Data source: PIT 2007–2014; Excludes Puerto Rico and U.S. territories.
Note: Excludes CoCs with fewer than 100 total homeless people.
The 2014 Annual Homeless Assessment Report to Congress: Part 1
21
22
1National Estimates Homelessness in the United States3National Estimates Homeless Families
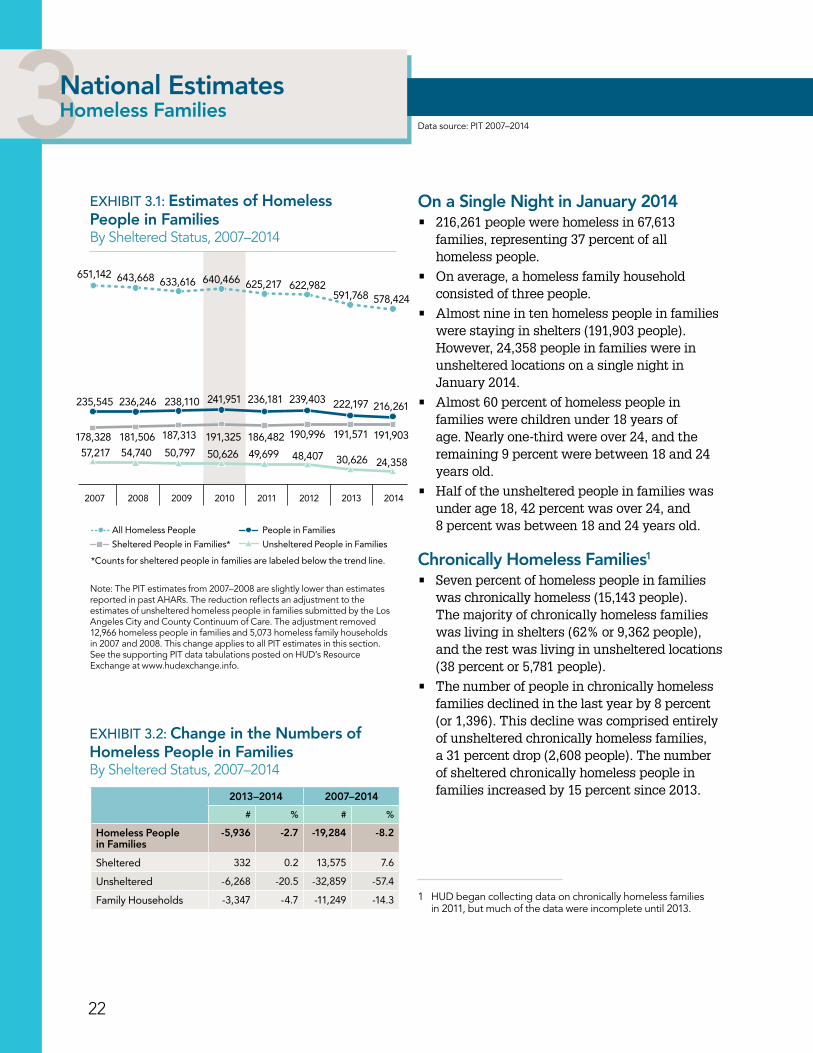
EXHIBIT 3.1: Estimates of Homeless People in Families By Sheltered Status, 2007–2014
On a Single Night in January 2014• 216,261 people were homeless in 67,613
families, representing 37 percent of all homeless people.
• On average, a homeless family household consisted of three people.
• Almost nine in ten homeless people in families were staying in shelters (191,903 people). However, 24,358 people in families were in unsheltered locations on a single night in January 2014.
• Almost 60 percent of homeless people in families were children under 18 years of age. Nearly one-third were over 24, and the remaining 9 percent were between 18 and 24 years old.
• Half of the unsheltered people in families was under age 18, 42 percent was over 24, and 8 percent was between 18 and 24 years old.
Chronically Homeless Families1
• Seven percent of homeless people in families was chronically homeless (15,143 people). The majority of chronically homeless families was living in shelters (62% or 9,362 people), and the rest was living in unsheltered locations (38 percent or 5,781 people).
• The number of people in chronically homeless families declined in the last year by 8 percent (or 1,396). This decline was comprised entirely of unsheltered chronically homeless families, a 31 percent drop (2,608 people). The number of sheltered chronically homeless people in families increased by 15 percent since 2013.
All Homeless People
Sheltered People in Families* Unsheltered People in Families
People in Families
*Counts for sheltered people in families are labeled below the trend line.
2007 2008 2009 2010 20122011 2013 2014
651,142 643,668 633,616 640,466 625,217 622,982591,768 578,424
235,545 236,246 238,110 241,951 236,181 239,403 222,197 216,261
178,328
57,217 54,740 50,797 50,626 49,699 48,407 30,626 24,358
181,506 187,313 191,325 186,482 190,996 191,571 191,903
Data source: PIT 2007–2014
Note: The PIT estimates from 2007–2008 are slightly lower than estimates reported in past AHARs. The reduction reflects an adjustment to the estimates of unsheltered homeless people in families submitted by the Los Angeles City and County Continuum of Care. The adjustment removed 12,966 homeless people in families and 5,073 homeless family households in 2007 and 2008. This change applies to all PIT estimates in this section. See the supporting PIT data tabulations posted on HUD’s Resource Exchange at www.hudexchange.info.
EXHIBIT 3.2: Change in the Numbers of Homeless People in FamiliesBy Sheltered Status, 2007–2014
2013–2014 2007–2014
# % # %
Homeless People in Families
-5,936 -2.7 -19,284 -8.2
Sheltered 332 0 .2 13,575 7 .6
Unsheltered -6,268 -20 .5 -32,859 -57 .4
Family Households -3,347 -4 .7 -11,249 -14 .3 1 HUD began collecting data on chronically homeless families in 2011, but much of the data were incomplete until 2013.
23
The 2014 Annual Homeless Assessment Report to Congress: Part 1
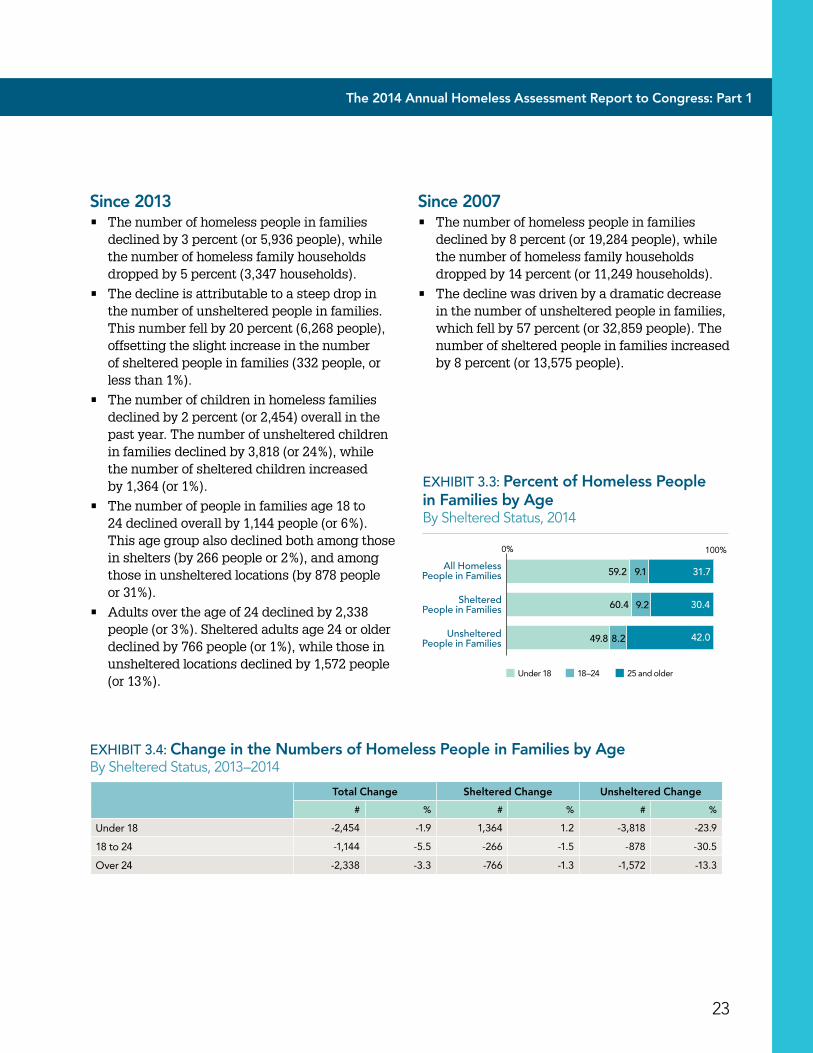
EXHIBIT 3.3: Percent of Homeless People in Families by Age By Sheltered Status, 2014
EXHIBIT 3.4: Change in the Numbers of Homeless People in Families by Age By Sheltered Status, 2013–2014
Since 2013• The number of homeless people in families
declined by 3 percent (or 5,936 people), while the number of homeless family households dropped by 5 percent (3,347 households).
• The decline is attributable to a steep drop in the number of unsheltered people in families. This number fell by 20 percent (6,268 people), offsetting the slight increase in the number of sheltered people in families (332 people, or less than 1%).
• The number of children in homeless families declined by 2 percent (or 2,454) overall in the past year. The number of unsheltered children in families declined by 3,818 (or 24%), while the number of sheltered children increased by 1,364 (or 1%).
• The number of people in families age 18 to 24 declined overall by 1,144 people (or 6%). This age group also declined both among those in shelters (by 266 people or 2%), and among those in unsheltered locations (by 878 people or 31%).
• Adults over the age of 24 declined by 2,338 people (or 3%). Sheltered adults age 24 or older declined by 766 people (or 1%), while those in unsheltered locations declined by 1,572 people (or 13%).
All HomelessPeople in Families
ShelteredPeople in Families
UnshelteredPeople in Families
0% 100%
Under 18 18–24 25 and older
59.2
60.4
49.8
9.1
9.2
8.2
31.7
30.4
42.0
Since 2007• The number of homeless people in families
declined by 8 percent (or 19,284 people), while the number of homeless family households dropped by 14 percent (or 11,249 households).
• The decline was driven by a dramatic decrease in the number of unsheltered people in families, which fell by 57 percent (or 32,859 people). The number of sheltered people in families increased by 8 percent (or 13,575 people).
Total Change Sheltered Change Unsheltered Change
# % # % # %
Under 18 -2,454 -1 .9 1,364 1 .2 -3,818 -23 .9
18 to 24 -1,144 -5 .5 -266 -1 .5 -878 -30 .5
Over 24 -2,338 -3 .3 -766 -1 .3 -1,572 -13 .3
24
1National Estimates Homelessness in the United States3State Estimates Homeless Families
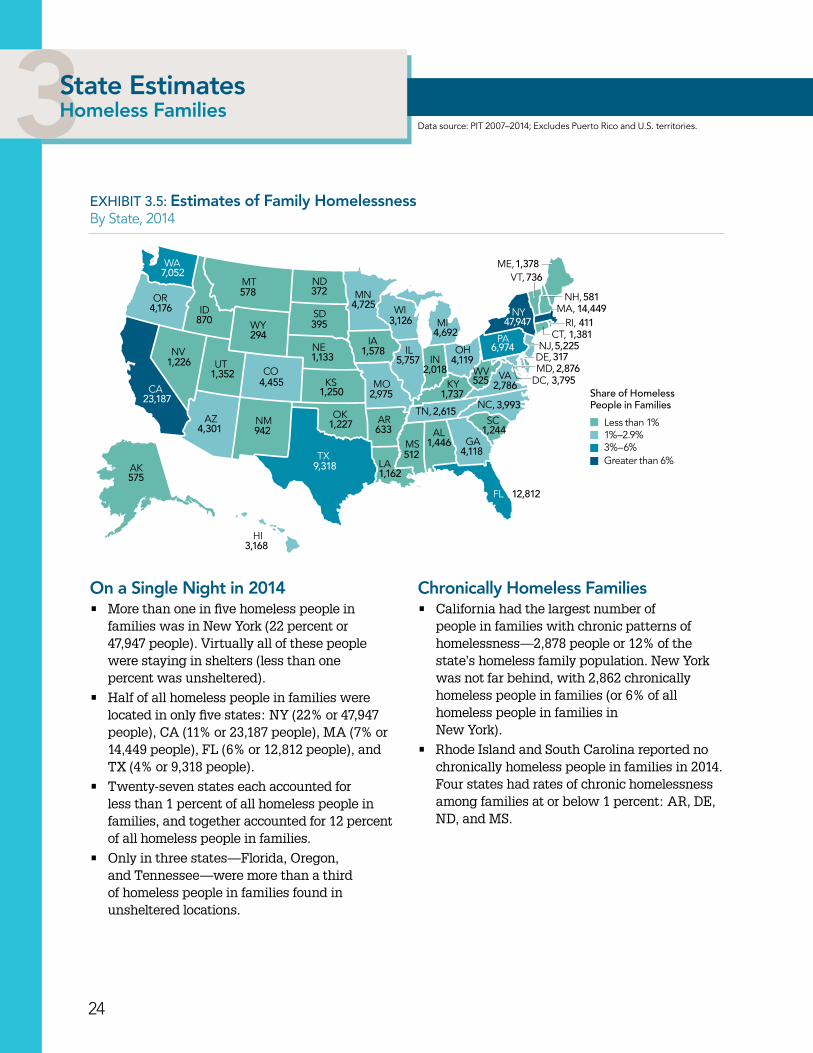
EXHIBIT 3.5: Estimates of Family Homelessness By State, 2014
On a Single Night in 2014• More than one in five homeless people in
families was in New York (22 percent or 47,947 people). Virtually all of these people were staying in shelters (less than one percent was unsheltered).
• Half of all homeless people in families were located in only five states: NY (22% or 47,947 people), CA (11% or 23,187 people), MA (7% or 14,449 people), FL (6% or 12,812 people), and TX (4% or 9,318 people).
• Twenty-seven states each accounted for less than 1 percent of all homeless people in families, and together accounted for 12 percent of all homeless people in families.
• Only in three states—Florida, Oregon, and Tennessee—were more than a third of homeless people in families found in unsheltered locations.
3175,225
2,8764,119
4,692
3,795
12,812
525 2,786
3,993
2,0185,757
2,615
1,737
1,244
4,118
6331,446
41114,449
1,3816,974
47,947
581
7361,378
512
1,162
ME,
NH,
VT,
NY MA,RI,
CT,NJ,
DE,
DC,
PA
VAWV
NC,
SC
GA
FL
AL
TN,
KY
OHIL
MIWI
MN
IA
MO
AR
LATX
OK
KS
NE
SD
NDMT
WA
OR
CA
AK
HI
WY
CO
NMAZ
UTNV
ID
IN
MS
MD,
Share of Homeless People in Families
Less than 1%1%–2.9%
Greater than 6%3%–6%
294
4,455
942
575
372578
870
1,352
4,301
1,226
4,176
7,052
23,187
9,318
395
1,133 1,578
3,126
4,725
2,9751,250
1,227
3,168
Chronically Homeless Families• California had the largest number of
people in families with chronic patterns of homelessness—2,878 people or 12% of the state’s homeless family population. New York was not far behind, with 2,862 chronically homeless people in families (or 6% of all homeless people in families in New York).
• Rhode Island and South Carolina reported no chronically homeless people in families in 2014. Four states had rates of chronic homelessness among families at or below 1 percent: AR, DE, ND, and MS.
Data source: PIT 2007–2014; Excludes Puerto Rico and U.S. territories.
The 2014 Annual Homeless Assessment Report to Congress: Part 1
25
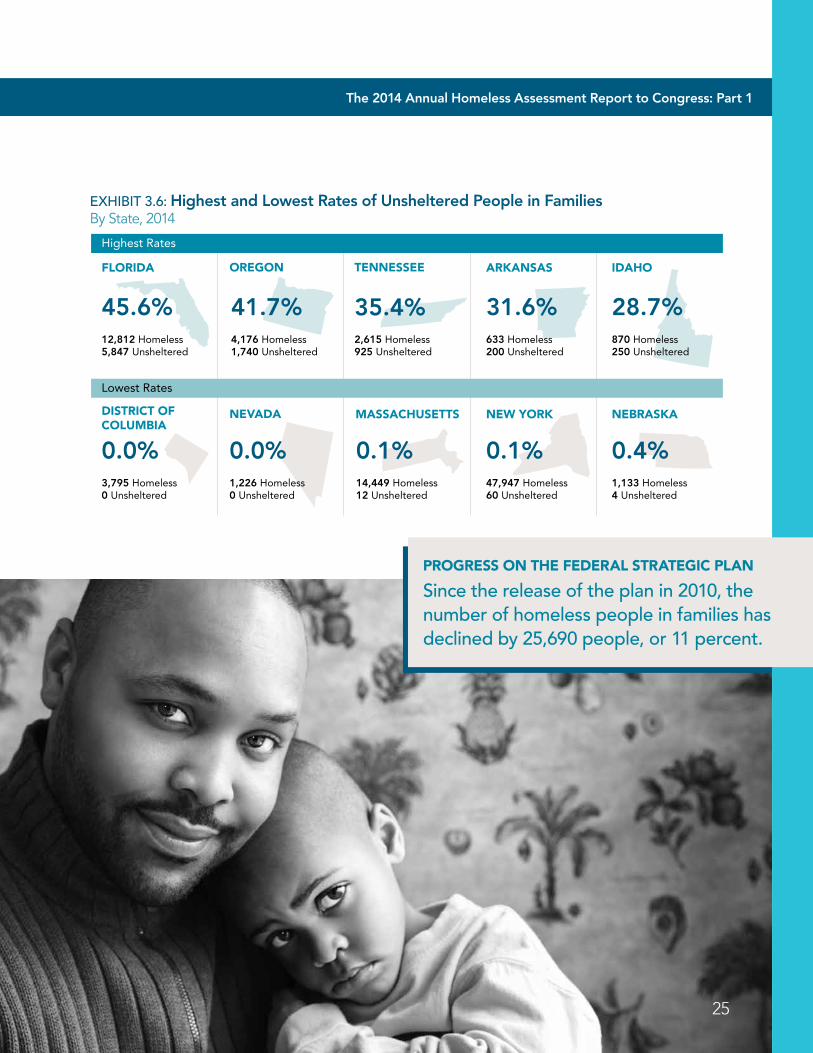
EXHIBIT 3.6: Highest and Lowest Rates of Unsheltered People in FamiliesBy State, 2014
FLORIDA OREGON TENNESSEE
12,812 Homeless5,847 Unsheltered
45.6%
DISTRICT OF COLUMBIA
3,795 Homeless0 Unsheltered
0.0%1,226 Homeless0 Unsheltered
0.0%14,449 Homeless12 Unsheltered
0.1%
ARKANSAS IDAHO
2,615 Homeless925 Unsheltered
35.4%633 Homeless200 Unsheltered
31.6%4,176 Homeless1,740 Unsheltered
41.7%870 Homeless250 Unsheltered
28.7%
NEBRASKAMASSACHUSETTSNEVADA
47,947 Homeless60 Unsheltered
0.1%1,133 Homeless4 Unsheltered
0.4%
NEW YORK
Lowest Rates
Highest Rates
PROGRESS ON THE FEDERAL STRATEGIC PLAN
Since the release of the plan in 2010, the number of homeless people in families has declined by 25,690 people, or 11 percent.
26
1National Estimates Homelessness in the United States3State Estimates Homeless Families
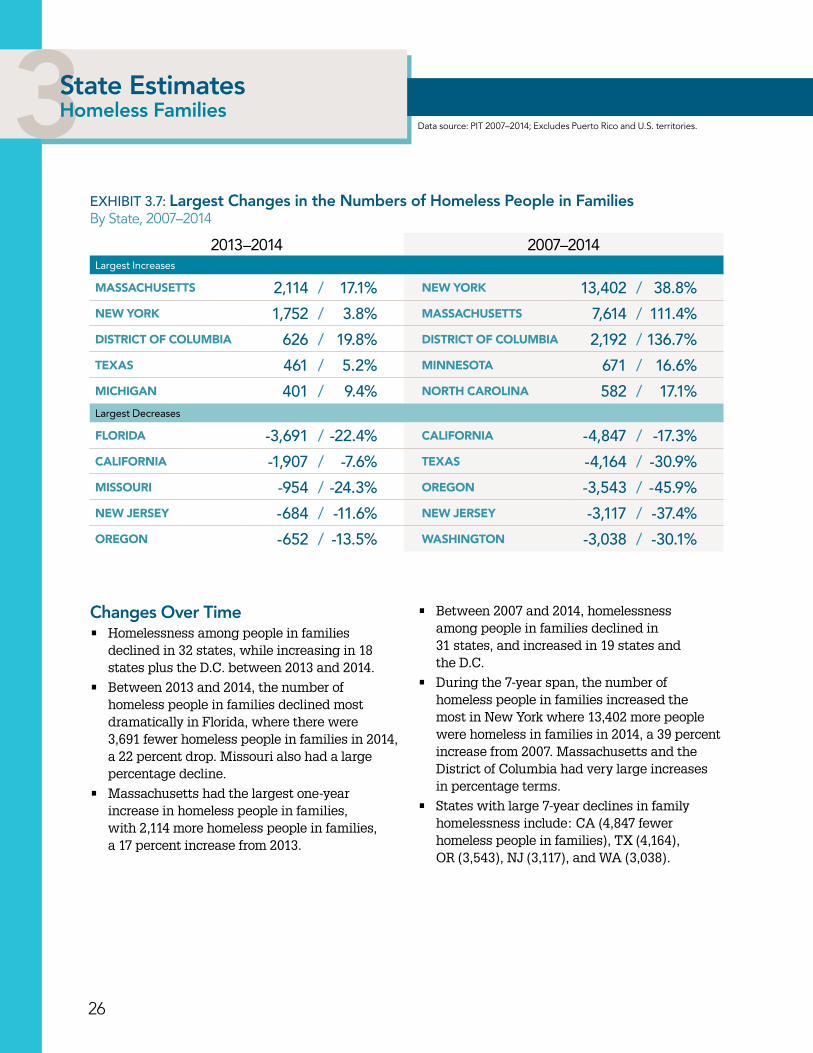
EXHIBIT 3.7: Largest Changes in the Numbers of Homeless People in FamiliesBy State, 2007–2014
2013–2014 2007–2014Largest Increases
MASSACHUSETTS 2,114 / 17.1% NEW YORK 13,402 / 38.8%
NEW YORK 1,752 / 3.8% MASSACHUSETTS 7,614 / 111.4%
DISTRICT OF COLUMBIA 626 / 19.8% DISTRICT OF COLUMBIA 2,192 / 136.7%
TEXAS 461 / 5.2% MINNESOTA 671 / 16.6%
MICHIGAN 401 / 9.4% NORTH CAROLINA 582 / 17.1%Largest Decreases
FLORIDA -3,691 / -22.4% CALIFORNIA -4,847 / -17.3%
CALIFORNIA -1,907 / -7.6% TEXAS -4,164 / -30.9%
MISSOURI -954 / -24.3% OREGON -3,543 / -45.9%
NEW JERSEY -684 / -11.6% NEW JERSEY -3,117 / -37.4%
OREGON -652 / -13.5% WASHINGTON -3,038 / -30.1%
Changes Over Time• Homelessness among people in families
declined in 32 states, while increasing in 18 states plus the D.C. between 2013 and 2014.
• Between 2013 and 2014, the number of homeless people in families declined most dramatically in Florida, where there were 3,691 fewer homeless people in families in 2014, a 22 percent drop. Missouri also had a large percentage decline.
• Massachusetts had the largest one-year increase in homeless people in families, with 2,114 more homeless people in families, a 17 percent increase from 2013.
• Between 2007 and 2014, homelessness among people in families declined in 31 states, and increased in 19 states and the D.C.
• During the 7-year span, the number of homeless people in families increased the most in New York where 13,402 more people were homeless in families in 2014, a 39 percent increase from 2007. Massachusetts and the District of Columbia had very large increases in percentage terms.
• States with large 7-year declines in family homelessness include: CA (4,847 fewer homeless people in families), TX (4,164), OR (3,543), NJ (3,117), and WA (3,038).
Data source: PIT 2007–2014; Excludes Puerto Rico and U.S. territories.
The 2014 Annual Homeless Assessment Report to Congress: Part 1
27
28
1National Estimates Homelessness in the United States3Estimates by CoC Homeless Families
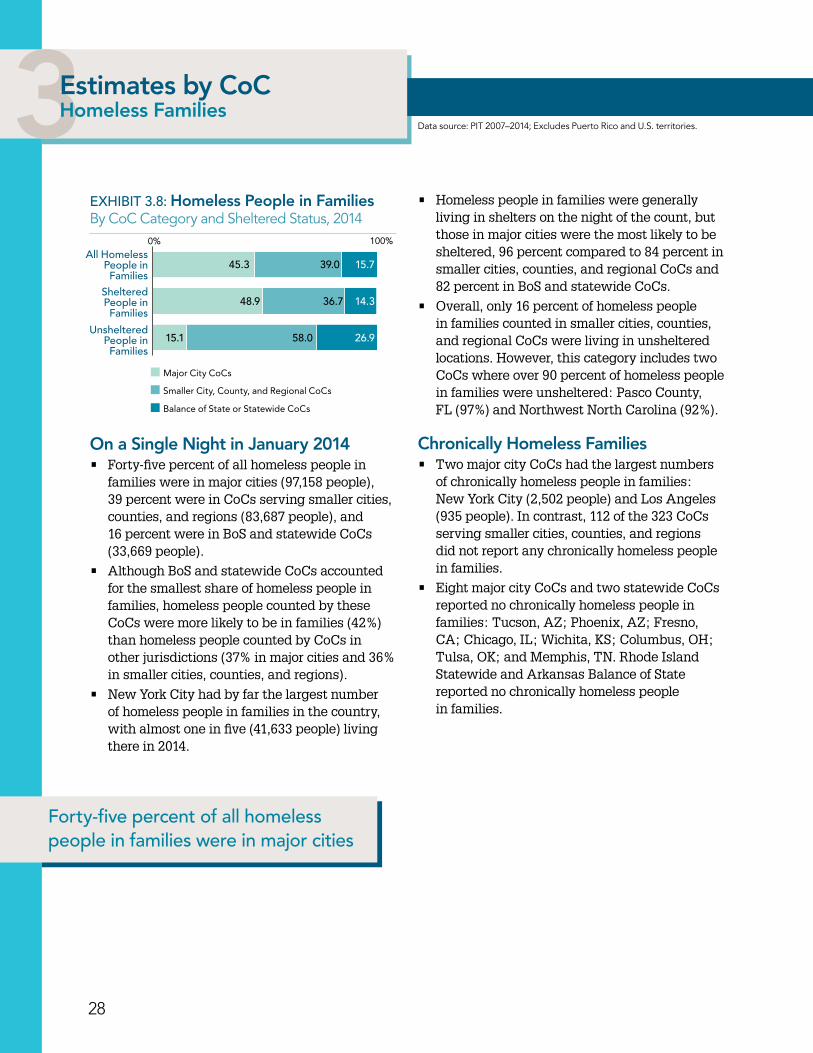
EXHIBIT 3.8: Homeless People in Families By CoC Category and Sheltered Status, 2014
On a Single Night in January 2014• Forty-five percent of all homeless people in
families were in major cities (97,158 people), 39 percent were in CoCs serving smaller cities, counties, and regions (83,687 people), and 16 percent were in BoS and statewide CoCs (33,669 people).
• Although BoS and statewide CoCs accounted for the smallest share of homeless people in families, homeless people counted by these CoCs were more likely to be in families (42%) than homeless people counted by CoCs in other jurisdictions (37% in major cities and 36% in smaller cities, counties, and regions).
• New York City had by far the largest number of homeless people in families in the country, with almost one in five (41,633 people) living there in 2014.
All HomelessPeople inFamilies
ShelteredPeople inFamilies
UnshelteredPeople inFamilies
0% 100%
45.3
48.9
15.1 58.0
36.7
39.0 15.7
14.3
26.9
Major City CoCs
Smaller City, County, and Regional CoCs
Balance of State or Statewide CoCs
• Homeless people in families were generally living in shelters on the night of the count, but those in major cities were the most likely to be sheltered, 96 percent compared to 84 percent in smaller cities, counties, and regional CoCs and 82 percent in BoS and statewide CoCs.
• Overall, only 16 percent of homeless people in families counted in smaller cities, counties, and regional CoCs were living in unsheltered locations. However, this category includes two CoCs where over 90 percent of homeless people in families were unsheltered: Pasco County, FL (97%) and Northwest North Carolina (92%).
Chronically Homeless Families• Two major city CoCs had the largest numbers
of chronically homeless people in families: New York City (2,502 people) and Los Angeles (935 people). In contrast, 112 of the 323 CoCs serving smaller cities, counties, and regions did not report any chronically homeless people in families.
• Eight major city CoCs and two statewide CoCs reported no chronically homeless people in families: Tucson, AZ; Phoenix, AZ; Fresno, CA; Chicago, IL; Wichita, KS; Columbus, OH; Tulsa, OK; and Memphis, TN. Rhode Island Statewide and Arkansas Balance of State reported no chronically homeless people in families.
Forty-five percent of all homeless people in families were in major cities
Data source: PIT 2007–2014; Excludes Puerto Rico and U.S. territories.
29
The 2014 Annual Homeless Assessment Report to Congress: Part 1
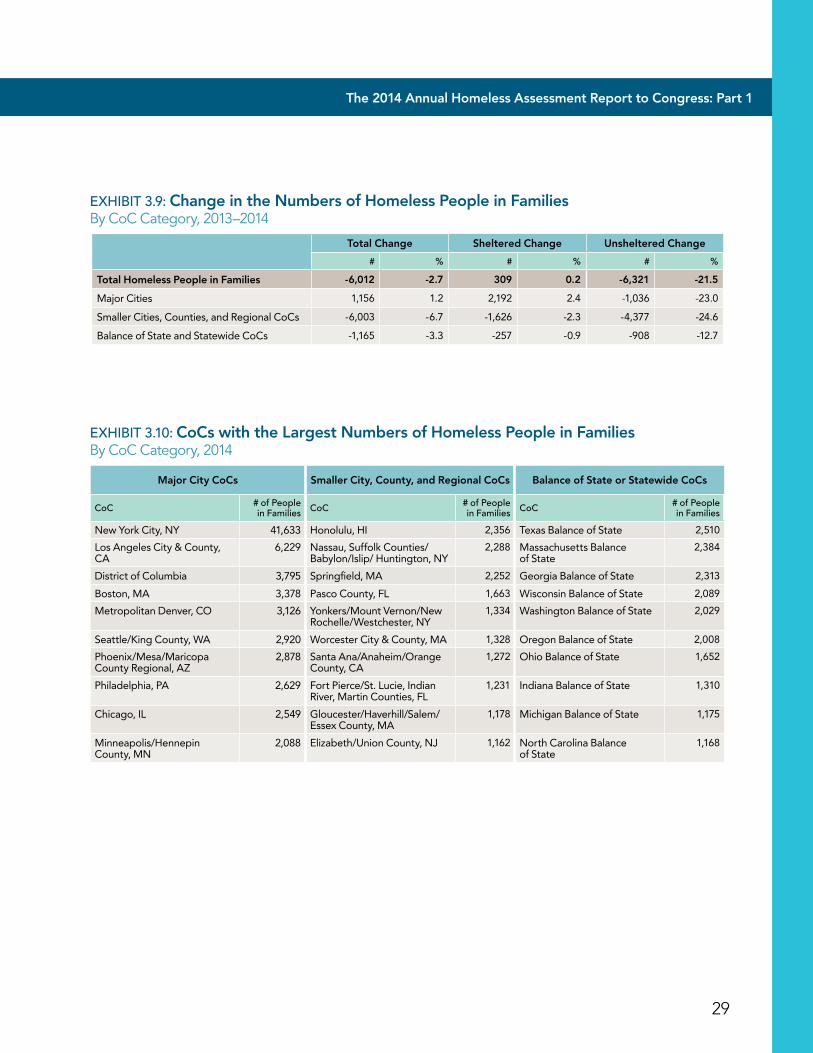
EXHIBIT 3.10: CoCs with the Largest Numbers of Homeless People in Families By CoC Category, 2014
EXHIBIT 3.9: Change in the Numbers of Homeless People in FamiliesBy CoC Category, 2013–2014
Major City CoCs Smaller City, County, and Regional CoCs Balance of State or Statewide CoCs
CoC # of People in Families CoC # of People
in Families CoC # of People in Families
New York City, NY 41,633 Honolulu, HI 2,356 Texas Balance of State 2,510
Los Angeles City & County, CA
6,229 Nassau, Suffolk Counties/Babylon/Islip/ Huntington, NY
2,288 Massachusetts Balance of State
2,384
District of Columbia 3,795 Springfield, MA 2,252 Georgia Balance of State 2,313
Boston, MA 3,378 Pasco County, FL 1,663 Wisconsin Balance of State 2,089
Metropolitan Denver, CO 3,126 Yonkers/Mount Vernon/New Rochelle/Westchester, NY
1,334 Washington Balance of State 2,029
Seattle/King County, WA 2,920 Worcester City & County, MA 1,328 Oregon Balance of State 2,008
Phoenix/Mesa/Maricopa County Regional, AZ
2,878 Santa Ana/Anaheim/Orange County, CA
1,272 Ohio Balance of State 1,652
Philadelphia, PA 2,629 Fort Pierce/St . Lucie, Indian River, Martin Counties, FL
1,231 Indiana Balance of State 1,310
Chicago, IL 2,549 Gloucester/Haverhill/Salem/Essex County, MA
1,178 Michigan Balance of State 1,175
Minneapolis/Hennepin County, MN
2,088 Elizabeth/Union County, NJ 1,162 North Carolina Balance of State
1,168
Total Change Sheltered Change Unsheltered Change
# % # % # %
Total Homeless People in Families -6,012 -2.7 309 0.2 -6,321 -21.5
Major Cities 1,156 1 .2 2,192 2 .4 -1,036 -23 .0
Smaller Cities, Counties, and Regional CoCs -6,003 -6 .7 -1,626 -2 .3 -4,377 -24 .6
Balance of State and Statewide CoCs -1,165 -3 .3 -257 -0 .9 -908 -12 .7
30
1National Estimates Homelessness in the United States3Estimates by CoC Homeless Families
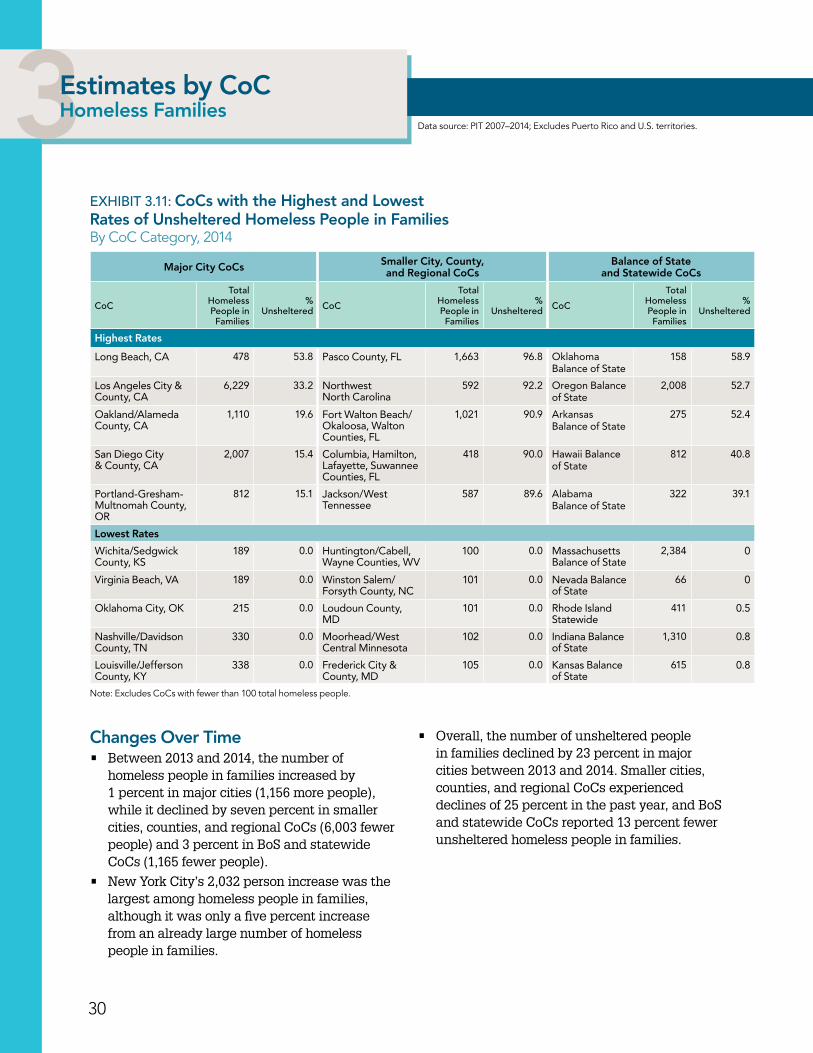
EXHIBIT 3.11: CoCs with the Highest and Lowest Rates of Unsheltered Homeless People in Families By CoC Category, 2014
Major City CoCs Smaller City, County, and Regional CoCs
Balance of State and Statewide CoCs
CoC
Total Homeless People in Families
% Unsheltered CoC
Total Homeless People in Families
% Unsheltered CoC
Total Homeless People in Families
% Unsheltered
Highest Rates
Long Beach, CA 478 53 .8 Pasco County, FL 1,663 96 .8 Oklahoma Balance of State
158 58 .9
Los Angeles City & County, CA
6,229 33 .2 Northwest North Carolina
592 92 .2 Oregon Balance of State
2,008 52 .7
Oakland/Alameda County, CA
1,110 19 .6 Fort Walton Beach/Okaloosa, Walton Counties, FL
1,021 90 .9 Arkansas Balance of State
275 52 .4
San Diego City & County, CA
2,007 15 .4 Columbia, Hamilton, Lafayette, Suwannee Counties, FL
418 90 .0 Hawaii Balance of State
812 40 .8
Portland-Gresham-Multnomah County, OR
812 15 .1 Jackson/West Tennessee
587 89 .6 Alabama Balance of State
322 39 .1
Lowest Rates
Wichita/Sedgwick County, KS
189 0 .0 Huntington/Cabell, Wayne Counties, WV
100 0 .0 Massachusetts Balance of State
2,384 0
Virginia Beach, VA 189 0 .0 Winston Salem/Forsyth County, NC
101 0 .0 Nevada Balance of State
66 0
Oklahoma City, OK 215 0 .0 Loudoun County, MD
101 0 .0 Rhode Island Statewide
411 0 .5
Nashville/Davidson County, TN
330 0 .0 Moorhead/West Central Minnesota
102 0 .0 Indiana Balance of State
1,310 0 .8
Louisville/Jefferson County, KY
338 0 .0 Frederick City & County, MD
105 0 .0 Kansas Balance of State
615 0 .8
Changes Over Time• Between 2013 and 2014, the number of
homeless people in families increased by 1 percent in major cities (1,156 more people), while it declined by seven percent in smaller cities, counties, and regional CoCs (6,003 fewer people) and 3 percent in BoS and statewide CoCs (1,165 fewer people).
• New York City’s 2,032 person increase was the largest among homeless people in families, although it was only a five percent increase from an already large number of homeless people in families.
• Overall, the number of unsheltered people in families declined by 23 percent in major cities between 2013 and 2014. Smaller cities, counties, and regional CoCs experienced declines of 25 percent in the past year, and BoS and statewide CoCs reported 13 percent fewer unsheltered homeless people in families.
Data source: PIT 2007–2014; Excludes Puerto Rico and U.S. territories.
Note: Excludes CoCs with fewer than 100 total homeless people.
The 2014 Annual Homeless Assessment Report to Congress: Part 1
31
32
1National Estimates Homelessness in the United States4National Estimates Unaccompanied Homeless Children and Youth
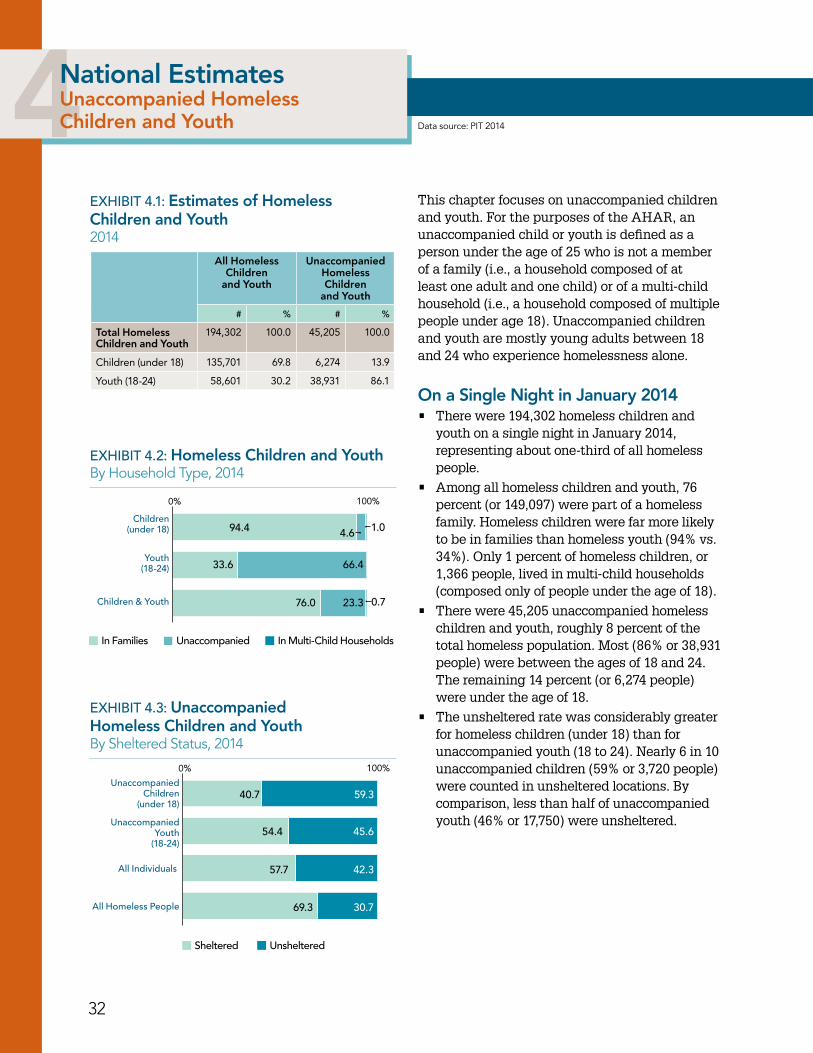
EXHIBIT 4.1: Estimates of Homeless Children and Youth2014
All Homeless Children
and Youth
Unaccompanied Homeless Children
and Youth
# % # %
Total Homeless Children and Youth
194,302 100 .0 45,205 100 .0
Children (under 18) 135,701 69 .8 6,274 13 .9
Youth (18-24) 58,601 30 .2 38,931 86 .1
EXHIBIT 4.2: Homeless Children and YouthBy Household Type, 2014
EXHIBIT 4.3: Unaccompanied Homeless Children and YouthBy Sheltered Status, 2014
This chapter focuses on unaccompanied children and youth. For the purposes of the AHAR, an unaccompanied child or youth is defined as a person under the age of 25 who is not a member of a family (i.e., a household composed of at least one adult and one child) or of a multi-child household (i.e., a household composed of multiple people under age 18). Unaccompanied children and youth are mostly young adults between 18 and 24 who experience homelessness alone.
On a Single Night in January 2014• There were 194,302 homeless children and
youth on a single night in January 2014, representing about one-third of all homeless people.
• Among all homeless children and youth, 76 percent (or 149,097) were part of a homeless family. Homeless children were far more likely to be in families than homeless youth (94% vs. 34%). Only 1 percent of homeless children, or 1,366 people, lived in multi-child households (composed only of people under the age of 18).
• There were 45,205 unaccompanied homeless children and youth, roughly 8 percent of the total homeless population. Most (86% or 38,931 people) were between the ages of 18 and 24. The remaining 14 percent (or 6,274 people) were under the age of 18.
• The unsheltered rate was considerably greater for homeless children (under 18) than for unaccompanied youth (18 to 24). Nearly 6 in 10 unaccompanied children (59% or 3,720 people) were counted in unsheltered locations. By comparison, less than half of unaccompanied youth (46% or 17,750) were unsheltered.
Data source: PIT 2014
Children & Youth
Youth(18-24)
Children(under 18)
0% 100%
In Families Unaccompanied In Multi-Child Households
94.4
33.6
76.0
4.6 1.0
23.3
66.4
0.7
All Homeless People
All Individuals
UnaccompaniedYouth
(18-24)
UnaccompaniedChildren
(under 18)
0% 100%
Sheltered Unsheltered
40.7
54.4
69.3
57.7
59.3
42.3
45.6
30.7
The 2014 Annual Homeless Assessment Report to Congress: Part 1
33
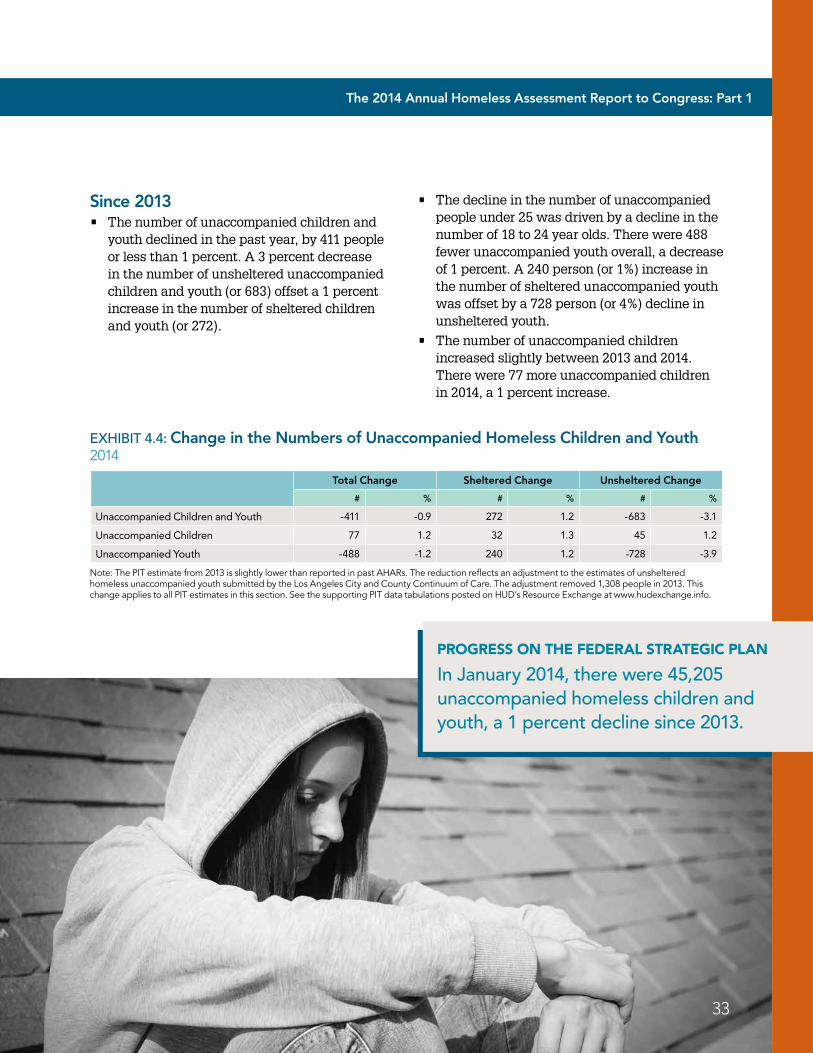
EXHIBIT 4.4: Change in the Numbers of Unaccompanied Homeless Children and Youth2014
Total Change Sheltered Change Unsheltered Change
# % # % # %
Unaccompanied Children and Youth -411 -0 .9 272 1 .2 -683 -3 .1
Unaccompanied Children 77 1 .2 32 1 .3 45 1 .2
Unaccompanied Youth -488 -1 .2 240 1 .2 -728 -3 .9
Since 2013• The number of unaccompanied children and
youth declined in the past year, by 411 people or less than 1 percent. A 3 percent decrease in the number of unsheltered unaccompanied children and youth (or 683) offset a 1 percent increase in the number of sheltered children and youth (or 272).
Note: The PIT estimate from 2013 is slightly lower than reported in past AHARs. The reduction reflects an adjustment to the estimates of unsheltered homeless unaccompanied youth submitted by the Los Angeles City and County Continuum of Care. The adjustment removed 1,308 people in 2013. This change applies to all PIT estimates in this section. See the supporting PIT data tabulations posted on HUD’s Resource Exchange at www.hudexchange.info.
PROGRESS ON THE FEDERAL STRATEGIC PLAN
In January 2014, there were 45,205 unaccompanied homeless children and youth, a 1 percent decline since 2013.
• The decline in the number of unaccompanied people under 25 was driven by a decline in the number of 18 to 24 year olds. There were 488 fewer unaccompanied youth overall, a decrease of 1 percent. A 240 person (or 1%) increase in the number of sheltered unaccompanied youth was offset by a 728 person (or 4%) decline in unsheltered youth.
• The number of unaccompanied children increased slightly between 2013 and 2014. There were 77 more unaccompanied children in 2014, a 1 percent increase.
34
1National Estimates Homelessness in the United States4State Estimates Unaccompanied Homeless Children and Youth
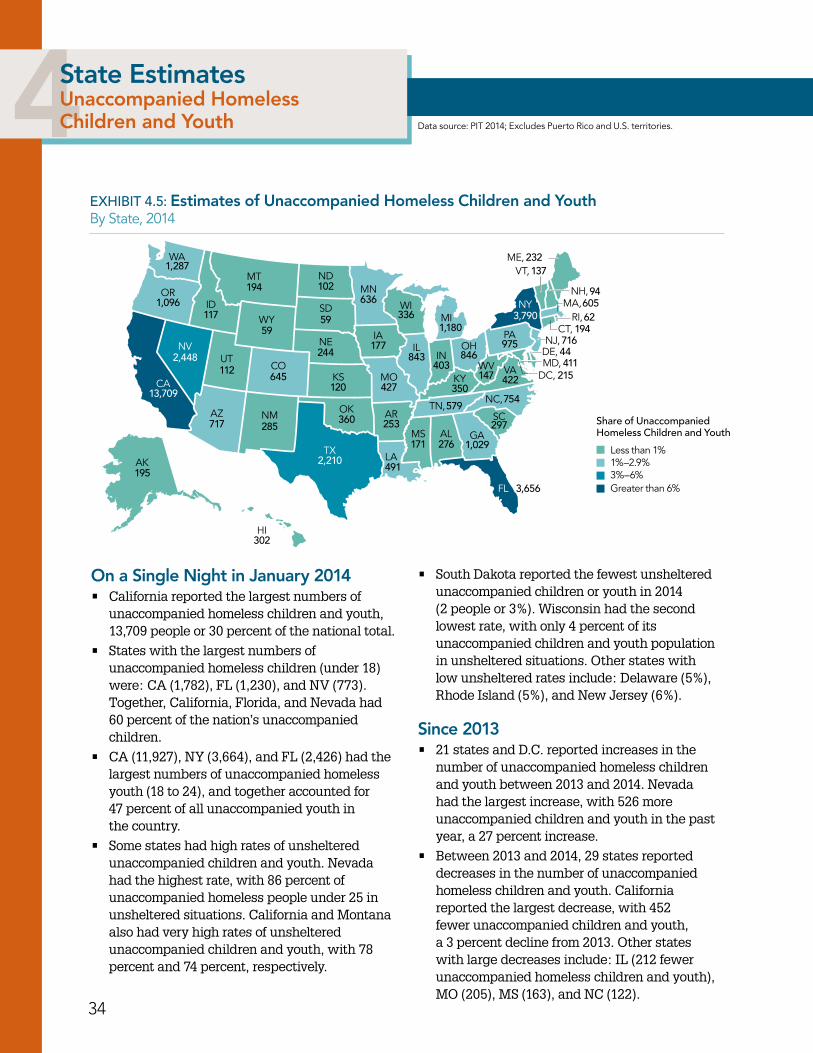
EXHIBIT 4.5: Estimates of Unaccompanied Homeless Children and Youth By State, 2014
ME,
NH,
VT,
NY MA,RI,
CT,NJ,
DE,
DC,
PA
VAWV
NC,
SC
GA
FL
AL
TN,
KY
OHIL
MIWI
MN
IA
MO
AR
LATX
OK
KS
NE
SD
NDMT
WA
OR
CA
AK
HI
WY
CO
NMAZ
UTNV
ID
IN
MS
MD,
Share of Unaccompanied Homeless Children and Youth
Less than 1%1%–2.9%
Greater than 6%3%–6%
59
645112
717
120
285
302
194
1171,096
1,287
2,210
13,709
59
177
336636
427
2442,448
360
102
44411
62
975
3,790194
7161,180
843
94
147350
579
1,029
422
754
215
3,656
403846
297
137232
605
171
491
276
253
195
On a Single Night in January 2014• California reported the largest numbers of
unaccompanied homeless children and youth, 13,709 people or 30 percent of the national total.
• States with the largest numbers of unaccompanied homeless children (under 18) were: CA (1,782), FL (1,230), and NV (773). Together, California, Florida, and Nevada had 60 percent of the nation’s unaccompanied children.
• CA (11,927), NY (3,664), and FL (2,426) had the largest numbers of unaccompanied homeless youth (18 to 24), and together accounted for 47 percent of all unaccompanied youth in the country.
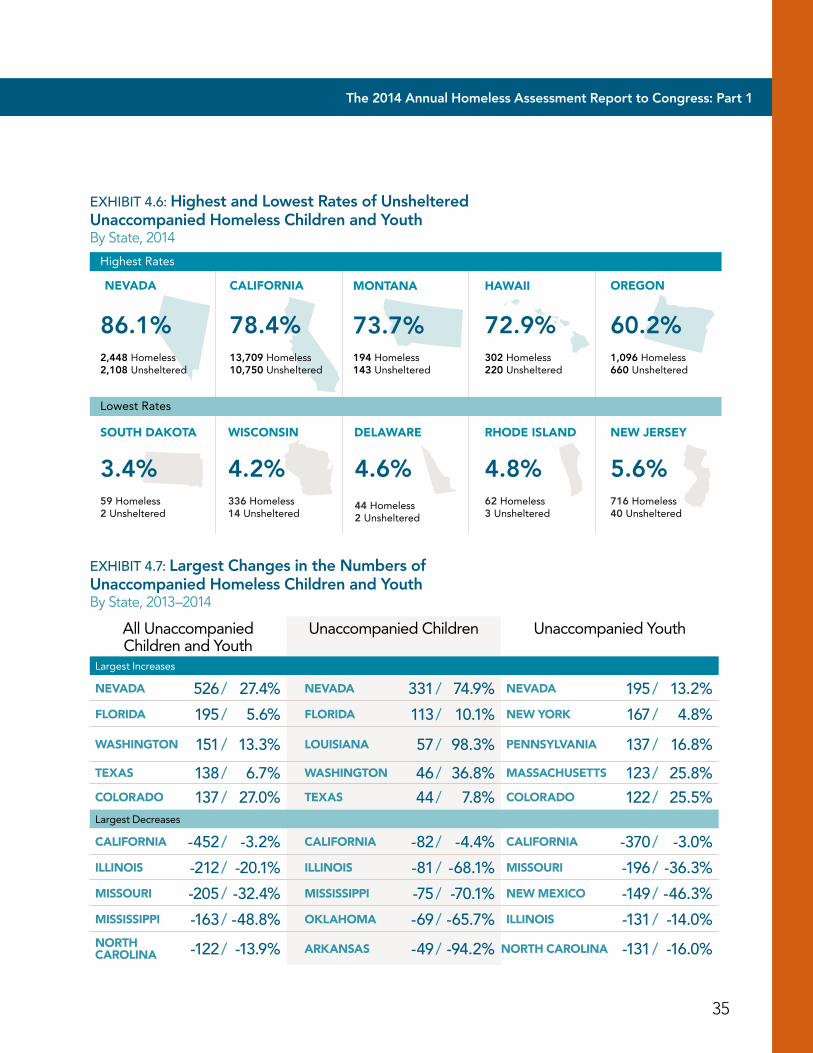
• Some states had high rates of unsheltered unaccompanied children and youth. Nevada had the highest rate, with 86 percent of unaccompanied homeless people under 25 in unsheltered situations. California and Montana also had very high rates of unsheltered unaccompanied children and youth, with 78 percent and 74 percent, respectively.
• South Dakota reported the fewest unsheltered unaccompanied children or youth in 2014 (2 people or 3%). Wisconsin had the second lowest rate, with only 4 percent of its unaccompanied children and youth population in unsheltered situations. Other states with low unsheltered rates include: Delaware (5%), Rhode Island (5%), and New Jersey (6%).
Since 2013• 21 states and D.C. reported increases in the
number of unaccompanied homeless children and youth between 2013 and 2014. Nevada had the largest increase, with 526 more unaccompanied children and youth in the past year, a 27 percent increase.
• Between 2013 and 2014, 29 states reported decreases in the number of unaccompanied homeless children and youth. California reported the largest decrease, with 452 fewer unaccompanied children and youth, a 3 percent decline from 2013. Other states with large decreases include: IL (212 fewer unaccompanied homeless children and youth), MO (205), MS (163), and NC (122).
Data source: PIT 2014; Excludes Puerto Rico and U.S. territories.
35
The 2014 Annual Homeless Assessment Report to Congress: Part 1
EXHIBIT 4.6: Highest and Lowest Rates of Unsheltered Unaccompanied Homeless Children and YouthBy State, 2014
EXHIBIT 4.7: Largest Changes in the Numbers of Unaccompanied Homeless Children and YouthBy State, 2013–2014
All Unaccompanied Children and Youth
Unaccompanied Children Unaccompanied Youth
Largest Increases
NEVADA 526/ 27.4% NEVADA 331/ 74.9% NEVADA 195/ 13.2%
FLORIDA 195/ 5.6% FLORIDA 113/ 10.1% NEW YORK 167/ 4.8%
WASHINGTON 151/ 13.3% LOUISIANA 57/ 98.3% PENNSYLVANIA 137/ 16.8%
TEXAS 138/ 6.7% WASHINGTON 46/ 36.8% MASSACHUSETTS 123/ 25.8%COLORADO 137/ 27.0% TEXAS 44/ 7.8% COLORADO 122/ 25.5%Largest Decreases
CALIFORNIA -452/ -3.2% CALIFORNIA -82/ -4.4% CALIFORNIA -370/ -3.0%
ILLINOIS -212/ -20.1% ILLINOIS -81/ -68.1% MISSOURI -196/ -36.3%
MISSOURI -205/ -32.4% MISSISSIPPI -75/ -70.1% NEW MEXICO -149/ -46.3%
MISSISSIPPI -163/ -48.8% OKLAHOMA -69/ -65.7% ILLINOIS -131/ -14.0%NORTH CAROLINA -122/ -13.9% ARKANSAS -49/ -94.2% NORTH CAROLINA -131/ -16.0%
CALIFORNIA MONTANA HAWAIINEVADA OREGON
2,448 Homeless2,108 Unsheltered
86.1%
SOUTH DAKOTA
59 Homeless2 Unsheltered
3.4%336 Homeless14 Unsheltered
4.2%44 Homeless2 Unsheltered
4.6%
194 Homeless143 Unsheltered
73.7%302 Homeless220 Unsheltered
72.9%13,709 Homeless10,750 Unsheltered
78.4%1,096 Homeless660 Unsheltered
60.2%
NEW JERSEYDELAWAREWISCONSIN
62 Homeless3 Unsheltered
4.8%716 Homeless40 Unsheltered
5.6%
RHODE ISLAND
Lowest Rates
Highest Rates
1National Estimates Homelessness in the United States4Estimates by CoCUnaccompanied Homeless Children and Youth
EXHIBIT 4.8: Unaccompanied Homeless Children and Youth By CoC Category and Sheltered Status, 2014
UnaccompaniedChildren
UnaccompaniedYouth
UnaccompaniedChildren and Youth
0% 100%
41.5
45.5
45.0 41.6
40.9
45.9 12.6
13.6
13.5
Major City CoCs
Smaller City, County, and Regional CoCs
Balance of State or Statewide CoCs
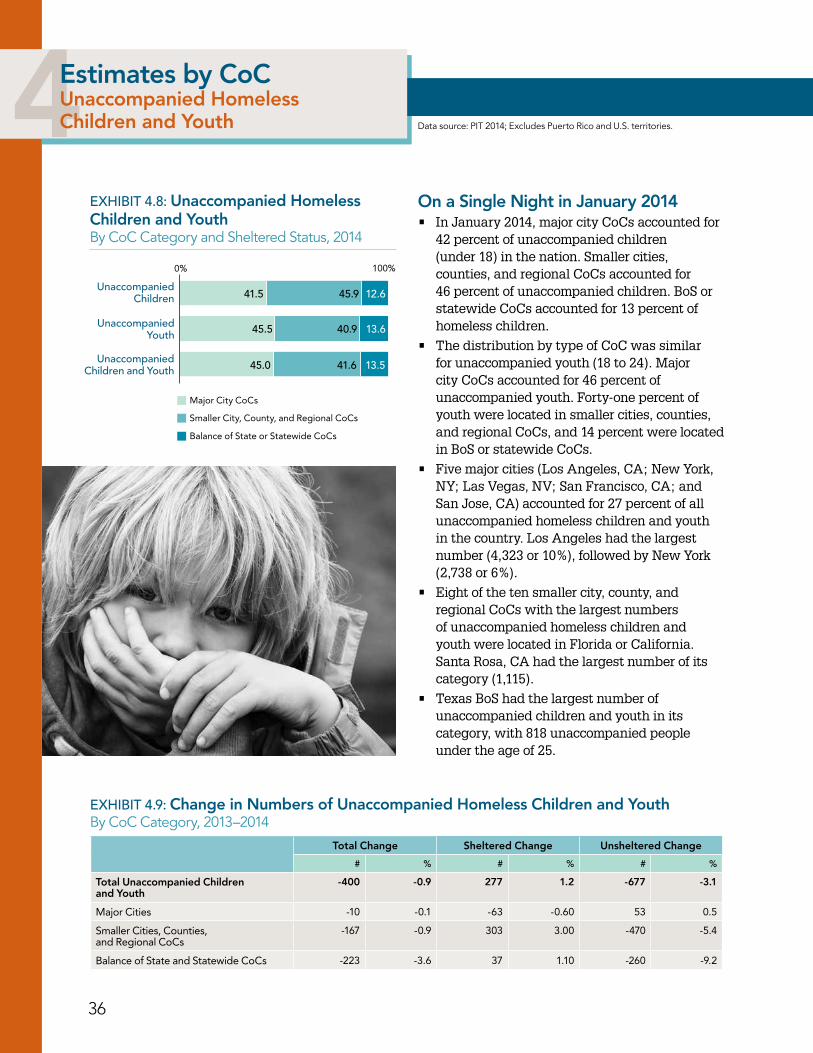
On a Single Night in January 2014• In January 2014, major city CoCs accounted for
42 percent of unaccompanied children (under 18) in the nation. Smaller cities, counties, and regional CoCs accounted for 46 percent of unaccompanied children. BoS or statewide CoCs accounted for 13 percent of homeless children.
• The distribution by type of CoC was similar for unaccompanied youth (18 to 24). Major city CoCs accounted for 46 percent of unaccompanied youth. Forty-one percent of youth were located in smaller cities, counties, and regional CoCs, and 14 percent were located in BoS or statewide CoCs.
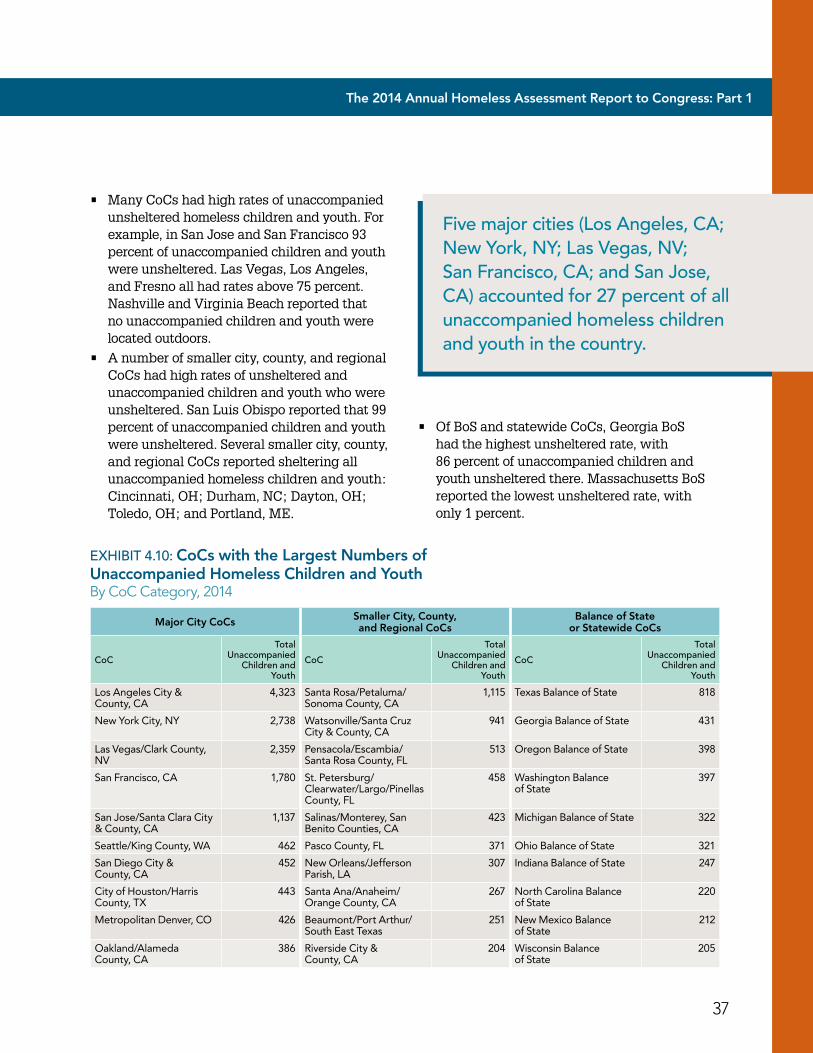
• Five major cities (Los Angeles, CA; New York, NY; Las Vegas, NV; San Francisco, CA; and San Jose, CA) accounted for 27 percent of all unaccompanied homeless children and youth in the country. Los Angeles had the largest number (4,323 or 10%), followed by New York (2,738 or 6%).
• Eight of the ten smaller city, county, and regional CoCs with the largest numbers of unaccompanied homeless children and youth were located in Florida or California. Santa Rosa, CA had the largest number of its category (1,115).
• Texas BoS had the largest number of unaccompanied children and youth in its category, with 818 unaccompanied people under the age of 25.
Data source: PIT 2014; Excludes Puerto Rico and U.S. territories.
36
EXHIBIT 4.9: Change in Numbers of Unaccompanied Homeless Children and Youth By CoC Category, 2013–2014
Total Change Sheltered Change Unsheltered Change
# % # % # %
Total Unaccompanied Children and Youth
-400 -0.9 277 1.2 -677 -3.1
Major Cities -10 -0 .1 -63 -0 .60 53 0 .5
Smaller Cities, Counties, and Regional CoCs
-167 -0 .9 303 3 .00 -470 -5 .4
Balance of State and Statewide CoCs -223 -3 .6 37 1 .10 -260 -9 .2
37
The 2014 Annual Homeless Assessment Report to Congress: Part 1
EXHIBIT 4.10: CoCs with the Largest Numbers of Unaccompanied Homeless Children and Youth By CoC Category, 2014
Major City CoCs Smaller City, County, and Regional CoCs
Balance of State or Statewide CoCs
CoC
Total Unaccompanied
Children and Youth
CoC
Total Unaccompanied
Children and Youth
CoC
Total Unaccompanied
Children and Youth
Los Angeles City & County, CA
4,323 Santa Rosa/Petaluma/Sonoma County, CA
1,115 Texas Balance of State 818
New York City, NY 2,738 Watsonville/Santa Cruz City & County, CA
941 Georgia Balance of State 431
Las Vegas/Clark County, NV
2,359 Pensacola/Escambia/Santa Rosa County, FL
513 Oregon Balance of State 398
San Francisco, CA 1,780 St . Petersburg/Clearwater/Largo/Pinellas County, FL
458 Washington Balance of State
397
San Jose/Santa Clara City & County, CA
1,137 Salinas/Monterey, San Benito Counties, CA
423 Michigan Balance of State 322
Seattle/King County, WA 462 Pasco County, FL 371 Ohio Balance of State 321
San Diego City & County, CA
452 New Orleans/Jefferson Parish, LA
307 Indiana Balance of State 247
City of Houston/Harris County, TX
443 Santa Ana/Anaheim/Orange County, CA
267 North Carolina Balance of State
220
Metropolitan Denver, CO 426 Beaumont/Port Arthur/South East Texas
251 New Mexico Balance of State
212
Oakland/Alameda County, CA
386 Riverside City & County, CA
204 Wisconsin Balance of State
205
• Many CoCs had high rates of unaccompanied unsheltered homeless children and youth. For example, in San Jose and San Francisco 93 percent of unaccompanied children and youth were unsheltered. Las Vegas, Los Angeles, and Fresno all had rates above 75 percent. Nashville and Virginia Beach reported that no unaccompanied children and youth were located outdoors.
• A number of smaller city, county, and regional CoCs had high rates of unsheltered and unaccompanied children and youth who were unsheltered. San Luis Obispo reported that 99 percent of unaccompanied children and youth were unsheltered. Several smaller city, county, and regional CoCs reported sheltering all unaccompanied homeless children and youth: Cincinnati, OH; Durham, NC; Dayton, OH; Toledo, OH; and Portland, ME.
• Of BoS and statewide CoCs, Georgia BoS had the highest unsheltered rate, with 86 percent of unaccompanied children and youth unsheltered there. Massachusetts BoS reported the lowest unsheltered rate, with only 1 percent.
Five major cities (Los Angeles, CA; New York, NY; Las Vegas, NV; San Francisco, CA; and San Jose, CA) accounted for 27 percent of all unaccompanied homeless children and youth in the country.
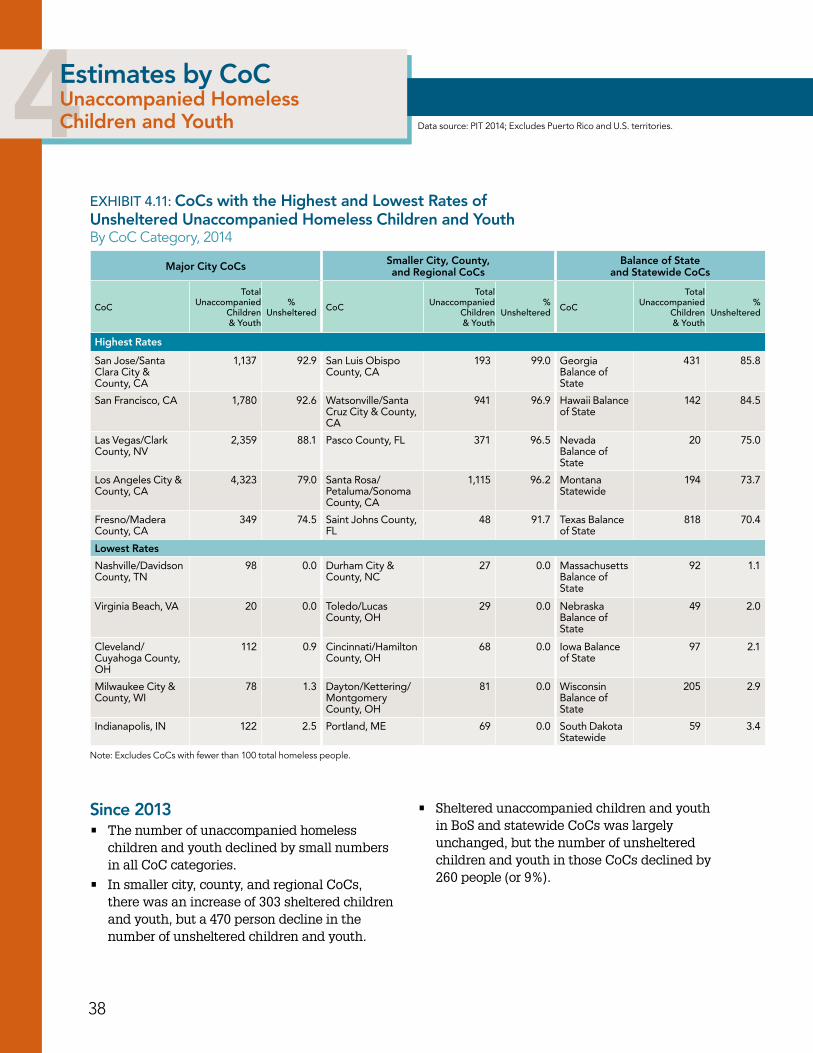
38
1National Estimates Homelessness in the United States4Estimates by CoCUnaccompanied Homeless Children and Youth
EXHIBIT 4.11: CoCs with the Highest and Lowest Rates of Unsheltered Unaccompanied Homeless Children and Youth By CoC Category, 2014
Major City CoCs Smaller City, County, and Regional CoCs
Balance of State and Statewide CoCs
CoC
Total Unaccompanied
Children & Youth
% Unsheltered CoC
Total Unaccompanied
Children & Youth
% Unsheltered CoC
Total Unaccompanied
Children & Youth
% Unsheltered
Highest Rates
San Jose/Santa Clara City & County, CA
1,137 92 .9 San Luis Obispo County, CA
193 99 .0 Georgia Balance of State
431 85 .8
San Francisco, CA 1,780 92 .6 Watsonville/Santa Cruz City & County, CA
941 96 .9 Hawaii Balance of State
142 84 .5
Las Vegas/Clark County, NV
2,359 88 .1 Pasco County, FL 371 96 .5 Nevada Balance of State
20 75 .0
Los Angeles City & County, CA
4,323 79 .0 Santa Rosa/Petaluma/Sonoma County, CA
1,115 96 .2 Montana Statewide
194 73 .7
Fresno/Madera County, CA
349 74 .5 Saint Johns County, FL
48 91 .7 Texas Balance of State
818 70 .4
Lowest Rates
Nashville/Davidson County, TN
98 0 .0 Durham City & County, NC
27 0 .0 Massachusetts Balance of State
92 1 .1
Virginia Beach, VA 20 0 .0 Toledo/Lucas County, OH
29 0 .0 Nebraska Balance of State
49 2 .0
Cleveland/Cuyahoga County, OH
112 0 .9 Cincinnati/Hamilton County, OH
68 0 .0 Iowa Balance of State
97 2 .1
Milwaukee City & County, WI
78 1 .3 Dayton/Kettering/Montgomery County, OH
81 0 .0 Wisconsin Balance of State
205 2 .9
Indianapolis, IN 122 2 .5 Portland, ME 69 0 .0 South Dakota Statewide
59 3 .4
Data source: PIT 2014; Excludes Puerto Rico and U.S. territories.
Since 2013• The number of unaccompanied homeless
children and youth declined by small numbers in all CoC categories.
• In smaller city, county, and regional CoCs, there was an increase of 303 sheltered children and youth, but a 470 person decline in the number of unsheltered children and youth.
• Sheltered unaccompanied children and youth in BoS and statewide CoCs was largely unchanged, but the number of unsheltered children and youth in those CoCs declined by 260 people (or 9%).
Note: Excludes CoCs with fewer than 100 total homeless people.
The 2014 Annual Homeless Assessment Report to Congress: Part 1
39
Major City CoCs Smaller City, County, and Regional CoCs
Balance of State and Statewide CoCs
CoC
Total Unaccompanied
Children & Youth
% Unsheltered CoC
Total Unaccompanied
Children & Youth
% Unsheltered CoC
Total Unaccompanied
Children & Youth
% Unsheltered
Highest Rates
San Jose/Santa Clara City & County, CA
1,137 92 .9 San Luis Obispo County, CA
193 99 .0 Georgia Balance of State
431 85 .8
San Francisco, CA 1,780 92 .6 Watsonville/Santa Cruz City & County, CA
941 96 .9 Hawaii Balance of State
142 84 .5
Las Vegas/Clark County, NV
2,359 88 .1 Pasco County, FL 371 96 .5 Nevada Balance of State
20 75 .0
Los Angeles City & County, CA
4,323 79 .0 Santa Rosa/Petaluma/Sonoma County, CA
1,115 96 .2 Montana Statewide
194 73 .7
Fresno/Madera County, CA
349 74 .5 Saint Johns County, FL
48 91 .7 Texas Balance of State
818 70 .4
Lowest Rates
Nashville/Davidson County, TN
98 0 .0 Durham City & County, NC
27 0 .0 Massachusetts Balance of State
92 1 .1
Virginia Beach, VA 20 0 .0 Toledo/Lucas County, OH
29 0 .0 Nebraska Balance of State
49 2 .0
Cleveland/Cuyahoga County, OH
112 0 .9 Cincinnati/Hamilton County, OH
68 0 .0 Iowa Balance of State
97 2 .1
Milwaukee City & County, WI
78 1 .3 Dayton/Kettering/Montgomery County, OH
81 0 .0 Wisconsin Balance of State
205 2 .9
Indianapolis, IN 122 2 .5 Portland, ME 69 0 .0 South Dakota Statewide
59 3 .4
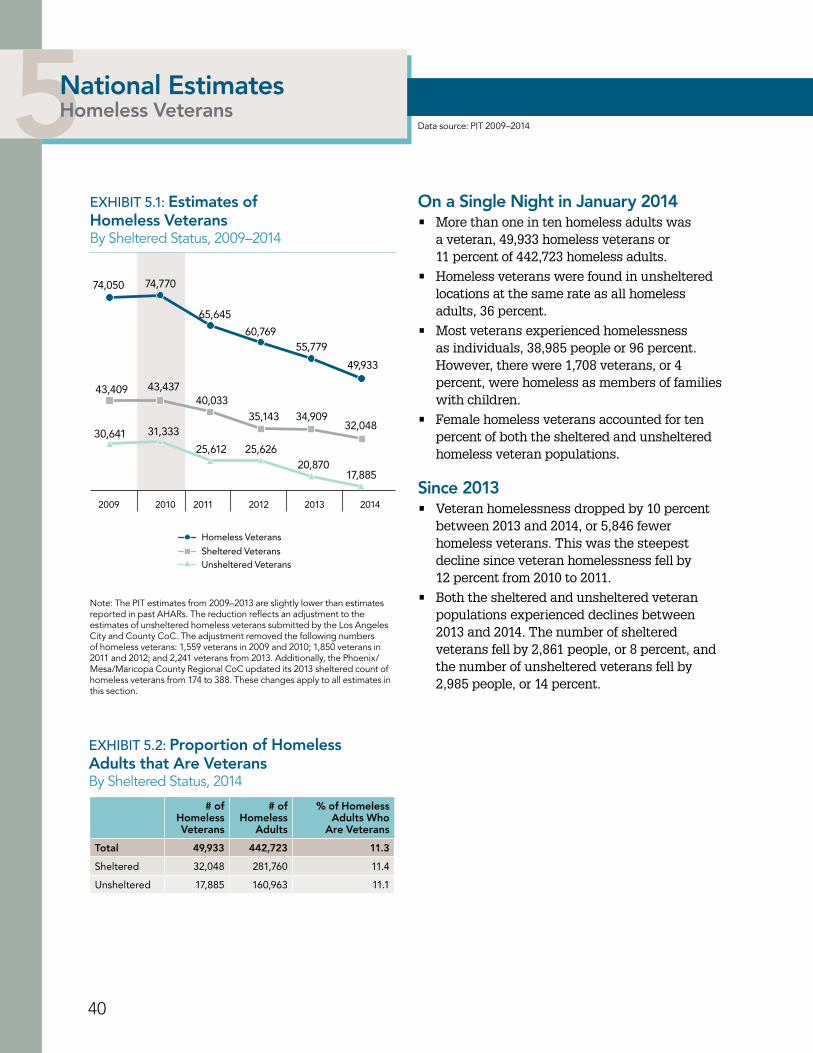
40
1National Estimates Homelessness in the United States5National Estimates Homeless Veterans
EXHIBIT 5.1: Estimates of Homeless Veterans By Sheltered Status, 2009–2014
EXHIBIT 5.2: Proportion of Homeless Adults that Are VeteransBy Sheltered Status, 2014
43,409
2009 2010 20122011
Sheltered VeteransUnsheltered Veterans
Homeless Veterans
20142013
43,43740,033
35,143 34,90932,048
74,050 74,770
65,645
60,76955,779
49,933
30,641 31,333
25,612 25,62620,870
17,885
# of Homeless Veterans
# of Homeless
Adults
% of Homeless Adults Who
Are Veterans
Total 49,933 442,723 11.3
Sheltered 32,048 281,760 11 .4
Unsheltered 17,885 160,963 11 .1
On a Single Night in January 2014 • More than one in ten homeless adults was
a veteran, 49,933 homeless veterans or 11 percent of 442,723 homeless adults.
• Homeless veterans were found in unsheltered locations at the same rate as all homeless adults, 36 percent.
• Most veterans experienced homelessness as individuals, 38,985 people or 96 percent. However, there were 1,708 veterans, or 4 percent, were homeless as members of families with children.
• Female homeless veterans accounted for ten percent of both the sheltered and unsheltered homeless veteran populations.
Since 2013• Veteran homelessness dropped by 10 percent
between 2013 and 2014, or 5,846 fewer homeless veterans. This was the steepest decline since veteran homelessness fell by 12 percent from 2010 to 2011.
• Both the sheltered and unsheltered veteran populations experienced declines between 2013 and 2014. The number of sheltered veterans fell by 2,861 people, or 8 percent, and the number of unsheltered veterans fell by 2,985 people, or 14 percent.
Data source: PIT 2009–2014
Note: The PIT estimates from 2009–2013 are slightly lower than estimates reported in past AHARs. The reduction reflects an adjustment to the estimates of unsheltered homeless veterans submitted by the Los Angeles City and County CoC. The adjustment removed the following numbers of homeless veterans: 1,559 veterans in 2009 and 2010; 1,850 veterans in 2011 and 2012; and 2,241 veterans from 2013. Additionally, the Phoenix/Mesa/Maricopa County Regional CoC updated its 2013 sheltered count of homeless veterans from 174 to 388. These changes apply to all estimates in this section.
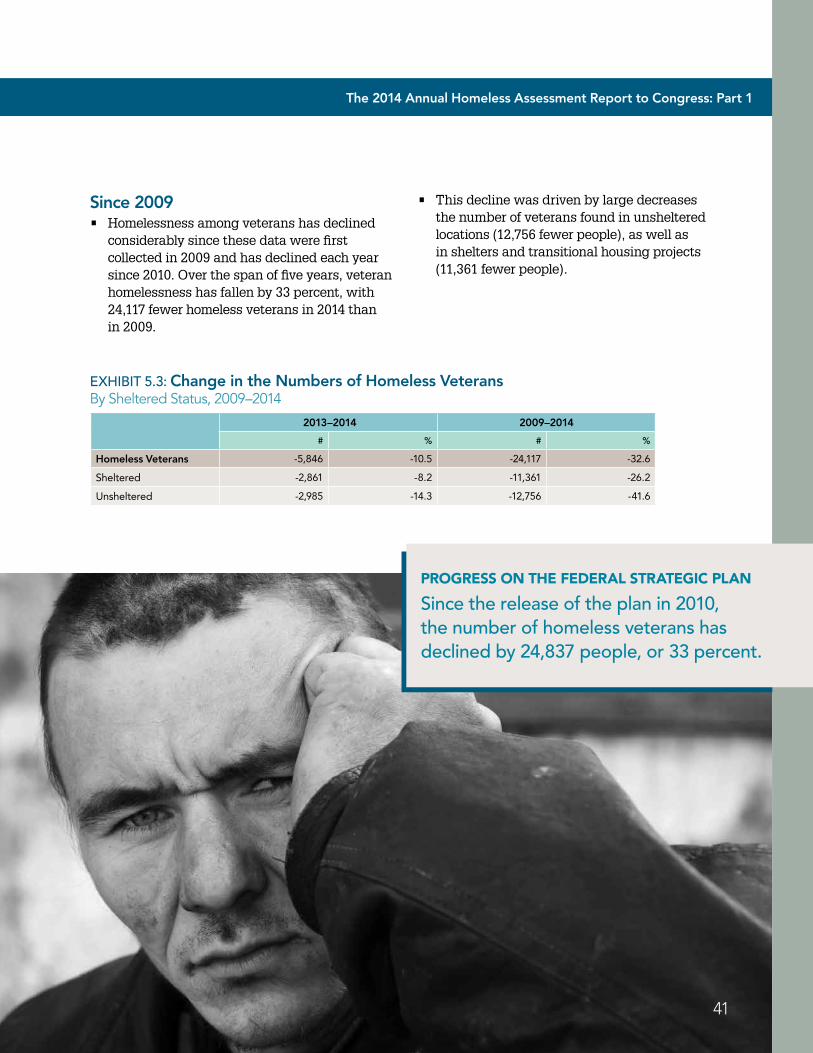
The 2014 Annual Homeless Assessment Report to Congress: Part 1
41
EXHIBIT 5.3: Change in the Numbers of Homeless VeteransBy Sheltered Status, 2009–2014
2013–2014 2009–2014
# % # %
Homeless Veterans -5,846 -10 .5 -24,117 -32 .6
Sheltered -2,861 -8 .2 -11,361 -26 .2
Unsheltered -2,985 -14 .3 -12,756 -41 .6
Since 2009• Homelessness among veterans has declined
considerably since these data were first collected in 2009 and has declined each year since 2010. Over the span of five years, veteran homelessness has fallen by 33 percent, with 24,117 fewer homeless veterans in 2014 than in 2009.
• This decline was driven by large decreases the number of veterans found in unsheltered locations (12,756 fewer people), as well as in shelters and transitional housing projects (11,361 fewer people).
PROGRESS ON THE FEDERAL STRATEGIC PLAN
Since the release of the plan in 2010, the number of homeless veterans has declined by 24,837 people, or 33 percent.
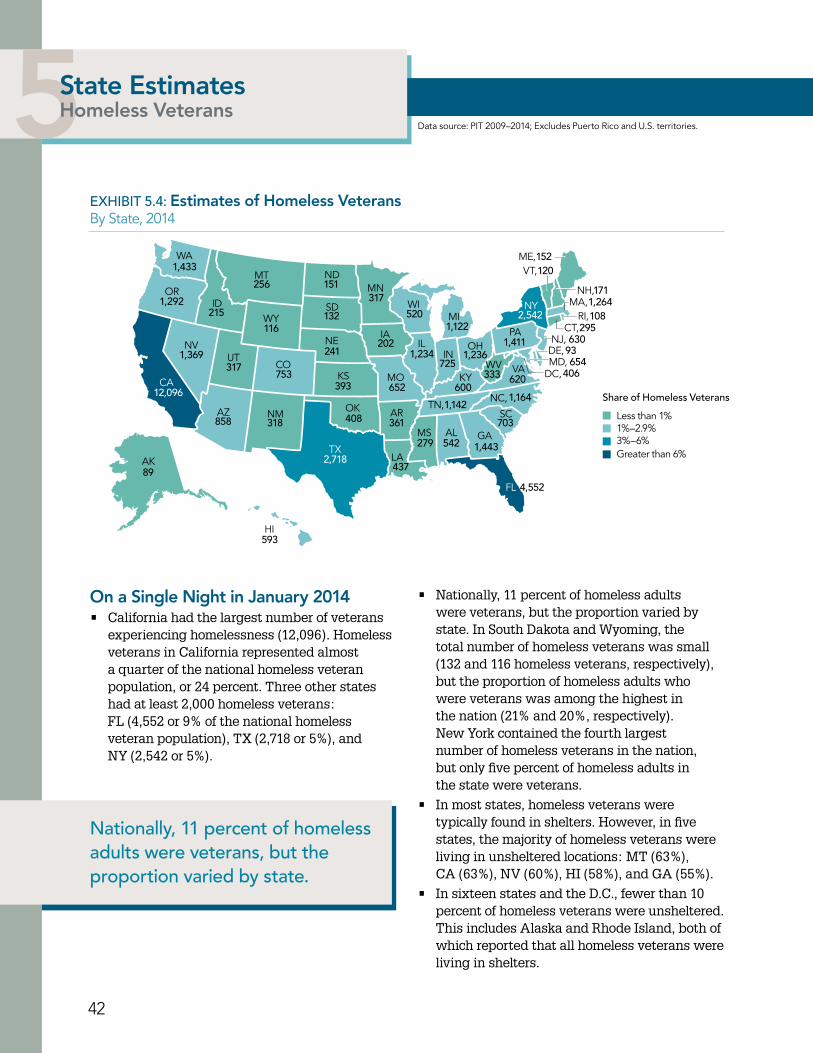
42
1National Estimates Homelessness in the United States5State Estimates Homeless Veterans
EXHIBIT 5.4: Estimates of Homeless Veterans By State, 2014
93
406
279
1081,264
295630
654333
600
725
620
703
1,443
4,552
171
120
2,542
2,718
12,096
152ME,
NH,
VT,
NY MA,RI,
CT,NJ,
DE,
DC,
PA
VAWV
NC,
SC
GA
FL
AL
TN,
KY
OHIL
MIWI
MN
IA
MO
AR
LATX
OK
KS
NE
SD
NDMT
WA
OR
CA
AK
HI
WY
CO
NMAZ
UTNV
ID
IN
MS
MD,
Share of Homeless Veterans
Less than 1%1%–2.9%
Greater than 6%3%–6%
89
116
317
318
215 132
241
393
408
202
361
437
151317
520
1,234 1,236
1,122
1,411
1,1421,164
652753
858
542
593
256
1,292
1,433
1,369
On a Single Night in January 2014• California had the largest number of veterans
experiencing homelessness (12,096). Homeless veterans in California represented almost a quarter of the national homeless veteran population, or 24 percent. Three other states had at least 2,000 homeless veterans: FL (4,552 or 9% of the national homeless veteran population), TX (2,718 or 5%), and NY (2,542 or 5%).
• Nationally, 11 percent of homeless adults were veterans, but the proportion varied by state. In South Dakota and Wyoming, the total number of homeless veterans was small (132 and 116 homeless veterans, respectively), but the proportion of homeless adults who were veterans was among the highest in the nation (21% and 20%, respectively). New York contained the fourth largest number of homeless veterans in the nation, but only five percent of homeless adults in the state were veterans.
• In most states, homeless veterans were typically found in shelters. However, in five states, the majority of homeless veterans were living in unsheltered locations: MT (63%), CA (63%), NV (60%), HI (58%), and GA (55%).
• In sixteen states and the D.C., fewer than 10 percent of homeless veterans were unsheltered. This includes Alaska and Rhode Island, both of which reported that all homeless veterans were living in shelters.
Data source: PIT 2009–2014; Excludes Puerto Rico and U.S. territories.
Nationally, 11 percent of homeless adults were veterans, but the proportion varied by state.
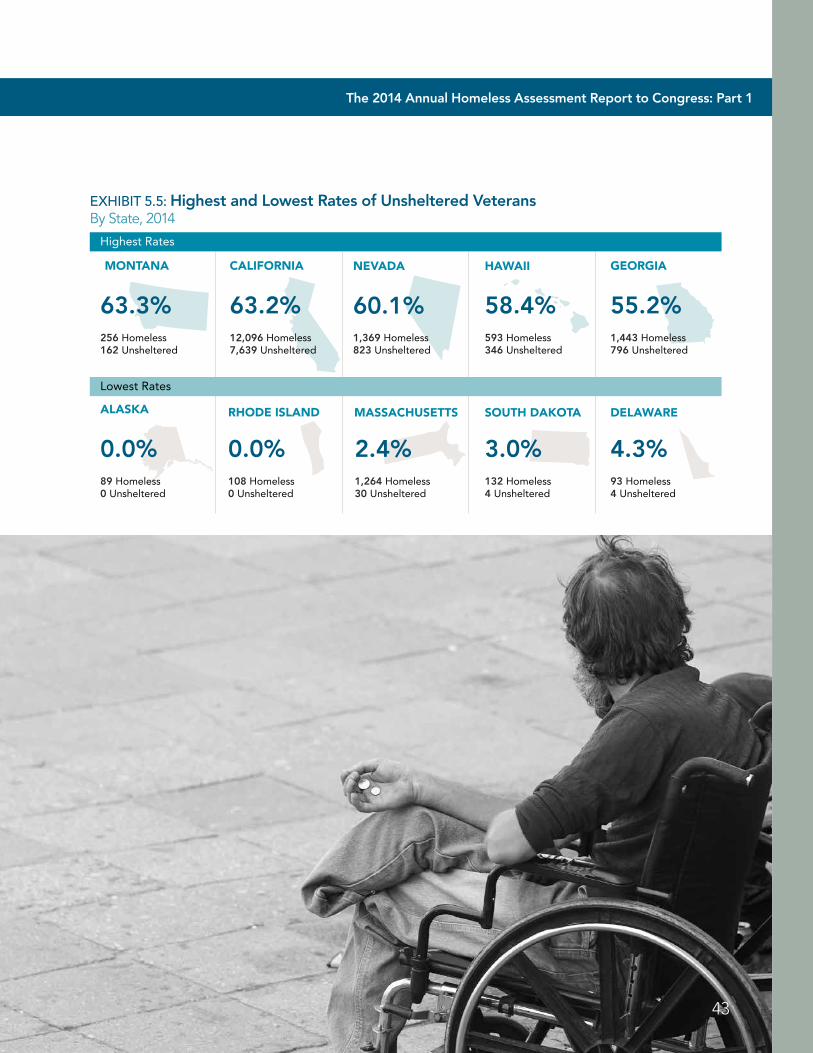
The 2014 Annual Homeless Assessment Report to Congress: Part 1
43
EXHIBIT 5.5: Highest and Lowest Rates of Unsheltered VeteransBy State, 2014
CALIFORNIA NEVADA HAWAIIMONTANA GEORGIA
256 Homeless162 Unsheltered
63.3%
ALASKA
89 Homeless0 Unsheltered
0.0%108 Homeless0 Unsheltered
0.0%1,264 Homeless30 Unsheltered
2.4%
1,369 Homeless823 Unsheltered
60.1%593 Homeless346 Unsheltered
58.4%12,096 Homeless7,639 Unsheltered
63.2%1,443 Homeless796 Unsheltered
55.2%
DELAWAREMASSACHUSETTSRHODE ISLAND
132 Homeless4 Unsheltered
3.0%93 Homeless4 Unsheltered
4.3%
SOUTH DAKOTA
Lowest Rates
Highest Rates
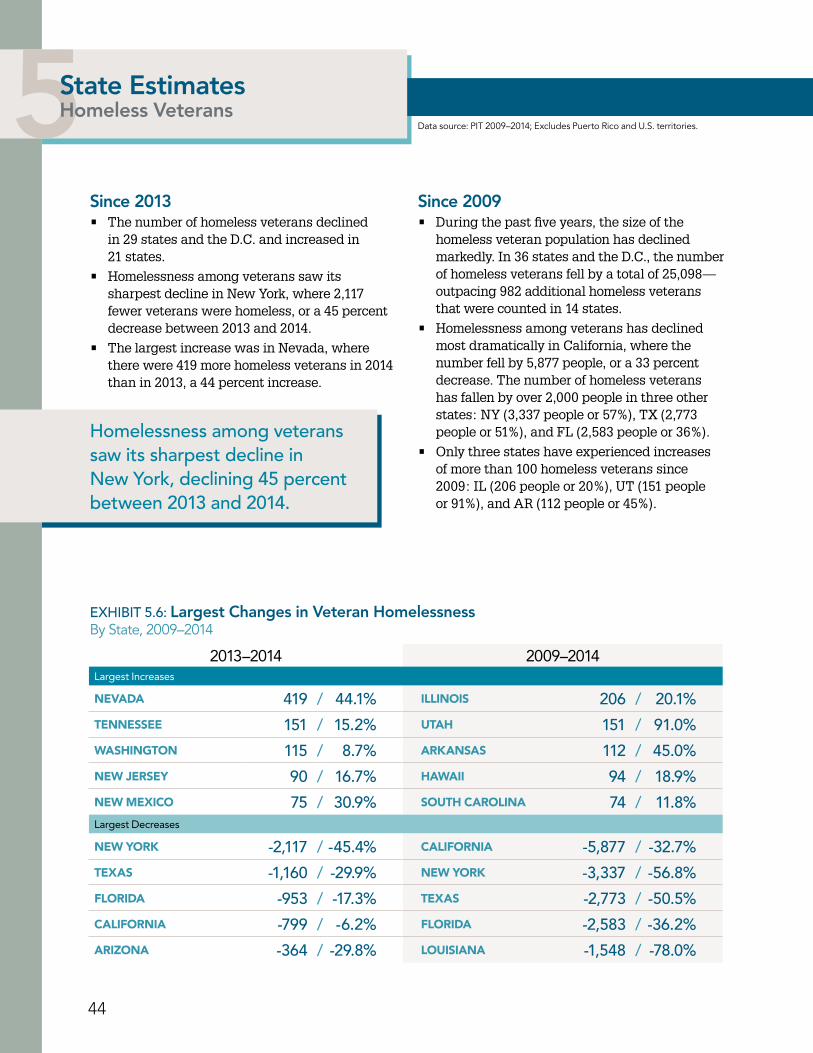
44
1National Estimates Homelessness in the United States5State Estimates Homeless Veterans
Since 2013• The number of homeless veterans declined
in 29 states and the D.C. and increased in 21 states.
• Homelessness among veterans saw its sharpest decline in New York, where 2,117 fewer veterans were homeless, or a 45 percent decrease between 2013 and 2014.
• The largest increase was in Nevada, where there were 419 more homeless veterans in 2014 than in 2013, a 44 percent increase.
Since 2009• During the past five years, the size of the
homeless veteran population has declined markedly. In 36 states and the D.C., the number of homeless veterans fell by a total of 25,098—outpacing 982 additional homeless veterans that were counted in 14 states.
• Homelessness among veterans has declined most dramatically in California, where the number fell by 5,877 people, or a 33 percent decrease. The number of homeless veterans has fallen by over 2,000 people in three other states: NY (3,337 people or 57%), TX (2,773 people or 51%), and FL (2,583 people or 36%).
• Only three states have experienced increases of more than 100 homeless veterans since 2009: IL (206 people or 20%), UT (151 people or 91%), and AR (112 people or 45%).
EXHIBIT 5.6: Largest Changes in Veteran Homelessness By State, 2009–2014
2013–2014 2009–2014Largest Increases
NEVADA 419 / 44.1% ILLINOIS 206 / 20.1%
TENNESSEE 151 / 15.2% UTAH 151 / 91.0%
WASHINGTON 115 / 8.7% ARKANSAS 112 / 45.0%
NEW JERSEY 90 / 16.7% HAWAII 94 / 18.9%
NEW MEXICO 75 / 30.9% SOUTH CAROLINA 74 / 11.8%Largest Decreases
NEW YORK -2,117 / -45.4% CALIFORNIA -5,877 / -32.7%
TEXAS -1,160 / -29.9% NEW YORK -3,337 / -56.8%
FLORIDA -953 / -17.3% TEXAS -2,773 / -50.5%
CALIFORNIA -799 / -6.2% FLORIDA -2,583 / -36.2%
ARIZONA -364 / -29.8% LOUISIANA -1,548 / -78.0%
Homelessness among veterans saw its sharpest decline in New York, declining 45 percent between 2013 and 2014.
Data source: PIT 2009–2014; Excludes Puerto Rico and U.S. territories.
The 2014 Annual Homeless Assessment Report to Congress: Part 1
45
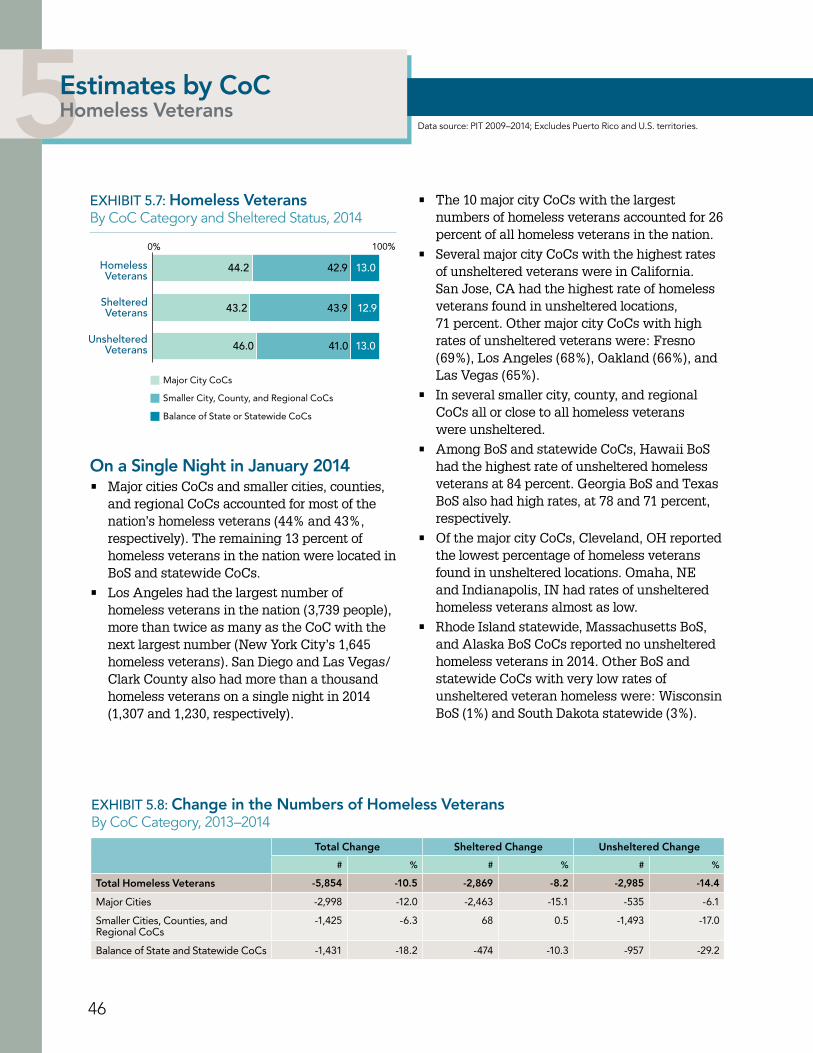
46
1National Estimates Homelessness in the United States5Estimates by CoCHomeless Veterans
EXHIBIT 5.7: Homeless Veterans By CoC Category and Sheltered Status, 2014
HomelessVeterans
ShelteredVeterans
UnshelteredVeterans
0% 100%
44.2
43.2
46.0 41.0
43.9
42.9 13.0
12.9
13.0
Major City CoCs
Smaller City, County, and Regional CoCs
Balance of State or Statewide CoCs
On a Single Night in January 2014 • Major cities CoCs and smaller cities, counties,
and regional CoCs accounted for most of the nation’s homeless veterans (44% and 43%, respectively). The remaining 13 percent of homeless veterans in the nation were located in BoS and statewide CoCs.
• Los Angeles had the largest number of homeless veterans in the nation (3,739 people), more than twice as many as the CoC with the next largest number (New York City’s 1,645 homeless veterans). San Diego and Las Vegas/Clark County also had more than a thousand homeless veterans on a single night in 2014 (1,307 and 1,230, respectively).
• The 10 major city CoCs with the largest numbers of homeless veterans accounted for 26 percent of all homeless veterans in the nation.
• Several major city CoCs with the highest rates of unsheltered veterans were in California. San Jose, CA had the highest rate of homeless veterans found in unsheltered locations, 71 percent. Other major city CoCs with high rates of unsheltered veterans were: Fresno (69%), Los Angeles (68%), Oakland (66%), and Las Vegas (65%).
• In several smaller city, county, and regional CoCs all or close to all homeless veterans were unsheltered.
• Among BoS and statewide CoCs, Hawaii BoS had the highest rate of unsheltered homeless veterans at 84 percent. Georgia BoS and Texas BoS also had high rates, at 78 and 71 percent, respectively.
• Of the major city CoCs, Cleveland, OH reported the lowest percentage of homeless veterans found in unsheltered locations. Omaha, NE and Indianapolis, IN had rates of unsheltered homeless veterans almost as low.
• Rhode Island statewide, Massachusetts BoS, and Alaska BoS CoCs reported no unsheltered homeless veterans in 2014. Other BoS and statewide CoCs with very low rates of unsheltered veteran homeless were: Wisconsin BoS (1%) and South Dakota statewide (3%).
Data source: PIT 2009–2014; Excludes Puerto Rico and U.S. territories.
EXHIBIT 5.8: Change in the Numbers of Homeless VeteransBy CoC Category, 2013–2014
Total Change Sheltered Change Unsheltered Change
# % # % # %
Total Homeless Veterans -5,854 -10.5 -2,869 -8.2 -2,985 -14.4
Major Cities -2,998 -12 .0 -2,463 -15 .1 -535 -6 .1
Smaller Cities, Counties, and Regional CoCs
-1,425 -6 .3 68 0 .5 -1,493 -17 .0
Balance of State and Statewide CoCs -1,431 -18 .2 -474 -10 .3 -957 -29 .2
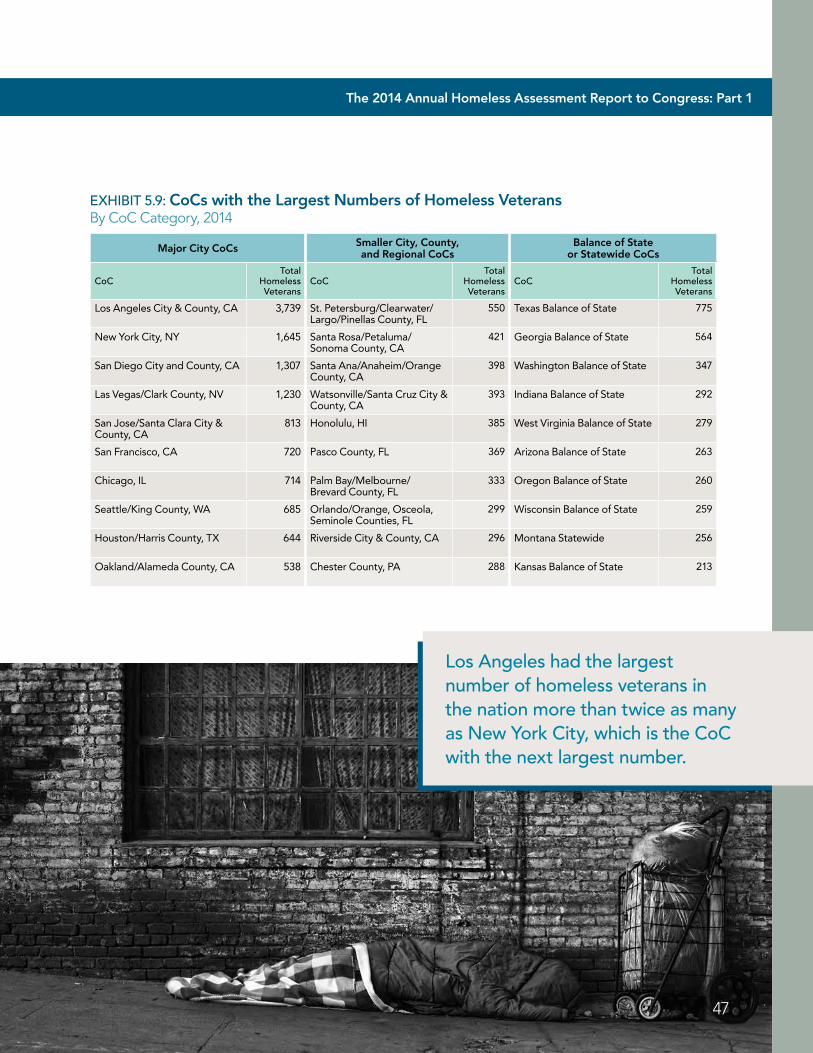
The 2014 Annual Homeless Assessment Report to Congress: Part 1
47
EXHIBIT 5.9: CoCs with the Largest Numbers of Homeless Veterans By CoC Category, 2014
Major City CoCs Smaller City, County, and Regional CoCs
Balance of State or Statewide CoCs
CoCTotal
Homeless Veterans
CoCTotal
Homeless Veterans
CoCTotal
Homeless Veterans
Los Angeles City & County, CA 3,739 St . Petersburg/Clearwater/Largo/Pinellas County, FL
550 Texas Balance of State 775
New York City, NY 1,645 Santa Rosa/Petaluma/Sonoma County, CA
421 Georgia Balance of State 564
San Diego City and County, CA 1,307 Santa Ana/Anaheim/Orange County, CA
398 Washington Balance of State 347
Las Vegas/Clark County, NV 1,230 Watsonville/Santa Cruz City & County, CA
393 Indiana Balance of State 292
San Jose/Santa Clara City & County, CA
813 Honolulu, HI 385 West Virginia Balance of State 279
San Francisco, CA 720 Pasco County, FL 369 Arizona Balance of State 263
Chicago, IL 714 Palm Bay/Melbourne/ Brevard County, FL
333 Oregon Balance of State 260
Seattle/King County, WA 685 Orlando/Orange, Osceola, Seminole Counties, FL
299 Wisconsin Balance of State 259
Houston/Harris County, TX 644 Riverside City & County, CA 296 Montana Statewide 256
Oakland/Alameda County, CA 538 Chester County, PA 288 Kansas Balance of State 213
Los Angeles had the largest number of homeless veterans in the nation more than twice as many as New York City, which is the CoC with the next largest number.
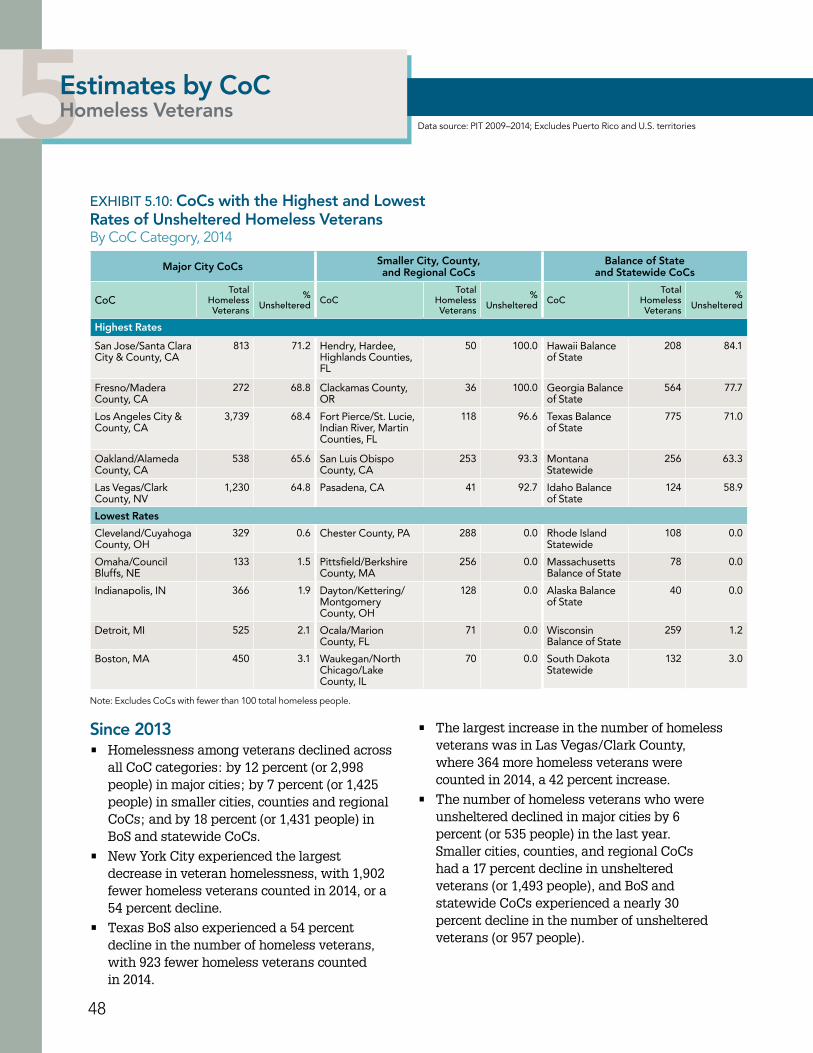
48
1National Estimates Homelessness in the United States5Estimates by CoCHomeless Veterans
EXHIBIT 5.10: CoCs with the Highest and Lowest Rates of Unsheltered Homeless Veterans By CoC Category, 2014
Major City CoCs Smaller City, County, and Regional CoCs
Balance of State and Statewide CoCs
CoCTotal
Homeless Veterans
% Unsheltered CoC
Total Homeless Veterans
% Unsheltered CoC
Total Homeless Veterans
% Unsheltered
Highest Rates
San Jose/Santa Clara City & County, CA
813 71 .2 Hendry, Hardee, Highlands Counties, FL
50 100 .0 Hawaii Balance of State
208 84 .1
Fresno/Madera County, CA
272 68 .8 Clackamas County, OR
36 100 .0 Georgia Balance of State
564 77 .7
Los Angeles City & County, CA
3,739 68 .4 Fort Pierce/St . Lucie, Indian River, Martin Counties, FL
118 96 .6 Texas Balance of State
775 71 .0
Oakland/Alameda County, CA
538 65 .6 San Luis Obispo County, CA
253 93 .3 Montana Statewide
256 63 .3
Las Vegas/Clark County, NV
1,230 64 .8 Pasadena, CA 41 92 .7 Idaho Balance of State
124 58 .9
Lowest Rates
Cleveland/Cuyahoga County, OH
329 0 .6 Chester County, PA 288 0 .0 Rhode Island Statewide
108 0 .0
Omaha/Council Bluffs, NE
133 1 .5 Pittsfield/Berkshire County, MA
256 0 .0 Massachusetts Balance of State
78 0 .0
Indianapolis, IN 366 1 .9 Dayton/Kettering/Montgomery County, OH
128 0 .0 Alaska Balance of State
40 0 .0
Detroit, MI 525 2 .1 Ocala/Marion County, FL
71 0 .0 Wisconsin Balance of State
259 1 .2
Boston, MA 450 3 .1 Waukegan/North Chicago/Lake County, IL
70 0 .0 South Dakota Statewide
132 3 .0
Data source: PIT 2009–2014; Excludes Puerto Rico and U.S. territories
Since 2013• Homelessness among veterans declined across
all CoC categories: by 12 percent (or 2,998 people) in major cities; by 7 percent (or 1,425 people) in smaller cities, counties and regional CoCs; and by 18 percent (or 1,431 people) in BoS and statewide CoCs.
• New York City experienced the largest decrease in veteran homelessness, with 1,902 fewer homeless veterans counted in 2014, or a 54 percent decline.
• Texas BoS also experienced a 54 percent decline in the number of homeless veterans, with 923 fewer homeless veterans counted in 2014.
• The largest increase in the number of homeless veterans was in Las Vegas/Clark County, where 364 more homeless veterans were counted in 2014, a 42 percent increase.
• The number of homeless veterans who were unsheltered declined in major cities by 6 percent (or 535 people) in the last year. Smaller cities, counties, and regional CoCs had a 17 percent decline in unsheltered veterans (or 1,493 people), and BoS and statewide CoCs experienced a nearly 30 percent decline in the number of unsheltered veterans (or 957 people).
Note: Excludes CoCs with fewer than 100 total homeless people.
The 2014 Annual Homeless Assessment Report to Congress: Part 1
49
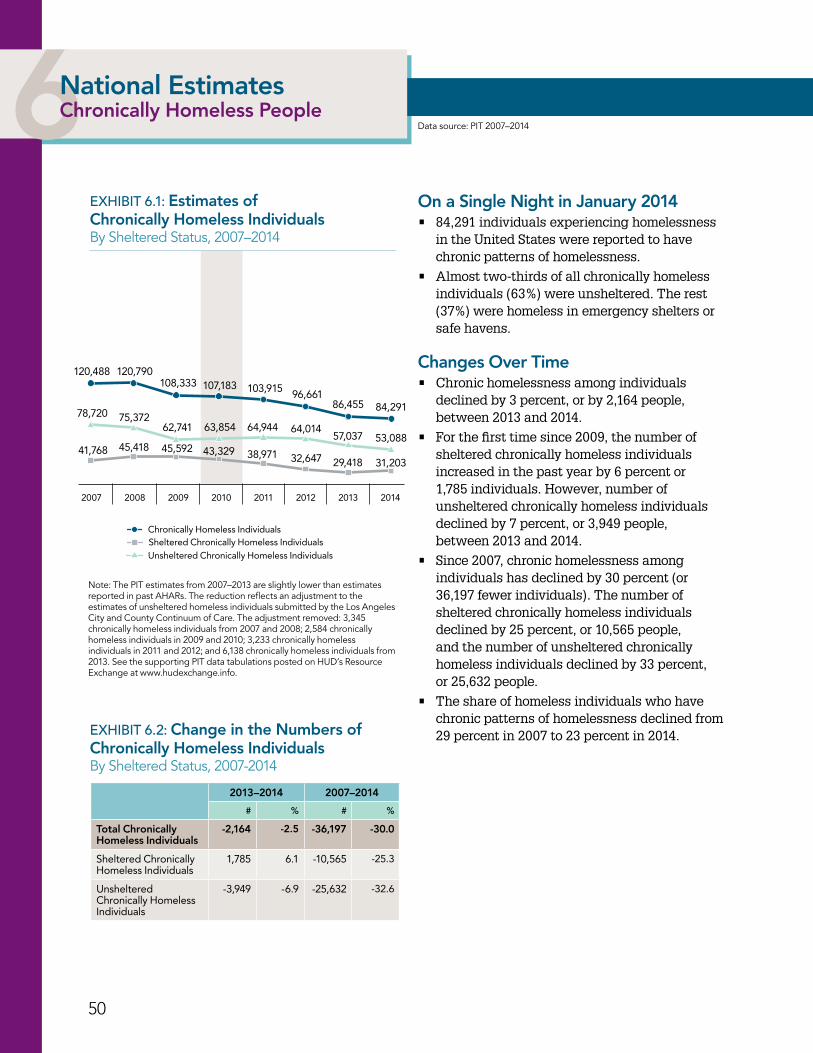
50
1National Estimates Homelessness in the United States6National Estimates Chronically Homeless People
Sheltered Chronically Homeless IndividualsUnsheltered Chronically Homeless Individuals
Chronically Homeless Individuals
2007 2008 2009 2010 20122011 2013 2014
120,488 120,790108,333 107,183 103,915 96,661
86,455 84,291
41,768 45,418 45,592 43,329 38,971 32,647 29,418 31,203
78,720 75,37262,741 63,854 64,944 64,014
57,037 53,088
EXHIBIT 6.1: Estimates of Chronically Homeless IndividualsBy Sheltered Status, 2007–2014
On a Single Night in January 2014• 84,291 individuals experiencing homelessness
in the United States were reported to have chronic patterns of homelessness.
• Almost two-thirds of all chronically homeless individuals (63%) were unsheltered. The rest (37%) were homeless in emergency shelters or safe havens.
Changes Over Time• Chronic homelessness among individuals
declined by 3 percent, or by 2,164 people, between 2013 and 2014.
• For the first time since 2009, the number of sheltered chronically homeless individuals increased in the past year by 6 percent or 1,785 individuals. However, number of unsheltered chronically homeless individuals declined by 7 percent, or 3,949 people, between 2013 and 2014.
• Since 2007, chronic homelessness among individuals has declined by 30 percent (or 36,197 fewer individuals). The number of sheltered chronically homeless individuals declined by 25 percent, or 10,565 people, and the number of unsheltered chronically homeless individuals declined by 33 percent, or 25,632 people.
• The share of homeless individuals who have chronic patterns of homelessness declined from 29 percent in 2007 to 23 percent in 2014.
Data source: PIT 2007–2014
EXHIBIT 6.2: Change in the Numbers of Chronically Homeless IndividualsBy Sheltered Status, 2007-2014
2013–2014 2007–2014
# % # %
Total Chronically Homeless Individuals
-2,164 -2.5 -36,197 -30.0
Sheltered Chronically Homeless Individuals
1,785 6 .1 -10,565 -25 .3
Unsheltered Chronically Homeless Individuals
-3,949 -6 .9 -25,632 -32 .6
Note: The PIT estimates from 2007–2013 are slightly lower than estimates reported in past AHARs. The reduction reflects an adjustment to the estimates of unsheltered homeless individuals submitted by the Los Angeles City and County Continuum of Care. The adjustment removed: 3,345 chronically homeless individuals from 2007 and 2008; 2,584 chronically homeless individuals in 2009 and 2010; 3,233 chronically homeless individuals in 2011 and 2012; and 6,138 chronically homeless individuals from 2013. See the supporting PIT data tabulations posted on HUD’s Resource Exchange at www.hudexchange.info.
The 2014 Annual Homeless Assessment Report to Congress: Part 1
51
PROGRESS ON THE FEDERAL STRATEGIC PLAN
Since the release of the plan in 2010, the number of individuals experiencing chronic homelessness has declined by 22,892 people, or 21 percent.
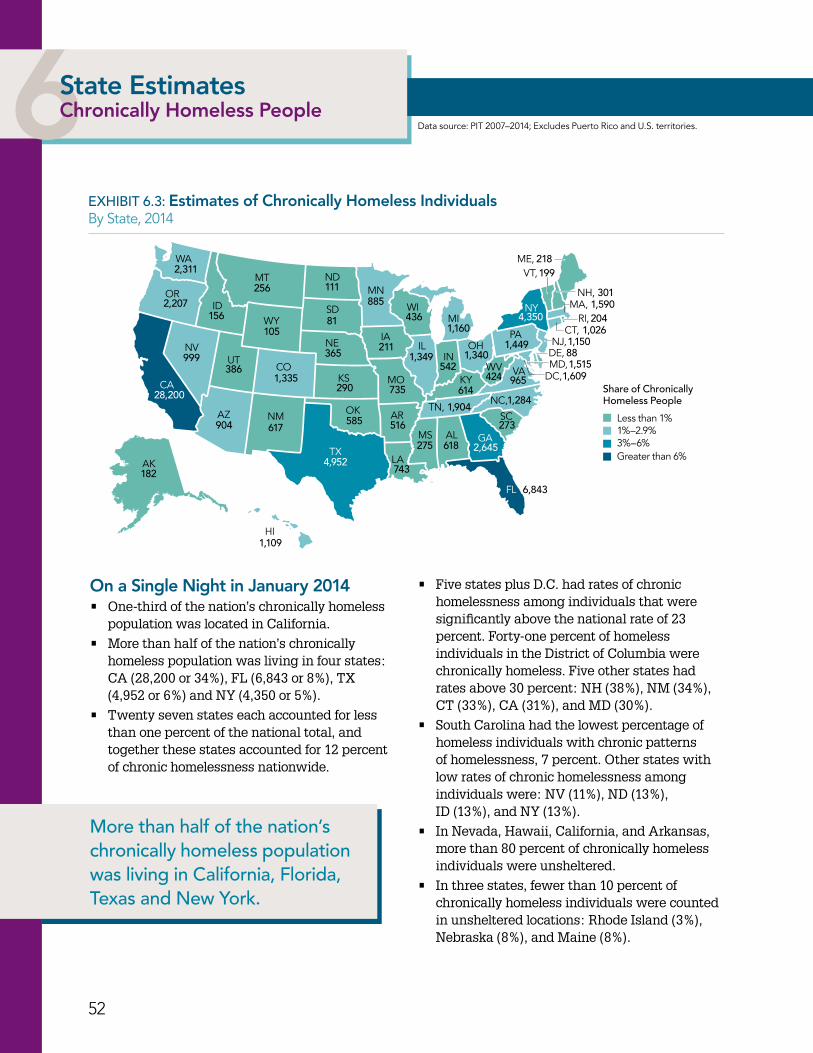
52
1National Estimates Homelessness in the United States6State Estimates Chronically Homeless People
EXHIBIT 6.3: Estimates of Chronically Homeless Individuals By State, 2014
On a Single Night in January 2014• One-third of the nation’s chronically homeless
population was located in California.
• More than half of the nation’s chronically homeless population was living in four states: CA (28,200 or 34%), FL (6,843 or 8%), TX (4,952 or 6%) and NY (4,350 or 5%).
• Twenty seven states each accounted for less than one percent of the national total, and together these states accounted for 12 percent of chronic homelessness nationwide.
ME,
NH,
VT,
NY MA,RI,
CT,NJ,
DE,
DC,
PA
VAWV
NC,
SC
GA
FL
AL
TN,
KY
OHIL
MIWI
MN
IA
MO
AR
LATX
OK
KS
NE
SD
NDMT
WA
OR
CA
AK
HI
WY
CO
NMAZ
UTNV
ID
IN
MS
MD,
Share of Chronically Homeless People
Less than 1%1%–2.9%
Greater than 6%3%–6%
81
365
290
585
211
735
743
516
436
1,349
1,160
1,3401,449
885
965
1,284
6,843
2,6454,952
28,200
4,350
904
1,109
542
614
1,904
273
424
199218
2041,590
1,026
301
105
1,335386
999
617
275 618
256
1562,207
2,311
182
111
881,515
1,609
1,150
• Five states plus D.C. had rates of chronic homelessness among individuals that were significantly above the national rate of 23 percent. Forty-one percent of homeless individuals in the District of Columbia were chronically homeless. Five other states had rates above 30 percent: NH (38%), NM (34%), CT (33%), CA (31%), and MD (30%).
• South Carolina had the lowest percentage of homeless individuals with chronic patterns of homelessness, 7 percent. Other states with low rates of chronic homelessness among individuals were: NV (11%), ND (13%), ID (13%), and NY (13%).
• In Nevada, Hawaii, California, and Arkansas, more than 80 percent of chronically homeless individuals were unsheltered.
• In three states, fewer than 10 percent of chronically homeless individuals were counted in unsheltered locations: Rhode Island (3%), Nebraska (8%), and Maine (8%).
Data source: PIT 2007–2014; Excludes Puerto Rico and U.S. territories.
More than half of the nation’s chronically homeless population was living in California, Florida, Texas and New York.
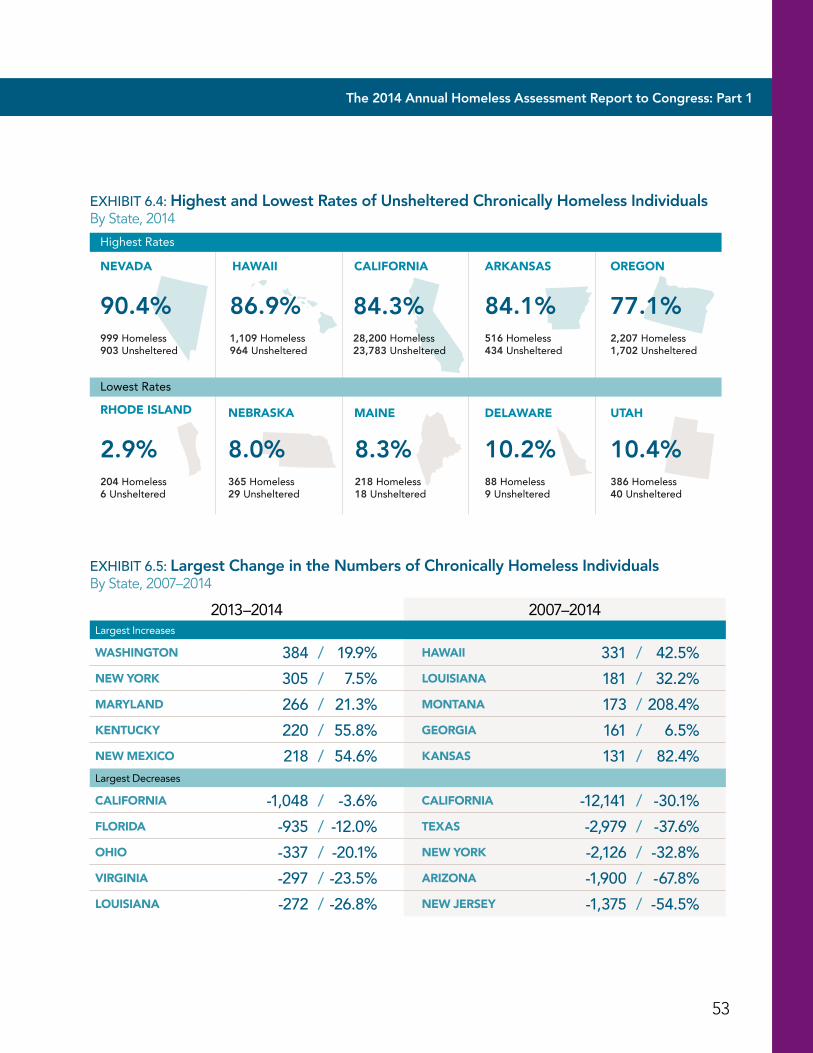
53
The 2014 Annual Homeless Assessment Report to Congress: Part 1
EXHIBIT 6.5: Largest Change in the Numbers of Chronically Homeless IndividualsBy State, 2007–2014
EXHIBIT 6.4: Highest and Lowest Rates of Unsheltered Chronically Homeless IndividualsBy State, 2014
OREGONCALIFORNIANEVADA HAWAII
999 Homeless903 Unsheltered
90.4%
RHODE ISLAND
204 Homeless6 Unsheltered
2.9%365 Homeless29 Unsheltered
8.0%218 Homeless18 Unsheltered
8.3%
28,200 Homeless23,783 Unsheltered
84.3%516 Homeless434 Unsheltered
84.1%1,109 Homeless964 Unsheltered
86.9%2,207 Homeless1,702 Unsheltered
77.1%
UTAHMAINENEBRASKA
88 Homeless9 Unsheltered
10.2%386 Homeless40 Unsheltered
10.4%
DELAWARE
Lowest Rates
Highest Rates
ARKANSAS
2013–2014 2007–2014Largest Increases
WASHINGTON 384 / 19.9% HAWAII 331 / 42.5%
NEW YORK 305 / 7.5% LOUISIANA 181 / 32.2%
MARYLAND 266 / 21.3% MONTANA 173 / 208.4%
KENTUCKY 220 / 55.8% GEORGIA 161 / 6.5%
NEW MEXICO 218 / 54.6% KANSAS 131 / 82.4%Largest Decreases
CALIFORNIA -1,048 / -3.6% CALIFORNIA -12,141 / -30.1%
FLORIDA -935 / -12.0% TEXAS -2,979 / -37.6%
OHIO -337 / -20.1% NEW YORK -2,126 / -32.8%
VIRGINIA -297 / -23.5% ARIZONA -1,900 / -67.8%
LOUISIANA -272 / -26.8% NEW JERSEY -1,375 / -54.5%
1National Estimates Homelessness in the United States6
54
State Estimates Chronically Homeless People
Changes Over Time• 24 states experienced increases in the number
of chronically homeless individuals between 2013 and 2014. Washington had the largest increase (384 more chronically homeless individuals) in the past year. Other states with large increases were: NY (305), MD (266), KY (220), and NM (218).
• Between 2013 and 2014, 26 states and D.C. experienced decreases in the number of chronically homeless individuals. The largest decrease in chronic homelessness occurred in California (1,048 fewer chronically homeless individuals), Florida (935), and Ohio (337).
• Three-quarters of states (37 states and D.C.) experienced declines in chronic homelessness since 2007. California had the largest decrease since 2007 (12,141 fewer chronically homeless individuals). Other states with large declines over the six year period were: TX (2,979), NY (2,126), AZ (1,900), and NJ (1,375).
• Since 2007, 13 states experienced increases in the number of chronically homeless individuals. Hawaii had the largest increase, with 331 additional chronically homeless individuals.
Data source: PIT 2007–2014; Excludes Puerto Rico and U.S. territories.
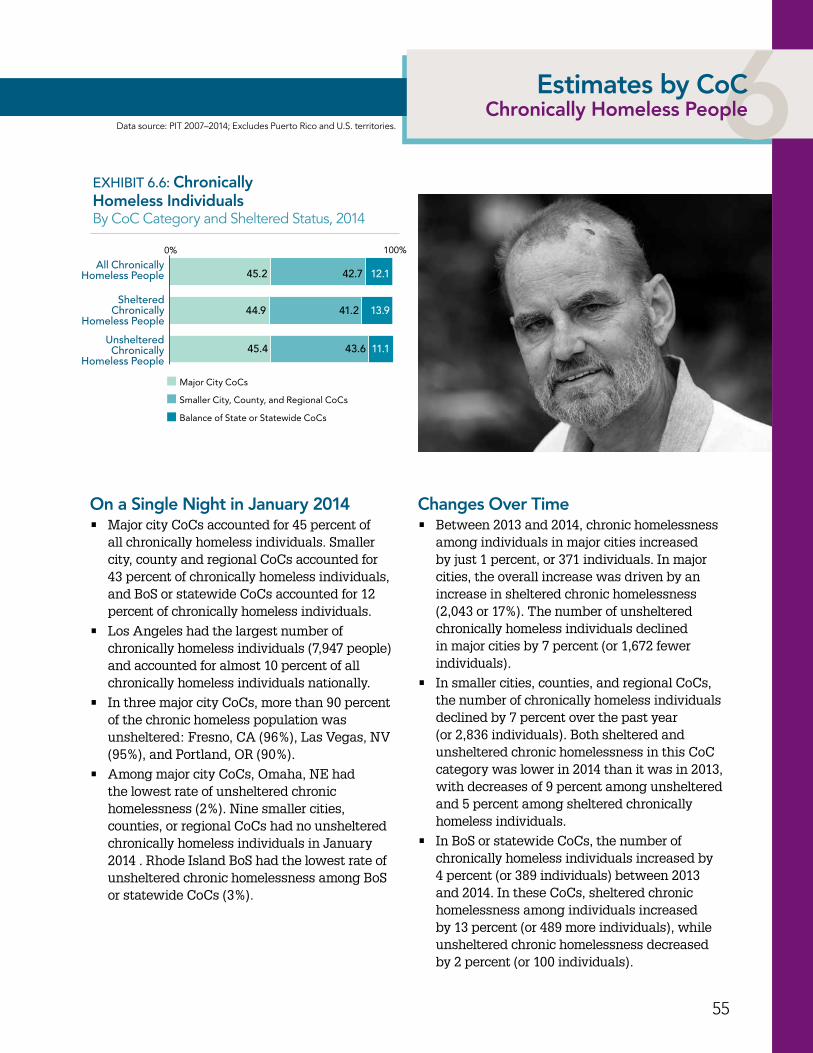
55
6Estimates by CoC Chronically Homeless People
EXHIBIT 6.6: Chronically Homeless Individuals By CoC Category and Sheltered Status, 2014
All ChronicallyHomeless People
ShelteredChronically
Homeless People
UnshelteredChronically
Homeless People
0% 100%
Major City CoCs
Smaller City, County, and Regional CoCs
Balance of State or Statewide CoCs
45.2
44.9
45.4
12.1
11.1
13.9
42.7
41.2
43.6
Data source: PIT 2007–2014; Excludes Puerto Rico and U.S. territories.
On a Single Night in January 2014• Major city CoCs accounted for 45 percent of
all chronically homeless individuals. Smaller city, county and regional CoCs accounted for 43 percent of chronically homeless individuals, and BoS or statewide CoCs accounted for 12 percent of chronically homeless individuals.
• Los Angeles had the largest number of chronically homeless individuals (7,947 people) and accounted for almost 10 percent of all chronically homeless individuals nationally.
• In three major city CoCs, more than 90 percent of the chronic homeless population was unsheltered: Fresno, CA (96%), Las Vegas, NV (95%), and Portland, OR (90%).
• Among major city CoCs, Omaha, NE had the lowest rate of unsheltered chronic homelessness (2%). Nine smaller cities, counties, or regional CoCs had no unsheltered chronically homeless individuals in January 2014 . Rhode Island BoS had the lowest rate of unsheltered chronic homelessness among BoS or statewide CoCs (3%).
Changes Over Time• Between 2013 and 2014, chronic homelessness
among individuals in major cities increased by just 1 percent, or 371 individuals. In major cities, the overall increase was driven by an increase in sheltered chronic homelessness (2,043 or 17%). The number of unsheltered chronically homeless individuals declined in major cities by 7 percent (or 1,672 fewer individuals).
• In smaller cities, counties, and regional CoCs, the number of chronically homeless individuals declined by 7 percent over the past year (or 2,836 individuals). Both sheltered and unsheltered chronic homelessness in this CoC category was lower in 2014 than it was in 2013, with decreases of 9 percent among unsheltered and 5 percent among sheltered chronically homeless individuals.
• In BoS or statewide CoCs, the number of chronically homeless individuals increased by 4 percent (or 389 individuals) between 2013 and 2014. In these CoCs, sheltered chronic homelessness among individuals increased by 13 percent (or 489 more individuals), while unsheltered chronic homelessness decreased by 2 percent (or 100 individuals).
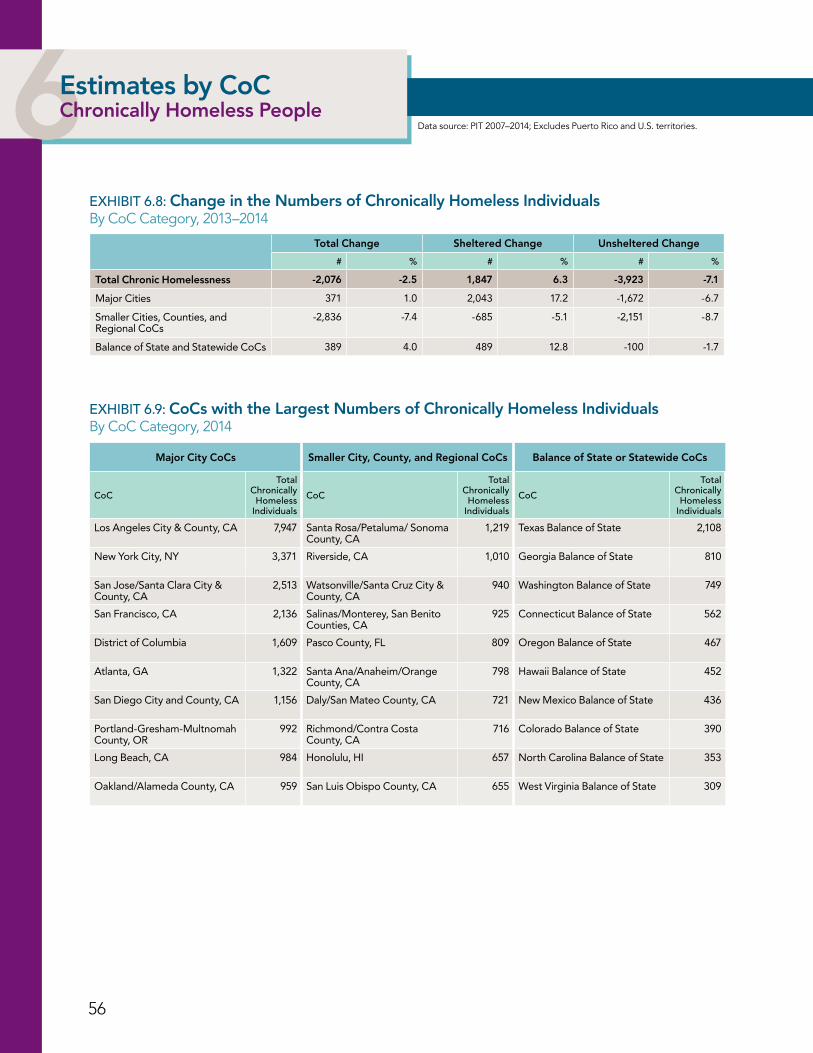
56
1National Estimates Homelessness in the United States6Estimates by CoCChronically Homeless People
EXHIBIT 6.9: CoCs with the Largest Numbers of Chronically Homeless IndividualsBy CoC Category, 2014
Major City CoCs Smaller City, County, and Regional CoCs Balance of State or Statewide CoCs
CoC
Total Chronically
Homeless Individuals
CoC
Total Chronically
Homeless Individuals
CoC
Total Chronically
Homeless Individuals
Los Angeles City & County, CA 7,947 Santa Rosa/Petaluma/ Sonoma County, CA
1,219 Texas Balance of State 2,108
New York City, NY 3,371 Riverside, CA 1,010 Georgia Balance of State 810
San Jose/Santa Clara City & County, CA
2,513 Watsonville/Santa Cruz City & County, CA
940 Washington Balance of State 749
San Francisco, CA 2,136 Salinas/Monterey, San Benito Counties, CA
925 Connecticut Balance of State 562
District of Columbia 1,609 Pasco County, FL 809 Oregon Balance of State 467
Atlanta, GA 1,322 Santa Ana/Anaheim/Orange County, CA
798 Hawaii Balance of State 452
San Diego City and County, CA 1,156 Daly/San Mateo County, CA 721 New Mexico Balance of State 436
Portland-Gresham-Multnomah County, OR
992 Richmond/Contra Costa County, CA
716 Colorado Balance of State 390
Long Beach, CA 984 Honolulu, HI 657 North Carolina Balance of State 353
Oakland/Alameda County, CA 959 San Luis Obispo County, CA 655 West Virginia Balance of State 309
Data source: PIT 2007–2014; Excludes Puerto Rico and U.S. territories.
EXHIBIT 6.8: Change in the Numbers of Chronically Homeless IndividualsBy CoC Category, 2013–2014
Total Change Sheltered Change Unsheltered Change
# % # % # %
Total Chronic Homelessness -2,076 -2.5 1,847 6.3 -3,923 -7.1
Major Cities 371 1 .0 2,043 17 .2 -1,672 -6 .7
Smaller Cities, Counties, and Regional CoCs
-2,836 -7 .4 -685 -5 .1 -2,151 -8 .7
Balance of State and Statewide CoCs 389 4 .0 489 12 .8 -100 -1 .7
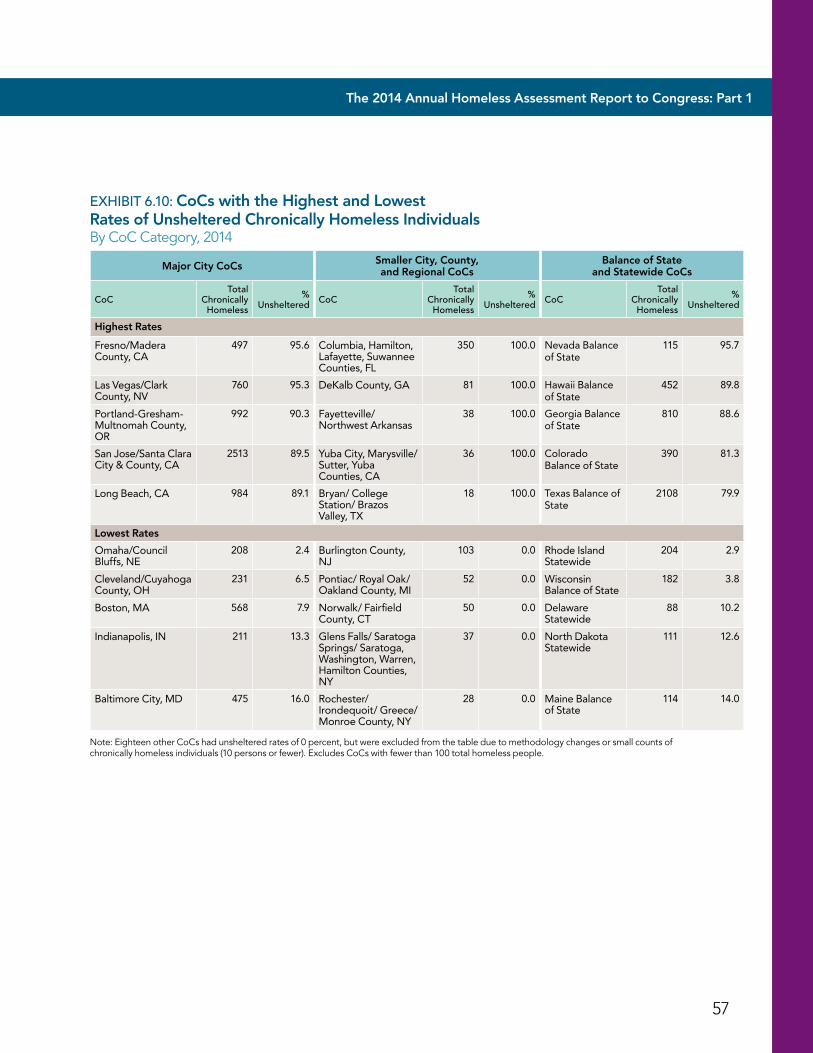
57
The 2014 Annual Homeless Assessment Report to Congress: Part 1
EXHIBIT 6.10: CoCs with the Highest and Lowest Rates of Unsheltered Chronically Homeless Individuals By CoC Category, 2014
Major City CoCs Smaller City, County, and Regional CoCs
Balance of State and Statewide CoCs
CoCTotal
Chronically Homeless
% Unsheltered CoC
Total Chronically
Homeless
% Unsheltered CoC
Total Chronically
Homeless
% Unsheltered
Highest Rates
Fresno/Madera County, CA
497 95 .6 Columbia, Hamilton, Lafayette, Suwannee Counties, FL
350 100 .0 Nevada Balance of State
115 95 .7
Las Vegas/Clark County, NV
760 95 .3 DeKalb County, GA 81 100 .0 Hawaii Balance of State
452 89 .8
Portland-Gresham-Multnomah County, OR
992 90 .3 Fayetteville/ Northwest Arkansas
38 100 .0 Georgia Balance of State
810 88 .6
San Jose/Santa Clara City & County, CA
2513 89 .5 Yuba City, Marysville/Sutter, Yuba Counties, CA
36 100 .0 Colorado Balance of State
390 81 .3
Long Beach, CA 984 89 .1 Bryan/ College Station/ Brazos Valley, TX
18 100 .0 Texas Balance of State
2108 79 .9
Lowest Rates
Omaha/Council Bluffs, NE
208 2 .4 Burlington County, NJ
103 0 .0 Rhode Island Statewide
204 2 .9
Cleveland/Cuyahoga County, OH
231 6 .5 Pontiac/ Royal Oak/ Oakland County, MI
52 0 .0 Wisconsin Balance of State
182 3 .8
Boston, MA 568 7 .9 Norwalk/ Fairfield County, CT
50 0 .0 Delaware Statewide
88 10 .2
Indianapolis, IN 211 13 .3 Glens Falls/ Saratoga Springs/ Saratoga, Washington, Warren, Hamilton Counties, NY
37 0 .0 North Dakota Statewide
111 12 .6
Baltimore City, MD 475 16 .0 Rochester/ Irondequoit/ Greece/ Monroe County, NY
28 0 .0 Maine Balance of State
114 14 .0
Note: Eighteen other CoCs had unsheltered rates of 0 percent, but were excluded from the table due to methodology changes or small counts of chronically homeless individuals (10 persons or fewer). Excludes CoCs with fewer than 100 total homeless people.
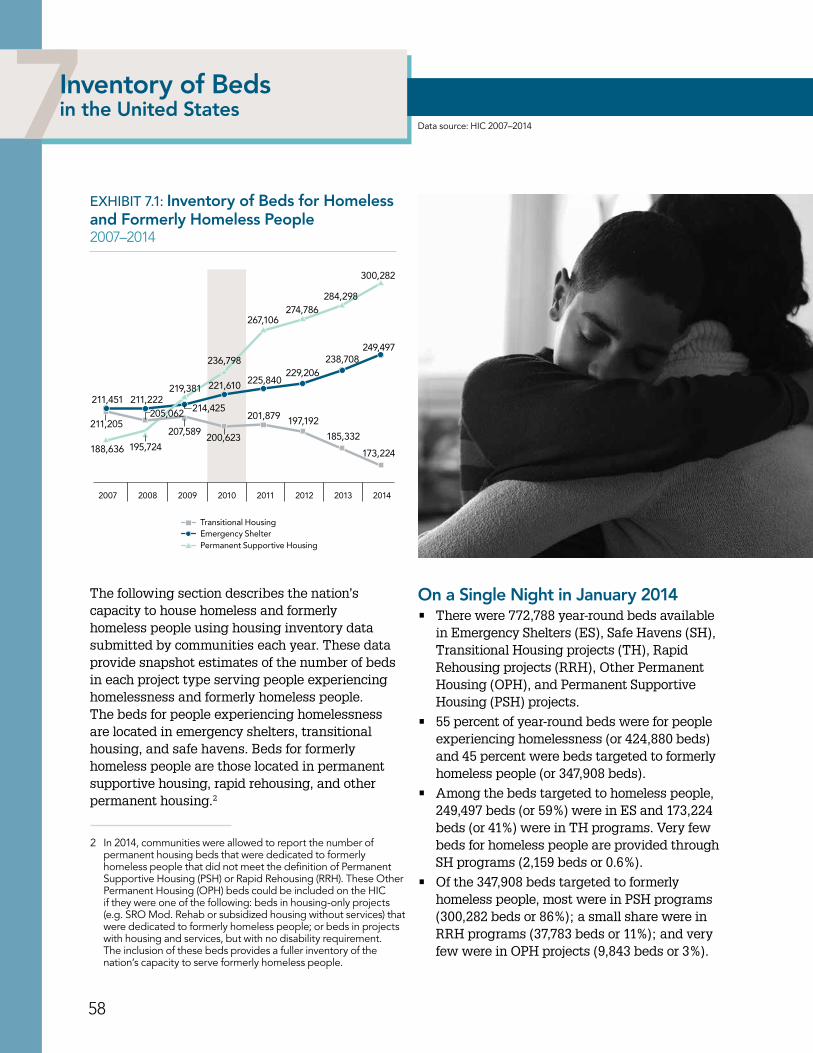
58
1National Estimates Homelessness in the United States7Inventory of Bedsin the United States
EXHIBIT 7.1: Inventory of Beds for Homeless and Formerly Homeless People2007–2014
2007 2008 2009 2010 20122011 2013 2014
211,451
Emergency ShelterTransitional Housing
Permanent Supportive Housing
211,222214,425
221,610 225,840229,206
211,205205,062
207,589200,623
201,879 197,192
185,332
173,224188,636 195,724
219,381
236,798
267,106274,786
284,298
249,497238,708
300,282
The following section describes the nation’s capacity to house homeless and formerly homeless people using housing inventory data submitted by communities each year. These data provide snapshot estimates of the number of beds in each project type serving people experiencing homelessness and formerly homeless people. The beds for people experiencing homelessness are located in emergency shelters, transitional housing, and safe havens. Beds for formerly homeless people are those located in permanent supportive housing, rapid rehousing, and other permanent housing.2
Data source: HIC 2007–2014
On a Single Night in January 2014• There were 772,788 year-round beds available
in Emergency Shelters (ES), Safe Havens (SH), Transitional Housing projects (TH), Rapid Rehousing projects (RRH), Other Permanent Housing (OPH), and Permanent Supportive Housing (PSH) projects.
• 55 percent of year-round beds were for people experiencing homelessness (or 424,880 beds) and 45 percent were beds targeted to formerly homeless people (or 347,908 beds).
• Among the beds targeted to homeless people, 249,497 beds (or 59%) were in ES and 173,224 beds (or 41%) were in TH programs. Very few beds for homeless people are provided through SH programs (2,159 beds or 0.6%).
• Of the 347,908 beds targeted to formerly homeless people, most were in PSH programs (300,282 beds or 86%); a small share were in RRH programs (37,783 beds or 11%); and very few were in OPH projects (9,843 beds or 3%).
2 In 2014, communities were allowed to report the number of permanent housing beds that were dedicated to formerly homeless people that did not meet the definition of Permanent Supportive Housing (PSH) or Rapid Rehousing (RRH). These Other Permanent Housing (OPH) beds could be included on the HIC if they were one of the following: beds in housing-only projects (e.g. SRO Mod. Rehab or subsidized housing without services) that were dedicated to formerly homeless people; or beds in projects with housing and services, but with no disability requirement. The inclusion of these beds provides a fuller inventory of the nation’s capacity to serve formerly homeless people.
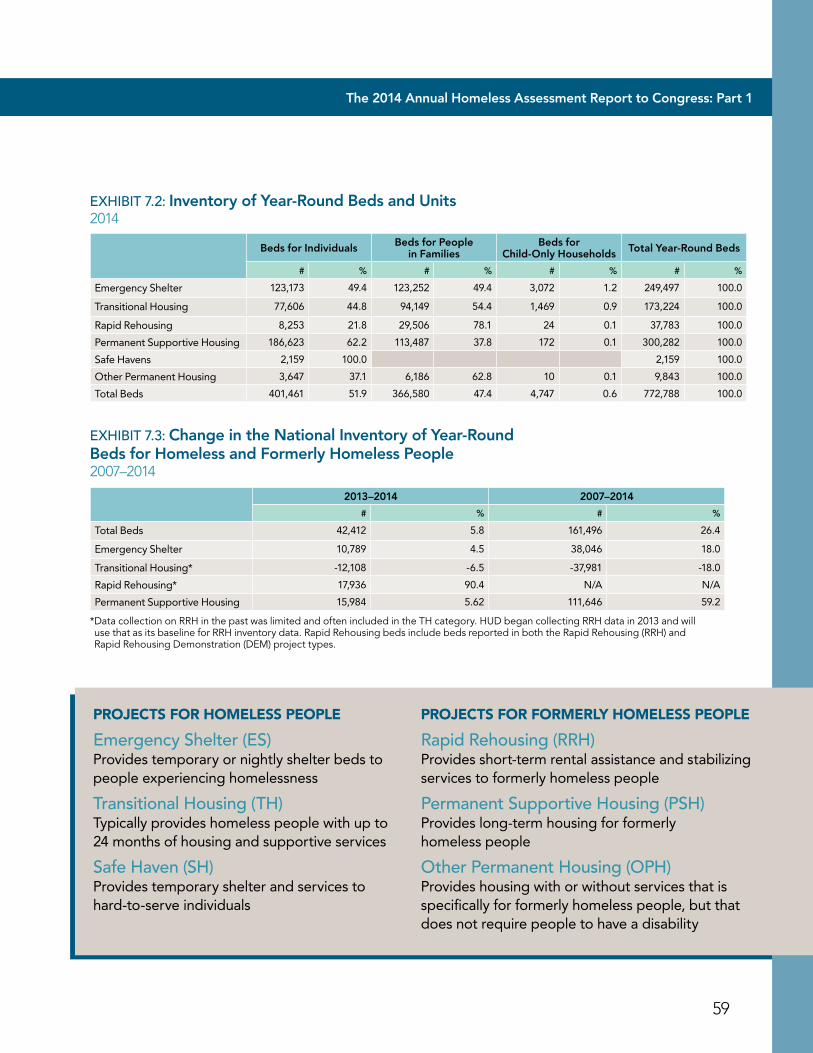
59
The 2014 Annual Homeless Assessment Report to Congress: Part 1
EXHIBIT 7.2: Inventory of Year-Round Beds and Units2014
EXHIBIT 7.3: Change in the National Inventory of Year-Round Beds for Homeless and Formerly Homeless People2007–2014
Beds for Individuals Beds for People in Families
Beds for Child-Only Households Total Year-Round Beds
# % # % # % # %
Emergency Shelter 123,173 49 .4 123,252 49 .4 3,072 1 .2 249,497 100 .0
Transitional Housing 77,606 44 .8 94,149 54 .4 1,469 0 .9 173,224 100 .0
Rapid Rehousing 8,253 21 .8 29,506 78 .1 24 0 .1 37,783 100 .0
Permanent Supportive Housing 186,623 62 .2 113,487 37 .8 172 0 .1 300,282 100 .0
Safe Havens 2,159 100 .0 2,159 100 .0
Other Permanent Housing 3,647 37 .1 6,186 62 .8 10 0 .1 9,843 100 .0
Total Beds 401,461 51 .9 366,580 47 .4 4,747 0 .6 772,788 100 .0
2013–2014 2007–2014
# % # %
Total Beds 42,412 5 .8 161,496 26 .4
Emergency Shelter 10,789 4 .5 38,046 18 .0
Transitional Housing* -12,108 -6 .5 -37,981 -18 .0
Rapid Rehousing* 17,936 90 .4 N/A N/A
Permanent Supportive Housing 15,984 5 .62 111,646 59 .2
* Data collection on RRH in the past was limited and often included in the TH category. HUD began collecting RRH data in 2013 and will use that as its baseline for RRH inventory data. Rapid Rehousing beds include beds reported in both the Rapid Rehousing (RRH) and Rapid Rehousing Demonstration (DEM) project types.
PROJECTS FOR HOMELESS PEOPLE
Emergency Shelter (ES) Provides temporary or nightly shelter beds to people experiencing homelessness
Transitional Housing (TH) Typically provides homeless people with up to 24 months of housing and supportive services
Safe Haven (SH) Provides temporary shelter and services to hard-to-serve individuals
PROJECTS FOR FORMERLY HOMELESS PEOPLE
Rapid Rehousing (RRH) Provides short-term rental assistance and stabilizing services to formerly homeless people
Permanent Supportive Housing (PSH) Provides long-term housing for formerly homeless people
Other Permanent Housing (OPH) Provides housing with or without services that is specifically for formerly homeless people, but that does not require people to have a disability
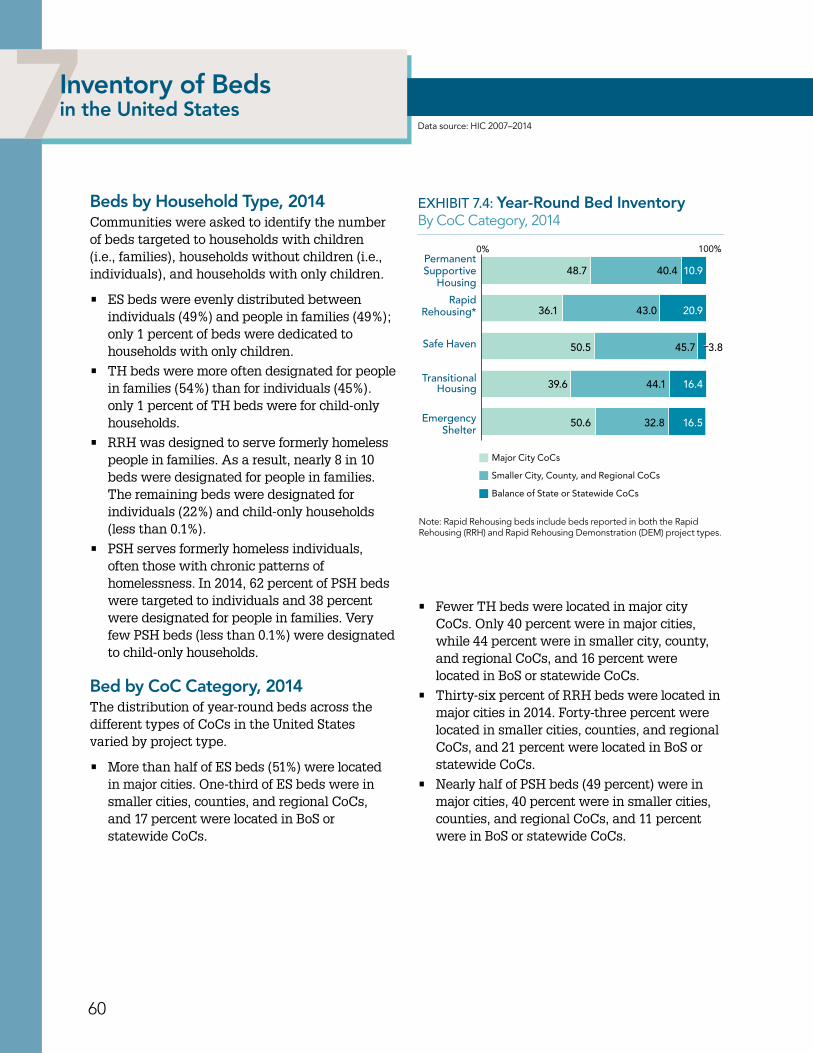
1National Estimates Homelessness in the United States7Inventory of Bedsin the United States
60
EXHIBIT 7.4: Year-Round Bed Inventory By CoC Category, 2014
EmergencyShelter
TransitionalHousing
RapidRehousing*
PermanentSupportive
Housing
Safe Haven
0% 100%
Major City CoCs
Smaller City, County, and Regional CoCs
Balance of State or Statewide CoCs
48.7 40.4 10.9
36.1 43.0 20.9
50.5 45.7 3.8
39.6 44.1 16.4
50.6 32.8 16.5
Beds by Household Type, 2014Communities were asked to identify the number of beds targeted to households with children (i.e., families), households without children (i.e., individuals), and households with only children.
• ES beds were evenly distributed between individuals (49%) and people in families (49%); only 1 percent of beds were dedicated to households with only children.
• TH beds were more often designated for people in families (54%) than for individuals (45%). only 1 percent of TH beds were for child-only households.
• RRH was designed to serve formerly homeless people in families. As a result, nearly 8 in 10 beds were designated for people in families. The remaining beds were designated for individuals (22%) and child-only households (less than 0.1%).
• PSH serves formerly homeless individuals, often those with chronic patterns of homelessness. In 2014, 62 percent of PSH beds were targeted to individuals and 38 percent were designated for people in families. Very few PSH beds (less than 0.1%) were designated to child-only households.
Bed by CoC Category, 2014The distribution of year-round beds across the different types of CoCs in the United States varied by project type.
• More than half of ES beds (51%) were located in major cities. One-third of ES beds were in smaller cities, counties, and regional CoCs, and 17 percent were located in BoS or statewide CoCs.
Data source: HIC 2007–2014
• Fewer TH beds were located in major city CoCs. Only 40 percent were in major cities, while 44 percent were in smaller city, county, and regional CoCs, and 16 percent were located in BoS or statewide CoCs.
• Thirty-six percent of RRH beds were located in major cities in 2014. Forty-three percent were located in smaller cities, counties, and regional CoCs, and 21 percent were located in BoS or statewide CoCs.
• Nearly half of PSH beds (49 percent) were in major cities, 40 percent were in smaller cities, counties, and regional CoCs, and 11 percent were in BoS or statewide CoCs.
Note: Rapid Rehousing beds include beds reported in both the Rapid Rehousing (RRH) and Rapid Rehousing Demonstration (DEM) project types.
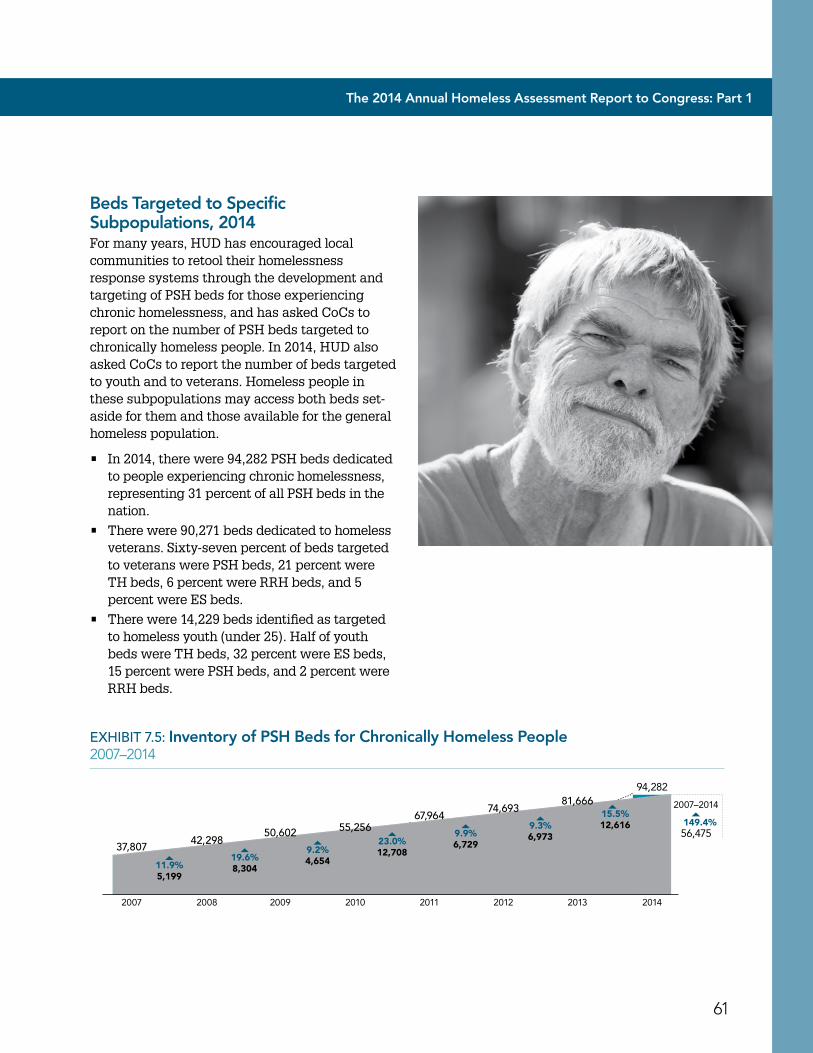
61
The 2014 Annual Homeless Assessment Report to Congress: Part 1
EXHIBIT 7.5: Inventory of PSH Beds for Chronically Homeless People2007–2014
2007 2008 2009 2010 20122011 2013 2014
2007–2014
56,475149.4%
94,282
5,19911.9% 8,304
19.6% 4,6549.2% 12,708
23.0% 6,7299.9% 6,973
9.3% 12,61615.5%
37,80742,298
50,602 55,25667,964
74,69381,666
Beds Targeted to Specific Subpopulations, 2014For many years, HUD has encouraged local communities to retool their homelessness response systems through the development and targeting of PSH beds for those experiencing chronic homelessness, and has asked CoCs to report on the number of PSH beds targeted to chronically homeless people. In 2014, HUD also asked CoCs to report the number of beds targeted to youth and to veterans. Homeless people in these subpopulations may access both beds set-aside for them and those available for the general homeless population.
• In 2014, there were 94,282 PSH beds dedicated to people experiencing chronic homelessness, representing 31 percent of all PSH beds in the nation.
• There were 90,271 beds dedicated to homeless veterans. Sixty-seven percent of beds targeted to veterans were PSH beds, 21 percent were TH beds, 6 percent were RRH beds, and 5 percent were ES beds.
• There were 14,229 beds identified as targeted to homeless youth (under 25). Half of youth beds were TH beds, 32 percent were ES beds, 15 percent were PSH beds, and 2 percent were RRH beds.
62
1National Estimates Homelessness in the United States7Inventory of Bedsin the United States
Data source: HIC 2007–2014
Since 2013• Between 2013 and 2014, the total inventory of
beds targeted to both homeless and formerly homeless people in the United States increased by 42,412 beds, or 6 percent.
• Between 2013 and 2014, the total number of beds for currently homeless people declined by 1,351 beds, or 0.3 percent. The decline in the number of TH beds (12,108 beds) offset an increase in ES beds (10,789).
• The inventory of beds for formerly homeless people increased over the past year, by 43,763 beds or 14 percent. Part of this increase was due to the addition of OPH beds to the inventory (9,843 beds or roughly 21% of the increase). However, RRH beds increased by 17,936 beds – a 90 percent increase. The number of PSH beds increased by 15,984 beds or 6 percent.
• The number of PSH beds targeted to people experiencing chronic homelessness increased by 12,616 beds, or 16 percent.
Since 2007• There were 161,496 more beds for homeless
and formerly homeless people in 2014 than there were in 2007, an increase of 26 percent.
• Between 2007 and 2014, the inventory of beds for homeless people in ES and TH (SH was not reported in 2007) did not change on net. The increase in the number of ES beds (38,046 beds or 18%) offset a decline in the number of TH beds (37,981 or 18%).
• Between 2007 and 2014, the number of PSH beds rose each year. An additional 111,646 PSH beds, or 59 percent, were added to the overall inventory over the past seven years.
• The number of PSH beds targeted to people experiencing chronic homelessness has increased dramatically. The nation added 56,475 PSH beds for chronically homeless people (a 149% increase) since 2007.
The U.S. Department of Housing and Urban DevelopmentOFFICE OF COMMUNITY PLANNING AND DEVELOPMENT