Embed Size (px)
Citation preview

13th CIGRÉ Ibero-America Regional
Conference Puerto Iguazú, Argentina - 24 al 28 de Mayo de 2009
* Praça Claudino Alves, 141 – Atibaia – SP – Brazil – ZIP CODE 12940-800 – [email protected]
ONLINE MONITORING OF CONVERTER TRANSFORMERS OF SE IBIÚNA HVDC TRANSMISSION SYSTEM
E. G. PERES W. R. DUSO J. S. LATENEK
Furnas Centrais Elétricas
S.A.
Furnas Centrais Elétricas
S.A.
Furnas Centrais Elétricas
S.A.
Brazil Brazil Brazil
M. E. G. ALVES*
Treetech Sistemas Digitais
Ltda.
Brazil
Summary - The relevance of Ibiúna Converter Substation for the supply of electricity to São Paulo led
Furnas to select the online monitoring of converter transformers, initially by replacing mechanical
temperature measurement systems with electronic monitors and subsequently with the complete monitoring
of one of the converter transformers. This document provides installation details and in-field experiences
concerning the online monitoring, including data transmission of transformer sensors via wireless network
using Wi-Fi technology.
Keywords: Transformers, Converters, HVDC, Online monitoring, Diagnostic, Prognostic, Predictive
maintenance
1 INTRODUCTION
Ibiúna is the substation where the converter terminal of Itaipu high-voltage direct current
transmission system (HVDC) is located, i.e., Ibiúna substation is the terminal where direct current is turned
into alternating current (345kV 60Hz) to supply Greater São Paulo.
This system, transmitting at ±600kVdc half of Itaipu generating capacity (6,300 MW), is comprised
of 8 converters, each 2 converters forming a pole and each 2 poles forming a bipole. The substation has 24
converter transformers in operation with installed capacity of 7,200MVA.
Ibiúna converter transformers are single-phase units, each having two primary windings and one
secondary winding. Because they are 12-pulse converters, transformer primary windings should be fed by
two three-phase systems 30º out of phase between each other. For such, one of the primary windings of
single-phase units of each bank is star connected, and the other primary winding is delta connected. The
three-line diagram in figure 1 shows this topology for bipole 1 pole 2 containing converters 2 and 4, which is
fed at +600kVdc. Pole 1 of the same bipole has identical configuration, except that it is fed at -600kVdc.
Each transformer has two on-load tap-changers (OLTC) that are driven by a common motorized
mechanism, given that the operation should be simultaneous. The automatic control system enables the
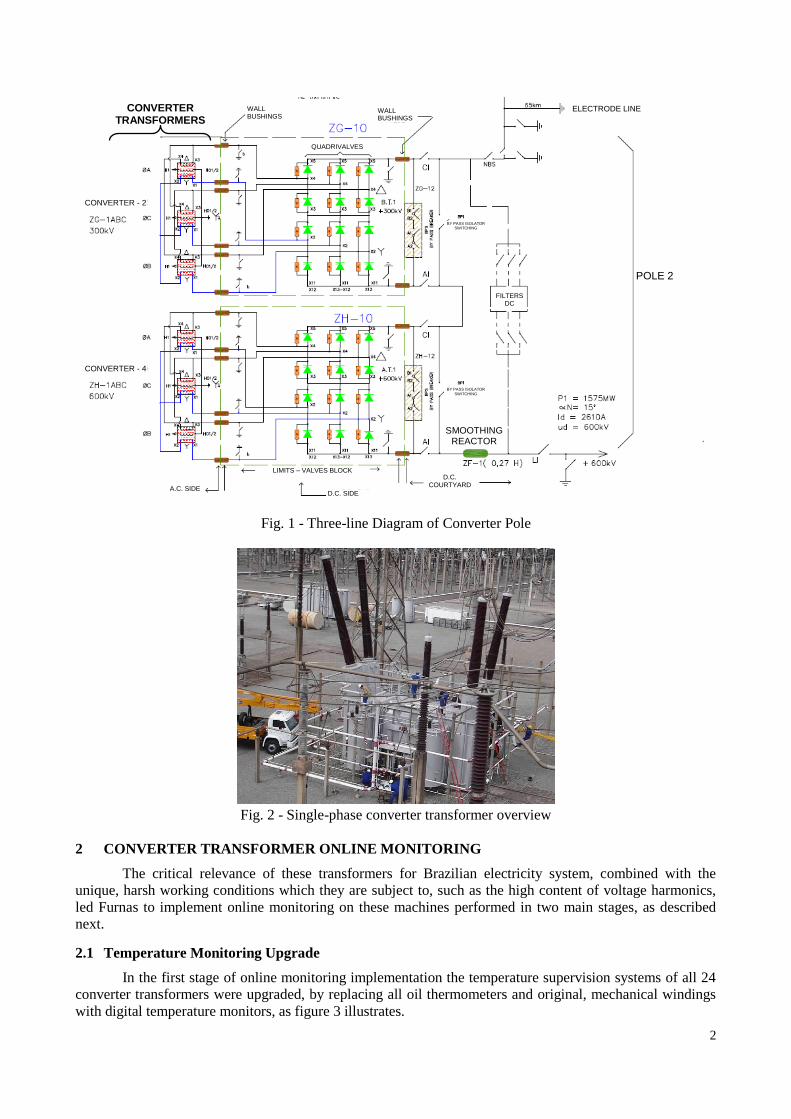
OLTC when valve firing angles exceed the rated operating range. Figure 2 shows an overview of a single-
phase converter transformer.
2
Fig. 1 - Three-line Diagram of Converter Pole
Fig. 2 - Single-phase converter transformer overview
2 CONVERTER TRANSFORMER ONLINE MONITORING
The critical relevance of these transformers for Brazilian electricity system, combined with the
unique, harsh working conditions which they are subject to, such as the high content of voltage harmonics,
led Furnas to implement online monitoring on these machines performed in two main stages, as described
next.
2.1 Temperature Monitoring Upgrade
In the first stage of online monitoring implementation the temperature supervision systems of all 24
converter transformers were upgraded, by replacing all oil thermometers and original, mechanical windings
with digital temperature monitors, as figure 3 illustrates.
CONVERTER TRANSFORMERS
SMOOTHING REACTOR
D.C. COURTYARD
D.C. SIDE A.C. SIDE
WALL BUSHINGS
WALL BUSHINGS
ELECTRODE LINE
POLE 2
QUADRIVALVES
CONVERTER - 2
CONVERTER - 4
LIMITS – VALVES BLOCK
BY PASS ISOLATOR SWITCHING
BY PASS ISOLATOR SWITCHING
FILTERS DC

3
(a) (b)
Fig. 3 - Converter transformer temperature monitoring upgrade (a) Beginning of original mechanical
thermometer replacement; (b) Digital temperature monitors installed.
One of the purposes of this stage was to reduce the failure rate of oil temperature measurement
system and windings, already obsolete, and remove the need for periodic calibration of these components.
Additionally, upgrading the temperature supervision system provided several new functionalities:
• Redundant measurement of oil top temperature, increasing measurement safety and allowing
continued operation in case one sensor fails.
• Winding template calculated by mathematical model - enhanced accuracy without the use of
heating resistance for simulation;
• Possibility of measuring additional temperatures such as ambient and on-load tap-changer
temperatures;
• Self-calibration of measurements;
• Output contacts for alarms, switch-off and cooling commands with timing;
• Current outputs for remote indications of integrated temperatures - removing transducers;
• Cooling command on manual or automatic mode;
• Automatic switchover of forced cooling groups;
• Transformer pre-cooling in case of load current increase;
• Automatic daily drills of cooling groups;
• Mass memory for measurements and events;
• As an option, monitoring of OLTC temperature differential for fault diagnosis.
• Serial communication ports for integration to remote systems.
This latter functionality - serial communication ports - specially opens the possibility of integrating
the temperature monitors to an Online Monitoring software, so that the measurements taken by the
equipment may be used by mathematical algorithms for transformer status diagnosis. Figure 4 illustrates this
application, which indicates that algorithms may be implemented in the monitoring software based on
information sent by the Temperature Monitor.

4
Fig. 4 - Temperature Monitor serial communication port integration to a transformer Online
Monitoring software and possible diagnosis algorithms.
To run the Online Monitoring software a server was installed in the substation control room, which is
connected to transformer Temperature Monitor serial ports. Initially, the physical media used for this
connection were shielded twisted-pair cables. Later, in order to render network installation easier and reduce
its costs, Wi-Fi wireless communication was used, which is now in operation with fully satisfactory results
despite the high level of electromagnetic interference in this substation. Figure 5 shows the components for
wireless communication.
(a) (b) (c)
Fig. 5 - Monitoring System Communication Components. (a) Wi-Fi communication module installed next to
temperature monitors and other sensors on transformer body; (b) Tower next to control room where the
Access Point was installed for communication with transformer sensors; (c) Access Point detail with antenna
and view towards the substation.
To ensure secure access to the Wi-Fi network MAC addresses filtering was implemented in the
Access Point, so that only with previously registered MAC are able to be connected. As additional measure,
WEP data encryption was used.
2.2 Online Monitoring of Converter 4 Transformers
One of the main features of the monitoring system implemented in SE Ibiúna is its modular design,
allowing that new monitoring functions or even new equipment to be easily added. Leveraging on this
feature, the second implantation stage of online monitoring for transformers was comprised of adding several
sensors to Converter 4, as well as corresponding monitoring software modules. Table I below lists the
sensors installed and their corresponding functions, including the existing Temperature Monitor in this
transformer.
Local temperature control (alarms, trips, venting) Remote temperature signal for Supervisory
Temperature Monitoring Sub-System: Remote temperature signal Isolation ageing Isolation remaining life Future temperatures forecast OLTC’s temperature differential Cooling efficiency Loading simulation Cooling Maintenance Assistant
Transformer
panel
Venting Control
OLTC temp.
Alarms, trips, signals
Oil temperature (mA)
Winding temperature (mA)
Temperature
Monitor
Room temperature Serial communication
Control Room
Monitoring Sub-System
Operations Centre
Maintenance Centre

5
TABLE I. SENSORS INSTALLED ON CONVERTER 4 TRANSFORMER, THEIR CORRESPONDING
MEASUREMENTS AND LOCAL INDEPENDENT FUNCTIONALITIES
Sensor Measurements Performed Local Independent Functions
TM1 and TM2
Temperature
Monitors
- Oil Temperature;
- Temperature of hottest point in
Windings
- Load current
- Alarm and switch-off by Oil temperature
- Alarm and switch-off by Winding temperature
- Forced Cooling automatic and manual control
- Transformer pre-cooling by load increase
- Daily fan drills
- On-Load Tap-Changer temperature differential
BM Bushing
Monitor
- Bushing capacitance
- Bushing delta tangent
- Capacitance upward trend
- Delta Tangent upward trend
- Time for High/Very High Capacitance Alarms
- Time for High/Very High Delta Tangent Alarms
Dissolved Gas-in-
Oil Monitor
- Content of dissolved hydrogen in
transformer oil (ppm)
- Oil temperature at hydrogen
measurement point
- Content of hydrogen in oil upward trend
- High or Very High hydrogen in oil alarms
- High H2 in oil upward trend alarms
DM1/DM2 signal
Digitalization
Modules
- Measurement of alarm dry
contact state
- Measurement of transformer oil
level
OLTC Oil
Humidity
Monitor
- Relative saturation (%) of water
in oil
- Content of water in oil (ppm)
- Oil temperature
- Content of water in oil upward trend
- High or Very High water in oil saturation (%) alarms
- High or Very High Content of water in oil alarms
- High water Content upward trend alarms
Transformer Oil
Humidity
Monitor
- Relative saturation (%) of water
in oil
- Content of water in oil (ppm)
- Ambient temperature
- Oil temperature
- Content of water in oil upward trend
- High or Very High water in oil saturation (%) alarms
- High or Very High Content of water in oil alarms
- High water Content upward trend alarms
Bladder Burst
Relay - Expansion tank bladder burst - Burst bladder alarm
DTM
Temperature
Monitor
- Oil Temperature at heat
exchanger inlets
- Oil Temperature at heat
exchanger outlets
PI Position
Indicator
- On-Load Tap-Changer tap
position
Based on the measurements of the sensors above, the monitoring software uses the following Engineering
Modules shown in table II for data processing, so as to provide to user diagnostics and prognostics of
transformer state.
TABLE II. ENGINEERING MODULES FOR TRANSFORMER STATE DIAGNOSTICS AND PROGNOSTICS
Engineering Modules Diagnostics and Prognostics Performed
Insulation Aging
Loss of Insulation Service Life
Loss of service life rate
Remaining service life prediction, in years.
Future Temperature
Forecast
Winding temperature after thermal stability
Forecast of alarm and switch-off events
Calculation of remaining time for alarm and switch-off events.
Cooling Efficiency
Calculation of expected oil temperature according to load, ambient temperature
and operating cooling group
Comparison with actual temperature measured and alarm in case of cooling low
performance - measured temperature way above the expected
6
Engineering Modules Diagnostics and Prognostics Performed
Cooling Group
Maintenance
Cooling group running hours since start up
Cooling group running hours since last maintenance
Cooling average daily running hours
Prediction of remaining time for inspection or maintenance
Advance warning for inspection or maintenance.
Water in Oil and in Paper
Content of water in Oil
Content of water in Paper
Acceleration of loss of insulation service life by excess of water
Bubble Formation Temperature by excess of water
Free Water Formation Temperature by excess of water in oil
OLTC Temperature
Differential
Tap-changer instantaneous temperature differential
Tap-changer filtrate temperature differential
Chromatography
Online measurement of dissolved hydrogen in oil
High, very high or upward trend H2 content alarm
Offline gas chromatography analysis database
Calculation of gas increase rates
Reports for gas chromatography analysis according to IEC60599 and Duval
Physical-chemical Offline physical-chemical tests in oil database
Automatic reports according to NBR10576
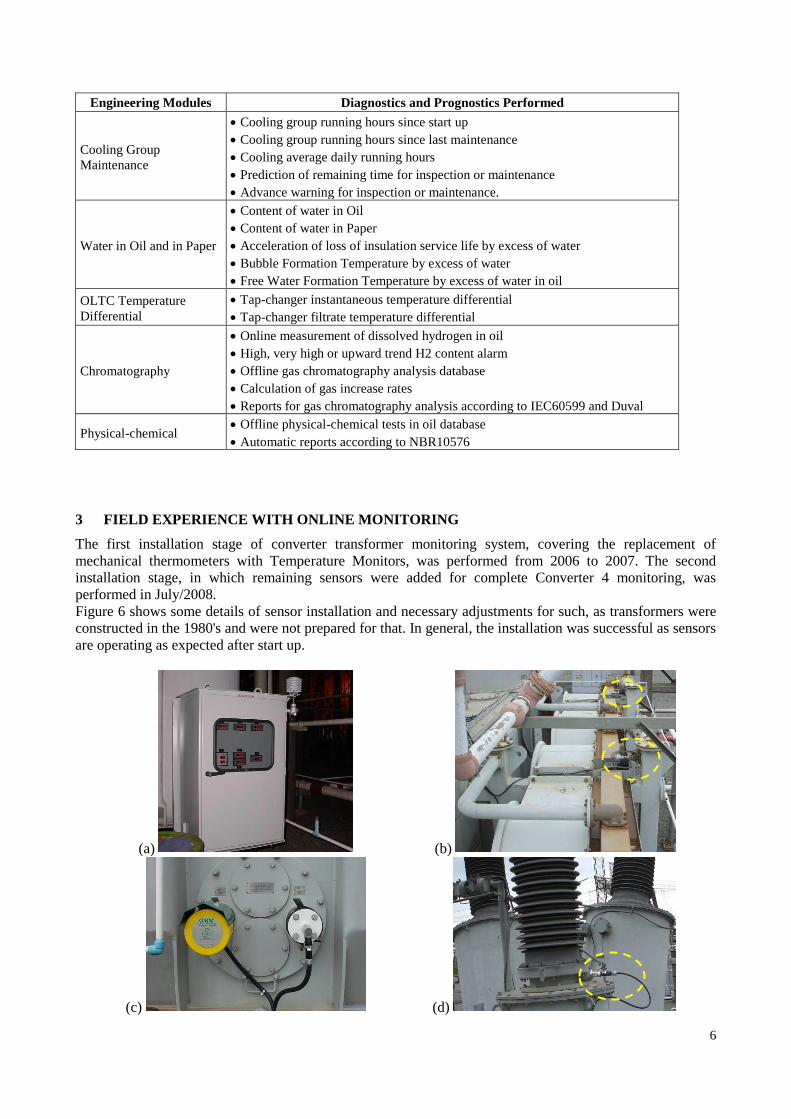
3 FIELD EXPERIENCE WITH ONLINE MONITORING
The first installation stage of converter transformer monitoring system, covering the replacement of
mechanical thermometers with Temperature Monitors, was performed from 2006 to 2007. The second
installation stage, in which remaining sensors were added for complete Converter 4 monitoring, was
performed in July/2008.
Figure 6 shows some details of sensor installation and necessary adjustments for such, as transformers were
constructed in the 1980's and were not prepared for that. In general, the installation was successful as sensors
are operating as expected after start up.
(a) (b)
(c) (d)
7
(e) (f)
(g) (h)
Fig. 6 - In-field installation of Monitoring sensors. (a) Panel with monitoring equipment and ambient
temperature sensor; (b) Oil temperature sensor at heat exchanger inlet and outlet; (c) Gas and oil
humidity sensors on transformer; (d) Connections to bushing taps; (e) OLTC oil humidity and
temperature sensors; (f) Redundant temperature sensors for oil top; (g) Ladder burst sensor; (h)
Ladder burst relay.
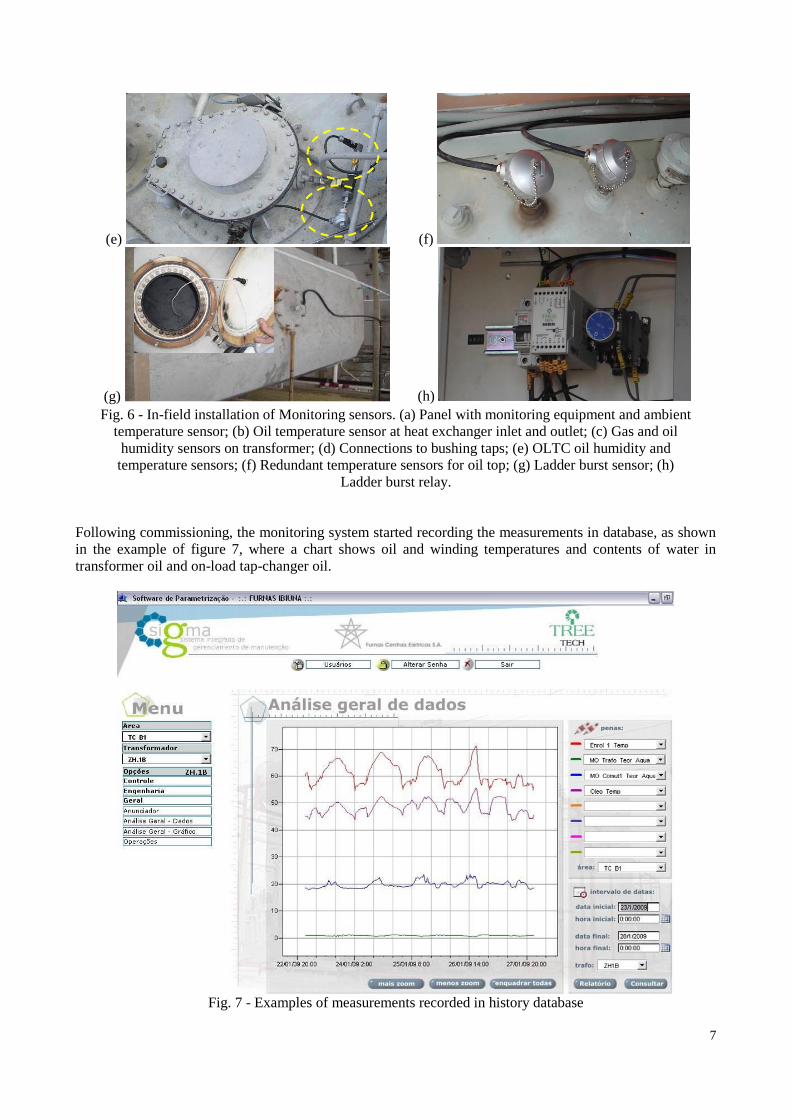
Following commissioning, the monitoring system started recording the measurements in database, as shown
in the example of figure 7, where a chart shows oil and winding temperatures and contents of water in
transformer oil and on-load tap-changer oil.
Fig. 7 - Examples of measurements recorded in history database

8
Because of the large geographical area covered by Furnas, as well as the large number of transformers used,
one of the main requirements for a monitoring system is the remote access to information. To allow this
access from any point within its facilities, the existing Intranet network in the company was the
communication means selected.
For that, the monitoring server located in the control room is connected to the In order with access to data,
information, diagnostics and prognostics performed from any computer in the company network.
In addition, with transformers in normal operating conditions, which is expected most of the time, the
monitoring system will remain in static condition only eventually issuing a fault diagnosis.
To remove the need for ongoing system tracking, which would consume a great deal of time of the
maintenance team, the monitoring system was equipped with an automatic email sending device in case any
abnormality is found. For that, the email addresses of people who should be warned must be previously
registered in the system.
Figure 8 below shows some examples of typical screens with online measurements and diagnosis of the
monitoring system.
Fig. 8 - Typical monitoring system diagnosis screen
4 CONCLUSIONS
Experiences with the implementation of online monitoring and their practical outcomes achieved
concerning HVDC Converter Transformers have been allowing to assess the benefits and effectiveness of the
decentralized architecture of sensors, communication means and software solutions used, as well as the
ruggedness of the electronic equipment installed in SE Ibiúna, which have been showing satisfactory results.
We may highlights the following benefits provided by the monitoring system installed:
• Elimination of costly and time-consuming annual thermometer calibration procedures;
• Extension of transformer service life by fast detection of conditions that could cause accelerated
degrading, such as conservator tank ladder burst;
• Reduced risks of catastrophic failures through, for example, online monitoring of hydrogen in oil;
• Increased equipment availability for the electrical system due to reduced preventive maintenance
shutdowns, for example, for bushing tests;
• As a result, reduced maintenance costs and, eventually, insurance costs and others.
Given that the application of HVDC technology for electricity transmission from other hydropower
projects in the north of the country is under consideration, the experience with the implementation of online
monitoring for SE Ibiúna converter transformers could be highly valuable to enhance reliability and full
performance of these new applications.

9
5 REFERENCES
[1] Albuquerque, Roberto, Alves, Marcos, “Monitoração On-Line de um Banco de Autotransformadores
345-138/13,8kV 150MVA com Comutação Sob Carga”, XIX SNPTEE – Seminário Nacional de
Produção e Transmissão de Energia Elétrica. Rio de Janeiro, Brasil, 2007.
[2] Melo, Marcos A. C., Alves, Marcos, “Experiência com Monitoração On-Line de Capacitância e
Tangente Delta de Buchas Condensivas”, XIX SNPTEE – Seminário Nacional de Produção e
Transmissão de Energia Elétrica. Rio de Janeiro, Brasil, 2007.
[3] Alves, Marcos, Araújo, Daniel C. P., Martins, Alvaro J. A. L., Costa, Marcelo A., “Monitoração e
Diagnóstico On-Line de Transformador de Potência com Óleo Vegetal”, V Workspot – Workshop on
Power Transformers, Belém, Brasil, 2008.
[4] Alves, Marcos, Silva, Gilson, “Experiência de Campo com Monitoração On-Line de um Transformador
343MVA 230kV com 2 Comutadores sob Carga”, IV Workspot – Workshop on Power Transformers,
Recife, Brasil, 2005.