Embed Size (px)
Citation preview
Geophys. J. Int. (2009) doi: 10.1111/j.1365-246X.2009.04114.x
GJI
Sei
smol
ogy
P, S velocity and VP/VS ratio beneath the Toba caldera complex(Northern Sumatra) from local earthquake tomography
Ivan Koulakov,1,2 Tedi Yudistira,3 Birger-G. Luehr2 and Wandono 4
1Institute of Petroleum Geology and Geophysics, SB RAS, Prospekt Akademika Koptuga, 3, Novosibirsk, 630090, Russia. E-mail: [email protected] Potsdam, Telegrafenberg, 14473 Potsdam, Germany3Department of Geophysics, Institut Teknologi Bandung, Indonesia4Meteorological and Geophysical Agency (BMG), Jakarta, Jl. Angkasa I/2, Jakarta 10720, Indonesia
Accepted 2009 January 9. Received 2009 January 9; in original form 2008 September 15
S U M M A R YIn this paper, we investigate the crustal and uppermost mantle structure beneath Toba caldera,which is known as the location of one of the largest Cenozoic eruptions on Earth. The mostrecent event occurred 74 000 yr BP, and had a significant global impact on climate and thebiosphere. In this study, we revise data on local seismicity in the Toba area recorded by atemporary PASSCAL network in 1995. We applied the newest version of the LOTOS-07algorithm, which includes absolute source location, optimization of the starting 1-D velocitymodel, and iterative tomographic inversion for 3-D seismic P, S (or the VP/VS ratio) and sourceparameters. Special attention is paid to verification of the obtained results. Beneath the Tobacaldera and other volcanoes of the arc, we observe relatively moderate (for volcanic areas)negative P- and S-velocity anomalies that reach 18 per cent in the uppermost layer, 10–12 percent in the lower crust and about 7 per cent in the uppermost mantle. Much stronger contrastsare observed for the VP/VS ratio that is a possible indicator of dominant effect of melting inorigin of seismic anomalies. At a depth of 5 km beneath active volcanoes, we observe smallpatterns (7–15 km size) with a high VP/VS ratio that might be an image of actual magmaticchambers filled with partially molten material feeding the volcanoes. In the mantle wedge, weobserve a vertical anomaly with low P and S velocities and a high VP/VS ratio that link thecluster of events at 120–140 km depth with Toba caldera. This may be an image of ascendingfluids and melts released from the subducted slab due to phase transitions. However, taking intoaccount poor vertical resolution, these results should be interpreted with prudence. Althoughthe results show clear signatures that are quite typical for volcanic areas (low velocity and highVP/VS ratio beneath volcanoes), we do not observe any specific features in seismic structurethat could characterize Toba as a super volcano.
Key words: Seismic tomography; Volcano seismology; Volcanic arc processes; Magmachamber processes; Calderas; Indian Ocean.
1 I N T RO D U C T I O N
The Toba volcanic complex, located in northern Sumatra, Indonesia,is part of a 5000 km long volcanic chain along the Sunda arc (Fig. 1).Toba volcano produced the largest known volcanic eruption on Earthduring the past 2 Myr (Smith & Bailey 1968). About 74 000 yr ago,around 2800 km3 of magma were erupted. The eruption led to thefinal formation of one of the largest calderas, the 35 × 100 km wideToba caldera. Super scale eruptions at Toba have occurred severaltimes (at least four eruptions of more than VEI 7 over the last 2 Myr).In this sense, Toba seems to be a singularity in a chain of more than100 other volcanoes with explosive potential along the Sunda arc.The reasons for this unique behaviour of the Toba volcanic activityare not yet clearly understood. We believe that understanding themechanisms of the origin of this supervolcano will only be possible
by investigating the entire subduction complex beneath Toba andthe surrounding areas. In addition, comparison with subductioncomplexes from other areas of normal and supervolcanism canreveal specific features that distinguish Toba from other volcanoes.
Supervolcano eruption with a Volcanic Explosivity Index of 8(VEI-8) is a colossal event that throws out at least 1000 km3 DenseRock Equivalent (DRE). Besides Toba, there are at least two otherknown eruptions of VEI-8 that occurred during the last 1000 000 yr:recent Yellowstone eruptions in the USA and the Oruanui eruptionin Taupo volcanic zone in New Zealand. Within the Yellowstonearea during the past 3 Myr, there were at least two VEI-8 eruptions:∼2.2 Ma (2500 km3 of erupted material) and ∼640 000 yr ago(1000 km3). Since the last cataclysmic eruption at least 30 domi-nantly rhyolitic and basaltic flows, as young as 70 000 yr old, havebeen erupted, covering much of Yellowstone (Christiansen 2001).
C© 2009 The Authors 1Journal compilation C© 2009 RAS
2 I. Koulakov et al.
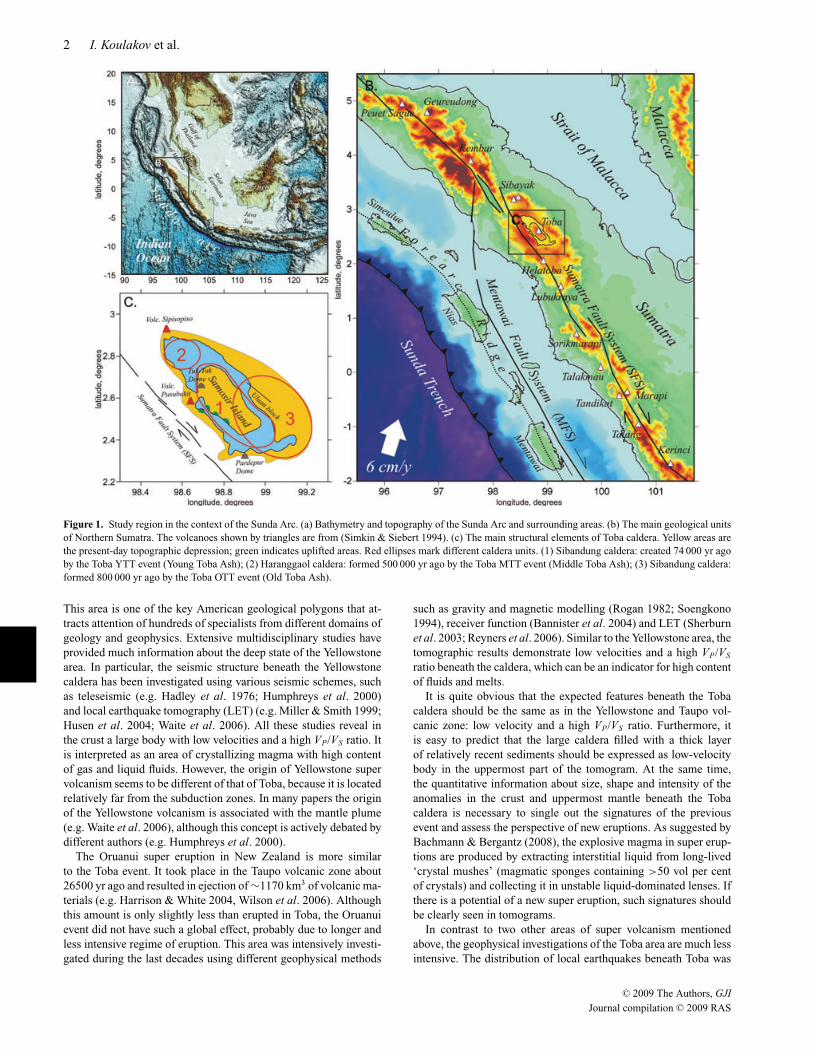
Figure 1. Study region in the context of the Sunda Arc. (a) Bathymetry and topography of the Sunda Arc and surrounding areas. (b) The main geological unitsof Northern Sumatra. The volcanoes shown by triangles are from (Simkin & Siebert 1994). (c) The main structural elements of Toba caldera. Yellow areas arethe present-day topographic depression; green indicates uplifted areas. Red ellipses mark different caldera units. (1) Sibandung caldera: created 74 000 yr agoby the Toba YTT event (Young Toba Ash); (2) Haranggaol caldera: formed 500 000 yr ago by the Toba MTT event (Middle Toba Ash); (3) Sibandung caldera:formed 800 000 yr ago by the Toba OTT event (Old Toba Ash).
This area is one of the key American geological polygons that at-tracts attention of hundreds of specialists from different domains ofgeology and geophysics. Extensive multidisciplinary studies haveprovided much information about the deep state of the Yellowstonearea. In particular, the seismic structure beneath the Yellowstonecaldera has been investigated using various seismic schemes, suchas teleseismic (e.g. Hadley et al. 1976; Humphreys et al. 2000)and local earthquake tomography (LET) (e.g. Miller & Smith 1999;Husen et al. 2004; Waite et al. 2006). All these studies reveal inthe crust a large body with low velocities and a high VP/VS ratio. Itis interpreted as an area of crystallizing magma with high contentof gas and liquid fluids. However, the origin of Yellowstone supervolcanism seems to be different of that of Toba, because it is locatedrelatively far from the subduction zones. In many papers the originof the Yellowstone volcanism is associated with the mantle plume(e.g. Waite et al. 2006), although this concept is actively debated bydifferent authors (e.g. Humphreys et al. 2000).
The Oruanui super eruption in New Zealand is more similarto the Toba event. It took place in the Taupo volcanic zone about26500 yr ago and resulted in ejection of ∼1170 km3 of volcanic ma-terials (e.g. Harrison & White 2004, Wilson et al. 2006). Althoughthis amount is only slightly less than erupted in Toba, the Oruanuievent did not have such a global effect, probably due to longer andless intensive regime of eruption. This area was intensively investi-gated during the last decades using different geophysical methods
such as gravity and magnetic modelling (Rogan 1982; Soengkono1994), receiver function (Bannister et al. 2004) and LET (Sherburnet al. 2003; Reyners et al. 2006). Similar to the Yellowstone area, thetomographic results demonstrate low velocities and a high VP/VS
ratio beneath the caldera, which can be an indicator for high contentof fluids and melts.
It is quite obvious that the expected features beneath the Tobacaldera should be the same as in the Yellowstone and Taupo vol-canic zone: low velocity and a high VP/VS ratio. Furthermore, itis easy to predict that the large caldera filled with a thick layerof relatively recent sediments should be expressed as low-velocitybody in the uppermost part of the tomogram. At the same time,the quantitative information about size, shape and intensity of theanomalies in the crust and uppermost mantle beneath the Tobacaldera is necessary to single out the signatures of the previousevent and assess the perspective of new eruptions. As suggested byBachmann & Bergantz (2008), the explosive magma in super erup-tions are produced by extracting interstitial liquid from long-lived‘crystal mushes’ (magmatic sponges containing >50 vol per centof crystals) and collecting it in unstable liquid-dominated lenses. Ifthere is a potential of a new super eruption, such signatures shouldbe clearly seen in tomograms.
In contrast to two other areas of super volcanism mentionedabove, the geophysical investigations of the Toba area are much lessintensive. The distribution of local earthquakes beneath Toba was
C© 2009 The Authors, GJI
Journal compilation C© 2009 RAS
P, S velocity and VP/VS ratio beneath the Toba caldera complex 3
previously studied in Fauzi et al. (1996) based on local seismicitydata recorded by a temporarily passive PASSCAL seismic experi-ment in 1995. The same data were used by Masturyono et al. (2001)to perform tomographic inversion resulted at P-velocity structurein the crust and the uppermost mantle beneath the Toba caldera.The undoubted advantage of this study was the combined analysisof seismic and gravity data. However, we suppose that this modelis not sufficiently trustworthy, and it must be revised. First of all,Masturyono et al. (2001) used only P arrivals. Without using the Sdata, the stability of source locations is significantly lower, whichreduces the reliability of the velocity model. Second, their solutionis strongly affected by parameterization grid. The cell spacing usedis too large, and, as a result, the solution oscillates from a cell to cell.For example, a strong negative anomaly in one cell may coexist witha positive anomaly in a neighbouring cell, which in its turn is con-terminous with another negative anomaly in the next cell. It is clearthat in this situation when one uses a grid with other parameters(e.g. shifted to a half step, or having slightly different spacing, orrotated grid), he or she would produce completely different images.Third, it is unclear how they selected damping parameters. The re-ported 37 per cent of P-velocity anomaly seems to be unrealisticand probably due to instability of the underdamped inversion.
In this study, we consider the data of the same PASSCAL experi-ment in the Toba area that were supplemented with S picks. Here weuse another tomographic algorithm, LOTOS-07 (Koulakov 2009a),which has some important features compared to the code used forobtaining the previous results, such as quasi-continuous parameter-ization, 1-D velocity optimization and a more effective algorithmfor source location in a 3-D model. It offers effective and unbi-ased ways for verification of the obtained results based on syntheticmodelling and other tests. In this study, we pay special attention tostudying the reliability of the results and the quantitative evaluationof the derived parameters. In particular, in this study, we use a newtechnique for estimating the amplitudes of anomalies. Based on thistechnique, we show that in the crust beneath Toba, the P-velocityanomaly does not exceed 16 per cent. This value is much lower thanthat predicted by Masturyono et al. (2001).
2 G E O L O G I C A L OV E RV I E W
The super large eruptions of Toba should be considered in thecontext of the entire subduction complex beneath Sumatra. SumatraIsland is a northwest trending physiographic expression locatedon the western edge of Sundaland, a southern extension of theEurasian Continental Plate (Figs 1a and b). Sumatra Island has anarea of about 435 000 km2, and a width of about 100–200 km inthe northern part and about 350 km in the southern part. The maingeographical trend lines of the island are rather simple. Its backboneis formed by the Barisan Range, which runs along the western sideand constitutes the active volcanic arc and divides the west and theeast coasts. The distance between the Sunda trench and the Sumatrancoast is about 200 km (Fig. 1b). In the offshore, a chain of islandsform the Forearc ridge, a local high between the trench and theSumatra coast. The island of Sumatra is interpreted to have beenconstructed by collision and suturing of discrete micro continentsin the late Pre-Tertiary times (Pulunggono & Cameron 1984). Atpresent, the Indo-Australian Ocean Plate is being subducted beneaththe Eurasian Continental Plate in a N20◦E direction at a rate of about5.5 cm yr−1 (e.g. DeMets et al. 1990; Fig. 1b). This zone is markedby the active Sunda Arc–Trench system (Fig. 1a) that extends formore than 5000 km, from Burma in the north to where the Australian
Plate is colliding with Eastern Indonesia in the south. The input ofsediments mainly comes from the Ganges River, India, leading tothe development of the largest accretionary wedge at a subductionzone on Earth (e.g. Steckler et al. 2008). The oblique subductionof the Indian plate is responsible for strike-slip fault systems alongSumatra [e.g. Mentawai Fault System (MFS), Sumatra Fault System(SFS)].
In 1949, van Bemmelen (1949) reported that Lake Toba wassurrounded by a vast layer of ignimbrite rocks. Later researchersfound rhyolite ash in Malaysia similar to the ignimbrites aroundToba, as well as 3000 km away in India (Aldiss & Ghazali 1984),and on the seafloor of the eastern Indian Ocean and the Bay ofBengal. These observations show that the Toba eruption, dated at74 000 yr ago, was the most recent truly large eruption on Earthduring the last several millions years. All information on the extentof the erupted Toba volcanic material has been compiled in Rose &Chesner (1987), Chesner & Rose (1991) and Chesner et al. (1991).According to estimates in these studies, the total amount of eruptedmaterial was about 2800 km3. About 800 km3 was ignimbrite thattravelled swiftly over the ground away from the volcano, and theremaining 2000 km3 fell as ash, with the wind blowing most of itto the west. Such a huge eruption probably lasted nearly 2 weeks.Ninkovich et al. (1978) estimated the height of the eruption columnto have been 50–80 km. Rose & Chesner (1987), after a studyof the shapes of the ash shards, concluded this estimate was toohigh by a factor of 5 or more. This event, called the eruption ofthe Youngest Toba Tuff (YTT), was responsible for the collapsestructure of the Toba caldera visible today (Van Bemmelen 1949).Besides, the most recent large eruption of 73 000 yr ago, duringthe past 1.2 Myr, there have been at least three other ash flow tufferuptions from the caldera complex (Chesner & Rose 1991; Chesneret al. 1991). The older Toba units are the Middle Toba Tuff (MTT;age 0.50 Myr, Chesner et al. 1991), the Oldest Toba Tuff (OTT;age 0.84 Myr, Diehl et al. 1987) and the Haranggoal Dacite Tuff(HDT; age 1.2 Myr, Nishimura et al. 1977). These were eruptedalternately from northern and southern vent areas in the presentcaldera (Chesner & Rose 1991).
The eruption of such a huge amount of volcanic rock caused alarge collapse, resulting in a huge caldera. This caldera filled withwater and created Lake Toba (Fig. 1c). The Toba caldera, the largestknown Cenozoic caldera in the world, has a size of 30 × 100 km anda total relief of 1700 m. After the YTT eruption, resurgent domingformed the massive Samosir Island and Uluan Peninsula structuralblocks. Lake sediments on Samosir indicate an uplift of at least450 m. Additionally, post-YTT eruptions include a series of lavadomes, the growth of the solfatarically active Pusubukit volcanoon the southwestern margin of the caldera, and the formation ofSipisopiso volcano at the NW-most rim of the caldera. Lack ofvegetation suggests that this volcano may be only a few hundredyears old. There have been no eruptions documented for Toba inhistorical time, but the area has been seismically active.
The recent enormous Toba super eruption should probably leavesome markers, such as low-velocity anomalies and high values ofthe VP/VS ratio in the crust and uppermost mantle. The main pur-pose of this paper is to detect them using the seismic tomographyapproach.
3 DATA D E S C R I P T I O N
The seismic network around Toba was operated for about 4 months(January–May, 1995) by Indonesian teams in cooperation with IRIS
C© 2009 The Authors, GJI
Journal compilation C© 2009 RAS
4 I. Koulakov et al.
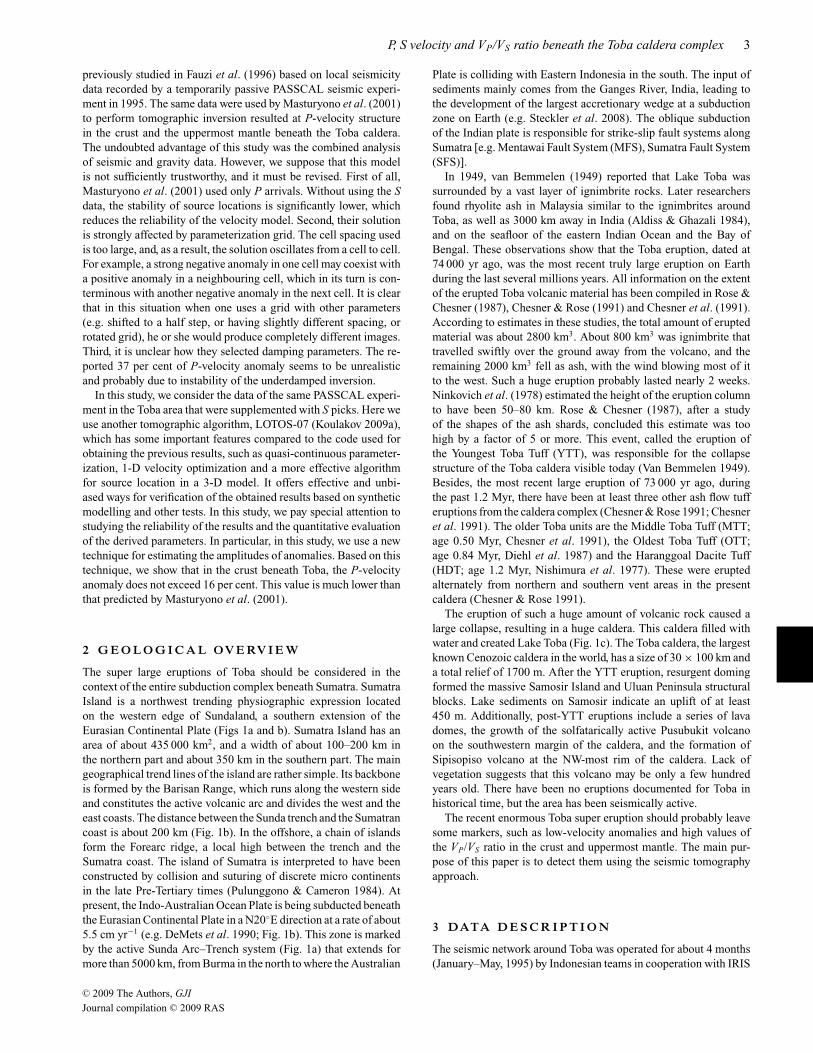
Figure 2. Distribution of stations (blue triangles) and events (coloured dots)used in this study. The colours of dots indicate the depth ranges of the eventsafter the final locations. Dotted lines indicate the locations of the Mentawaiand Sumatra fault zones.
and PASSCAL. The network comprised 30 short-period stations(three-component Mark Product L22C-3D) and 10 broad-band in-struments (Guralp CNG-3ESP) covering an area of about 250 ×250 km. To obtain better control on the locations of the events inthe offshore, one station was installed on Nias Island, west of NorthSumatra. The network recorded ∼1500 local earthquakes; however,for this study only the 390 most reliable events were used. Thedistribution of the stations and earthquakes used in this study ispresented in Fig. 2.
We selected events with a number of recorded phases at more thannine stations, which seems to be the optimum value for this data set.We considered cases of other values of this number and tested themwith synthetic models. If fewer stations were chosen (e.g. seven),the total amount of data amount increased, but the trade-off betweenvelocity and source parameters became more important. As a resultof the joint inversion for seismic anomalies and velocity parameters,some artefacts appeared. On the other hand, for larger numbers ofstations (e.g. 12), the total amount of data became much smaller,which lead to a significant loss of resolution. In total, we selected390 events and the corresponding 3377 P and 2462 S rays.
The LOTOS code, which is used here for inversion, does notrequire that sources be located inside the network of stations (havinga GAP <180◦), as in many tomographic studies. Koulakov (2009b)has shown that this requirement does not reflect the real importanceof an event for tomographic inversion. Based on synthetic testing, hehas demonstrated great importance of out-of-network events for theLET scheme. In LOTOS, we set the requirements of event selectionless strictly than the GAP criterion. For example, an event is rejectedif the lateral distance to the nearest station is more than 200 km.
It should be mentioned that additional data for this region havebeen collected by Meteorological and Geophysical Agency (BMG),using Indonesian permanent seismic stations. However, the cata-logue provided by the Agency contained only P arrivals, and numberof picks for each single event was quite low. For most of events, thenumber of picks was less than 7, which is not sufficient for solving
the coupled inversion problem for velocity and source parameters.Therefore, these data were not used in this study.
4 A L G O R I T H M
4.1 General information
For tomographic inversion, we used the LOTOS-07 code, whichis described in detail in Koulakov et al. (2007) and Koulakov(2009a), and is freely available on the web site www.ivan-art.com/science/LOTOS_07. Here we present a short descriptionof the main steps of this code. The calculations start with two datafiles: coordinates of the stations and arrival times of P- and S seis-mic rays from local earthquakes to these stations. Also, additionalinformation such as starting velocity model, parameters of grid andinversion and others is defined in a separate file. It is possible to usepreliminary locations and origin times provided by picking toolsor/and catalogues, but this information is not strictly required. Inthe case of the absence of any information about sources, LOTOS-07 starts searching for the source hypocentre either from the centreof the network or from the station with minimal arrival times. Thealgorithm contains the following general steps:
(1) simultaneous optimization for the best 1-D velocity modeland preliminary location of sources;
(2) location of sources in the 3-D velocity model and(3) simultaneous inversion for the source parameters and veloc-
ity model using several parameterization grids.
Steps 2 and 3 are repeated in turn, one after another, in severaliterations. Now let us describe some features of these steps.
4.2 Algorithm for one-dimensional velocity optimization
Preliminary location of sources and searching for the best 1-D modelinclude the following steps:
(1) Calculation of a traveltime table in a current 1-D model.The traveltimes for all possible combinations of source depths epi-central distances are computed in a 1-D model using analyticalformulae (Nolet 1981).
(2) Source location in the 1-D model. The calculations of trav-eltimes in this step are based on bilinear interpolation of valuesfrom the reference table and therefore very fast. For finding sourcelocation, we use the grid search method that provides very stablesolution (e.g. Koulakov et al. 2007).
(3) Matrix calculation and inversion. We compute the matrixthat reflects the effect of velocity variation in each depth level upontraveltime of each ray. Matrix inversion is performed for the 1-D P- and S-velocity anomalies and for correction of source parameters(dx, dy, dz and dt). Damping is controlled by a special smoothingblock. The inversion is performed using the LSQR method (Paige& Saunders 1982; Van der Sluis & Van der Vorst 1987).
The 1-D velocity model is then updated according to the velocityanomalies obtained in step 3 and is used as a reference modelfor the next iteration that contains steps 1–3. Optimum values forfree parameters (number of iterations, smoothing coefficients andweights for the source parameters) are evaluated on the basis ofsynthetic modelling.
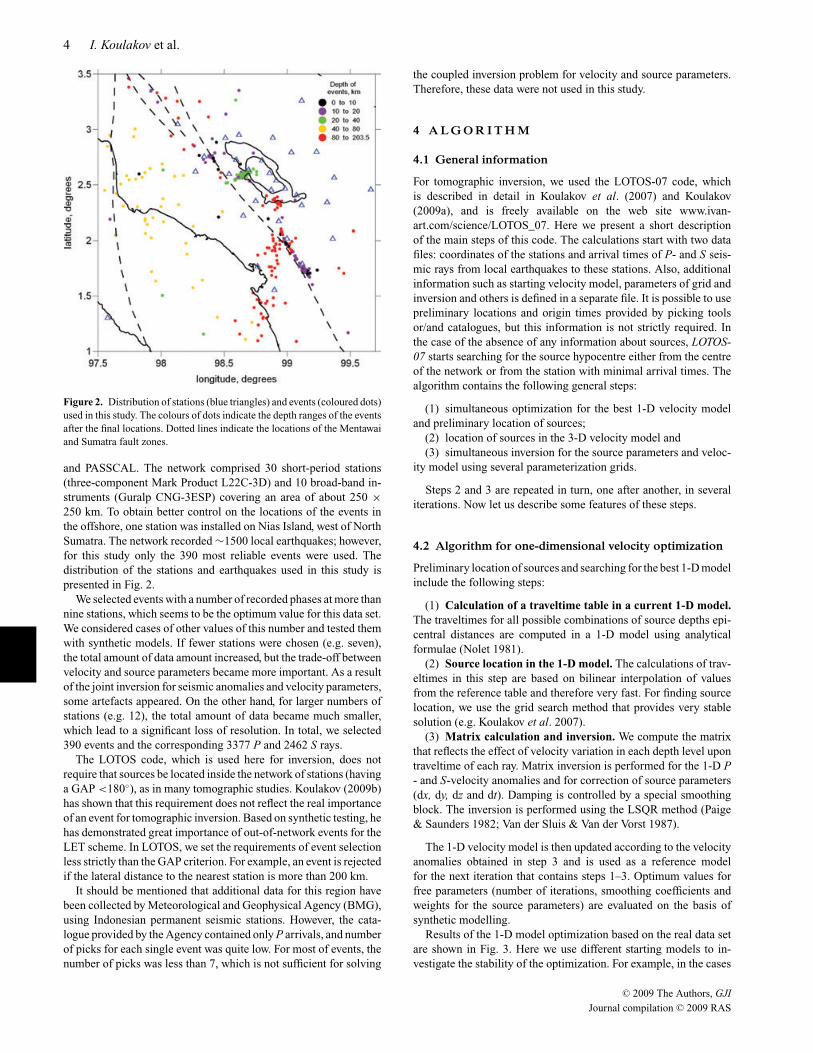
Results of the 1-D model optimization based on the real data setare shown in Fig. 3. Here we use different starting models to in-vestigate the stability of the optimization. For example, in the cases
C© 2009 The Authors, GJI
Journal compilation C© 2009 RAS
P, S velocity and VP/VS ratio beneath the Toba caldera complex 5
Figure 3. Optimization results for 1-D P- and S-velocity models based on real data with the use of different starting models (plots a–e) after performing fouriterations. In plot f, all the results from a–e are combined in one plot. Bold black line is a starting model; thin black lines are results of inversion after 1–3iterations; bold green line is a final optimization result after four iterations. In plot f, the best model corresponds to case b, which provides the best data fitindicated by blue. The values of rms after tracing in the starting and final models are shown with numbers.
plotted in Figs 3(a) and (b), the values of VP/VS in the starting 1-Dvelocity distributions are significantly different. Nevertheless, theoptimization results in these cases are similar. In the case of shal-lower depth of the uppermost low-velocity layer (crust) in the start-ing model (Fig. 3c), the optimized model tends to deepen this layer.Combination of all the resulting velocity distributions in Fig. 3(e)shows that the most coherent results are obtained for depths below50 km. This seems paradoxical because, as will be shown later, thevertical resolution below 50 km is rather poor. In the depth intervalof 0–50 km, absolute velocities vary in the range of 10 per cent.A model with the best fit (Fig. 3b and blue line in Fig. 3f) is usedas a reference distribution for further 3-D inversions. At the sametime, it should be noted that the computed 3-D velocity anoma-lies based on various 1-D starting velocity distributions are quitesimilar, and all the models shown in Fig. 3 appear to be equallyreliable.
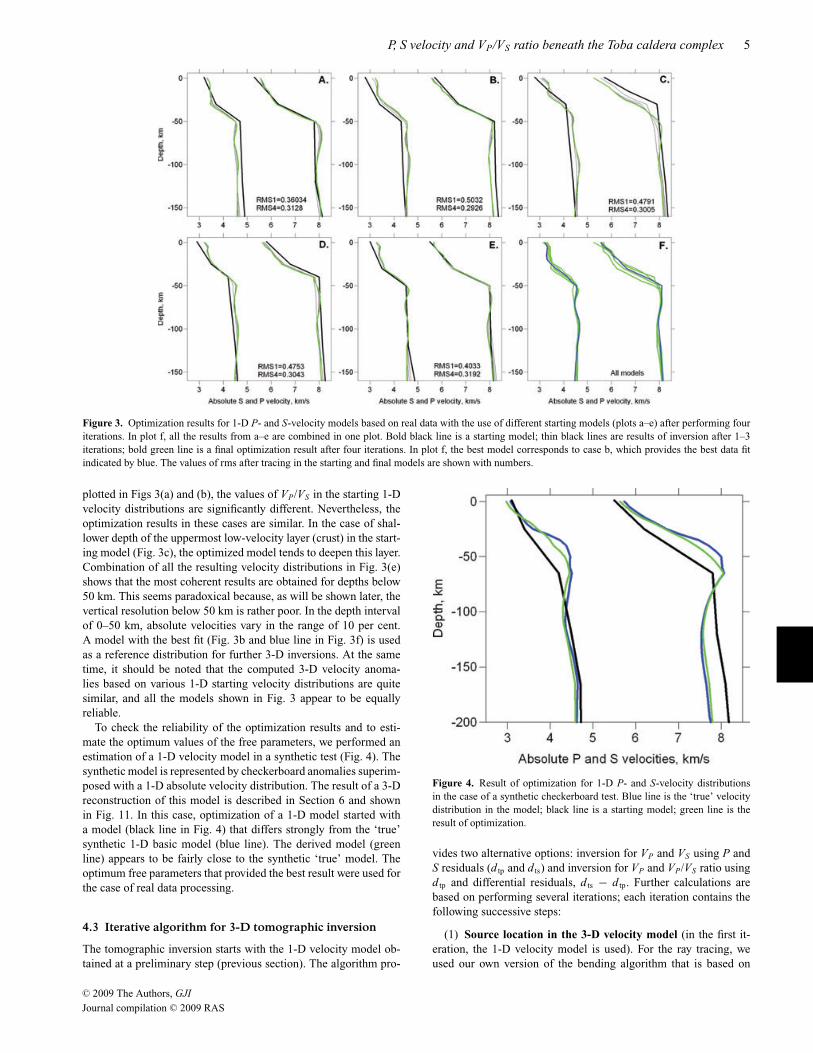
To check the reliability of the optimization results and to esti-mate the optimum values of the free parameters, we performed anestimation of a 1-D velocity model in a synthetic test (Fig. 4). Thesynthetic model is represented by checkerboard anomalies superim-posed with a 1-D absolute velocity distribution. The result of a 3-Dreconstruction of this model is described in Section 6 and shownin Fig. 11. In this case, optimization of a 1-D model started witha model (black line in Fig. 4) that differs strongly from the ‘true’synthetic 1-D basic model (blue line). The derived model (greenline) appears to be fairly close to the synthetic ‘true’ model. Theoptimum free parameters that provided the best result were used forthe case of real data processing.
4.3 Iterative algorithm for 3-D tomographic inversion
The tomographic inversion starts with the 1-D velocity model ob-tained at a preliminary step (previous section). The algorithm pro-
Figure 4. Result of optimization for 1-D P- and S-velocity distributionsin the case of a synthetic checkerboard test. Blue line is the ‘true’ velocitydistribution in the model; black line is a starting model; green line is theresult of optimization.
vides two alternative options: inversion for VP and VS using P andS residuals (d tp and d ts) and inversion for VP and VP/VS ratio usingd tp and differential residuals, d ts − d tp. Further calculations arebased on performing several iterations; each iteration contains thefollowing successive steps:
(1) Source location in the 3-D velocity model (in the first it-eration, the 1-D velocity model is used). For the ray tracing, weused our own version of the bending algorithm that is based on
C© 2009 The Authors, GJI
Journal compilation C© 2009 RAS
6 I. Koulakov et al.
successive deformation of the ray path to achieve the minimum ofthe traveltime that is described in detail in Koulakov (2009a). Thegeneral idea of bending was proposed in previous studies (e.g. Um& Thurber 1987), but our practical realization is significantly dif-ferent. In contrast to source location in a 1-D model that is basedon the grid searching method, the location in a 3-D model uses thegradient method of searching the extreme value of goal function(Koulakov et al. 2007).
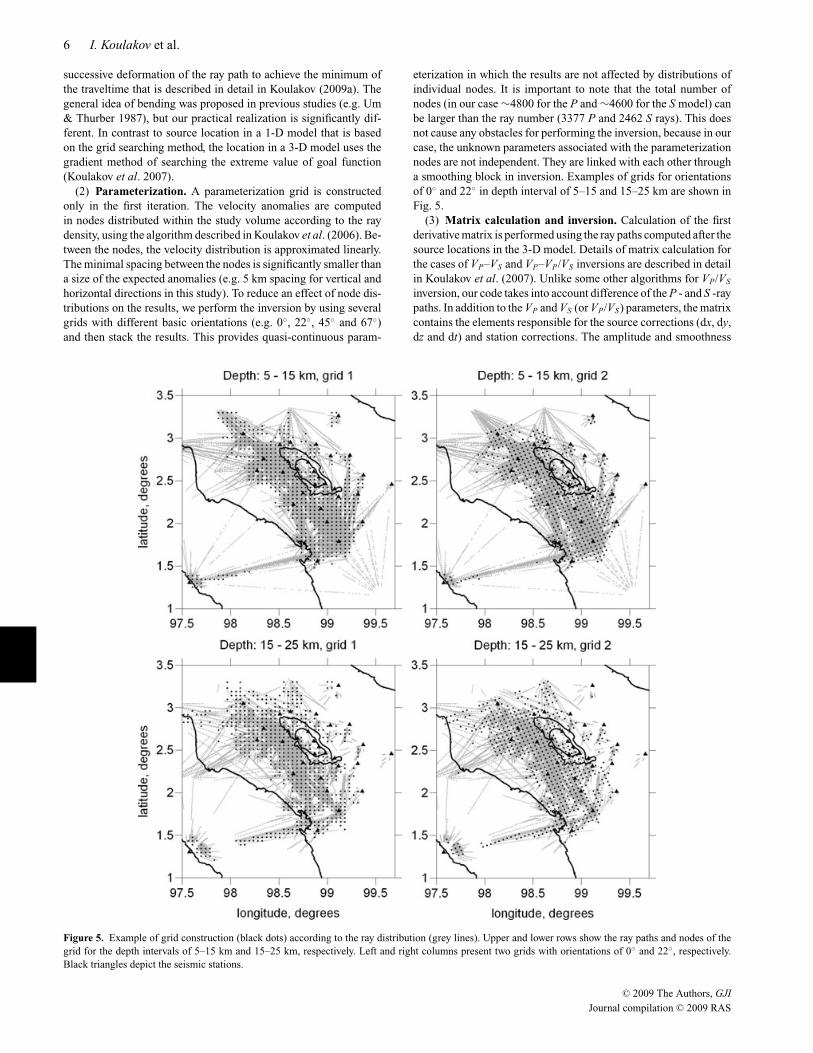
(2) Parameterization. A parameterization grid is constructedonly in the first iteration. The velocity anomalies are computedin nodes distributed within the study volume according to the raydensity, using the algorithm described in Koulakov et al. (2006). Be-tween the nodes, the velocity distribution is approximated linearly.The minimal spacing between the nodes is significantly smaller thana size of the expected anomalies (e.g. 5 km spacing for vertical andhorizontal directions in this study). To reduce an effect of node dis-tributions on the results, we perform the inversion by using severalgrids with different basic orientations (e.g. 0◦, 22◦, 45◦ and 67◦)and then stack the results. This provides quasi-continuous param-
Figure 5. Example of grid construction (black dots) according to the ray distribution (grey lines). Upper and lower rows show the ray paths and nodes of thegrid for the depth intervals of 5–15 km and 15–25 km, respectively. Left and right columns present two grids with orientations of 0◦ and 22◦, respectively.Black triangles depict the seismic stations.
eterization in which the results are not affected by distributions ofindividual nodes. It is important to note that the total number ofnodes (in our case ∼4800 for the P and ∼4600 for the S model) canbe larger than the ray number (3377 P and 2462 S rays). This doesnot cause any obstacles for performing the inversion, because in ourcase, the unknown parameters associated with the parameterizationnodes are not independent. They are linked with each other througha smoothing block in inversion. Examples of grids for orientationsof 0◦ and 22◦ in depth interval of 5–15 and 15–25 km are shown inFig. 5.
(3) Matrix calculation and inversion. Calculation of the firstderivative matrix is performed using the ray paths computed after thesource locations in the 3-D model. Details of matrix calculation forthe cases of VP–VS and VP–VP/VS inversions are described in detailin Koulakov et al. (2007). Unlike some other algorithms for VP/VS
inversion, our code takes into account difference of the P - and S -raypaths. In addition to the VP and VS (or VP/VS) parameters, the matrixcontains the elements responsible for the source corrections (dx, dy,dz and dt) and station corrections. The amplitude and smoothness
C© 2009 The Authors, GJI
Journal compilation C© 2009 RAS
P, S velocity and VP/VS ratio beneath the Toba caldera complex 7
of the solution are controlled by two additional blocks as describedin Koulakov (2009a). Increasing the weights of these blocks causeseither reduction in the solution amplitude or smoothness of thecomputed velocity fields. Inversion of the entire sparse matrix isperformed using an iterative LSQR code (Paige & Saunders 1982;Van der Sluis & van der Vorst 1987).
(4) Update of the 3-D velocity distribution. The results ob-tained for several parameterization grids are averaged in one 3-Dmodel that is used for the next iteration. This mode is defined in aregular grid that makes the ray tracing significantly faster comparedto the case when the model is defined in an irregular grid.
The first iteration contains all the steps, whereas for the nextiterations, only steps 1, 3 and 4 are executed. After the end of calcu-lations, the results are visualized in arbitrary horizontal and verticalsections. The values of the resulting anomalies are shown if thedistance to a nearest parameterization node is less than predefinedvalue (e.g. 5 km in our case).
To define optimal values of free parameters for inversion (smooth-ing and amplitude coefficients, weights for source and station cor-rections, number of iterations, etc.), we perform a series of syntheticreconstruction with the conditions that represent the real situation asadequate as possible. In our opinion, the most important test for thispurpose is creating a model that reproduces the realistic patterns.This modelling is discussed in Section 6.
In many studies, the damping coefficients are defined byanalysing the relationship between the rms of residuals, amplitudeof the solution and values of damping; these are called the trade-off curves (TOC; e.g. Eberhart-Phillips 1986). Koulakov (2009a)provides several arguments based on synthetic modelling why thisapproach is not valid in most cases. First, in most of the studiesthat use this approach, the TOC is computed for the first iterationof the inversion procedure. At the same time, the main results ofthese studies are obtained after performing several iterations (e.g.3, 5, 10). The damping parameters obtained as corner points of the‘L-shaped’ TOC do not necessarily coincide in the first and finaliterations. It would be more reasonable to use the value that corre-sponds to the TOC in the final iteration, but in this case, the problembecomes too time-consuming. Second, even if we use a dampingvalue corresponding to the TOC in the final iteration, it is not clearthat this value is really optimal. Koulakov (2009a) has tested thisquestion with several synthetic models, and he has observed thatdamping estimated in this way is too strong.
5 R E A L DATA I N V E R S I O N
We performed a number of inversions for real and synthetic datawith different parameters, data subsets and configurations of syn-thetic models. Here we present only a few of them that seem mostimportant for showing the reliability of our main results, and whichallow quantifying values of obtained velocity anomalies. All thereal and synthetic models presented here are obtained after realiza-tion of five iteration steps. This number is taken as a compromisebetween solution quality and calculation speed, and it was checkedwith synthetic modelling.
For each solution, we compute the amplitude of the velocityvariation as the difference between values of velocity deviationsin prominent negative and positive anomalies. These values arecomputed in two small square areas (0.12◦ × 0.12◦ each) that arelocated inside the anomalies where the solution seems to be robust.The average values of the velocity anomalies are computed insideeach square and then subtracted from each other. The amplitude
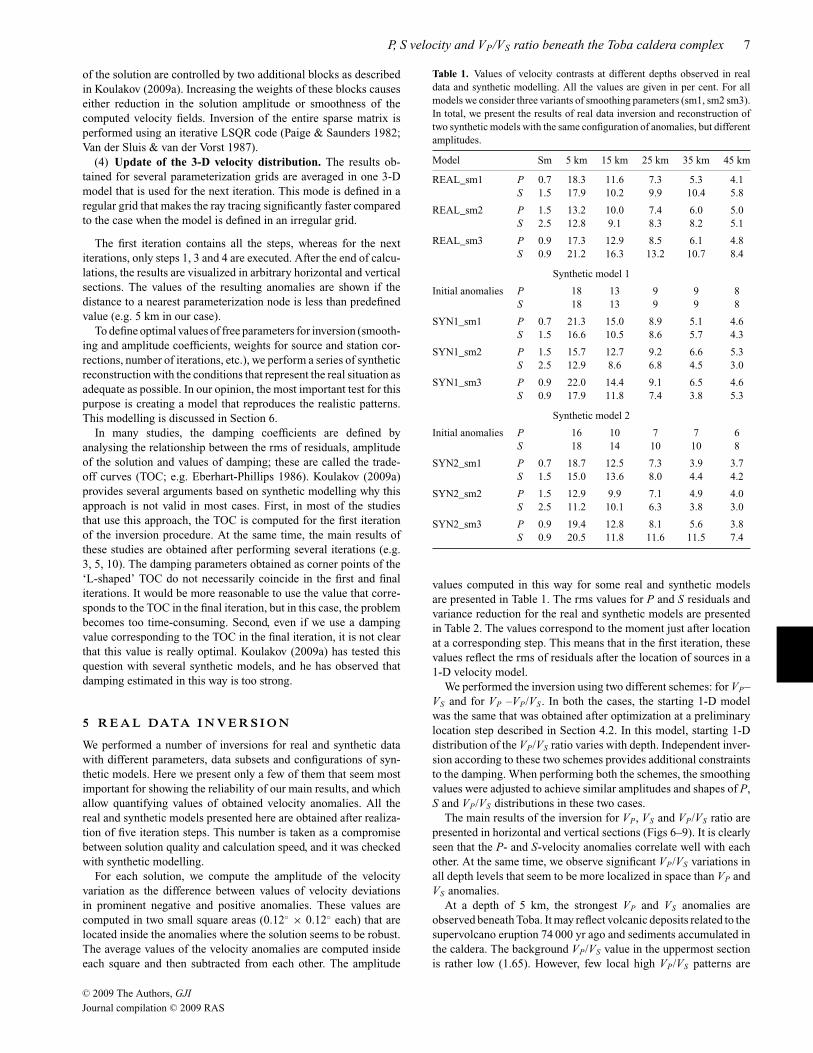
Table 1. Values of velocity contrasts at different depths observed in realdata and synthetic modelling. All the values are given in per cent. For allmodels we consider three variants of smoothing parameters (sm1, sm2 sm3).In total, we present the results of real data inversion and reconstruction oftwo synthetic models with the same configuration of anomalies, but differentamplitudes.
Model Sm 5 km 15 km 25 km 35 km 45 km
REAL_sm1 P 0.7 18.3 11.6 7.3 5.3 4.1S 1.5 17.9 10.2 9.9 10.4 5.8
REAL_sm2 P 1.5 13.2 10.0 7.4 6.0 5.0S 2.5 12.8 9.1 8.3 8.2 5.1
REAL_sm3 P 0.9 17.3 12.9 8.5 6.1 4.8S 0.9 21.2 16.3 13.2 10.7 8.4
Synthetic model 1
Initial anomalies P 18 13 9 9 8S 18 13 9 9 8
SYN1_sm1 P 0.7 21.3 15.0 8.9 5.1 4.6S 1.5 16.6 10.5 8.6 5.7 4.3
SYN1_sm2 P 1.5 15.7 12.7 9.2 6.6 5.3S 2.5 12.9 8.6 6.8 4.5 3.0
SYN1_sm3 P 0.9 22.0 14.4 9.1 6.5 4.6S 0.9 17.9 11.8 7.4 3.8 5.3
Synthetic model 2
Initial anomalies P 16 10 7 7 6S 18 14 10 10 8
SYN2_sm1 P 0.7 18.7 12.5 7.3 3.9 3.7S 1.5 15.0 13.6 8.0 4.4 4.2
SYN2_sm2 P 1.5 12.9 9.9 7.1 4.9 4.0S 2.5 11.2 10.1 6.3 3.8 3.0
SYN2_sm3 P 0.9 19.4 12.8 8.1 5.6 3.8S 0.9 20.5 11.8 11.6 11.5 7.4
values computed in this way for some real and synthetic modelsare presented in Table 1. The rms values for P and S residuals andvariance reduction for the real and synthetic models are presentedin Table 2. The values correspond to the moment just after locationat a corresponding step. This means that in the first iteration, thesevalues reflect the rms of residuals after the location of sources in a1-D velocity model.
We performed the inversion using two different schemes: for VP–VS and for VP –VP/VS . In both the cases, the starting 1-D modelwas the same that was obtained after optimization at a preliminarylocation step described in Section 4.2. In this model, starting 1-Ddistribution of the VP/VS ratio varies with depth. Independent inver-sion according to these two schemes provides additional constraintsto the damping. When performing both the schemes, the smoothingvalues were adjusted to achieve similar amplitudes and shapes of P,S and VP/VS distributions in these two cases.
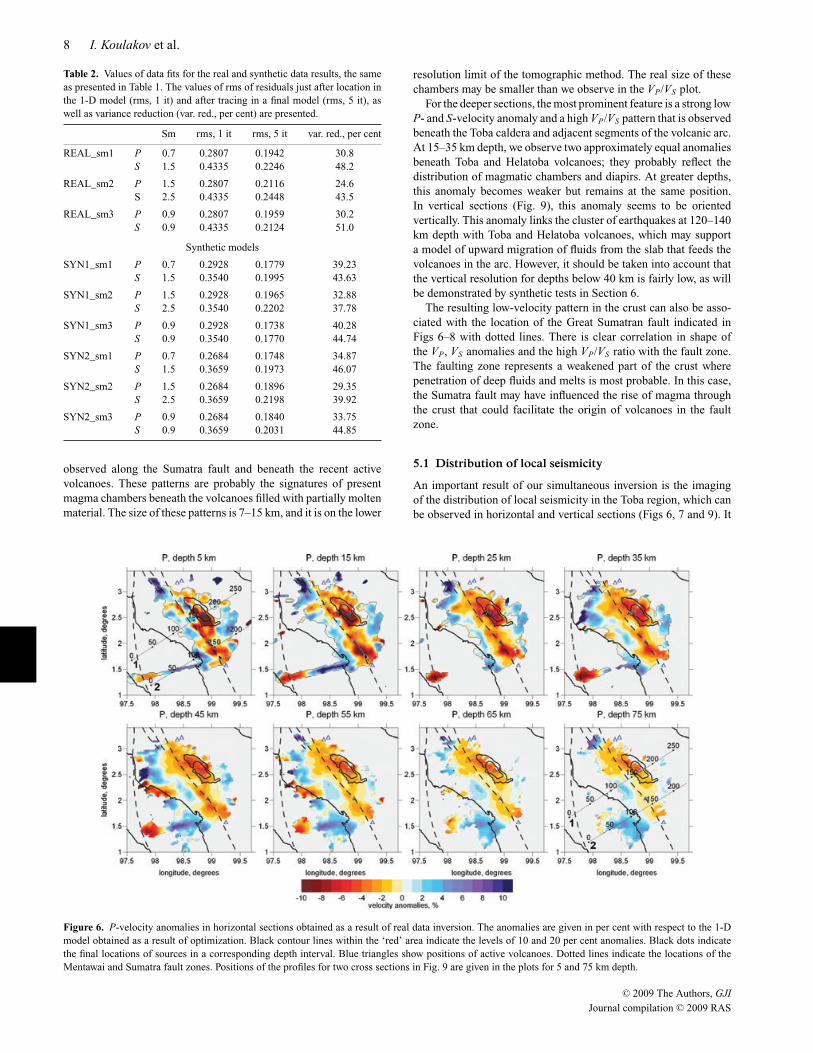
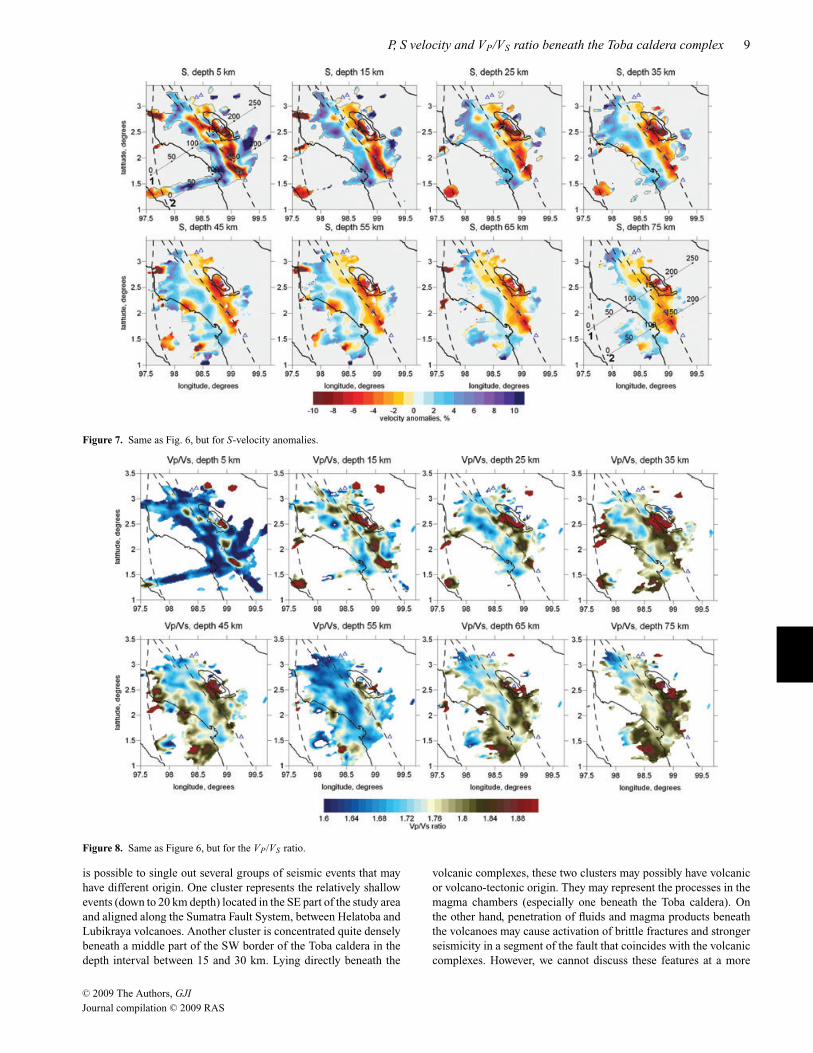
The main results of the inversion for VP, VS and VP/VS ratio arepresented in horizontal and vertical sections (Figs 6–9). It is clearlyseen that the P- and S-velocity anomalies correlate well with eachother. At the same time, we observe significant VP/VS variations inall depth levels that seem to be more localized in space than VP andVS anomalies.
At a depth of 5 km, the strongest VP and VS anomalies areobserved beneath Toba. It may reflect volcanic deposits related to thesupervolcano eruption 74 000 yr ago and sediments accumulated inthe caldera. The background VP/VS value in the uppermost sectionis rather low (1.65). However, few local high VP/VS patterns are
C© 2009 The Authors, GJI
Journal compilation C© 2009 RAS
8 I. Koulakov et al.
Table 2. Values of data fits for the real and synthetic data results, the sameas presented in Table 1. The values of rms of residuals just after location inthe 1-D model (rms, 1 it) and after tracing in a final model (rms, 5 it), aswell as variance reduction (var. red., per cent) are presented.
Sm rms, 1 it rms, 5 it var. red., per cent
REAL_sm1 P 0.7 0.2807 0.1942 30.8S 1.5 0.4335 0.2246 48.2
REAL_sm2 P 1.5 0.2807 0.2116 24.6S 2.5 0.4335 0.2448 43.5
REAL_sm3 P 0.9 0.2807 0.1959 30.2S 0.9 0.4335 0.2124 51.0
Synthetic models
SYN1_sm1 P 0.7 0.2928 0.1779 39.23S 1.5 0.3540 0.1995 43.63
SYN1_sm2 P 1.5 0.2928 0.1965 32.88S 2.5 0.3540 0.2202 37.78
SYN1_sm3 P 0.9 0.2928 0.1738 40.28S 0.9 0.3540 0.1770 44.74
SYN2_sm1 P 0.7 0.2684 0.1748 34.87S 1.5 0.3659 0.1973 46.07
SYN2_sm2 P 1.5 0.2684 0.1896 29.35S 2.5 0.3659 0.2198 39.92
SYN2_sm3 P 0.9 0.2684 0.1840 33.75S 0.9 0.3659 0.2031 44.85
observed along the Sumatra fault and beneath the recent activevolcanoes. These patterns are probably the signatures of presentmagma chambers beneath the volcanoes filled with partially moltenmaterial. The size of these patterns is 7–15 km, and it is on the lower
Figure 6. P-velocity anomalies in horizontal sections obtained as a result of real data inversion. The anomalies are given in per cent with respect to the 1-Dmodel obtained as a result of optimization. Black contour lines within the ‘red’ area indicate the levels of 10 and 20 per cent anomalies. Black dots indicatethe final locations of sources in a corresponding depth interval. Blue triangles show positions of active volcanoes. Dotted lines indicate the locations of theMentawai and Sumatra fault zones. Positions of the profiles for two cross sections in Fig. 9 are given in the plots for 5 and 75 km depth.
resolution limit of the tomographic method. The real size of thesechambers may be smaller than we observe in the VP/VS plot.
For the deeper sections, the most prominent feature is a strong lowP- and S-velocity anomaly and a high VP/VS pattern that is observedbeneath the Toba caldera and adjacent segments of the volcanic arc.At 15–35 km depth, we observe two approximately equal anomaliesbeneath Toba and Helatoba volcanoes; they probably reflect thedistribution of magmatic chambers and diapirs. At greater depths,this anomaly becomes weaker but remains at the same position.In vertical sections (Fig. 9), this anomaly seems to be orientedvertically. This anomaly links the cluster of earthquakes at 120–140km depth with Toba and Helatoba volcanoes, which may supporta model of upward migration of fluids from the slab that feeds thevolcanoes in the arc. However, it should be taken into account thatthe vertical resolution for depths below 40 km is fairly low, as willbe demonstrated by synthetic tests in Section 6.
The resulting low-velocity pattern in the crust can also be asso-ciated with the location of the Great Sumatran fault indicated inFigs 6–8 with dotted lines. There is clear correlation in shape ofthe VP, VS anomalies and the high VP/VS ratio with the fault zone.The faulting zone represents a weakened part of the crust wherepenetration of deep fluids and melts is most probable. In this case,the Sumatra fault may have influenced the rise of magma throughthe crust that could facilitate the origin of volcanoes in the faultzone.
5.1 Distribution of local seismicity
An important result of our simultaneous inversion is the imagingof the distribution of local seismicity in the Toba region, which canbe observed in horizontal and vertical sections (Figs 6, 7 and 9). It
C© 2009 The Authors, GJI
Journal compilation C© 2009 RAS
P, S velocity and VP/VS ratio beneath the Toba caldera complex 9
Figure 7. Same as Fig. 6, but for S-velocity anomalies.
Figure 8. Same as Figure 6, but for the VP/VS ratio.
is possible to single out several groups of seismic events that mayhave different origin. One cluster represents the relatively shallowevents (down to 20 km depth) located in the SE part of the study areaand aligned along the Sumatra Fault System, between Helatoba andLubikraya volcanoes. Another cluster is concentrated quite denselybeneath a middle part of the SW border of the Toba caldera in thedepth interval between 15 and 30 km. Lying directly beneath the
volcanic complexes, these two clusters may possibly have volcanicor volcano-tectonic origin. They may represent the processes in themagma chambers (especially one beneath the Toba caldera). Onthe other hand, penetration of fluids and magma products beneaththe volcanoes may cause activation of brittle fractures and strongerseismicity in a segment of the fault that coincides with the volcaniccomplexes. However, we cannot discuss these features at a more
C© 2009 The Authors, GJI
Journal compilation C© 2009 RAS
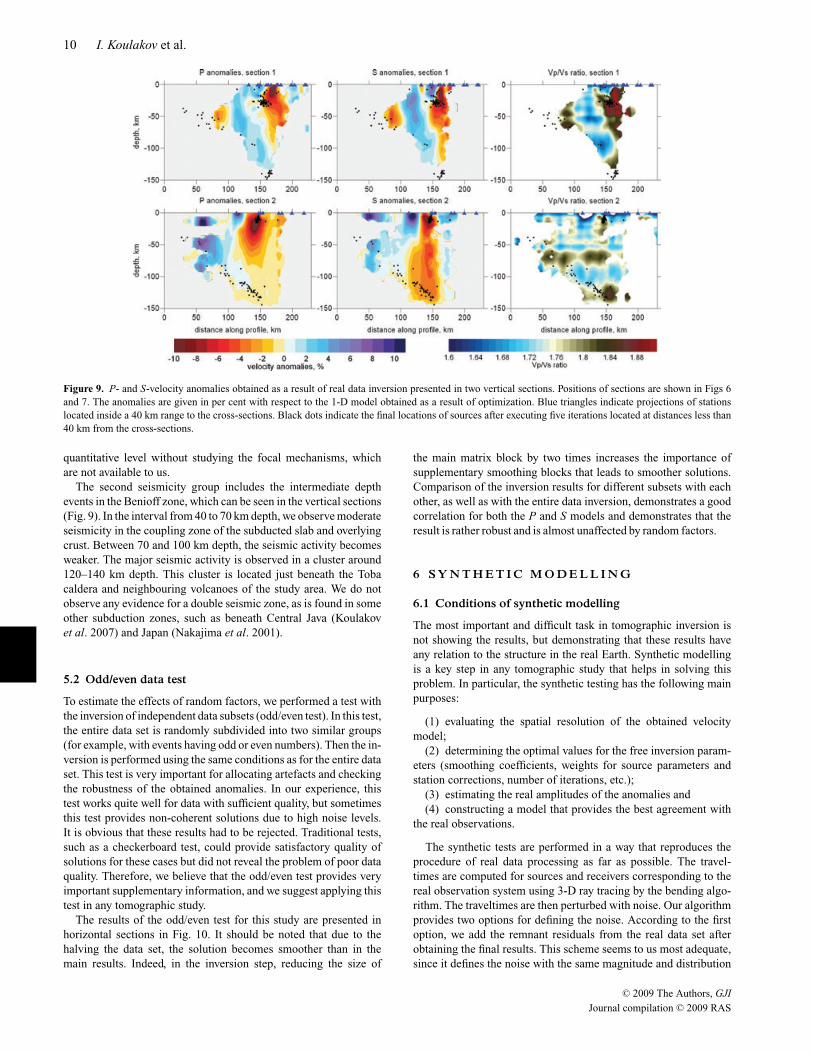
10 I. Koulakov et al.
Figure 9. P- and S-velocity anomalies obtained as a result of real data inversion presented in two vertical sections. Positions of sections are shown in Figs 6and 7. The anomalies are given in per cent with respect to the 1-D model obtained as a result of optimization. Blue triangles indicate projections of stationslocated inside a 40 km range to the cross-sections. Black dots indicate the final locations of sources after executing five iterations located at distances less than40 km from the cross-sections.
quantitative level without studying the focal mechanisms, whichare not available to us.
The second seismicity group includes the intermediate depthevents in the Benioff zone, which can be seen in the vertical sections(Fig. 9). In the interval from 40 to 70 km depth, we observe moderateseismicity in the coupling zone of the subducted slab and overlyingcrust. Between 70 and 100 km depth, the seismic activity becomesweaker. The major seismic activity is observed in a cluster around120–140 km depth. This cluster is located just beneath the Tobacaldera and neighbouring volcanoes of the study area. We do notobserve any evidence for a double seismic zone, as is found in someother subduction zones, such as beneath Central Java (Koulakovet al. 2007) and Japan (Nakajima et al. 2001).
5.2 Odd/even data test
To estimate the effects of random factors, we performed a test withthe inversion of independent data subsets (odd/even test). In this test,the entire data set is randomly subdivided into two similar groups(for example, with events having odd or even numbers). Then the in-version is performed using the same conditions as for the entire dataset. This test is very important for allocating artefacts and checkingthe robustness of the obtained anomalies. In our experience, thistest works quite well for data with sufficient quality, but sometimesthis test provides non-coherent solutions due to high noise levels.It is obvious that these results had to be rejected. Traditional tests,such as a checkerboard test, could provide satisfactory quality ofsolutions for these cases but did not reveal the problem of poor dataquality. Therefore, we believe that the odd/even test provides veryimportant supplementary information, and we suggest applying thistest in any tomographic study.
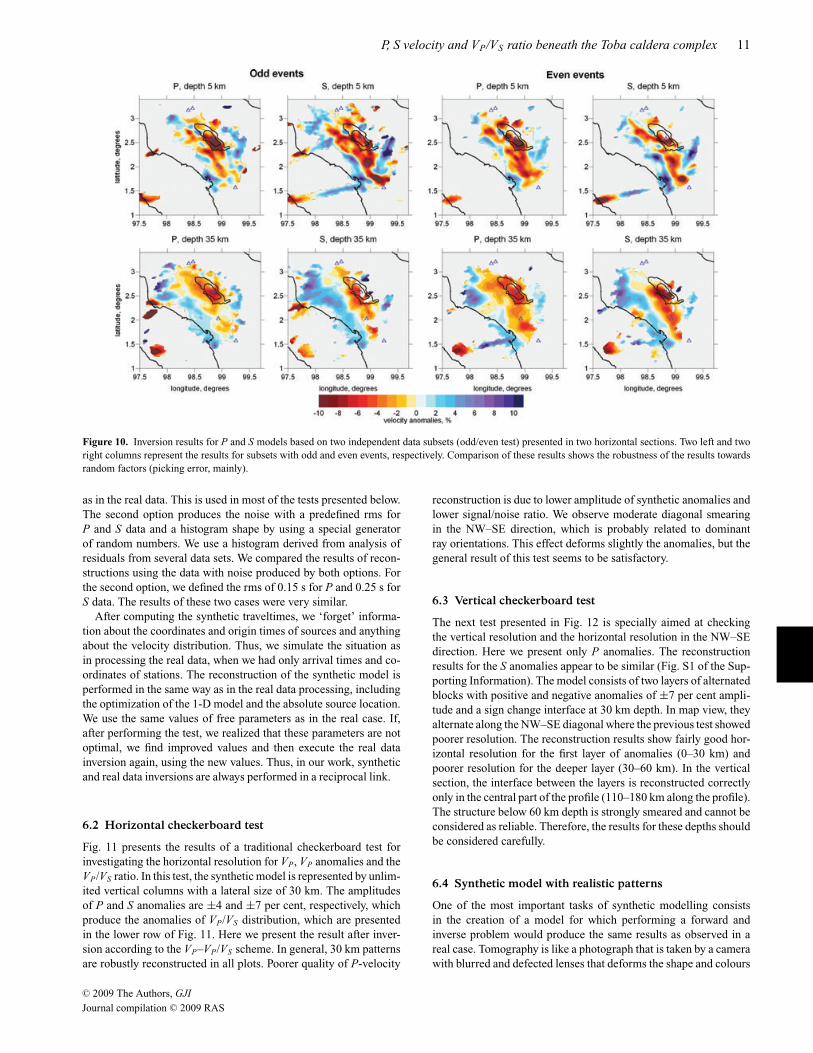
The results of the odd/even test for this study are presented inhorizontal sections in Fig. 10. It should be noted that due to thehalving the data set, the solution becomes smoother than in themain results. Indeed, in the inversion step, reducing the size of
the main matrix block by two times increases the importance ofsupplementary smoothing blocks that leads to smoother solutions.Comparison of the inversion results for different subsets with eachother, as well as with the entire data inversion, demonstrates a goodcorrelation for both the P and S models and demonstrates that theresult is rather robust and is almost unaffected by random factors.
6 S Y N T H E T I C M O D E L L I N G
6.1 Conditions of synthetic modelling
The most important and difficult task in tomographic inversion isnot showing the results, but demonstrating that these results haveany relation to the structure in the real Earth. Synthetic modellingis a key step in any tomographic study that helps in solving thisproblem. In particular, the synthetic testing has the following mainpurposes:
(1) evaluating the spatial resolution of the obtained velocitymodel;
(2) determining the optimal values for the free inversion param-eters (smoothing coefficients, weights for source parameters andstation corrections, number of iterations, etc.);
(3) estimating the real amplitudes of the anomalies and(4) constructing a model that provides the best agreement with
the real observations.
The synthetic tests are performed in a way that reproduces theprocedure of real data processing as far as possible. The travel-times are computed for sources and receivers corresponding to thereal observation system using 3-D ray tracing by the bending algo-rithm. The traveltimes are then perturbed with noise. Our algorithmprovides two options for defining the noise. According to the firstoption, we add the remnant residuals from the real data set afterobtaining the final results. This scheme seems to us most adequate,since it defines the noise with the same magnitude and distribution
C© 2009 The Authors, GJI
Journal compilation C© 2009 RAS
P, S velocity and VP/VS ratio beneath the Toba caldera complex 11
Figure 10. Inversion results for P and S models based on two independent data subsets (odd/even test) presented in two horizontal sections. Two left and tworight columns represent the results for subsets with odd and even events, respectively. Comparison of these results shows the robustness of the results towardsrandom factors (picking error, mainly).
as in the real data. This is used in most of the tests presented below.The second option produces the noise with a predefined rms forP and S data and a histogram shape by using a special generatorof random numbers. We use a histogram derived from analysis ofresiduals from several data sets. We compared the results of recon-structions using the data with noise produced by both options. Forthe second option, we defined the rms of 0.15 s for P and 0.25 s forS data. The results of these two cases were very similar.
After computing the synthetic traveltimes, we ‘forget’ informa-tion about the coordinates and origin times of sources and anythingabout the velocity distribution. Thus, we simulate the situation asin processing the real data, when we had only arrival times and co-ordinates of stations. The reconstruction of the synthetic model isperformed in the same way as in the real data processing, includingthe optimization of the 1-D model and the absolute source location.We use the same values of free parameters as in the real case. If,after performing the test, we realized that these parameters are notoptimal, we find improved values and then execute the real datainversion again, using the new values. Thus, in our work, syntheticand real data inversions are always performed in a reciprocal link.
6.2 Horizontal checkerboard test
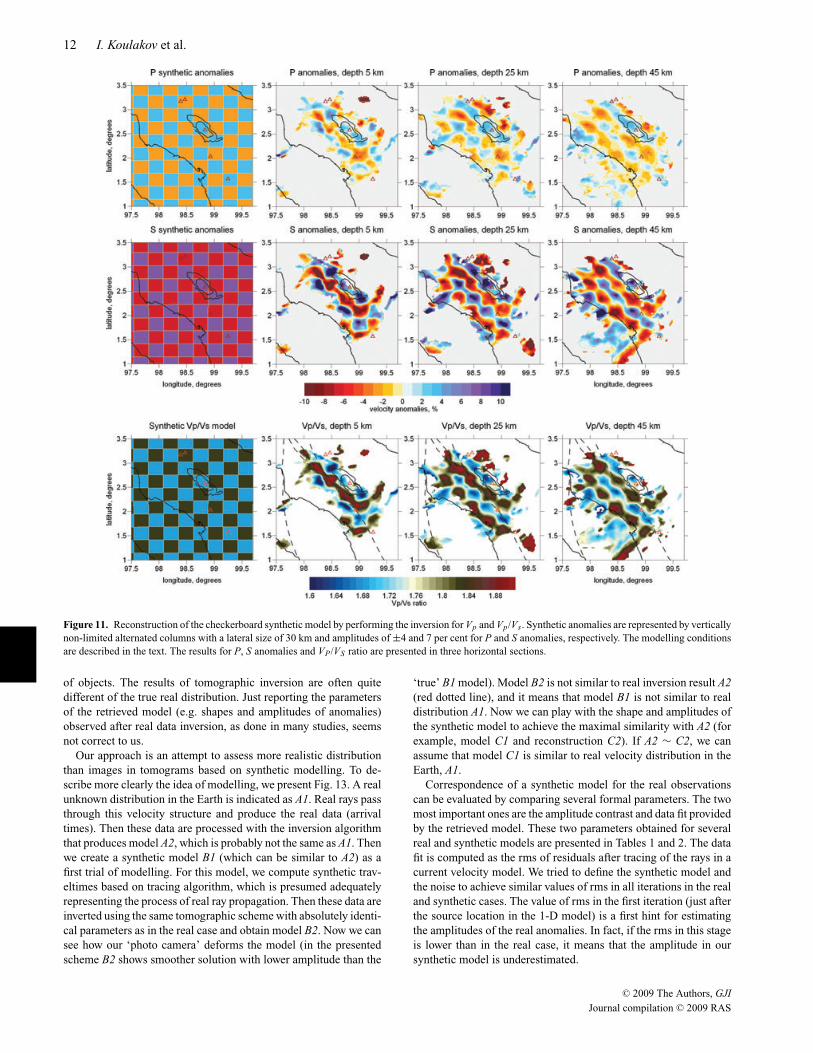
Fig. 11 presents the results of a traditional checkerboard test forinvestigating the horizontal resolution for VP, VP anomalies and theVP/VS ratio. In this test, the synthetic model is represented by unlim-ited vertical columns with a lateral size of 30 km. The amplitudesof P and S anomalies are ±4 and ±7 per cent, respectively, whichproduce the anomalies of VP/VS distribution, which are presentedin the lower row of Fig. 11. Here we present the result after inver-sion according to the VP–VP/VS scheme. In general, 30 km patternsare robustly reconstructed in all plots. Poorer quality of P-velocity
reconstruction is due to lower amplitude of synthetic anomalies andlower signal/noise ratio. We observe moderate diagonal smearingin the NW–SE direction, which is probably related to dominantray orientations. This effect deforms slightly the anomalies, but thegeneral result of this test seems to be satisfactory.
6.3 Vertical checkerboard test
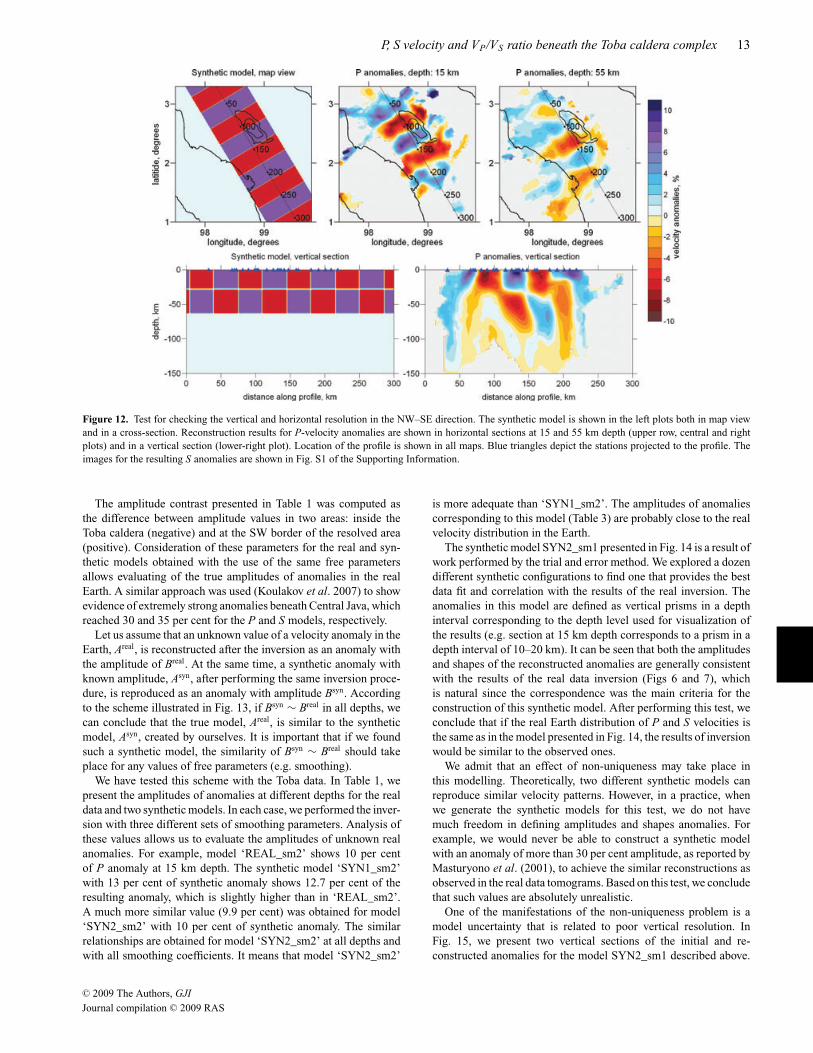
The next test presented in Fig. 12 is specially aimed at checkingthe vertical resolution and the horizontal resolution in the NW–SEdirection. Here we present only P anomalies. The reconstructionresults for the S anomalies appear to be similar (Fig. S1 of the Sup-porting Information). The model consists of two layers of alternatedblocks with positive and negative anomalies of ±7 per cent ampli-tude and a sign change interface at 30 km depth. In map view, theyalternate along the NW–SE diagonal where the previous test showedpoorer resolution. The reconstruction results show fairly good hor-izontal resolution for the first layer of anomalies (0–30 km) andpoorer resolution for the deeper layer (30–60 km). In the verticalsection, the interface between the layers is reconstructed correctlyonly in the central part of the profile (110–180 km along the profile).The structure below 60 km depth is strongly smeared and cannot beconsidered as reliable. Therefore, the results for these depths shouldbe considered carefully.
6.4 Synthetic model with realistic patterns
One of the most important tasks of synthetic modelling consistsin the creation of a model for which performing a forward andinverse problem would produce the same results as observed in areal case. Tomography is like a photograph that is taken by a camerawith blurred and defected lenses that deforms the shape and colours
C© 2009 The Authors, GJI
Journal compilation C© 2009 RAS
12 I. Koulakov et al.
Figure 11. Reconstruction of the checkerboard synthetic model by performing the inversion for Vp and Vp/Vs. Synthetic anomalies are represented by verticallynon-limited alternated columns with a lateral size of 30 km and amplitudes of ±4 and 7 per cent for P and S anomalies, respectively. The modelling conditionsare described in the text. The results for P, S anomalies and VP/VS ratio are presented in three horizontal sections.
of objects. The results of tomographic inversion are often quitedifferent of the true real distribution. Just reporting the parametersof the retrieved model (e.g. shapes and amplitudes of anomalies)observed after real data inversion, as done in many studies, seemsnot correct to us.
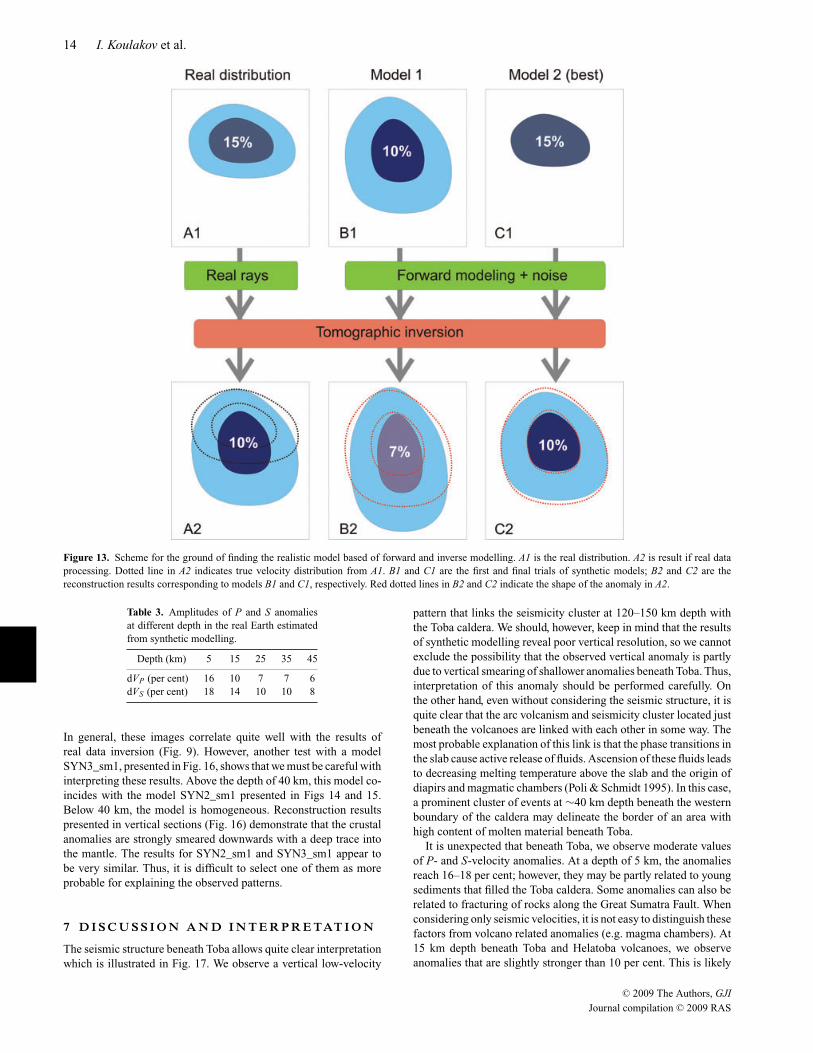
Our approach is an attempt to assess more realistic distributionthan images in tomograms based on synthetic modelling. To de-scribe more clearly the idea of modelling, we present Fig. 13. A realunknown distribution in the Earth is indicated as A1. Real rays passthrough this velocity structure and produce the real data (arrivaltimes). Then these data are processed with the inversion algorithmthat produces model A2, which is probably not the same as A1. Thenwe create a synthetic model B1 (which can be similar to A2) as afirst trial of modelling. For this model, we compute synthetic trav-eltimes based on tracing algorithm, which is presumed adequatelyrepresenting the process of real ray propagation. Then these data areinverted using the same tomographic scheme with absolutely identi-cal parameters as in the real case and obtain model B2. Now we cansee how our ‘photo camera’ deforms the model (in the presentedscheme B2 shows smoother solution with lower amplitude than the
‘true’ B1 model). Model B2 is not similar to real inversion result A2(red dotted line), and it means that model B1 is not similar to realdistribution A1. Now we can play with the shape and amplitudes ofthe synthetic model to achieve the maximal similarity with A2 (forexample, model C1 and reconstruction C2). If A2 ∼ C2, we canassume that model C1 is similar to real velocity distribution in theEarth, A1.
Correspondence of a synthetic model for the real observationscan be evaluated by comparing several formal parameters. The twomost important ones are the amplitude contrast and data fit providedby the retrieved model. These two parameters obtained for severalreal and synthetic models are presented in Tables 1 and 2. The datafit is computed as the rms of residuals after tracing of the rays in acurrent velocity model. We tried to define the synthetic model andthe noise to achieve similar values of rms in all iterations in the realand synthetic cases. The value of rms in the first iteration (just afterthe source location in the 1-D model) is a first hint for estimatingthe amplitudes of the real anomalies. In fact, if the rms in this stageis lower than in the real case, it means that the amplitude in oursynthetic model is underestimated.
C© 2009 The Authors, GJI
Journal compilation C© 2009 RAS
P, S velocity and VP/VS ratio beneath the Toba caldera complex 13
Figure 12. Test for checking the vertical and horizontal resolution in the NW–SE direction. The synthetic model is shown in the left plots both in map viewand in a cross-section. Reconstruction results for P-velocity anomalies are shown in horizontal sections at 15 and 55 km depth (upper row, central and rightplots) and in a vertical section (lower-right plot). Location of the profile is shown in all maps. Blue triangles depict the stations projected to the profile. Theimages for the resulting S anomalies are shown in Fig. S1 of the Supporting Information.
The amplitude contrast presented in Table 1 was computed asthe difference between amplitude values in two areas: inside theToba caldera (negative) and at the SW border of the resolved area(positive). Consideration of these parameters for the real and syn-thetic models obtained with the use of the same free parametersallows evaluating of the true amplitudes of anomalies in the realEarth. A similar approach was used (Koulakov et al. 2007) to showevidence of extremely strong anomalies beneath Central Java, whichreached 30 and 35 per cent for the P and S models, respectively.
Let us assume that an unknown value of a velocity anomaly in theEarth, Areal, is reconstructed after the inversion as an anomaly withthe amplitude of Breal. At the same time, a synthetic anomaly withknown amplitude, Asyn, after performing the same inversion proce-dure, is reproduced as an anomaly with amplitude Bsyn. Accordingto the scheme illustrated in Fig. 13, if Bsyn ∼ Breal in all depths, wecan conclude that the true model, Areal, is similar to the syntheticmodel, Asyn, created by ourselves. It is important that if we foundsuch a synthetic model, the similarity of Bsyn ∼ Breal should takeplace for any values of free parameters (e.g. smoothing).
We have tested this scheme with the Toba data. In Table 1, wepresent the amplitudes of anomalies at different depths for the realdata and two synthetic models. In each case, we performed the inver-sion with three different sets of smoothing parameters. Analysis ofthese values allows us to evaluate the amplitudes of unknown realanomalies. For example, model ‘REAL_sm2’ shows 10 per centof P anomaly at 15 km depth. The synthetic model ‘SYN1_sm2’with 13 per cent of synthetic anomaly shows 12.7 per cent of theresulting anomaly, which is slightly higher than in ‘REAL_sm2’.A much more similar value (9.9 per cent) was obtained for model‘SYN2_sm2’ with 10 per cent of synthetic anomaly. The similarrelationships are obtained for model ‘SYN2_sm2’ at all depths andwith all smoothing coefficients. It means that model ‘SYN2_sm2’
is more adequate than ‘SYN1_sm2’. The amplitudes of anomaliescorresponding to this model (Table 3) are probably close to the realvelocity distribution in the Earth.
The synthetic model SYN2_sm1 presented in Fig. 14 is a result ofwork performed by the trial and error method. We explored a dozendifferent synthetic configurations to find one that provides the bestdata fit and correlation with the results of the real inversion. Theanomalies in this model are defined as vertical prisms in a depthinterval corresponding to the depth level used for visualization ofthe results (e.g. section at 15 km depth corresponds to a prism in adepth interval of 10–20 km). It can be seen that both the amplitudesand shapes of the reconstructed anomalies are generally consistentwith the results of the real data inversion (Figs 6 and 7), whichis natural since the correspondence was the main criteria for theconstruction of this synthetic model. After performing this test, weconclude that if the real Earth distribution of P and S velocities isthe same as in the model presented in Fig. 14, the results of inversionwould be similar to the observed ones.
We admit that an effect of non-uniqueness may take place inthis modelling. Theoretically, two different synthetic models canreproduce similar velocity patterns. However, in a practice, whenwe generate the synthetic models for this test, we do not havemuch freedom in defining amplitudes and shapes anomalies. Forexample, we would never be able to construct a synthetic modelwith an anomaly of more than 30 per cent amplitude, as reported byMasturyono et al. (2001), to achieve the similar reconstructions asobserved in the real data tomograms. Based on this test, we concludethat such values are absolutely unrealistic.
One of the manifestations of the non-uniqueness problem is amodel uncertainty that is related to poor vertical resolution. InFig. 15, we present two vertical sections of the initial and re-constructed anomalies for the model SYN2_sm1 described above.
C© 2009 The Authors, GJI
Journal compilation C© 2009 RAS
14 I. Koulakov et al.
Figure 13. Scheme for the ground of finding the realistic model based of forward and inverse modelling. A1 is the real distribution. A2 is result if real dataprocessing. Dotted line in A2 indicates true velocity distribution from A1. B1 and C1 are the first and final trials of synthetic models; B2 and C2 are thereconstruction results corresponding to models B1 and C1, respectively. Red dotted lines in B2 and C2 indicate the shape of the anomaly in A2.
Table 3. Amplitudes of P and S anomaliesat different depth in the real Earth estimatedfrom synthetic modelling.
Depth (km) 5 15 25 35 45
dVP (per cent) 16 10 7 7 6dVS (per cent) 18 14 10 10 8
In general, these images correlate quite well with the results ofreal data inversion (Fig. 9). However, another test with a modelSYN3_sm1, presented in Fig. 16, shows that we must be careful withinterpreting these results. Above the depth of 40 km, this model co-incides with the model SYN2_sm1 presented in Figs 14 and 15.Below 40 km, the model is homogeneous. Reconstruction resultspresented in vertical sections (Fig. 16) demonstrate that the crustalanomalies are strongly smeared downwards with a deep trace intothe mantle. The results for SYN2_sm1 and SYN3_sm1 appear tobe very similar. Thus, it is difficult to select one of them as moreprobable for explaining the observed patterns.
7 D I S C U S S I O N A N D I N T E R P R E TAT I O N
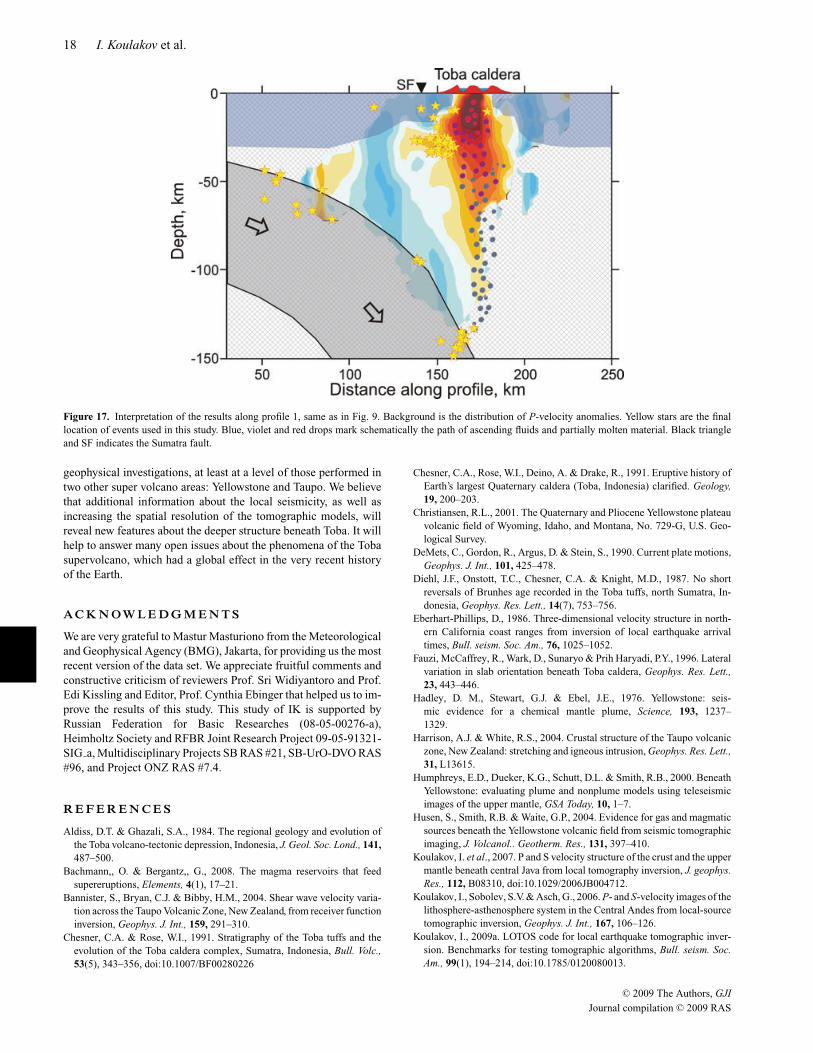
The seismic structure beneath Toba allows quite clear interpretationwhich is illustrated in Fig. 17. We observe a vertical low-velocity
pattern that links the seismicity cluster at 120–150 km depth withthe Toba caldera. We should, however, keep in mind that the resultsof synthetic modelling reveal poor vertical resolution, so we cannotexclude the possibility that the observed vertical anomaly is partlydue to vertical smearing of shallower anomalies beneath Toba. Thus,interpretation of this anomaly should be performed carefully. Onthe other hand, even without considering the seismic structure, it isquite clear that the arc volcanism and seismicity cluster located justbeneath the volcanoes are linked with each other in some way. Themost probable explanation of this link is that the phase transitions inthe slab cause active release of fluids. Ascension of these fluids leadsto decreasing melting temperature above the slab and the origin ofdiapirs and magmatic chambers (Poli & Schmidt 1995). In this case,a prominent cluster of events at ∼40 km depth beneath the westernboundary of the caldera may delineate the border of an area withhigh content of molten material beneath Toba.
It is unexpected that beneath Toba, we observe moderate valuesof P- and S-velocity anomalies. At a depth of 5 km, the anomaliesreach 16–18 per cent; however, they may be partly related to youngsediments that filled the Toba caldera. Some anomalies can also berelated to fracturing of rocks along the Great Sumatra Fault. Whenconsidering only seismic velocities, it is not easy to distinguish thesefactors from volcano related anomalies (e.g. magma chambers). At15 km depth beneath Toba and Helatoba volcanoes, we observeanomalies that are slightly stronger than 10 per cent. This is likely
C© 2009 The Authors, GJI
Journal compilation C© 2009 RAS
P, S velocity and VP/VS ratio beneath the Toba caldera complex 15
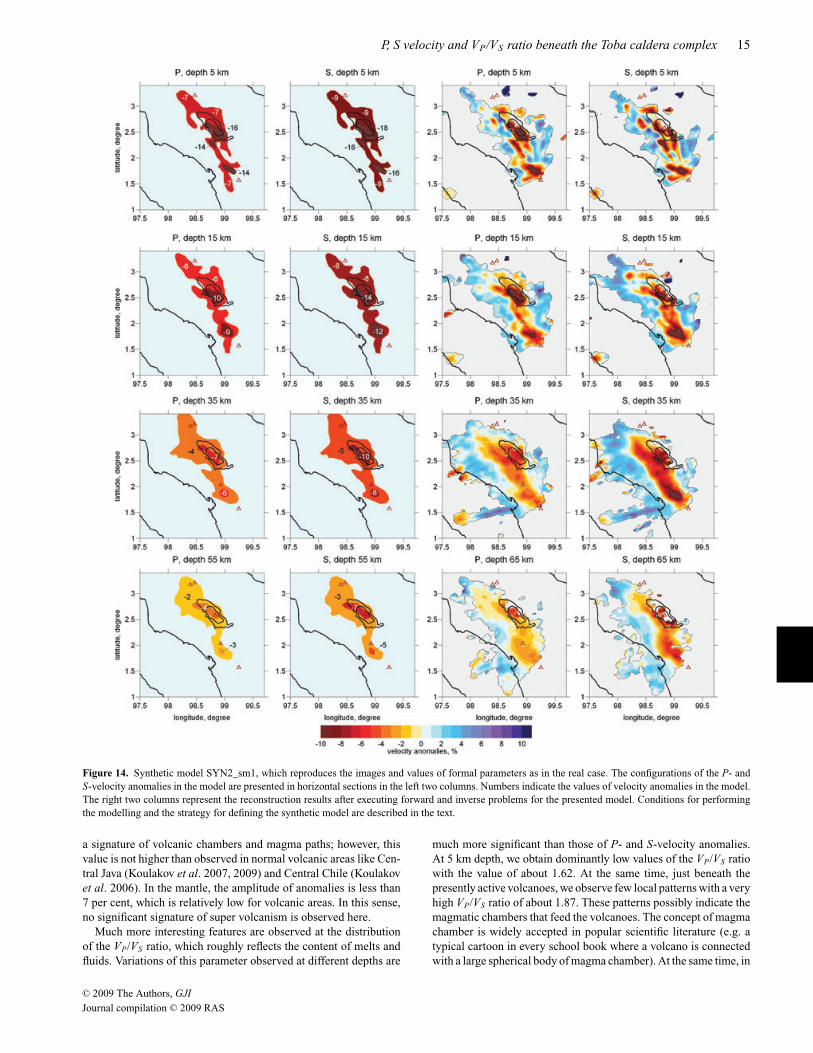
Figure 14. Synthetic model SYN2_sm1, which reproduces the images and values of formal parameters as in the real case. The configurations of the P- andS-velocity anomalies in the model are presented in horizontal sections in the left two columns. Numbers indicate the values of velocity anomalies in the model.The right two columns represent the reconstruction results after executing forward and inverse problems for the presented model. Conditions for performingthe modelling and the strategy for defining the synthetic model are described in the text.
a signature of volcanic chambers and magma paths; however, thisvalue is not higher than observed in normal volcanic areas like Cen-tral Java (Koulakov et al. 2007, 2009) and Central Chile (Koulakovet al. 2006). In the mantle, the amplitude of anomalies is less than7 per cent, which is relatively low for volcanic areas. In this sense,no significant signature of super volcanism is observed here.
Much more interesting features are observed at the distributionof the VP/VS ratio, which roughly reflects the content of melts andfluids. Variations of this parameter observed at different depths are
much more significant than those of P- and S-velocity anomalies.At 5 km depth, we obtain dominantly low values of the VP/VS ratiowith the value of about 1.62. At the same time, just beneath thepresently active volcanoes, we observe few local patterns with a veryhigh VP/VS ratio of about 1.87. These patterns possibly indicate themagmatic chambers that feed the volcanoes. The concept of magmachamber is widely accepted in popular scientific literature (e.g. atypical cartoon in every school book where a volcano is connectedwith a large spherical body of magma chamber). At the same time, in
C© 2009 The Authors, GJI
Journal compilation C© 2009 RAS
16 I. Koulakov et al.
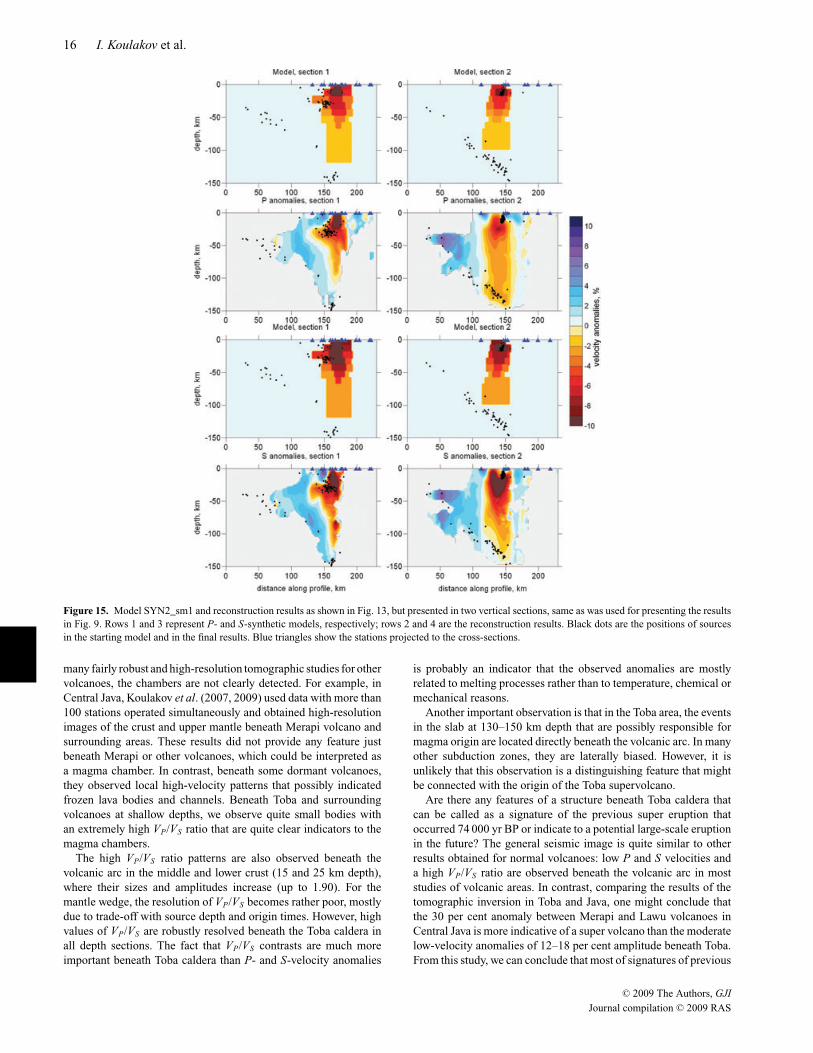
Figure 15. Model SYN2_sm1 and reconstruction results as shown in Fig. 13, but presented in two vertical sections, same as was used for presenting the resultsin Fig. 9. Rows 1 and 3 represent P- and S-synthetic models, respectively; rows 2 and 4 are the reconstruction results. Black dots are the positions of sourcesin the starting model and in the final results. Blue triangles show the stations projected to the cross-sections.
many fairly robust and high-resolution tomographic studies for othervolcanoes, the chambers are not clearly detected. For example, inCentral Java, Koulakov et al. (2007, 2009) used data with more than100 stations operated simultaneously and obtained high-resolutionimages of the crust and upper mantle beneath Merapi volcano andsurrounding areas. These results did not provide any feature justbeneath Merapi or other volcanoes, which could be interpreted asa magma chamber. In contrast, beneath some dormant volcanoes,they observed local high-velocity patterns that possibly indicatedfrozen lava bodies and channels. Beneath Toba and surroundingvolcanoes at shallow depths, we observe quite small bodies withan extremely high VP/VS ratio that are quite clear indicators to themagma chambers.
The high VP/VS ratio patterns are also observed beneath thevolcanic arc in the middle and lower crust (15 and 25 km depth),where their sizes and amplitudes increase (up to 1.90). For themantle wedge, the resolution of VP/VS becomes rather poor, mostlydue to trade-off with source depth and origin times. However, highvalues of VP/VS are robustly resolved beneath the Toba caldera inall depth sections. The fact that VP/VS contrasts are much moreimportant beneath Toba caldera than P- and S-velocity anomalies
is probably an indicator that the observed anomalies are mostlyrelated to melting processes rather than to temperature, chemical ormechanical reasons.
Another important observation is that in the Toba area, the eventsin the slab at 130–150 km depth that are possibly responsible formagma origin are located directly beneath the volcanic arc. In manyother subduction zones, they are laterally biased. However, it isunlikely that this observation is a distinguishing feature that mightbe connected with the origin of the Toba supervolcano.
Are there any features of a structure beneath Toba caldera thatcan be called as a signature of the previous super eruption thatoccurred 74 000 yr BP or indicate to a potential large-scale eruptionin the future? The general seismic image is quite similar to otherresults obtained for normal volcanoes: low P and S velocities anda high VP/VS ratio are observed beneath the volcanic arc in moststudies of volcanic areas. In contrast, comparing the results of thetomographic inversion in Toba and Java, one might conclude thatthe 30 per cent anomaly between Merapi and Lawu volcanoes inCentral Java is more indicative of a super volcano than the moderatelow-velocity anomalies of 12–18 per cent amplitude beneath Toba.From this study, we can conclude that most of signatures of previous
C© 2009 The Authors, GJI
Journal compilation C© 2009 RAS
P, S velocity and VP/VS ratio beneath the Toba caldera complex 17
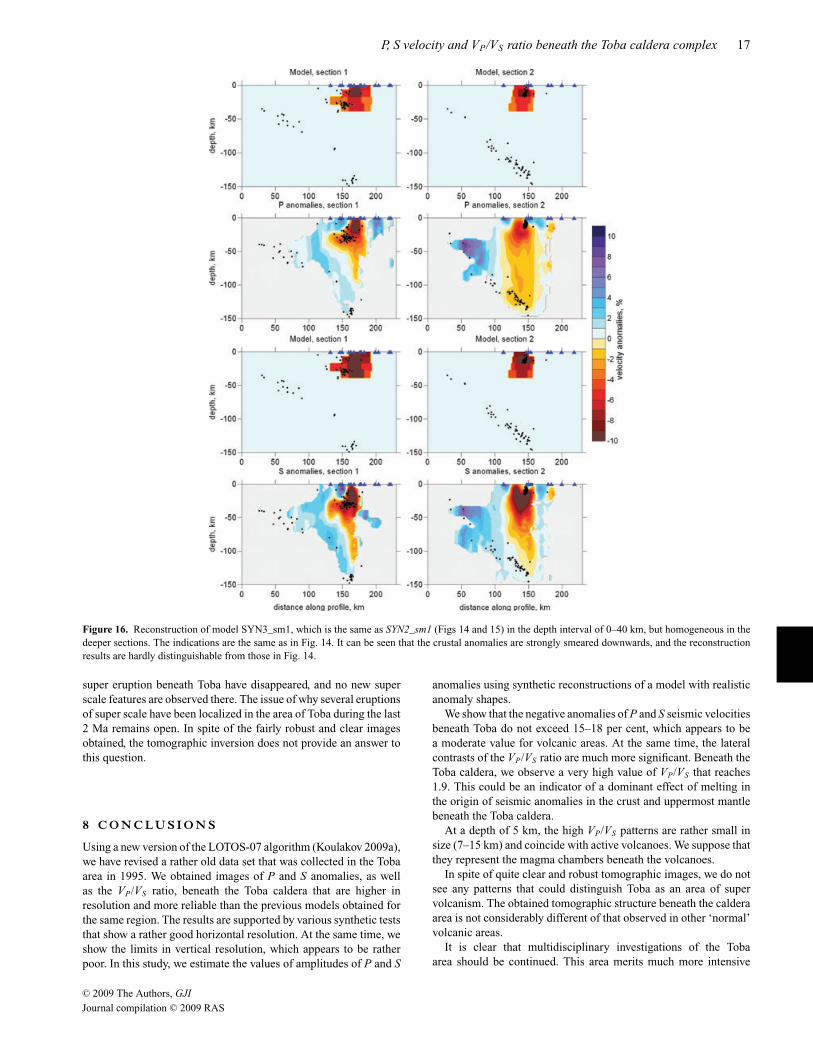
Figure 16. Reconstruction of model SYN3_sm1, which is the same as SYN2_sm1 (Figs 14 and 15) in the depth interval of 0–40 km, but homogeneous in thedeeper sections. The indications are the same as in Fig. 14. It can be seen that the crustal anomalies are strongly smeared downwards, and the reconstructionresults are hardly distinguishable from those in Fig. 14.
super eruption beneath Toba have disappeared, and no new superscale features are observed there. The issue of why several eruptionsof super scale have been localized in the area of Toba during the last2 Ma remains open. In spite of the fairly robust and clear imagesobtained, the tomographic inversion does not provide an answer tothis question.
8 C O N C LU S I O N S
Using a new version of the LOTOS-07 algorithm (Koulakov 2009a),we have revised a rather old data set that was collected in the Tobaarea in 1995. We obtained images of P and S anomalies, as wellas the VP/VS ratio, beneath the Toba caldera that are higher inresolution and more reliable than the previous models obtained forthe same region. The results are supported by various synthetic teststhat show a rather good horizontal resolution. At the same time, weshow the limits in vertical resolution, which appears to be ratherpoor. In this study, we estimate the values of amplitudes of P and S
anomalies using synthetic reconstructions of a model with realisticanomaly shapes.
We show that the negative anomalies of P and S seismic velocitiesbeneath Toba do not exceed 15–18 per cent, which appears to bea moderate value for volcanic areas. At the same time, the lateralcontrasts of the VP/VS ratio are much more significant. Beneath theToba caldera, we observe a very high value of VP/VS that reaches1.9. This could be an indicator of a dominant effect of melting inthe origin of seismic anomalies in the crust and uppermost mantlebeneath the Toba caldera.
At a depth of 5 km, the high VP/VS patterns are rather small insize (7–15 km) and coincide with active volcanoes. We suppose thatthey represent the magma chambers beneath the volcanoes.
In spite of quite clear and robust tomographic images, we do notsee any patterns that could distinguish Toba as an area of supervolcanism. The obtained tomographic structure beneath the calderaarea is not considerably different of that observed in other ‘normal’volcanic areas.
It is clear that multidisciplinary investigations of the Tobaarea should be continued. This area merits much more intensive
C© 2009 The Authors, GJI
Journal compilation C© 2009 RAS
18 I. Koulakov et al.
Figure 17. Interpretation of the results along profile 1, same as in Fig. 9. Background is the distribution of P-velocity anomalies. Yellow stars are the finallocation of events used in this study. Blue, violet and red drops mark schematically the path of ascending fluids and partially molten material. Black triangleand SF indicates the Sumatra fault.
geophysical investigations, at least at a level of those performed intwo other super volcano areas: Yellowstone and Taupo. We believethat additional information about the local seismicity, as well asincreasing the spatial resolution of the tomographic models, willreveal new features about the deeper structure beneath Toba. It willhelp to answer many open issues about the phenomena of the Tobasupervolcano, which had a global effect in the very recent historyof the Earth.
A C K N OW L E D G M E N T S
We are very grateful to Mastur Masturiono from the Meteorologicaland Geophysical Agency (BMG), Jakarta, for providing us the mostrecent version of the data set. We appreciate fruitful comments andconstructive criticism of reviewers Prof. Sri Widiyantoro and Prof.Edi Kissling and Editor, Prof. Cynthia Ebinger that helped us to im-prove the results of this study. This study of IK is supported byRussian Federation for Basic Researches (08-05-00276-a),Heimholtz Society and RFBR Joint Research Project 09-05-91321-SIG a, Multidisciplinary Projects SB RAS #21, SB-UrO-DVO RAS#96, and Project ONZ RAS #7.4.
R E F E R E N C E S
Aldiss, D.T. & Ghazali, S.A., 1984. The regional geology and evolution ofthe Toba volcano-tectonic depression, Indonesia, J. Geol. Soc. Lond., 141,487–500.
Bachmann,, O. & Bergantz,, G., 2008. The magma reservoirs that feedsupereruptions, Elements, 4(1), 17–21.
Bannister, S., Bryan, C.J. & Bibby, H.M., 2004. Shear wave velocity varia-tion across the Taupo Volcanic Zone, New Zealand, from receiver functioninversion, Geophys. J. Int., 159, 291–310.
Chesner, C.A. & Rose, W.I., 1991. Stratigraphy of the Toba tuffs and theevolution of the Toba caldera complex, Sumatra, Indonesia, Bull. Volc.,53(5), 343–356, doi:10.1007/BF00280226
Chesner, C.A., Rose, W.I., Deino, A. & Drake, R., 1991. Eruptive history ofEarth’s largest Quaternary caldera (Toba, Indonesia) clarified. Geology,19, 200–203.
Christiansen, R.L., 2001. The Quaternary and Pliocene Yellowstone plateauvolcanic field of Wyoming, Idaho, and Montana, No. 729-G, U.S. Geo-logical Survey.
DeMets, C., Gordon, R., Argus, D. & Stein, S., 1990. Current plate motions,Geophys. J. Int., 101, 425–478.
Diehl, J.F., Onstott, T.C., Chesner, C.A. & Knight, M.D., 1987. No shortreversals of Brunhes age recorded in the Toba tuffs, north Sumatra, In-donesia, Geophys. Res. Lett., 14(7), 753–756.
Eberhart-Phillips, D., 1986. Three-dimensional velocity structure in north-ern California coast ranges from inversion of local earthquake arrivaltimes, Bull. seism. Soc. Am., 76, 1025–1052.
Fauzi, McCaffrey, R., Wark, D., Sunaryo & Prih Haryadi, P.Y., 1996. Lateralvariation in slab orientation beneath Toba caldera, Geophys. Res. Lett.,23, 443–446.
Hadley, D. M., Stewart, G.J. & Ebel, J.E., 1976. Yellowstone: seis-mic evidence for a chemical mantle plume, Science, 193, 1237–1329.
Harrison, A.J. & White, R.S., 2004. Crustal structure of the Taupo volcaniczone, New Zealand: stretching and igneous intrusion, Geophys. Res. Lett.,31, L13615.
Humphreys, E.D., Dueker, K.G., Schutt, D.L. & Smith, R.B., 2000. BeneathYellowstone: evaluating plume and nonplume models using teleseismicimages of the upper mantle, GSA Today, 10, 1–7.
Husen, S., Smith, R.B. & Waite, G.P., 2004. Evidence for gas and magmaticsources beneath the Yellowstone volcanic field from seismic tomographicimaging, J. Volcanol.. Geotherm. Res., 131, 397–410.
Koulakov, I. et al., 2007. P and S velocity structure of the crust and the uppermantle beneath central Java from local tomography inversion, J. geophys.Res., 112, B08310, doi:10.1029/2006JB004712.
Koulakov, I., Sobolev, S.V. & Asch, G., 2006. P- and S-velocity images of thelithosphere-asthenosphere system in the Central Andes from local-sourcetomographic inversion, Geophys. J. Int., 167, 106–126.
Koulakov, I., 2009a. LOTOS code for local earthquake tomographic inver-sion. Benchmarks for testing tomographic algorithms, Bull. seism. Soc.Am., 99(1), 194–214, doi:10.1785/0120080013.
C© 2009 The Authors, GJI
Journal compilation C© 2009 RAS
P, S velocity and VP/VS ratio beneath the Toba caldera complex 19
Koulakov, I., 2009b. Out-of-network events can be of great importance forimproving results of local earthquake tomography, Bull. seism. Soc. Am.,,submitted, available at: www.ivan-art.com/science/PAPERS/gap.pdf.
Koulakov, I., Jakovlev, A. & Luhr, B., 2009. Anisotropic structure be-neath Central Java from local earthquake tomography, Geochem. Geo-phys. Geosyst., 10, Q02011, doi:10.1029/2008GC002109.
Masturyono, McCaffrey, R., Wark, D.A., Roecker, S.W., Fauzi, Ibrahim,G. & Sukhyar, 2001. Distribution of magma beneath Toba caldera, NorthSumatra, Indonesia, constrained by 3-dimensional P-wave velocities, seis-micity, and gravity data, Geochemistry, Geophys Geosyst. 2.
Miller, D.S. & Smith, R.B., 1999. P and S velocity structure of the Yellow-stone volcanic field from local earthquake and controlled source tomog-raphy, J. geophys. Res., 104, 15105–15121.
Nakajima, J., Matsuzawa, T., Hasegawa, A. & Zhao, D., 2001. Three-dimensional structure of Vp, Vs and Vp/Vs beneath northeastern Japan:implication for arc magmatism and fluids, J. geophys. Res., 106, 21843–21857.
Ninkovich, D., Shackleton, N.J., Abdel-Monem, A.A., Obradovich, J.D. &Izett, G., 1978. K-Ar age of the late Pleistocene eruption of Toba, northSumatra. Nature, 276, 574–577.
Nishimura, S., Abe, E., Yokoyama, T., Wirasantosa, S. & Dharma, A., 1977.Danau Toba-the outline of Lake Toba, North Sumatra, Indonesia. Pale-olimnol. Lake Biwa Japanese Pleistocene, 5, 313–332.
Nolet, G., 1981. Linearized inversion of (teleseismic) data, in The Solution ofthe Inverse Problem in Geophysical Interpretation, pp. 9–37, ed. Cassinis,R. Plenum, New York, USA.
Paige, C.C. & Saunders, M.A., 1982. LSQR: an algorithm for sparse linearequations and sparse least squares, ACM Trans. Math. Soft., 8, 43–71.
Poli, S. & Schmidt, M.W., 1995. H2O transport and release in subductionzones: experimental constrains on basaltic and andesitic systems, J. geo-phys. Res., 100, 22 299–22 314.
Pulunggono, A. & Cameron, N. R., 1984. Sumatran microplates, their char-acteristics and their role in the evolution of the Central and South Sumatrabasins, in Proceedings of the Indonesian Petroleum Association, Vol. 13,pp. 121–143.
Reyners, M., Eberhart-Phillips, D., Stuart, G. & Nishimura, Y., 2006. Imag-ing subduction from the trench to 300 km depth beneath the central NorthIsland, New Zealand, with Vp and Vp/Vs, Geophys. J. Int., 165, 565–583,doi:10.1111/j.1365-246X.2006.02897.x.
Rogan, M., 1982. A geophysical study of the Taupo volcanic zone NewZealand, J. geophys. Res., 87(B5), 4073–4088.
Rose, W.I. & Chesner, C.A., 1987. Dispersal of ash in the great Toba erup-tion, 75 ka. Geology, 15, 913–917.
Sherburn, S., Bannister, S. & Bibby, H., 2003. Seismic velocity structureof the central Taupo Volcanic Zone, New Zealand, from local earthquaketomography, J. Volc. Geotherm. Res., 122, 69–88.
Simkin, T. & Siebert, L., 1994. Volcanoes of the World, 2nd edn, GeosciencePress in association with the Smithsonian Institution Global VolcanismProgram, Tucson AZ, 368 p.
Smith, R.L. & Bailey, R.A., 1968. Resurgent cauldrons, in Studies in Vol-canology, (A memoir in honor of Howel Williams), Geol. Soc. AmericaMem. V., 116, 613–662
Soengkono, S., 1994. A magnetic model for deep plutonic bodies beneaththe central Taupo Volcanic Zone, North Island, NZ J. Volc. Geotherm.Res., 68, 193–207.
Steckler, M.S., Akhter, S.H. & Seeber, L., 2008. Collision of the Ganges–Brahmaputra Delta with the Burma Arc: implications for earthquakehazard, Earth planet Sci. Lett., 273, 367–378.
Um, J. & Thurber, C., 1987. A fast algorithm for two-point seismic raytracing, Bull. seism. Soc. Am., 77, 972–986.
Van Bemmelen, R.W., 1949. The geology of Indonesia, in General Geologyof Indonesia and Adjacent Archipelagos, Vol. 1A. Government PrintingOffice, The Hague, The Netherlands, 732 pp.
Van der Sluis, A. & van der Vorst, H.A., 1987. Numerical solutionof large, sparse linear algebraic systems arising from tomographicproblems, in Seismic Tomography, pp. 49–83, ed. Nolet, G., Reidel,Dordrecht.
Waite, G.P., Smith, R.B. & Allen, R.M., 2006. VP and VS structure of theYellowstone hot spot: evidence for an upper mantle plume, J. geophys.Res., 111, B04303, doi:10.1029/2005JB003867.
Wilson, C.J.N., Blake, S., Charlier, B.L.A. & Sutton, A.N., 2006. The 26.5ka Oruanui eruption, Taupo volcano, New Zealand: development, char-acteristics and evacuation of a large rhyolite magma body, J. Petrol., 47,35–69.
S U P P O RT I N G I N F O R M AT I O N
Additional Supporting Information may be found in the online ver-sion of this article:
Figure S1. Test for checking the vertical and horizontal resolutionin the NW–SE direction for the S velocity anomalies.
Please note: Wiley-Blackwell are not responsible for the content orfunctionality of any supporting materials supplied by the authors.Any queries (other than missing material) should be directed to thecorresponding author for the article.
C© 2009 The Authors, GJI
Journal compilation C© 2009 RAS