Embed Size (px)
Citation preview

Relationships of Meal and Recess Schedules to
Plate Waste in Elementary Schools
National Food Service Management Institute The University of Mississippi
NFSMI Item Number R-71-03
2003
This publication has been produced by the National Food Service Management Institute-Applied Research Division, located at The University of Southern Mississippi with headquarters at The University of Mississippi. Funding for the Institute has been provided with Federal funds from the U.S. Department of Agriculture, Food and Nutrition Service, to The University of Mississippi. The contents of this publication do not necessarily reflect the views or policies of The University of Mississippi or the U.S. Department of Agriculture, nor does mention of trade names, commercial products, or organizations imply endorsement by the U.S. Government. The National Food Service Management Institute complies with all applicable laws regarding affirmative action and equal opportunity in all its activities and programs and does not discriminate against anyone protected by law because of age, color, disability, national origin, race, religion, sex, or status as a veteran or disabled veteran.

National Food Service Management Institute The University of Mississippi
Building the Future Through Child Nutrition
PURPOSE The National Food Service Management Institute (NFSMI) was authorized by Congress in 1989 and established in 1990 at The University of Mississippi in Oxford. The Institute operates under a grant agreement with the United States Department of Agriculture, Food and Nutrition Service. The purpose of NFSMI is to improve the operation of Child Nutrition Programs through research, education and training, and information dissemination. The Administrative Offices and Divisions of Technology Transfer and Education and Training are located in Oxford. The Division of Applied Research is located at The University of Southern Mississippi in Hattiesburg. MISSION The mission of the National Food Service Management Institute is to provide information and services that promote the continuous improvement of Child Nutrition Programs. VISION The vision of the National Food Service Management Institute is to be the leader in providing education, research, and resources to promote excellence in Child Nutrition Programs. Administrative Offices Applied Research Division Education and Training Division The University of Southern Mississippi Technology Transfer Division 118 College Drive #10077 The University of Mississippi Hattiesburg, MS 39406-0001 6 Jeanette Phillips Drive Phone: 601-266-5773 P.O. Drawer 188 Fax: 888-262-9631 University, MS 38677-0188 Phone: 800-321-3054 Fax: 800-321-3061
www.nfsmi.org

Acknowledgments
WRITTEN AND DEVELOPED BY
Ethan A. Bergman, PhD, RD, CD, FADA Professor of Food Science and Nutrition
Central Washington University
Nancy S. Buergel, MS, RD, CD Associate Professor of Food Science and Nutrition
Central Washington University
Annaka Femrite, RD Graduate Student
Central Washington University
Timothy F. Englund, PhD Assistant Professor of Mathematics
and
With special assistance from Michael R. Braunstein, PhD
Associate Professor of Physics
PROJECT COORDINATOR Deborah H. Carr, PhD, RD
EXECUTIVE DIRECTOR Charlotte B. Oakley, PhD, RD, FADA

TABLE OF CONTENTS
Executive Summary ...................................................................................................................... 1 Literature Review.......................................................................................................................... 3 Purpose of the Study ..................................................................................................................... 5 Methods......................................................................................................................................... 6 Results...........................................................................................................................................10 Discussion.....................................................................................................................................23 Conclusions...................................................................................................................................25 Recommendations.........................................................................................................................26 References.....................................................................................................................................28
LIST OF TABLES
Table 1: Elementary School Recess Placement, Lunch Schedule, Length of Lunch, and Free and Reduced Eligibility Rate ................................................................................. 6 Table 2: Mean Amount of Food Offered, Eaten, and Wasted for All Students, Males and Females in Grades 3-5 by Recess ..................................................................................10 Table 3: Mean Amount of Nutrients Offered by Recess..............................................................11 Table 4: Mean Amount of Macronutrients Consumed for All Students in Grades 3-5 by Recess ............................................................................................................................12 Table 5: Mean Amount of Macronutrients Consumed for Males in Grades 3-5 by Recess ........13 Table 6: Mean Amount of Macronutrients Consumed for Females in Grades 3-5 by Recess.....13 Table 7: Mean Amount of Vitamins and Minerals Consumed for All Students, Males and Females in Grades 3-5 by Recess ..................................................................................15 Table 8: Mean Amount of Fiber, Cholesterol, and Sodium Consumed for All Students, Males and Females in Grades 3-5 by Recess............................................................................16 Table 9: Mean Amount of Food Offered, Eaten, and Wasted for All Students, Males and Females in Grades 3-5 by Length of Lunch...................................................................17 Table 10: Mean Amount of Nutrients Offered by Length of Lunch............................................18 Table 11: Mean Amount of Macronutrients Consumed for All Students in Grades 3-5 by Length of Lunch...........................................................................................................19 Table 12: Mean Amount of Macronutrients Consumed for Males in Grades 3-5 by Length of Lunch ...........................................................................................................................19 Table 13: Mean Amount of Macronutrients Consumed for Females in Grades 3-5 by Length of Lunch .......................................................................................................................20 Table 14: Mean Amount of Vitamins and Minerals Consumed for All Students, Males and Females in Grades 3-5 by Length of Lunch.................................................................21 Table 15: Mean Amount of Fiber, Cholesterol, and Sodium Consumed for All Students, Males and Females in Grades 3-5 by Length of Lunch...........................................................22
Relationships of Meal and Recess Schedules to Plate Waste in Elementary Schools 1
Relationships of Meal and Recess Schedules to
Plate Waste in Elementary Schools
EXECUTIVE SUMMARY
The results of this study clearly demonstrate that there are at least two factors that have
an impact on nutrient consumption of elementary school children receiving school lunch. One of
these is the placement of recess relative to the lunch period. The students who received recess
before lunch consumed significantly more food and nutrients than those who had recess after
lunch. Food waste decreased from 40.1% to 27.2% when recess was scheduled before lunch.
These results are similar to those in an earlier study (Getlinger, Laughlin, Bell, Akre, &
Arjmandi, 1996) that reported food waste decreased from 34.9% to 24.3% when recess was
scheduled before lunch. This is a major concern because the results from the School Health
Policies and Programs Study (Wechsler, Brener, Kuester, & Miller, 2001) showed that
elementary schools are more likely to schedule recess immediately after lunch rather than before
lunch. Only 4.6% of schools reported scheduling recess immediately before lunch.
The total time children have to eat lunch is also an important factor in the amount of food
and nutrients consumed. Children who received a 30-minute lunch period consumed significantly
more food and nutrients (except vitamin C) than those who received the 20-minute lunch period.
Results of previous studies have shown that waiting in the service line may have a significant
negative impact on the amount of time available for children to eat (Bergman, Buergel,
Enamuthu, & Sanchez, 2000; Conklin & Lambert, 2001). Consumption time, defined as the
actual time a student is engaged in food consumption, increases when children have more time to
eat (Buergel, Bergman, Knutson, & Lindass, 2002).
Relationships of Meal and Recess Schedules to Plate Waste in Elementary Schools 2
Changing the lunch period so that elementary schools offer lunch after recess and provide
adequate time to eat may result in less total plate waste and better consumption of nutrients by
students. Both of these are desired outcomes because better nutrient consumption by students
may enhance learning, especially among those who qualify for free and reduced lunches. These
students may not receive another well-balanced meal during the day. Less plate waste is also a
desired outcome because this is a more prudent use of resources.
More investigations are required to determine:
• the time needed for the lunch period in a wide range of elementary school settings,
and
• if calories and nutrients consumed at lunch play a role in readiness to learn, especially
in the afternoon hours of instruction.
Relationships of Meal and Recess Schedules to Plate Waste in Elementary Schools 3
Literature Review
The National School Lunch Program (NSLP) plays an essential role in the lives of many
school-aged children. Currently, about 99,000 schools and residential child care facilities
participate in the National School Lunch Program, which provides nutritionally sound lunches to
about 25 million children each school day (U.S. Department of Agriculture School [USDA]
Lunch Program, 2003).
Because school-aged children are in a time of rapid growth and development, it is very
important that they are provided with meals to help meet their physical, social, and emotional
needs. Students who participate in the NSLP have better nutrient intakes than students who eat
elsewhere including students who bring lunch from home, eat from vending machines, or eat off
campus (Gordon, Devaney, & Burghardt, 1995; Rainville, 2001). Additionally, a significant
relationship between nutrition and a child’s ability to learn has been established (Troccoli, 1993).
Environmental factors, which may influence consumption of lunch, include the amount
of time children have to eat, the time of day the lunch is served, and the placement of recess in
relation to the lunch period. In order for children to receive the nutritional benefits of school
lunch, they must have adequate time to consume it.
The placement of recess in relation to the lunch period has been shown to have an
important impact on the amount of food consumed by elementary children. In a study examining
the placement of recess in relation to the lunch period, Getlinger, et al. (1996) showed plate
waste decreased from 34.9% to 24.3% when recess was scheduled before lunch rather than after
lunch in elementary school grades 1-3. Similar studies investigating the placement of recess
in relationship to the lunch period have demonstrated comparable results (Read & Moosburner,
1985; Ruppenthal & Hogue, 1977; Smith, 1980).

Relationships of Meal and Recess Schedules to Plate Waste in Elementary Schools 4
The results of the School Health Policies and Programs Study (SHPPS, 2000)
demonstrated that almost one-fifth of schools gave students less than 20 minutes to eat lunch.
Approximately one-fourth of schools started serving lunch before 11:00 a.m.and one-eighth
served lunch after 1:00 p.m. (Wechsler, et al., 2001).
Previous studies examining the amount of time children have to eat lunch have shown
that elementary school children may spend much of their lunch time waiting in line for service,
which could significantly decrease their available time to eat (Bergman, Buergel, Enamuthu, &
Sanchez, 2000; Buergel, Bergman, Knutson, & Lindass, 2002). The length of the lunch period
and the amount of time spent waiting in line have also been identified as significant factors in
students’ participation in the school lunch program (Mauer, 1984).
In a survey of public school cafeteria managers, one-fourth mentioned plate waste as
being at least a moderate problem, particularly in elementary schools. Attention to recess, free
time, or socializing rather than eating were cited as factors related to increased plate waste (U.S.
General Accounting Office [USGAO], 1996). The School Nutrition Dietary Assessment Study
(SNDA-II) (USDA, Food and Nutrition Service [FNS], 2001) estimated that about 12 percent of
calories from food offered by the NSLP was wasted, with an estimated direct economic loss of
$5.49 billion (Burghardt & Devaney, 1993; Buzby & Gutherie, 2002). Plate waste in the NSLP
varies by food type, with fruits and vegetables being wasted more than other meal components
(USGAO, 1996).

Relationships of Meal and Recess Schedules to Plate Waste in Elementary Schools 5
Purpose of the Study
The purpose of this study was to determine the impact of the placement of lunch in the
school day relative to recess and the length of the lunchtime on nutrient consumption of upper
elementary students in the third through fifth grades. A plate waste study was conducted in four
elementary schools in the Central Washington area to measure the amount of food wasted and
nutrients consumed by the children.

Relationships of Meal and Recess Schedules to Plate Waste in Elementary Schools 6
Methods
Plate waste was collected for a ten-day period in each of the four elementary schools for
grades 3-5. The four elementary schools were chosen specifically for the placement of the lunch
periods. Two schools had recess before lunch and two schools had recess after lunch (Table 1).
Table 1 Elementary School Recess Placement, Lunch Schedule, Length of Lunch, and Free and Reduced Eligibility Rate Elementary School Recess Schedule Lunch Start
Time Length of
Lunch (Min)Free and Reduced
Eligibility Rate (%) School 1 After Lunch 11:30 a.m. 30 89 School 2 Before Lunch 12:30 p.m. 30 86 School 3 Before Lunch 12:40 p.m. 20 93 School 4 After Lunch 12:30 p.m. 30 86
Students in the study all ate in a common cafeteria, which included one single serving
line with the exception of School 3, which had two serving lines after the single line check-in.
Some elementary students ate in their classrooms on designated days. Students who ate in their
classrooms were not included in the study.
Central Washington University Human Subjects Review Committee approved the study
prior to the selection of the subjects. Handouts describing the purpose of the study were sent
home prior to the beginning of the study at each school. The handouts were written in both
English and Spanish. Parents who did not wish to have their child involved in the study had the
option of asking their child to refrain from study participation. Students who elected not to
participate were instructed to put their disposable tray in the garbage containers and bypass the
area where the researchers were collecting trays.
Relationships of Meal and Recess Schedules to Plate Waste in Elementary Schools 7
Research assistants were recruited from Central Washington University and Yakima
Valley Community College to help with data collection. The research assistants were trained in
the plate waste procedures prior to data collection.
Two Ohaus CT1200 Portable Digital gram scales were used to determine plate waste in
grams. The computer software program used for data entry was LabVIEW 6i (2000). Central
Washington University Physics Professor, Dr. Michael Braunstein developed and programmed
LabVIEW with instructions necessary for data collection. Two laptop computers (Dell
Inspiration 3200 D266XT TS30H and IBM ThinkPad 380XD) connected to the Ohaus digital
gram scales were used during the data collection process. A Microsoft Excel spreadsheet was
developed that contained the menu items offered each day in the five-day cycle of data
collection. At the conclusion of the data collection, all Excel spreadsheets were linked to
determine nutrient consumption and plate waste using the relational database Microsoft Access.
The nutrient content of foods offered during the study was measured using Nutrikids (2001).
At the start of each lunch period, three to five servings of each pre-portioned menu item
were measured using the gram scale and an average weight of each food item was obtained and
recorded. The scales were read and data recorded to 0.1-gram increments. The two laptop
computers with the Lab View program were set up and connected to each digital gram scale.
Each menu item was entered into Lab View to be weighed at the end of the lunch period.
Because data were collected in the same school district for four ten-day periods, the same
menu items were not served on the same days of the week at each of the schools. This resulted in
students receiving a slightly different nutrient intake from school to school. For this reason, the
percent of nutrients offered was also calculated using the following formula:
Amount of nutrients consumed Amount of nutrients offered x 100 = percent nutrients consumed
Relationships of Meal and Recess Schedules to Plate Waste in Elementary Schools 8
The same menu cycle was used throughout the study period so many of the daily menus offered
were similar between each of the schools during the study periods.
Paper lunch trays were used for the study. The trays were numbered using a felt tip pen.
Student identification numbers were received from a master list provided by school
administration. For each tray, the student’s assigned tray number was matched with the student’s
personal identification number on the master copy. At the beginning of each lunch period two
research assistants dispensed the numbered trays as the students entered the lunch line. At the
conclusion of the meal, the students brought their trays to the disposal area for collection. After
all trays were collected, the research assistants collected plate waste data using the following
procedures:
Step 1: The student number that corresponded to the tray number was entered into the
Lab View program for each tray weighed.
Step 2: When prompted by the research assistant operating the computer, a second
research assistant placed the individual menu item on the top loading digital scale in a
plastic weighing container.
Step 3: The weight of the menu item was automatically entered into the Lab View
program spreadsheet.
Steps 2-3 were repeated for each menu item included in the school lunch. At the end of
the collection day, the data were saved into Microsoft Excel 2000 spreadsheet.
Data were analyzed by linking the gram total weights and nutrient totals for each menu
item on the Excel spreadsheets using Microsoft Access 2000. The spreadsheet was designed to
calculate the percentage of each item consumed using the following equation:

Relationships of Meal and Recess Schedules to Plate Waste in Elementary Schools 9
Amount of food wasted (g) Amount of food served (g) x 100 = percentage food waste By linking the two spreadsheets, nutrient consumption for each item for calories and
the following nutrients was determined: carbohydrate, protein, fat, saturated fat, fiber, vitamin C,
vitamin A, and iron. A spreadsheet containing demographic data (gender, age, grade level, and
free or reduced price meal status) obtained from school administration that corresponded to the
individual student’s personal identification number was linked to the Excel spreadsheet that
contained the gram totals of plate waste for each student. Only student identification numbers
linked to the demographic data were used, not student names. Student confidentiality was
maintained throughout the study.
Differences in placement of recess related to lunch and the length period were analyzed
regarding the amount of nutrients consumed using analysis of variance (ANOVA). Fisher’s
PLSD post hoc tests were completed on those nutrients where a significant F-value was
calculated with ANOVA to determine where significant differences existed (p < 0.05).
Percentages of calories from carbohydrate, protein, total fat, and saturated fat consumed were
analyzed in relation to recess placement, length of the lunch period, gender, grade level, and free
or reduced status using Fisher’s PLSD.

Relationships of Meal and Recess Schedules to Plate Waste in Elementary Schools 10
Results
Placement of Recess and Nutrient Consumption
Table 2 shows the grams of food consumed and wasted for Schools 2 and 4. Both
schools had a 30-minute lunch period, which began at 12:30 p.m. Students in School 2 received
a 30-minute recess prior to lunch, and the students in School 4 received a 30-minute recess after
lunch. Results show that for all children, the grams of food eaten were significantly greater and
the amount of food wasted was significantly lower when recess was scheduled before lunch
(p<0.0001). Overall food waste decreased from 40.1% to 27.2% when recess was scheduled
before lunch.
Table 2 Mean Amount of Food Offered, Eaten, and Wasted for All Students, Males and Females in Grades 3-5 by Recess Recess Before Lunch
School 2 Recess After Lunch
School 4 All Students Grades 3-5 N=1119 N=889 Amount of food offered (g) 568.8 + 52.2 565.3 + 71.5 Grams of food eaten 410.9 + 103.2* 330.7 + 121.8 % of offered that was eaten 72.8 + 18.2* 59.9 + 21.5 Grams of food wasted 156.6 + 108.1* 223.1 + 122.9 % of offered that was wasted 27.2 + 18.2* 40.1 + 21.5 Males Grades 3-5 N=548 N=360 Grams of food eaten 424.4 + 98.8* 343.4 + 121.7 % of offered that was eaten 75.1 + 17.4* 62.1 + 21.5 Grams of food wasted 143.0 + 102.8* 211.0 + 122.5 % of offered that was wasted 24.9 + 17.4* 37.9 + 21.5 Females Grades 3-5 N=571 N=529 Grams of food eaten 397.9 + 105.6* 322.0 + 121.3 % of offered that was eaten 70.5 + 18.7* 58.3 + 21.3 Grams of food wasted 169.6 + 111.6* 231.4 + 122.7 % of offered that was wasted 29.5 + 18.7* 41.7 + 21.3 All values are mean + standard deviation. N represents number of lunch trays measured. *Two-sample t-test indicated significant difference compared to recess after lunch, p<0.0001.
Relationships of Meal and Recess Schedules to Plate Waste in Elementary Schools 11
Table 3 Mean Amount of Nutrients Offered by Recess
Nutrients Recommended Nutrient Levels for School
Lunch Grades K-6#
Recess Before Lunch School 2
Recess After Lunch School 4
Calories 664 622.4 + 118.6 652.9 + 106.9 Carbohydrate (g) >91a 89.2 + 17.3 88.6 + 22.1 Protein (g) 10 27.8 + 4.6 30.5 + 4.7 Total Fat (g) ≤22b 16.8 + 4.9 19.4 + 6.3 Saturated Fat (g) ≤7b 5.8 + 2.2 5.7 + 1.7 Vitamin A (RE) 224 458.5 + 417.9 384.9 + 291.4 Vitamin C (mg) 15 17.5 + 18.3 27.7 + 25.1 Iron (mg) 3.5 3.8 + 0.9 3.7 + 1.1 Cholesterol (mg) 100 40.5 + 11.6 54.2 + 26.3 Calcium (mg) 286 465.9 + 108.5 421.4 + 130.7 Fiber (g) Not Specified 5.6 + 1.8 6.5 + 3.0 Sodium (mg) <800 1366.4 + 319.3 1304.1 + 371.7
#United States Department of Agriculture, Food and Nutrition Service (2001). a>55% of total calories. b<30 % of calories from fat and 10% calories from saturated fat All values are mean + standard deviation. Means are derived from 10 days of lunches served at each school.
Table 3 provides the recommended nutrient levels required for meals following the
National School Lunch Program guidelines. The amount of nutrients offered for each of the two
schools is also outlined in Table 3.
Tables 4 through 7 show the differences in nutrients consumed for all students combined
and for males and females separately in both schools. Tables 4, 5, and 6 show the difference in
macronutrients consumed for both schools for all students and for male and female students
separately. The intake of calories and all macronutrients (grams of fat, saturated fat,
carbohydrate, and protein) expressed as a percentage offered was significantly greater for all
students when recess was scheduled before lunch (p<0.0001). The percent intake was also
greater for males and females separately when recess was scheduled before lunch (p<0.0001).
However, the total grams of protein consumed were not significantly different when comparing
all students, and males and females with lunch before or after recess.
Relationships of Meal and Recess Schedules to Plate Waste in Elementary Schools 12
The total grams of fat consumed was significantly less for all students and male students
individually who had recess before lunch, although the percent fat consumed was significantly
higher for these students. The amount of fat offered to students who had recess before lunch was
about 17 grams versus over 19 grams for students who had recess after lunch. For all students
and for male students separately, when recess was scheduled after lunch, their fat consumption
was significantly higher (p<0.01 and p<0.05, respectively, Tables 4 and 5). Even though this was
analyzed as a significant difference, it represents less than one gram of fat, which is a trivial
amount when factored into the total day. There was no significant difference in the total fat
consumed by the female students between the two schools. Although the students who had recess
before lunch received fat in their diet, they consumed a significantly higher percentage of the fat
offered (86.2% versus 77.6%).
Table 4 Mean Amount of Macronutrients Consumed for All Students in Grades 3-5 by Recess
Nutrients Recess Before Lunch School 2
Recess After Lunch School 4
All Students Grades 3-5 N=1119 N=889 Calories 503.3 + 133.0** 463.5 + 153.5 Calories (% of offered) 81.1 + 16.8** 71.5 + 20.5 Total Fat (g) 14.3 + 4.9 14.9 + 5.9† Total Fat (% of offered) 86.2 + 18.3** 77.6 + 22.3 Saturated Fat (g) 4.9 + 2.1** 4.2 + 1.8 Saturated Fat (% of offered) 85.4 + 18.8** 75.0 + 24.9 Carbohydrate (g) 70.7 + 19.9** 59.8 + 26.0 Carbohydrate (% of offered) 79.3 + 18.1** 69.2 + 20.7 Protein (g) 22.1 + 6.2 21.6 + 7.2 Protein (% of offered) 79.9 + 18.2** 68.9 + 22.2 All values are mean + standard deviation. N represents number of lunch trays measured over a 10-day observation period. * Two-sample t-test indicated significant difference compared to recess after lunch, p<0.0001. *† Two-sample t-test indicated significant difference compared to recess before lunch, p<0.01.

Relationships of Meal and Recess Schedules to Plate Waste in Elementary Schools 13
Table 5 Mean Amount of Macronutrients Consumed for Males in Grades 3-5 by Recess
Nutrients Recess Before Lunch School 2
Recess After Lunch School 4
Males Grades 3-5 N=548 N=360 Calories 510.3 + 132.1** 484.8 + 154.1 Calories (% of offered) 82.4 + 16.7*** 74.2 + 20.4 Total Fat (g) 14.4 + 4.8 15.6 + 6.0† Total Fat (% of offered) 87.1 + 17.9*** 79.8 + 22.0 Saturated Fat (g) 4.9 + 2.0*** 4.4 + 1.8 Saturated Fat (% of offered) 86.3 + 18.2*** 77.8 + 24.3 Carbohydrate (g) 71.6 + 20.0*** 62.9 + 26.6 Carbohydrate (% of offered) 80.5 + 18.4 *** 72.2 + 20.7 Protein (g) 22.7 + 6.1 22.4 + 7.0 Protein (% of offered) 82.0 + 17.3*** 71.3 + 21.6 All values are mean + standard deviation. N represents number of lunch trays measured over a 10-day observation period. *** Two-sample t-test indicated significant difference compared to recess after lunch, p<0.0001. ** Two-sample t-test indicated significant difference compared to recess after lunch, p<0.05. † Two-sample t-test indicated significant difference compared to recess after lunch, p<0.005 Table 6 Mean Amount of Macronutrients Consumed for Female in Grades 3-5 by Recess
Nutrients Recess Before Lunch School 2
Recess After Lunch School 4
Females Grades 3-5 N=571 N=529 Calories 496.5 + 133.6* 449.1 + 151.5 Calories (% of offered) 79.8 + 16.9* 69.7 + 20.4 Total Fat (g) 14.2 + 4.9 14.5 + 5.7 Total Fat (% of offered) 85.3 + 18.7* 76.1 + 22.5 Saturated Fat (g) 4.9 + 2.1* 4.0 + 1.8 Saturated Fat (% of offered) 84.6 + 19.3* 73.2 + 25.2 Carbohydrate (g) 69.9 + 19.8* 57.7 + 25.4 Carbohydrate (% of offered) 78.1 + 17.7* 67.1 + 20.4 Protein (g) 21.6 + 6.3 21.0 + 7.3 Protein (% of offered) 77.9 + 18.8* 67.2 + 22.4 All values are mean + standard deviation. N represents number of lunch trays measured over a 10-day observation period. * Two-sample t-test indicated significant difference compared to recess after lunch, p<0.0001.
Relationships of Meal and Recess Schedules to Plate Waste in Elementary Schools 14
Table 7 shows the amounts of vitamins and minerals consumed (vitamin A and C, iron,
and calcium) for all students combined and for male and female students separately. With the
exception of vitamin C, the consumption of vitamins and minerals was significantly greater when
recess occurred before lunch. Calcium intake was 36% higher for those students who had recess
before lunch (390.0 mg versus 252.4 mg).
For all students and for male and female students separately, when recess was scheduled
after lunch, vitamin C consumption was significantly greater. The students who had recess after
lunch were offered more vitamin C containing foods than the students having recess before lunch
(27.7 grams versus17.5 grams, respectively). This occurred because of the differences in the
menu items offered between the two schools. During the 10-day data collection period, the
school with recess after lunch received a whole orange, which resulted in the difference.
The amounts of fiber and sodium consumed were significantly greater for students when
recess occurred before lunch (Table 8). The amount of cholesterol consumed was significantly
higher for students with recess after lunch although the percent consumed was significantly
lower (Table 8). Students were offered similar amounts of fiber and sodium in both schools.
However, the amount of sodium offered was greater than recommended (1366 mg and 1304 mg
versus the less than 800 mg that was recommended).
Relationships of Meal and Recess Schedules to Plate Waste in Elementary Schools 15
Table 7 Mean Amount of Vitamins and Minerals Consumed for All Students, Males and Females in Grades 3-5 by Recess
Nutrients Recess Before Lunch School 2
Recess After Lunch School 4
All Students Grades 3-5 N=1119 N=889 Iron (mg) 3.1 + 1.0*** 2.7 + 1.2 Iron (% of offered) 82.1 + 20.4*** 73.6 + 26.2 Calcium (mg) 340.9 + 138.0*** 252.4 + 149.5 Calcium (% of offered) 73.1 + 24.1*** 57.9 + 29.4 Vitamin A (RE) 249.2 + 269.7** 219.8 + 175.7 Vitamin A (% of offered) 63.7 + 29.5*** 57.6 + 27.6 Vitamin C (mg) 10.7 + 9.4 13.0 + 13.9††† Vitamin C (% of offered) 69.5 + 21.1*** 53.4 + 27.6 Males Grades 3-5 N=548 N=360 Iron (mg) 3.1 + 1.0*** 2.8 + 1.2 Iron (% of offered) 82.6 + 20.6*** 76.7 + 24.4 Calcium (mg) 355.1 + 134.7*** 263.7 + 148.6 Calcium (% of offered) 76.4 + 22.4*** 60.6 + 28.7 Vitamin A (RE) 258.5 + 275.9* 222.6 + 176.7 Vitamin A (% of offered) 66.8 + 28.4*** 59.2 + 27.3 Vitamin C (mg) 10.6 + 9.1 13.4 + 14.1† Vitamin C (% of offered) 70.7 + 21.1*** 54.8 + 28.6 Females Grades 3-5 N=571 N=529 Iron (mg) 3.1 + 1.0*** 2.6 + 1.2 Iron (% of offered) 81.8 + 20.2*** 71.4 + 25.6 Calcium (mg) 327.2 + 139.8*** 244.7 + 149.8 Calcium (% of offered) 69.9 + 25.1*** 56.0 + 29.7 Vitamin A (RE) 240.2 + 263.5 217.9 + 175.1 Vitamin A (% of offered) 60.8 + 30.3* 56.5 + 27.7 Vitamin C (mg) 10.7 + 9.7 12.8 + 13.7† Vitamin C (% of offered) 68.4 + 21.1*** 52.4 + 26.9 All values are mean + standard deviation. N represents number of lunch trays measured over a 10-day observation period. ***Two-sample t-test indicated significant difference compared to recess after lunch, p<0.0001. **Two-sample t-test indicated significant difference compared to recess after lunch, p<0.001 *Two-sample t-test indicated significant difference compared to recess after lunch, p<0.05 ††† Two-sample t-test indicated significant difference compared to recess before lunch, p<0.0001 † Two-sample t-test indicated significant difference compared to recess before lunch, p<0.01
Relationships of Meal and Recess Schedules to Plate Waste in Elementary Schools 16
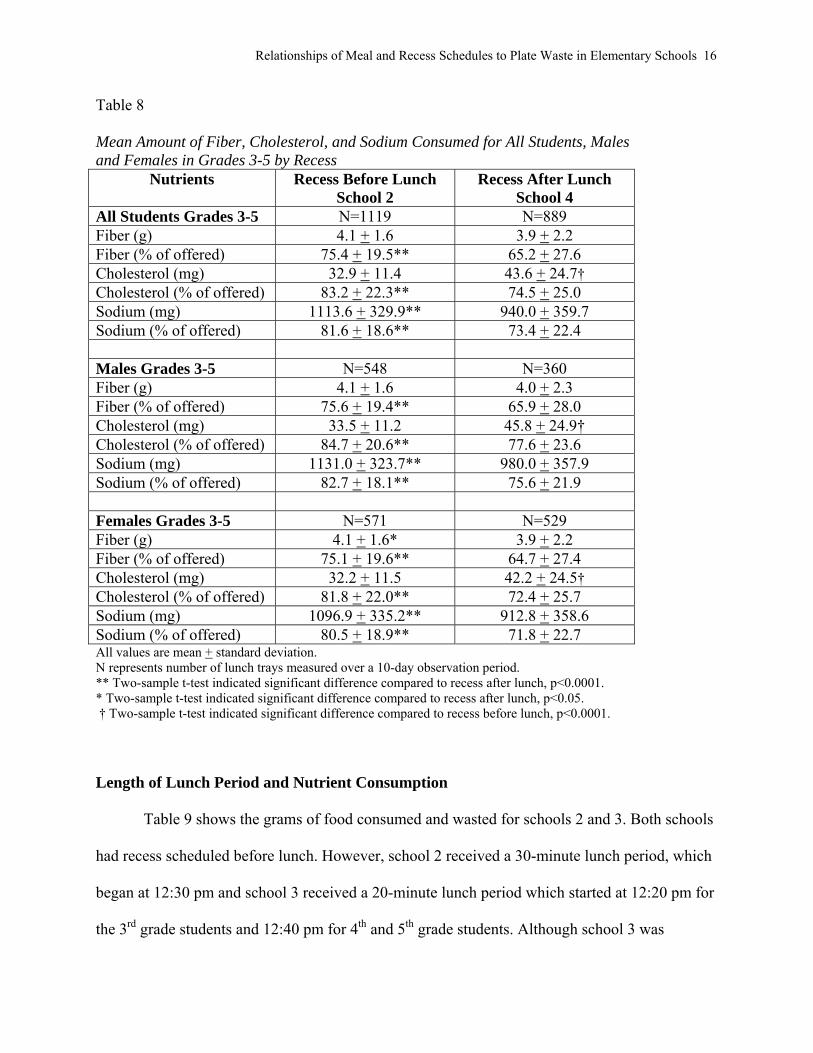
Table 8 Mean Amount of Fiber, Cholesterol, and Sodium Consumed for All Students, Males and Females in Grades 3-5 by Recess
Nutrients Recess Before Lunch School 2
Recess After Lunch School 4
All Students Grades 3-5 N=1119 N=889 Fiber (g) 4.1 + 1.6 3.9 + 2.2 Fiber (% of offered) 75.4 + 19.5** 65.2 + 27.6 Cholesterol (mg) 32.9 + 11.4 43.6 + 24.7† Cholesterol (% of offered) 83.2 + 22.3** 74.5 + 25.0 Sodium (mg) 1113.6 + 329.9** 940.0 + 359.7 Sodium (% of offered) 81.6 + 18.6** 73.4 + 22.4 Males Grades 3-5 N=548 N=360 Fiber (g) 4.1 + 1.6 4.0 + 2.3 Fiber (% of offered) 75.6 + 19.4** 65.9 + 28.0 Cholesterol (mg) 33.5 + 11.2 45.8 + 24.9† Cholesterol (% of offered) 84.7 + 20.6** 77.6 + 23.6 Sodium (mg) 1131.0 + 323.7** 980.0 + 357.9 Sodium (% of offered) 82.7 + 18.1** 75.6 + 21.9 Females Grades 3-5 N=571 N=529 Fiber (g) 4.1 + 1.6* 3.9 + 2.2 Fiber (% of offered) 75.1 + 19.6** 64.7 + 27.4 Cholesterol (mg) 32.2 + 11.5 42.2 + 24.5† Cholesterol (% of offered) 81.8 + 22.0** 72.4 + 25.7 Sodium (mg) 1096.9 + 335.2** 912.8 + 358.6 Sodium (% of offered) 80.5 + 18.9** 71.8 + 22.7 All values are mean + standard deviation. N represents number of lunch trays measured over a 10-day observation period. ** Two-sample t-test indicated significant difference compared to recess after lunch, p<0.0001. * Two-sample t-test indicated significant difference compared to recess after lunch, p<0.05. † Two-sample t-test indicated significant difference compared to recess before lunch, p<0.0001.
Length of Lunch Period and Nutrient Consumption
Table 9 shows the grams of food consumed and wasted for schools 2 and 3. Both schools
had recess scheduled before lunch. However, school 2 received a 30-minute lunch period, which
began at 12:30 pm and school 3 received a 20-minute lunch period which started at 12:20 pm for
the 3rd grade students and 12:40 pm for 4th and 5th grade students. Although school 3 was

Relationships of Meal and Recess Schedules to Plate Waste in Elementary Schools 17
scheduled for a 20-minute lunch period, in actuality the amount of time allotted for lunch was
less. After 15 minutes a bell rang and the students were expected to stop eating and dispose of
their lunch trays in preparation for returning to the classroom.
Table 9 shows that for all children, the grams of food eaten were significantly greater and
the amount of food wasted was significantly lower for the students who had a 30-minute lunch
period (p<0.0001). Overall food waste decreased from 43.5% to 27.2% when the length of the
lunch period was 30-minutes versus 20-minutes.
Table 9 Mean Amount of Food Offered, Eaten, and Wasted for All Students, Males and Females in Grades 3-5 by Length of Lunch 30-Minute
Lunch Period School 2
20-Minute Lunch Period
School 3 All Students Grades 3-5 N=1119 N=758 Amount of food offered (g) 568.8 + 52.2 605.2 + 33.8 Grams of food eaten 410.9 + 103.2* 338.3 + 132.9 % of offered that was eaten 72.8 + 18.2* 56.5 + 22.1 Grams of food wasted 156.6 + 108.1* 260.2 + 133.1 % of offered that was wasted 27.2 + 18.2* 43.5 + 22.1 Males Grades 3-5 N=548 N=372 Grams of food eaten 424.4 + 98.8* 371.8 + 129.7 % of offered that was eaten 75.1 + 17.4* 62.1 + 21.7 Grams of food wasted 143.0 + 102.8* 227.7 + 131.3 % of offered that was wasted 24.9 + 17.4* 37.9 + 21.7 Females Grades 3-5 N=571 N=386 Grams of food eaten 397.9 + 105.6* 306.1 + 128.0 % of offered that was eaten 70.5 + 18.7* 51.2 + 21.2 Grams of food wasted 169.6 + 111.6* 291.4 + 127.5 % of offered that was wasted 29.5 + 18.7* 48.8 + 21.2 All values are mean + standard deviation. N represents number of lunch trays measured. *Two-sample t-test indicated significant difference compared to the 20-minute lunch period, p<0.0001
Relationships of Meal and Recess Schedules to Plate Waste in Elementary Schools 18
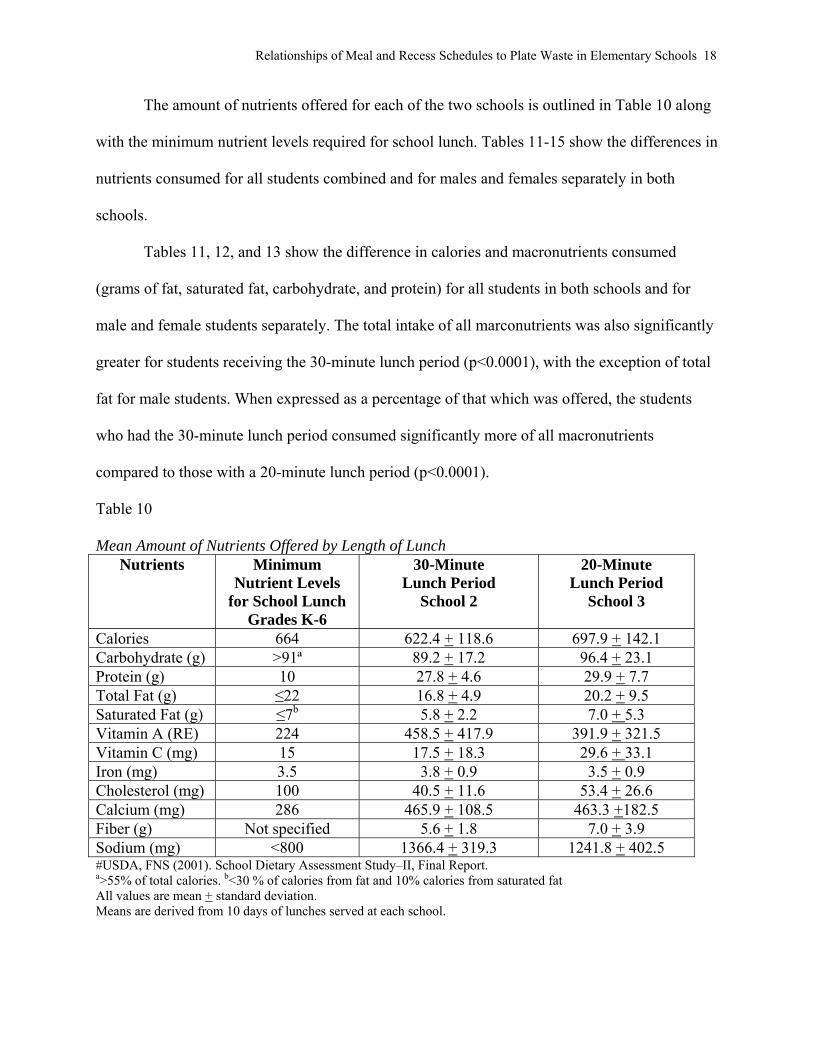
The amount of nutrients offered for each of the two schools is outlined in Table 10 along
with the minimum nutrient levels required for school lunch. Tables 11-15 show the differences in
nutrients consumed for all students combined and for males and females separately in both
schools.
Tables 11, 12, and 13 show the difference in calories and macronutrients consumed
(grams of fat, saturated fat, carbohydrate, and protein) for all students in both schools and for
male and female students separately. The total intake of all marconutrients was also significantly
greater for students receiving the 30-minute lunch period (p<0.0001), with the exception of total
fat for male students. When expressed as a percentage of that which was offered, the students
who had the 30-minute lunch period consumed significantly more of all macronutrients
compared to those with a 20-minute lunch period (p<0.0001).
Table 10 Mean Amount of Nutrients Offered by Length of Lunch
Nutrients Minimum Nutrient Levels
for School Lunch Grades K-6
30-Minute Lunch Period
School 2
20-Minute Lunch Period
School 3
Calories 664 622.4 + 118.6 697.9 + 142.1 Carbohydrate (g) >91ª 89.2 + 17.2 96.4 + 23.1 Protein (g) 10 27.8 + 4.6 29.9 + 7.7 Total Fat (g) ≤22 16.8 + 4.9 20.2 + 9.5 Saturated Fat (g) ≤7b 5.8 + 2.2 7.0 + 5.3 Vitamin A (RE) 224 458.5 + 417.9 391.9 + 321.5 Vitamin C (mg) 15 17.5 + 18.3 29.6 + 33.1 Iron (mg) 3.5 3.8 + 0.9 3.5 + 0.9 Cholesterol (mg) 100 40.5 + 11.6 53.4 + 26.6 Calcium (mg) 286 465.9 + 108.5 463.3 +182.5 Fiber (g) Not specified 5.6 + 1.8 7.0 + 3.9 Sodium (mg) <800 1366.4 + 319.3 1241.8 + 402.5 #USDA, FNS (2001). School Dietary Assessment Study–II, Final Report. a>55% of total calories. b<30 % of calories from fat and 10% calories from saturated fat All values are mean + standard deviation. Means are derived from 10 days of lunches served at each school.

Relationships of Meal and Recess Schedules to Plate Waste in Elementary Schools 19
Table 11 Mean Amount of Macronutrients Consumed for All Students in Grades 3-5 by Length of Lunch
Nutrients 30-Minute Lunch Period
School 2
20-Minute Lunch Period
School 3 All Students Grades 3-5 N=1119 N=758 Calories 503.3+133.0* 432.9 + 176.3 Calories (% of offered) 81.1 + 16.8* 64.4 + 24.2 Total Fat (g) 14.3 + 4.9* 12.8 + 6.3 Total Fat (% of offered) 86.2 + 18.3* 72.6 + 29.3 Saturated Fat (g) 4.9 + 2.1* 3.9 + 2.3 Saturated Fat (% of offered) 85.4 + 18.8* 69.7 + 30.7 Carbohydrate (g) 70.7 + 19.9* 59.3 + 30.2 Carbohydrate (% of offered) 79.3 + 18.1* 61.6 + 25.8 Protein (g) 22.1 + 6.2* 18.6 + 7.3 Protein (% of offered) 79.9 + 18.2* 64.7 + 25.7 All values are mean + standard deviation. N represents number of lunch trays measured over a 10-day observation period. * Two-sample t-test indicated significant difference compared to the 20-minute lunch period, p<0.0001. Table 12 Mean Amount of Macronutrients Consumed for Males in Grades 3-5 by Length Of Lunch Nutrient Requirement for
School Lunch 30-Minute
Lunch Period School 2
20-Minute Lunch Period
School 3 Males Grades 3-5 N=548 N=372 Calories 510.3 + 132.1* 470.2 + 172.6 Calories (% of offered) 82.4 + 16.6* 69.4 + 23.7 Total Fat (g) 14.4 + 4.8 13.9 + 6.3 Total Fat (% of offered) 87.1 + 17.9* 77.3 + 28.4 Saturated Fat (g) 4.9 + 2.1* 4.2 + 2.3 Saturated Fat (% of offered) 86.3 + 18.2* 74.8+ 30.1 Carbohydrate (g) 71.6 + 20.0* 64.4 + 29.7 Carbohydrate (% of offered) 80.5 + 18.4* 66.6 + 25.1 Protein (g) 22.7 + 6.1* 20.1 + 6.9 Protein (% of offered) 82.0 + 17.3* 70.2 + 24.3 All values are mean + standard deviation. N represents number of lunch trays measured over a 10-day observation period. *Two-sample t-test indicated significant difference compared to the 20-minute lunch period, p<0.0001.

Relationships of Meal and Recess Schedules to Plate Waste in Elementary Schools 20
Table 13 Mean Amount Of Macronutrients Consumed for Females in Grades 3-5 by Length of Lunch Nutrient Requirement for
School Lunch 30-Minute
Lunch Period School 2
20-Minute Lunch Period
School 3 Females Grades 3-5 N=571 N=386 Calories 496.5 + 133.6* 397.0 + 172.5 Calories (% of offered) 79.8 + 16.9* 59.6 + 23.8 Total Fat (g) 14.2 + 4.9* 11.7 + 6.0 Total Fat (% of offered) 85.3 + 18.7* 68.1 + 29.5 Saturated Fat (g) 4.9 + 2.1* 3.6 + 2.3 Saturated Fat (% of offered) 84.6 + 19.3* 64.9 + 30.4 Carbohydrate (g) 69.9 + 19.8 54.5 + 29.9 Carbohydrate (% of offered) 78.1 + 17.7* 56.8 + 25.5 Protein (g) 21.6 + 6.3* 17.1 + 7.4 Protein (% of offered) 77.9 + 18.8* 59.3 + 24.6 All values are mean + standard deviation. N represents number of lunch trays measured over a 10-day observation period. *Two-sample t-test indicated significant difference compared to the 20-minute lunch period, p<0.0001.
Table 14 shows that the amounts of vitamins and minerals (vitamins A and C, iron, and
calcium) consumed by all students and both male and female students. The amount of vitamin A,
iron, and calcium consumed was significantly greater when students were given a 30-minute
period to consume lunch versus when they were given 20 minutes (p<0.0001). The amount of
vitamin C consumed was not significantly different between the two groups although the
percentage consumed was greater for those students who had the 30-minute lunch period.
The amounts of fiber and sodium consumed, was also significantly greater when students
were given the longer lunch period (p<0.0001) (Table 15). There were no differences in the
amount of cholesterol consumed by children between the two schools.

Relationships of Meal and Recess Schedules to Plate Waste in Elementary Schools 21
Table 14 Mean Amount of Vitamins and Minerals Consumed for All Students, Males and Females in Grades 3-5 by Length of Lunch
Nutrients 30-Minute Lunch Period
School 2
20-Minute Lunch Period
School 3 All Students Grades 3-5 N=1119 N=758 Iron (mg) 3.1 + 1.0* 2.4 + 1.2 Iron (% of offered) 82.1 + 20.4* 70.1 + 29.2 Calcium (mg) 340.9 + 138.0* 218.5 + 144.4 Calcium (% of offered) 73.1 + 24.1* 50.6 + 31.3 Vitamin A (RE) 249.2 + 269.7* 171.1 + 206.7 Vitamin A (% of offered) 63.7 + 29.5* 45.4 + 32.1 Vitamin C (mg) 10.7 + 9.4 11.5 + 14.4 Vitamin C (% of offered) 69.5 + 21.1* 53.3 + 26.9 Males Grades 3-5 N=548 N=372 Iron (mg) 3.1 + 1.0* 2.6 + 1.2 Iron (% of offered) 82.6 + 20.6* 74.2 + 28.7 Calcium (mg) 355.1 + 134.7* 245.1 + 134.9 Calcium (% of offered) 76.4 + 22.4* 58.1 + 30.3 Vitamin A (RE) 258.5 + 275.9* 189.6 + 212.3 Vitamin A (% of offered) 66.8 + 28.4* 51.4 + 31.8 Vitamin C (mg) 10.6 + 9.1 12.2 + 15.0 Vitamin C (% of offered) 70.7 + 21.1* 56.8 + 27.2 Females Grades 3-5 N=571 N=386 Iron (mg) 3.1 + 1.0* 2.2 + 1.2 Iron (% of offered) 81.8 + 20.2* 66.1 + 29.1 Calcium (mg) 327.2 + 139.8* 192.8 + 148.8 Calcium (% of offered) 69.9 + 25.2* 43.5 + 30.7 Vitamin A (RE) 240.2 + 263.5* 153.2 + 199.9 Vitamin A (% of offered) 60.8 + 30.3* 39.7 + 31.4 Vitamin C (mg) 10.7 + 9.7 10.9 + 13.9 Vitamin C (% of offered) 68.4 + 21.1* 50.0 + 26.3 All values are mean + standard deviation. N represents number of lunch trays measured over a 10-day observation period. *Two-sample t-test indicated significant difference compared to the 20-minute lunch period, p<0.0001.

Relationships of Meal and Recess Schedules to Plate Waste in Elementary Schools 22
Table 15 Mean Amount of Fiber, Cholesterol and Sodium Consumed for All Students, Males and Females in Grades 3-5 by Length of Lunch
Nutrients 30-Minute Lunch Period
School 2
20-Minute Lunch Period
School 3 All Students Grades 3-5 N=1119 N=758 Fiber (g) 4.1 + 1.6* 3.6 + 2.5 Fiber (% of offered) 75.4 + 19.5* 59.3 + 26.5 Cholesterol (mg) 32.9 + 11.4 32.9 + 17.0 Cholesterol (% of offered) 83.2 + 21.3* 70.0 + 30.2 Sodium (mg) 1113.6 + 329.9* 781.5 + 366.6 Sodium (% of offered) 81.6 + 18.6* 68.8 + 27.0 Males Grades 3-5 N=548 N=372 Fiber (g) 4.1 + 1.6 3.9 + 2.4 Fiber (% of offered) 75.6 + 19.4* 62.3 + 26.8 Cholesterol (mg) 33.5 + 11.2 35.4 + 17.0 Cholesterol (% of offered) 84.7 + 20.6* 74.3 + 29.1 Sodium (mg) 1131.0 + 323.7* 840.7 + 349.5 Sodium (% of offered) 82.7 + 18.1* 74.1 + 25.7 Females Grades 3-5 N=571 N=386 Fiber (g) 4.1 + 1.6* 3.4 + 2.5 Fiber (% of offered) 75.1 + 19.6* 56.4 + 25.8 Cholesterol (mg) 32.2 + 11.5 30.5 + 16.6 Cholesterol (% of offered) 81.8 + 22.0* 65.8 + 30.6 Sodium (mg) 1096.9 + 335.2* 724.5 + 373.9 Sodium (% of offered) 80.5 + 18.9* 63.7 + 27.3 All values are mean + standard deviation. N represents number of lunch trays measured over a 10-day observation period. * Two-sample t-test indicated significant difference compared to the 20-minute lunch period, p<0.0001.
Relationships of Meal and Recess Schedules to Plate Waste in Elementary Schools 23
Discussion
The results of this study demonstrate that there are at least two factors that have an
impact on nutrient consumption of elementary school children receiving school lunch. One of
these is the placement of recess relative to lunch. The students who received recess before lunch
consumed significantly more food and nutrients than those who had recess after lunch. Food
waste decreased from 40.1% to 27.2% when recess was scheduled before lunch. These results
are similar to those reported by Getlinger (1996) who found food waste decreased from 34.9% to
24.3% when recess was scheduled before lunch. This is of concern since the School Health
Policies and Programs Study (Wechsler et al., 2001) showed that elementary schools are more
likely to schedule recess immediately after lunch rather than before lunch. Only 4.6% of schools
in the United States reported scheduling recess immediately before lunch.
These data indicate that recess should be tailored so that elementary school children have
recess before they eat. When recess is scheduled before lunch, children may come to lunch ready
to eat and free from distractions. Children with recess after lunch often seem more anxious to go
out to recess and less interested in eating lunch (Buergel et al., 2002).
The total time children have to eat lunch is also an important factor in the amount of food
and nutrients consumed. Children who received a 30-minute lunch period consumed significantly
more food and nutrients than those who received the 20-minute lunch period because they had
more time to eat their lunches. According to The School Health Policies and Programs Study
(Wechsler et al., 2001), one-fifth of U.S. schools give students less than 20 minutes to eat lunch.
Many variables, in addition to the time of the lunch period, impact the amount of time
students have to eat their lunch. One of these is the amount of time it takes for the students to get
to the service line, including standing in line to receive a tray, waiting for the cashier, and the

Relationships of Meal and Recess Schedules to Plate Waste in Elementary Schools 24
time to travel to the lunch table. Previous studies have shown that waiting in the service line can
vary from 2.5 to 3.3 minutes for elementary school students depending on the type and speed of
service (Conklin & Lambert, 2001). Students (K-12) need approximately 8-10 minutes to
consume their lunch (Bergman et al., 2001; Conklin et al., 2001). This represents the time to
actually eat and drink but does not include time to socialize. Buergel et al., (2002) showed that
this consumption time increases when children are given more time to eat.
Research has demonstrated a clear connection between nutrition and the child’s cognitive
development (Troccoli, 1993). Since school lunch is designed to provide children with one-third
of their nutrient requirements for the day, it is essential that the school environment be designed
to promote optimum quality food consumption. The schools in this study had a very high free
and reduced rate of participation (86-93%). Because this suggests that some of the children may
come from homes where food availability is limited, it is essential that they receive optimal
nutrition in order to learn and to grown and develop appropriately.
Relationships of Meal and Recess Schedules to Plate Waste in Elementary Schools 25
Conclusions
Three conclusions can be drawn from the results of this study:
1. When recess is scheduled before lunch, elementary school children consume significantly
more food and have less plate waste than children who have recess after lunch.
2. When recess is scheduled before lunch children consume more calories and total nutrients
than when they have recess after lunch.
3. Children who have a 30-minute lunch period consume significantly more food and
nutrients than those who have a 20-minute lunch period.

Relationships of Meal and Recess Schedules to Plate Waste in Elementary Schools 26
Recommendations
Based on the results from this study, the following recommendations can be made:
1. Elementary school administrators should schedule lunch after recess in order to offer
students the opportunity to consume a well-balanced school lunch and receive the
benefits of this meal for the remainder of the day.
2. School administrators should provide enough time for elementary students to eat, so that
the students are able to benefit from the consumed calories throughout the remainder of
the school day.
3. School foodservice directors and site managers should constantly assess their level of
productivity for meal service, to assure service is efficient and timely.
The approximate amount of time required for school lunch studies may be determined by the
following formula proposed by Buergel et al. (2002):
Minimum Lunch Period Time (MLPT) = 2 X mean wait time + (longest
mean consumption time (CT) + 2 x longest standard deviation)
Based on timing studies competed by Bergman et al., (2000) and Buergel et al., (2002),
elementary school children require between 8 to 9 minutes for consumption time. The longest
standard deviation in the previous studies was 3.5 minutes. Because the amount of wait time
before children are able to sit down and consume lunch varies considerably among schools,
school administrators and child nutrition directors should determine the average wait time for
their particular schools by timing how long children stand in line. Using these data and the
formula above, the minimum amount of time that should be allowed for the school lunch period
can be determined.
Relationships of Meal and Recess Schedules to Plate Waste in Elementary Schools 27
In order to maximize food consumption and nutrient intake in elementary school children
continued research is needed to determine the ideal time needed for the lunch period in a wide
range of elementary school settings. Additionally, further studies are needed to determine if
calories and nutrients consumed at lunch play a role in readiness to learn, especially in the
afternoon hours of instruction.
Relationships of Meal and Recess Schedules to Plate Waste in Elementary Schools 28
References
Bergman, E., Buergel, N.S., Enamuthu, J., & Sanchez, A. (2000). Time spent by schoolchildren to eat lunch. Journal of the American Dietetic Association, 100, 696-698.
Buergel, N.S., Bergman, E., Knutson, A.C., & Lindaas, M.A. (2002). Students consuming sack
lunches devotes more time to eating than those consuming school lunches. Journal American Dietetic Association, 102, 1283-1286.
Burghardt, J., and Devaney, B. (1993). The School Nutrition Dietary Assessment Study:
Summary of Findings. Prepared by Mathematica Policy Research, Inc. Princeton, NJ, under contract No. 53-3198-0-16, with the Food and Nutrition Service, U.S. Department of Agriculture.
Buzby, J.C., & Gutherie, J. (2002). Plate Waste in School Nutrition Programs. Report to
Congress. Retrieved October 21, 2003 from:
http://www.ers.usda.gov/publications/efan02009/efan02009.pdf Conklin, M.T., & Lambert, L.G. (2001). Eating at school. A summary of NFSMI research on
time required by students to eat lunch. Retrieved October 10, 2003 from:
http://www.nfsmi.org/Information/eating_at_school.pdf. Getlinger, M.J., Laughlin, C.V.T., Bell, E., Akre, C., & Arjmandi, B.H. (1996). Food waste is
reduced when elementary-school children have recess before lunch. Journal American Dietetic Association, 96, 906-908.
Gordon, A., Delaney, B., & Burghardt, J. (1995). Dietary effects of the National School Lunch
Program and the School Breakfast Program. American Journal of Clinical Nutrition,
61(suppl.), 221S-231S.
Relationships of Meal and Recess Schedules to Plate Waste in Elementary Schools 29
LabView 6i [Computer Software]. (2000). Austin, TX: National Instruments Inc. Mauer, K. (1984). The national evaluation of school nutrition programs: factors affecting student
participation. American Journal Clinical Nutrition, 40, 425-447. Nutrikids. (2001). Rochester NY: Lunchbyte Systems Inc. Rainville, A.J. (2001). Nutrition quality of reimbursable school lunches brought compared to
lunches brought from home in elementary schools in two southeastern Michigan
districts. The Journal of Child Nutrition and Management, 25(1), 13-17. Read, M.H., & Moosburner, N. (1985). The scheduling of recess and the effect of plate waste at
the elementary school level. School Food Service Research Review, 9, 40-44. Ruppenthal, B., & Hogue, W. (1977). Playground and plate waste. School Food Service Journal,
31, 66-70. School Health Policies and Program Study. (2000). National Center for Chronic Disease
Prevention and Health Promotion. Retrieved October 3, 2003 from: http//:www.cdc.gov.nccephp/dash/shpps/index.htm.
School Lunch Program: Cafeteria Managers’ Views on Food Wasted by Students. (1996).
Washington, DC: US General Accounting Office: Publication GAO/RCED-960191. Smith, T.R. (1980). Play first, eat last! School Food Service Journal, 34, 54 -55. Troccoli, K. (1993). Eat to Learn, Learn to Eat: The Link Between Nutrition and Learning in
Children. Washington, DC: National Healthy Education Consortium, Occasional paper 7. U. S. Department of Agriculture, Food and Nutrition Service (2001). Nutrition Assistance
Program Report Series. Special Nutrition Programs. Report No. CN-01-SNDAIIFR. School Nutrition Dietary Assessment Study-II. Final Report. Retrieved June 24, 2003 from http://www.fns.usda.gov/oane/MENU/Published/CNP/FILES/sndaII.pdf.
Relationships of Meal and Recess Schedules to Plate Waste in Elementary Schools 30
U. S. Department of Agriculture School Lunch Program. Retrieved June 24, 2003 from the Food,
Nutrition and Consumer Service Web site via FNS Access:
http://www.fns.usda.gov/cnd/Lunch/Default.htm. Wechsler, H, Brener, N, Kuester, S, & Miller, C. (2001). Food service and foods and beverages
Available at school: Results from the school health policies programs study 2000. Journal of School Health, 71, 313-324.