Embed Size (px)
Citation preview

Commonwealth Bank of Australia ACN 123 123 124
Results PresentationFor the half year ended 31 December 2009
10 February 2010
For
per
sona
l use
onl
y
2
Disclaimer
The material that follows is a presentation of general background information
about the Group’s activities current at the date of the presentation,
9 February 2011. It is information given in summary form and does not
purport to be complete. It is not intended to be relied upon as advice to
investors or potential investors and does not take into account the
investment objectives, financial situation or needs of any particular investor.
These should be considered, with or without professional advice when
deciding if an investment is appropriate.
For
per
sona
l use
onl
y

3
Agenda
Ralph Norris, CEO – Company Update and Outlook
David Craig, CFO – Financial Overview
Questions and Answers
For
per
sona
l use
onl
y

4
Notes
For
per
sona
l use
onl
y

5
Overview
Another solid financial result
Challenging operating environment
Disciplined strategy execution continuing to deliver
Investing for the future
Cautiously optimistic for calendar 2011
For
per
sona
l use
onl
y

6
Snapshot – 1H11 Results*
Cash earnings ($m) 3,335 +13%
ROE (Cash) 19.2% +70bpts
Cash EPS ($) 2.14 +12%
DPS ($) 1.32 +10%
Cost-to-Income 45.4% 70bpts
NIM 2.12% (6bpts)
RBS ($m) 2,227 +2%
IB&M ($m) 865 (12%)
BPB ($m) 858 +6%
Bankwest ($m) 369 +10%
Wealth Management ($m) 453 +10%
NZ (NZD $m) 419 +15%
Total Assets ($bn) 650 +4%
Total Liabilities ($bn) 614 +4%
FUA ($bn) 199 +3%
RWAs ($bn) 286 (4%)
Provisions to Credit RWAs 2.25% +21bpts
Tier 1 Capital 9.71% +61bpts
Tier 1 – UK FSA 13.5% +110bpts
WAM – New Issuance (yrs) 4.4 -
Deposit Funding (%) 60% +4%
Liquid Assets ($bn) 93 +4%
* All movements on prior comparative period.
Financial
Strong balance sheet Capital & Funding
Operating Performance by Division
For
per
sona
l use
onl
y
7
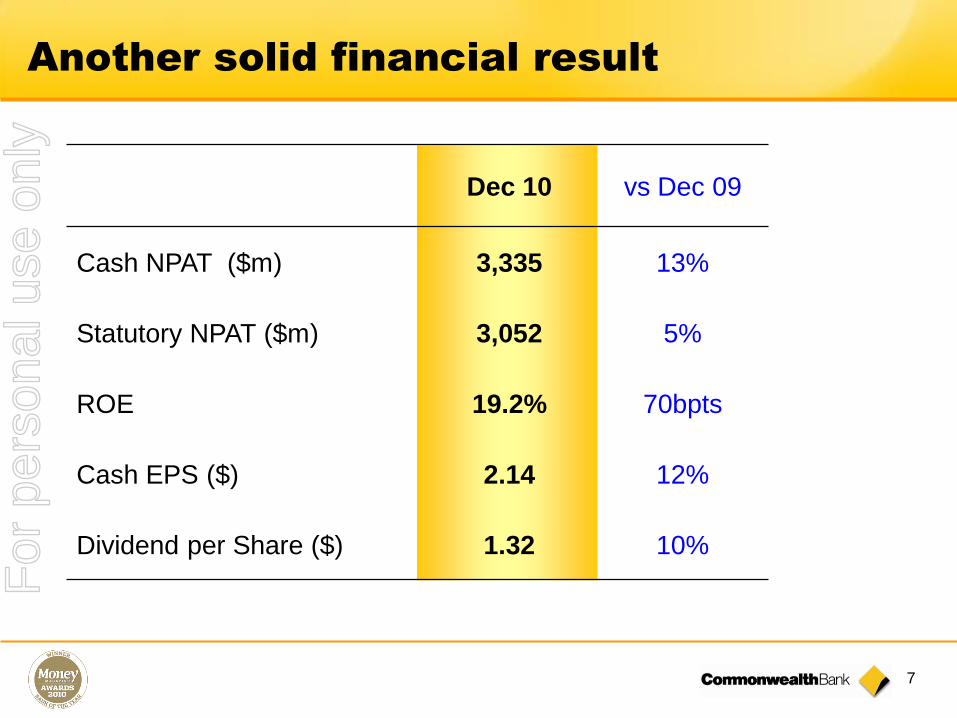
Dec 10 vs Dec 09
Cash NPAT ($m) 3,335 13%
Statutory NPAT ($m) 3,052 5%
ROE 19.2% 70bpts
Cash EPS ($) 2.14 12%
Dividend per Share ($) 1.32 10%
Another solid financial result
For
per
sona
l use
onl
y

8
Return on Equity (Cash)
18.8%
21.5% 21.7%20.4%
15.8%
18.7% 19.2%
2005 2006 2007 2008 2009 2010 1H11
For
per
sona
l use
onl
y
9
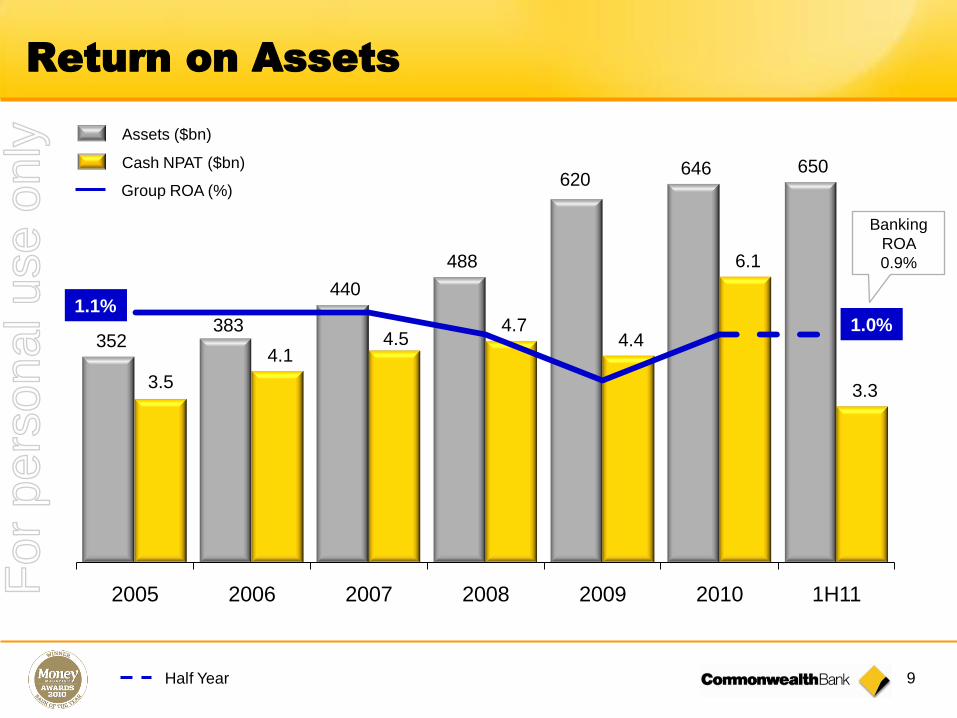
Return on Assets
Cash NPAT ($bn)
Assets ($bn)
352 383
440
488
620 646 650
3.5
4.1 4.5
4.7 4.4
6.1
3.3
-
0
0
1
1
1
1
1
2
2
0
100
200
300
400
500
600
700
2005 2006 2007 2008 2009 2010 1H11
Half Year
Group ROA (%)
1.1%1.0%
Banking
ROA
0.9%
For
per
sona
l use
onl
y

10
A clear, focussed strategy
Australia’s finest
financial services
organisation
Customer
Satisfaction
Business
Banking
Trust and
Team Spirit
Technology and
Operational
Excellence
Profitable
GrowthFor
per
sona
l use
onl
y
11
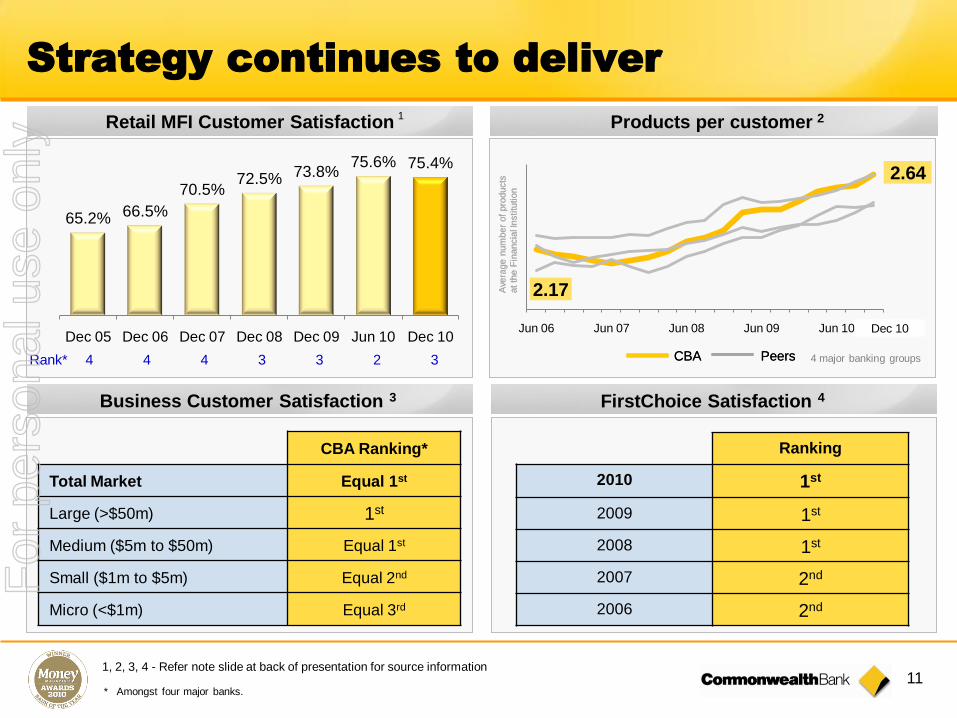
Strategy continues to deliver
1, 2, 3, 4 - Refer note slide at back of presentation for source information
Business Customer Satisfaction 3
Products per customer 2
CBA Ranking*
Total Market Equal 1st
Large (>$50m) 1st
Medium ($5m to $50m) Equal 1st
Small ($1m to $5m) Equal 2nd
Micro (<$1m) Equal 3rd
FirstChoice Satisfaction 4
CBA Peers
2.64
Ave
rage n
um
ber
of
pro
ducts
at th
e F
inancia
l Institu
tion
4 major banking groupsCBA Peers
Ave
rage n
um
ber
of
pro
ducts
at th
e F
inancia
l Institu
tion
Jun 06 Jun 07 Jun 08 Jun 09 Jun 10Dec 10
2.17
Retail MFI Customer Satisfaction1
Dec 10
Ranking
2010 1st
2009 1st
2008 1st
2007 2nd
2006 2nd
65.2% 66.5%
70.5%72.5% 73.8%
75.6% 75.4%
Dec 05 Dec 06 Dec 07 Dec 08 Dec 09 Jun 10 Dec 10
* Amongst four major banks.
Rank* 4 4 4 3 3 2 3
For
per
sona
l use
onl
y

12
Notes
For
per
sona
l use
onl
y
13
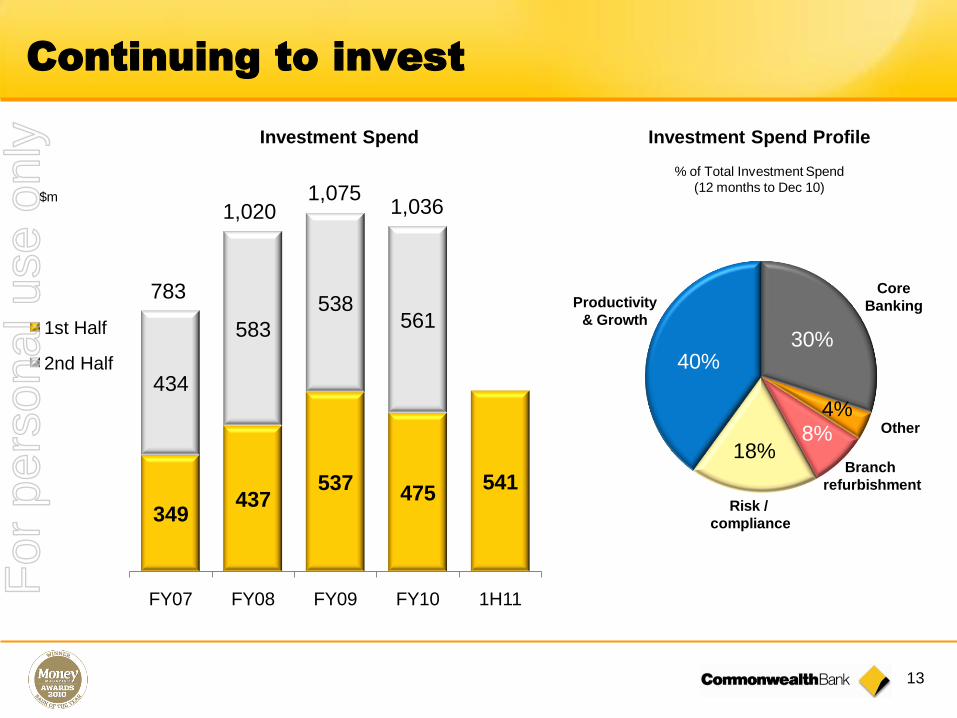
Continuing to invest
349437
537475
541
434
583
538561
FY07 FY08 FY09 FY10 1H11
1st Half
2nd Half
783
1,0201,075
1,036
Investment Spend Investment Spend Profile
4%
40%30%
$m
% of Total Investment Spend
(12 months to Dec 10)
Risk /
compliance
Branch
refurbishment
Core
Banking
Other8%18%
Productivity
& Growth
For
per
sona
l use
onl
y

14
Notes
For
per
sona
l use
onl
y
15
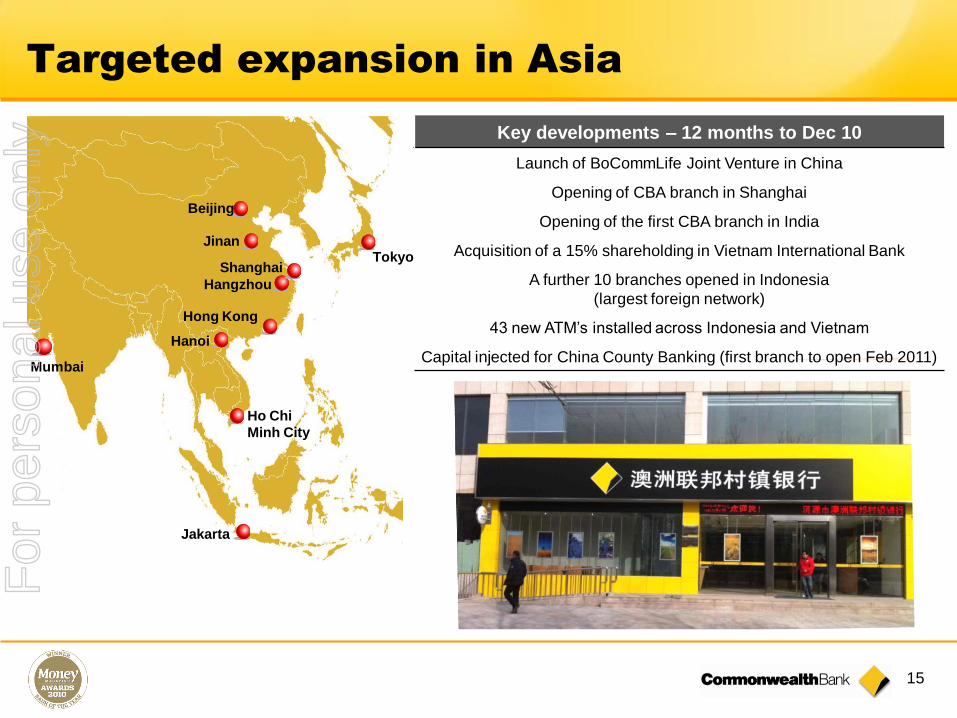
Targeted expansion in Asia
Beijing
Jinan
Shanghai
Hangzhou
Mumbai
Ho Chi
Minh City
Jakarta
Tokyo
Hanoi
Hong Kong
Key developments – 12 months to Dec 10
Launch of BoCommLife Joint Venture in China
Opening of CBA branch in Shanghai
Opening of the first CBA branch in India
Acquisition of a 15% shareholding in Vietnam International Bank
A further 10 branches opened in Indonesia
(largest foreign network)
43 new ATM’s installed across Indonesia and Vietnam
Capital injected for China County Banking (first branch to open Feb 2011)
For
per
sona
l use
onl
y
16
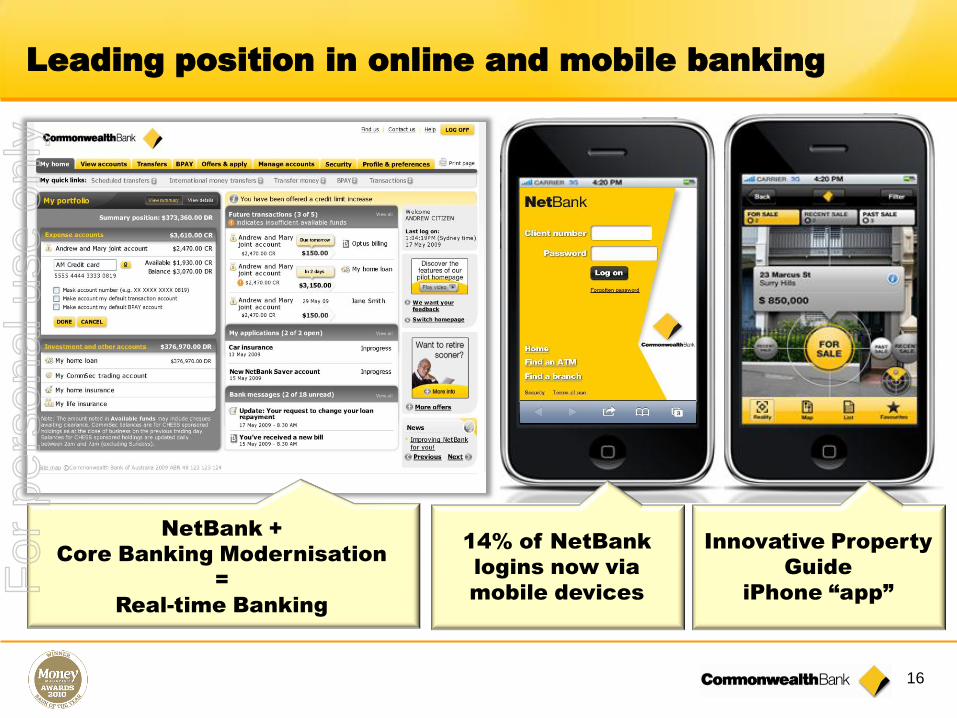
Leading position in online and mobile banking
14% of NetBank
logins now via
mobile devices
Innovative Property
Guide
iPhone “app”
NetBank +
Core Banking Modernisation
=
Real-time Banking
For
per
sona
l use
onl
y
17
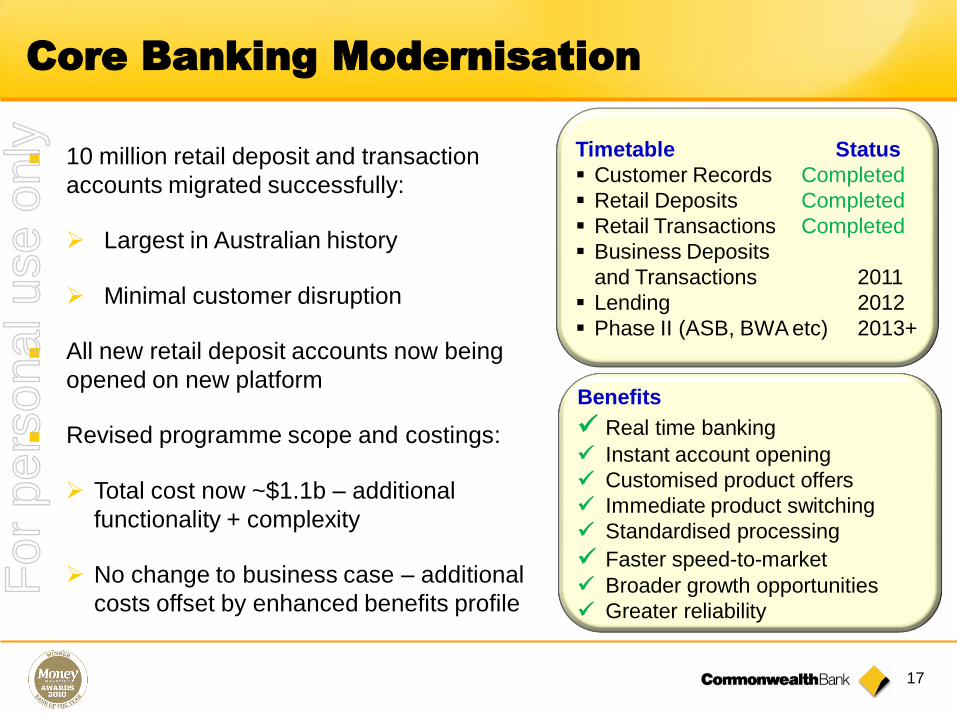
Core Banking Modernisation
10 million retail deposit and transaction
accounts migrated successfully:
Largest in Australian history
Minimal customer disruption
All new retail deposit accounts now being
opened on new platform
Revised programme scope and costings:
Total cost now ~$1.1b – additional
functionality + complexity
No change to business case – additional
costs offset by enhanced benefits profile
Timetable Status
Customer Records Completed
Retail Deposits Completed
Retail Transactions Completed
Business Deposits
and Transactions 2011
Lending 2012
Phase II (ASB, BWA etc) 2013+
Benefits
Real time banking
Instant account opening
Customised product offers
Immediate product switching
Standardised processing
Faster speed-to-market
Broader growth opportunities
Greater reliability
For
per
sona
l use
onl
y

18
Employing 45,000 people
Serving 11 million Australian customers
$100 billion in new lending in FY10
Paid $2.9 billion in taxes in FY10
74% of profit returned to shareholders
AA Credit Rating
Ensures Australia’s stability
Keeps interest rates lower
Delivers funds for our customers
Supporting Australia
55%
17%
28%800,000
Retail
InvestorsOverseas
Funds
Australian
Funds
Where does our net income go?
FY10
Expenses
Taxes
Shareholder
dividends
Salaries for
45,000 staff
Retained to
grow lending
4.0
4.5
4.6
1.6
2.9
2.1
Impairment$bn
For
per
sona
l use
onl
y

19
Supporting our Community - Floods
Flood Assistance initiatives totalling $65m:
Compassionate Assistance Fund of up to $50m
CommInsure ex gratia payments of $8m
Community Group Flood Assistance Fund of $5m
Cash donations of ~$2m to flood relief appeals
$1bn set aside for loans to business and agri customers:
No interest for first 3 months for new or increased overdraft facilities
Hardship assistance through Emergency Assistance packages
For
per
sona
l use
onl
y

20
Key Earnings Drivers - FY11
Driver FY11 Outlook
System
Credit Growth*
► Total Credit (%): 4½-6½
► Housing Credit (%): 7-9
► Business Credit (%): 1-3
Margins► Elevated funding costs
► Many variables – specific outlook hard to predict
Other Banking Income ► Likely subdued overall growth
Funds Management
Income► Leverage to equity market recovery
Costs► Continued cost discipline + investing in the business
► Inflationary pressures
Impairment Expense ► Stabilising
* CBA Economists forecasts
For
per
sona
l use
onl
y

21
Outlook
Operating conditions remain challenging:
Subdued credit growth
Competitive pressures
Elevated funding costs
Nevertheless, cautiously optimistic about calendar 2011:
Global outlook improving, albeit gradually
Outlook for domestic economy positive
Well placed to benefit from upturnFor
per
sona
l use
onl
y

22
Notes
For
per
sona
l use
onl
y
Commonwealth Bank of Australia ACN 123 123 124
Results PresentationFor the half year ended 31 December 2009
10 February 2010
For
per
sona
l use
onl
y

24
Notes
For
per
sona
l use
onl
y

25
Solid profit growth
Dec 10
$m
Dec 09
$m
Dec 10 vs
Dec 09
Operating income 9,704 9,550 2%
Operating expenses (4,408) (4,268) 3%
Operating performance 5,296 5,282 -
Investment experience 35 142 (75%)
Impairment expense (722) (1,383) (48%)
Tax and non-controlling interest (1,274) (1,098) 16%
Cash NPAT 3,335 2,943 13%
Dec 10 vs
Jun 10
5%
2%
7%
(63%)
4%
7%
6%For
per
sona
l use
onl
y
26
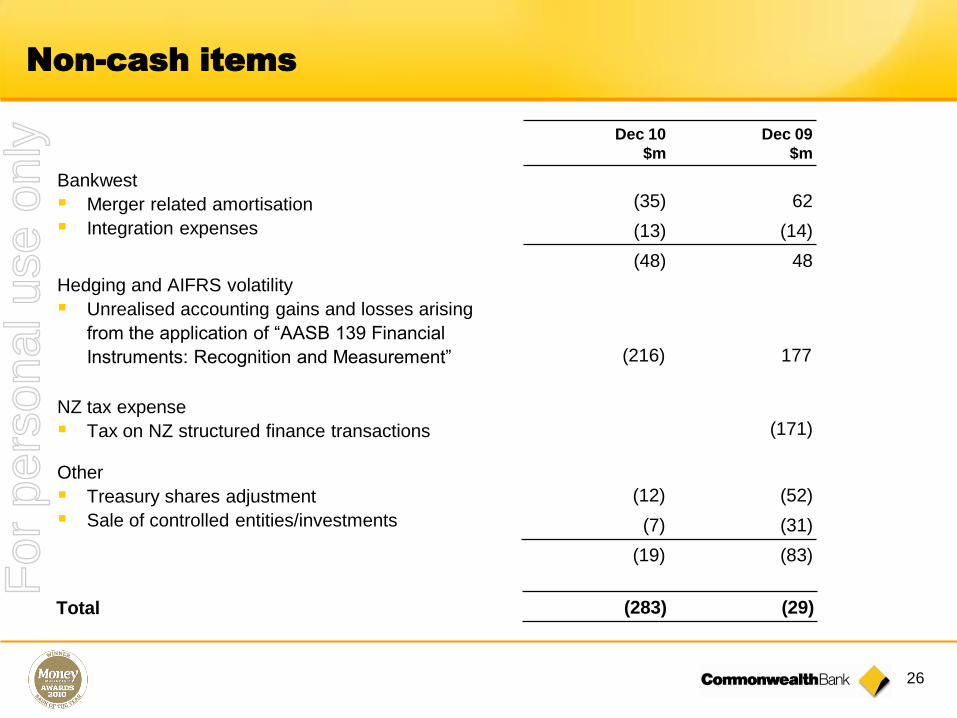
Non-cash items
Hedging and AIFRS volatility
Unrealised accounting gains and losses arising
from the application of “AASB 139 Financial
Instruments: Recognition and Measurement”
(12) (52)
(7) (31)
(19) (83)
NZ tax expense
Tax on NZ structured finance transactions
Dec 10
$m
Dec 09
$m
Bankwest
Merger related amortisation
Integration expenses
(216) 177
Other
Treasury shares adjustment
Sale of controlled entities/investments
(171)
(35) 62
(13) (14)
(48) 48
(283) (29)Total
For
per
sona
l use
onl
y
27
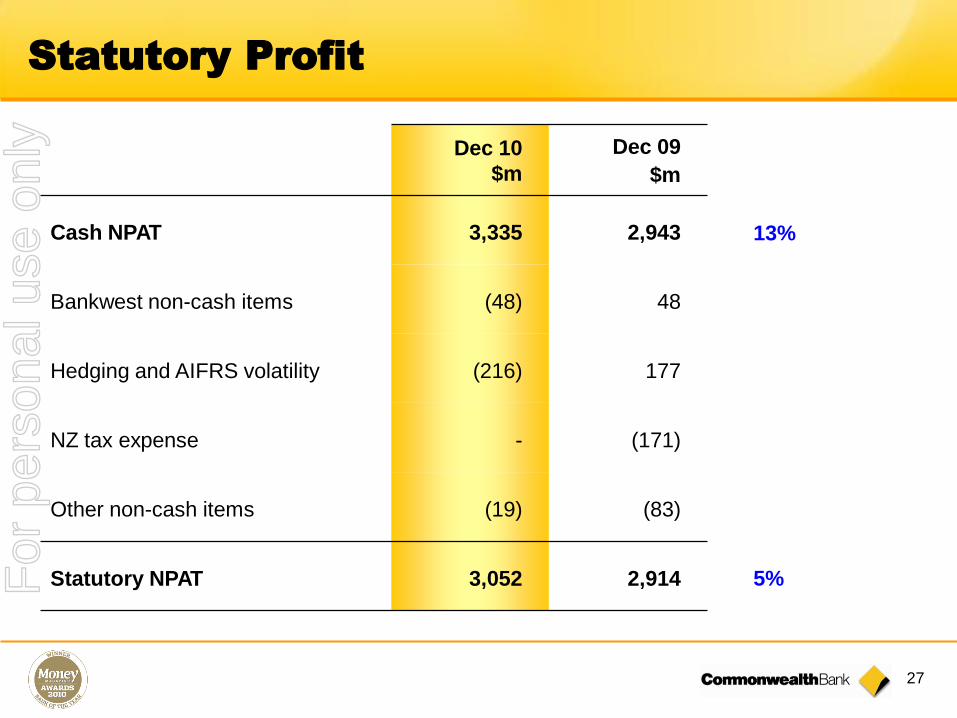
Statutory Profit
Dec 10
$m
Dec 09
$m
Cash NPAT 3,335 2,943
Bankwest non-cash items (48) 48
Hedging and AIFRS volatility (216) 177
NZ tax expense - (171)
Other non-cash items (19) (83)
Statutory NPAT 3,052 2,914
13%
5%For
per
sona
l use
onl
y

28
$m
Operating
Performance
Impairment
Expense
Investment
Experience
Tax & non-
controlling
interests
Cash
NPAT
Dec 10
Cash
NPAT
Dec 09
Mvt
Cash
NPAT
Mvt
Operating
Performance
RBS 2,227 (253) - (591) 1,383 1,237 12% 2%
IB&M 865 (193) - (160) 512 553 (7%) (12%)
BPB 858 (135) - (217) 506 440 15% 6%
WM 453 - 31 (125) 359 379 (5%) 10%
Bankwest 369 (49) - (96) 224 15 Large 10%
NZ 335 (28) - (73) 234 161 45% 8%
Other 189 (64) 4 (12) 117 158 (26%) (27%)
Total 5,296 (722) 35 (1,274) 3,335 2,943 13% -
Business unit profitability
1 NZ in AUD
2 Includes Group Treasury, Centre functions, Asia
1
2
For
per
sona
l use
onl
y
29
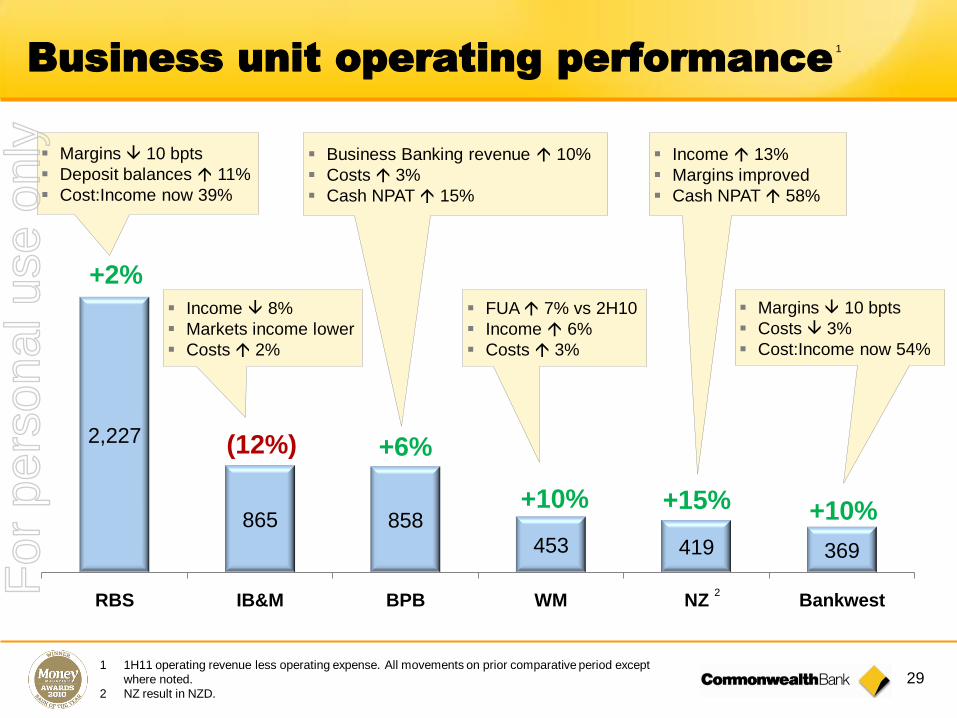
Business unit operating performance
2,227
865 858453 419 369
RBS IB&M BPB WM NZ Bankwest
+2%
(12%) +6%
+15%+10% +10%
1 1H11 operating revenue less operating expense. All movements on prior comparative period except
where noted.
2 NZ result in NZD.
Margins 10 bpts
Deposit balances 11%
Cost:Income now 39%
Income 8%
Markets income lower
Costs 2%
Business Banking revenue 10%
Costs 3%
Cash NPAT 15%
Margins 10 bpts
Costs 3%
Cost:Income now 54%
FUA 7% vs 2H10
Income 6%
Costs 3%
Income 13%
Margins improved
Cash NPAT 58%
1
2For
per
sona
l use
onl
y
30
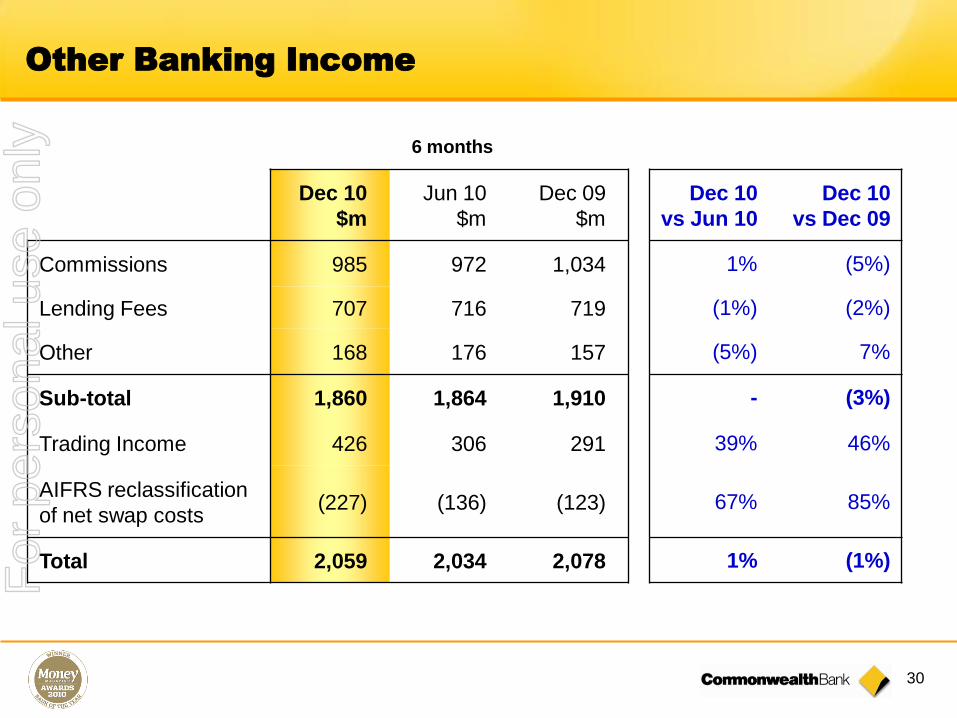
Other Banking Income
Dec 10
$m
Jun 10
$m
Dec 09
$m
Dec 10
vs Jun 10
Dec 10
vs Dec 09
Commissions 985 972 1,034 1% (5%)
Lending Fees 707 716 719 (1%) (2%)
Other 168 176 157 (5%) 7%
Sub-total 1,860 1,864 1,910 - (3%)
Trading Income 426 306 291 39% 46%
AIFRS reclassification
of net swap costs(227) (136) (123) 67% 85%
Total 2,059 2,034 2,078 1% (1%)
6 months
For
per
sona
l use
onl
y

31
Operating Income up 2%
Funds &
Insurance
+2%
Other Banking
Income
Trading Income
Net Interest
Income
Dec 09 Dec 10
9,550 9,704
+2%
+46%
(3%)
+5%Average FUA balances 5%
Change in mix of Treasury earnings (OBI vs NII)1
Other Banking Income excludes Trading Income, AIFRS.
$m
Commissions ($49m) (5%)
Lending Fees ($12m) (2%)
1 In prior period, RBA rate tightening resulted in a negative mark-to-market position in the Treasury trading
book – with offsetting gains on interest rate swaps accounted for in Net Interest Income.
Volume $287m 5%
Margin ($165m) (3%)
For
per
sona
l use
onl
y
32
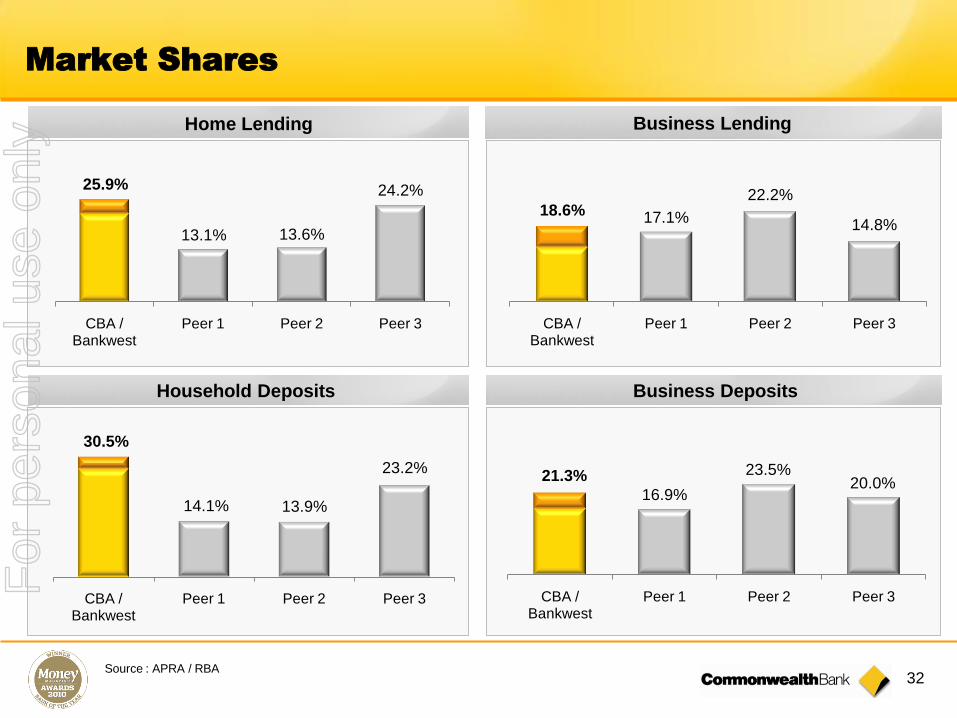
Home Lending Business Lending
Business DepositsHousehold Deposits
Market Shares
21.3%
16.9%
23.5%20.0%
CBA / Bankwest
Peer 1 Peer 2 Peer 3
18.6% 17.1%
22.2%
14.8%
CBA / Bankwest
Peer 1 Peer 2 Peer 3
Source : APRA / RBA
25.9%
13.1% 13.6%
24.2%
CBA / Bankwest
Peer 1 Peer 2 Peer 3
30.5%
14.1% 13.9%
23.2%
CBA / Bankwest
Peer 1 Peer 2 Peer 3
For
per
sona
l use
onl
y

33
Volumes
+16% 8.8%
-9.9%
-18.2%
-6.1%
0.6%
BPB IB&M BWA Total CBA
Business Lending
Business Deposits
Home Loan Fundings
Six month balance growth to Dec 10
(annualised)
Six month balance growth to Dec 10
(annualised)
Market
Household Deposits
12.2% 12.2%
Six month balance growth to Dec 10
(annualised)
4,651 4,502 4,341 4,388 4,367
4,8905,082
2H10 Jul 10 Aug 10 Sep 10 Oct 10 Nov 10 Dec 10
Monthly fundings
$m
10.3%
20.6%
Total CBA MarketTotal CBA Market
*
* Monthly average
Source : APRA / RBA
For
per
sona
l use
onl
y

34
219
205
198
216218
208
212
Jun 06 Jun 07 Jun 08 Jun 09 Dec 09 Jun 10 Dec 10
Margins remain below pre-GFC levels
NIM decline as GFC
drives term funding
costs higher
NIM recovery as pricing
adjusted for higher
funding costs and
increased risk
NIM under
pressure from
higher funding
costs
Group NIM (six-month periods)
bpts
218
200
193
211
213
203 204
AIFRS
For
per
sona
l use
onl
y

35
bpts
218
208 209212
7 (9)
3
3
Asset pricing
and mix
Funding
costs
AIFRS
Volatility
1H111H10 2H10 NZ
Group Margin
-2 bpts
Group
Underlying
Liquids, funding mix and other net to nil
For
per
sona
l use
onl
y

36
Other key information
269
256
239234 233
219223
1H06
bpts
1H07 1H08 1H09 1H10 1H112H10
Increased
funding
cost
+1.25%
* Long term and short term. Includes basis risk
Jun 07 Dec 07 Jun 08 Dec 08 Jun 09 Dec 09 Jun 10 Dec 10
Wholesale
Funding*
Deposit
Funding
+1.46%
x 60%
+0.94%
x 40%
Average Funding Costs - GroupRBS Margin
For
per
sona
l use
onl
y
37
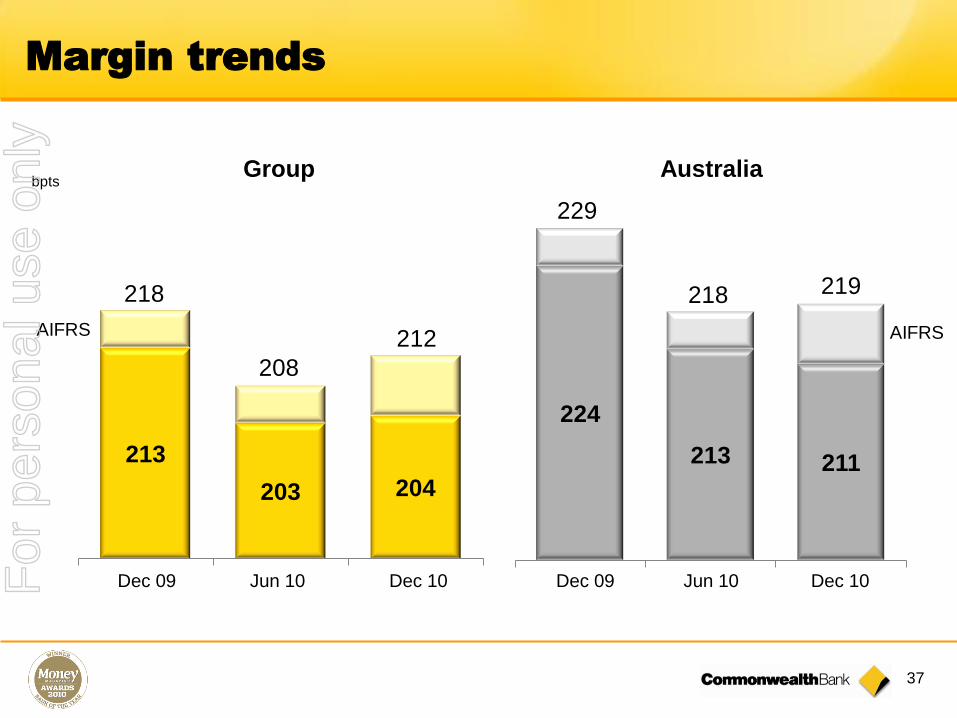
Margin trends
bpts
224
213 211
Australia
Dec 09 Jun 10 Dec 10
AIFRS
229
218 219
213
203 204
Group
Dec 09 Jun 10 Dec 10
218
208
212AIFRS
For
per
sona
l use
onl
y

38
Notes
For
per
sona
l use
onl
y

39
Tight cost control: Continuing to invest
4,2684,408
2039
81
Dec 10Dec 09 Business
as Usual
InvestmentDefined Benefits
Fund
$m
+1.4%
Includes 4%
salary increase
from July
+3.3%
For
per
sona
l use
onl
y

40
4735
17 20
9
7
-7
6
5
13
18 2
28
28
1,121881
428 518
207
189
-177
155
113
313
441 49
692
722
6 months ($m)6 months annualised (basis points)*
OverlayBase
61
Bankwest
1,4411,383
55
* Basis points as a percentage of average Gross Loans and Acceptances
Jun 09 Jun 10
cash earnings
Dec 09 Jun 09 Jun 10
cash earnings
Dec 09
Impairment expense
Dec 10 Dec 10
For
per
sona
l use
onl
y

41
Impairment Expense to Gross Loans
1519
32
85
61
55
2824
Jun 07 Dec 07 Jun 08 Dec 08 Jun 09 Dec 09 Jun 10 Stat
Dec 10
40
20
13
18 20
37
2823
15
Jun 07 Dec 07 Jun 08 Dec 08 Jun 09 Dec 09 Jun 10 Dec 10
Margin LendingCBA Group1
1 Includes ASB and Bankwest from December 08. December 08 includes Bankwest on a pro forma basis.
2 Represents Retail Banking Services, ASB Retail and Bankwest Retail from December 08
3 Represents Institutional Banking and Markets, Business and Private Banking, ASB Business and
Bankwest Business from December 08
bpts
Consumer bpts
pro forma
Review of Bankwest pre acquisition business book
4
28
20 25 37
96 98 90
47
Jun 07 Dec 07 Jun 08 Dec 08 Jun 09 Dec 09 Jun 10 Dec 10
bpts
Corporate3
Flood related overlay
1
3
pro forma
pro forma
Stat
2
54
185
44
14
For
per
sona
l use
onl
y

42
Additional Information
Individual Provisions ($m)
1,066927 920
1,108
43162 116
139
620 733956
922
Commercial
Consumer
Bankwest1,729
1,822
1,992
2,169
Jun 09 Dec 09 Jun 10 Dec 10
Individual Provisions ($m)
For
per
sona
l use
onl
y
43
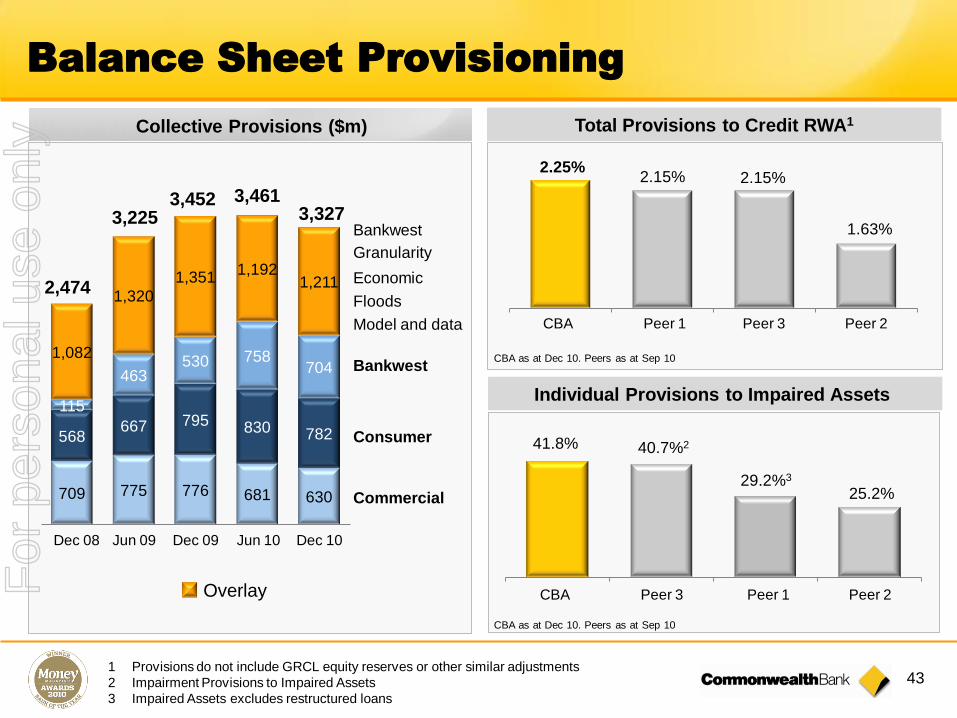
40.7%2
29.2%3
41.8%
25.2%
1.63%
Balance Sheet Provisioning
Overlay
709 775 776 681 630
568667 795 830 782
115
463530 758
7041,082
1,320
1,3511,192
1,211
Collective Provisions ($m)
2,474
Bankwest
Granularity
Economic
Model and data
Commercial
Consumer
Bankwest
3,225
Dec 08 Jun 09
3,452
Dec 09
3,461
Jun 10 Dec 10
3,327
Total Provisions to Credit RWA1
2.25%2.15% 2.15%
1 Provisions do not include GRCL equity reserves or other similar adjustments
2 Impairment Provisions to Impaired Assets
3 Impaired Assets excludes restructured loans
CBA as at Dec 10. Peers as at Sep 10
Peer 3 Peer 2Peer 1CBA
CBA Peer 1 Peer 3 Peer 2
Individual Provisions to Impaired Assets
Floods
CBA as at Dec 10. Peers as at Sep 10
For
per
sona
l use
onl
y
44
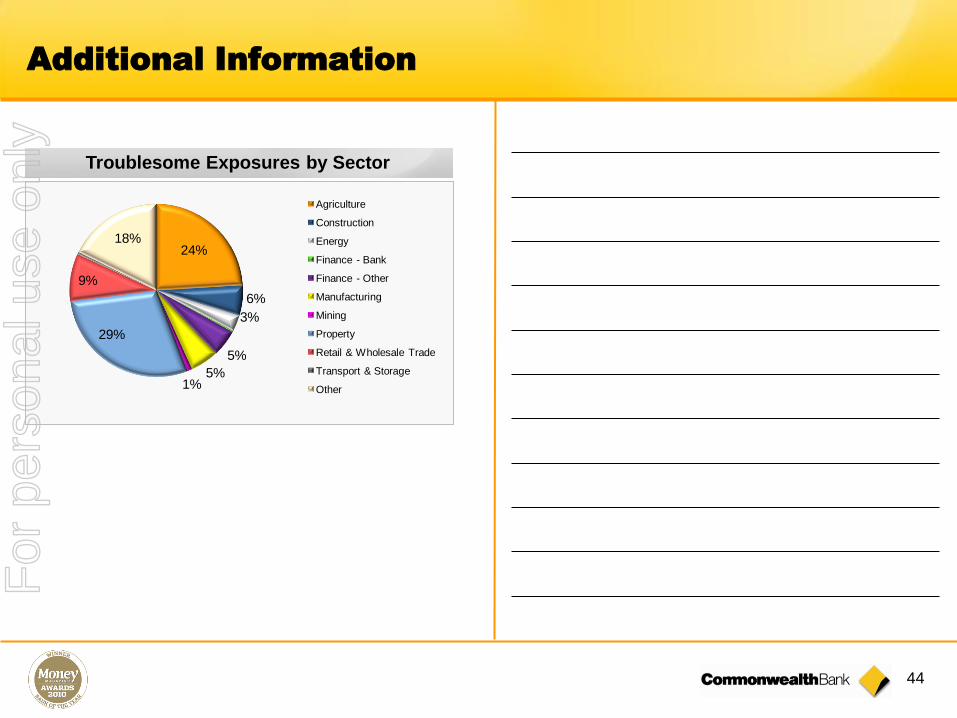
Troublesome Exposures by Sector
24%
6%
3%
5%
5%1%
29%
9%
18%
Agriculture
Construction
Energy
Finance - Bank
Finance - Other
Manufacturing
Mining
Property
Retail & Wholesale Trade
Transport & Storage
Other
Additional Information
For
per
sona
l use
onl
y

45
Jun 09 Dec 09 Jun 10 Dec 10
bpts
35 40 34
Improving credit quality
30 days +
CBA Home Loans*
BWA Home Loans
CBA Credit CardsCBA Personal Loans
* includes customer assist
0.0%
1.0%
2.0%
3.0%
4.0%
5.0%
Jun 08 Dec 08 Jun 09 Dec 09 Jun 10 Dec 10
Exposure
($m
)
Dec
07
Dec
08
Dec
09
Dec
10
Risk-Rated Portfolios
-30,000
-25,000
-20,000
-15,000
-10,000
-5,000
0
5,000
10,000
Total Upgrades
Total Downgrades
Net
4.54.9
Jun 08 Dec 08 Jun 09 Dec 09 Jun 10 Dec 10
CBA (including ASB) Bankwest
$bn
4.9
bpts 2 101 166 197
5.5
2.9
5.56.2
7.2
238
8.5
5.7
275
7.7
248
CBA Bankwest New
28
58
$4,210m
61
$4,823m
62
$5,216m
3
102
8696
102
$5,184m
51 49 464068
Total and New Impaired Assets to GLATroublesome Exposures 1
Dec
06
1 Includes defaulted/well secured exposures and exposures where there is a potential for default within ~ 12 months if a sustained
improvement in financial performance is not achieved within the short term. Does not include impaired exposures
2 As a percentage of Total Commercial Exposures
3 As a percentage of Gross Loans and Advances
Risk Rated Portfolio MigrationsConsumer Arrears
For
per
sona
l use
onl
y
46
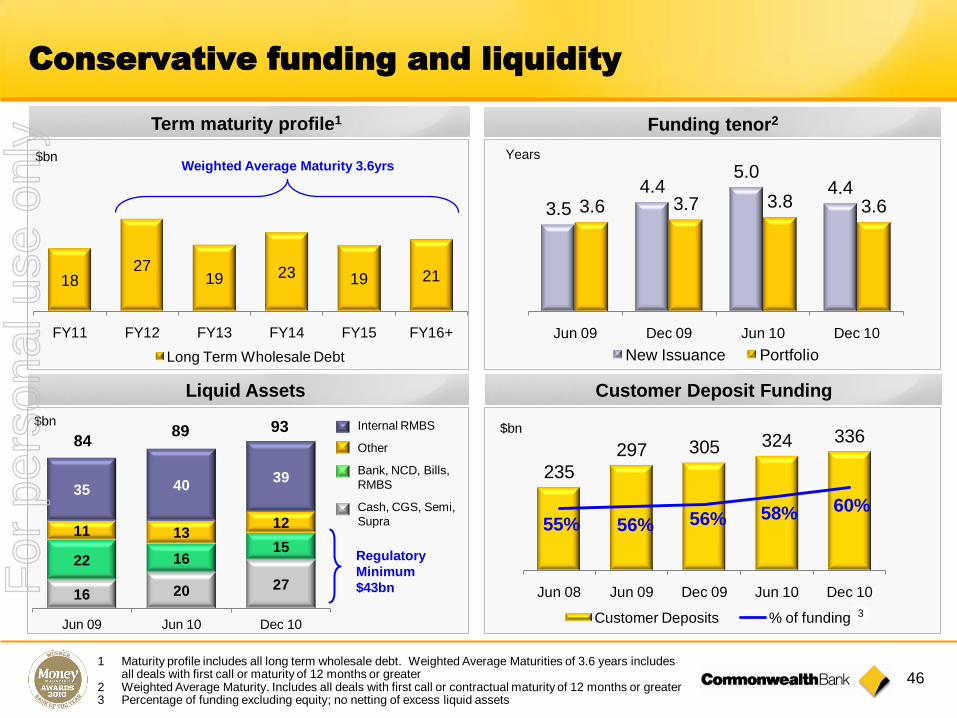
1827
19 23 19 21
FY11 FY12 FY13 FY14 FY15 FY16+
Long Term Wholesale Debt
Conservative funding and liquidity
$bn
1 Maturity profile includes all long term wholesale debt. Weighted Average Maturities of 3.6 years includes all deals with first call or maturity of 12 months or greater
2 Weighted Average Maturity. Includes all deals with first call or contractual maturity of 12 months or greater3 Percentage of funding excluding equity; no netting of excess liquid assets
Weighted Average Maturity 3.6yrs
3.5
4.45.0
4.43.6 3.7 3.8 3.6
Jun 09 Dec 09 Jun 10 Dec 10
New Issuance Portfolio
Years
$bn
Regulatory
Minimum
$43bn16 20 27
22 1615
11 1312
35 4039
Jun 09 Jun 10 Dec 10
8489 93 $bn
1
235
297 305 324 336
55% 56% 56% 58% 60%
Jun 08 Jun 09 Dec 09 Jun 10 Dec 10
Customer Deposits % of funding 3
Internal RMBS
Other
Bank, NCD, Bills,
RMBS
Cash, CGS, Semi,
Supra
Funding tenor2Term maturity profile1
Customer Deposit FundingLiquid Assets
For
per
sona
l use
onl
y

47
Deposit funded
Funded
assets
Jun 10
Funded
assets
Dec 10
Wholesale
Funding
Deposits
Funded assets includes securitisation, bank acceptances of customers and accounting gross-ups
Short term Long term$bn
593 602 592
12 2 (5)
(10)
Total
funded
assets
AIFRS &
FX on
debt issues
60%19%
5%
14%1%1%
Customer Deposits
ST Wholesale Funding
LT Wholesale maturing <12m
LT Wholesale maturing >=12m
RMBS
Hybrids
60% Deposit Funded
For
per
sona
l use
onl
y

48
Notes
For
per
sona
l use
onl
y
49
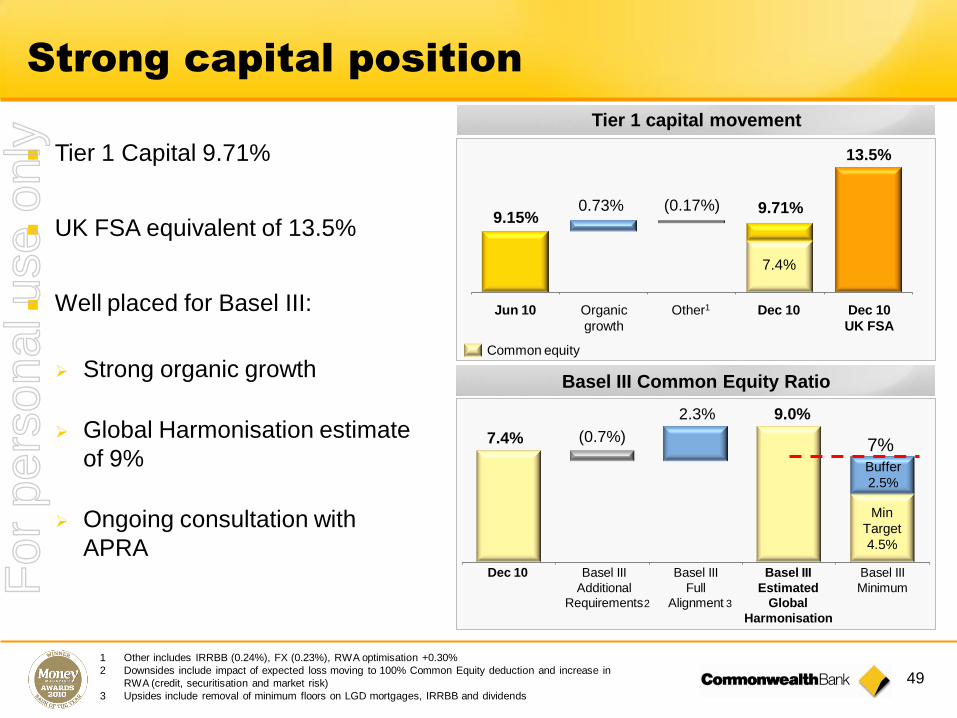
Strong capital position
Tier 1 capital movement
Customer Deposit FundingBasel III Common Equity Ratio
Jun 10 Organic
growth
Tier 1 Capital 9.71%
UK FSA equivalent of 13.5%
Well placed for Basel III:
Strong organic growth
Global Harmonisation estimate
of 9%
Ongoing consultation with
APRA
7.4% (0.7%)
2.3% 9.0%
Dec 10 Basel III
Estimated
Global
Harmonisation
Basel III
Additional
Requirements
9.15%
13.5%
0.73% (0.17%)
Dec 10
Common equity
Dec 10
UK FSA
Other1
9.71%
Min
Target
4.5%
Buffer
2.5%
Basel III
Minimum
Basel III
Full
Alignment
7%
1 Other includes IRRBB (0.24%), FX (0.23%), RWA optimisation +0.30%
2 Downsides include impact of expected loss moving to 100% Common Equity deduction and increase in
RWA (credit, securitisation and market risk)
3 Upsides include removal of minimum floors on LGD mortgages, IRRBB and dividends
2 3
7.4%
For
per
sona
l use
onl
y

50
Snapshot – 1H11 Results*
Cash earnings ($m) 3,335 +13%
ROE (Cash) 19.2% +70bpts
Cash EPS ($) 2.14 +12%
DPS ($) 1.32 +10%
Cost-to-Income 45.4% 70bpts
NIM 2.12% (6bpts)
Total Assets ($bn) 650 +4%
Total Liabilities ($bn) 614 +4%
FUA ($bn) 199 +3%
RWAs ($bn) 286 (4%)
Provisions to Credit RWAs 2.25% +21bpts
* All movements on prior comparative period.
Financial
Strong balance sheet
RBS ($m) 1,383 +12%
IB&M ($m) 512 (7%)
BPB ($m) 506 +15%
Bankwest ($m) 224 Large
Wealth Management ($m) 359 (5%)
NZ (NZD $m) 293 +58%
Cash NPAT by division
Tier 1 Capital 9.71% +61bpts
Tier 1 – UK FSA 13.5% +110bpts
WAM – New Issuance (yrs) 4.4 -
Deposit Funding (%) 60% +4%
Liquid Assets ($bn) 93 +4%
Capital & Funding
For
per
sona
l use
onl
y
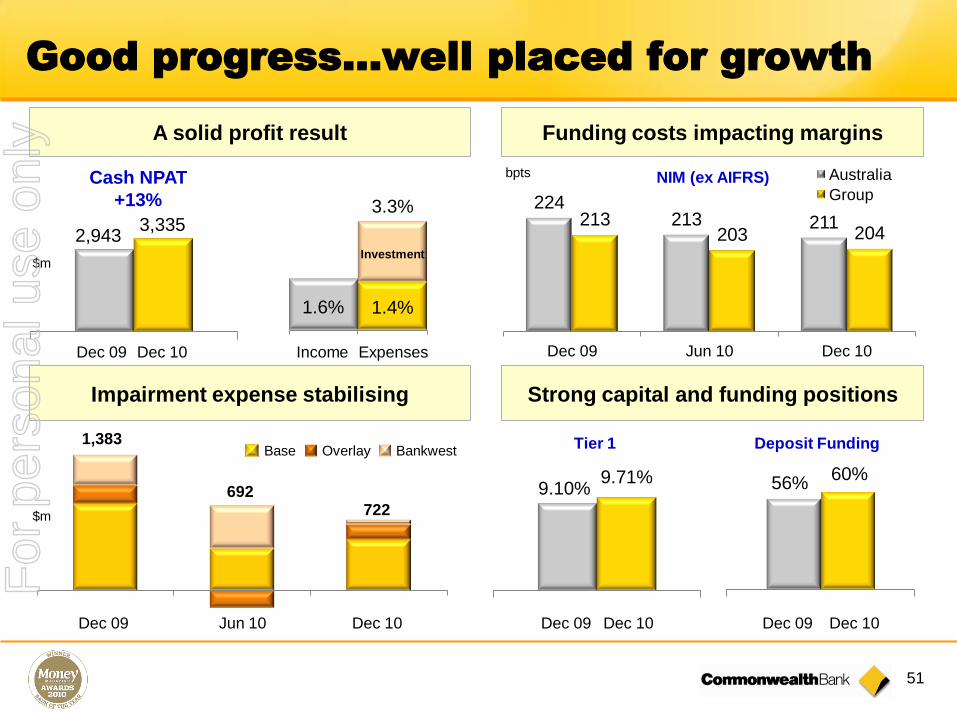
51
Strong capital and funding positions Impairment expense stabilising
Funding costs impacting marginsA solid profit result
Good progress...well placed for growth
224213 211213
203 204
Dec 09 Jun 10 Dec 10
Australia
Group
9.10%9.71%
Tier 1 Deposit Funding
56%60%
2,9433,335
Cash NPAT
+13%
1.6% 1.4%
3.3%
Investment
Dec 09 Dec 10 Dec 09 Dec 10
Dec 09 Dec 10 Income Expenses
$m
NIM (ex AIFRS)bpts
Jun 10 Dec 09 Dec 10
1,383
692722
OverlayBase Bankwest
$m
For
per
sona
l use
onl
y

52
Notes
For
per
sona
l use
onl
y
Commonwealth Bank of Australia ACN 123 123 124
Results PresentationFor the half year ended 31 December 2009
10 February 2010
For
per
sona
l use
onl
y

54
Index
Overview and Strategy 54
Business Performance 66
Risk Management 84
Capital, Funding and Liquidity 93
Economic Overview 104
For
per
sona
l use
onl
y

55
CBA Overview
Largest Australian Bank by market capitalisation and 2nd largest listed company
AA Credit Rating
Tier 1 Capital Ratio of 9.71%; or 13.5% on UK FSA basis
Total Assets of $650bn
13 million customers; large distribution footprint
#1 in household deposits – over 30% share
#1 in home lending ~26% share
#1 FirstChoice platform ~11% shareFor
per
sona
l use
onl
y

56
Transformational change - scorecard
Customer Satisfaction
Retail 64.9% 75.4%
Business - DBM n/a Ranked equal 1st
FirstChoice Ranked 2nd Ranked 1st
Share of Ombudsman Complaints 29.8% 15.1%
Market Shares
Home Lending 18.7% 25.9%
Business Lending 12.1% 18.6%
Household Deposits 29.3% 30.5%
Business Deposits 11.9% 21.3%
Products per Customer 2.17 2.64
System Reliability – Sev. 1 incidents pa 66 3 (YTD)
Employee Engagement – Percentile 69th 76th
Total Shareholder Return – RankingRanked 1st
( 2, 3, 4, 5yrs)
1
5
1, 2, 3, 4 – Refer note slide at back of this presentation for source information5 Source RBA/APRA. June 2006 market shares do not include Bankwest6 Major banks
4
2
Jun 06
6
Dec 10
Progress
3
For
per
sona
l use
onl
y
57
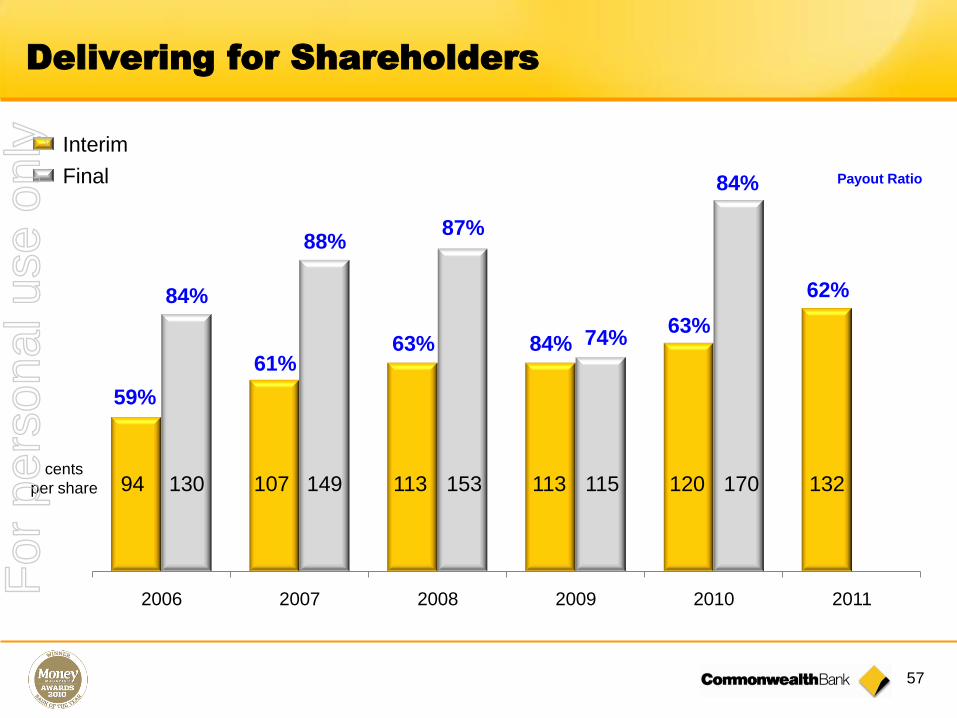
Delivering for Shareholders
2006 2007 2008 2009 2010 2011
63%84%63%
61%
74%
87%88%
Payout Ratio
59%
Interim
Final
84%
cents
per share 94 107 113 113 120130 149 153 115
84%
170 132
62%
For
per
sona
l use
onl
y
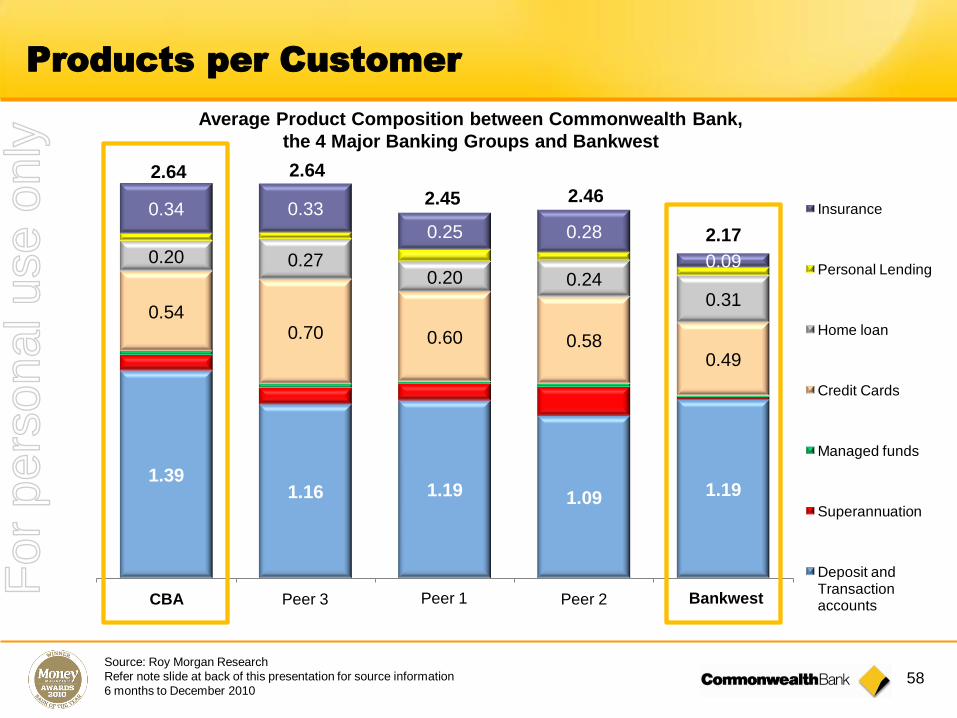
58
Products per Customer
Source: Roy Morgan Research
Refer note slide at back of this presentation for source information
6 months to December 2010
1.391.16 1.19 1.09 1.19
0.540.70 0.60 0.58
0.49
0.20 0.270.20 0.24
0.31
0.34 0.33
0.25 0.28
0.09
Insurance
Personal Lending
Home loan
Credit Cards
Managed funds
Superannuation
Deposit and Transaction accounts
2.64 2.64
2.45 2.46
2.17
Average Product Composition between Commonwealth Bank,
the 4 Major Banking Groups and Bankwest
Peer 3 Peer 1 BankwestCBA Peer 2
For
per
sona
l use
onl
y

59
Institutional Banking
Understanding Customers’ BusinessLoyalty to Relationship
More
Satisfied
Less
Satisfied
Lower the Score the Higher the Satisfaction
Source : East & Partners' Institutional Banking Markets Report October 2010
Lower the Score the Higher the Satisfaction
More
Satisfied
Less
Satisfied
Peer 3
Peer 2
Peer 1
CBA
Peer 3
Peer 2
Peer 1
CBARanked
No. 1
Ranked
No. 1
For
per
sona
l use
onl
y
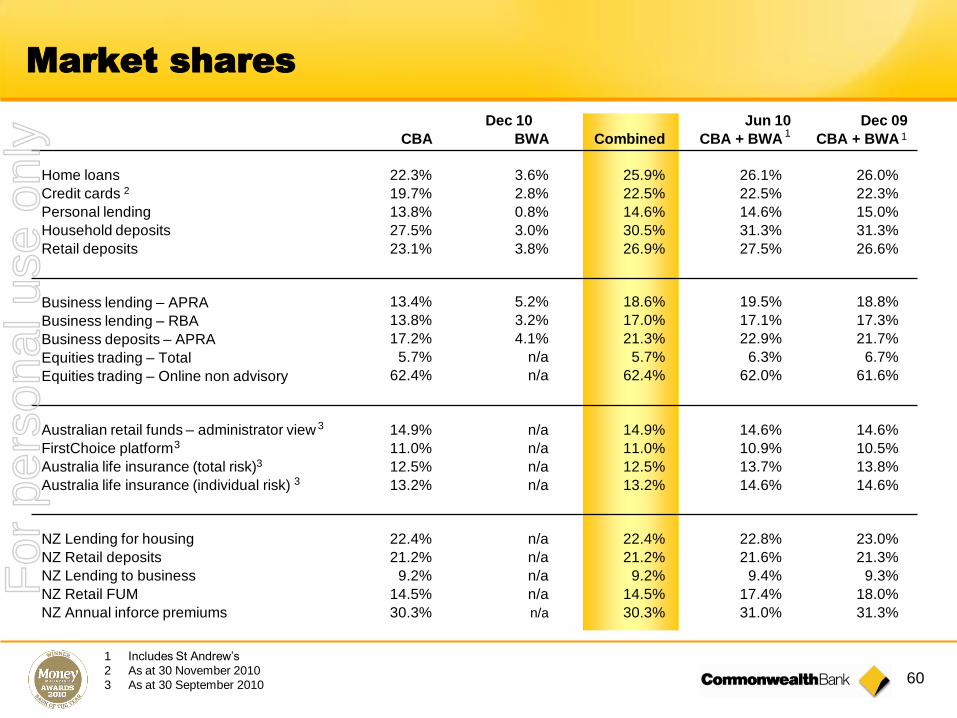
60
Dec 10 Jun 10 Dec 09
CBA BWA Combined CBA + BWA CBA + BWA
Home loans 22.3% 3.6% 25.9% 26.1% 26.0%
Credit cards 2 19.7% 2.8% 22.5% 22.5% 22.3%
Personal lending 13.8% 0.8% 14.6% 14.6% 15.0%
Household deposits 27.5% 3.0% 30.5% 31.3% 31.3%
Retail deposits 23.1% 3.8% 26.9% 27.5% 26.6%
Business lending – APRA 13.4% 5.2% 18.6% 19.5% 18.8%
Business lending – RBA 13.8% 3.2% 17.0% 17.1% 17.3%
Business deposits – APRA 17.2% 4.1% 21.3% 22.9% 21.7%
Equities trading – Total 5.7% n/a 5.7% 6.3% 6.7%
Equities trading – Online non advisory 62.4% n/a 62.4% 62.0% 61.6%
Australian retail funds – administrator view 14.9% n/a 14.9% 14.6% 14.6%
FirstChoice platform 11.0% n/a 11.0% 10.9% 10.5%
Australia life insurance (total risk) 12.5% n/a 12.5% 13.7% 13.8%
Australia life insurance (individual risk) 13.2% n/a 13.2% 14.6% 14.6%
NZ Lending for housing 22.4% n/a 22.4% 22.8% 23.0%
NZ Retail deposits 21.2% n/a 21.2% 21.6% 21.3%
NZ Lending to business 9.2% n/a 9.2% 9.4% 9.3%
NZ Retail FUM 14.5% n/a 14.5% 17.4% 18.0%
NZ Annual inforce premiums 30.3% n/a 30.3% 31.0% 31.3%
Market shares
1 Includes St Andrew’s
2 As at 30 November 2010
3 As at 30 September 2010
1 1
3
3
3
3
For
per
sona
l use
onl
y
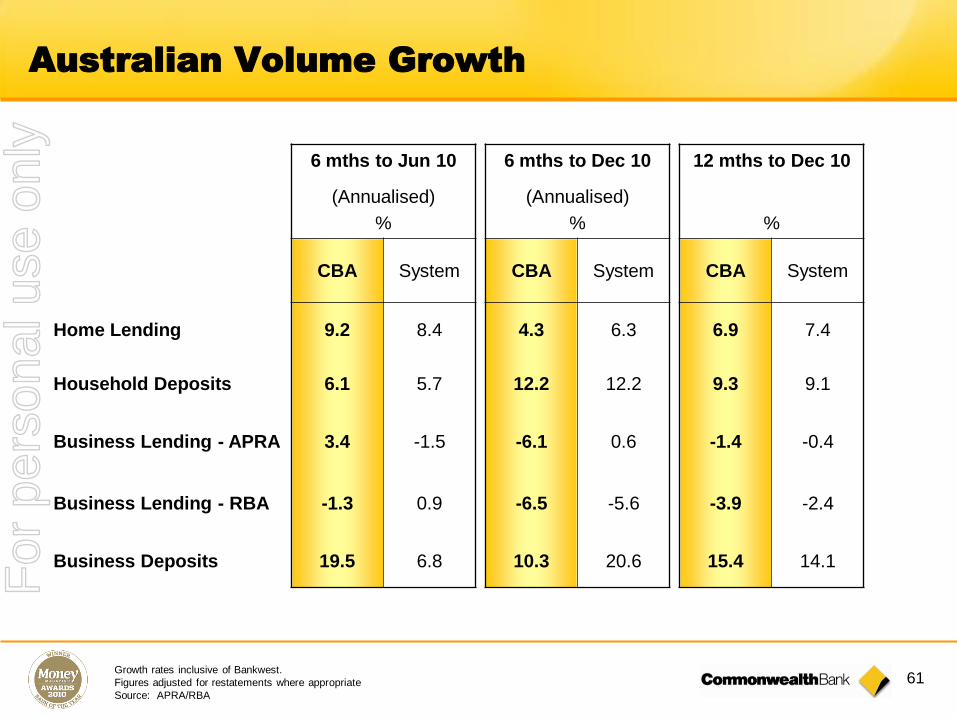
61
6 mths to Jun 10 6 mths to Dec 10 12 mths to Dec 10
(Annualised) (Annualised)
% % %
CBA System CBA System CBA System
Home Lending 9.2 8.4 4.3 6.3 6.9 7.4
Household Deposits 6.1 5.7 12.2 12.2 9.3 9.1
Business Lending - APRA 3.4 -1.5 -6.1 0.6 -1.4 -0.4
Business Lending - RBA -1.3 0.9 -6.5 -5.6 -3.9 -2.4
Business Deposits 19.5 6.8 10.3 20.6 15.4 14.1
Australian Volume Growth
Growth rates inclusive of Bankwest.
Figures adjusted for restatements where appropriate
Source: APRA/RBA
For
per
sona
l use
onl
y

62
Home Loan Growth by Channel
Jun 10Dec 09
11%
7%
2%
7%
4%
Broker Branch Premium Total CBA Total Market
Note : Width of channel columns reflects relative proportion of total CBA balances
Total CBA and Market balance growth sourced from RBA
Excludes Bankwest
Dec 10
5%
4%
3%
4%4%
Balance Growth by Channel - 6 months
3%
2%2%
3%
2%
For
per
sona
l use
onl
y
63
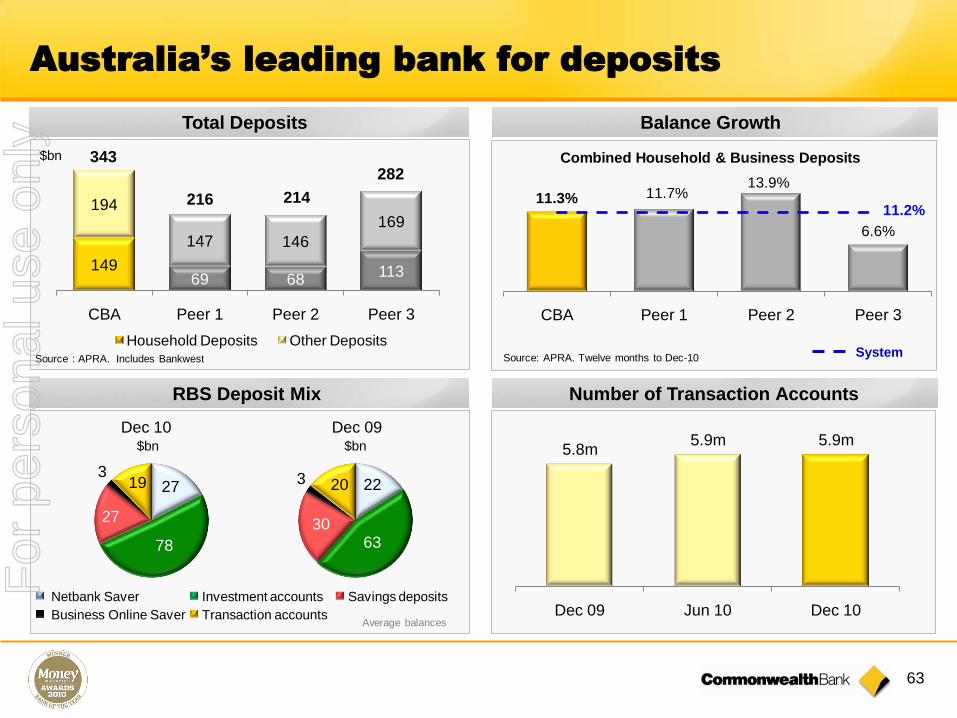
Australia’s leading bank for deposits
Total Deposits
Source: APRA. Twelve months to Dec-10 System
11.3% 11.7%13.9%
6.6%
11.2%
CBA Peer 1 Peer 2 Peer 3
Combined Household & Business Deposits
Dec 10 Dec 09$bn
Netbank Saver Investment accounts Savings deposits
Business Online Saver Transaction accounts
3262
$bn
27
78
27
319 22
6330
3 20
Average balances
14969 68
113
194
147 146
169
CBA Peer 1 Peer 2 Peer 3
Household Deposits Other DepositsSource : APRA. Includes Bankwest
RBS Deposit Mix Number of Transaction Accounts
Balance Growth
343
216 214
282
$bn
5.8m5.9m 5.9m
Dec 09 Jun 10 Dec 10
For
per
sona
l use
onl
y
64
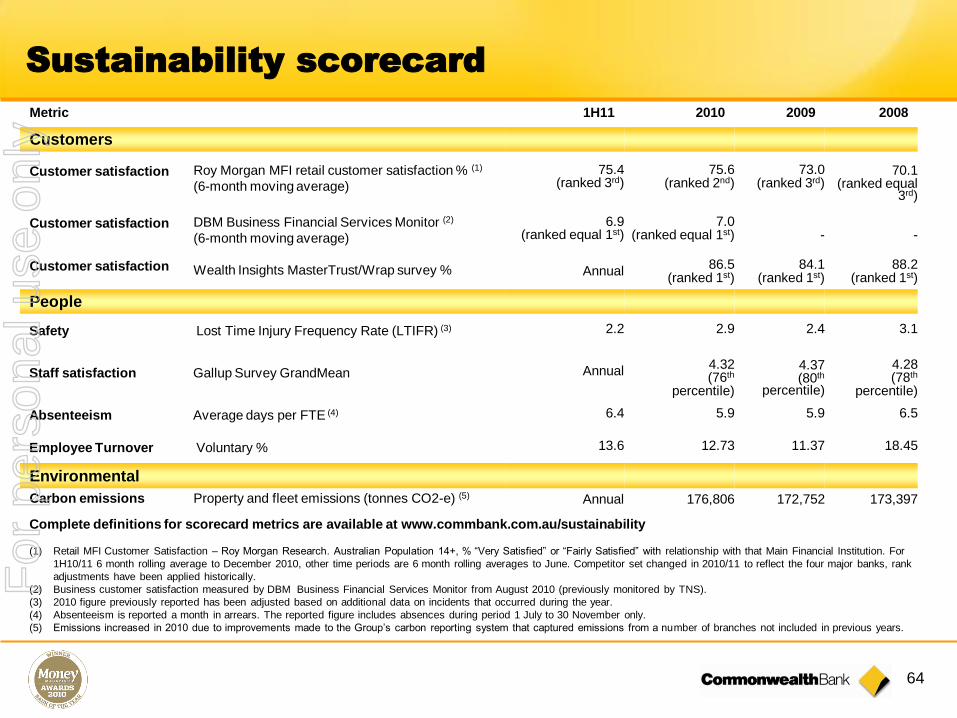
Sustainability scorecard
Metric 1H11 2010 2009 2008
Customers
Customer satisfaction Roy Morgan MFI retail customer satisfaction % (1)
(6-month moving average)
75.4(ranked 3rd)
75.6(ranked 2nd)
73.0(ranked 3rd)
70.1(ranked equal
3rd)
Customer satisfaction DBM Business Financial Services Monitor (2)
(6-month moving average)
6.9(ranked equal 1st)
7.0(ranked equal 1st) - -
Customer satisfaction Wealth Insights MasterTrust/Wrap survey % Annual86.5
(ranked 1st)84.1
(ranked 1st)88.2
(ranked 1st)
People
Safety Lost Time Injury Frequency Rate (LTIFR) (3) 2.2 2.9 2.4 3.1
Staff satisfaction Gallup Survey GrandMean Annual4.32(76th
percentile)
4.37(80th
percentile)
4.28(78th
percentile)
Absenteeism Average days per FTE (4) 6.4 5.9 5.9 6.5
Employee Turnover Voluntary % 13.6 12.73 11.37 18.45
Environmental
Carbon emissions Property and fleet emissions (tonnes CO2-e) (5) Annual 176,806 172,752 173,397
Complete definitions for scorecard metrics are available at www.commbank.com.au/sustainability
(1) Retail MFI Customer Satisfaction – Roy Morgan Research. Australian Population 14+, % “Very Satisfied” or “Fairly Satisfied” with relationship with that Main Financial Institution. For
1H10/11 6 month rolling average to December 2010, other time periods are 6 month rolling averages to June. Competitor set changed in 2010/11 to reflect the four major banks, rank
adjustments have been applied historically.
(2) Business customer satisfaction measured by DBM Business Financial Services Monitor from August 2010 (previously monitored by TNS).
(3) 2010 figure previously reported has been adjusted based on additional data on incidents that occurred during the year.
(4) Absenteeism is reported a month in arrears. The reported figure includes absences during period 1 July to 30 November only.
(5) Emissions increased in 2010 due to improvements made to the Group’s carbon reporting system that captured emissions from a number of branches not included in previous years.
For
per
sona
l use
onl
y
65
People
Significant progress on our Indigenous School Based Trainee Program, with 21 School Based Trainees completing their
traineeship while 47 new trainees commenced with the Group in December 2010.
Launched the Group’s updated Disability Action Plan in December 2010, highlighting progress and setting out further
improvement goals and actions. (commbank.com.au/disability-action-plan)
Customers
Commonwealth Bank Foundation received an Australian Business Award for innovation for the development of StartSmart
Primary, one the Foundation’s youth financial literacy programs.
Second Viewpoint report published, measuring the economic health of the nation and examining the impact of the
resources boom in mining areas of Australia. (commbank.com.au/viewpoint)
Community
Launched the Group’s 2010/11 Reconciliation Action Plan in December 2010, highlighting our commitment across financial
services employment, enterprise support, education and financial literacy. (www.commbank.com.au/rap)
The Group’s health partnerships received strong support from staff, with more than $215,000 fundraised for the Prostate
Cancer Foundation and over $440,000 in diary sales and fundraising for the Breast Cancer Institute of Australia.
Environment
The Refreshingly Green Program, consisting of a range of environmental initiatives to be implemented across retail
branches and commercial buildings, commenced in late 2010. Initiatives are scheduled for completion in late 2012.
Improved result in the 2010 Carbon Disclosure Project, scoring 92 out of 100 in the Carbon Disclosure Leadership Index
and placing in the top 10% of Global 500 for the second year.
Governance
Released second annual Sustainability Report covering sustainability performance for 2009-2010. (commbank.com.au/sustainability-reporting)
Sustainability progress
More information about sustainability is available at commbank.com.au/sustainability
For
per
sona
l use
onl
y

66
Index
Overview and Strategy 54
Business Performance 66
Risk Management 84
Capital, Funding and Liquidity 93
Economic Overview 104
For
per
sona
l use
onl
y
67
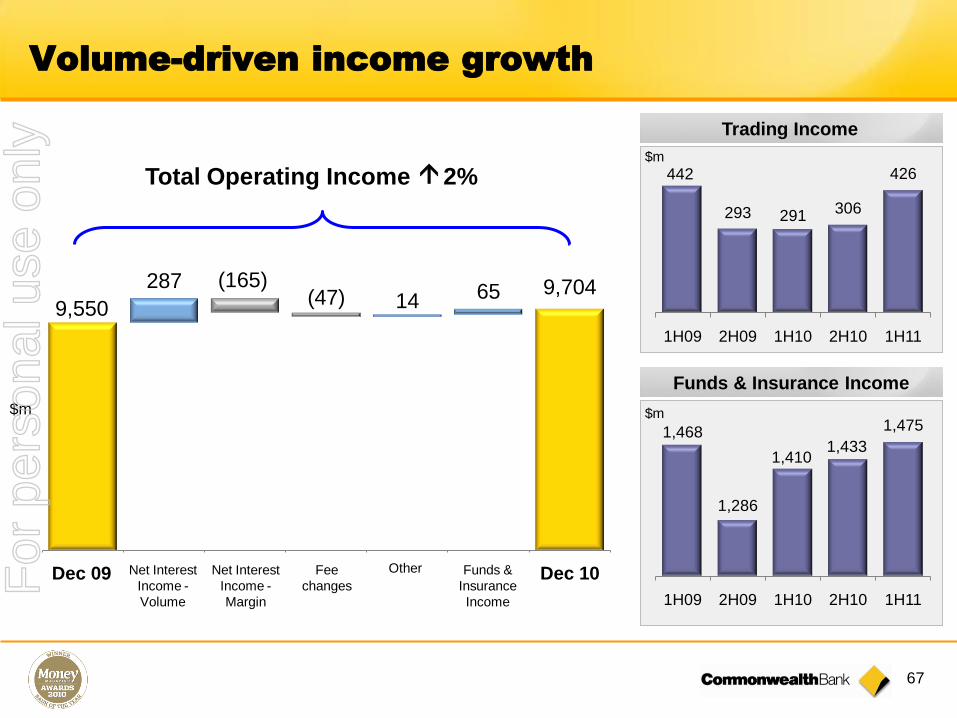
Volume-driven income growth
9,5509,704287 (165)
(47) 14 65
1,468
1,286
1,4101,433
1,475
1H09 2H09 1H10 2H10 1H11
Funds & Insurance Income
Total Operating Income 2%
$m $m
442
293 291 306
426
1H09 2H09 1H10 2H10 1H11
Trading Income
$m
Dec 09 Dec 10Net Interest
Income -
Volume
Net Interest
Income -
Margin
Fee
changes
Funds &
Insurance
Income
Other For
per
sona
l use
onl
y
68
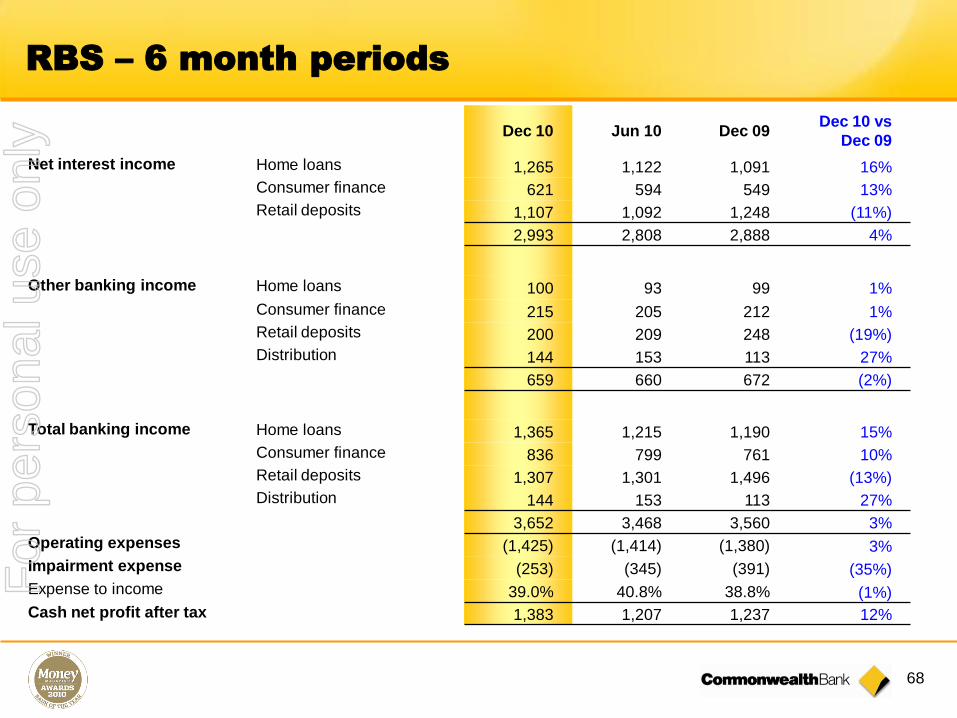
RBS – 6 month periods
Dec 10 Jun 10 Dec 09Dec 10 vs
Dec 09
Net interest income Home loans 1,265 1,122 1,091 16%
Consumer finance 621 594 549 13%
Retail deposits 1,107 1,092 1,248 (11%)
2,993 2,808 2,888 4%
Other banking income Home loans 100 93 99 1%
Consumer finance 215 205 212 1%
Retail deposits 200 209 248 (19%)
Distribution 144 153 113 27%
659 660 672 (2%)
Total banking income Home loans 1,365 1,215 1,190 15%
Consumer finance 836 799 761 10%
Retail deposits 1,307 1,301 1,496 (13%)
Distribution 144 153 113 27%
3,652 3,468 3,560 3%
Operating expenses (1,425) (1,414) (1,380) 3%
Impairment expense (253) (345) (391) (35%)
Expense to income 39.0% 40.8% 38.8% (1%)
Cash net profit after tax 1,383 1,207 1,237 12%
For
per
sona
l use
onl
y

69
Dec 10
$m
Dec 10 vs
Dec 09
Home loans 1,365 15%
Consumer finance 836 10%
Retail deposits 1,307 (13%)
Distribution 144 27%
Total banking income 3,652 3%
Operating expenses (1,425) 3%
Operating performance 2,227 2%
Impairment expense 253 (35%)
Tax 591 7%
Cash net profit after tax 1,383 12%
Retail Banking Services
Strong business performance
supported by customer focus and
cost efficiency
Solid volume growth in Home
Loans and Deposits
Strong competition maintaining
pressure on Deposit margins
Cost-to-income ratio remains
below 40%
Improvement in arrears rates and
impairment expenseFor
per
sona
l use
onl
y

70
IB&M – 6 month periods
Dec 10 Jun 10 Dec 09Dec 10 vs
Dec 09
Net interest income Institutional Banking 545 558 569 (4%)
Markets 105 93 114 (8%)
650 651 683 (5%)
Other banking income Institutional Banking 345 401 341 1%
Markets 265 173 342 (23%)
610 574 683 (11%)
Total banking income Institutional Banking 890 959 910 (2%)
Markets 370 266 456 (19%)
1,260 1,225 1,366 (8%)
Operating expenses (395) (405) (387) 2%
Profit before impairment expenses 865 820 979 (12%)
Impairment expense (193) 72 (321) (40%)
Expense to income 31.3% 33.1% 28.3% 11%
Cash net profit after tax 512 646 553 (7%)
For
per
sona
l use
onl
y
71
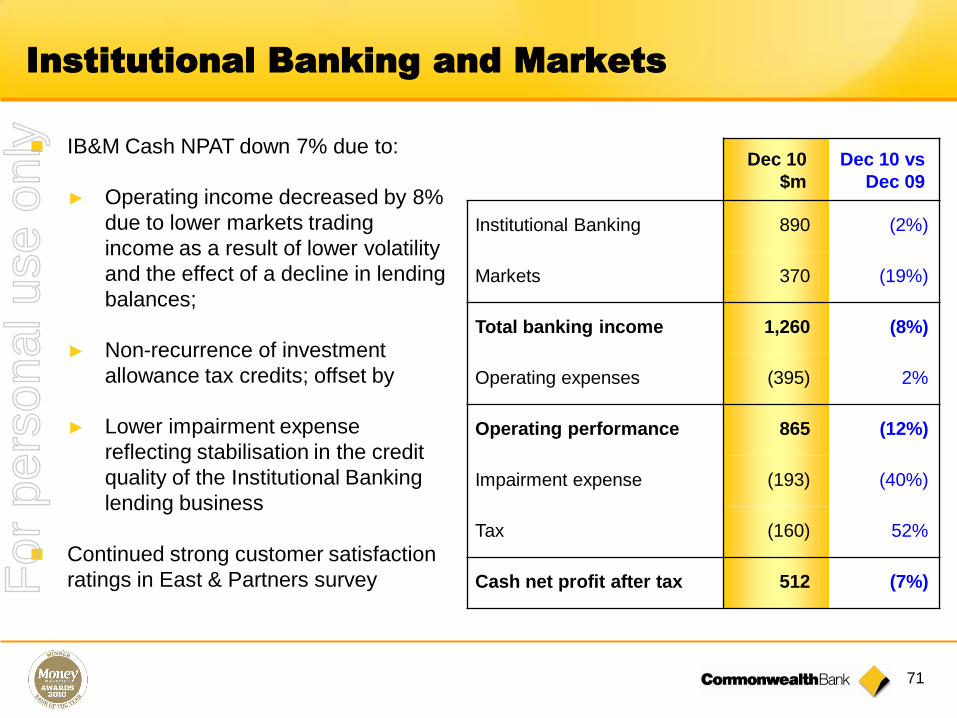
Institutional Banking and Markets
Dec 10
$m
Dec 10 vs
Dec 09
Institutional Banking 890 (2%)
Markets 370 (19%)
Total banking income 1,260 (8%)
Operating expenses (395) 2%
Operating performance 865 (12%)
Impairment expense (193) (40%)
Tax (160) 52%
Cash net profit after tax 512 (7%)
IB&M Cash NPAT down 7% due to:
► Operating income decreased by 8%
due to lower markets trading
income as a result of lower volatility
and the effect of a decline in lending
balances;
► Non-recurrence of investment
allowance tax credits; offset by
► Lower impairment expense
reflecting stabilisation in the credit
quality of the Institutional Banking
lending business
Continued strong customer satisfaction
ratings in East & Partners survey For
per
sona
l use
onl
y

72
BPB – 6 month periods
Dec 10 Jun 10 Dec 09Dec 10 vs
Dec 09
Net interest income Corporate Financial Services 264 262 267 (1%)
Regional & Agribusiness 126 121 120 5%
Local Business Banking 258 245 222 16%
Private Bank 60 60 63 (5%)
Equities and Margin Lending 105 107 108 (3%)
Other 38 26 42 (10%)
851 821 822 4%Other banking income Corporate Financial Services 296 251 221 34%
Regional & Agribusiness 78 72 71 10%
Local Business Banking 120 117 123 (2%)
Private Bank 60 58 57 5%
Equities and Margin Lending 99 113 142 (30%)
Other 14 12 12 17%
667 623 626 7%Total banking income Corporate Financial Services 560 513 488 15%
Regional & Agribusiness 204 193 191 7%
Local Business Banking 378 362 345 10%
Private Bank 120 118 120 -
Equities and Margin Lending 204 220 250 (18%)
Other 52 38 54 (4%)
1,518 1,444 1,448 5%Operating expenses (660) (671) (639) 3%Impairment expense (135) (132) (194) (30%)Expense to income 43.5% 46.5% 44.1% (1%)Cash net profit after tax 506 453 440 15%
For
per
sona
l use
onl
y
73
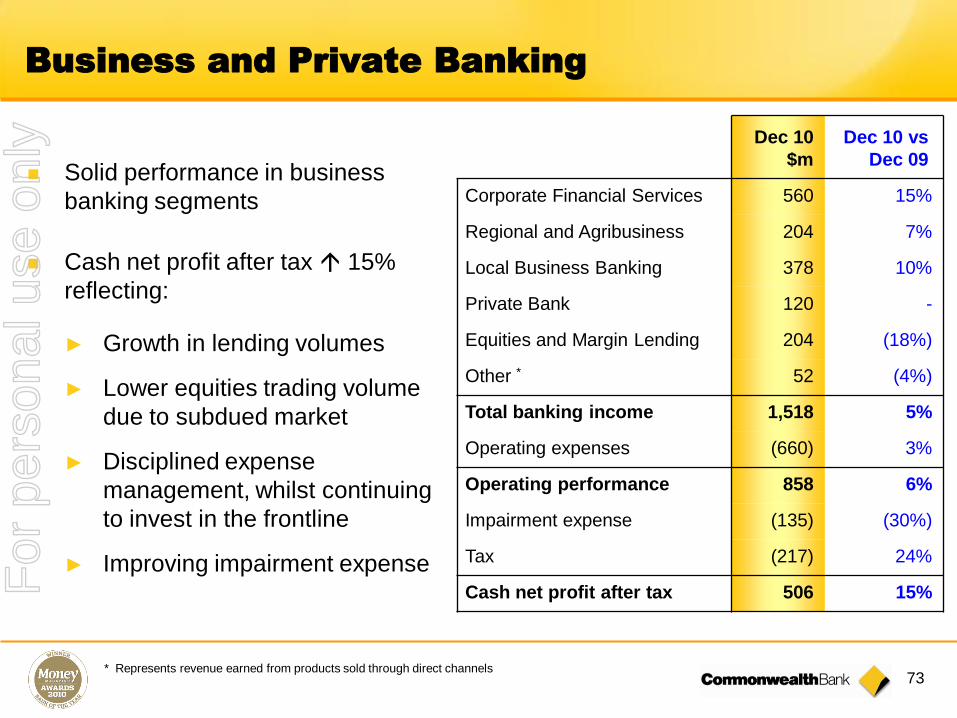
Business and Private Banking
Solid performance in business
banking segments
Cash net profit after tax 15%
reflecting:
► Growth in lending volumes
► Lower equities trading volume
due to subdued market
► Disciplined expense
management, whilst continuing
to invest in the frontline
► Improving impairment expense
* Represents revenue earned from products sold through direct channels
Dec 10
$m
Dec 10 vs
Dec 09
Corporate Financial Services 560 15%
Regional and Agribusiness 204 7%
Local Business Banking 378 10%
Private Bank 120 -
Equities and Margin Lending 204 (18%)
Other * 52 (4%)
Total banking income 1,518 5%
Operating expenses (660) 3%
Operating performance 858 6%
Impairment expense (135) (30%)
Tax (217) 24%
Cash net profit after tax 506 15%For
per
sona
l use
onl
y
74
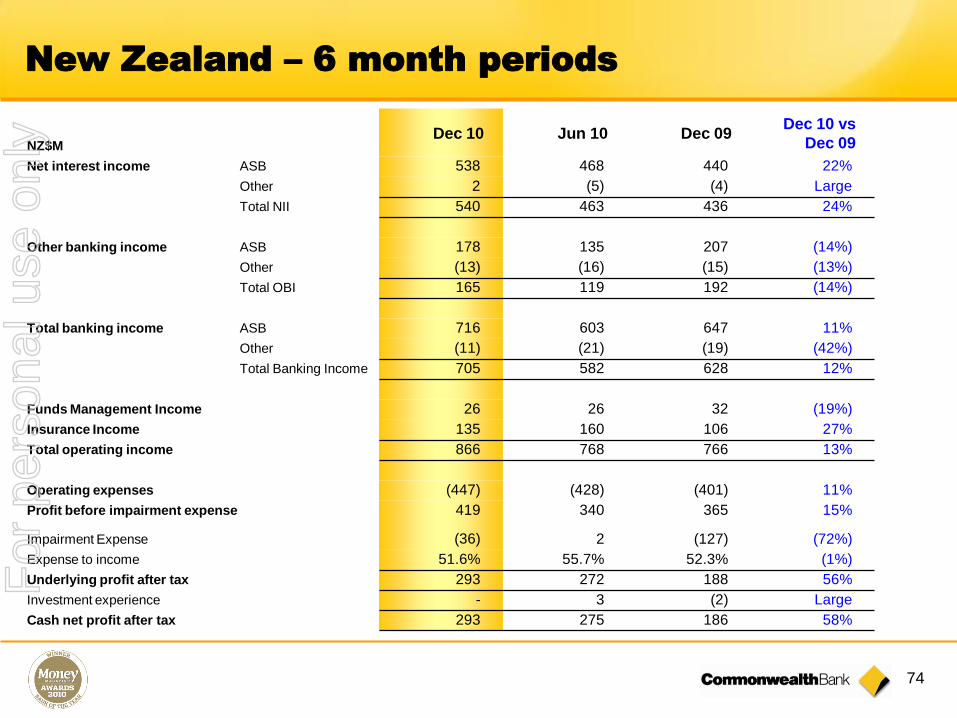
New Zealand – 6 month periods
NZ$MDec 10 Jun 10 Dec 09
Dec 10 vs
Dec 09
Net interest income ASB 538 468 440 22%
Other 2 (5) (4) Large
Total NII 540 463 436 24%
Other banking income ASB 178 135 207 (14%)
Other (13) (16) (15) (13%)
Total OBI 165 119 192 (14%)
Total banking income ASB 716 603 647 11%
Other (11) (21) (19) (42%)
Total Banking Income 705 582 628 12%
Funds Management Income 26 26 32 (19%)
Insurance Income 135 160 106 27%
Total operating income 866 768 766 13%
Operating expenses (447) (428) (401) 11%
Profit before impairment expense 419 340 365 15%
Impairment Expense (36) 2 (127) (72%)
Expense to income 51.6% 55.7% 52.3% (1%)
Underlying profit after tax 293 272 188 56%
Investment experience - 3 (2) Large
Cash net profit after tax 293 275 186 58%
For
per
sona
l use
onl
y

75
New Zealand
Dec 10
NZ$m
Dec 10 vs
Dec 09
ASB 743 9%
Sovereign 131 30%
Other (8) 47%
Total operating income 866 13%
Operating expenses (447) 11%
Operating performance 419 15%
Impairment expense (36) (72%)
Tax and minority interests (90) 80%
Underlying profit after tax 293 56%
Investment experience - Large
Cash net profit after tax 293 58%
ASB NZD Cash NPAT 57%
due to:
► Improving home loan margins
► Lower impairment expense due
to improving arrears across all
portfolios
Sovereign NZD cash NPAT 67%
due to:
► Improved claims experience and
reduced lapse rates
► Inforce premiums 7%
Sovereign is clear market leader
capturing 25% of new business salesFor
per
sona
l use
onl
y
76
WM – 6 month periods
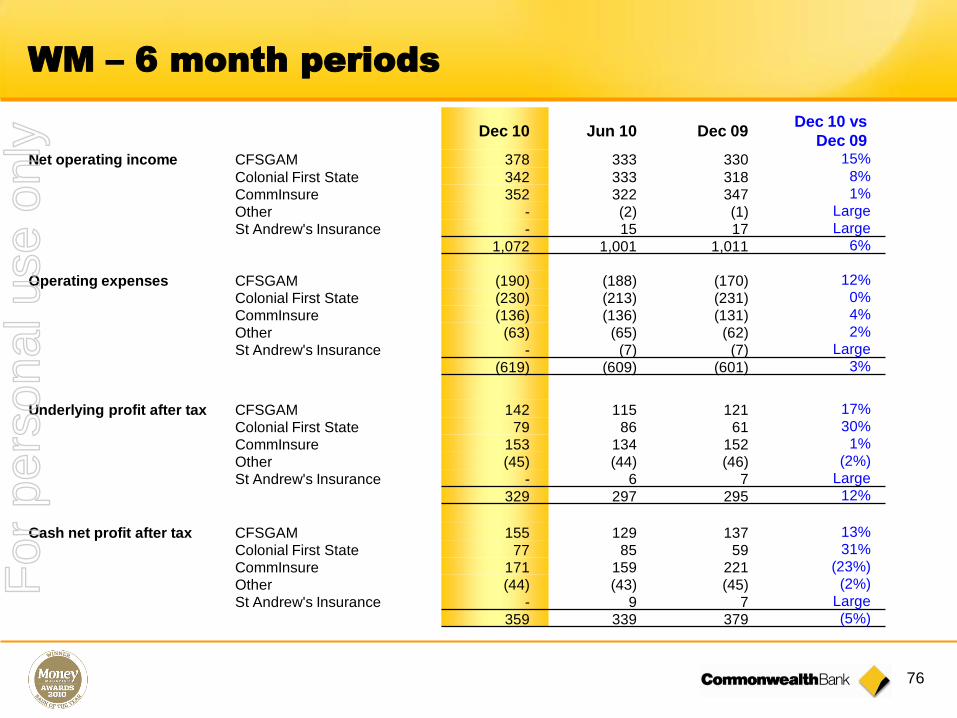
Dec 10 Jun 10 Dec 09Dec 10 vs
Dec 09Net operating income CFSGAM 378 333 330 15%
Colonial First State 342 333 318 8%
CommInsure 352 322 347 1%
Other - (2) (1) Large
St Andrew's Insurance - 15 17 Large
1,072 1,001 1,011 6%
Operating expenses CFSGAM (190) (188) (170) 12%
Colonial First State (230) (213) (231) 0%
CommInsure (136) (136) (131) 4%
Other (63) (65) (62) 2%
St Andrew's Insurance - (7) (7) Large
(619) (609) (601) 3%
Underlying profit after tax CFSGAM 142 115 121 17%
Colonial First State 79 86 61 30%
CommInsure 153 134 152 1%
Other (45) (44) (46) (2%)
St Andrew's Insurance - 6 7 Large
329 297 295 12%
Cash net profit after tax CFSGAM 155 129 137 13%
Colonial First State 77 85 59 31%
CommInsure 171 159 221 (23%)
Other (44) (43) (45) (2%)
St Andrew's Insurance - 9 7 Large
359 339 379 (5%)
For
per
sona
l use
onl
y
77
Wealth Management
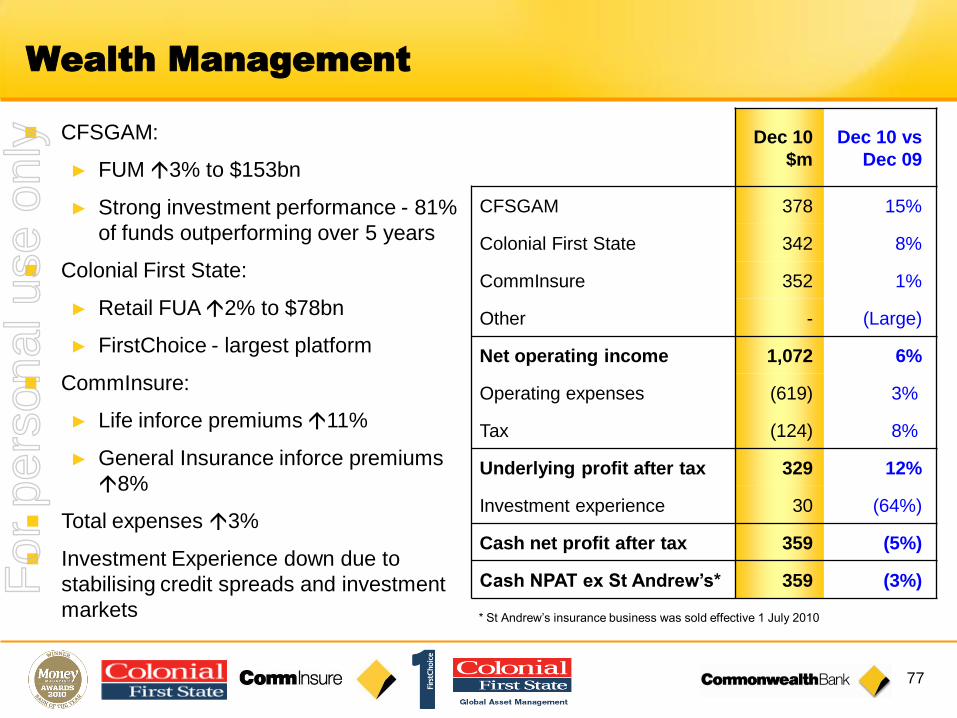
CFSGAM:
► FUM 3% to $153bn
► Strong investment performance - 81%
of funds outperforming over 5 years
Colonial First State:
► Retail FUA 2% to $78bn
► FirstChoice - largest platform
CommInsure:
► Life inforce premiums 11%
► General Insurance inforce premiums
8%
Total expenses 3%
Investment Experience down due to
stabilising credit spreads and investment
markets
Dec 10
$m
Dec 10 vs
Dec 09
CFSGAM 378 15%
Colonial First State 342 8%
CommInsure 352 1%
Other - (Large)
Net operating income 1,072 6%
Operating expenses (619) 3%
Tax (124) 8%
Underlying profit after tax 329 12%
Investment experience 30 (64%)
Cash net profit after tax 359 (5%)
Cash NPAT ex St Andrew’s* 359 (3%)
* St Andrew’s insurance business was sold effective 1 July 2010
For
per
sona
l use
onl
y
78
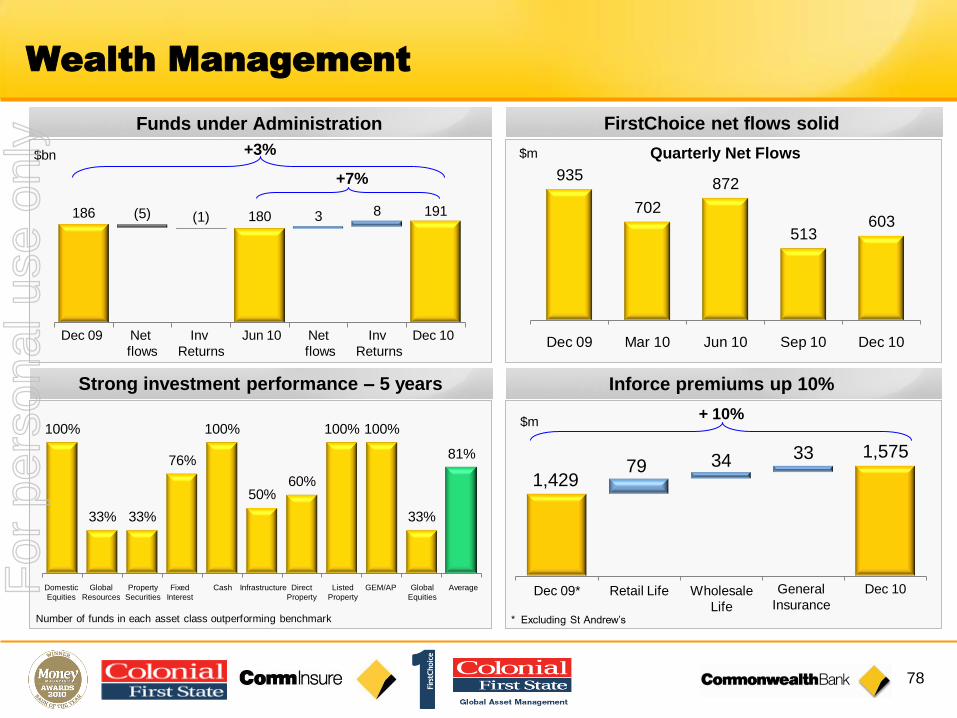
Wealth Management
Quarterly Net Flows
+ 10%
* Excluding St Andrew’s
+3%
935
702
872
513603
Dec 09 Mar 10 Jun 10 Sep 10 Dec 10
Funds under Administration FirstChoice net flows solid
Strong investment performance – 5 years Inforce premiums up 10%
186 180 191(5) (1) 3 8
Dec 09 Net
flows
Inv
Returns
Jun 10 Net
flows
Inv
Returns
Dec 10
1,429
1,57579 34 33
Dec 09* Retail Life Wholesale
Life
General
Insurance
Dec 10
100%
33% 33%
76%
100%
50%60%
100% 100%
33%
81%
Domestic
Equities
Global
Resources
Property
Securities
Fixed
Interest
Cash Infrastructure Direct
Property
Listed
Property
GEM/AP Global
Equities
Average
+7%
$bn $m
$m
Number of funds in each asset class outperforming benchmark
For
per
sona
l use
onl
y
79
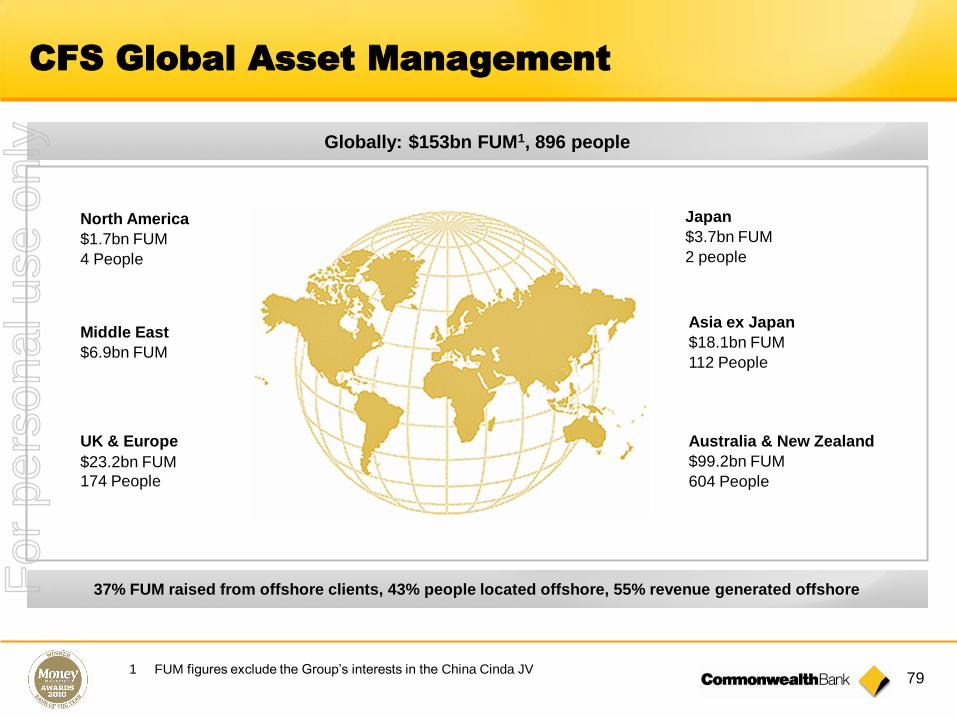
CFS Global Asset Management
1 FUM figures exclude the Group’s interests in the China Cinda JV
North America
$1.7bn FUM
4 People
Globally: $153bn FUM1, 896 people
Middle East
$6.9bn FUM
UK & Europe
$23.2bn FUM
174 People
Japan
$3.7bn FUM
2 people
Asia ex Japan
$18.1bn FUM
112 People
Australia & New Zealand
$99.2bn FUM
604 People
37% FUM raised from offshore clients, 43% people located offshore, 55% revenue generated offshoreFor
per
sona
l use
onl
y
80
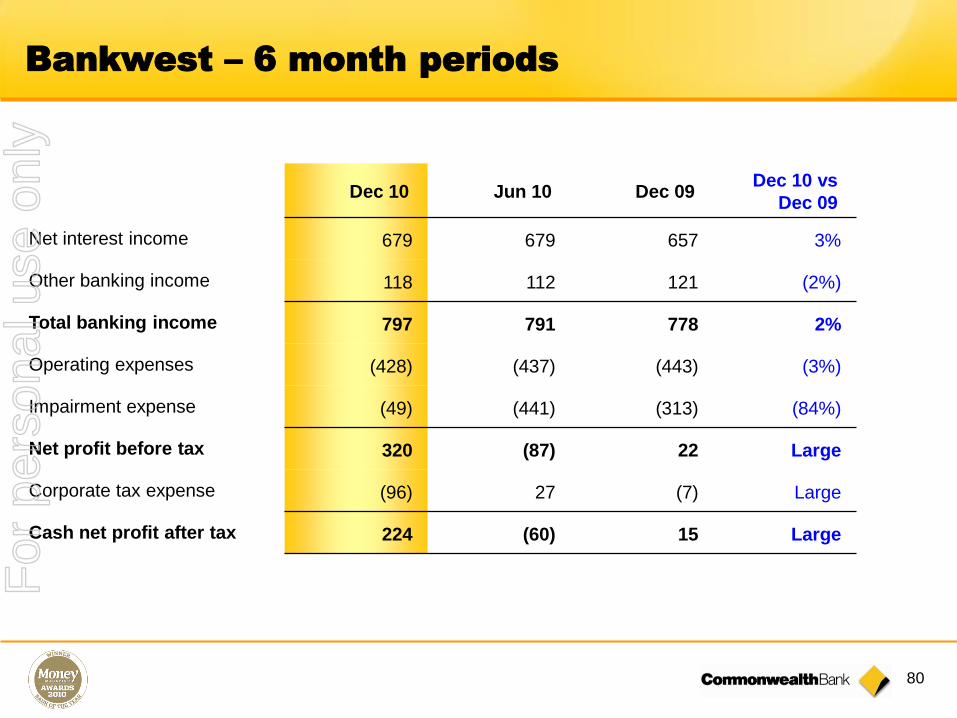
Bankwest – 6 month periods
Dec 10 Jun 10 Dec 09Dec 10 vs
Dec 09
Net interest income 679 679 657 3%
Other banking income 118 112 121 (2%)
Total banking income 797 791 778 2%
Operating expenses (428) (437) (443) (3%)
Impairment expense (49) (441) (313) (84%)
Net profit before tax 320 (87) 22 Large
Corporate tax expense (96) 27 (7) Large
Cash net profit after tax 224 (60) 15 Large
For
per
sona
l use
onl
y
81
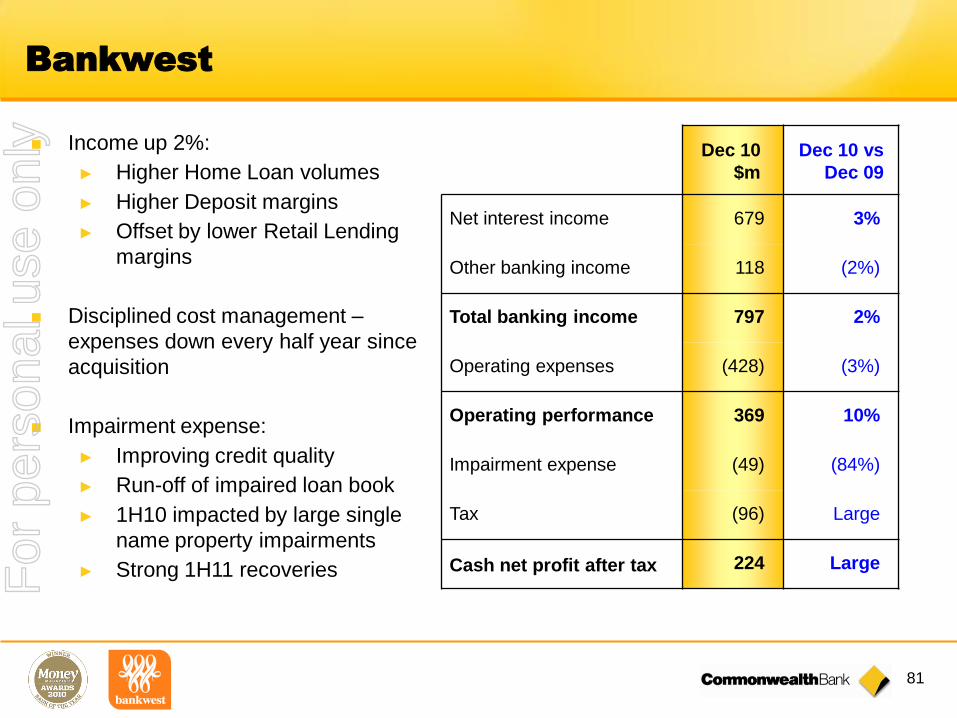
Bankwest
Dec 10
$m
Dec 10 vs
Dec 09
Net interest income 679 3%
Other banking income 118 (2%)
Total banking income 797 2%
Operating expenses (428) (3%)
Operating performance 369 10%
Impairment expense (49) (84%)
Tax (96) Large
Cash net profit after tax 224 Large
Income up 2%:
► Higher Home Loan volumes
► Higher Deposit margins
► Offset by lower Retail Lending
margins
Disciplined cost management –
expenses down every half year since
acquisition
Impairment expense:
► Improving credit quality
► Run-off of impaired loan book
► 1H10 impacted by large single
name property impairments
► Strong 1H11 recoveriesFor
per
sona
l use
onl
y

82
$96m
$112m
$24m
$18m
$18m
$48m
$26m
$60m
$88m
Bankwest integration
Annual expense synergies
East Coast
Store Rollout
(cessation)
Restructuring
Property &
Procurement
$240m pa (2012)
Operating
efficiencies, other
IT
IT
RestructuringProperty
Operations /
other
Integration costs - composition
$250m
By
December
2008
By
June
2009
By
FY12
Post
FY12
Acquisition announced Oct 08
Governance structure established
Due diligence commenced,
Regulatory approvals obtained
New CEO, CFO and CRO appointed
Formal acquisition date 19 Dec 08
Common ATM and branch access
Multi-brand strategy implemented
Revised growth plan established
Integration of St Andrew’s
Final acquisition accounting in FY09 results
Systems alignment
Consolidation of operations/processes
Pursue targeted cost synergy opportunities
Focus on leveraging CBA scale advantage
Pursue incremental synergy opportunities
Timetable
For
per
sona
l use
onl
y

83
China Branches Staff
Japan (Branch), Singapore (Branch, First State Investments)
Vietnam 15% stake in VIB (135 branches) – 2010; Branch
(Ho Chi Minh - 2008), Representative office (Hanoi) - 1994.
IndonesiaPT Bank Commonwealth – 1995 84 1,733PT Commonwealth Life – 1992 24 346
Qilu Bank (20%) - 2004 80 >2,000
Bank of Hangzhou (20%) - 2005 101 3,055
Shanghai Branch - 2010 15
Beijing Representative office - 1992 / 1994 6
BoCommLife JV - 2010 145
Branches Staff
$76m
$13m
Beijing
Jinan
Shanghai
Hangzhou
Mumbai
Ho Chi
Minh City
Jakarta
Tokyo
Hanoi
Hong Kong
Asia
Cash NPAT
1H11
PTBC branch
locations in Indonesia
Singapore
Medan
Jakarta
Malaysia
Padang
Denpasar
Bandung
Martapura
$42m
1 Includes Asian earnings from all CBA business units, and excludes head office support costs
2 Includes First State Cinda Funds Management company, Institutional Banking & Markets branch in Hong Kong
and First State Investments in Hong Kong
India Mumbai Branch opened - 2010
1
2
$131m
For
per
sona
l use
onl
y
84
Index
Overview and Strategy 54
Business Performance 66
Risk Management 84
Capital, Funding and Liquidity 93
Economic Overview 104
For
per
sona
l use
onl
y
85
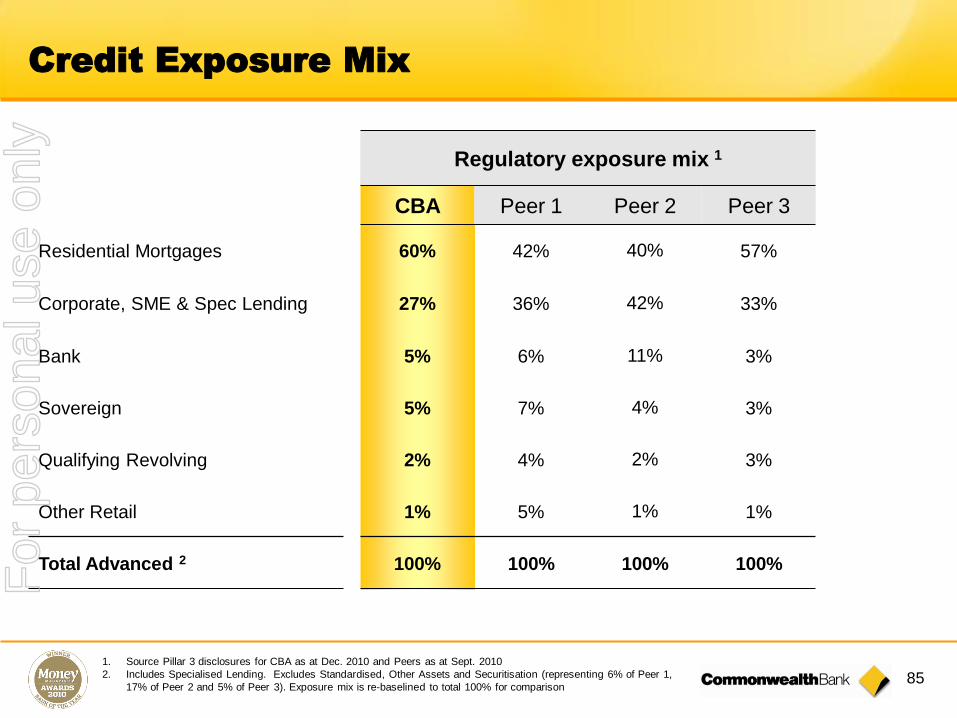
Credit Exposure Mix
Regulatory exposure mix 1
CBA Peer 1 Peer 2 Peer 3
Residential Mortgages 60% 42% 40% 57%
Corporate, SME & Spec Lending 27% 36% 42% 33%
Bank 5% 6% 11% 3%
Sovereign 5% 7% 4% 3%
Qualifying Revolving 2% 4% 2% 3%
Other Retail 1% 5% 1% 1%
Total Advanced 2 100% 100% 100% 100%
1. Source Pillar 3 disclosures for CBA as at Dec. 2010 and Peers as at Sept. 2010
2. Includes Specialised Lending. Excludes Standardised, Other Assets and Securitisation (representing 6% of Peer 1,
17% of Peer 2 and 5% of Peer 3). Exposure mix is re-baselined to total 100% for comparison
For
per
sona
l use
onl
y
86
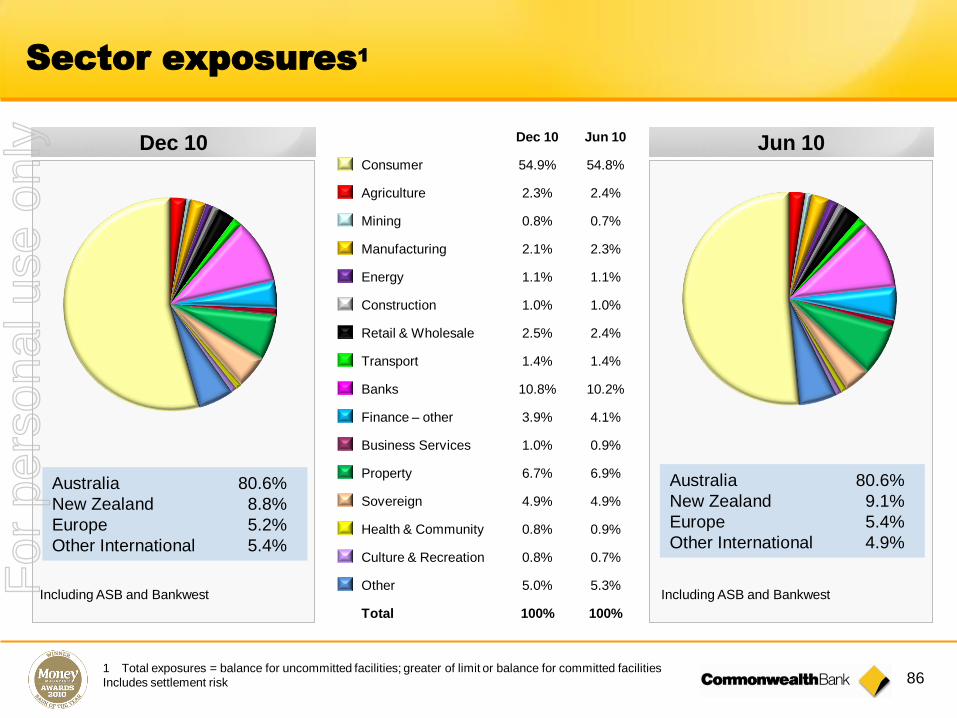
Sector exposures1
Dec 10 Jun 10
1 Total exposures = balance for uncommitted facilities; greater of limit or balance for committed facilities
Includes settlement risk
Dec 10 Jun 10
Consumer 54.9% 54.8%
Agriculture 2.3% 2.4%
Mining 0.8% 0.7%
Manufacturing 2.1% 2.3%
Energy 1.1% 1.1%
Construction 1.0% 1.0%
Retail & Wholesale 2.5% 2.4%
Transport 1.4% 1.4%
Banks 10.8% 10.2%
Finance – other 3.9% 4.1%
Business Services 1.0% 0.9%
Property 6.7% 6.9%
Sovereign 4.9% 4.9%
Health & Community 0.8% 0.9%
Culture & Recreation 0.8% 0.7%
Other 5.0% 5.3%
Total 100% 100%
Australia 80.6%
New Zealand 8.8%
Europe 5.2%
Other International 5.4%
Including ASB and Bankwest Including ASB and Bankwest
Australia 80.6%
New Zealand 9.1%
Europe 5.4%
Other International 4.9%
For
per
sona
l use
onl
y
87
1
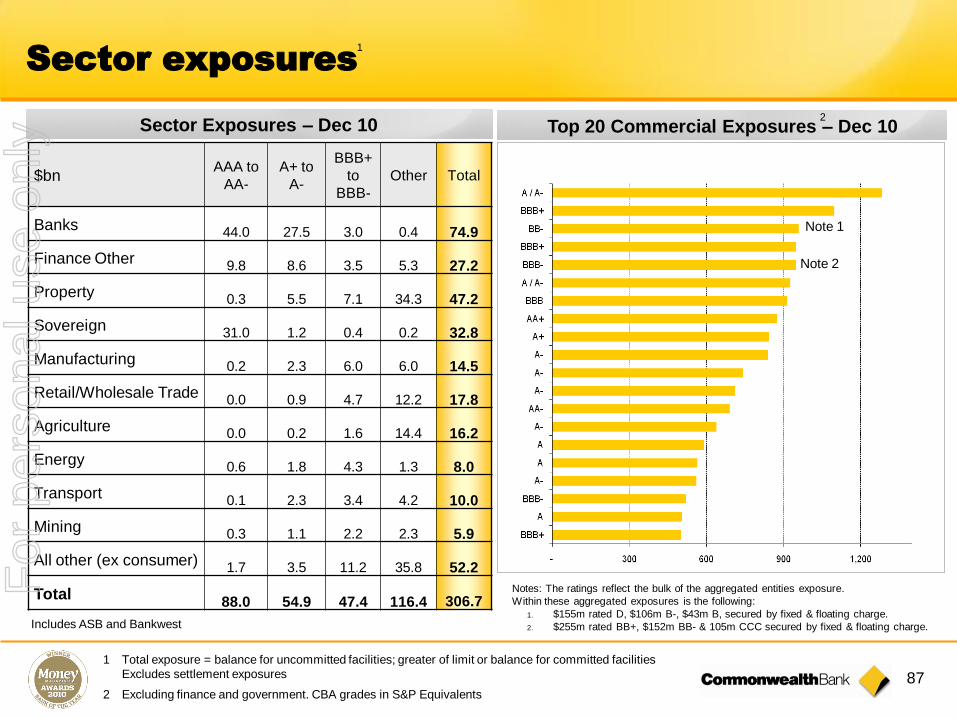
Sector exposures
1 Total exposure = balance for uncommitted facilities; greater of limit or balance for committed facilities
Excludes settlement exposures
Includes ASB and Bankwest
2 Excluding finance and government. CBA grades in S&P Equivalents
Sector Exposures – Dec 10
$bnAAA to
AA-
A+ to
A-
BBB+
to
BBB-
Other Total
Banks44.0 27.5 3.0 0.4 74.9
Finance Other9.8 8.6 3.5 5.3 27.2
Property0.3 5.5 7.1 34.3 47.2
Sovereign31.0 1.2 0.4 0.2 32.8
Manufacturing0.2 2.3 6.0 6.0 14.5
Retail/Wholesale Trade0.0 0.9 4.7 12.2 17.8
Agriculture0.0 0.2 1.6 14.4 16.2
Energy0.6 1.8 4.3 1.3 8.0
Transport0.1 2.3 3.4 4.2 10.0
Mining0.3 1.1 2.2 2.3 5.9
All other (ex consumer)1.7 3.5 11.2 35.8 52.2
Total88.0 54.9 47.4 116.4 306.7
Notes: The ratings reflect the bulk of the aggregated entities exposure.
Within these aggregated exposures is the following:
1. $155m rated D, $106m B-, $43m B, secured by fixed & floating charge.
2. $255m rated BB+, $152m BB- & 105m CCC secured by fixed & floating charge.
Note 1
Note 2
Top 20 Commercial Exposures – Dec 102
For
per
sona
l use
onl
y
88
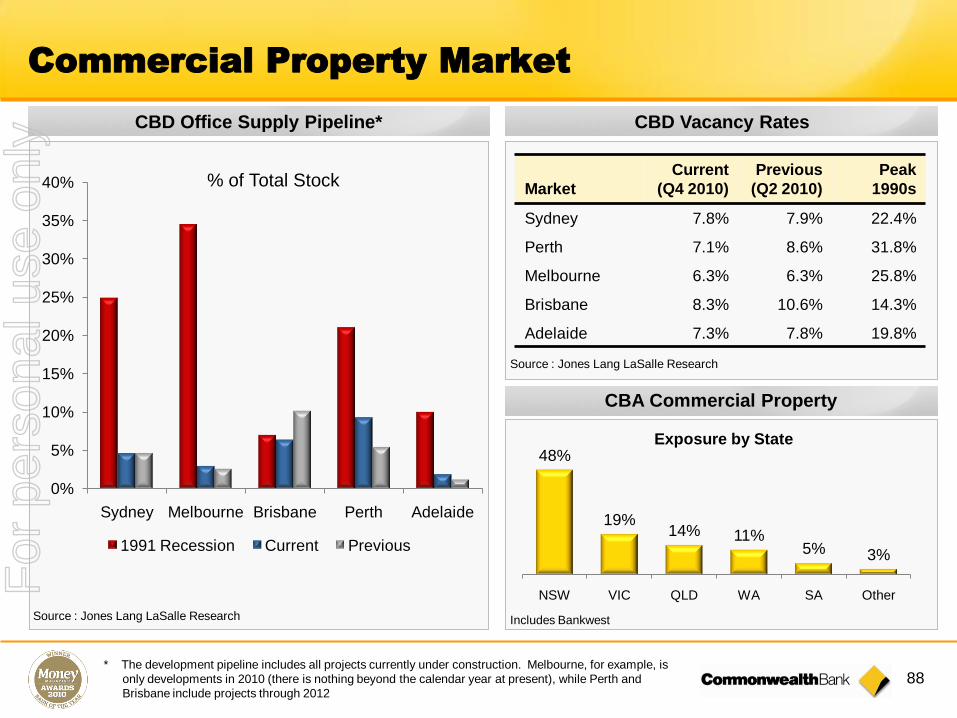
Commercial Property Market
0%
5%
10%
15%
20%
25%
30%
35%
40%
Sydney Melbourne Brisbane Perth Adelaide
1991 Recession Current Previous
Source : Jones Lang LaSalle Research
Market
Current
(Q4 2010)
Previous
(Q2 2010)
Peak
1990s
Sydney 7.8% 7.9% 22.4%
Perth 7.1% 8.6% 31.8%
Melbourne 6.3% 6.3% 25.8%
Brisbane 8.3% 10.6% 14.3%
Adelaide 7.3% 7.8% 19.8%
% of Total Stock
CBD Vacancy RatesCBD Office Supply Pipeline*
CBA Commercial Property
48%
19%14% 11%
5% 3%
NSW VIC QLD WA SA Other
Source : Jones Lang LaSalle Research
Includes Bankwest
Exposure by State
* The development pipeline includes all projects currently under construction. Melbourne, for example, is
only developments in 2010 (there is nothing beyond the calendar year at present), while Perth and
Brisbane include projects through 2012
For
per
sona
l use
onl
y

89
0
1
2
3
4
1982 1984 1986 1988 1990 1992 1994
Loss R
ate
(%
)
Small Business
Personal Loans
Credit cards
Business Banking
Home Loans
Institutional Banking
Historical loss rates in the last recession
For
per
sona
l use
onl
y

90
Credit RWA Movement (%) Composition of Movement (%)
RWA Movement (%)
TotalTier 1 ratio
impact (bpts)
Credit Risk (5)% 40
Traded Market Risk 11% (1)
Operational Risk (1)% 1
Total excl IRRBB (4)% 40
IRRBB 66% (24)
Total (2)% 16
■ Credit RWAs reduced by $12.2b primarily as a result of:
Improvement in credit quality
Growth primarily from lower risk retail portfolios with
subdued demand in higher risk commercial portfolio.
Exchange rate appreciation also moderated growth
Change in methodology for commercial Loss Given
Defaults offset by change in regulatory treatment
■ IRRBB RWAs increased by $6.7b driven mostly by rising
interest rates and increase in re-pricing and yield curve risk.
On Balance
Sheet
Off Balance
SheetTotal
Consumer Retail 1% 0% 1%
Non-retail (10)% (6)% (9)%
CRFs1 FX/
Volume Quality
Reg
Change2 Total
- 2% (5)% 4% 1%
(7)% 0% (2)% - (9)%
Tier 1 impact – Retail (bpts) (2) 0 (2)
Tier 1 impact – Non-Retail (bpts) 28 7 35
Tier 1 impact – Other 3 (bpts) 6 1 7
Total Tier 1 impact (bpts) 32 8 40
- (4) 10 (8) (2)
28 1 7 (1) 35
2 9 (2) (2) 7
30 6 15 (11) 40
1 Credit Risk Factors (RWA Optimisation). Revised LGD modelling approach for risk rated portfolios. Revised approach leverages bank loan
recovery data (instead of bond data) supplied by Standard and Poor’s to supplement internal loss data for a more refined view of LGD estimates.
2 Regulatory Change includes use of a standardised approach for reverse mortgages and implementation of a revised ASB home loan PD model.
3 Other includes Credit Risk Weighted Assets for other Basel Asset standardised classes including Bankwest, margin lending, equities,
securitised and other assets and claims
Risk Weighted Assets – Dec 2010 Half
For
per
sona
l use
onl
y
91
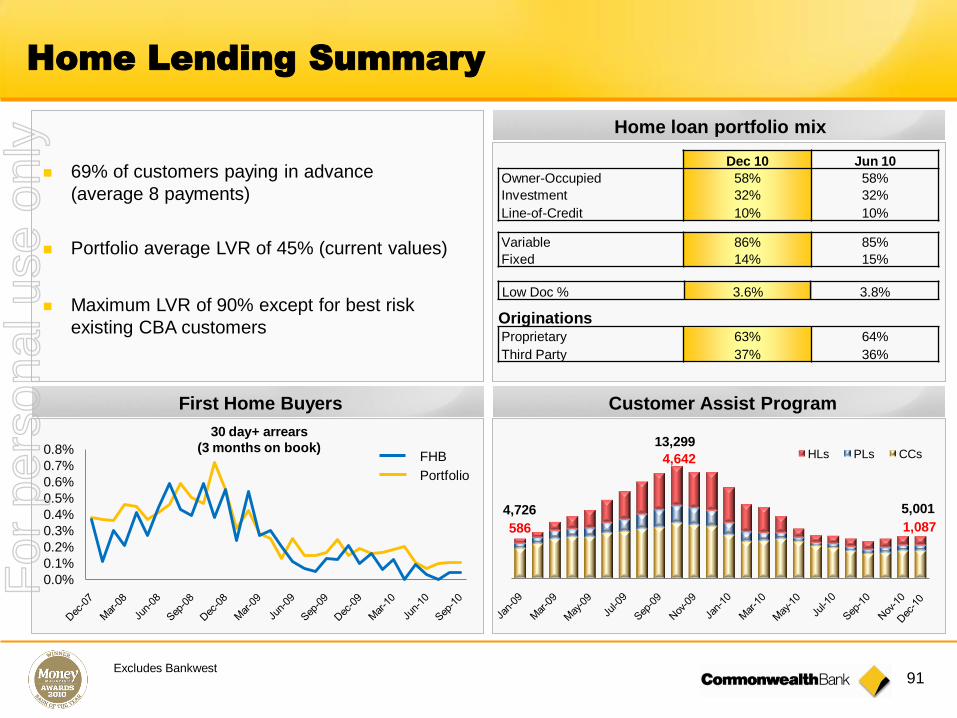
OriginationsProprietary 63% 64%
Third Party 37% 36%
Low Doc % 3.6% 3.8%
Variable 86% 85%
Fixed 14% 15%
Dec 10 Jun 10
Owner-Occupied 58% 58%
Investment 32% 32%
Line-of-Credit 10% 10%
Home Lending Summary
Excludes Bankwest
586
4,642
1,087
HLs PLs CCs
4,726
13,299
5,001
Customer Assist Program
69% of customers paying in advance
(average 8 payments)
Portfolio average LVR of 45% (current values)
Maximum LVR of 90% except for best risk
existing CBA customers
Home loan portfolio mix
0.0%
0.1%
0.2%
0.3%
0.4%
0.5%
0.6%
0.7%
0.8%FHB
Portfolio
30 day+ arrears
(3 months on book)
First Home Buyers
For
per
sona
l use
onl
y

92
Home Loan sensitivity test
Expected Loss decreased by 24%, driven by:
Stable arrears
National average property prices increased
across the portfolio by 3.5%*
Number of customers paying in advance was
unchanged
Expected Loss outcomes Loss mitigants
Six-Month Movement Changes over 6 months
Excludes Bankwest and ASB
Loans >80% LVR mortgage insured (additional insured
losses of $1,322m (previously $1,515m) in high stress
scenario)
Portfolio average LVR of 45%
Full recourse to borrower
69% of accounts paying in advance
743 566
51 168
34 75
2009-12Closed AccountsExisting Accounts - Changes in Market ValuationExisting Accounts - Portfolio qualityNew Accounts 2010-06Previous
Result
Closed
Accounts
Increase in
Market
Valuation
Existing
Accounts
New
Accounts
Current
Result
$m
Expected loss $m PD stress factor
Property value x1 x2 x4 x6
No decrease 7 11 17 21
10% decrease 23 34 53 69
20% decrease 70 106 167 220
30% decrease 168 263 423 566
Example scenario that could drive a x6 PD would involve
unemployment of 15% and property value decline of 30%
* Source : APM
For
per
sona
l use
onl
y
93
Index
Overview and Strategy 54
Business Performance 66
Risk Management 84
Capital, Funding and Liquidity 93
Economic Overview 104
For
per
sona
l use
onl
y

94
Regulatory Change: Liquidity, funding, capital
Final proposals & QIS
(Dec 10)
Liq
uid
ity
Fu
nd
ing
Ca
pit
al
Liquidity Coverage Ratio (LCR)
Definition of liquid assets widened to include “Level 2” liquid assets and development of standards for jurisdictions with insufficient government bonds
RBA/APRA propose a “committed secured liquidity facility” with the RBA, for a fee
Measurement to be finalised and clarity required on use (extent and mechanics) of RBA facility
Net Stable Funding Ratio
Assets with >1yr maturity to be funded with “stable”
liabilities with >1yr term
Decrease in quantum of “stable funding” required for
mortgages (100% to 65%)
Less onerous run-off assumptions for some deposits
Measurement to be finalised
7.0% minimum Common Equity inclusive of buffer (2.5%)
8.5% minimum Tier 1 inclusive of buffer (2.5%)
Countercyclical buffer: 0-2.5% of RWA
Leverage Ratio – set at minimum 3%
Timing CBA Position
Expect APRA to release
draft standards in 2011
APRA standards subject
to consultation 2011-12
Observation and review
from Jan-11, effective
Jan-15
Expect APRA to release draft standards in 2011
Observation and review from Jan-11, effective Jan-18
Expect APRA to release draft standards in 2011
Minimum levels to be phased in between 2013 and 2019
Leverage ratio –observation and review from 2011. Pillar 1 measure from 2018
Favourable impact from
revised mortgage treatment
(vs original proposals)
More, and longer term
funding undertaken since
GFC
Strong organic capital
generation
Estimated Global
Harmonisation Common
Equity of 9.0%
Leverage Ratio less onerous
than originally expected
Regulatory minimums
expected to double
CBA carrying significant liquid
assets
Liquids portfolio already in
transition
For
per
sona
l use
onl
y
95
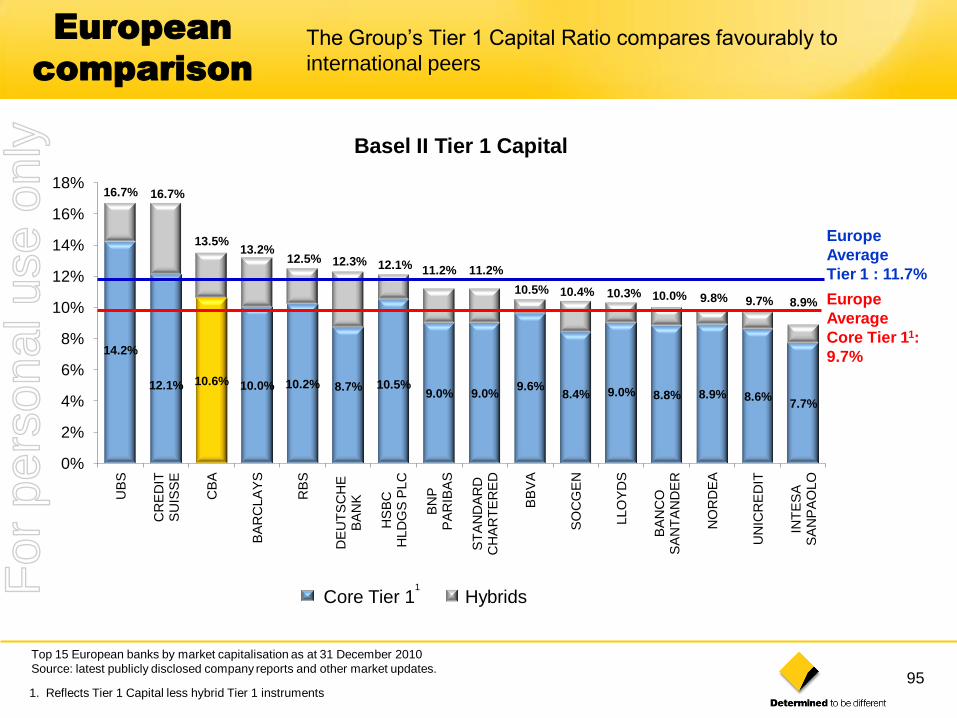
European
comparison
The Group’s Tier 1 Capital Ratio compares favourably to
international peers
Basel II Tier 1 Capital
Hybrids
14.2%
12.1% 10.6% 10.0% 10.2% 8.7% 10.5%9.0% 9.0%
9.6%8.4% 9.0% 8.8% 8.9% 8.6%
7.7%
16.7% 16.7%
13.5%13.2%
12.5% 12.3% 12.1% 11.2% 11.2%
10.5% 10.4% 10.3% 10.0% 9.8% 9.7% 8.9%
0%
2%
4%
6%
8%
10%
12%
14%
16%
18%
UB
S
CR
ED
IT
SU
ISS
E
CB
A
BA
RC
LA
YS
RB
S
DE
UT
SC
HE
B
AN
K
HS
BC
H
LD
GS
PLC
BN
P
PA
RIB
AS
ST
AN
DA
RD
C
HA
RT
ER
ED
BB
VA
SO
CG
EN
LLO
YD
S
BA
NC
O
SA
NT
AN
DE
R
NO
RD
EA
UN
ICR
ED
IT
INT
ES
A
SA
NP
AO
LO
E
Top 15 European banks by market capitalisation as at 31 December 2010
Source: latest publicly disclosed company reports and other market updates.
1. Reflects Tier 1 Capital less hybrid Tier 1 instruments
Europe
Average
Tier 1 : 11.7%
Europe
Average
Core Tier 11:
9.7%
Core Tier 11F
or p
erso
nal u
se o
nly
96
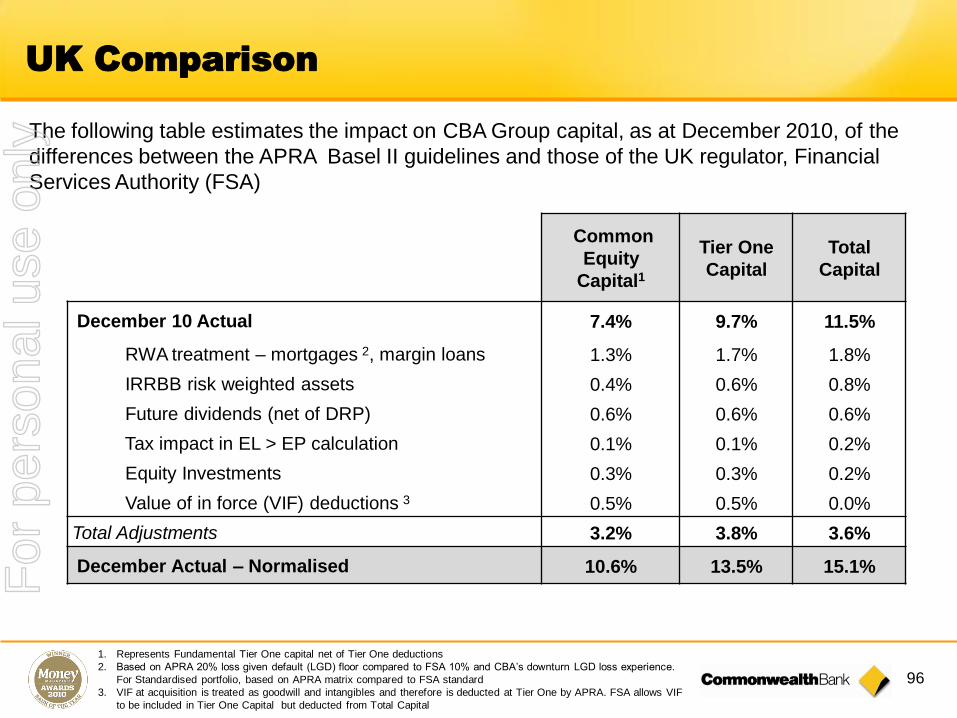
UK Comparison
The following table estimates the impact on CBA Group capital, as at December 2010, of the
differences between the APRA Basel II guidelines and those of the UK regulator, Financial
Services Authority (FSA)
1. Represents Fundamental Tier One capital net of Tier One deductions
2. Based on APRA 20% loss given default (LGD) floor compared to FSA 10% and CBA’s downturn LGD loss experience.
For Standardised portfolio, based on APRA matrix compared to FSA standard
3. VIF at acquisition is treated as goodwill and intangibles and therefore is deducted at Tier One by APRA. FSA allows VIF
to be included in Tier One Capital but deducted from Total Capital
Common
Equity
Capital1
Tier One
Capital
Total
Capital
December 10 Actual 7.4% 9.7% 11.5%
RWA treatment – mortgages 2, margin loans 1.3% 1.7% 1.8%
IRRBB risk weighted assets 0.4% 0.6% 0.8%
Future dividends (net of DRP) 0.6% 0.6% 0.6%
Tax impact in EL > EP calculation 0.1% 0.1% 0.2%
Equity Investments 0.3% 0.3% 0.2%
Value of in force (VIF) deductions 3 0.5% 0.5% 0.0%
Total Adjustments 3.2% 3.8% 3.6%
December Actual – Normalised 10.6% 13.5% 15.1%For
per
sona
l use
onl
y
97
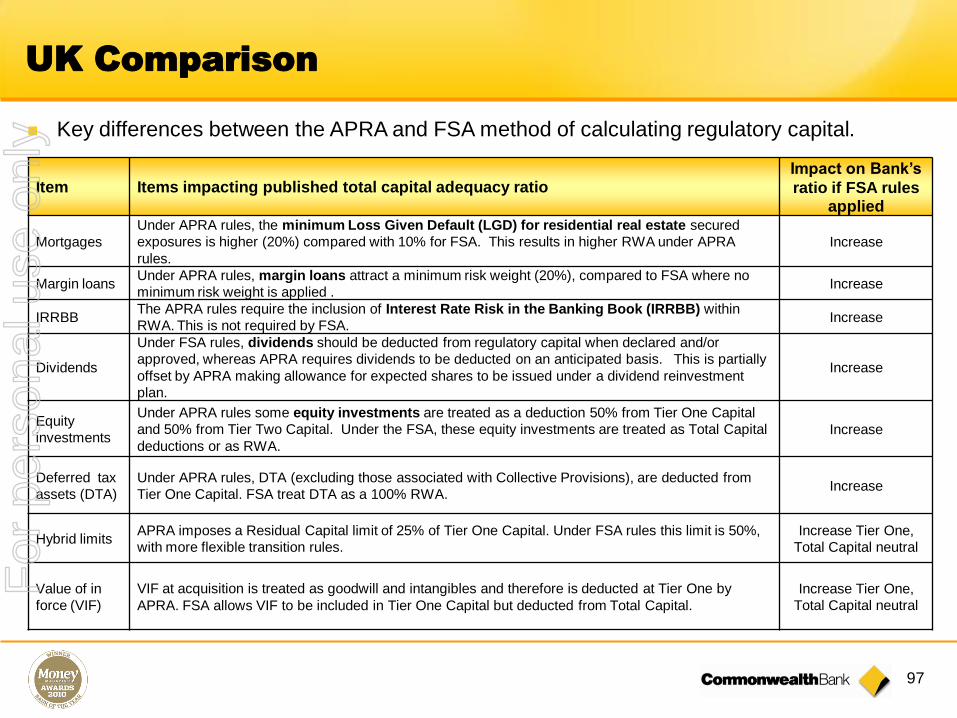
Key differences between the APRA and FSA method of calculating regulatory capital.
Item Items impacting published total capital adequacy ratioImpact on Bank’s
ratio if FSA rules applied
Mortgages
Under APRA rules, the minimum Loss Given Default (LGD) for residential real estate secured
exposures is higher (20%) compared with 10% for FSA. This results in higher RWA under APRA
rules.
Increase
Margin loansUnder APRA rules, margin loans attract a minimum risk weight (20%), compared to FSA where no
minimum risk weight is applied .Increase
IRRBBThe APRA rules require the inclusion of Interest Rate Risk in the Banking Book (IRRBB) within
RWA. This is not required by FSA.Increase
Dividends
Under FSA rules, dividends should be deducted from regulatory capital when declared and/or
approved, whereas APRA requires dividends to be deducted on an anticipated basis. This is partially
offset by APRA making allowance for expected shares to be issued under a dividend reinvestment
plan.
Increase
Equity
investments
Under APRA rules some equity investments are treated as a deduction 50% from Tier One Capital
and 50% from Tier Two Capital. Under the FSA, these equity investments are treated as Total Capital
deductions or as RWA.
Increase
Deferred tax
assets (DTA)
Under APRA rules, DTA (excluding those associated with Collective Provisions), are deducted from
Tier One Capital. FSA treat DTA as a 100% RWA.Increase
Hybrid limitsAPRA imposes a Residual Capital limit of 25% of Tier One Capital. Under FSA rules this limit is 50%,
with more flexible transition rules.
Increase Tier One,
Total Capital neutral
Value of in
force (VIF)
VIF at acquisition is treated as goodwill and intangibles and therefore is deducted at Tier One by
APRA. FSA allows VIF to be included in Tier One Capital but deducted from Total Capital.
Increase Tier One,
Total Capital neutral
UK Comparison
For
per
sona
l use
onl
y

98
Regulatory Expected Loss
1. Eligible provisions exclude Bankwest portfolio which operates under Basel II standardised methodology
2. Includes transfer from Collective provision to Individually assessed provisions in accordance with APS 220
requirements (Dec 10: $120m June 10: $136m, Dec 09; $116m)
Dec 09 Jun 10 Dec 10
$m $m $m
CBA (ex Bankwest) Regulatory Expected Loss (EL) – before tax 4,276 4,332 4,293
Eligible Provision 1
Collective provision 2 2,339 2,036 2,029
Individually assessed provisions 2 1,204 1,172 1,343
Other provisions 30 25 25
Subtotal 3,573 3,233 3,397
less tax effect impact (711) (618) (616)
General Reserve for Credit Losses adjustment (after tax) - 90 84
Other (40) (33) (68)
Total Eligible Provision 2,822 2,672 2,797
Regulatory EL in excess of Eligible Provision 1,454 1,660 1,496
Tier One deduction – 50% 727 830 748
Tier Two deduction – 50% 727 830 748
Total Capital Deduction 1,454 1,660 1,496
For
per
sona
l use
onl
y
99
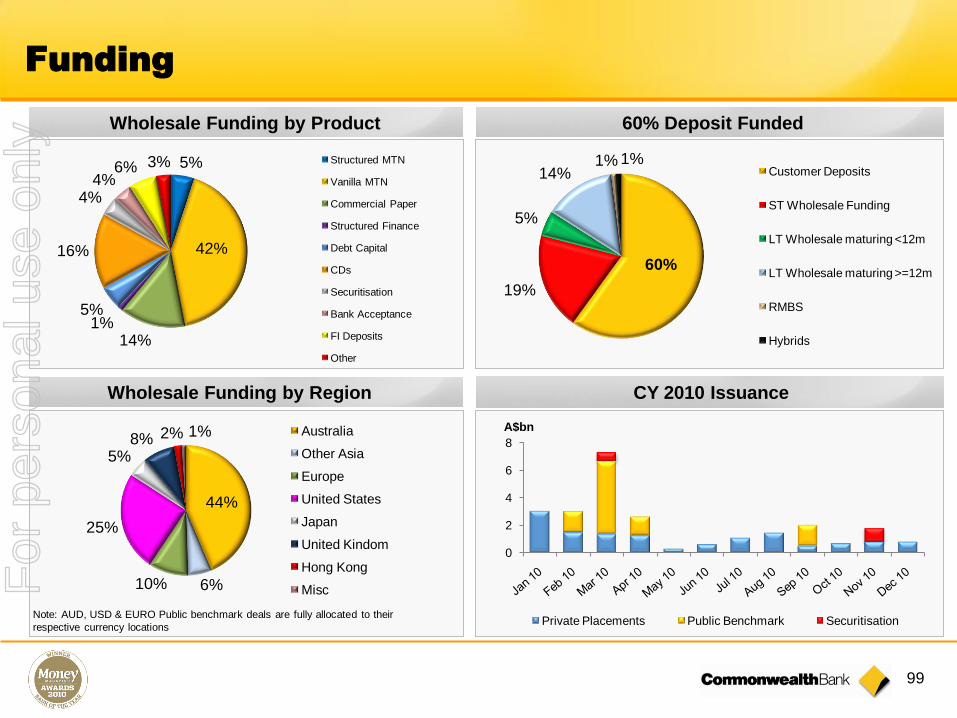
Funding
5%
42%
14%1%
5%
16%
4%4%
6% 3% Structured MTN
Vanilla MTN
Commercial Paper
Structured Finance
Debt Capital
CDs
Securitisation
Bank Acceptance
FI Deposits
Other
44%
6%10%
25%
5%8% 2% 1% Australia
Other Asia
Europe
United States
Japan
United Kindom
Hong Kong
Misc
Note: AUD, USD & EURO Public benchmark deals are fully allocated to their
respective currency locations
Wholesale Funding by Product
Wholesale Funding by Region CY 2010 Issuance
60%
19%
5%
14%1% 1%
Customer Deposits
ST Wholesale Funding
LT Wholesale maturing <12m
LT Wholesale maturing >=12m
RMBS
Hybrids
60% Deposit Funded
0
2
4
6
8
A$bn
Private Placements Public Benchmark Securitisation
For
per
sona
l use
onl
y

100
Interest
Rate Risk
Capital Assigned to Interest Rate Risk in
Banking Book - APS117
Dec 08 Jun 09 Dec 09 Jun 10 Dec 10
Optionality
Basis Risk
Repricing and
Yield Curve RiskEmbedded Loss
$1,363m
-$70m
(ie zero)
$716m
$1,328m
0 bpts 54 bpts 33 bpts26 bpts
$822m
62 bpts
Embedded Gain
(offset to capital)
Repricing and
Yield Curve Risk
Basis Risk
Optionality
Embedded gain reduces
due to increase in swap
rates, and other factors
including customer pre-
payments of fixed rate
mortgages
Fixed rate asset portfolios serve to offset NIM
compression in falling and low rate environment -
less APS117 capital needs to be held
For
per
sona
l use
onl
y

101
1%
2%
3%
4%
5%
6%
7%
8%
Replicating Portfolio
Actual and Forecast Scenario*
2001 Current 2012
Forecast*
* Indicative forecast of the replicating portfolio in relation to hypothetical movements in the official cash rate
Official Cash Rate
Replicating Portfolio Yield
For
per
sona
l use
onl
y
102
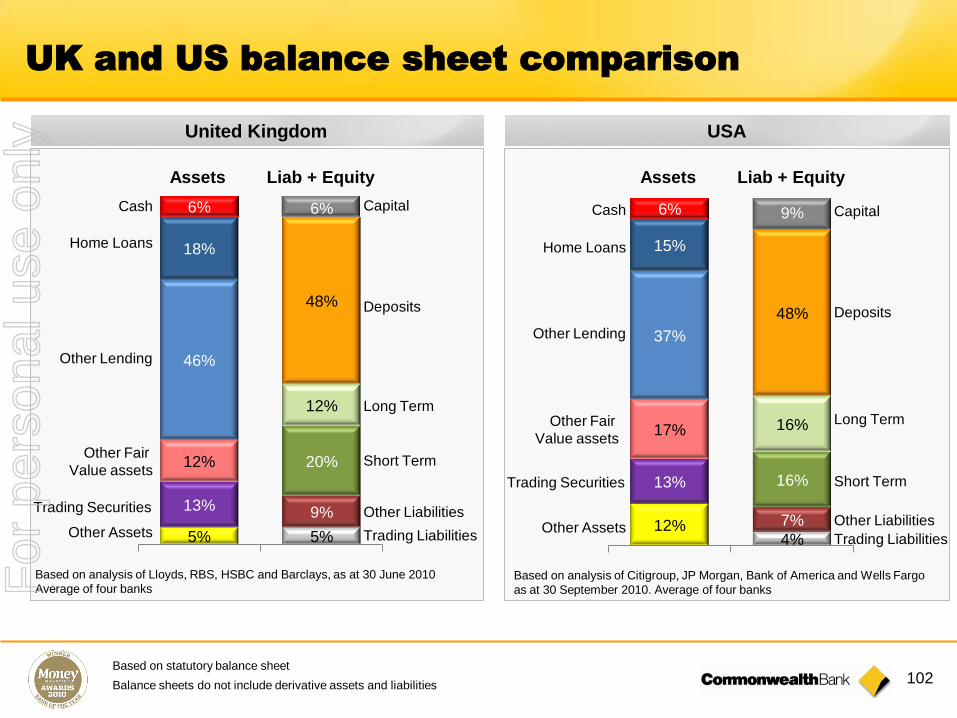
UK and US balance sheet comparison
United Kingdom
5% 5%
13% 9%
12% 20%
46%
12%
18%
48%
6% 6%
Other Assets
Other Fair
Value assets
Other Lending
Home Loans
Trading Securities
Cash Capital
Deposits
Long Term
Short Term
Other Liabilities
Trading Liabilities
Assets Liab + Equity
USA
12%4%
13%
7%
17%
16%
37%
16%
15%
48%
6% 9%
Other Assets
Other Lending
Home Loans
Trading Securities
Cash Capital
Deposits
Long Term
Short Term
Other Liabilities
Trading Liabilities
Assets Liab + Equity
Based on analysis of Citigroup, JP Morgan, Bank of America and Wells Fargo
as at 30 September 2010. Average of four banks
Based on analysis of Lloyds, RBS, HSBC and Barclays, as at 30 June 2010
Average of four banks
Balance sheets do not include derivative assets and liabilities
Other Fair
Value assets
Based on statutory balance sheet
For
per
sona
l use
onl
y

103
Australian Banks – safe assets, secure funding
Other Assets
Other Lending
Home Loans
Trading Securities
Cash Capital
Deposits
Long Term
Short Term
Other Liabilities
Commonwealth Bank
Trading Liabilities
CBA balance sheet as at 31 December 2010
Balance sheet does not include derivative assets and liabilities
Based on statutory balance sheet
Assets Liab + Equity
Other Fair
Value assets
6%1%
3%6%
6% 14%
29% 14%
53%
59%
3% 6%
Assets – CBA’s assets are safer because:
53% of balance sheet is home loans, which are stable/long
term
Trading securities and other fair value assets comprise just
9% of CBA balance sheet compared to 25% and 30% for UK
and US banks
CBA’s balance sheet is less volatile due to a lower proportion
of fair value assets
Funding – a more secure profile because:
Highest deposit base (59% including 23% of stable household
deposits)
Reliance on wholesale funding similar to UK and US banks,
although a longer profile than UK banks, which gives CBA a
buffer against constrained liquidity in the wholesale markets
Balance sheet comparisons
Assets*
Amortised cost Fair Value
CBA 82% 18%
UK 56% 44%
US 39% 61%
* Includes grossed up derivatives.
For
per
sona
l use
onl
y
104
Index
Overview and Strategy 54
Business Performance 66
Risk Management 84
Capital, Funding and Liquidity 93
Economic Overview 104
For
per
sona
l use
onl
y

105
As at June
2007 2008 2009 2010 2011 (f) 2012 (f)
Credit Growth % – Total 15.5 11.4 2.9 3.3 4½-6½ 7-9
Credit Growth % – Housing 12.9 9.5 7.2 8.2 7-9 7-9
Credit Growth % – Business 19.2 16.0 -0.9 -4.0 1-3 7-9
Credit Growth % – Other Personal 16.1 2.6 -6.5 3.2 4-6 4-6
GDP % 3.6 3.8 1.4 2.2 2.8 3.7
CPI % 2.9 3.4 3.1 2.3 3.0 3.2
Unemployment rate % 4.5 4.2 4.9 5.5 5.1 4.7
Cash Rate % 6¼ 7¼ 3 4½ 5 5¾
CBA Economists Forecasts
Credit Growth = 12 months to June Qtr
GDP, Unemployment & CPI = Year average
Cash Rate = June qtr
CBA Economists summary of key indicatorsEconomic
Summary
For
per
sona
l use
onl
y
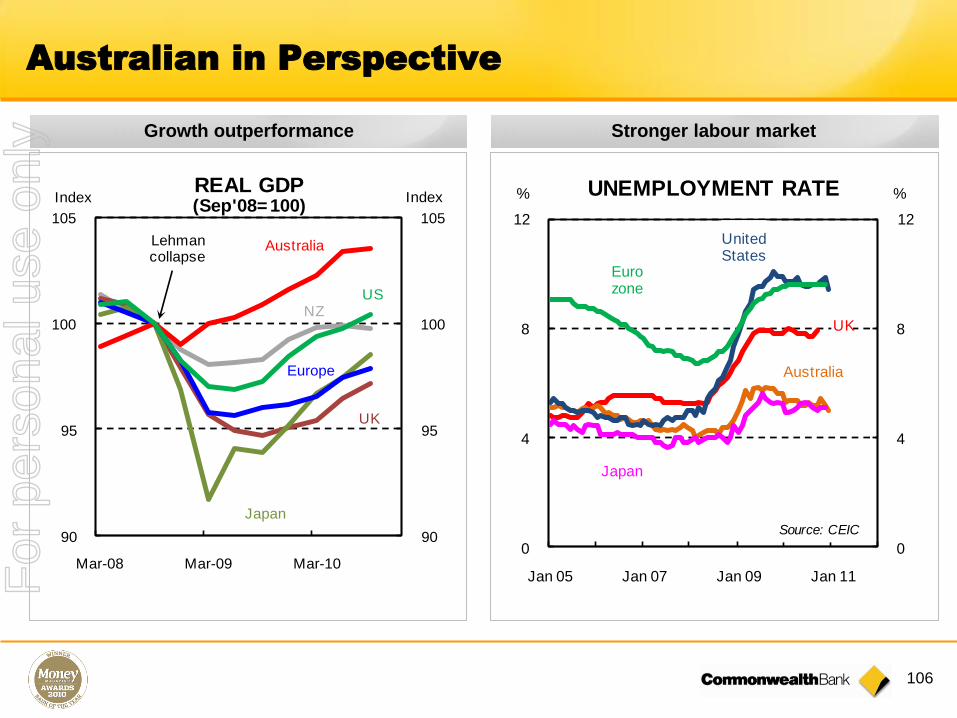
106
Growth outperformance Stronger labour market
Australian in Perspective
90
95
100
105
90
95
100
105
Mar-08 Mar-09 Mar-10
REAL GDP(Sep'08= 100)
Index Index
Japan
US
Australia
Europe
UK
NZ
Lehman collapse
0
4
8
12
0
4
8
12
Jan 05 Jan 07 Jan 09 Jan 11
%%
UK
Eurozone
Source: CEIC
UNEMPLOYMENT RATE
UnitedStates
Japan
Australia
For
per
sona
l use
onl
y

107
Global growth back to trend Asian outperformance supports commodities
China-Commodities-Incomes High debt to weigh on advanced economy growth
Global Backdrop
-2
0
2
4
-2
0
2
4
1994/95 1998/99 2002/03 2006/07 2010/11
COMMODITY INCOME BOOST*(% of GDP) %%
2010/11
*Source: CBA calculations
2011/12
0
2
4
6
0
2
4
6
<30% 30-60% 60-90% >90%
%pa%pa
Central government debt (% of GDP)
Source: Reinhart & Rogoff
GDP GROWTH & DEBT LEVELS(1790-2009)
Advanced economies
(median)
-2
0
2
4
6
8
-2
0
2
4
6
8
1950 1960 1970 1980 1990 2000 2010
WORLD GROWTH(annual % change) %%
Source: IMF
Long-runaverage
Globalrecessions
-1.0 -0.5 0.0 0.5 1.0 1.5
World
Advanced economies
Euro area
United States
Asian NICs
Developing Asia
China
India
Middle East
Lat America & Carrib
WORLD GROWTH IN 2011-2012(% deviation from normal*)
*1998-07 average
Source: IMF
For
per
sona
l use
onl
y

108
Domestic Drivers
High commodity prices A capex boom
Mining the key Supportive backdrop for profitability
0
50
100
150
0
50
100
150
1995 1997 1999 2001 2003 2005 2007 2009 2011
$bn $bn
Source: ABARE
ADVANCED MINING PROJECTS
0
15
30
45
0
15
30
45
1990 1994 1998 2002 2006 2010
%%
Non-mining
Mining
PROFIT SHARE(% of GDP at factor cost)
50
75
100
125
50
75
100
125
1984 1989 1994 1999 2004 2009
THE TERMS OF TRADEIndex Index
0
50
100
150
0
50
100
150
Sep-84 Sep-89 Sep-94 Sep-99 Sep-04 Sep-09
$bn $bnTHE CAPEX PIPELINE
(value of work yet to be done)
For
per
sona
l use
onl
y
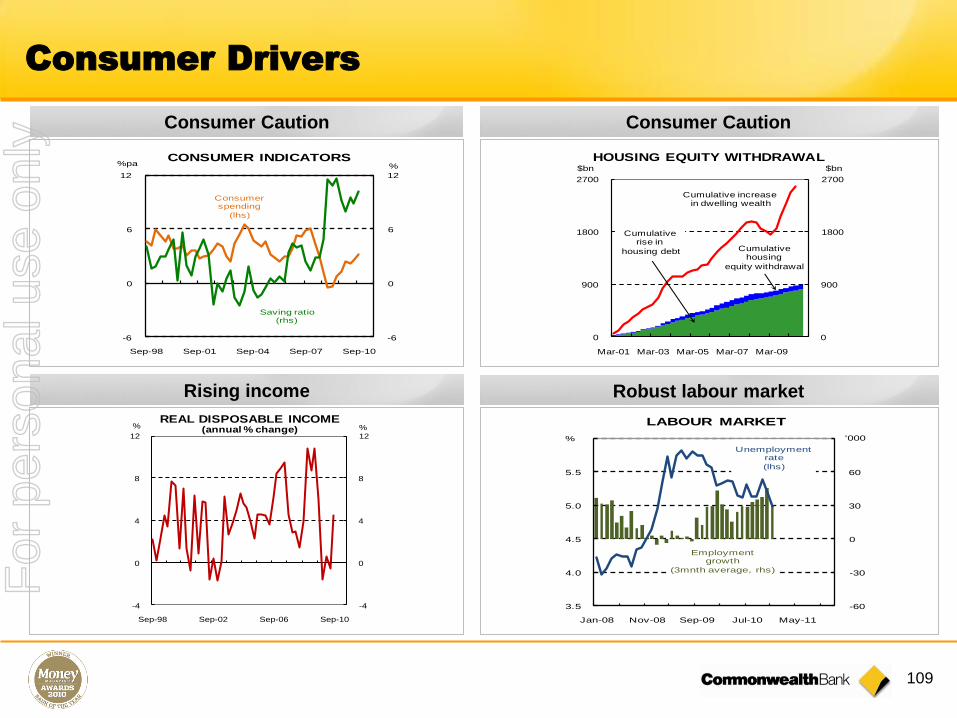
109
Consumer Caution
Consumer Drivers
-6
0
6
12
-6
0
6
12
Sep-98 Sep-01 Sep-04 Sep-07 Sep-10
CONSUMER INDICATORS
Saving ratio(rhs)
%pa %
Consumerspending
(lhs)
-60
-30
0
30
60
90
3.5
4.0
4.5
5.0
5.5
6.0
Jan-08 Nov-08 Sep-09 Jul-10 May-11
LABOUR MARKET
Employmentgrowth
(3mnth average, rhs)
Unemployment rate
(lhs)
% '000
0
900
1800
2700
0
900
1800
2700
Mar-01 Mar-03 Mar-05 Mar-07 Mar-09
$bn $bn
Cumulativehousing
equity withdrawal
Cumulative increase in dwelling wealth
HOUSING EQUITY WITHDRAWAL
Cumulativerise in
housing debt
-4
0
4
8
12
-4
0
4
8
12
Sep-98 Sep-02 Sep-06 Sep-10
REAL DISPOSABLE INCOME(annual % change)% %
Rising income Robust labour market
Consumer Caution
For
per
sona
l use
onl
y
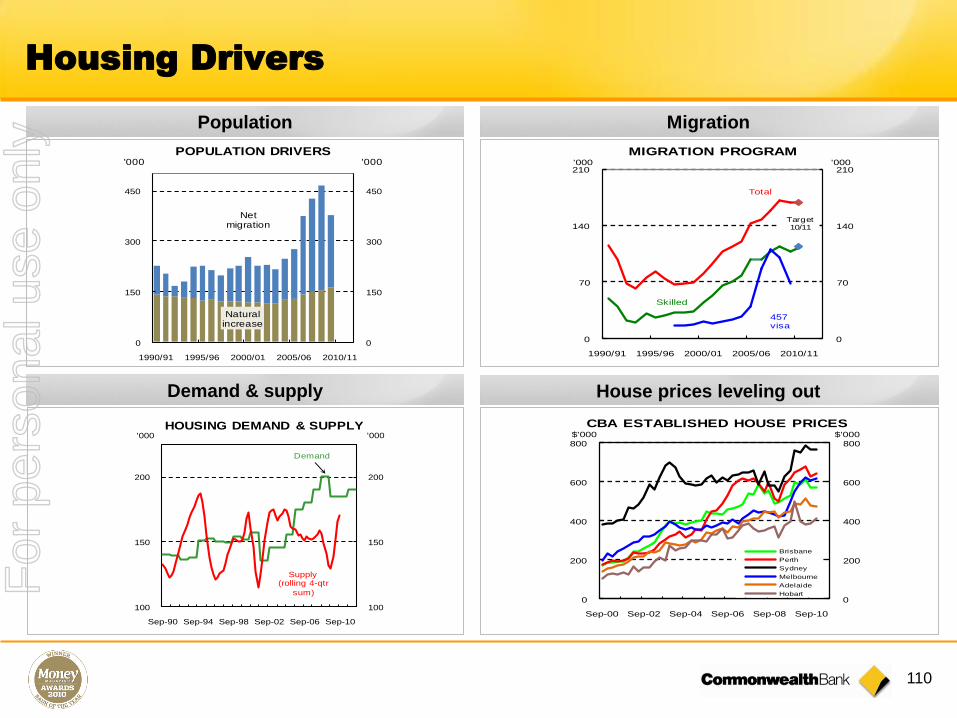
110
Housing Drivers
Population Migration
Demand & supply House prices leveling out
0
150
300
450
0
150
300
450
1990/91 1995/96 2000/01 2005/06 2010/11
POPULATION DRIVERS'000 '000
Netmigration
Naturalincrease
0
70
140
210
0
70
140
210
1990/91 1995/96 2000/01 2005/06 2010/11
MIGRATION PROGRAM'000 '000
Total
Skilled
457visa
Target10/11
0
200
400
600
800
0
200
400
600
800
Sep-00 Sep-02 Sep-04 Sep-06 Sep-08 Sep-10
Brisbane
Perth
Sydney
Melbourne
Adelaide
Hobart
CBA ESTABLISHED HOUSE PRICES$'000$'000
100
150
200
100
150
200
Sep-90 Sep-94 Sep-98 Sep-02 Sep-06 Sep-10
HOUSING DEMAND & SUPPLY
Demand
Supply(rolling 4-qtr
sum)
'000'000
For
per
sona
l use
onl
y
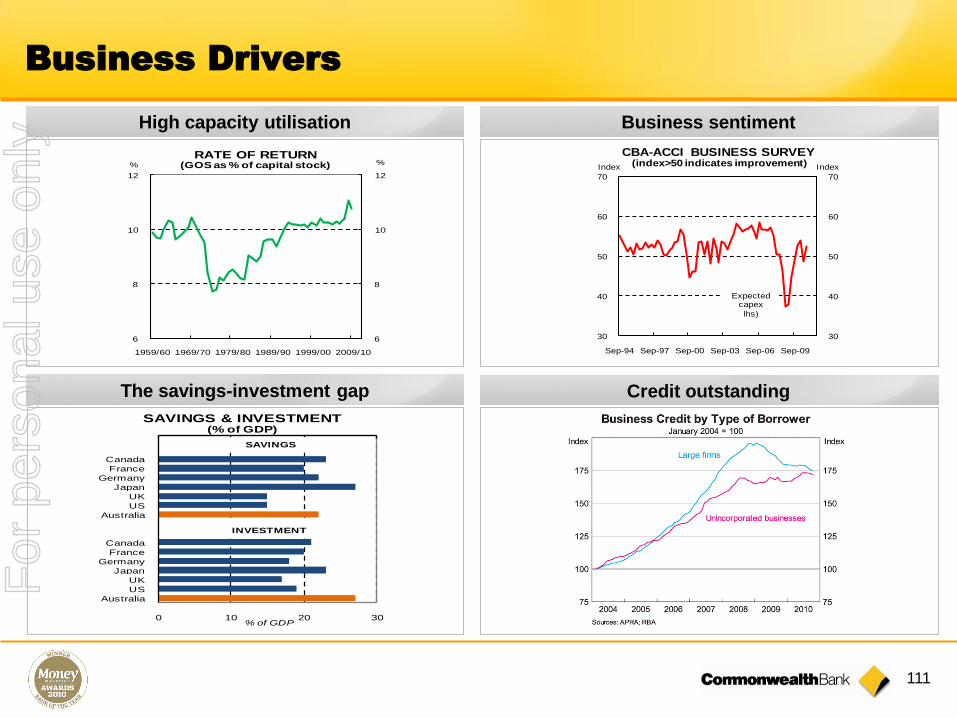
111
High capacity utilisation Business sentiment
Business Drivers
0 10 20 30
Canada
France
Germany
Japan
UK
US
Australia
Canada
France
Germany
Japan
UK
US
Australia
SAVINGS & INVESTMENT(% of GDP)
% of GDP
SAVINGS
INVESTMENT
30
40
50
60
70
30
40
50
60
70
Sep-94 Sep-97 Sep-00 Sep-03 Sep-06 Sep-09
CBA-ACCI BUSINESS SURVEY(index>50 indicates improvement)
Expectedcapex
lhs)
IndexIndex
6
8
10
12
6
8
10
12
1959/60 1969/70 1979/80 1989/90 1999/00 2009/10
RATE OF RETURN(GOS as % of capital stock) %%
Credit outstandingThe savings-investment gap
For
per
sona
l use
onl
y
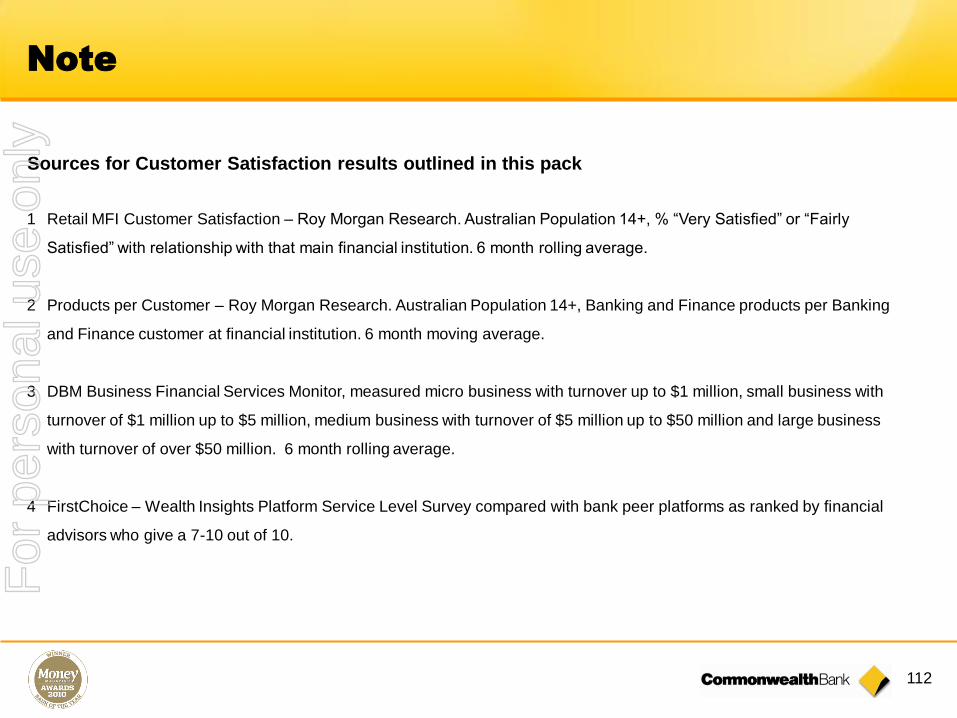
112
Note
1 Retail MFI Customer Satisfaction – Roy Morgan Research. Australian Population 14+, % “Very Satisfied” or “Fairly
Satisfied” with relationship with that main financial institution. 6 month rolling average.
2 Products per Customer – Roy Morgan Research. Australian Population 14+, Banking and Finance products per Banking
and Finance customer at financial institution. 6 month moving average.
3 DBM Business Financial Services Monitor, measured micro business with turnover up to $1 million, small business with
turnover of $1 million up to $5 million, medium business with turnover of $5 million up to $50 million and large business
with turnover of over $50 million. 6 month rolling average.
4 FirstChoice – Wealth Insights Platform Service Level Survey compared with bank peer platforms as ranked by financial
advisors who give a 7-10 out of 10.
Sources for Customer Satisfaction results outlined in this pack
For
per
sona
l use
onl
y
Commonwealth Bank of Australia ACN 123 123 124
Results PresentationFor the half year ended 31 December 2009
10 February 2010
For
per
sona
l use
onl
y