Embed Size (px)
Citation preview
A balance of outward and linear inward ionic currents is
required for the generation of slow wave oscillations
Jorge Golowasch1,2, Amitabha Bose2, Yinzheng Guan1, Dalia Salloum1, Andrea
Roeser1,2 and Farzan Nadim1,2
1 Federated Department of Biological Sciences, New Jersey Institute of Technology and
Rutgers University, Newark, NJ 07102
2 Department of Mathematical Sciences, New Jersey Institute of Technology, Newark,
NJ 07102
Abbreviated title: Slow wave oscillation require balanced currents
Corresponding Author: Jorge Golowasch
Federated Department of Biological Sciences, NJIT, 100 Summit St, CKB 337,
University Heights, NJ 07103, Phone: 973-596-8444, Fax: 973-596-5689.
Email: [email protected]
Keywords: rhythmic activity, compensation, ionic currents, model, phase space
Support: This work was supported by NSF DMS1122291 (AB), NIH MH064711 &
NS085330 (JG) and NIH MH060605 (FN).
. CC-BY-NC-ND 4.0 International licensepeer-reviewed) is the author/funder. It is made available under aThe copyright holder for this preprint (which was not. http://dx.doi.org/10.1101/136887doi: bioRxiv preprint first posted online May. 11, 2017;
2
Abstract
Regenerative inward currents help produce slow oscillations through a negative-slope
conductance region of their current-voltage relationship that is well approximated by a
linear negative conductance. We used dynamic clamp injections of a linear current with
this conductance, INL, to explore why some neurons can generate intrinsic slow
oscillations whereas others cannot. We addressed this question, in synaptically isolated
neurons of the crab Cancer borealis, after blocking action potentials. The pyloric
network consists of distinct pacemaker group and follower neurons, all of which express
the same complement of ionic currents. When the pyloric dilator (PD) neuron, a member
of the pacemaker group, was injected with INL using dynamic clamp, it consistently
produced slow oscillations. In contrast, the lateral pyloric (LP) or ventral pyloric (VD)
follower neurons, failed to oscillate with INL. To understand these distinct behaviors, we
compared outward current levels of PD, LP and VD neurons. We found that LP and VD
neurons had significantly larger high-threshold potassium currents (IHTK) than PD, and
LP had lower transient potassium current, IA. Reducing IHTK pharmacologically enabled
both LP and VD neurons to produce oscillations with INL, whereas modifying IA levels did
not affect INL-induced oscillations. Using phase-plane and bifurcation analysis of a
simplified model cell, we demonstrate that large levels of IHTK can block INL-induced
oscillatory activity, whereas generation of oscillations is almost independent of IA levels.
These results demonstrate the importance of a balance between inward pacemaking
currents and high-threshold K+ current levels in determining slow oscillatory activity.
. CC-BY-NC-ND 4.0 International licensepeer-reviewed) is the author/funder. It is made available under aThe copyright holder for this preprint (which was not. http://dx.doi.org/10.1101/136887doi: bioRxiv preprint first posted online May. 11, 2017;
3
Introduction
Leak currents are key determinants of neuronal excitability (Brickley et al. 2007; Lu and
Feng 2012; Lutas et al. 2016; Rekling et al. 2000) and can be regulated by many
different neuromodulators, which can modify the activity to either silence neurons, or to
induce spiking or oscillatory activity (Bayliss et al. 1992; Cymbalyuk et al. 2002; Egorov
et al. 2002; Lu and Feng 2012; Lutas et al. 2016; Talley et al. 2000; van den Top et al.
2004; Vandermaelen and Aghajanian 1983; Xu et al. 2009). Leak currents have been
proposed to control pacemaker rhythm generation (Amarillo et al. 2014; Blethyn et al.
2006; Cymbalyuk et al. 2002; Koizumi and Smith 2008; Lu and Feng 2012; Pang et al.
2009; Yamada-Hanff and Bean 2013; Zhao et al. 2010). Often, leak currents act to bring
the membrane potential to within a range of voltage where other currents can activate
and produce a new state of activity (Brickley et al. 2007; Lu and Feng 2012; Rekling et
al. 2000; Yamada-Hanff and Bean 2013).
Regenerative inward currents, such as persistent Na+- and low-threshold Ca++-currents,
are essential for the generation of oscillatory neuronal activity (Amarillo et al. 2014; Del
Negro et al. 2002; Dunmyre et al. 2011; Jahnsen and Llinas 1984; McCormick and
Huguenard 1992; Yamada-Hanff and Bean 2013; Zhao et al. 2010). These currents can
be divided into two almost linear components, only one of which is sufficient and
necessary to generate the oscillations (Bose et al. 2014; Zhao et al. 2010). Since this
component is linear, we refer to it as a leak current; however, it has negative slope
conductance (hence, a negative-conductance leak current, INL). It is a leak current in the
sense that, when combined with the standard leak current (IL), the total current INL+IL
remains linear, and yet it is a key determinant of neuronal excitability. The mechanism
by which INL controls oscillatory activity is by destabilizing the resting state of the cell
(Bose et al. 2014) thereby increasing the voltage of the cell to a point where outward
currents can turn on and bring the voltage back to hyperpolarized levels. In this way,
when INL dominates over IL, the total linear current can be a de facto pacemaker current
(Bose et al. 2014; Zhao et al. 2010).
Outward currents, primarily carried by K+, play an essential role as currents that restore
the polarization of the cells from which a new cycle of depolarization and
. CC-BY-NC-ND 4.0 International licensepeer-reviewed) is the author/funder. It is made available under aThe copyright holder for this preprint (which was not. http://dx.doi.org/10.1101/136887doi: bioRxiv preprint first posted online May. 11, 2017;
4
hyperpolarization can emerge. Consequently, the kinetics of these currents are
essential in determining the overall dynamics of the oscillatory activity (Bose et al.
2014). A balance between outward and inward currents is essential for the generation of
oscillatory activity: too little K+ current and the cell will be pushed towards, and
sometimes locked in, a depolarized state; too much K+ current and the increased
leakiness will prevent it from escaping the hyperpolarized resting state. A growing
number of recent studies indicate that ionic current levels may be linked via
mechanisms involving ion channel co-regulation (Bergquist et al. 2010; Linsdell and
Moody 1994; MacLean et al. 2003). A consequence of this co-regulation is that, in a
population of neurons, various parameters of these different currents (most notably their
amplitude or conductance) are correlated with one another (Amendola et al. 2012;
Anderson et al. 2016; Anirudhan and Narayanan 2015; Goaillard et al. 2009; Golowasch
2015; Khorkova and Golowasch 2007; Roffman et al. 2012; Schulz et al. 2006; Schulz
et al. 2007; Srikanth and Narayanan 2015; Temporal et al. 2012; Temporal et al. 2014).
Such co-regulation is likely to be involved in maintaining the balance of regenerative
and outward ionic currents to regulate activity levels in oscillatory neurons.
In the stomatogastric nervous system, INL, corresponding to the negatively sloped
portion of the modulator-activated inward current IMI (Golowasch and Marder 1992b;
Gray and Golowasch 2016; Swensen and Marder 2000), is a pacemaker current of the
pyloric network pacemaker neurons (Bose et al. 2014; Zhao et al. 2010). This current
underlies the slow oscillations observed in the presence of a variety of neuromodulators
(Golowasch and Marder 1992b; Swensen and Marder 2000), even in the presence of
the Na+ channel blocker tetrodotoxin. Although IMI is expressed by all pyloric neurons
(Swensen and Marder 2000), when these neurons are synaptically isolated, modulator-
induced oscillations occur only in a small subset: the three electrically coupled neurons
regarded as the pacemaker neurons of the network (two Pyloric Dilators, PD, and one
Anterior Burster, AB, neurons (Hooper and Marder 1987)). Why other pyloric neurons
do not show pacemaker activity in the presence of modulators is unclear.
Using both theoretical and experimental methods, we test the hypothesis that the
generation of slow-wave oscillations requires the correct balance of a linear pacemaker
. CC-BY-NC-ND 4.0 International licensepeer-reviewed) is the author/funder. It is made available under aThe copyright holder for this preprint (which was not. http://dx.doi.org/10.1101/136887doi: bioRxiv preprint first posted online May. 11, 2017;

5
inward current and outward currents. Our hypothesis is based on the property that INL is
sufficient to emulate the pacemaker IMI (Bose et al. 2014). We show that this balance
can only be produce in a subset pyloric network neurons that express the appropriate
levels of high-threshold potassium currents. We further show how the induction of
oscillatory activity depends on the interplay between the maximal conductance (gNL) and
equilibrium potential (ENL) of INL, and how these observations match our theoretical
predictions.
Methods
Experimental
Experiments were performed on identified neurons from the stomatogastric ganglion
(STG) of male crabs (Cancer borealis). The animals were obtained at local markets in
Newark (NJ) and maintained in seawater tanks at 10–13°C. The entire stomatogastric
nervous system, including the anterior commissural and esophageal ganglia, STG and
connecting and motor nerves were dissected out as previously described (Selverston et
al. 1976) and pinned down on a Sylgard-coated Petri dish, and the STG was
desheathed, to allow for electrode impalement of the cell bodies. All preparations were
continuously superfused with chilled (10 - 13°C) physiological Cancer saline: (in mM) 11
KCl, 440 NaCl, 13 CaCl2, 26 MgCl2, 11.2 Trizma base, 5.1 maleic acid, pH 7.4 –7.5.
Extracellular recordings were performed with pin electrodes placed in petroleum jelly
wells built around individual nerves and recorded differentially, relative to an electrode
placed outside of the well, using an A-M Systems 1700 differential amplifier (A-M
Systems, Carlsberg, WA). Intracellular recordings, current injections and voltage clamp
were performed with Axoclamp 2B amplifiers (Molecular Devices, Sunnydale, CA) using
double impalements with 0.6 M K2SO4 + 20 mM KCl-filled borosilicate electrodes. Low
resistance electrodes (15-20 MΩ) were used for current injection, and high resistance
electrodes (30-40 MΩ) for voltage measurement. Individual neurons were identified by
matching intracellularly recorded action potentials to action potentials on identified
motor nerves that innervate known muscles (Selverston et al. 1976).
. CC-BY-NC-ND 4.0 International licensepeer-reviewed) is the author/funder. It is made available under aThe copyright holder for this preprint (which was not. http://dx.doi.org/10.1101/136887doi: bioRxiv preprint first posted online May. 11, 2017;
6
In every preparation, action potentials were blocked by bath application of 10-7 M
tetrodotoxin (TTX; Biotium). This treatment effectively blocks all modulatory inputs,
including peptidergic and cholinergic modulators that activate IMI (Golowasch and
Marder 1992b; Swensen and Marder 2000), therefore decentralizing the preparation.
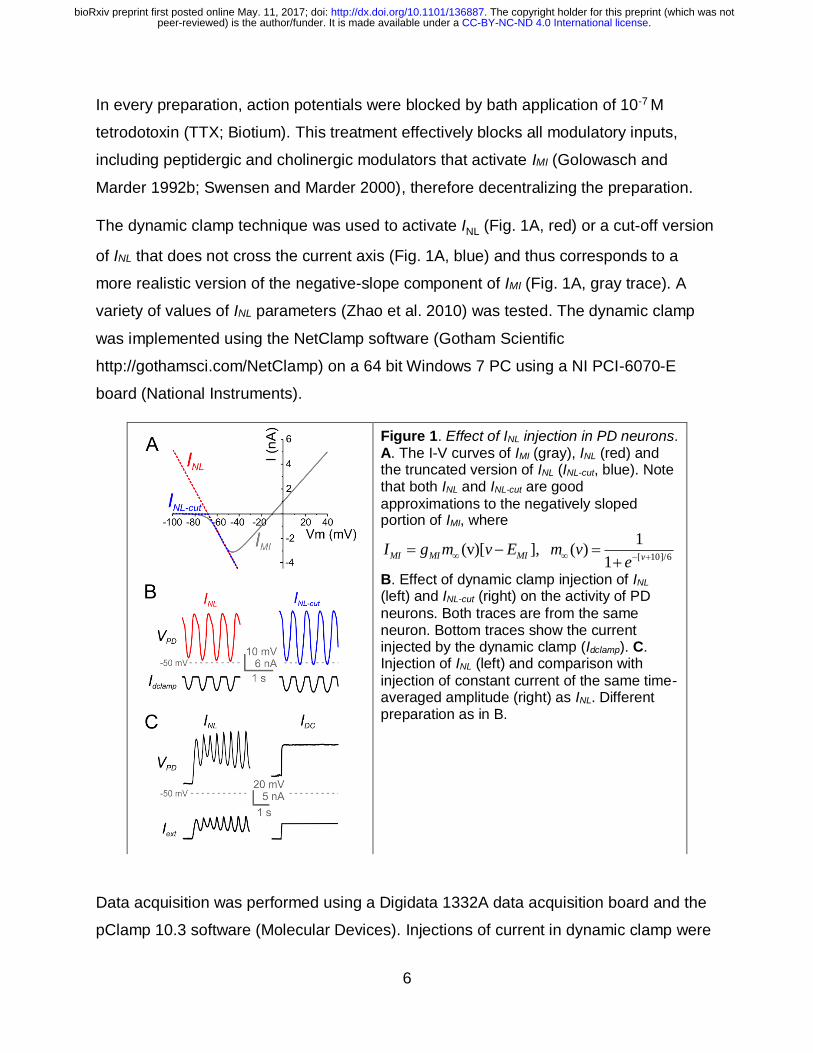
The dynamic clamp technique was used to activate INL (Fig. 1A, red) or a cut-off version
of INL that does not cross the current axis (Fig. 1A, blue) and thus corresponds to a
more realistic version of the negative-slope component of IMI (Fig. 1A, gray trace). A
variety of values of INL parameters (Zhao et al. 2010) was tested. The dynamic clamp
was implemented using the NetClamp software (Gotham Scientific
http://gothamsci.com/NetClamp) on a 64 bit Windows 7 PC using a NI PCI-6070-E
board (National Instruments).
Data acquisition was performed using a Digidata 1332A data acquisition board and the
pClamp 10.3 software (Molecular Devices). Injections of current in dynamic clamp were
Figure 1. Effect of INL injection in PD neurons. A. The I-V curves of IMI (gray), INL (red) and the truncated version of INL (INL-cut, blue). Note that both INL and INL-cut are good
approximations to the negatively sloped portion of IMI, where
[ 10]/6
1,(v)[ ] ( )
1MI MIMI v
I g v E m ve
m
B. Effect of dynamic clamp injection of INL (left) and INL-cut (right) on the activity of PD
neurons. Both traces are from the same neuron. Bottom traces show the current injected by the dynamic clamp (Idclamp). C. Injection of INL (left) and comparison with
injection of constant current of the same time-averaged amplitude (right) as INL. Different preparation as in B.
. CC-BY-NC-ND 4.0 International licensepeer-reviewed) is the author/funder. It is made available under aThe copyright holder for this preprint (which was not. http://dx.doi.org/10.1101/136887doi: bioRxiv preprint first posted online May. 11, 2017;
7
performed at 10 KHz and voltage recordings at 5 KHz. The following equations were
used:
[ ]
[ (] )
NL
NL cut
NL NL
NL NL NL
I g v E
I g v E Heav v E
For dynamic clamp experiments involving the pyloric dilator (PD) neuron, the values
used for injection were 12 values of gNL from -0.01 to -0.30 μS and the reference value
of ENL was set at 2 mV below the cell’s resting potential (Vrest), typically resulting in ENL =
−67 to −58 mV. The value of ENL was changed by increments of ±5 mV up to ±15 mV
from this reference value (a total of 7 values).
Ionic currents were measured in two-electrode voltage clamp. The high-threshold K+
current (IHTK) was measured with depolarizing voltage steps from a holding voltage of -
40 mV to inactivate the transient K+ current (IA). IA was measured with the same
depolarizing voltage steps as for IHTK but from a holding voltage of -80 mV and
calculated by subtraction of IHTK from these recordings (Zhao and Golowasch 2012).
Pharmacological agents were prepared immediately before use. Statistical analysis was
performed with either SigmaPlot 12 (Systat) or Origin 8.5 (OribinLab) software.
Model
The equations that describe the full model involve currents for leak (IL), negative-
conductance leak with cutoff (INL-cut) and three potassium currents, delayed rectifier
(IKdr), high-threshold (IHTK) and an A-current (IA) are:
[ ] [ ] ]
(
[
[ [
( ),
( )
( )
( )
) ] ]
ext L L NL Kdr
H
NL NL
TK
K
K A K
K
A
m
dvC I g v E g v E Heav v E g w v E
dt
g v E g v E
w v wdw
dt v
h v hdh
dt
h
v
v w
(1)
. CC-BY-NC-ND 4.0 International licensepeer-reviewed) is the author/funder. It is made available under aThe copyright holder for this preprint (which was not. http://dx.doi.org/10.1101/136887doi: bioRxiv preprint first posted online May. 11, 2017;
8
The parameter C is the capacitance. The variable v represents the membrane potential,
w is an activation variable for potassium currents which, for convenience, is taken to be
common for both IKdr and IA, and h is an inactivation variable for IA. IHTK is considered to
have instantaneous activation and no inactivation. The parameters gx and Ex represent
the maximal conductance and reversal potentials for the various currents, respectively.
We use the cutoff version ][ ( )NL cut NL NL NLI g v E Heav v E with a negative maximal
conductance value gNL (Fig. 1A, blue). The Heaviside function ( )NLHeav v E , is 0 when v
< ENL and is equal to 1 when v ≥ ENL. This implies that for v ≥ ENL, INL-cut is simply a
linear current with negative conductance, while for v < ENL, INL-cut = 0 (Fig. 1A, blue). The
terms w∞(v) and m∞(v) are the steady-state activation functions for the two potassium
currents and h∞(v) is the steady state inactivation function of IA. They are described by
equations:
( 40)/4 ( 25)/3 ( 50)/4
1 1 1( ) , ( ) , ( )
1 e 1 1 e
v v v
w v m v ve
h .
The associated time constants are given by
3.9 16.25( ) , ( )
cosh(( 40) / 4)) cosh(( 50) / 4))AK v v
v v
.
Parameter values that vary across simulations are provided in the Results, while those
that were fixed are given here: C = 1 μF/cm2, gL = 0.00325 μS, EL = -60 mV, gKdr =
0.0325 μS, EK = -80 mV and Iext = 0.065 nA. These parameters were chosen so that the
period of oscillations in the simulations was on the order of those found in experiments.
Simulations and bifurcation diagrams were constructed using XPPAUT (Ermentrout
2002).
In prior work (Bose et al. 2014), we analyzed the case of IHTK = IA= 0 and showed that
non-zero INL and IKdr currents alone can produce oscillations. In order to now isolate the
effect of IHTK with regard to pacemaker properties, for much of the analysis we continue
to keep IA=0. With IA=0, the variable h is redundant and the set of equations (1) reduces
to a two-dimensional system that will be analyzed using phase plane methods. We will
. CC-BY-NC-ND 4.0 International licensepeer-reviewed) is the author/funder. It is made available under aThe copyright holder for this preprint (which was not. http://dx.doi.org/10.1101/136887doi: bioRxiv preprint first posted online May. 11, 2017;

9
show that a non-zero value of IA does not affect the existence of oscillations, but that if it
is large enough it can introduce a stable, sub-threshold fixed point.
Results
The pacemaker current operates over restricted parameter ranges
Our first goal here is to characterize some of the conditions that IMI needs to satisfy to
operate as a pacemaker current as predicted by our previous theoretical work (Bose et
al. 2014). Oscillatory activity can be induced in the PD neuron by injecting the negative-
leak conductance current INL (Fig. 1B, C), which is a linearized version of the pacemaker
current IMI (Fig. 1A). The effect of INL only depends on the region of its I-V curve where
the current is negative. Therefore, injection of the same current which is set to 0 below
ENL (the cut-off version INL-cut) produces almost identical oscillations (Fig. 1B; see
Methods). Since the results for oscillatory activity are nearly identical, henceforth we
use INL.
The effect of INL in producing oscillations in the PD neuron could not be mimicked by
injecting a depolarizing DC current (Fig. 1C right) equal to the time-averaged current
measured during the dynamic clamp injection of INL (Fig. 1C left), demonstrating that the
effects of INL are not simply a consequence of a depolarization of the cell by INL, but its
role as a voltage-dependent current.
In our previous study, we predicted that oscillations produced by INL would occur in a
restricted range of gNL (Bose et al. 2014). To explore the effect of the INL parameters on
the oscillatory activity, we changed gNL over 12 values from -0.01 to -0.30 µS and ENL
over a range of ±15 mV in steps of ±5 mV from the initial reference value (for a range of
12 x 7 = 84 runs; see Methods). We found that there was a double Gaussian distribution
(R2=0.9185) of gNL-ENL values over which INL was effective in eliciting oscillatory activity
(Fig. 2A).
An important point that these results illustrated was that oscillatory activity in the pyloric
pacemaker cells does not require TTX-sensitive Na+ currents to be produced. We
. CC-BY-NC-ND 4.0 International licensepeer-reviewed) is the author/funder. It is made available under aThe copyright holder for this preprint (which was not. http://dx.doi.org/10.1101/136887doi: bioRxiv preprint first posted online May. 11, 2017;
10
observed a relative independence of cycle period on gNL (Fig. 2B), but a decreasing
amplitude of oscillations as gNL became larger in absolute value (Fig. 2C). On the other
hand, period was an increasing function of ENL (Fig. 2D) and the oscillation amplitude
had an inverted U-shape relationship with ENL (Fig. 2E).
Pacemaker cells balance inward and outward currents to produce oscillatory
activity
The effect of IHTK
As we have seen, INL injected into neurons of the pacemaker group (i.e. PD neurons)
consistently induces oscillatory activity (Fig. 2, Fig. 3, top left), albeit within relatively
narrow ranges of gNL and ENL (Fig. 2). We examined whether follower neurons in the
network were equally capable of generating oscillatory activity.
We observed that none of the follower cells in the pyloric network (ventral dilator VD,
pyloric constrictor PY, inferior cardiac IC, lateral pyloric LP and lateral posterior gastric
LPG neurons) were capable of generating consistent oscillatory activity independently
of the combination of gNL and ENL used. Individual examples shown in Figure 3 were
obtained by injection of gNL = -0.16 S and ENL = Vrest – 2 mV for each cell type.
However, each cell was further tested with the same combination of gNL and ΔErev as
the PD cells shown in Figure 2A. We found that only one out of eight LP neurons tested
expressed any oscillatory activity, and none of the other follower cells tested could
express such activity for any of the gNL and ENL combinations.
. CC-BY-NC-ND 4.0 International licensepeer-reviewed) is the author/funder. It is made available under aThe copyright holder for this preprint (which was not. http://dx.doi.org/10.1101/136887doi: bioRxiv preprint first posted online May. 11, 2017;

11
Figure 2. Effect of INL parameters on PD neuron oscillations. Identified PD
neurons (N=7) were injected with dynamic clamp INL and parameters gNL and Erev were modified over a broad range of values. A. The presence
or absence of oscillations (# of oscillatory preparations out of 7) was graphed as a function of the change in Erev
relative to each cell’s resting voltage (ΔErev = 0 = Vrest – 2
mV), and the value of the negative conductance injected (gNL). Red symbols
are the experimental data. The smooth surface is a Gaussian surface fit to the experimental data. Adjusted R2 = 0.9185. B. Average period vs gNL. C. Average amplitude vs gNL. D. Average period vs ENL. E. Average amplitude vs ENL. All data shown in A-E are from the same set of cells. Error bars are SEM.
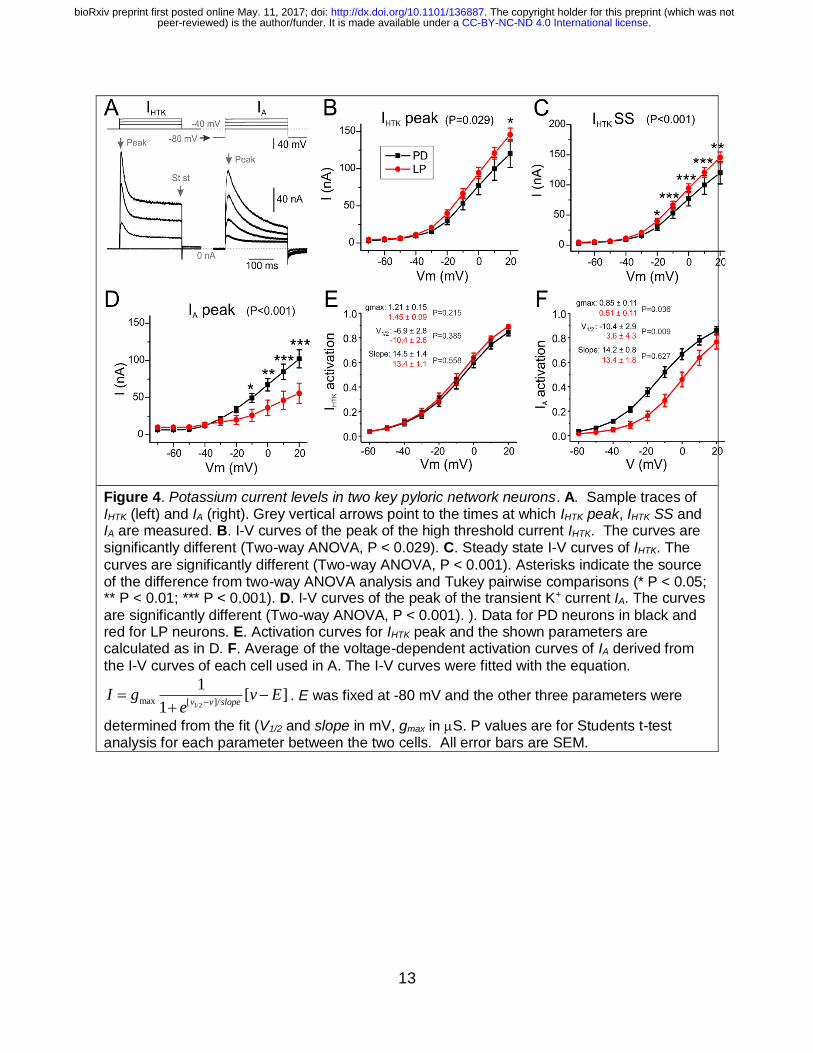
To understand what prevents follower cells from expressing oscillatory activity, we
examined the levels of K+ currents expressed in two of the follower cells (LP and VD
neurons) and compared that to the current levels expressed by the pacemaker PD
neurons. Our hypothesis throughout was that large outward currents could be
responsible for preventing oscillatory activity. Figure 4 shows the comparison of two
outward currents, IHTK and IA (see definitions in Methods), with IHTK further divided into
peak (IHTK peak) and steady state (IHTK SS) in two cell types the PD and LP neurons.
. CC-BY-NC-ND 4.0 International licensepeer-reviewed) is the author/funder. It is made available under aThe copyright holder for this preprint (which was not. http://dx.doi.org/10.1101/136887doi: bioRxiv preprint first posted online May. 11, 2017;

12
Figure 3. Dynamic clamp INL injection in pyloric network neurons cannot induce oscillatory activity in follower cells. Identified neurons with characteristic activity response to INL injection
(gNL = 0.16 S, ENL = Vrest – 2 mV) of the cells listed. PD neurons responded with oscillatory activity in 100% of the preparations tested. The numbers next to the cell type name indicate how many of the total cells tested showed any oscillatory activity. All cells were tested with the same combinations of gNL and ΔErev as the PD neurons shown in Figure 2A. Top traces in
each panel is the membrane potential; bottom trace is the dynamic clamp current injected.
PD neurons expressed a significantly smaller IHTK than LP neurons, when this current
was compared at its peak (two-way ANOVA, P = 0.029, Fig. 4B), as well as at steady
state (P < 0.001, Fig. 4C). Interestingly, the activation parameters as well as the
maximal conductance of the peak of IHTK are not significantly different between PD and
LP neurons (Fig. 4E; PD, Table 1). However, the differences, especially in gmax_HTK and
V1/2_HTK, while independently not significantly different between these cells, were
sufficient to make the currents different between them.
. CC-BY-NC-ND 4.0 International licensepeer-reviewed) is the author/funder. It is made available under aThe copyright holder for this preprint (which was not. http://dx.doi.org/10.1101/136887doi: bioRxiv preprint first posted online May. 11, 2017;
13
Figure 4. Potassium current levels in two key pyloric network neurons. A. Sample traces of IHTK (left) and IA (right). Grey vertical arrows point to the times at which IHTK peak, IHTK SS and IA are measured. B. I-V curves of the peak of the high threshold current IHTK. The curves are significantly different (Two-way ANOVA, P < 0.029). C. Steady state I-V curves of IHTK. The
curves are significantly different (Two-way ANOVA, P < 0.001). Asterisks indicate the source of the difference from two-way ANOVA analysis and Tukey pairwise comparisons (* P < 0.05; ** P < 0.01; *** P < 0.001). D. I-V curves of the peak of the transient K+ current IA. The curves
are significantly different (Two-way ANOVA, P < 0.001). ). Data for PD neurons in black and red for LP neurons. E. Activation curves for IHTK peak and the shown parameters are calculated as in D. F. Average of the voltage-dependent activation curves of IA derived from
the I-V curves of each cell used in A. The I-V curves were fitted with the equation.
1/2max [ ]/
1[ ]
1v v slope
I g v Ee
. E was fixed at -80 mV and the other three parameters were
determined from the fit (V1/2 and slope in mV, gmax in S. P values are for Students t-test analysis for each parameter between the two cells. All error bars are SEM.
. CC-BY-NC-ND 4.0 International licensepeer-reviewed) is the author/funder. It is made available under aThe copyright holder for this preprint (which was not. http://dx.doi.org/10.1101/136887doi: bioRxiv preprint first posted online May. 11, 2017;

14
Table 1. IHTK and IA parameters in PD and LP neurons. Parameters were obtained from fits of a sigmoidal function to conductances calculated from IHTK and IA measurements and a driving
force = (Vm - Erev), with Erev = -80 mV.
Mean SD t (d.f.) P
PD LP PD LP
gmax_HTK (S) 1.21 1.45 0.61 0.33 -1.270 (28) 0.215
V1/2_HTK (mV) -6.9 -10.4 11.6 9.3 0.883 (28) 0.385
Vslope_HTK (mV) 14.5 13.4 5.8 3.8 0593 (28) 0.558
gmax_A (S) 0.85 0.51 0.44 0.39 2.205 (28) 0.036
V1/2_A (mV) -10.4 3.6 11.8 15.7 -2.829 (28) 0.009
Vslope_A (mV) 14.2 13.5 3.4 6.5 0.491 (28) 0.627
In contrast to IHTK, PD neurons had a significant larger IA than LP neurons (two-way
ANOVA, P = 0.001, Fig. 4D) in part derived from a significantly more hyperpolarized
activation curve (V1/2_A, Fig. 4F, Table 1) and a significantly higher maximum
conductance (gmax_A,Table 1). The Vslope of IA did not differ significantly between the two
cells (Table 1).
The functional significance of K+ current amplitude differences
In order to test if the differences in K+ current levels reported above are functionally
related to the inability of follower cells to generate oscillatory activity when injected with
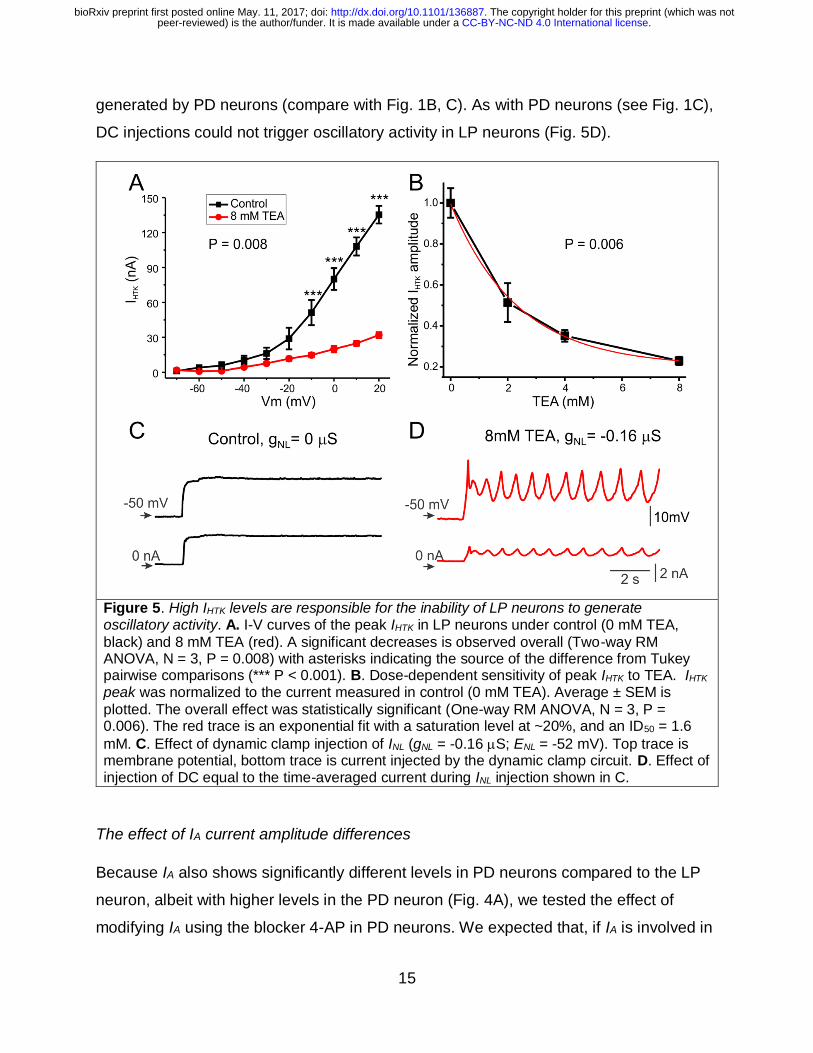
INL, we reduced IHTK with different concentrations of TEA (Golowasch and Marder
1992a) in the LP neuron. A significant effect of TEA on the IHTK I-V curve is observed at
all voltages (two-way RM ANOVA, P = 0.008, Fig. 5A). In fact, a highly significant effect
of TEA concentrations was observed, with a maximum inhibition level of ~80% and a
half-maximal effect at 1.6 mM (Fig. 5B). We tested whether reduced IHTK conditions
were more permissive for producing oscillations by injecting INL (gNL = -0.16 S) in the
presence of 8 mM TEA. We observed that, under these conditions, oscillatory activity
could be consistently elicited in the LP neuron (Fig. 5C; N = 4) comparable to those
. CC-BY-NC-ND 4.0 International licensepeer-reviewed) is the author/funder. It is made available under aThe copyright holder for this preprint (which was not. http://dx.doi.org/10.1101/136887doi: bioRxiv preprint first posted online May. 11, 2017;
15
generated by PD neurons (compare with Fig. 1B, C). As with PD neurons (see Fig. 1C),
DC injections could not trigger oscillatory activity in LP neurons (Fig. 5D).
Figure 5. High IHTK levels are responsible for the inability of LP neurons to generate oscillatory activity. A. I-V curves of the peak IHTK in LP neurons under control (0 mM TEA,
black) and 8 mM TEA (red). A significant decreases is observed overall (Two-way RM ANOVA, N = 3, P = 0.008) with asterisks indicating the source of the difference from Tukey pairwise comparisons (*** P < 0.001). B. Dose-dependent sensitivity of peak IHTK to TEA. IHTK peak was normalized to the current measured in control (0 mM TEA). Average ± SEM is
plotted. The overall effect was statistically significant (One-way RM ANOVA, N = 3, P = 0.006). The red trace is an exponential fit with a saturation level at ~20%, and an ID50 = 1.6
mM. C. Effect of dynamic clamp injection of INL (gNL = -0.16 S; ENL = -52 mV). Top trace is membrane potential, bottom trace is current injected by the dynamic clamp circuit. D. Effect of injection of DC equal to the time-averaged current during INL injection shown in C.
The effect of IA current amplitude differences
Because IA also shows significantly different levels in PD neurons compared to the LP
neuron, albeit with higher levels in the PD neuron (Fig. 4A), we tested the effect of
modifying IA using the blocker 4-AP in PD neurons. We expected that, if IA is involved in
. CC-BY-NC-ND 4.0 International licensepeer-reviewed) is the author/funder. It is made available under aThe copyright holder for this preprint (which was not. http://dx.doi.org/10.1101/136887doi: bioRxiv preprint first posted online May. 11, 2017;
16
the regulation of PD neurons to generate oscillatory activity, reducing IA levels in the PD
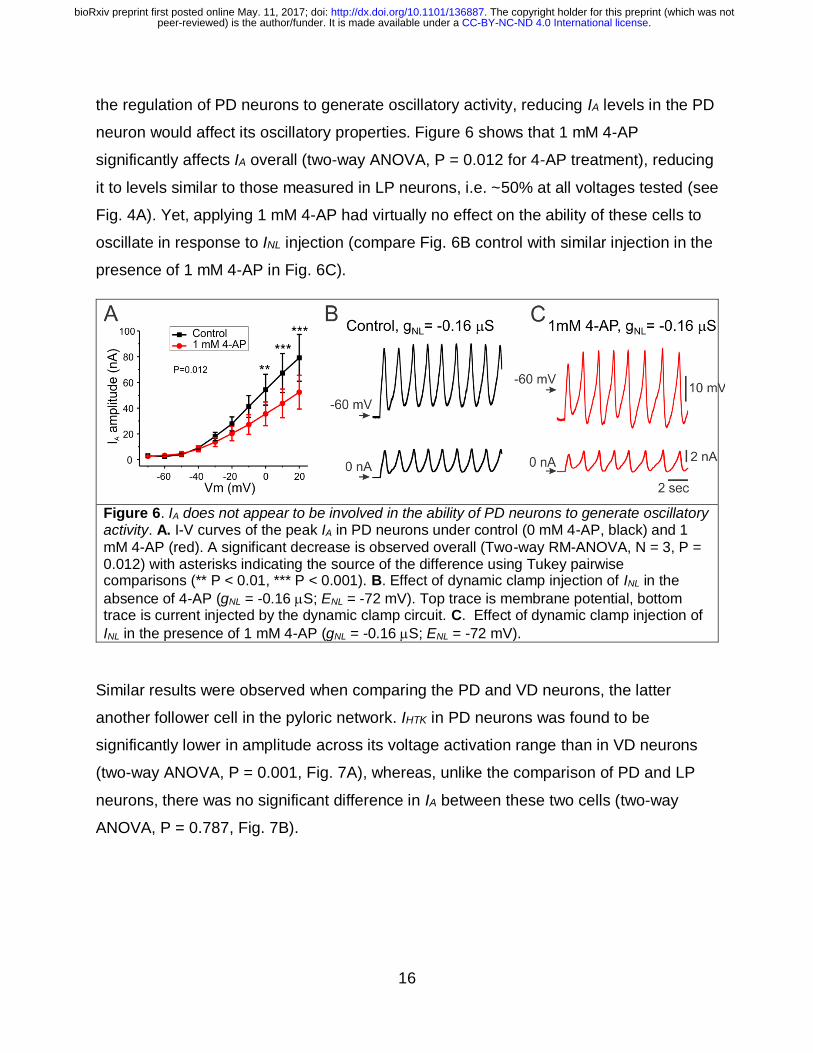
neuron would affect its oscillatory properties. Figure 6 shows that 1 mM 4-AP
significantly affects IA overall (two-way ANOVA, P = 0.012 for 4-AP treatment), reducing
it to levels similar to those measured in LP neurons, i.e. ~50% at all voltages tested (see
Fig. 4A). Yet, applying 1 mM 4-AP had virtually no effect on the ability of these cells to
oscillate in response to INL injection (compare Fig. 6B control with similar injection in the
presence of 1 mM 4-AP in Fig. 6C).
Figure 6. IA does not appear to be involved in the ability of PD neurons to generate oscillatory activity. A. I-V curves of the peak IA in PD neurons under control (0 mM 4-AP, black) and 1
mM 4-AP (red). A significant decrease is observed overall (Two-way RM-ANOVA, N = 3, P = 0.012) with asterisks indicating the source of the difference using Tukey pairwise comparisons (** P < 0.01, *** P < 0.001). B. Effect of dynamic clamp injection of INL in the
absence of 4-AP (gNL = -0.16 S; ENL = -72 mV). Top trace is membrane potential, bottom trace is current injected by the dynamic clamp circuit. C. Effect of dynamic clamp injection of
INL in the presence of 1 mM 4-AP (gNL = -0.16 S; ENL = -72 mV).
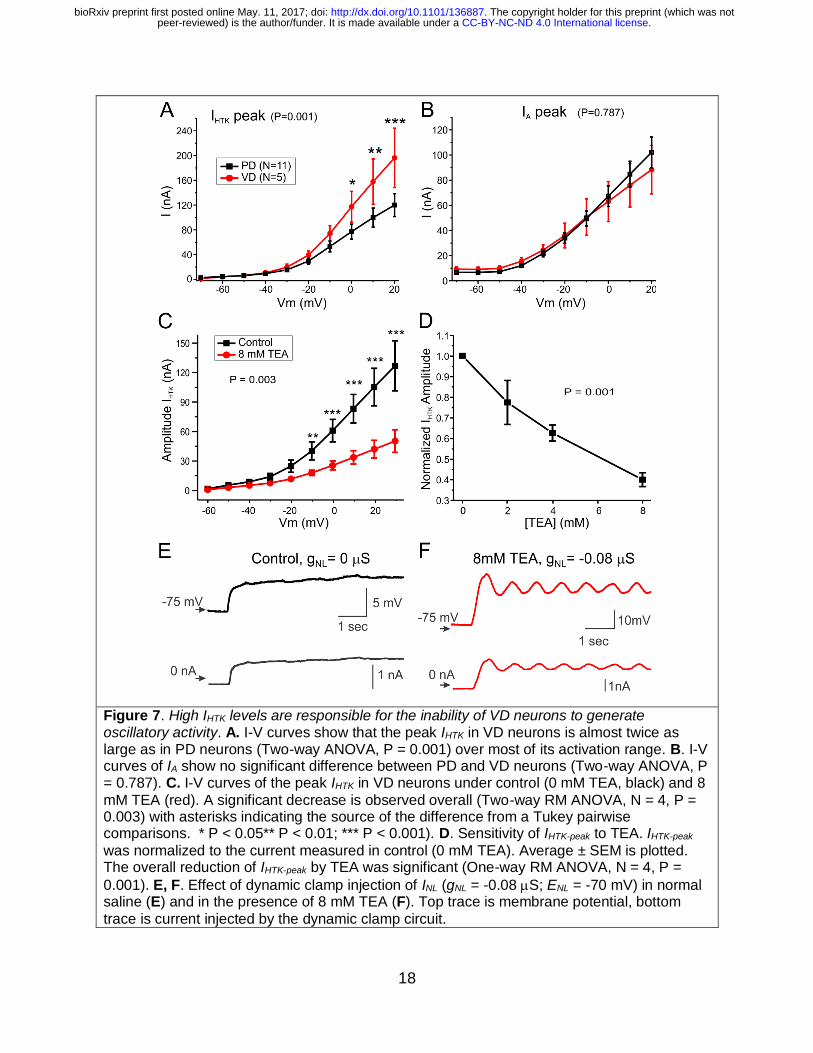
Similar results were observed when comparing the PD and VD neurons, the latter
another follower cell in the pyloric network. IHTK in PD neurons was found to be
significantly lower in amplitude across its voltage activation range than in VD neurons
(two-way ANOVA, P = 0.001, Fig. 7A), whereas, unlike the comparison of PD and LP
neurons, there was no significant difference in IA between these two cells (two-way
ANOVA, P = 0.787, Fig. 7B).
. CC-BY-NC-ND 4.0 International licensepeer-reviewed) is the author/funder. It is made available under aThe copyright holder for this preprint (which was not. http://dx.doi.org/10.1101/136887doi: bioRxiv preprint first posted online May. 11, 2017;

17
Table 2. IHTK and IA parameters in PD and VD neurons. Parameters were obtained from fits of a sigmoidal function to conductances calculated from IHTK and IA measurements and a driving force = (Vm - Erev), with Erev = -80 mV.
Mean SD t (d.f.) P
PD VD PD VD
gmax_HTK (S) 1.37 2.22 0.66 1.21 -1.894 (15) 0.078
V1/2_HTK (mV) -11.9 -13.5 9.8 13.5 0.274 (15) 0.788
Vslope_HTK (mV) 16.8 14.9 6.1 6.0 0.605 (15) 0.554
gmax_A (S) 1.06 0.81 0.41 0.47 1.183 (15) 0.255
V1/2_A (mV) -12.5 -19.2 12.3 15.8 0.974 (15) 0.345
Vslope_A (mV) 14.6 9.2 2.8 3.7 3.366 (15) 0.004
Bath application of 8 mM TEA reduced the amplitude of IHTK significantly (Fig. 7C, N=4,
two-way RM-ANOVA, P = 0.003). The effect of TEA was dose-dependent (one-way RM-
ANOVA, P < 0.001, Fig. 7D). When INL was injected (gNL = -0.16 S) in control medium
(0 mM TEA), VD neurons such as the one shown in Figure 7E depolarized but never
generated oscillations (see also Fig. 3). However, in the presence of 8 mM TEA, the
same INL injection elicited oscillations (Fig. 7F) comparable to those produced by INL in
PD neurons in normal TTX saline (Fig. 1B, C) and LP neurons in TEA (Fig. 5D).
Modeling description of experimental observations
We performed simulations using equation (1) to determine whether a theoretical model
provides a framework for understanding our experimental findings. The main question
we investigated was whether differences in various K+ currents could cause a model
neuron to either oscillate or not. Additionally, we checked to see what computational
predictions our model made with regards to period and amplitude as functions of
parameters associated with INL.
To guide the simulations, we first discuss the phase space structure of the model.
Recall that we are keeping gKdr fixed throughout at 0.0325 μS, and gL at 0.00325 μS.
This is to ensure oscillations in the absence of additional K+ currents when INL is added.
. CC-BY-NC-ND 4.0 International licensepeer-reviewed) is the author/funder. It is made available under aThe copyright holder for this preprint (which was not. http://dx.doi.org/10.1101/136887doi: bioRxiv preprint first posted online May. 11, 2017;
18
Figure 7. High IHTK levels are responsible for the inability of VD neurons to generate oscillatory activity. A. I-V curves show that the peak IHTK in VD neurons is almost twice as large as in PD neurons (Two-way ANOVA, P = 0.001) over most of its activation range. B. I-V curves of IA show no significant difference between PD and VD neurons (Two-way ANOVA, P = 0.787). C. I-V curves of the peak IHTK in VD neurons under control (0 mM TEA, black) and 8
mM TEA (red). A significant decrease is observed overall (Two-way RM ANOVA, N = 4, P = 0.003) with asterisks indicating the source of the difference from a Tukey pairwise comparisons. * P < 0.05** P < 0.01; *** P < 0.001). D. Sensitivity of IHTK-peak to TEA. IHTK-peak
was normalized to the current measured in control (0 mM TEA). Average ± SEM is plotted. The overall reduction of IHTK-peak by TEA was significant (One-way RM ANOVA, N = 4, P =
0.001). E, F. Effect of dynamic clamp injection of INL (gNL = -0.08 S; ENL = -70 mV) in normal saline (E) and in the presence of 8 mM TEA (F). Top trace is membrane potential, bottom
trace is current injected by the dynamic clamp circuit.
. CC-BY-NC-ND 4.0 International licensepeer-reviewed) is the author/funder. It is made available under aThe copyright holder for this preprint (which was not. http://dx.doi.org/10.1101/136887doi: bioRxiv preprint first posted online May. 11, 2017;

19
Now we examine the role of other K+ currents known to be expressed in most neurons,
and in pyloric neurons in particular. When IA = 0, the model equations involve only the v
and w variables, allowing for phase plane analysis. The nullclines of equation (1) are
obtained by plotting the set of points that satisfy v’=0 and w’=0, respectively. The v-
nullcline is decreasing for v < ENL. If |gNL| is sufficiently large relative to gL, then the
nullcline can increase for a range of values v ≥ ENL. The w-nullcline is a monotone
increasing sigmoidal function. If it intersects the v-nullcline along its decreasing portion,
then a stable fixed point ensues and oscillations are not possible. If the intersection of
the two nullclines occurs for v ≥ ENL then oscillations may be possible and depends on
the slope of each at the point of intersection. We will show that, as gHTK is increased,
oscillatory behavior is destroyed.
. CC-BY-NC-ND 4.0 International licensepeer-reviewed) is the author/funder. It is made available under aThe copyright holder for this preprint (which was not. http://dx.doi.org/10.1101/136887doi: bioRxiv preprint first posted online May. 11, 2017;

20
Figure 8 The effect of IHTK on the existence of oscillations. A. Panel A1 shows the v-w phase plane for low values of gHTK in which an oscillatory solution exists. For larger values of gHTK the oscillatory solution fails to exist, as shown in panel A2, because the stronger IHTK stabilizes the fixed point at the intersection of the two nullclines. B.
Bifurcation diagram showing how the existence and amplitude of oscillatory solutions depends on gHTK. Arrows from panels A1 and A2 show the values of gHTK used to produce those simulations. Oscillatory solutions are lost through a Hopf Bifurcation as gHTK increases. C. Bifurcation diagrams showing behavior of solutions at gixed values of gHTK while gNL is varied. The range of gNL values for which oscillations exist decreases at gHTK increases (compare left and middle diagrams). If gHTK is too large (rightmost diagram), no amount of gNL can restore oscillations. D. Bifurcation diagram summarizing behavior in the gHTK- gNL parameter space. Oscillations are possible for
parameter values in the red region bounded between the parabola-like shape and the vertical axis and are not possible outside of that region.
. CC-BY-NC-ND 4.0 International licensepeer-reviewed) is the author/funder. It is made available under aThe copyright holder for this preprint (which was not. http://dx.doi.org/10.1101/136887doi: bioRxiv preprint first posted online May. 11, 2017;
21
Figure 8A1 shows phase plane from equation (1) when gNL = -0.0195 µS, gHTK = 0.013
µS and gA = 0 µS. For this choice of parameters, the w-nullcline intersects the v-
nullcline along a portion where the latter is increasing with a sufficiently large slope at
the point of intersection. This produces an unstable fixed point. A periodic solution
surrounds this unstable fixed point because, as v becomes too hyperpolarized, INL
current drives the voltage away from ENL. At larger values of v, IKdr activates and
restricts the voltage from increasing too much. This result is consistent with our prior
work (Bose et al. 2014) in which IHTK was not present. Thus, the addition of this small
amount of HTK conductance does not play a role in the generation of oscillations, but it
does limit the amplitude at both higher and lower values of v. Indeed, the largest
amplitude oscillation under these conditions exists when gHTK = 0 (Fig. 8B).
We then increased the value of gHTK to 0.0975 µS. Figure 8A2 shows the ensuing phase
plane. Note that the only change is that the v-nullcline now has a much steeper and
pronounced right branch along which it is decreasing. Moreover, the slope of the v-
nullcline at the intersection with the w-nullcline has decreased enough to stabilize that
fixed point. This change is indicative of a Hopf bifurcation, which in fact occurs as gHTK
is increased. Figure 8B shows that as gHTK is increased from lower values, the periodic
solution decreases in amplitude (upper and lower bounds of oscillations shown by solid
red curves). Moreover, the unstable fixed point (dashed blue curve) gains stability
through a Hopf bifurcation near gHTK =0.078 µS and oscillations cease to exist. The
reason for this loss of excitability is that IHTK is too strong and destroys the balance
between IKdr and INL-cut that could produce oscillations. In short, too much IHTK is
incompatible with the production of oscillations. This finding is consistent with our
experimental results shown in Figs. 5 and 6.
We next varied gNL to further understand the relationship between these currents.
Figure 8C shows bifurcation diagrams for three different fixed values of gHTK, indicated
by arrows from Fig. 8B, as we vary gNL. The rightmost panel shows that if gHTK is too
large, then no amount of INL-cut can produce oscillations. Indeed for all values of gNL, the
stable fixed point remains. For smaller values of gHTK (middle and left panels),
oscillations are present over an interval of gNL values. This interval is a decreasing
. CC-BY-NC-ND 4.0 International licensepeer-reviewed) is the author/funder. It is made available under aThe copyright holder for this preprint (which was not. http://dx.doi.org/10.1101/136887doi: bioRxiv preprint first posted online May. 11, 2017;

22
function of gHTK as summarized in Fig. 8D. There we show a two-parameter bifurcation
diagram where the curve is the boundary between oscillatory and non-oscillatory
behavior. For any choice of parameters that lies within the red shaded parabola-like
region, oscillations are possible. For choices outside of this region, oscillations are not
possible. The diagram clearly shows that the interval of gNL values over which
oscillations occurs shrinks as gHTK is increased.
Figure 9 The effect of IA on the existence of oscillations. A1.The projection onto the v-w phase plane for gA=0.033 µS. No qualitative difference is found from the gA = 0 µS case (shown in Fig. 8A1). The value of the third variable h (not shown) oscillates, but remains small. The v–nullcline shown is for the largest value of h along the periodic solution. The intersection of the projection of the v and w-nullclines is not a fixed point. A2. The projection onto the v-w phase plane at gA=0.195 µS for which bistability exists between the periodic solution and a stable fixed point. The lower of the two v-nullclines occurs for h = 0.45 at the value corresponding to a stable fixed point (open circle). The upper of the two v-nullclines occurs at the largest h value along the periodic solution. B. Bifurcation diagram showing how the bistability of solutions depends on gA. Arrows from panels A1 and A2 show the values of gA used to produce those simulations. The unstable fixed point (dashed blue curve) undergoes a sub-critical Hopf bifurcation as gA increases resulting in a stable fixed point and
an unstable branch of periodic solutions.
. CC-BY-NC-ND 4.0 International licensepeer-reviewed) is the author/funder. It is made available under aThe copyright holder for this preprint (which was not. http://dx.doi.org/10.1101/136887doi: bioRxiv preprint first posted online May. 11, 2017;

23
Our experimental findings, as summarized in Fig. 7, suggest that IA plays no role in
generating oscillations, but may affect the properties of the oscillatory solution.
Therefore, we investigated what role, if any, IA may play in the generation of oscillations.
With a non-zero value of IA, equation (1) becomes three-dimensional and direct phase
plane analysis is not possible. Thus, we now project the solution trajectory onto the v-w
phase plane to study how the shape of the respective nullclines varies as a function of
parameters associated with IA. For example, Figure 9A1, shows the case where gA=
0.0325 µS. Note that the projected nullclines look very much the same as those in
Figure 8A1. As we varied the value of either gA or the half-activation voltage of h∞(v) we
found little change in the shape of the projected nullclines. Thus, we concluded that the
addition of IA plays no role in whether a periodic solution exists, consistent with results
of the prior sub-section. However, an interesting effect of a large IA current was found to
occur. A very strong A-current can induce bistability between a periodic solution and a
stable fixed point. Figure 9A2 shows the case of gA = 0.195 µS. For this parameter
value, a stable periodic solution co-exists with a stable fixed point. The figure shows an
example of a trajectory that starts at the stable fixed point where h = 0.45 (lower v-
nullcline). Leaving the initial values of v and w unchanged, we switched to the initial
condition h = 0. This has the effect of assigning a new initial condition in the full three-
dimensional v-w-h phase space that is not a fixed point (though the location looks
unchanged in the projection onto the v-w phase plane). The ensuing trajectory leaves
that location and is seen to converge to the stable periodic orbit. The associated
bifurcation diagram in Figure 9B shows that the stable fixed point loses stability through
a subcritical Hopf bifurcation as gA is decreased. The red, roughly horizontal curves
depict the upper and lower limits of the periodic solution.
Note that the bifurcation diagram is also a projection onto the v-gA space. In this
projection, the value of h for the fixed point cannot be discerned. Indeed, the bifurcation
diagram at gA = 0.195 µS suggests that the stable periodic solution encloses the stable
fixed point (Fig. 9B). But from the projected phase plane in Figure 9A2, it appears as if
the stable periodic solution encloses an unstable fixed point. In reality, neither case is
true. There is a stable fixed point whose projection in the v-w phase plane occurs at the
intersection of the lower v-nullcline and the w-nullcline in Figure 9A2, and which occurs
. CC-BY-NC-ND 4.0 International licensepeer-reviewed) is the author/funder. It is made available under aThe copyright holder for this preprint (which was not. http://dx.doi.org/10.1101/136887doi: bioRxiv preprint first posted online May. 11, 2017;
24
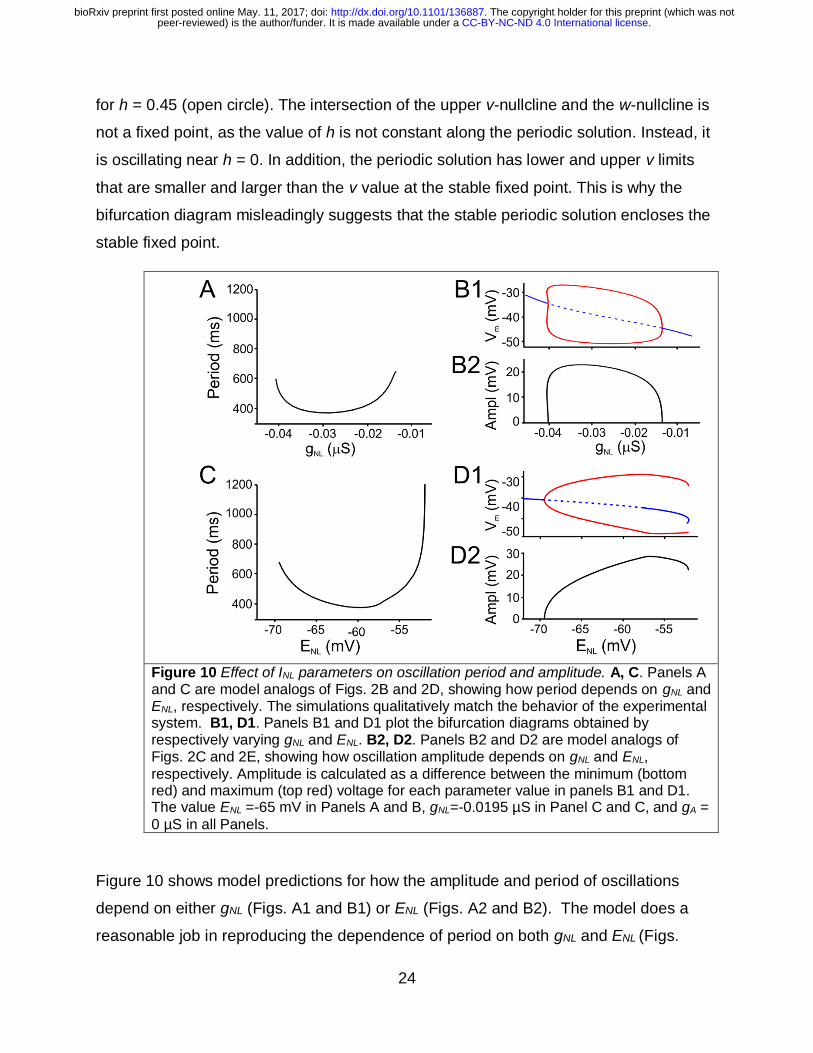
for h = 0.45 (open circle). The intersection of the upper v-nullcline and the w-nullcline is
not a fixed point, as the value of h is not constant along the periodic solution. Instead, it
is oscillating near h = 0. In addition, the periodic solution has lower and upper v limits
that are smaller and larger than the v value at the stable fixed point. This is why the
bifurcation diagram misleadingly suggests that the stable periodic solution encloses the
stable fixed point.
Figure 10 Effect of INL parameters on oscillation period and amplitude. A, C. Panels A and C are model analogs of Figs. 2B and 2D, showing how period depends on gNL and ENL, respectively. The simulations qualitatively match the behavior of the experimental system. B1, D1. Panels B1 and D1 plot the bifurcation diagrams obtained by respectively varying gNL and ENL. B2, D2. Panels B2 and D2 are model analogs of Figs. 2C and 2E, showing how oscillation amplitude depends on gNL and ENL,
respectively. Amplitude is calculated as a difference between the minimum (bottom red) and maximum (top red) voltage for each parameter value in panels B1 and D1. The value ENL =-65 mV in Panels A and B, gNL=-0.0195 µS in Panel C and C, and gA =
0 µS in all Panels.
Figure 10 shows model predictions for how the amplitude and period of oscillations
depend on either gNL (Figs. A1 and B1) or ENL (Figs. A2 and B2). The model does a
reasonable job in reproducing the dependence of period on both gNL and ENL (Figs.
. CC-BY-NC-ND 4.0 International licensepeer-reviewed) is the author/funder. It is made available under aThe copyright holder for this preprint (which was not. http://dx.doi.org/10.1101/136887doi: bioRxiv preprint first posted online May. 11, 2017;

25
10A1, 10A2), at least over a range of parameters (compare to Figs. 2B and 2D,
respectively).
The dependence of the amplitude of oscillations on gNL and ENL (Figs. 10B2 and 10D2,
respectively) is obtained by subtracting the upper value of voltage from the lower value
(upper branch of red curve minus lower branch of red curve) in Figs. 10B1 and 10D1.
The model does a poor job of describing the larger amplitude oscillations that arise in
experiments for small absolute values of gNL (compare Fig. 10B2 with Fig. 2C).
Mathematically this is because oscillations in the model arise due a supercritical Hopf
bifurcation, whereas those that arise in the experiments may correspond to a subcritical
Hopf bifurcation. The dependence of amplitude on ENL (compare Fig. 10D2 with Fig. 2E)
is reasonably well described qualitatively by the model. Oscillations begin at small
amplitude at low values of ENL due to a super-critical Hopf bifurcation. There is a local
maximum in the amplitude at higher values of ENL, followed by a decrease in the
amplitude just before oscillations cease to exist.
In sum, the simulations provide a theoretical framework to support the notion that the
balance between high threshold outward currents and INL is critical to create pre-
conditions for the existence of oscillations. Once this is in place, the simulations confirm
that too much IHTK (or too little total outward current) destroys this balance and thus can
be used to determine which pyloric neurons can actually produce oscillations based on
the INL protocol. The model also confirms that IA does not appear to play a significant
role in the generation or even modulation of oscillatory activity at least at relatively low
amplitudes of the current.
Discussion
We have shown previously (Zhao et al. 2010) that the nearly linear and negatively-
sloped portion of the inward modulator-activated current (IMI) is the key element to
produce oscillations in pacemaker cells of the pyloric central pattern generator. In (Bose
et al. 2014), we addressed the question of what currents are minimally necessary to
produce oscillatory activity in a single-cell model of a neural pattern generator. We did
. CC-BY-NC-ND 4.0 International licensepeer-reviewed) is the author/funder. It is made available under aThe copyright holder for this preprint (which was not. http://dx.doi.org/10.1101/136887doi: bioRxiv preprint first posted online May. 11, 2017;

26
so by examining a simplified model of an oscillator consisting of a high threshold K+
current and a linear inward current that describes the behavior of this negative
conductance component of IMI, and which we call the negative-conductance leak current
(INL). That work suggested, but left open, the question of how a balance between inward
and distinct outward currents arises in pyloric neurons, and whether there are
systematic differences in this balance between pacemaker and follower cells. Here,
using both experiments and simulations, we provide evidence that pyloric neurons
contain different levels of specific outward currents and that this may be the key
distinction between what makes a neuron a pacemaker or a follower.
Experimentally, we find that one cell type, the PD neurons, which are considered part of
the pacemaker groups of neurons in the network (Marder and Eisen 1984), are the only
ones that can generate oscillations when driven by INL: PD neurons can sustain
oscillations over a large but finite range of conductances and equilibrium potentials of
INL. In contrast to the PD neurons, we find that no value of INL conductance (or
combination of gNL and ENL) can induce oscillations in any of the follower neurons.
These findings are consistent with the effect the endogenous neuromodulatory peptide
proctolin on the pyloric network neurons (Hooper and Marder 1987; Zhao et al. 2010).
Proctolin is one of the neuromodulators that activates IMI, the current for which INL is a
simplified (linear) version. Although proctolin produces oscillations in the pyloric
pacemaker neurons, it does not produce oscillations in any of the synaptically isolated
pyloric follower neurons (Hooper and Marder 1987; Zhao et al. 2010).
Because pyloric neurons have the same set of ionic currents (Schulz et al. 2006; Schulz
et al. 2007; Temporal et al. 2012; Temporal et al. 2014), we explored the mechanisms
that preclude endogenous oscillations in the follower neurons. We found that, in
follower LP and VD neurons, high-threshold outward currents (IHTK) are much too large,
compared to the same currents in the PD neuron, to permit INL-induced oscillations.
However, oscillations in both of these follower neuron types could be produced if IHTK
are reduced pharmacologically. These results suggests that, in order to be able to
produce endogenous oscillations, a relative balance between the pacemaker current
(for which INL is a surrogate) and the counteracting outward currents needs to be
. CC-BY-NC-ND 4.0 International licensepeer-reviewed) is the author/funder. It is made available under aThe copyright holder for this preprint (which was not. http://dx.doi.org/10.1101/136887doi: bioRxiv preprint first posted online May. 11, 2017;

27
maintained. Interestingly, we also observe that increasing the INL conductance alone
cannot, at least in these cells, balance the high levels of outward currents. To address
why the large outward currents cannot simply be balanced by increasing the inward
currents, we used a simplified mathematical model. This model confirmed that there is a
finite region in the gNL-gHTK space within which oscillations are possible (Fig. 8D). The
bounds on this region result from either insufficient inward current when gHTK is low
(lower edge of oscillation region in Fig. 8D), or excessive leakiness of the cell when gHTK
is too high, which no level of gNL can overcome to produce oscillations.
Several theoretical studies have suggested that a balance between inward and outward
current is required for oscillatory activity to be generated (Doloc-Mihu and Calabrese
2014; Goldman et al. 2001; Hudson and Prinz 2010; Lamb and Calabrese 2013; Zhao
and Golowasch 2012). In leech, it was shown that a close linear correlation between
three currents, a leak current, a persistent K+ current, and a persistent Na+ current was
required to ensure bursting oscillatory activity (Doloc-Mihu and Calabrese 2014; Lamb
and Calabrese 2013). Although, in our case, the relationship between gK and gNL is not
linear as in the leech studies, but rather bell-shaped and broad (Fig. 8D), those studies
are consistent with ours in that relatively strict relationships must be maintained to
ensure the generation of a number of features of activity, including oscillatory and
bursting activity. Another example that supports the relationship between oscillatory
activity and an inward/outward current balance is that of bursting pacemaker neurons in
the rodent pre-Bötzinger respiratory center, in which a higher ratio of persistent Na+
current to leak current (INaP/Ileak) is characteristic of pacemaker neurons, while a lower
ratio is typical of follower neurons (Del Negro et al. 2002).
Studies with cultured STG neurons (Haedo and Golowasch 2006; Turrigiano et al.
1995) have shown that neurons may be programmed to maintain and even restore such
relationships after the loss of oscillatory activity. In these studies, recovery of rhythmic
activity in cultured crab STG neurons after dissociation required the reduction of IHTK,
and the increase in inward currents whose voltage dependence resembles that of IMI
and INL. These cells are capable of doing this over the course of hours to days in
culture. Thus, we conclude that pacemaker activity in individual neurons involves a
. CC-BY-NC-ND 4.0 International licensepeer-reviewed) is the author/funder. It is made available under aThe copyright holder for this preprint (which was not. http://dx.doi.org/10.1101/136887doi: bioRxiv preprint first posted online May. 11, 2017;

28
careful balance, not simply a linear correlation, of an inward pacemaker current with
some type of current, such as IHTK, which promotes the recovery from depolarization.
In the STG, IHTK is composed of two high-threshold currents, the delayed rectifier IKdr
and the calcium-dependent IKCa. The former is known to be involved in action potential
generation, while IKCa may more directly be involved in oscillatory activity (Haedo and
Golowasch 2006; Soto-Trevino et al. 2005). Nevertheless, here (and earlier (Bose et al.
2014)) we showed that IKdr is also capable of generating oscillatory activity in
conjunction with IMI or INL. In other systems too, high-threshold K+ currents have been
shown to be essential elements of oscillatory mechanisms (e.g. Aplysia egg laying
(Hermann and Erxleben 1987)) but the specific relationship with the inward currents
engaged in oscillatory activity in that system have not been examined.
Interestingly, the transient A-current does not typically seem to be involved in
pacemaker activity generation, as we confirmed in this study, even though its activation
properties can be quite similar to those of high threshold K+ currents. In our study, IA
has the same voltage-dependence of activation as IKdr, but only IKdr can participate in
the generation of oscillatory activity (see also (Bose et al. 2014)). Thus, the differences
in the kinetics and voltage dependencies of the inactivation variable are probably
sufficient to determine or exclude its participation in pacemaker activity. Additionally, the
transient IA was not involved in the recovery of rhythmic activity in crab cultured cells
(Haedo and Golowasch 2006), consistent with the result reported here.
Our modeling results also provide the basis to interpret and understand some of our
experimental results regarding the dependence of period and amplitude on parameters
associated with INL. They show that in most cases the results are qualitatively consistent
over a subset of parameter values of the model. A comparison between Fig. 2B-E
(experimental results) and Fig. 10 (model results) relative to how period and amplitude
vary with gNL and ENL, for example, reveals a consistent relative independence of cycle
period on gNL (Fig. 2B). In the model, changes in gNL simply shifted the v-nullcline up or
down in the phase space, but left the overall balance of currents largely intact over a
large range of values. As a result, neither period nor amplitude varies much (Figs. 10A
and B). Variations due to changes in ENL were also consistent across both experiment
. CC-BY-NC-ND 4.0 International licensepeer-reviewed) is the author/funder. It is made available under aThe copyright holder for this preprint (which was not. http://dx.doi.org/10.1101/136887doi: bioRxiv preprint first posted online May. 11, 2017;
29
and model. When ENL becomes too small, the inward effect of INL is mitigated by the
outward effect of IKdr (their reversal potentials are too close). Alternatively when ENL is
too large, the model cell is attracted to a higher level stable fixed point because the
inward effect is too strong to be overcome (the driving force from INL is too large). The
model also makes predictions about how oscillations are lost through specific kinds of
bifurcations as gNL or ENL are varied. It would be of interest to test if these predictions
are borne out experimentally, which would provide further insight into the mechanisms
of rhythm generation in pacemaker neurons similar to pyloric pacemaker neurons.
In conclusion, we observe that a coordinated balance of high-threshold outward
currents and inward pacemaker currents is required for the generation of oscillatory
activity. This is consistent with previous experimental and theoretical observations, but
here we show both approaches confirming this in the same biological system and using
a minimal model that captures the essential features of these relationships.
. CC-BY-NC-ND 4.0 International licensepeer-reviewed) is the author/funder. It is made available under aThe copyright holder for this preprint (which was not. http://dx.doi.org/10.1101/136887doi: bioRxiv preprint first posted online May. 11, 2017;

30
References
Amarillo Y, Zagha E, Mato G, Rudy B, and Nadal MS. The interplay of seven subthreshold conductances controls the resting membrane potential and the oscillatory behavior of thalamocortical neurons. Journal of Neurophysiology 112: 393-410, 2014. Amendola J, Woodhouse A, Martin-Eauclaire MF, and Goaillard JM.
Ca(2)(+)/cAMP-sensitive covariation of I(A) and I(H) voltage dependences tunes rebound firing in dopaminergic neurons. J Neurosci 32: 2166-2181, 2012. Anderson WD, Makadia HK, and Vadigepalli R. Molecular variability elicits a tunable switch with discrete neuromodulatory response phenotypes. J Comput Neurosci 40: 65-82, 2016. Anirudhan A, and Narayanan R. Analogous synaptic plasticity profiles emerge from
disparate channel combinations. J Neurosci 35: 4691-4705, 2015. Bayliss DA, Viana F, and Berger AJ. Mechanisms underlying excitatory effects of
thyrotropin-releasing hormone on rat hypoglossal motoneurons in vitro. J Neurophysiol 68: 1733-1745, 1992. Bergquist S, Dickman DK, and Davis GW. A hierarchy of cell intrinsic and target-derived homeostatic signaling. Neuron 66: 220-234, 2010. Blethyn KL, Hughes SW, Toth TI, Cope DW, and Crunelli V. Neuronal basis of the slow (<1 Hz) oscillation in neurons of the nucleus reticularis thalami in vitro. J Neurosci 26: 2474-2486, 2006. Bose A, Golowasch J, Guan Y, and Nadim F. The role of linear and voltage-
dependent ionic currents in the generation of slow wave oscillations. J Comput Neurosci 37: 229-242, 2014. Brickley SG, Aller MI, Sandu C, Veale EL, Alder FG, Sambi H, Mathie A, and Wisden W. TASK-3 two-pore domain potassium channels enable sustained high-
frequency firing in cerebellar granule neurons. J Neurosci 27: 9329-9340, 2007. Cymbalyuk GS, Gaudry Q, Masino MA, and Calabrese RL. Bursting in leech heart
interneurons: cell-autonomous and network-based mechanisms. J Neurosci 22: 10580-10592, 2002. Del Negro CA, Koshiya N, Butera RJ, Jr., and Smith JC. Persistent sodium current, membrane properties and bursting behavior of pre-botzinger complex inspiratory neurons in vitro. Journal of neurophysiology 88: 2242-2250, 2002. Doloc-Mihu A, and Calabrese RL. Identifying crucial parameter correlations
maintaining bursting activity. PLoS Comput Biol 10: e1003678, 2014. Dunmyre JR, Del Negro CA, and Rubin JE. Interactions of persistent sodium and
calcium-activated nonspecific cationic currents yield dynamically distinct bursting regimes in a model of respiratory neurons. Journal of computational neuroscience 31: 305-328, 2011. Egorov AV, Hamam BN, Fransen E, Hasselmo ME, and Alonso AA. Graded
persistent activity in entorhinal cortex neurons. Nature 420: 173-178, 2002. Ermentrout B. Simulating, analyzing, and animating dynamical systems : a guide to
XPPAUT for researchers and students. Philadelphia: Society for Industrial and Applied Mathematics, 2002, p. xiv, 290 p. Goaillard J-M, Taylor AL, Schulz DJ, and Marder E. Functional consequences of animal-to-animal variation in circuit parameters. Nat Neurosci 12: 1424-1430, 2009.
. CC-BY-NC-ND 4.0 International licensepeer-reviewed) is the author/funder. It is made available under aThe copyright holder for this preprint (which was not. http://dx.doi.org/10.1101/136887doi: bioRxiv preprint first posted online May. 11, 2017;

31
Goldman MS, Golowasch J, Marder E, and Abbott LF. Global structure, robustness, and modulation of neuronal models. The Journal of neuroscience : the official journal of the Society for Neuroscience 21: 5229-5238, 2001. Golowasch J. Stability and Homeostasis in Small Network Central Pattern Generators.
In: Encyclopedia of Computational Neuroscience, edited by Jaeger D, and Jung R. New York: Springer Verlag, 2015, p. 2858-2864. Golowasch J, and Marder E. Ionic currents of the lateral pyloric neuron of the stomatogastric ganglion of the crab. J Neurophysiol 67: 318-331, 1992a. Golowasch J, and Marder E. Proctolin activates an inward current whose voltage dependence is modified by extracellular Ca2+. J Neurosci 12: 810-817, 1992b. Gray M, and Golowasch J. Voltage Dependence of a Neuromodulator-Activated Ionic Current. eNeuro 3: 2016. Haedo RJ, and Golowasch J. Ionic mechanism underlying recovery of rhythmic activity in adult isolated neurons. Journal of neurophysiology 96: 1860-1876, 2006. Hermann A, and Erxleben C. Charybdotoxin selectively blocks small Ca-activated K channels in Aplysia neurons. J Gen Physiol 90: 27-47, 1987. Hooper SL, and Marder E. Modulation of the lobster pyloric rhythm by the peptide proctolin. J Neurosci 7: 2097-2112, 1987. Hudson AE, and Prinz AA. Conductance ratios and cellular identity. PLoS Comput Biol 6: e1000838, 2010. Jahnsen H, and Llinas R. Ionic basis for the electro-responsiveness and oscillatory properties of guinea-pig thalamic neurones in vitro. The Journal of physiology 349: 227-247, 1984. Khorkova O, and Golowasch J. Neuromodulators, not activity, control coordinated
expression of ionic currents. J Neurosci 27: 8709-8718, 2007. Koizumi H, and Smith JC. Persistent Na+ and K+-dominated leak currents contribute
to respiratory rhythm generation in the pre-Botzinger complex in vitro. J Neurosci 28: 1773-1785, 2008. Lamb DG, and Calabrese RL. Correlated conductance parameters in leech heart motor neurons contribute to motor pattern formation. PLoS One 8: e79267, 2013. Linsdell P, and Moody WJ. Na+ channel mis-expression accelerates K+ channel development in embryonic Xenopus laevis skeletal muscle. J Physiol 480 ( Pt 3): 405-410, 1994. Lu TZ, and Feng ZP. NALCN: a regulator of pacemaker activity. Molecular
neurobiology 45: 415-423, 2012. Lutas A, Lahmann C, Soumillon M, and Yellen G. The leak channel NALCN controls
tonic firing and glycolytic sensitivity of substantia nigra pars reticulata neurons. Elife 5: 2016. MacLean JN, Zhang Y, Johnson BR, and Harris-Warrick RM. Activity-independent homeostasis in rhythmically active neurons. Neuron 37: 109-120, 2003. Marder E, and Eisen JS. Electrically coupled pacemaker neurons respond differently to same physiological inputs and neurotransmitters. J Neurophysiol 51: 1362-1374, 1984. McCormick DA, and Huguenard JR. A model of the electrophysiological properties of thalamocortical relay neurons. Journal of Neurophysiology 68: 1384-1400, 1992. Pang DS, Robledo CJ, Carr DR, Gent TC, Vyssotski AL, Caley A, Zecharia AY, Wisden W, Brickley SG, and Franks NP. An unexpected role for TASK-3 potassium
. CC-BY-NC-ND 4.0 International licensepeer-reviewed) is the author/funder. It is made available under aThe copyright holder for this preprint (which was not. http://dx.doi.org/10.1101/136887doi: bioRxiv preprint first posted online May. 11, 2017;

32
channels in network oscillations with implications for sleep mechanisms and anesthetic action. Proc Natl Acad Sci U S A 106: 17546-17551, 2009. Rekling JC, Funk GD, Bayliss DA, Dong XW, and Feldman JL. Synaptic control of motoneuronal excitability. Physiol Rev 80: 767-852, 2000. Roffman RC, Norris BJ, and Calabrese RL. Animal-to-animal variability of connection strength in the leech heartbeat central pattern generator. J Neurophysiol 107: 1681-1693, 2012. Schulz DJ, Goaillard JM, and Marder E. Variable channel expression in identified
single and electrically coupled neurons in different animals. Nat Neurosci 9: 356-362, 2006. Schulz DJ, Goaillard JM, and Marder EE. Quantitative expression profiling of identified neurons reveals cell-specific constraints on highly variable levels of gene expression. Proc Natl Acad Sci U S A 104: 13187-13191, 2007. Selverston AI, Russell DF, and Miller JP. The stomatogastric nervous system:
structure and function of a small neural network. Prog Neurobiol 7: 215-290, 1976. Soto-Trevino C, Rabbah P, Marder E, and Nadim F. Computational model of
electrically coupled, intrinsically distinct pacemaker neurons. J Neurophysiol 94: 590-604, 2005. Srikanth S, and Narayanan R. Variability in State-Dependent Plasticity of Intrinsic Properties during Cell-Autonomous Self-Regulation of Calcium Homeostasis in Hippocampal Model Neurons(1,2,3). eNeuro 2: 2015. Swensen AM, and Marder E. Multiple peptides converge to activate the same voltage-
dependent current in a central pattern-generating circuit. J Neurosci 20: 6752-6759, 2000. Talley EM, Lei Q, Sirois JE, and Bayliss DA. TASK-1, a two-pore domain K+ channel, is modulated by multiple neurotransmitters in motoneurons. Neuron 25: 399-410, 2000. Temporal S, Desai M, Khorkova O, Varghese G, Dai A, Schulz DJ, and Golowasch J. Neuromodulation independently determines correlated channel expression and
conductance levels in motor neurons of the stomatogastric ganglion. Journal of Neurophysiology 107: 718-727, 2012. Temporal S, Lett KM, and Schulz DJ. Activity-dependent feedback regulates correlated ion channel mRNA levels in single identified motor neurons. Curr Biol 24: 1899-1904, 2014. Turrigiano G, LeMasson G, and Marder E. Selective regulation of current densities
underlies spontaneous changes in the activity of cultured neurons. J Neurosci 15: 3640-3652, 1995. van den Top M, Lee K, Whyment AD, Blanks AM, and Spanswick D. Orexigen-sensitive NPY/AgRP pacemaker neurons in the hypothalamic arcuate nucleus. Nat Neurosci 7: 493-494, 2004. Vandermaelen CP, and Aghajanian GK. Electrophysiological and pharmacological
characterization of serotonergic dorsal raphe neurons recorded extracellularly and intracellularly in rat brain slices. Brain Res 289: 109-119, 1983. Xu XF, Tsai HJ, Li L, Chen YF, Zhang C, and Wang GF. Modulation of leak K(+) channel in hypoglossal motoneurons of rats by serotonin and/or variation of pH value. Sheng Li Xue Bao 61: 305-316, 2009.
. CC-BY-NC-ND 4.0 International licensepeer-reviewed) is the author/funder. It is made available under aThe copyright holder for this preprint (which was not. http://dx.doi.org/10.1101/136887doi: bioRxiv preprint first posted online May. 11, 2017;

33
Yamada-Hanff J, and Bean BP. Persistent sodium current drives conditional pacemaking in CA1 pyramidal neurons under muscarinic stimulation. J Neurosci 33: 15011-15021, 2013. Zhao S, and Golowasch J. Ionic current correlations underlie the global tuning of large
numbers of neuronal activity attributes. J Neurosci 32: 13380-13388, 2012. Zhao S, Golowasch J, and Nadim F. Pacemaker neuron and network oscillations
depend on a neuromodulator-regulated linear current. Frontiers in behavioral neuroscience 4: 21, 2010.
. CC-BY-NC-ND 4.0 International licensepeer-reviewed) is the author/funder. It is made available under aThe copyright holder for this preprint (which was not. http://dx.doi.org/10.1101/136887doi: bioRxiv preprint first posted online May. 11, 2017;