Embed Size (px)
Citation preview

Supporting Online Materials
UV-Induced Self-Repairing Polydimethylsiloxane-Polyurethane (PDMS-PUR) Cu-
Catalyzed Networks
Zhanhua Wang, Ying Yang, Ruslan Burtovyy, Igor Luzinov and Marek W. Urban*
Department of Materials Science and Engineering, 299A Sirrine Hall
Clemson University
Clemson, SC 29634-0971
* - corresponding author (e-mail: [email protected])
Electronic Supplementary Material (ESI) for Journal of Materials Chemistry A.This journal is © The Royal Society of Chemistry 2014

Figure S1. NMR spectra of PDMS
In order to determine the number of repeated units in PDMS, 1H NMR spectra shown in
Figure S1 were recoreded. The area ratios for aH and bH resonances was determined to be
4 : 61.72. The average molecular weight of PDMS was determined by ratioing
a:b=4:61.72 and number of repeating units n=61.72÷6=10.3, giving Mn = 877.2.

Figure S2. NMR spectra of HDI
In order to determine the composition of the isocyanate, 1H NMR spectrum was recorded
shown in Figure S2. The area ratio of aH : bH : cH : dH = 2 : 2.75 : 2.75 : 1, indicating a
2:3 ratio of mono-HDI and tri-HDI in the composition with no presence of di-HDI .

Figure S3 ATR-IR spectra of: a - CuCl2, b - PDMS, c – HDI, and d - PDMS-PUR-CuCl2
networks.
Figure S3 illustrates ATR-IR spectra of CuCl2 (a), PDMS (b), HDI (c) and PDMS-PUR-
CuCl2 networks (d). The bands at 1022 and 1080 cm-1 due to asymmetric Si-O stretching
and 1250 cm-1 attributed to C-H symmetric deformations of Si-CH3 group appear in trace
b and c, demonstrating that PDMS is copolymerized into PDMS-PUR-CuCl2 networks.
The asymmetric stretching vibration at 2268 cm-1 and symmetric stretching vibration at
1355 cm-1 due to –N=C=O functionalities disappear in trace d, signifying all NCO groups
have been reacted. These observations confirms that PUR-PDMS-CuCl2 networks were
successfully synthesized.

Figure S4 Raman spectra of: a - CuCl2, b- CuCl2 film deposited form DMF, c - PDMS-
PUR-CuCl2, and d - PEG-PUR-CuCl2 networks.
Figure S4 illustrates Raman spectra of CuCl2 (a), CuCl2 layers deposited form DMF (b),
PDMS-PUR-CuCl2 (c) and PEG-PUR-CuCl2 networks (d). The band at 285 cm-1
attributed to longitudinal vibrations of Cu-Cl bonds shifts to lower energy, thus
suggesting the CuCl2 oligomers formation. The band at 193 cm-1 due to the transverse
vibrations of Cu-Cl bonds is detected in the PDMS-PUR-CuCl2 network (c), while the
band at 285 cm-1 diminishes to minimum, manifesting the formation of Cu-O
coordination bond. Figure S5 A illustrates the formation of CuCl2 oligomers, and Figure
S5 B shows transverse and longitudinal vibrational modes of Cu-Cl bonds detected in
Raman measurements.

Figure S5 A - Schemetic representation of two structure of copper chloride. B -
Transverse and longitudinal vibrational modes of Cu-Cl bonds.

Figure S6 ATR-IR spectra of: a - PEG-PUR-DBTDL, b - PDMS-PUR-DBTDL, c - PEG-
PUR-CuCl2, and d - PDMS-PUR-CuCl2 networks.
Figure S6 illustrate ATR-IR spectra of PEG-PUR-DBTDL (a), PDMS-PUR-DBTDL (b),
PEG-PUR-CuCl2 (c) and PDMS-PUR-CuCl2 (d) networks. The bands at 1097 and 1093
cm-1 due to asymmetric vibrations of C-O-C entities in PEG are detected in Traces a and
c, demonstrating PEG macromonomer incorpration into PEG-PUR network . The bands
at 1080 cm-1 and 1022 cm-1 due to asymmetric vibrations of Si-O-Si in PDMS observed
in Traces b and d demonstrate that PDMS was incorprated into PDMS-PUR network.
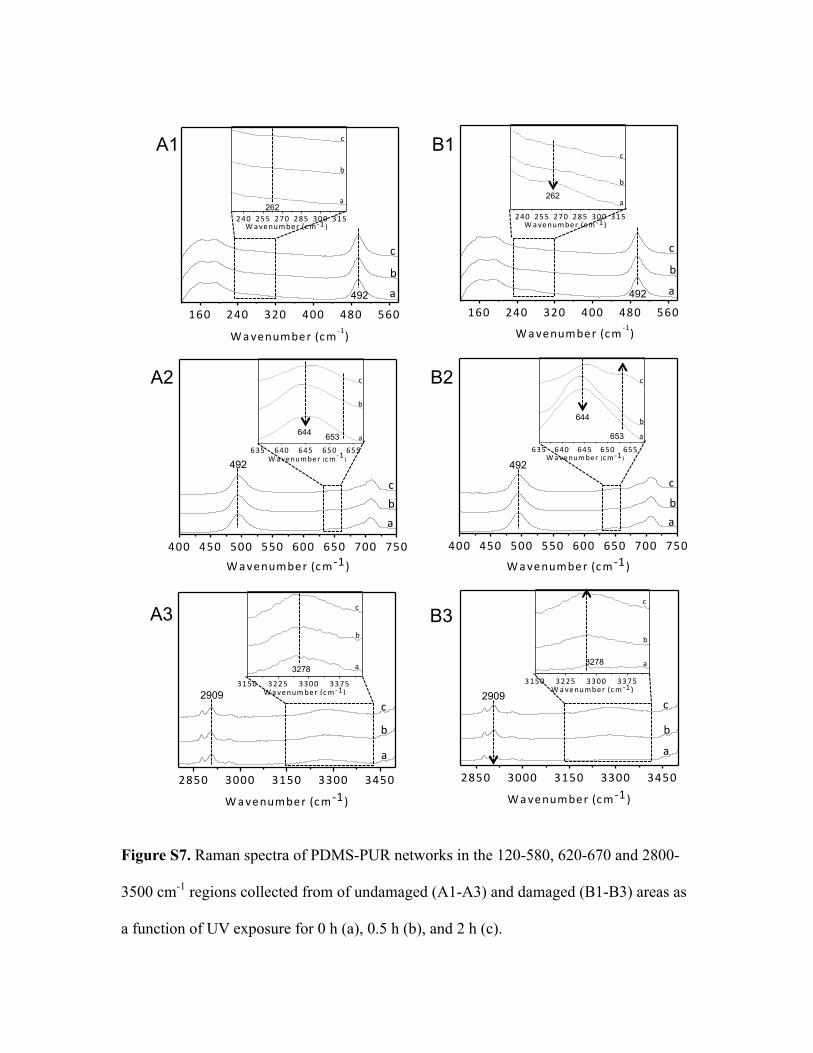
Figure S7. Raman spectra of PDMS-PUR networks in the 120-580, 620-670 and 2800-
3500 cm-1 regions collected from of undamaged (A1-A3) and damaged (B1-B3) areas as
a function of UV exposure for 0 h (a), 0.5 h (b), and 2 h (c).
400 450 500 550 600 650 700 750
c
b
Wavenumber0(cm21)
a
160 240 320 400 480 560
c
a
+
Wavenumber+(cm51)
b
240 255 270 285 300 315
c
b
Wavenumber3(cm51)
a
160 240 320 400 480 560
c
b
Wavenumber3(cm51)
a
240 255 270 285 300 315
c
b
Wavenumber3(cm51)
a
2850 3000 3150 3300 3450
c
b
Wavenumber2(cm41)
a
3150 3225 3300 3375
c
b
Wavenumber1(cm31)
a
2850 3000 3150 3300 3450
c
b
Wavenumber2(cm41)
a
3150 3225 3300 3375
c
b
Wavenumber1(cm31)
a
400 450 500 550 600 650 700 750
cb
Wavenumber0(cm21)
a
262 262
A1 B1
A2 B2
2909 2909
3278 3278
A3 B3
635 640 645 650 655
c
b
Wavenumber0(cm21)
a635 640 645 650 655
&
c
b
Wavenumber&(cm21)
a
492 492
492 492
644
644 653 653
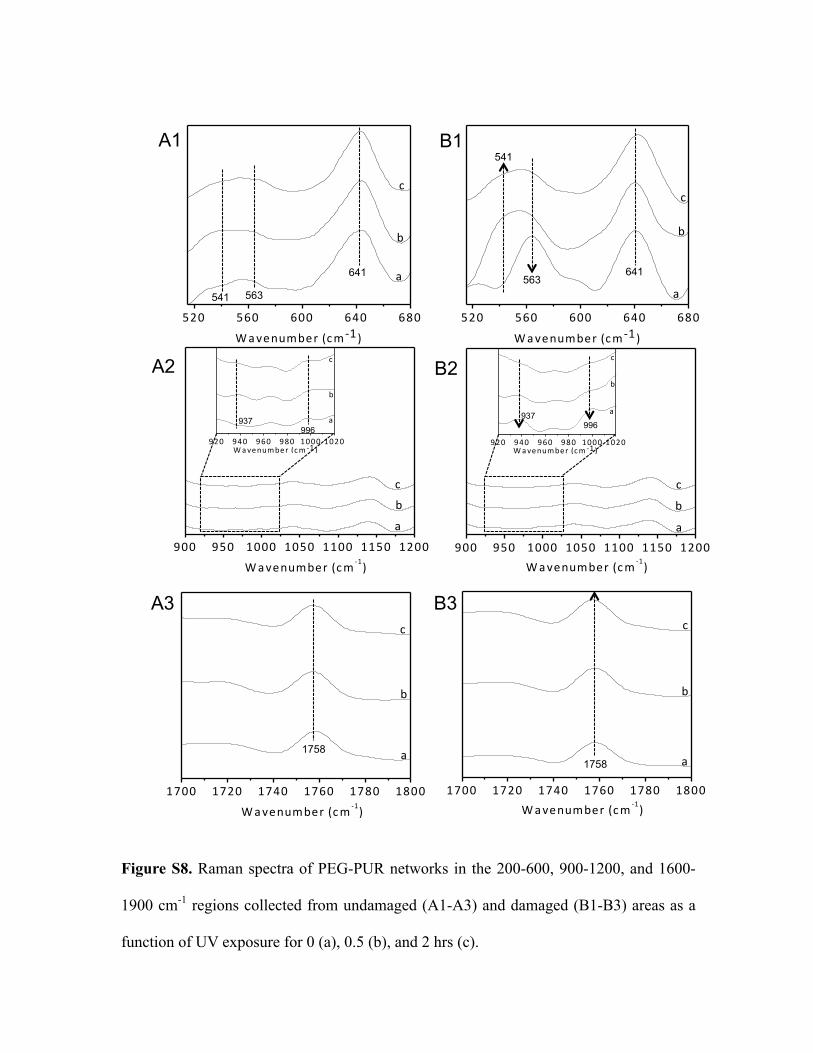
Figure S8. Raman spectra of PEG-PUR networks in the 200-600, 900-1200, and 1600-
1900 cm-1 regions collected from undamaged (A1-A3) and damaged (B1-B3) areas as a
function of UV exposure for 0 (a), 0.5 (b), and 2 hrs (c).
900 950 1000 1050 1100 1150 1200
c
b
Wavenumber0(cm21)
a900 950 1000 1050 1100 1150 1200
c
b
Wavenumber0(cm21)
a
920 940 960 980 1000 1020
c
b
Wavenumber2(cm41)
a
920 940 960 980 1000 1020Wavenumber1(cm41)
a
b
c
1700 1720 1740 1760 1780 1800
(
c
b
Wavenumber((cm41)
a
1700 1720 1740 1760 1780 1800
c
b
Wavenumber2(cm41)
a
520 560 600 640 680
c
b
Wavenumber1(cm31)
a
520 560 600 640 680
c
b
)
Wavenumber)(cm31)
a
996 996 937 937
1758 1758
641
541
541 563
563
A1 B1
A2 B2
A3 B3
641