Embed Size (px)
Citation preview

The Value of Enterprise Risk Management: Evidence from the U.S. Insurance Industry
Robert E. Hoyt**
Dudley L. Moore, Jr. Chair of Insurance Brooks Hall 206
Terry College of Business University of Georgia
Athens, GA 30602-6255 (706) 542-4290 (706) 542-4295
Andre P. Liebenberg University of Mississippi
School of Business Administration Oxford, MS 38677
**Corresponding author
This draft, January 31, 2008.
The Value of Enterprise Risk Management: Evidence from the U.S. Insurance Industry
Abstract Enterprise risk management (ERM) has been the topic of increased media attention in recent years. Many organizations have implemented ERM programs, consulting firms have established specialized ERM units, and universities have developed ERM-related courses and research centers. Despite the heightened interest in ERM by academics and practitioners, there is an absence of empirical evidence regarding the impact of such programs on firm value. The objective of this study is to measure the extent to which specific firms have implemented ERM programs and, then, to assess the value implications of these programs. We focus our attention in this study on U.S. insurers in order to control for differences that might arise from regulatory and market differences across industries. We use a maximum-likelihood treatment effects framework to simultaneously model the determinants of ERM and the effect of ERM on firm value. In our ERM-choice regression we find ERM usage to be positively related to firm size and institutional ownership, and negatively related to reinsurance use and leverage. By focusing on publicly-traded insurers we are able to estimate the effect of ERM on Tobin’s Q, a standard proxy for firm value. We find a positive relation between firm value and the use of ERM. The ERM premium is statistically and economically significant and approximately 17% of firm value.
JEL Classifications: G22; G32. Key words: Enterprise risk management; firm value; selection bias; insurance companies.
The Value of Enterprise Risk Management: Evidence from the U.S. Insurance Industry
Introduction
Interest in enterprise risk management (ERM) has continued to grow in recent
years.1 Increasing numbers of organizations have implemented or are considering ERM
programs, consulting firms have established specialized ERM units, rating agencies have
begun to consider ERM in the ratings process2 and universities have developed ERM-
related courses and research centers. Unlike traditional risk management where individual
risk categories are separately managed in risk ‘silos’, ERM enables firms to manage a wide
array of risks in an integrated, enterprise-wide fashion. Academics and industry
commentators argue that ERM benefits firms by decreasing earnings and stock-price
volatility, reducing external capital costs, increasing capital efficiency, and creating
synergies between different risk management activities (Miccolis and Shah, 2000;
Cumming and Hirtle, 2001; Lam, 2001; Meulbroek, 2002; Beasley, Pagach, and Warr,
2006). More broadly, ERM is said to promote increased risk awareness which facilitates
better operational and strategic decision-making. Despite the substantial interest in ERM
by academics and practitioners and the abundance of survey evidence on the prevalence
and characteristics of ERM programs (see for example Miccolis and Shah, 2000; Hoyt,
Merkley, and Thiessen, 2001; CFO Research Services, 2002; Kleffner, Lee, and
McGannon, 2003; Liebenberg and Hoyt, 2003, Beasley, Clune, and Hermanson, 2005),
there is an absence of empirical evidence regarding the impact of such programs on firm
value.3 The absence of clear empirical evidence on the value of ERM programs continues
to limit the growth of these programs. According to one industry consultant, Sim Segal of
1 ERM is synonymous with integrated risk management (IRM), holistic risk management, enterprise-wide risk management, and strategic risk management. For consistency we use the acronym ERM throughout this study. 2 In December 2006 S&P reported in announcing its decision to upgrade the rating of Munich Reinsurance from A- to AA- that in part the upgrade “reflected a robust enterprise risk management framework.” 3 An exception is the recent event-study of Chief Risk Officer appointment announcements by Beasley, Pagach, and Warr (2006).
1
Deloitte Consulting, corporate executives are “justifiably uncomfortable making a deeper
commitment to ERM without a clear and quantifiable business case.”
The objective of this study is to measure the extent to which specific firms have
implemented ERM programs and, then, to assess the value implications of these programs.
While ERM activities by firms in general would be of interest, we focus our attention in
this study on U.S. insurers in order to control for differences that might arise from
regulatory and market differences across industries. We also focus on publicly-traded
insurers so that we have access to market-based measures of value and because we are
more likely to observe public disclosures of ERM activity among publicly-traded firms.
Our primary sources of information on the extent of ERM implementation by each insurer
come from a search of Lexis-Nexis for the existence of a CRO/Risk Management
Committee and a review of SEC filings for evidence of an ERM framework. We augment
this with a general search of other public announcements of ERM activity for each of the
insurers in our sample.
The study is structured as follows. First, we provide a brief summary of the
literature regarding the determinants of two traditional risk management activities –
insurance and hedging. We then discuss the forces that have driven the popularity of ERM
and the perceived benefits of using an ERM approach, and why in theory ERM may add
value. Third, we develop a set of indicators of ERM activity that we use to assess the
degree to which individual insurers have implemented ERM programs. Fourth, we describe
our sample, data, empirical methodology, and results. Finally, we conclude by
summarizing our results and discussing avenues for further research.
Determinants of Traditional Risk Management Activities
While little academic literature exists on the motivations for ERM, the
determinants of traditional risk management activities such as hedging and corporate
insurance purchases are well documented. Corporate insurance demand by firms with well-
diversified shareholders is not driven by risk aversion. Since sophisticated shareholders are
able to costlessly diversify firm-specific risk, insurance purchases at actuarially unfair rates
reduce stockholder wealth. However, when viewed as part of the firm’s financing policy
corporate insurance may increase firm value through its effect on investment policy,
contracting costs, and the firm’s tax liabilities (Mayers and Smith, 1982). Thus, the theory
2
suggests that firms should purchase insurance because it potentially reduces: (i) the costs
associated with conflicts of interest between owners and managers4 and between
shareholders and bondholders;5 (ii) expected bankruptcy costs; (iii) the firm’s tax burden;
and (iv) the costs of regulatory scrutiny.6 A number of studies have found general support
for these theoretical predictions (see Mayers and Smith, 1990; Ashby and Diacon, 1998;
Hoyt and Khang, 2000).
As with corporate insurance purchases, corporate hedging reduces expected
bankruptcy costs by reducing the probability of financial distress (Smith and Stulz, 1985).
Furthermore, the hedging literature suggests that, much like corporate insurance, this form
of risk management potentially mitigates incentive conflicts, reduces expected taxes, and
improves the firm’s ability to take advantage of attractive investment opportunities (see
Smith and Stulz, 1985; MacMinn, 1985; Campbell and Kracaw, 1987; Bessembinder,
1991; Froot, Scharfstein, and Stein, 1993; Nance, Smith, and Smithson, 1993). Empirical
evidence generally supports these theoretical predictions (see Nance, Smith, and Smithson,
1993; Colquitt and Hoyt, 1997).
Why ERM Adds Value to the Firm
Profit-maximizing firms should consider implementing an ERM program only if it
increases expected shareholder wealth. While the individual advantages of different risk
management activities are clear, there are disadvantages to the traditional “silo” approach
to risk management. Managing each risk class in a separate silo creates inefficiencies due
to lack of coordination between the various risk management departments. By integrating
decision making across all risk classes, firms are able to avoid duplication of risk
management expenditure by exploiting natural hedges. Firms that engage in ERM are able
to better understand the aggregate risk inherent in different business activities. This
provides them with a more objective basis for resource allocation, thus improving capital
efficiency and return on equity. Organizations with a wide range of investment
4 As discussed by Jensen and Meckling (1976). 5 Such as Myers’ (1977) underinvestment problem. Mayers and Smith (1987) provide a model that describes the effect of corporate insurance on the underinvestment problem. 6 Mayers and Smith (1982) describe other benefits of corporate insurance not discussed here such as real service efficiencies and comparative advantage in risk bearing.
3
opportunities are likely to benefit from being able to select investments based on a more
accurate risk-adjusted rate than was available under the traditional risk management
approach (Meulbroek, 2002).
While individual risk management activities may reduce earnings volatility by
reducing the probability of catastrophic losses, there are potential interdependencies
between risks across activities that might go unnoticed in the traditional risk management
model. ERM provides a structure that combines all risk management activities into one
integrated framework that facilitates the identification of such interdependencies. Thus,
while individual risk management activities can reduce earnings volatility from a specific
source (hazard risk, interest rate risk, etc.), an ERM strategy reduces volatility by
preventing aggregation of risk across different sources. A further source of value from
ERM programs arises due to improved information about the firm’s risk profile. Outsiders
are more likely to have difficulty in assessing the financial strength and risk profile of
firms that are highly financially and operationally complex. ERM enables these financially
opaque firms to better inform outsiders of their risk profile and also serves as a signal of
their commitment to risk management. By improving risk management disclosure, ERM is
likely to reduce the expected costs of regulatory scrutiny and external capital (Meulbroek,
2002).
Additionally, for insurers the major ratings agencies have put increasing focus on
risk management and ERM specifically as part of their financial review. This is likely to
provide additional incentives for insurers to consider ERM programs, and also suggests a
potential value implication to the existence of ERM programs in insurers. As an example
of this interest from the rating agencies in the implications of ERM, in October 2005
Standard & Poor’s announced that with the emergence of ERM, risk management will
become a separate, major category of its analysis. Most recently, in February 2006, A.M.
Best released a special report describing its increased focus on ERM in the rating process.
Empirical Evidence on the Value-Relevance of Risk Management
Smithson and Simkins (2005) provide a thorough review of the literature regarding
the value-relevance of risk management. While their study examines four specific
questions, their focus on the relationship between the use of risk management and the
value of the firm is most relevant to our study. Of the studies examined by Smithson and
4
Simkins (2005), one considered interest rate and FX risk management by financial
institutions, five considered interest rate and FX risk management by industrial
corporations, one considered commodity price risk management by commodity users, and
three considered commodity price risk management by commodity producers. While this
series of prior studies has considered these specific types of hedging activity, no prior
study has considered the value-relevance of a firm’s overall or enterprise-wide risk
management practices. While many of these prior studies have found evidence of a
positive relationship between specific forms of risk management and the value of the firm,
others such as Guay and Kothari (2003) suggest that corporate derivatives positions in
general are far too small to account for the valuation premiums reported in some of these
studies (e.g., Allayannis and Weston, 2001). In contrast to the prior studies of the value-
relevance of risk management, we focus not on assessing the potential value-relevance of
specific forms of hedging or risk management but on the overall risk management posture
of the firm at the enterprise level. In other words, is the firm pursing an ERM program or
not, and if it is, what is the value associated with such a program?
Sample, Data, and Empirical Method
In order to control for differences that might arise from regulatory and market
differences across industries, we have elected to focus our attention in this study on U.S.
insurers. We also have elected to focus on publicly-traded insurers so that we have access
to market-based measures of value and because we are more likely to observe public
disclosures of ERM activity among publicly-traded firms.7 Our initial sample is drawn
from the universe of insurance companies (SIC codes between 6311 and 6399) in the
merged CRSP/COMPUSTAT database for the period 1995 to 2005. This sample is
comprised of 275 insurance firms that operated in any year during the 11-year period.
We then attempt to identify ERM activity for each of these firms. Because firms are
not required to report whether they engage in enterprise risk management, we perform a
detailed search of financial reports, newswires, and other media for evidence of ERM
7 Although we restrict our analysis to publicly-traded insurers we are still able to cover a substantial proportion of the US insurance market. For example, we were able to link 129 publicly-traded insurers to the NAIC database for the year 2004. These 129 insurers accounted for 1114 subsidiaries (834 property/liability, 280 life/health), or roughly one-third of all firms licensed in the US insurance industry. In terms of direct premiums written, these publicly-traded insurers accounted for almost half of all premiums written by licensed insurers ($482 billion out of $1.04 trillion).
5
activity.8 More specifically, we use Factiva, Thomson, and other search engines to perform
separate keyword searches for each insurer. Our search strings included the following
phrases, their acronyms, as well as the individual words within the same paragraph;
“enterprise risk management”, “chief risk officer”, “risk committee”, “strategic risk
management”, “consolidated risk management”, “holistic risk management”, “integrated
risk management”. We chose these particular search strings because the second and third
phrases are prominent methods for the implementation and management of an ERM
program, and the other phrases are synonymous with enterprise risk management
(Liebenberg and Hoyt, 2003). Each search “hit” was manually reviewed within its context
in order to determine that each recorded successful “hit” related to ERM adoption or
engagement as opposed to, for example, the sale of ERM products to customers. Each
successful “hit” was then dated and coded to record which key words generated the “hit”.9
All potential “hits” were reviewed in reverse date order in order to locate the single,
earliest evidence of ERM activity for each firm. The earliest evidence of ERM activity is in
late 1999 and all of the remaining hits occur between 2000 and 2005.10
Based on the concentration of ERM activity between 2000 and 2005, we apply the
sample selection criteria summarized in Table 1. First, we limit our data collection to the
six-year period from 2000 to 2005, and exclude firms with missing Compustat values for
sales, assets, or equity, and American Depository Receipts. We then use the Compustat
Segment database to identify the distribution of each firm’s income across various business
segments and exclude firms that are not primarily involved in the insurance industry.
Consistent with Zhang, Cox, and Van Ness (2005), we use a cutoff of 50% to determine
whether a firm is primarily an insurer.11 Next, we eliminate firms that have missing or
invalid ownership data in Compact Disclosure SEC and firms with only one year of sales
8 An alternative approach would be to survey firms to determine whether or not they are currently engaged in ERM activity. However, we prefer the implicit validation associated with public disclosures of specific ERM activity. 9 Please see Appendix I for examples. 10 Our results are not overly sensitive to the time period chosen. We performed our full analysis on the seven-year period 1999-2005, as well as the four-year period 2002-2005. Our key results are similar to those reported. 11 Specifically, we calculate the ratio of insurance sales (NAICS code 5241) to total sales and exclude firms for which the ratio is below 0.5.
6
data. Finally, we match these firms to the statutory accounting data and eliminate firms
that cannot be matched to the NAIC Infopro data. Our final sample consists of 125 firms,
or 549 firm-year observations. Figure 1 shows the cumulative number of sample firms that
are deemed to engage in ERM, by the earliest year of identifiable ERM activity.
<Insert Table 1 here>
<Insert Figure 1 here>
Table 2 summarizes the frequency with which various key words, or phrases,
yielded the first evidence of an ERM program. It is evident from Table 2 that most of the
evidence suggesting ERM engagement is related to the existence of a Chief Risk Officer.
Of the 24 unique “hits” for ERM, 15 were for the keyword “Chief Risk Officer” (or
“CRO”). Of these 15 CRO-related “hits”, 8 were announcements of CRO appointments.
These announcements generally indicate the implementation of an ERM program. For the
remaining 7 CRO “hits”, as well as the 9 non-CRO “hits”, we do not have any indication
of the date when the ERM program was implemented or adopted. Accordingly, we are
unable to use a time-series approach in our empirical analysis. We are, however, able to
distinguish between insurers that engaged in ERM at some point during a given period, and
those that did not. In the empirical analysis that follows we use a dummy variable, “ERM”,
to indicate whether an insurer engaged in ERM (ERM=1) or did not engage in ERM
(ERM=0) at any point during the period 2000-2005.
<Insert Table 2 here>
The primary objective of our empirical analysis is to estimate the relation between
ERM and firm value. One approach to this analysis is to simply model firm value as a
function of ERM and other value determinants. The disadvantage of such an approach is
that it ignores potential selectivity bias that arises due to the likely endogeneity of ERM
choice. In other words, some of the factors that are correlated with the firm’s choice to
adopt ERM may also be correlated with observed differences in firm value. To deal with
this potential endogeneity bias we use a maximum-likelihood treatment effects model that
jointly estimates the decision to engage in ERM and the effect of that decision (or
treatment) on firm value in a two-equation system.12 This technique is the maximum
12 For a different finance application of the maximum-likelihood treatment effects model see Ljungqvist, Jenkinson, and Wilhelm (2003).
7
likelihood analog of the Heckman “two-step” selection correction model. We prefer the
maximum-likelihood method of estimating the system to the two-step method because it
enables the adjustment of standard-errors for firm-level clustering.13 Given that we have
up to six repeated observations per firm it is important to adjust standard errors for
clustering to avoid underestimating the standard errors of our coefficient estimates.
In the first equation, we model the choice to engage in ERM. Our ERM
engagement model sheds light on some of the determinants of ERM activity among
insurance firms. Equation (1) is as follows:
ERM Engagement = f(Size, Institutional Ownership, Diversification, Industry, etc.) (1)
The dependent variable is a dummy variable equal to one for firms that exhibited
evidence of ERM engagement during the period 2000 to 2005, and zero otherwise. Survey
evidence suggests that larger firms are more likely to engage in ERM because they are
more complex, face a wider array of risks, have the institutional size to support the
administrative cost of an ERM program, etc. (see for example: Colquitt, Hoyt, and Lee,
1999; Hoyt et al., 2001; Beasley et al., 2005; and Standard and Poor’s, 2005). We use the
natural log of the book value of assets as a proxy for firm size.
Pressure from external stakeholders is regarded as an important driving force
behind the adoption of ERM programs (Lam and Kawamoto, 1997; Miccolis and Shah,
2000; Lam, 2001). Regulatory pressure is likely to have a similar impact on all competitors
within a given industry while shareholder pressure may differ depending on the relative
influence of different shareholder groups for each firm. Institutions are relatively more
influential than individual shareholders and are able to exert greater pressure for the
adoption of an ERM program. Therefore, we expect that firms with higher percentage of
institutional share ownership will be more likely to engage in ERM.
According to Standard and Poor’s (2005), insurers that are relatively more complex
are likely to benefit more from the adoption of ERM programs. While firm size captures a
good deal of complexity, other factors such as industrial and international diversification
are also likely to affect whether a firm adopts an ERM program. We use dummy variables
to indicate diversification status. The industrial diversification dummy takes on a value of
one for firms with income from non-insurance operating segments, and zero otherwise.
13 See Peterson (2006) for a discussion of the importance of adjusting for firm-level clustering.
8
The international diversification dummy takes on a value of one for firms with geographic
segments outside of the US, and zero otherwise. Both forms of diversification are expected
to be positively related to ERM engagement because diversified firms face a more complex
range of risks than do undiversified firms.14 Intra-industry diversification, calculated as the
complement of the Herfindahl index of premiums written across all lines of business,
further captures firm complexity.
We include a dummy variable equal to one for firms that are primarily life insurers
(SIC Code 6311), and zero otherwise, to account for potential differences in the likelihood
of ERM engagement across sectors of the insurance industry. Finally, book-value of
assets/book-value of liabilities reflects the effect of capital structure on ERM-engagement,
and reinsurance use (calculated as reinsurance ceded/direct premiums written plus
reinsurance assumed) relates the ERM-decision to the extent to which an insurer reduces
underwriting risk via reinsurance contracts.
Firm Value = f (ERM engagement | other value determinants) (2)
In the second equation of the treatment effects framework, firm value is modeled as
a function of ERM and other value-determinants. Consistent with the general practice in
the corporate finance literature, we use the natural logarithm of Tobin’s Q as a proxy for
firm value. Tobin’s Q is a ratio that compares the market value of a firm’s assets to their
replacement cost. It has been used to measure the value-effects of factors such as board
size (Yermack, 1996), inside ownership (Morck, Schleifer, and Vishny, 1988), and
industrial diversification (Servaes, 1996). Lang and Stulz (1994) explain that Tobin’s Q
dominates other performance measures (e.g. stock returns and accounting measures)
because, unlike other measures, Tobin’s Q does not require risk-adjustment or
normalization. Furthermore, because Tobin’s Q reflects market expectations, it is relatively
free from managerial manipulation (Lindenberg and Ross, 1981).
In their review of empirical studies on the value-relevance of risk management,
Smithson and Simkins (2005) report that the majority of studies use Tobin’s Q to proxy for
firm value. Consistent with Cummins, Lewis, and Wei (2006) we define Tobin’s Q as the 14 Additionally, internationally diversified firms that operate in the UK and Canada, where regulated corporate governance regarding risk management control and reporting historically has been more stringent, should be more likely to adopt an ERM program (Liebenberg and Hoyt, 2003). Similarly, Beasley et al (2005) find that US-based firms are less likely to be in advanced stage of ERM than are their international counterparts.
9
market value of equity plus the book value of liabilities divided by the book value of
assets. Cummins et al. (2006) contend that this approximation of Tobin’s Q is appropriate
for insurance companies because the book value of their assets is a much closer
approximation of replacement costs than would be the case for non-financial firms. In our
context, Tobin’s Q is particularly useful as a value measure because it is a prospective
performance measure. Unlike historical accounting performance measures such as ROA or
ROE, Tobin’s Q reflects future expectations of investors. This is important because the
benefits of ERM are not expected to be immediately realized. Rather, we expect there to be
some lag between ERM implementation and benefit realization.
To isolate the relationship between market value and ERM we need to control for
other factors that could influence firm value. Size: There is some evidence that large firms
are more likely to have ERM programs in place (Colquitt et al, 1999, Liebenberg and
Hoyt, 2003, Beasley et al., 2005). Thus, it is important to control for size in our analysis
because our ERM indicator may proxy for firm size. We use the log of the book value of
assets to control for size-related variation in Tobin’s Q. Lang and Stulz (1994) and
Allayannis and Weston (2001) find a significantly negative relation between size and firm
value.
Leverage: To control for the relation between capital structure and firm value we
include a leverage variable that is equal to the ratio of the book value of liabilities to the
market value of equity. The predicted sign on this variable is ambiguous. On the one hand,
financial leverage enhances firm value to the extent that it reduces free cash flow which
might otherwise have been invested by self-interested managers in sub-optimal projects
(Jensen, 1986). On the other hand, excessive leverage can increase the probability of
bankruptcy and cause the firm’s owners to bear financial distress costs.
Profitability: Profitable firms are likely to trade at a premium (Allayannis and
Weston, 2001). To control for firm profitability we include return on assets (ROA) in our
regressions. ROA is calculated as net income divided by total assets. We expect a positive
relation between ROA and Tobin’s Q.
Industrial diversification: Several insurers in our sample belong to conglomerates
that operate in other industries. Theory suggests that industrial diversification is associated
with both costs and benefits. On the one hand, diversification may be performance-
10
enhancing due to benefits associated with scope economies, larger internal capital markets,
and risk-reduction (Lewellen, 1971, Teece, 1980). On the other hand, diversification may
reduce performance if it exacerbates agency costs and leads to inefficient cross-
subsidization of poorly performing businesses (Easterbrook, 1984, Berger and Ofek,
1995). The vast majority of empirical studies find that conglomerates trade at a discount
relative to undiversified firms (Martin and Sayrak, 2003).15 To control for the effect of
industrial diversification on firm value we use a dummy variable equal to one for firms that
report sales in SIC codes greater than 6399 or less than 6311 on the Compustat Segment
Files. We expect a negative relation between industrial diversification and Tobin’s Q.
International diversification: The theoretical predictions described for industrial
diversification apply equally to international diversification. As is the case with industrial
diversification, international diversification is associated with costs that stem from
unresolved agency conflicts and benefits that result from scope economies and risk-
reduction. The empirical evidence on the relation between international diversification and
firm value is mixed. While some studies have found a discount (e.g. Denis, Denis, and
Yost, 2002), others have found a premium (e.g. Bodnar, Tang, Weintrop, 1999).
International diversification is measured using a dummy variable set equal to one for firms
with non-zero foreign sales, and zero otherwise. Foreign sales are defined as sales outside
of the US and are calculated using Compustat segment data.
Dividend policy: Following Allayannis and Weston (2001) and Lang and Stulz
(1994) we include in our model a dividend payment indicator, equal to one if the firm paid
a dividend in the current year. The expected sign is ambiguous. On the one hand, investors
may view a disbursement of cash in the form of a dividend as a sign that the firm has
exhausted its growth opportunities. If this holds then the payment of dividends will
negatively affect firm value. On the other hand, to the extent that dividends reduce free
cash flow that could be used for managerial perquisite consumption, the payment of
dividends is expected to positively affect firm value.
Insider Ownership: There is a large body of research that links insider share
ownership to firm value. We use the percentage of shares owned by insiders to control for
15 We are aware of the recent literature that suggests that the well-documented diversification discount is an artifact of measurement error, managerial discretion in segment reporting, and endogeneity bias (e.g., Campa and Kedia, 2002, Graham, Lemmon, and Wolf, 2002, and Villalonga 2004).
11
variation in Tobin’s Q that is due to cross-sectional differences in managerial incentives.
The literature predicts that low levels of insider ownership are effective in aligning
managerial and shareholder interests. However, high levels of ownership have the opposite
effect on firm value (McConnell and Servaes, 1990). Accordingly, we expect Tobin’s Q to
be positively related to the percentage of insider ownership, but negatively related to the
square of the percentage of insider ownership. Data for insider ownership are from
Compact Disclosure SEC.
Growth Opportunities: Allayannis and Weston (2001) control for the effect of
growth opportunities on Tobin’s Q using the ratio of R&D expenditure to sales, or capital
expenditure to assets. These data are missing for the majority of our sample firms.
Accordingly, we use historical (one-year) sales growth as a proxy for future growth
opportunities.
The correlation matrix of Tobin’s Q, ERM, and their determinants, appears in
Table 3. The general lack of high correlation coefficients between the independent
variables that are used in the second equation of the treatment effects regression suggests
that multicollinearity should not be a problem in our regression analysis.16
<Insert Table 3 here>
Results
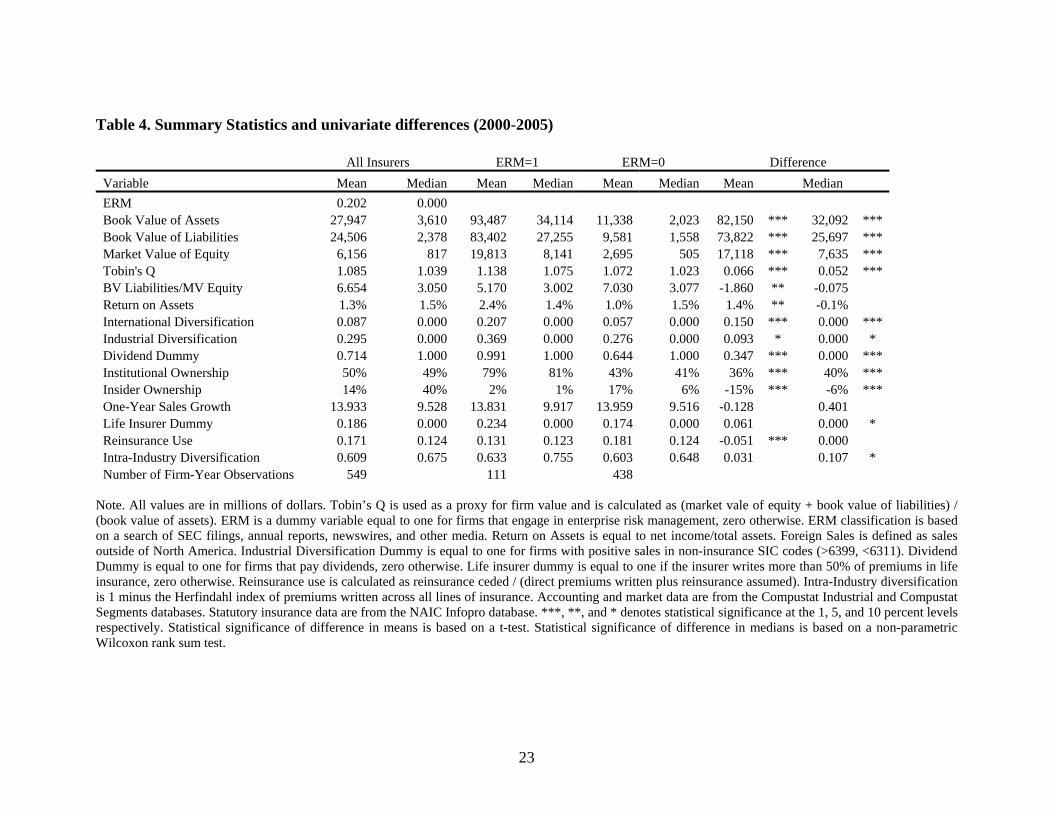
Table 4 reports summary statistics for the overall sample as well as differences in
the means and medians of key variables between insurers with an identifiable ERM
program (ERM=1) and those without (ERM=0). Three differences are noteworthy. First,
the univariate results support the contention that ERM enhances firm value. Both the mean
and median values of Tobin’s Q are significantly higher for firms with ERM programs. On
average, insurers with ERM programs are valued approximately 6% higher than other
insurers. Second, ERM users are systematically different from non-users. Specifically, in
terms of their financial characteristics, ERM users are larger, more internationally and
industrially diversified and less capital constrained than non-users. Furthermore, in terms
16 Since the first-stage probit regression is primarily useful as a prediction model we are less concerned about multicollinearity issues in this model. We further investigate whether multicollinearity is an issue in our second-stage OLS model by inspecting variance inflation factors in our regression diagnostics. The general rule is that multicollinearity may be a problem if variance inflation factors exceed 10 (Belsley, Kuh, and Welsch, 1980). Our highest variance inflation factor of 1.4 confirms that multicollinearity is not a problem in our sample.
12
of ownership, they tend to have higher levels of institutional and insider ownership than
non-users. Finally, they are more prevalent in the life insurance industry than in the
property-casualty insurance industry.
<Insert Table 4 here>
Table 5 reports the results of the ERM-decision model. Consistent with survey
evidence, larger firms are more likely to engage in ERM than are smaller firms. The
positive coefficient on institutional ownership supports the contention that pressure from
institutional owners is an important determinant of ERM adoption. International
diversification, industrial diversification and life insurance dummy are significant only
when firm size is omitted from the regression. Thus, while these factors appear to be
significant in classifying between ERM-users and non-users they are likely reflecting the
tendency for larger insurers to be more diversified and for life insurers to be larger than
non-life insurers. Leverage and reinsurance use are both negatively related to ERM-
engagement.
<Insert Table 5 here>
Estimation results of the value-determinants equation are reported in Table 6. Most
importantly, the coefficient on ERM is positive and significant. The coefficient estimate of
0.167 indicates that insurers engaged in ERM are valued 16.7% higher than other insurers,
after controlling for other value determinants and potential endogeneity bias. Regarding
our control variables, we find evidence consistent with prior research on non-financial
industries of a quadratic relation between insider ownership and firm value. We also find a
positive relation between dividend payment and firm value, consistent with the notion that
the dividend payments are a valuable method of reducing the agency costs associated with
free cash-flow. None of our other explanatory variables is statistically significant. The
Wald test for independent equations rejects the null hypothesis that the residuals from
equations (1) and (2) are uncorrelated and supports their joint estimation.
<Insert Table 6 here>
Conclusion and Recommendations for Future Research
Our study provides some initial evidence on the value-relevance of ERM for
insurance companies. One of the major challenges facing researchers is how to identify
firms that engage in ERM. Absent explicit disclosure of ERM implementation, we perform
13
a detailed search of financial reports, newswires, and other media for evidence of ERM
use. An indicator variable is used to distinguish between ERM users and non-users. We
use a maximum-likelihood treatment effects model to jointly estimate the determinants of
ERM, and the relation between ERM and firm value. In our ERM-choice model we find
ERM usage to be positively related to firm size and institutional ownership, and negatively
related to financial leverage and reinsurance use. By focusing on publicly-traded insurers
we are able to calculate Tobin’s Q, a standard proxy for firm value, for each insurer in our
sample. We then model Tobin’s Q as a function of ERM use and a range of other
determinants. We find a positive relation between firm value and the use of ERM. The
ERM premium is statistically and economically significant and approximately 17% of firm
value. To our knowledge, ours is one of the first studies to document the value relevance
of ERM.
Our analysis provides a starting point for additional research into ERM in the
insurance industry. The vast majority of extant research takes the form of surveys. These
studies are valuable as a source of descriptive information regarding ERM use, but do not
answer the fundamental question of whether ERM enhances shareholder wealth. Our study
addresses this question using a well-established methodology and, except for our ERM
proxy, data that are readily available to most researchers. We recommend that future
researchers extend our study by applying a similar methodology to other industries and by
finding more robust measures of ERM use.
Our proxy for ERM implementation could be refined with the use of surveys that
might indicate the extent of ERM use, as well as the length of time that an ERM program
has been in place. Further, an ERM measure that identifies the time at which ERM was
implemented would allow for an ex post analysis of the effects of ERM on organizations.
A weakness of our measure is that we are unable to identify the point in time when ERM
was implemented and thus cannot perform a before-and-after comparison. However, to the
extent that we are able to distinguish between firms that engage in ERM and those that do
not, we are able to provide some evidence on the relation between ERM and firm value.
14

References
Allayannis, George., and James Weston, 2001, The Use of Foreign Currency Derivatives and Firm Market Value, Review of Financial Studies, 14, 243-276.
A.M. Best, 2006, A.M. Best Comments on Enterprise Risk Management and Capital
Models, World Wide Web: http://www.ambest.com/ratings/methodology/enterpriserisk.pdf
Ashby, S.G. and Diacon, S.R., 1998, The Corporate Demand for Insurance: A Strategic
Perspective, Geneva Papers on Risk and Insurance, 23, 34-51. Beasley, Mark S., Clune, Richard, and Hermanson, Dana R., 2005, Enterprise risk
management: An empirical analysis of factors associated with the extent of implementation, Journal of Accounting and Public Policy, 24, 521-31
Beasley, Mark S., Pagach, Don, and Warr, Richard, 2006, The Information Conveyed in Hiring Announcements of Senior Executives Overseeing Enterprise-Wide Risk Management Processes, Working Paper, North Carolina State University.
Belsley, D.A., E. Kuh, and R.E. Welsch, 1980, Regression Diagnostics, Identifying Influential Data and Sources of Collinearity, Wiley, New York.
Berger, Philip G., and Eli Ofek, 1995, Diversification's Effect on Firm Value, Journal of Financial Economics 37, 39-65.
Bessembinder, H., 1991, Forward Contracts and Firm Value: Investment Incentive and Contracting Effects, Journal of Financial and Quantitative Analysis, 26: 519:32.
Bodnar, Gordon M., Charles Tang, and Joseph Weintrop, 1999, Both sides of corporate
diversification: The value impacts of global and industrial diversification, Working Paper, Johns Hopkins University.
Campa, Jose Manuel, and Simi Kedia, 2002, Explaining the Diversification Discount, Journal of Finance 57, 1731-62.
Campbell, Tim S. and Kracaw, William A., 1990, Corporate Risk Management and the Incentive Effects of Debt, Journal of Finance, 45, 1673-86.
CFO Research Services, 2002, Strategic Risk Management: New Disciplines, New
Opportunities, CFO Publishing Corp., March. Colquitt, L. Lee and Robert E. Hoyt, 1997, Determinants of Corporate Hedging Behavior:
Evidence from the Life Insurance Industry, Journal of Risk and Insurance, 64, 649-671.
15
Colquitt, L. Lee, Hoyt, Robert E., and Lee, Ryan B., 1999, Integrated Risk Management and the Role of the Risk Manager, Risk Management and Insurance Review, 2, 43-61.
Cumming, C.M. and Hirtle, B.J., 2001, The Challenges of Risk Management in Diversified
Financial Companies, FRBNY Economic Policy Review, March. Cummins, J. David, Christopher Lewis, and Ran Wei, 2006, The Market Impact of
Operational Risk Events for U.S. Banks and Insurers, Journal of Banking and Finance, forthcoming.
Cyree, Ken B. and Pinghsun Huang, 2006, The Effect of Derivatives Use on Bank and
Dealer Value and Risk, Working Paper, University of Mississippi.
Denis, David J., Diane K. Denis, and Keven Yost, 2002, Global Diversification, Industrial Diversification and Firm Value, Journal of Finance, 1951-79.
Easterbrook, Frank H., 1984, Two Agency-Cost Explanations of Dividends, American Economic Review 74, 650-59.
Froot, Kenneth A., Scharfstein, David S., and Stein, Jeremy C., 1993, Risk management: Coordinating corporate investment and financing policies, Journal of Finance, 48, 1629-58.
Graham, John R., Michael L. Lemmon, and Jack G. Wolf, 2002, Does Corporate Diversification Destroy Value?, Journal of Finance, 57, 695-720.
Guay, W. and S.P. Kothari, 2003, How Much do Firms Hedge with Derivatives?, Journal of Financial Economics, 70, 423-461.
Hoyt, Robert E. and Khang, Ho, 2000, On the Demand for Corporate Property Insurance, Journal of Risk and Insurance, 67, 91-107.
Hoyt, Robert E., Brian M. Merkley, and Karen Thiessen, 2001, A Composite Sketch of a Chief Risk Officer, The Conference Board of Canada, September.
Jensen, Michael C., 1986, Agency costs of free cash flow, corporate finance and takeover,
American Economic Review, 76, 323-329. Jensen, Michael C. and Meckling, W., 1976, Theory of the Firm, Managerial Behavior,
Agency Costs and Ownership Structure, Journal of Financial Economics, 3, 305-60.
Kleffner, Anne E., Ryan B. Lee, and Bill McGannon, 2003, The Effect of Corporate
Governance on the use of Enterprise Risk Management: Evidence from Canada, Risk Management and Insurance Review, 6, 53-73
16
Lam, James, 2001, The CRO is here to stay, Risk Management, April, 16-20. Lam, James, and Kawamoto, Brian M., 1997, Emergence of the Chief Risk Officer, Risk
Management, September, 30-34. Lang, L. and R. Stulz, 1994, Tobin's q, diversification, and firm performance, Journal of
Political Economy, 102, 1248-1280. Lewellen, Wilbur G., 1971, A Pure Financial Rationale for the Conglomerate Merger,
Journal of Finance 26, 521-37. Liebenberg, Andre P. and Hoyt, Robert E., 2003, Determinants of Enterprise Risk
Management: Evidence from the Appointment of Chief Risk Officers, Risk Management and Insurance Review, 6, 37-52.
Lindenberg, E. and Ross, S. 1981, Tobin's q ratio and industrial organization, Journal of
Business, 54, 1-32. Ljungqvist, Alexander P., Jenkinson, Tim, and Wilhelm, William J. Jr., 2003, Global
Integration in Primary Equity Markets: The Role of US Banks and US Investors, Review of Financial Studies, 16, 63-99.
MacMinn, Richard D., 1987, Insurance and Corporate Risk Management, Journal of Risk
and Insurance, 54, 658-77. Martin, John D., and Akin Sayrak, 2003, Corporate Diversification and Shareholder Value:
A Survey of Recent Literature, Journal of Corporate Finance, 9, 37-57. Mayers, David and Smith, Clifford W., 1982, On the Corporate Demand for Insurance,
Journal of Business, 55, 190-205. Mayers, David and Smith, Clifford W., 1987, Corporate Insurance and the
Underinvestment Problem, Journal of Risk and Insurance, 54, 45-54. Mayers, David and Smith, Clifford W., 1990, On the Corporate Demand for Insurance:
Evidence from the Reinsurance Market, Journal of Business, 63, 19-40. McConnell, John and Henri Servaes, 1990, Additional evidence on equity ownership and
corporate value, Journal of Financial Economics, 27, 595-612. Meulbroek, Lisa K., 2002, Integrated Risk Management for the Firm: A Senior Manager’s
Guide, Journal of Applied Corporate Finance, 14, 56-70. Miccolis, Jerry and Samir Shah, 2000, Enterprise Risk Management: An Analytic
Approach, Tillinghast – Towers Perrin.
17

Morck, R., A. Schleifer and R. Vishny, 1988, Management ownership and market valuation: an empirical analysis, Journal of Financial Economics, 20, 293–315.
Myers, S.C., 1977, The Determinants of Corporate Borrowing, Journal of Financial
Economics, 4, 147-75. Nance, D.R., C.W. Smith and C.W. Smithson, 1993, On the Determinants of Corporate
Hedging, Journal of Finance, 48, 267-284. Petersen, Mitchell A., 2006, Estimating Standard Errors in Finance Panel Data Sets:
Comparing Approaches, Working Paper, Northwestern University. Servaes, Henri, 1996, The Value of Diversification During the Conglomerate Merger
Wave, Journal of Finance, 51, 1201-25. Smith, Clifford W., and Stulz, Rene M., 1985, The Determinants of Firms’ Hedging
Policies, Journal of Financial and Quantitative Analysis, 31, 419-39. Smithson, Charles and Betty J. Simkins, 2005, Does Risk Management Add Value? A
Survey of the Evidence, Journal of Applied Corporate Finance, 17, 8-17. Standard and Poor’s, 2005, Insurance Criteria: Evaluating The Enterprise Risk
Management Practices of Insurance Companies, October 17. SwissRe, 2004, Exploiting the growth potential of emerging insurance markets: China and
India in the spotlight, Sigma, No. 5/2004. Zurich. Teece, David J., 1980, Economies of scope and the scope of the enterprise, Journal of
Economic Behavior and Organization, 1, 223-47.
Tillinghast-Towers Perrin, 2002, Enterprise Risk Management in the Insurance Industry - 2002 Benchmarking Survey Report.
Villalonga, Belén, 2004, Does diversification cause the ‘diversification discount’?, Financial Management, 33, 5-27.
Yermack, David, 1996, Higher Market Valuation of Companies with a Small Board of Directors, Journal of Financial Economics, 40, 185-211.
Zhang, Tao, Larry A. Cox, and Robert A. Van Ness, 2005, Insurer Opaqueness and
Adverse Selection, Working Paper, University of Mississippi.
18
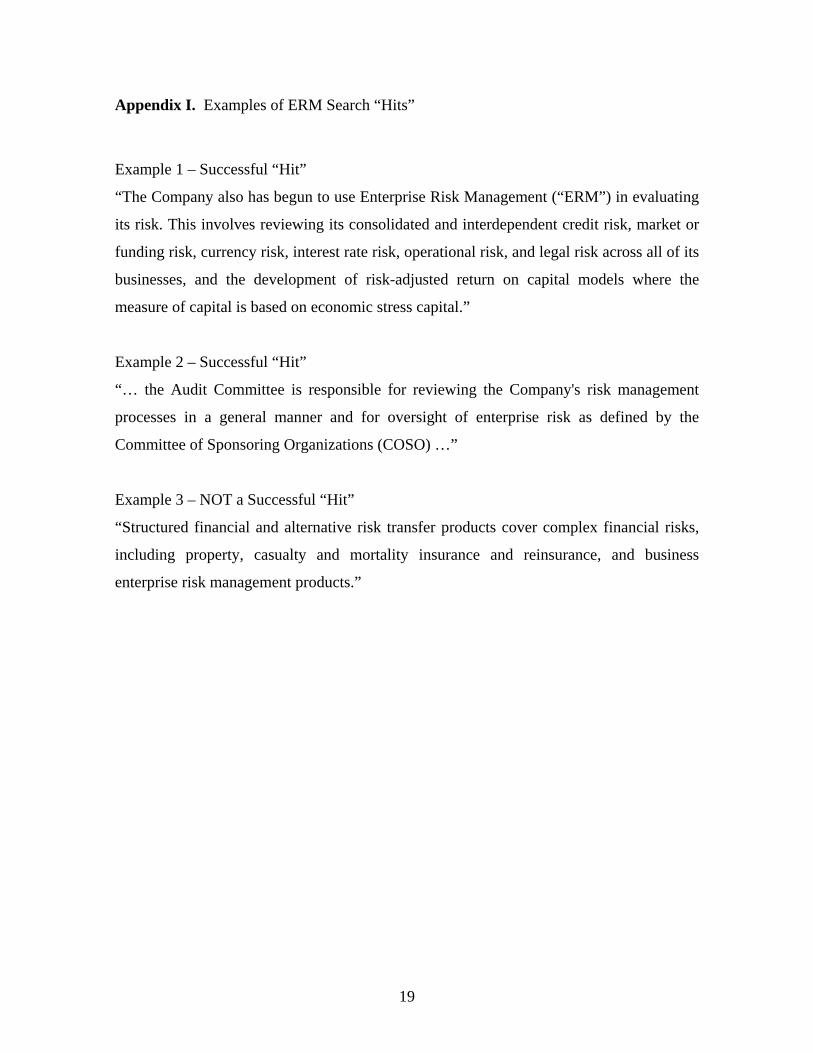
Appendix I. Examples of ERM Search “Hits”
Example 1 – Successful “Hit”
“The Company also has begun to use Enterprise Risk Management (“ERM”) in evaluating
its risk. This involves reviewing its consolidated and interdependent credit risk, market or
funding risk, currency risk, interest rate risk, operational risk, and legal risk across all of its
businesses, and the development of risk-adjusted return on capital models where the
measure of capital is based on economic stress capital.”
Example 2 – Successful “Hit”
“… the Audit Committee is responsible for reviewing the Company's risk management
processes in a general manner and for oversight of enterprise risk as defined by the
Committee of Sponsoring Organizations (COSO) …”
Example 3 – NOT a Successful “Hit”
“Structured financial and alternative risk transfer products cover complex financial risks,
including property, casualty and mortality insurance and reinsurance, and business
enterprise risk management products.”
19

Table 1. Sample Selection
Action Observations Firms Data Souce
Initial Sample 1598 275 Merged CRSP/Compustat
Search for ERM use 1598 275 Factiva, Thomson, Edgar
1. Delete if year < 2000 and missing sales, assets, or equity 1000 218 Merged CRSP/Compustat
2. Delete American Depository Receipts 955 208 Merged CRSP/Compustat
3. Delete where insurance segment sales < 50% ot total 863 187 Compustat Segment Database
4. Delete where ownership data are missing or invalid 781 160 Compact Disclosure SEC
5. Delete where one-year sales growth data are missing 747 159
6. Merge with statutory return data 549 125 NAIC Infopro Database
Final Sample 549 125
20

21
Table 2. ERM activity by market segment (2000-2005)
SIC Code Segment Name
# firms with identifiable ERM
activity# firms in
sample
% firms with identifiable ERM
activity6311 Life 7 5 (1) 25 28%6321 Accident & Health 1 0 10 10%6331 Fire, Marine, and Casualty 11 7 (5) 73 15%6351 Surety 5 3 (2) 15 33%6361 Title 0 0 2 0%Total 24 125 19%
# firms where ERM activity is existence
of CRO*
15 (8) *Number of cases where the appointment date of the Chief Risk Officer is known appears in parentheses. Figure 1. Cumulative number of sample insurers engaged in ERM
0
2
4
6
8
10
12
14
16
18
20
2000
Cum
ulat
ive
Num
ber o
f ERM
Insu
rers
.
2001 2002 2003 2004 2005
Year
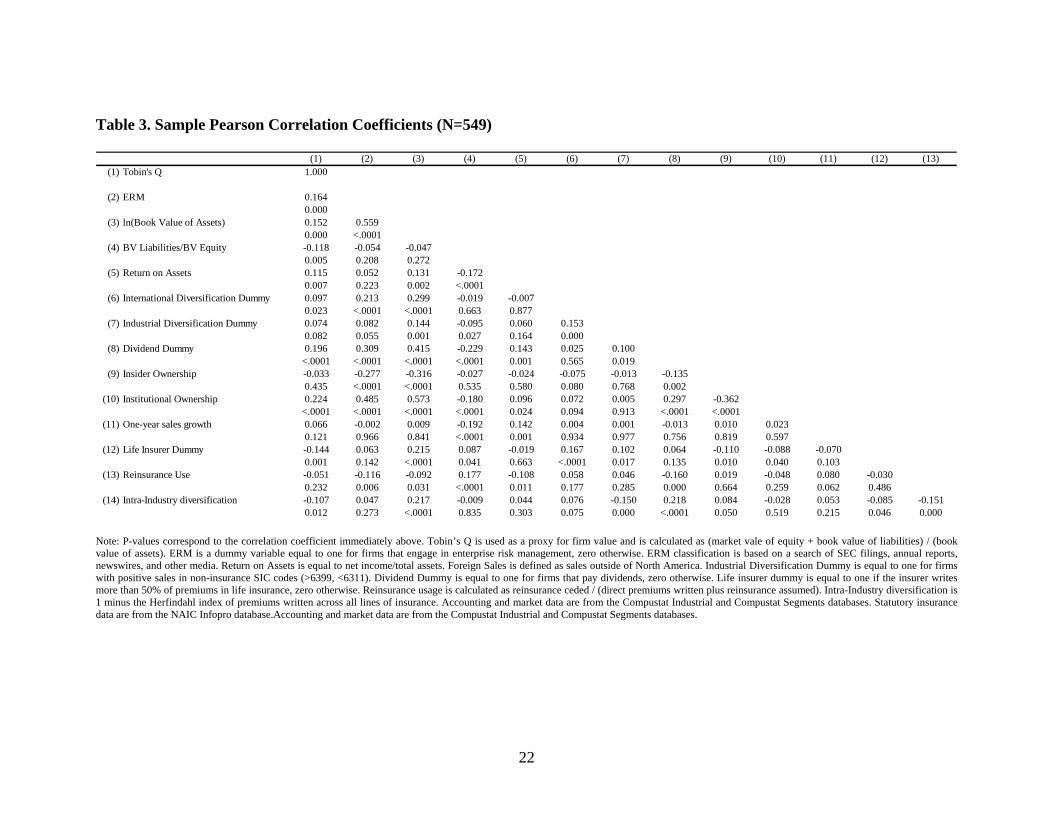
Table 3. Sample Pearson Correlation Coefficients (N=549)
(1) (2) (3) (4) (5) (6) (7) (8) (9) (10) (11) (12) (13)(1) Tobin's Q 1.000
(2) ERM 0.1640.000
(3) ln(Book Value of Assets) 0.152 0.5590.000 <.0001
(4) BV Liabilities/BV Equity -0.118 -0.054 -0.0470.005 0.208 0.272
(5) Return on Assets 0.115 0.052 0.131 -0.1720.007 0.223 0.002 <.0001
(6) International Diversification Dummy 0.097 0.213 0.299 -0.019 -0.0070.023 <.0001 <.0001 0.663 0.877
(7) Industrial Diversification Dummy 0.074 0.082 0.144 -0.095 0.060 0.1530.082 0.055 0.001 0.027 0.164 0.000
(8) Dividend Dummy 0.196 0.309 0.415 -0.229 0.143 0.025 0.100<.0001 <.0001 <.0001 <.0001 0.001 0.565 0.019
(9) Insider Ownership -0.033 -0.277 -0.316 -0.027 -0.024 -0.075 -0.013 -0.1350.435 <.0001 <.0001 0.535 0.580 0.080 0.768 0.002
(10) Institutional Ownership 0.224 0.485 0.573 -0.180 0.096 0.072 0.005 0.297 -0.362<.0001 <.0001 <.0001 <.0001 0.024 0.094 0.913 <.0001 <.0001
(11) One-year sales growth 0.066 -0.002 0.009 -0.192 0.142 0.004 0.001 -0.013 0.010 0.0230.121 0.966 0.841 <.0001 0.001 0.934 0.977 0.756 0.819 0.597
(12) Life Insurer Dummy -0.144 0.063 0.215 0.087 -0.019 0.167 0.102 0.064 -0.110 -0.088 -0.0700.001 0.142 <.0001 0.041 0.663 <.0001 0.017 0.135 0.010 0.040 0.103
(13) Reinsurance Use -0.051 -0.116 -0.092 0.177 -0.108 0.058 0.046 -0.160 0.019 -0.048 0.080 -0.0300.232 0.006 0.031 <.0001 0.011 0.177 0.285 0.000 0.664 0.259 0.062 0.486
(14) Intra-Industry diversification -0.107 0.047 0.217 -0.009 0.044 0.076 -0.150 0.218 0.084 -0.028 0.053 -0.085 -0.1510.012 0.273 <.0001 0.835 0.303 0.075 0.000 <.0001 0.050 0.519 0.215 0.046 0.000
Note: P-values correspond to the correlation coefficient immediately above. Tobin’s Q is used as a proxy for firm value and is calculated as (market vale of equity + book value of liabilities) / (book value of assets). ERM is a dummy variable equal to one for firms that engage in enterprise risk management, zero otherwise. ERM classification is based on a search of SEC filings, annual reports, newswires, and other media. Return on Assets is equal to net income/total assets. Foreign Sales is defined as sales outside of North America. Industrial Diversification Dummy is equal to one for firms with positive sales in non-insurance SIC codes (>6399, <6311). Dividend Dummy is equal to one for firms that pay dividends, zero otherwise. Life insurer dummy is equal to one if the insurer writes more than 50% of premiums in life insurance, zero otherwise. Reinsurance usage is calculated as reinsurance ceded / (direct premiums written plus reinsurance assumed). Intra-Industry diversification is 1 minus the Herfindahl index of premiums written across all lines of insurance. Accounting and market data are from the Compustat Industrial and Compustat Segments databases. Statutory insurance data are from the NAIC Infopro database.Accounting and market data are from the Compustat Industrial and Compustat Segments databases.
22
23
Table 4. Summary Statistics and univariate differences (2000-2005)
All Insurers ERM=1 ERM=0 Difference Variable Mean Median Mean Median Mean Median Mean Median ERM 0.202 0.000 Book Value of Assets 27,947 3,610 93,487 34,114 11,338 2,023 82,150 *** 32,092 *** Book Value of Liabilities 24,506 2,378 83,402 27,255 9,581 1,558 73,822 *** 25,697 *** Market Value of Equity 6,156 817 19,813 8,141 2,695 505 17,118 *** 7,635 *** Tobin's Q 1.085 1.039 1.138 1.075 1.072 1.023 0.066 *** 0.052 *** BV Liabilities/MV Equity 6.654 3.050 5.170 3.002 7.030 3.077 -1.860 ** -0.075 Return on Assets 1.3% 1.5% 2.4% 1.4% 1.0% 1.5% 1.4% ** -0.1% International Diversification 0.087 0.000 0.207 0.000 0.057 0.000 0.150 *** 0.000 *** Industrial Diversification 0.295 0.000 0.369 0.000 0.276 0.000 0.093 * 0.000 * Dividend Dummy 0.714 1.000 0.991 1.000 0.644 1.000 0.347 *** 0.000 *** Institutional Ownership 50% 49% 79% 81% 43% 41% 36% *** 40% *** Insider Ownership 14% 40% 2% 1% 17% 6% -15% *** -6% *** One-Year Sales Growth 13.933 9.528 13.831 9.917 13.959 9.516 -0.128 0.401 Life Insurer Dummy 0.186 0.000 0.234 0.000 0.174 0.000 0.061 0.000 * Reinsurance Use 0.171 0.124 0.131 0.123 0.181 0.124 -0.051 *** 0.000 Intra-Industry Diversification 0.609 0.675 0.633 0.755 0.603 0.648 0.031 0.107 * Number of Firm-Year Observations 549 111 438
Note. All values are in millions of dollars. Tobin’s Q is used as a proxy for firm value and is calculated as (market vale of equity + book value of liabilities) / (book value of assets). ERM is a dummy variable equal to one for firms that engage in enterprise risk management, zero otherwise. ERM classification is based on a search of SEC filings, annual reports, newswires, and other media. Return on Assets is equal to net income/total assets. Foreign Sales is defined as sales outside of North America. Industrial Diversification Dummy is equal to one for firms with positive sales in non-insurance SIC codes (>6399, <6311). Dividend Dummy is equal to one for firms that pay dividends, zero otherwise. Life insurer dummy is equal to one if the insurer writes more than 50% of premiums in life insurance, zero otherwise. Reinsurance use is calculated as reinsurance ceded / (direct premiums written plus reinsurance assumed). Intra-Industry diversification is 1 minus the Herfindahl index of premiums written across all lines of insurance. Accounting and market data are from the Compustat Industrial and Compustat Segments databases. Statutory insurance data are from the NAIC Infopro database. ***, **, and * denotes statistical significance at the 1, 5, and 10 percent levels respectively. Statistical significance of difference in means is based on a t-test. Statistical significance of difference in medians is based on a non-parametric Wilcoxon rank sum test.
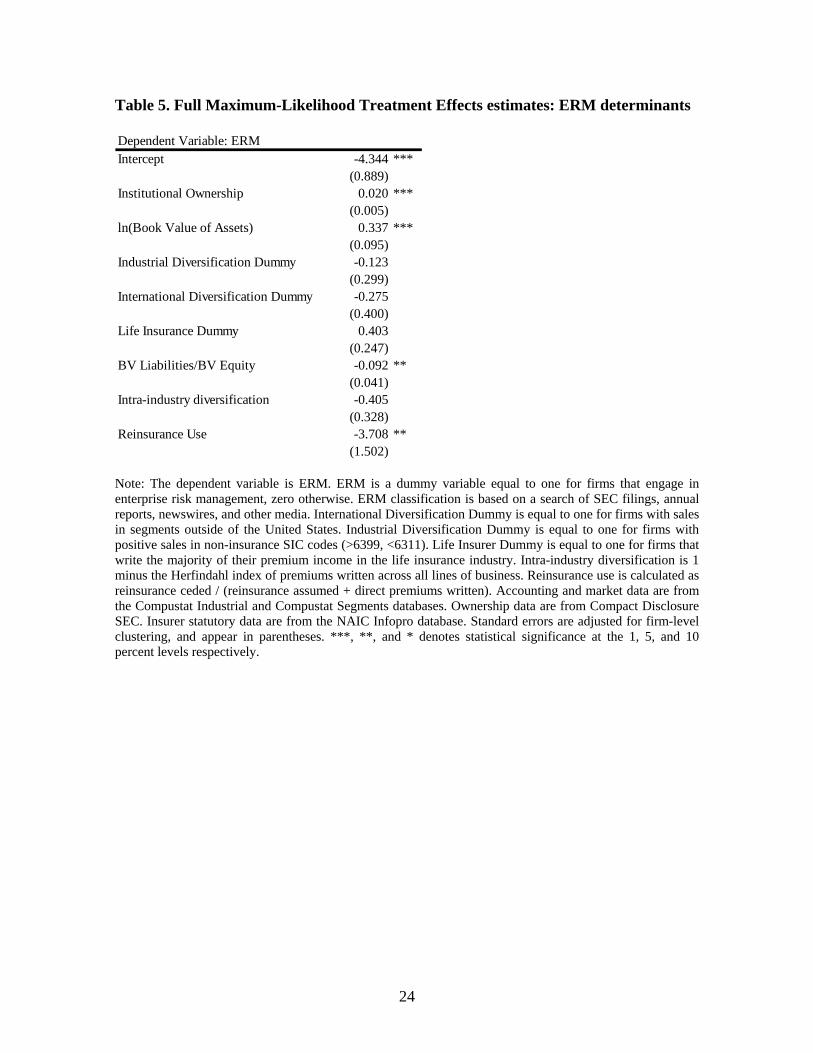
Table 5. Full Maximum-Likelihood Treatment Effects estimates: ERM determinants
Dependent Variable: ERMIntercept -4.344 ***
(0.889)Institutional Ownership 0.020 ***
(0.005)ln(Book Value of Assets) 0.337 ***
(0.095)Industrial Diversification Dummy -0.123
(0.299)International Diversification Dummy -0.275
(0.400)Life Insurance Dummy 0.403
(0.247)BV Liabilities/BV Equity -0.092 **
(0.041)Intra-industry diversification -0.405
(0.328)Reinsurance Use -3.708 **
(1.502) Note: The dependent variable is ERM. ERM is a dummy variable equal to one for firms that engage in enterprise risk management, zero otherwise. ERM classification is based on a search of SEC filings, annual reports, newswires, and other media. International Diversification Dummy is equal to one for firms with sales in segments outside of the United States. Industrial Diversification Dummy is equal to one for firms with positive sales in non-insurance SIC codes (>6399, <6311). Life Insurer Dummy is equal to one for firms that write the majority of their premium income in the life insurance industry. Intra-industry diversification is 1 minus the Herfindahl index of premiums written across all lines of business. Reinsurance use is calculated as reinsurance ceded / (reinsurance assumed + direct premiums written). Accounting and market data are from the Compustat Industrial and Compustat Segments databases. Ownership data are from Compact Disclosure SEC. Insurer statutory data are from the NAIC Infopro database. Standard errors are adjusted for firm-level clustering, and appear in parentheses. ***, **, and * denotes statistical significance at the 1, 5, and 10 percent levels respectively.
24
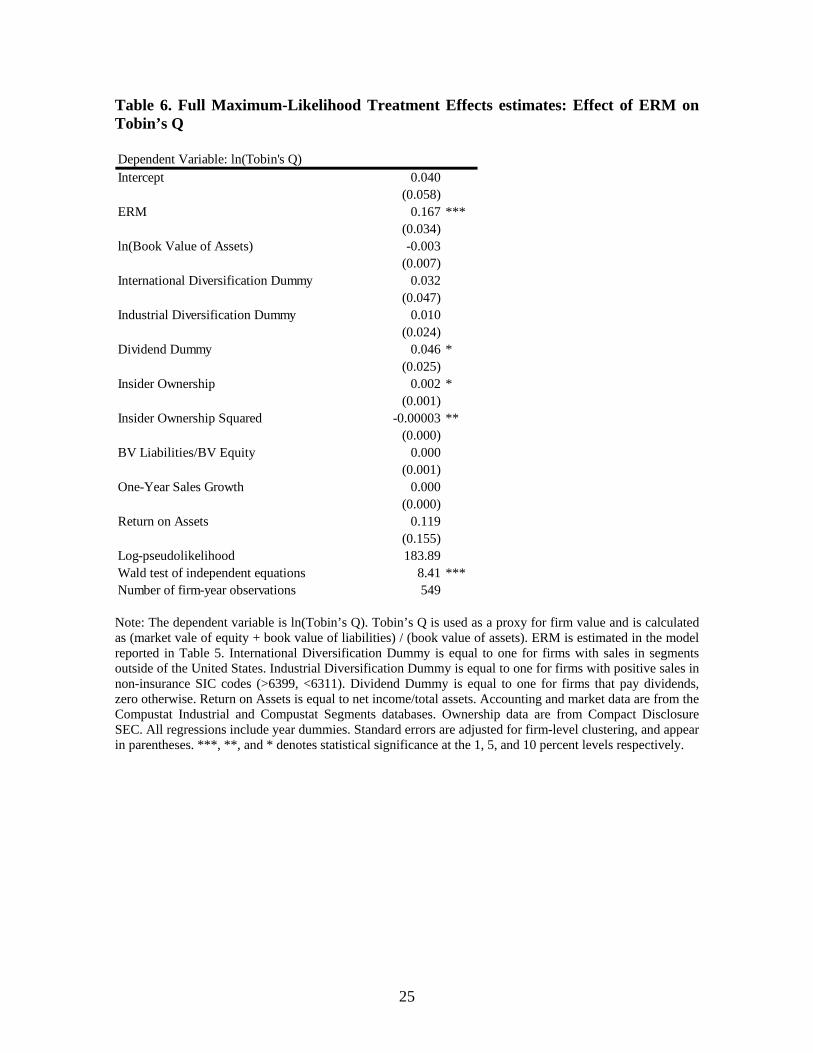
Table 6. Full Maximum-Likelihood Treatment Effects estimates: Effect of ERM on Tobin’s Q Dependent Variable: ln(Tobin's Q)Intercept 0.040
(0.058)ERM 0.167 ***
(0.034)ln(Book Value of Assets) -0.003
(0.007)International Diversification Dummy 0.032
(0.047)Industrial Diversification Dummy 0.010
(0.024)Dividend Dummy 0.046 *
(0.025)Insider Ownership 0.002 *
(0.001)Insider Ownership Squared -0.00003 **
(0.000)BV Liabilities/BV Equity 0.000
(0.001)One-Year Sales Growth 0.000
(0.000)Return on Assets 0.119
(0.155)Log-pseudolikelihood 183.89Wald test of independent equations 8.41 ***Number of firm-year observations 549 Note: The dependent variable is ln(Tobin’s Q). Tobin’s Q is used as a proxy for firm value and is calculated as (market vale of equity + book value of liabilities) / (book value of assets). ERM is estimated in the model reported in Table 5. International Diversification Dummy is equal to one for firms with sales in segments outside of the United States. Industrial Diversification Dummy is equal to one for firms with positive sales in non-insurance SIC codes (>6399, <6311). Dividend Dummy is equal to one for firms that pay dividends, zero otherwise. Return on Assets is equal to net income/total assets. Accounting and market data are from the Compustat Industrial and Compustat Segments databases. Ownership data are from Compact Disclosure SEC. All regressions include year dummies. Standard errors are adjusted for firm-level clustering, and appear in parentheses. ***, **, and * denotes statistical significance at the 1, 5, and 10 percent levels respectively.
25