Embed Size (px)
Citation preview
Last Modified 4/22/2015
V-1-1
V-1. Reinforced Concrete Failure Mechanisms
Key Concepts and Factors Affecting Risks
This section discusses the failure mechanisms of reinforced concrete members such as
spillway piers, walls, slabs, and buttresses. The following are presented: 1) factors
influencing the strength and stability of the reinforced concrete sections, 2)
considerations when assigning failure probabilities based on structural analysis results, 3)
considerations related to National codes (such as ACI or AASHTO) in the risk context,
and 4) a typical event tree of the failure progression.
Factors Influencing Strength and Stability Factors influencing the stability of reinforced sections include:
geometry and support conditions of the section,
material properties of the reinforcement,
material properties of the concrete,
amount and detailing of the reinforcement,
type and duration of loading, and
location of the reinforced concrete members relative to the entire structure
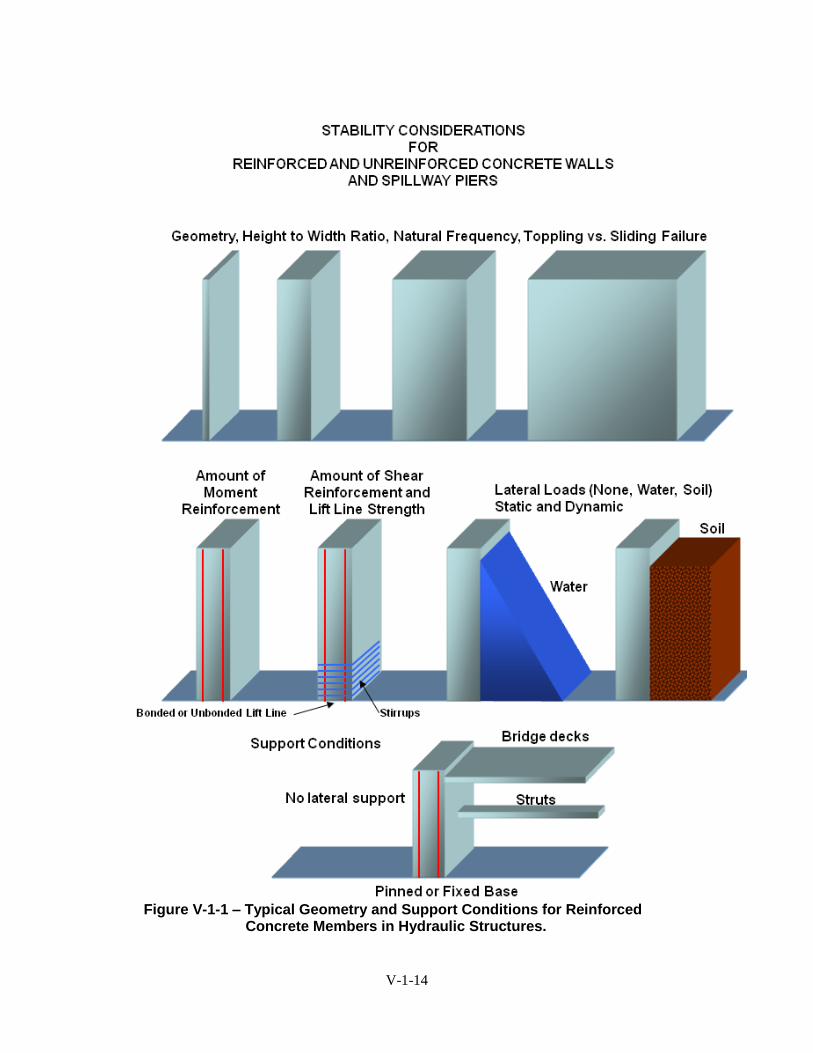
Geometry and Support Conditions As illustrated in Figure V-1-1, reinforced concrete sections in hydraulic structures vary
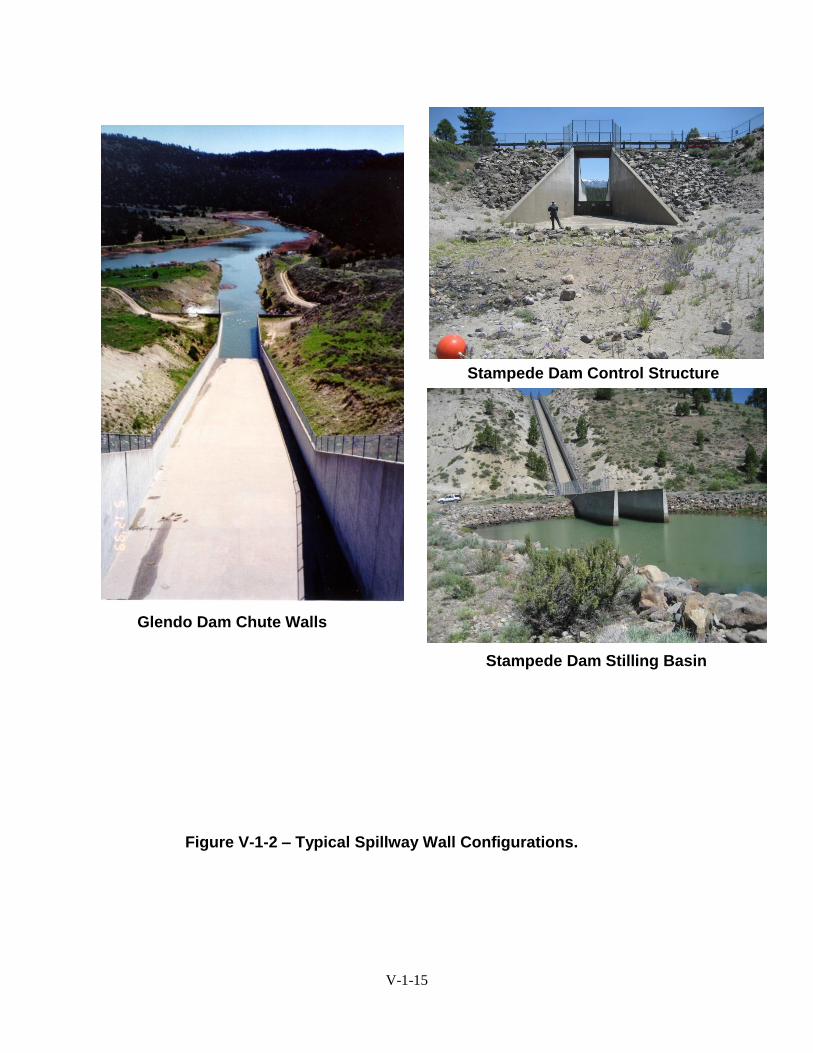
greatly in size and shape. Spillway walls can be very tall and narrow as shown on Figure
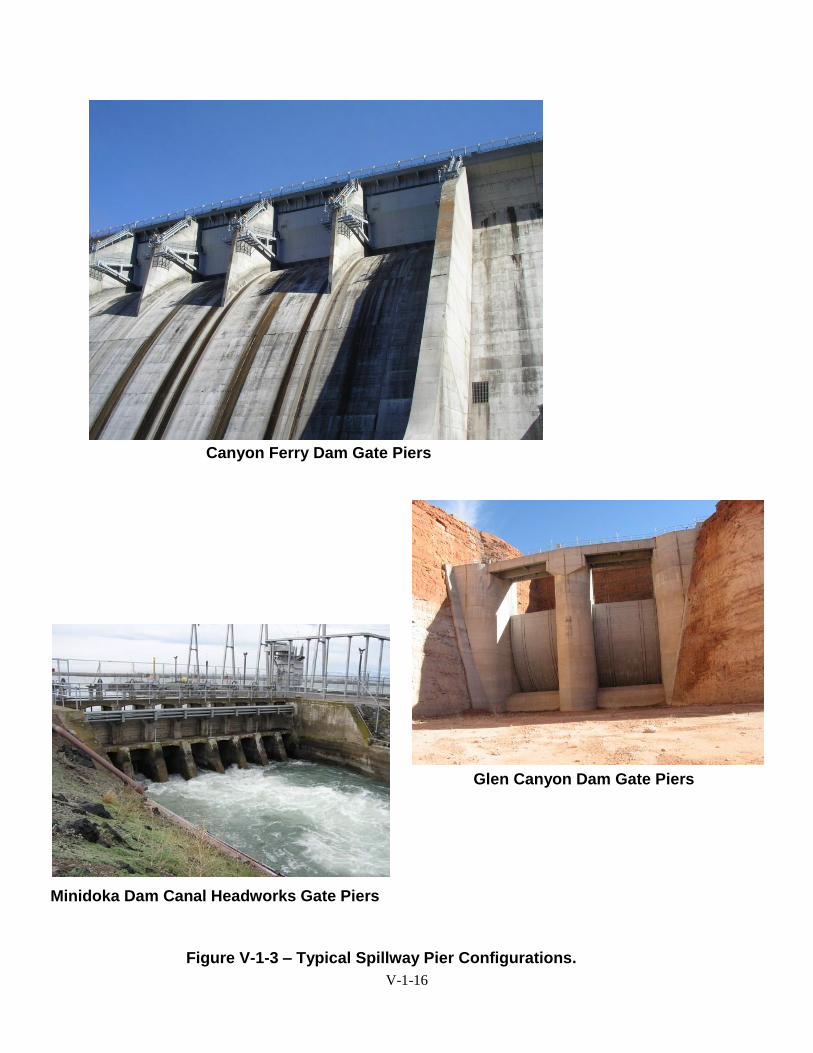
V-1-2. Spillway piers tend to be shorter and wider than walls as shown on Figure V-1-3.
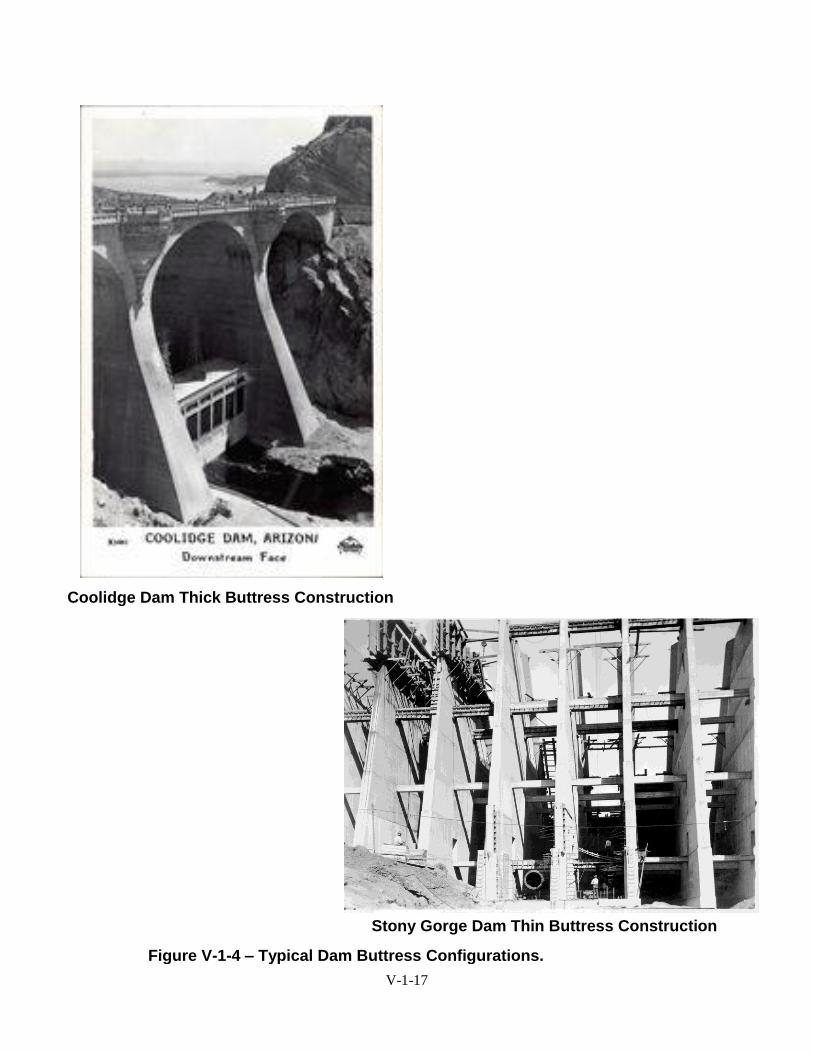
Buttresses in buttress dams can vary from very thin tall sections like at Stony Gorge Dam
to more stout sections like at Coolidge Dam as shown on Figure V-1-4. The geometry of
the concrete section has a large impact on how the section may fail. As a rule of thumb,
sections with height to thickness ratios of 4:1 or less tend to slide more than rotate or
bend while sections with height to width ratios more than 4:1 tend to bend, rotate and
topple (4:1 ratio based on deep beam criteria in ACI Code 318).
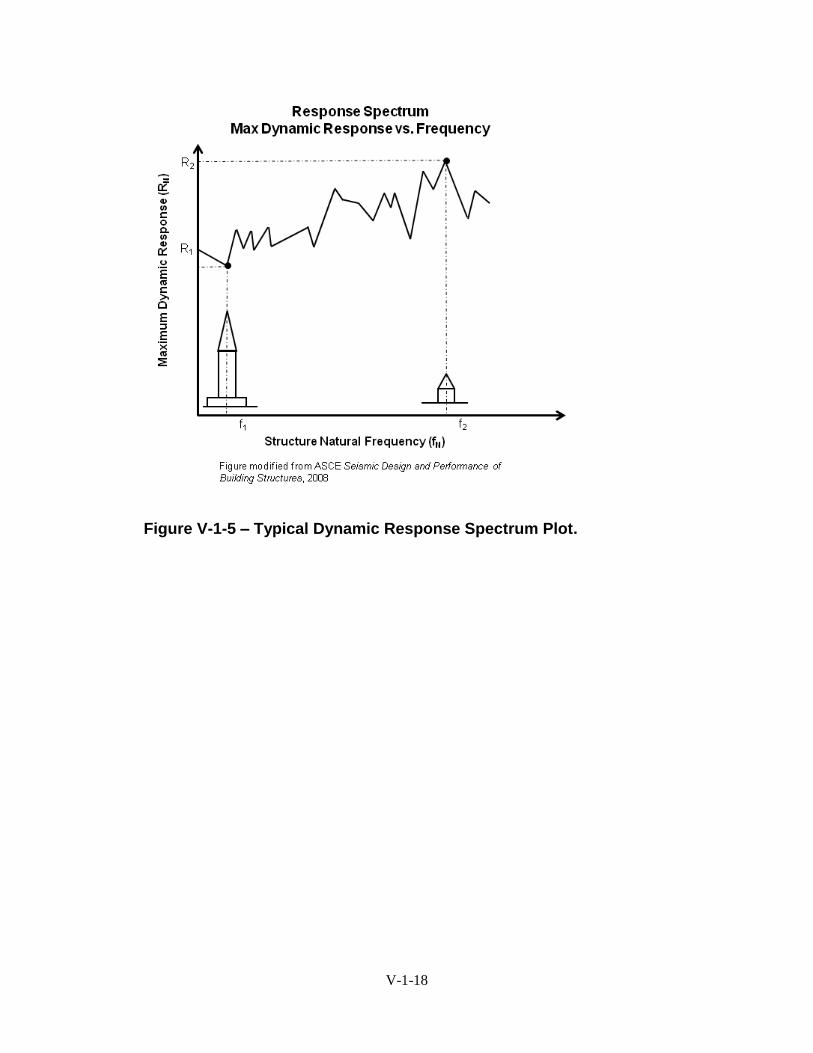
Structures have definite, signature dynamic characteristics. The geometry greatly affects
the natural frequency of the reinforced concrete member and how the frequency content
of an earthquake ground motion matches up with the natural frequency of the member.
The natural frequency of the member decreases as the height to width ratio increases. In
other words, the section becomes more flexible as the section becomes taller and thinner
as shown on Figure V-1-5.
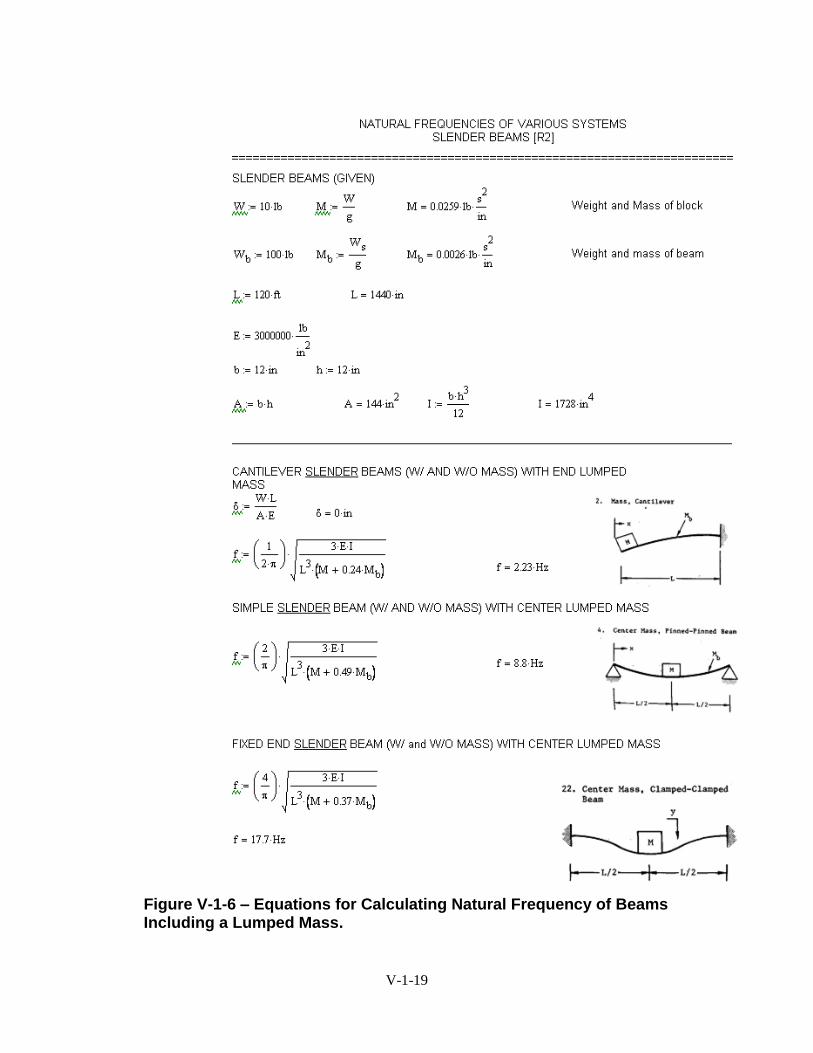
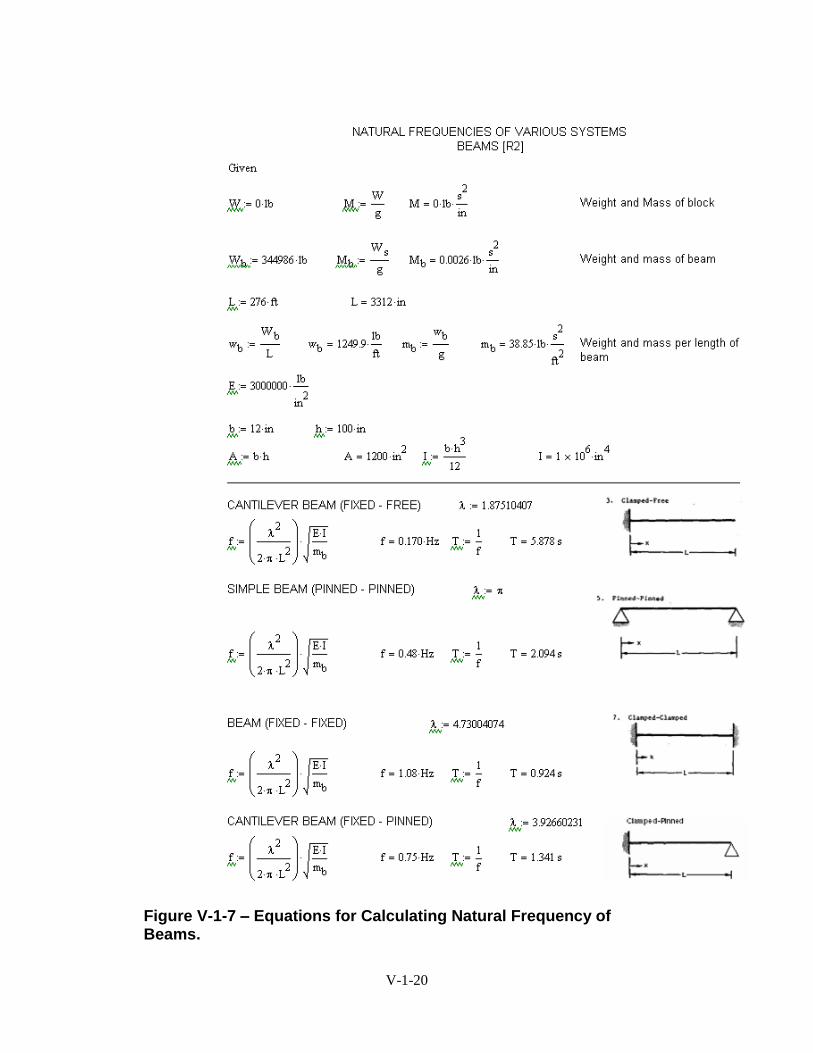
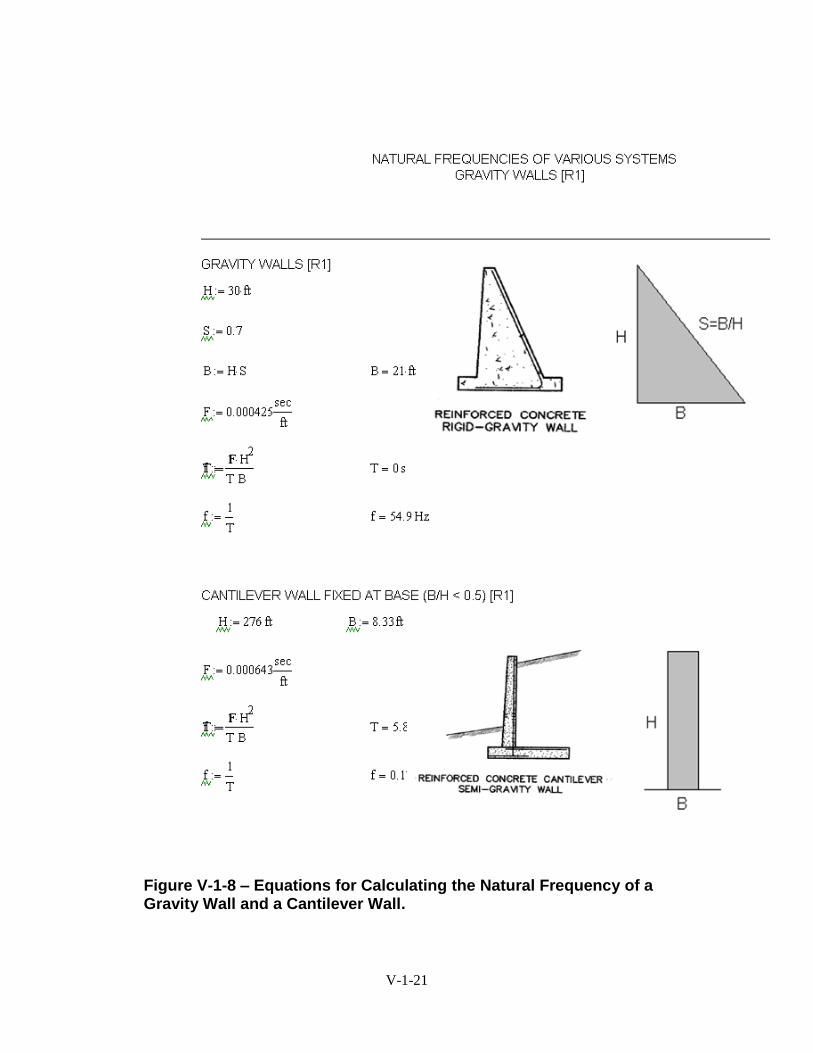
Figures V-1-6 through V-1-8 provide useful equations to compute the natural frequencies
of various concrete structures. As a check, the natural frequency of the member should
be compared to the acceleration response spectra at 5 percent damping to judge how
seismic loads may amplify through the section. For example, a concrete member with a
natural frequency of 3 Hz on a rock site might have significant amplification of the
seismic load from the base to the top of the section. If the structure cracks, a reduced
V-1-2
modulus (typically 1/3 the uncracked modulus) can be used to get a sense as to how the
amplification might change.
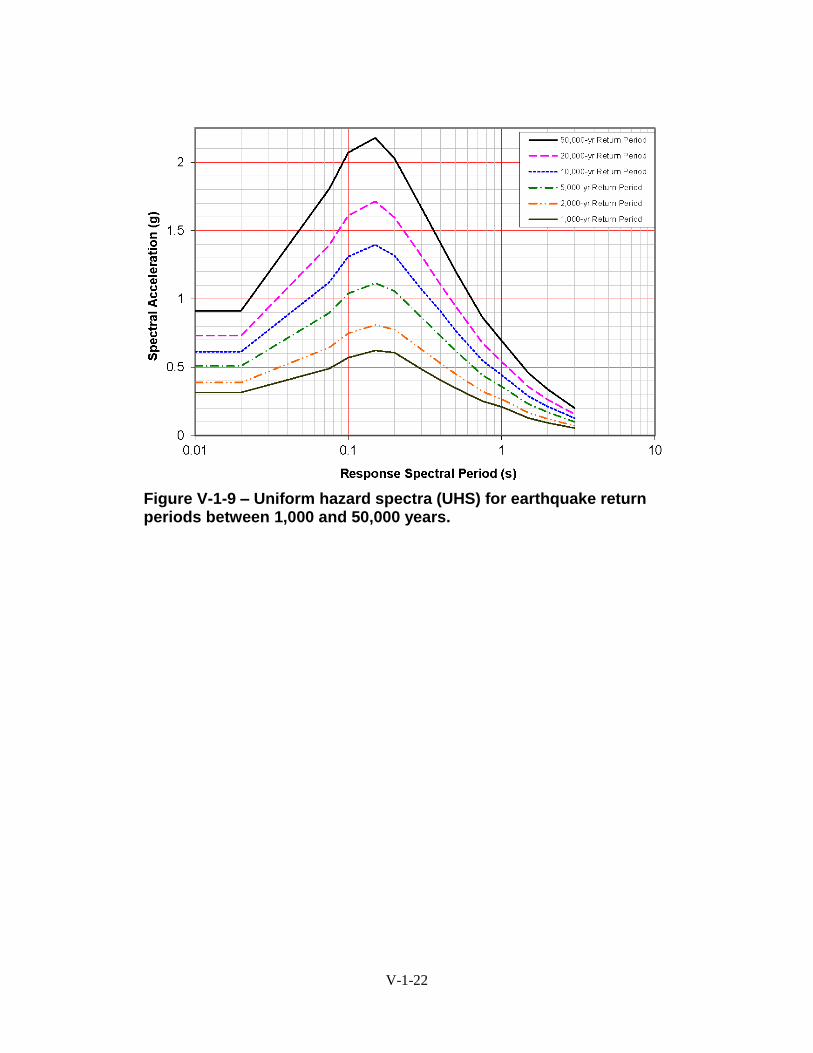
Often times if a site specific probabilistic seismic hazard analysis (PSHA) is performed, a
uniform hazard spectra similar to the one shown on Figure V-1-9 is developed that can be
conservatively used for the purpose of estimating structural acceleration response based
on a computed or estimated fundamental structural return period.
Foundation support conditions can greatly influence the dynamic response of a structure.
The dynamic responses of a structure founded on rock will be different than the dynamic
response of the same structure to the same earthquake if it is founded on soil. Design
criteria in structural design codes reflect this difference in the form of site classifications.
Structures founded on the top of dams must be evaluated considering amplification of
earthquake ground motions through the dam.
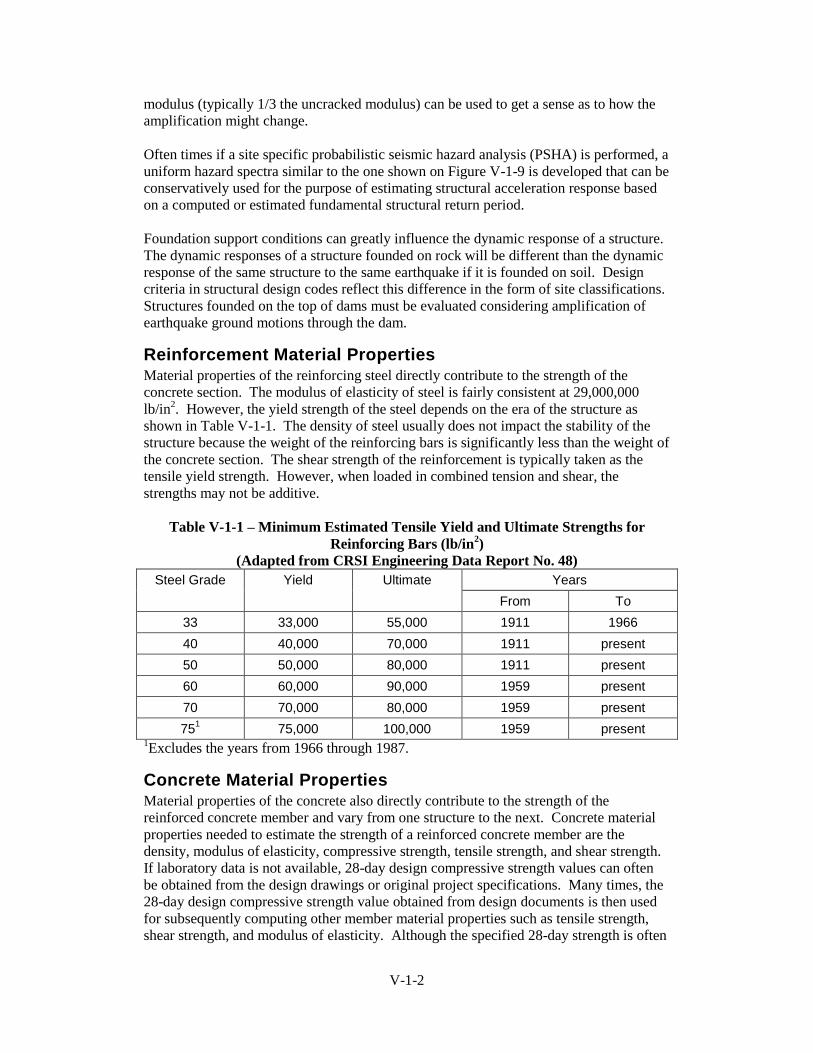
Reinforcement Material Properties Material properties of the reinforcing steel directly contribute to the strength of the
concrete section. The modulus of elasticity of steel is fairly consistent at 29,000,000
lb/in2. However, the yield strength of the steel depends on the era of the structure as
shown in Table V-1-1. The density of steel usually does not impact the stability of the
structure because the weight of the reinforcing bars is significantly less than the weight of
the concrete section. The shear strength of the reinforcement is typically taken as the
tensile yield strength. However, when loaded in combined tension and shear, the
strengths may not be additive.
Table V-1-1 – Minimum Estimated Tensile Yield and Ultimate Strengths for
Reinforcing Bars (lb/in2)
(Adapted from CRSI Engineering Data Report No. 48)
Steel Grade Yield Ultimate Years
From To
33 33,000 55,000 1911 1966
40 40,000 70,000 1911 present
50 50,000 80,000 1911 present
60 60,000 90,000 1959 present
70 70,000 80,000 1959 present
751 75,000 100,000 1959 present
1Excludes the years from 1966 through 1987.
Concrete Material Properties Material properties of the concrete also directly contribute to the strength of the
reinforced concrete member and vary from one structure to the next. Concrete material
properties needed to estimate the strength of a reinforced concrete member are the
density, modulus of elasticity, compressive strength, tensile strength, and shear strength.
If laboratory data is not available, 28-day design compressive strength values can often
be obtained from the design drawings or original project specifications. Many times, the
28-day design compressive strength value obtained from design documents is then used
for subsequently computing other member material properties such as tensile strength,
shear strength, and modulus of elasticity. Although the specified 28-day strength is often
V-1-3
considered to be a conservative estimate for the existing strength of a reinforced concrete
member, reference tools are available to estimate adjustments to the 28-day design
compressive strength to better represent the existing concrete compressive strength.
These reference tools should be used carefully taking into account the original curing
conditions, the prevalent environmental conditions over the life of the structure, and the
observed condition of the concrete.
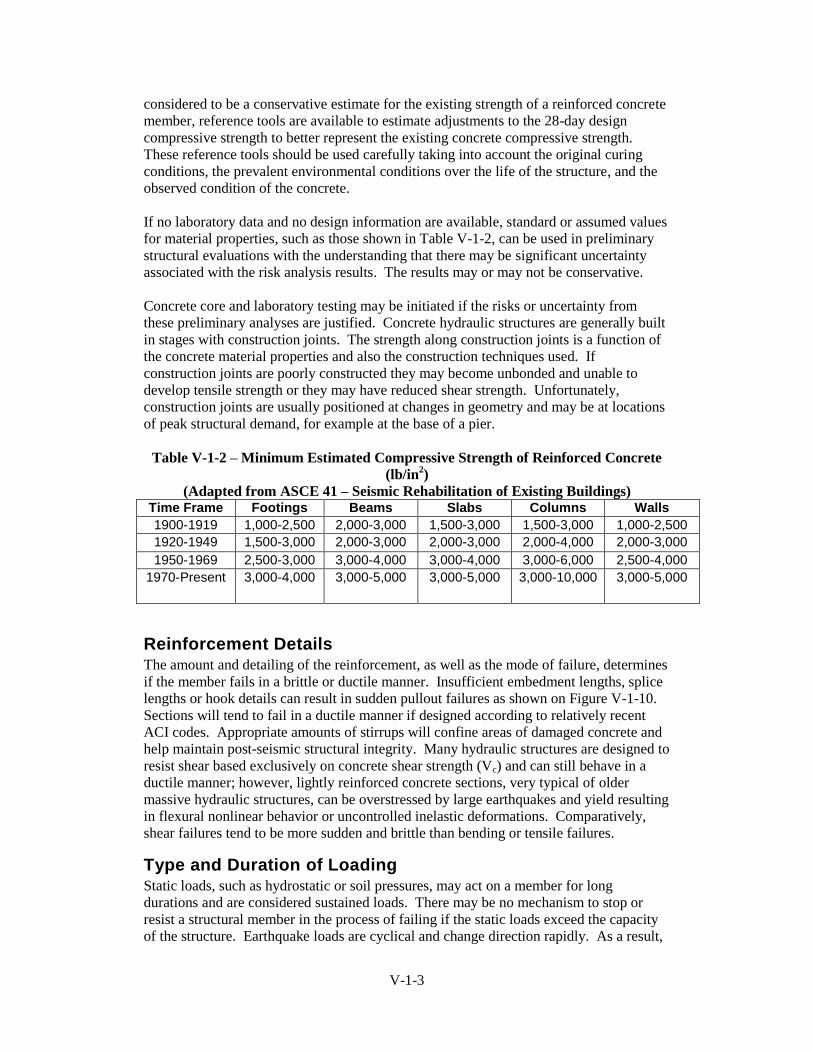
If no laboratory data and no design information are available, standard or assumed values
for material properties, such as those shown in Table V-1-2, can be used in preliminary
structural evaluations with the understanding that there may be significant uncertainty
associated with the risk analysis results. The results may or may not be conservative.
Concrete core and laboratory testing may be initiated if the risks or uncertainty from
these preliminary analyses are justified. Concrete hydraulic structures are generally built
in stages with construction joints. The strength along construction joints is a function of
the concrete material properties and also the construction techniques used. If
construction joints are poorly constructed they may become unbonded and unable to
develop tensile strength or they may have reduced shear strength. Unfortunately,
construction joints are usually positioned at changes in geometry and may be at locations
of peak structural demand, for example at the base of a pier.
Table V-1-2 – Minimum Estimated Compressive Strength of Reinforced Concrete
(lb/in2)
(Adapted from ASCE 41 – Seismic Rehabilitation of Existing Buildings) Time Frame Footings Beams Slabs Columns Walls
1900-1919 1,000-2,500 2,000-3,000 1,500-3,000 1,500-3,000 1,000-2,500
1920-1949 1,500-3,000 2,000-3,000 2,000-3,000 2,000-4,000 2,000-3,000
1950-1969 2,500-3,000 3,000-4,000 3,000-4,000 3,000-6,000 2,500-4,000
1970-Present 3,000-4,000 3,000-5,000 3,000-5,000 3,000-10,000 3,000-5,000
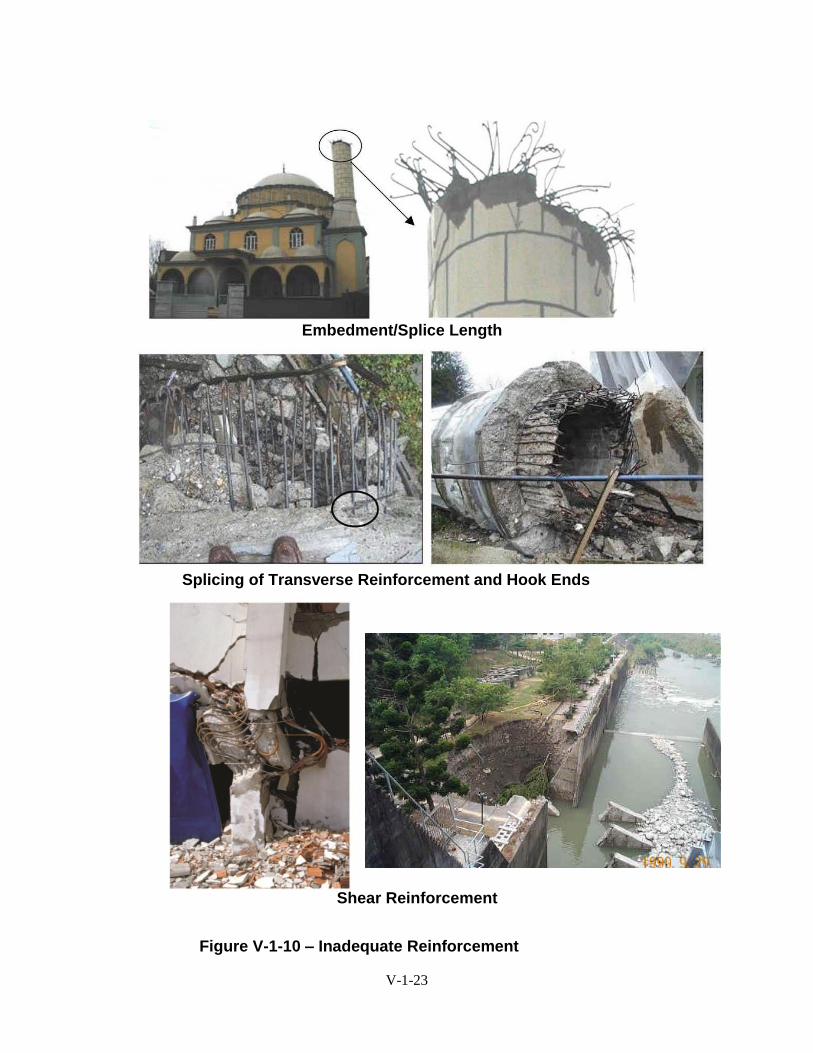
Reinforcement Details The amount and detailing of the reinforcement, as well as the mode of failure, determines
if the member fails in a brittle or ductile manner. Insufficient embedment lengths, splice
lengths or hook details can result in sudden pullout failures as shown on Figure V-1-10.
Sections will tend to fail in a ductile manner if designed according to relatively recent
ACI codes. Appropriate amounts of stirrups will confine areas of damaged concrete and
help maintain post-seismic structural integrity. Many hydraulic structures are designed to
resist shear based exclusively on concrete shear strength (Vc) and can still behave in a
ductile manner; however, lightly reinforced concrete sections, very typical of older
massive hydraulic structures, can be overstressed by large earthquakes and yield resulting
in flexural nonlinear behavior or uncontrolled inelastic deformations. Comparatively,
shear failures tend to be more sudden and brittle than bending or tensile failures.
Type and Duration of Loading Static loads, such as hydrostatic or soil pressures, may act on a member for long
durations and are considered sustained loads. There may be no mechanism to stop or
resist a structural member in the process of failing if the static loads exceed the capacity
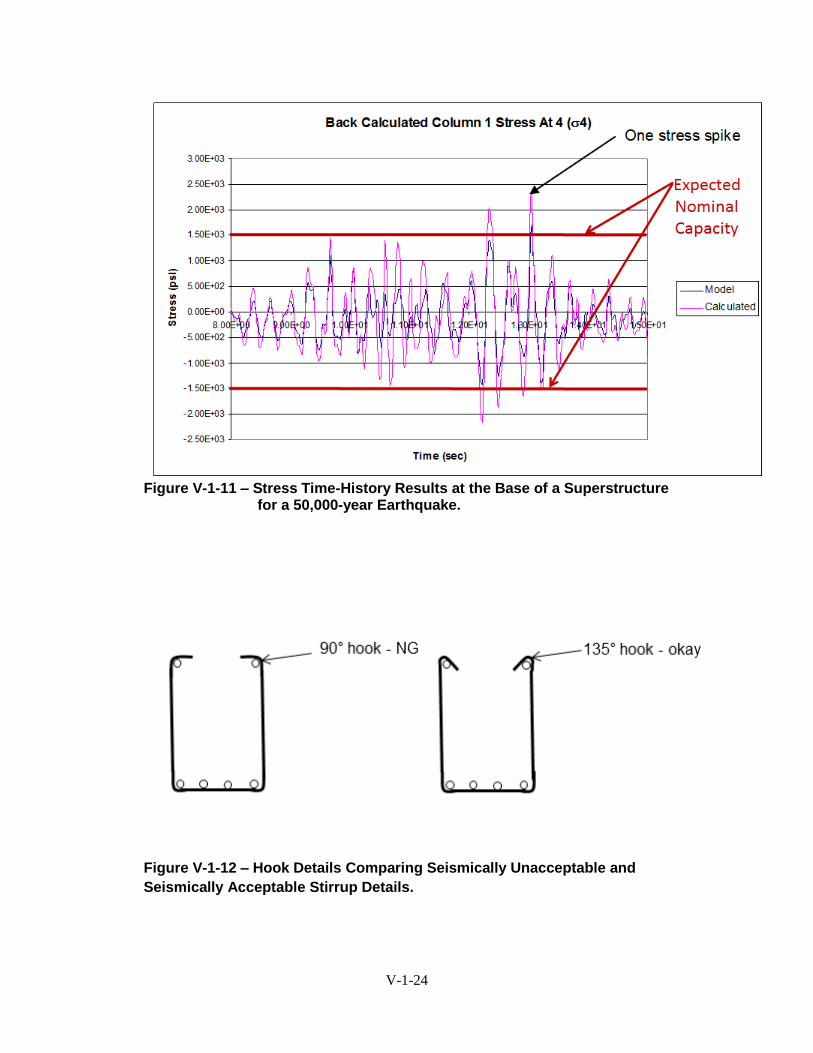
of the structure. Earthquake loads are cyclical and change direction rapidly. As a result,
V-1-4
sections may not crack through the member thickness even though the tensile capacity is
exceeded for short durations. As shown on Figure V-1-11, the seismic load may not have
sufficient duration or have enough significant stress peaks to completely strain a section
to failure if it cracks through; or as the section cracks and changes frequency, the
response of the structure may change the seismic loads and failure potential. Post-
seismic stability must consider the ability of a damaged section to carry static loads.
Structural System Considerations The location and support conditions of the member within the structural system can affect
the seismic internal forces acting on the section under investigation and the response of
the member. Structural systems that perform well during earthquakes have the ability to
dissipate energy through inelastic deformation and have the ability to redistribute loads to
elsewhere in the system. In fact, new seismic design details often incorporate the
concept of forced plastic hinging at specific locations in the system for the purpose of
dissipating energy and redistributing loads within the system. However, representative
hydraulic structures such as spillway walls and piers are generally not highly redundant
structures.
Considerations for Analysis Results
While typical hydraulic structures are not necessarily highly redundant structural
systems, they do tend to be very large and massive structures. As a result, when
evaluating the potential for and degree of overstress, it is important to look at the
structure as a whole, and not just focus on a localized maximum value. Judgment may be
required to select representative demand/capacity ratios that represent the overall
structural component response. Linear elastic finite element analyses may give local
overstress values that do not account for additional deflection of a cracked or yielded
section. Cracking and straining of reinforcement may result in redistribution of load to
other areas of large members. Displacement criteria should be used to evaluate inelastic
behavior of reinforced concrete members.
National Codes
National codes like ACI, Caltrans, or AASHTO should be used to compute the capacity
of existing reinforced concrete sections with caution. If a new structure is being
designed, φ factors and load factors are applied to develop levels of certainty and factors
of safety. In risk analyses for existing reinforced concrete structures, it is desirable to
compute the capacity of the sections without φ factors and get the “true” expected
capacity of the section without extra conservatism. In addition, member demands should
be computed without load factors for evaluating risks and determining demand-capacity
ratios. Then during the risk analyses team members should consider the condition of the
concrete and reinforcement based on the era of construction, severity of the environment,
deterioration due to alkali-aggregate reaction, freeze-thaw, and corrosion. In addition, the
strength equations provided in National codes like ACI assume ductile sections with
reinforcement details consistent with detailing requirements specified within the code
including lap splices, confining reinforcement and anchorage of ties and hooks. As an
example, many older spillway bridge deck beams utilize stirrups for shear reinforcement
with 90-degree hooks that would be considered inadequate based on the seismic code
requirement for 135-degree hooks as illustrated in Figure V-1-12. In situations where
reinforcement detailing is insufficient based on current standards, codes specifically
V-1-5
written for evaluation of existing structures such as ASCE 31-Seismic Evaluations of
Existing Buildings may be used to determine the capacity of a member with inadequate
reinforcement details.
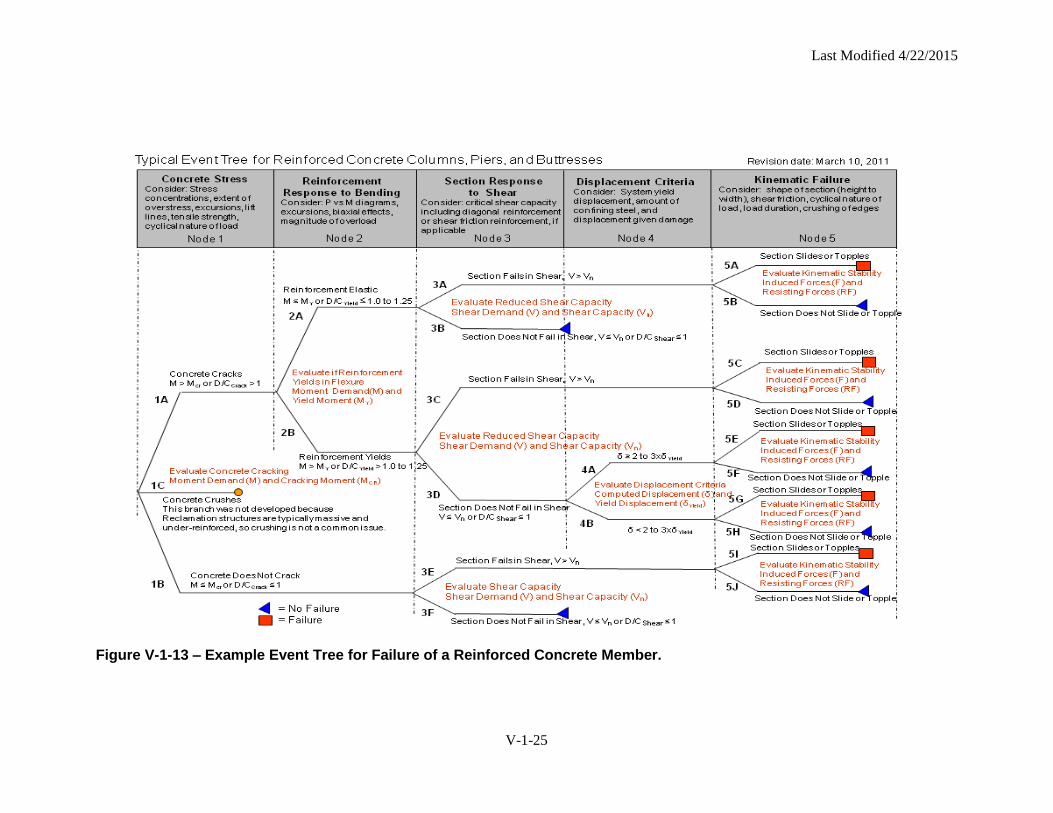
Event tree
An example event tree for the potential failure of a reinforced concrete section is shown
in Figure V-1-13. The initiating loads potentially causing the failure are not shown and
would typically be included on the front end of the tree to capture the probability of the
load occurring.
Node 1 – Concrete Stress Node 1 of the event tree evaluates the probability that the concrete might crack in tension
or crush in compression. The tensile strength of concrete is discussed in the section on
Risk Analysis for Concrete Gravity Dams. The tensile stresses induced on the section
under investigation are compared to the tensile strength of the concrete. The dynamic
tensile strength of concrete is measured using the splitting tensile test loaded to failure
within a time of 0.05 seconds and is then adjusted in accordance with the guidelines
provided in the section on Risk Analysis for Concrete Gravity Dams. This is typically
the time for a stress spike during an earthquake to go from zero to maximum tension.
The tensile strength of the concrete is compared to the magnitude of the computed tensile
stresses, the number of excursions above certain values, and the area of the section being
overstressed. A few localized excursions of overstress may not significantly crack the
concrete over a large enough area to result in structural distress and potentially a brittle
failure mechanism.
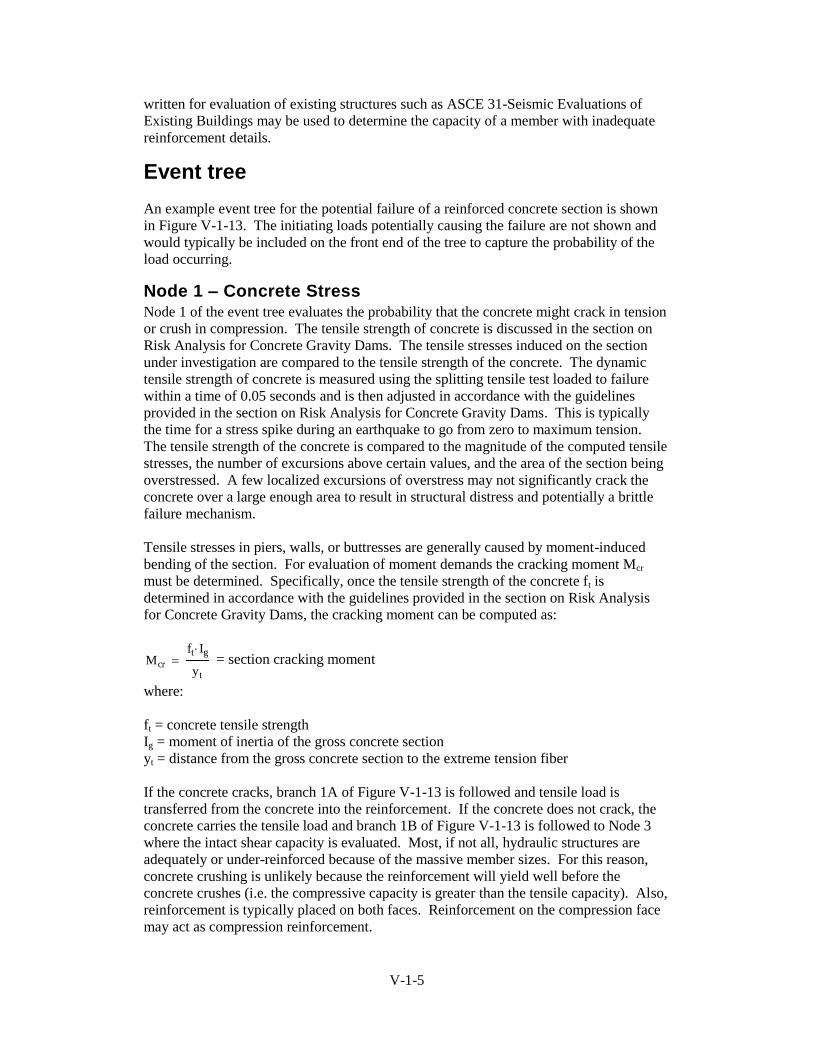
Tensile stresses in piers, walls, or buttresses are generally caused by moment-induced
bending of the section. For evaluation of moment demands the cracking moment Mcr
must be determined. Specifically, once the tensile strength of the concrete ft is
determined in accordance with the guidelines provided in the section on Risk Analysis
for Concrete Gravity Dams, the cracking moment can be computed as:
= section cracking moment
where:
ft = concrete tensile strength
Ig = moment of inertia of the gross concrete section
yt = distance from the gross concrete section to the extreme tension fiber
If the concrete cracks, branch 1A of Figure V-1-13 is followed and tensile load is
transferred from the concrete into the reinforcement. If the concrete does not crack, the
concrete carries the tensile load and branch 1B of Figure V-1-13 is followed to Node 3
where the intact shear capacity is evaluated. Most, if not all, hydraulic structures are
adequately or under-reinforced because of the massive member sizes. For this reason,
concrete crushing is unlikely because the reinforcement will yield well before the
concrete crushes (i.e. the compressive capacity is greater than the tensile capacity). Also,
reinforcement is typically placed on both faces. Reinforcement on the compression face
may act as compression reinforcement.
Mcr
ft Ig
yt
V-1-6
Node 2 – Reinforcement Response to Bending Node 2 of the event tree evaluates the possibility of the reinforcing steel yielding given
that the concrete cracks. At this node there are two possible paths: either the
reinforcement can carry the load and not yield along branch 2A or the reinforcement
yields along branch 2B. These likelihoods need to add to 1.0.
The first task for evaluating this node is to identify the yield strength of the reinforcement
and the detailing of the reinforcement for the section under investigation. Locate as-built
drawings, records of design and construction, the design specifications, and laboratory
testing results. If these are not available, Table V-1-1 and Table V-1-2 gives some
guidance on possible strengths of reinforcing steel and concrete, respectively, given the
age of the structure..
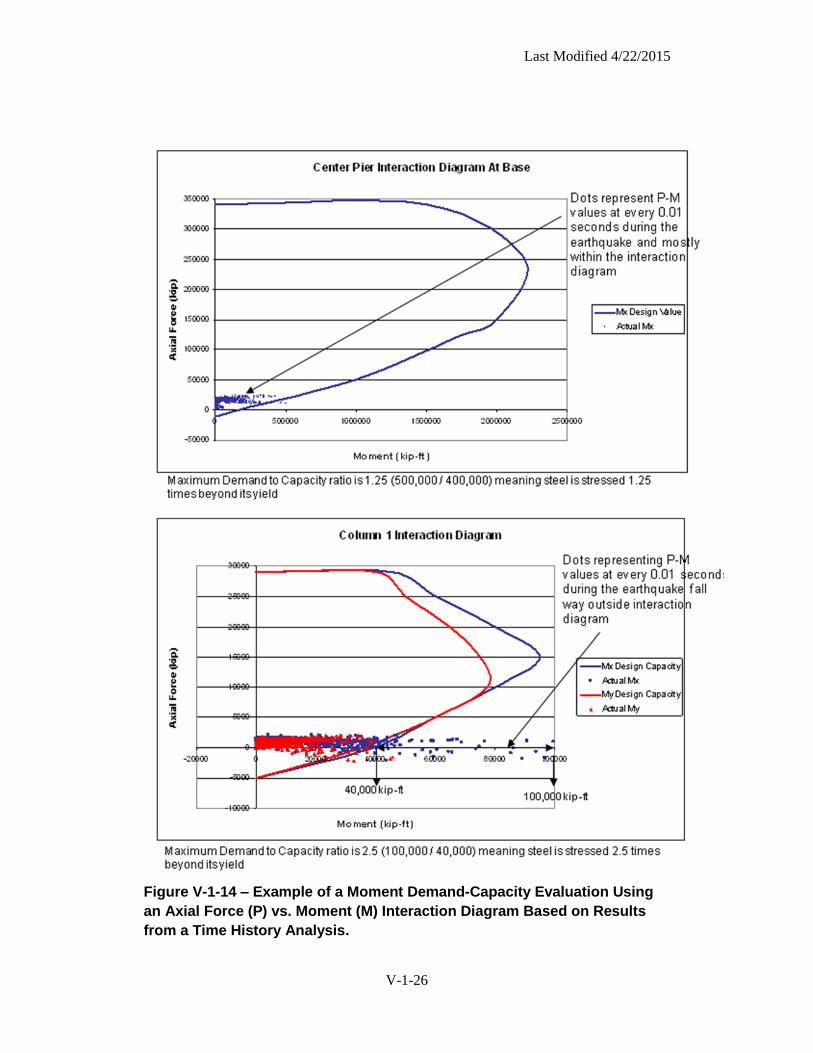
The second task is to compute the moment capacity of the section as a function of axial
load (P) and moment (M) represented on a P-M diagram as shown on Figure V-1-14.
The P and M demands are plotted on the P-M diagram to determine if the loading
exceeds the nominal capacity of the section. During seismic loading, biaxial bending is
considered and not just bending along the major and minor axes of the member. If the
member is analyzed using finite elements with shell elements or analyzed by hand
calculations, P and M demands are produced and compared to the P-M capacity
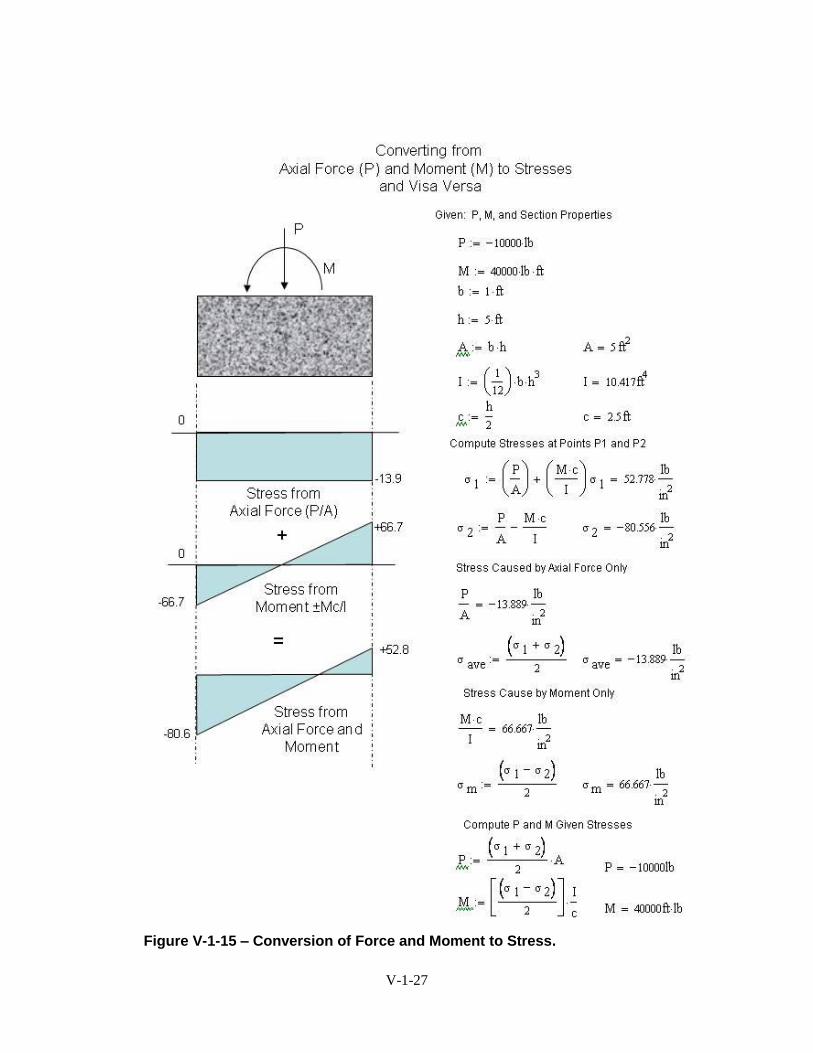
diagrams. If the member is analyzed using solid finite elements, stresses are output.
These stresses need to be converted to P and M values as shown in Figure V-1-15 and
then plotted on the P-M diagram. The top graph in Figure V-1-14 shows a section that is
slightly overstressed beyond its nominal yield capacity (maximum moment D/C ratio =
1.25). A moment D/C ratio of 1.25 indicates the stress in the reinforcement is 1.25 times
greater than the yield capacity of the reinforcement. The bottom graph of Figure V-1-14
shows a section that is clearly stressed beyond its nominal yield capacity by a factor of
2.5 (maximum moment D/C ratio = 2.5).
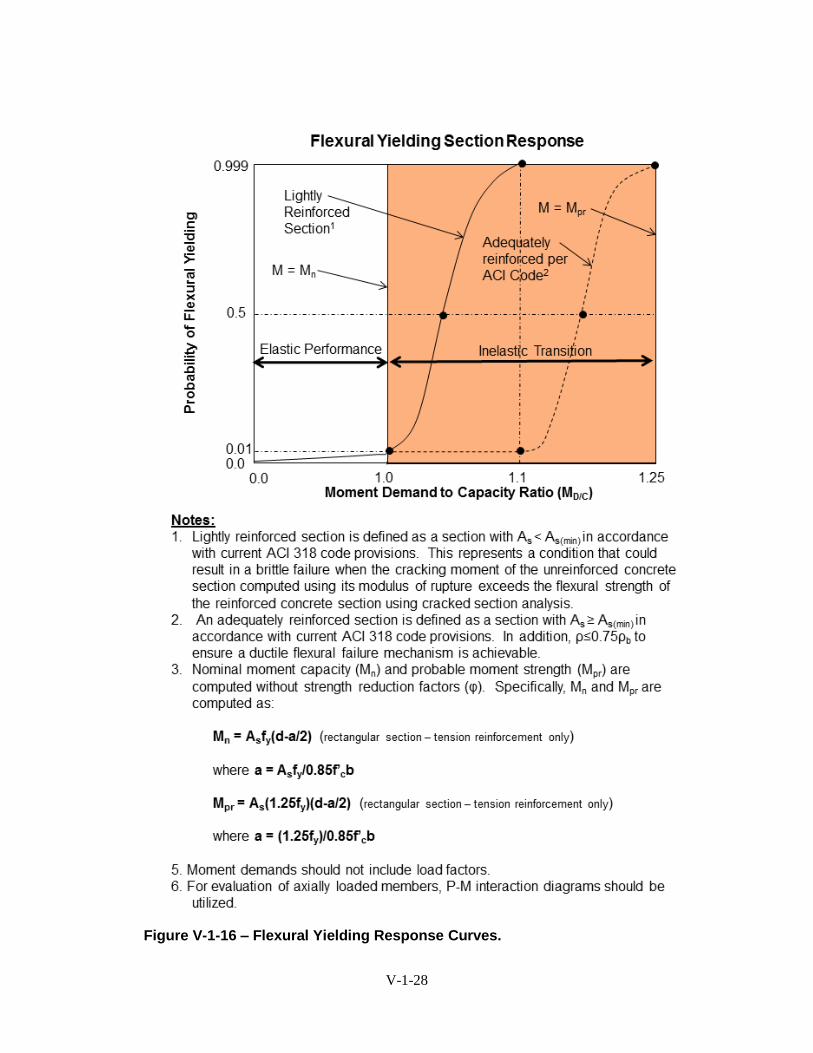
Figure V-1-16 shows example response curves that may be used at Node 2 as a starting
point for estimating the likelihood of various flexural responses of the reinforcement.
Similar curves or adjustments to the curves provided on Figure V-1-16 can be developed
by the risk analysis team and should account for site-specific conditions and the
experience of the risk analysis team members. As stated previously, the demand/capacity
ratios referenced in Figure V-1-16 are computed without strength reduction () factors
and load factors suggested by the ACI code. Specifically, it is desirable to compute the
“true” capacity of the members without adding conservatism in the computations. This
way the risk teams can make judgments on the strength of the members and then
incorporate factors such as concrete deterioration, age of concrete, era of construction,
corrosion, spalling, and environmental issues. For the example flexural yielding section
response curves indicated on Figure V-1-16, moment D/C ratios of 1.0 or less for lightly
reinforced sections and 1.1 or less for adequately reinforced sections indicate it is very
unlikely that the reinforcement has yielded.
The lightly reinforced section curve shown on Figure V-1-16 represents the case where
the section is lightly reinforced compared to current code requirements and formation of
a fully yielded section (plastic hinge) is possible at smaller demand/capacity ratios and is
typical of many older hydraulic structures. Lightly reinforced means that the
reinforcement was not adequately designed to carry the induced moment, the amount of
steel is less than the minimum required by code (Asmin), or the moment capacity of the
V-1-7
reinforced section is less than the cracking moment capacity of the concrete. This might
be the case for a spillway pier that has only temperature and shrinkage reinforcement
along the sides of the pier resisting the moment induced by cross-canyon seismic loads.
Or this might be the case when the tensile strength of the concrete alone results in a
moment capacity greater than the moment capacity of the reinforced section. This can
cause a brittle failure when the concrete cracks and moment demands are transferred
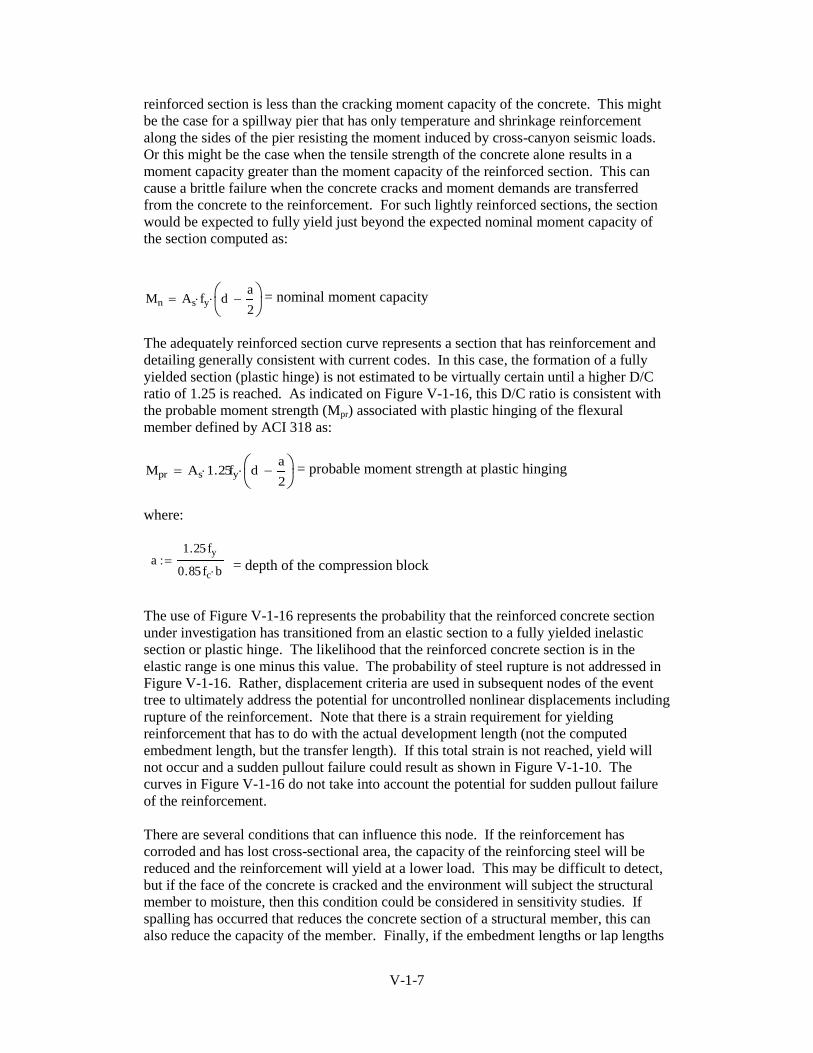
from the concrete to the reinforcement. For such lightly reinforced sections, the section
would be expected to fully yield just beyond the expected nominal moment capacity of
the section computed as:
= nominal moment capacity
The adequately reinforced section curve represents a section that has reinforcement and
detailing generally consistent with current codes. In this case, the formation of a fully
yielded section (plastic hinge) is not estimated to be virtually certain until a higher D/C
ratio of 1.25 is reached. As indicated on Figure V-1-16, this D/C ratio is consistent with
the probable moment strength (Mpr) associated with plastic hinging of the flexural
member defined by ACI 318 as:
= probable moment strength at plastic hinging
where:
= depth of the compression block
The use of Figure V-1-16 represents the probability that the reinforced concrete section
under investigation has transitioned from an elastic section to a fully yielded inelastic
section or plastic hinge. The likelihood that the reinforced concrete section is in the
elastic range is one minus this value. The probability of steel rupture is not addressed in
Figure V-1-16. Rather, displacement criteria are used in subsequent nodes of the event
tree to ultimately address the potential for uncontrolled nonlinear displacements including
rupture of the reinforcement. Note that there is a strain requirement for yielding
reinforcement that has to do with the actual development length (not the computed
embedment length, but the transfer length). If this total strain is not reached, yield will
not occur and a sudden pullout failure could result as shown in Figure V-1-10. The
curves in Figure V-1-16 do not take into account the potential for sudden pullout failure
of the reinforcement.
There are several conditions that can influence this node. If the reinforcement has
corroded and has lost cross-sectional area, the capacity of the reinforcing steel will be
reduced and the reinforcement will yield at a lower load. This may be difficult to detect,
but if the face of the concrete is cracked and the environment will subject the structural
member to moisture, then this condition could be considered in sensitivity studies. If
spalling has occurred that reduces the concrete section of a structural member, this can
also reduce the capacity of the member. Finally, if the embedment lengths or lap lengths
Mn As fy da
2
Mpr As 1.25 fy da
2
a1.25 fy
0.85 fc b
V-1-8
of the reinforcing bars are not adequate to fully develop the strength of the bars, the
reinforcement may debond and fail at a load that is less than what would have occurred
with adequate embedment length or lap length.
Node 3 – Section Response to Shear Node 3 of the event tree evaluates the shear failure of the section. Nodes 3A and 3B
evaluate the potential for the section to shear given a cracked section but with the
reinforcement stressed below the elastic limit. If the section fails in shear the section is
then evaluated along branch 3A for kinematic instability (see below). Nodes 3C and 3D
evaluate the potential for shear failure given a cracked concrete section where the
moment steel has yielded. The shear capacity of this section is less than the section in
Node 3A and 3B because the concrete section has cracked resulting in a potentially
reduced shear capacity and reinforcement that has yielded. Nodes 3E and 3F represent
the shear strength of a concrete section that has not cracked due to bending and the
reinforcement has not yielded. This section has the highest shear capacity of all the Node
3 possibilities because the concrete is intact and the reinforcement has not yielded. If any
of the Node 3 sections fail in shear, the branches proceed to evaluating the kinematic
instability of the section in Node 5.
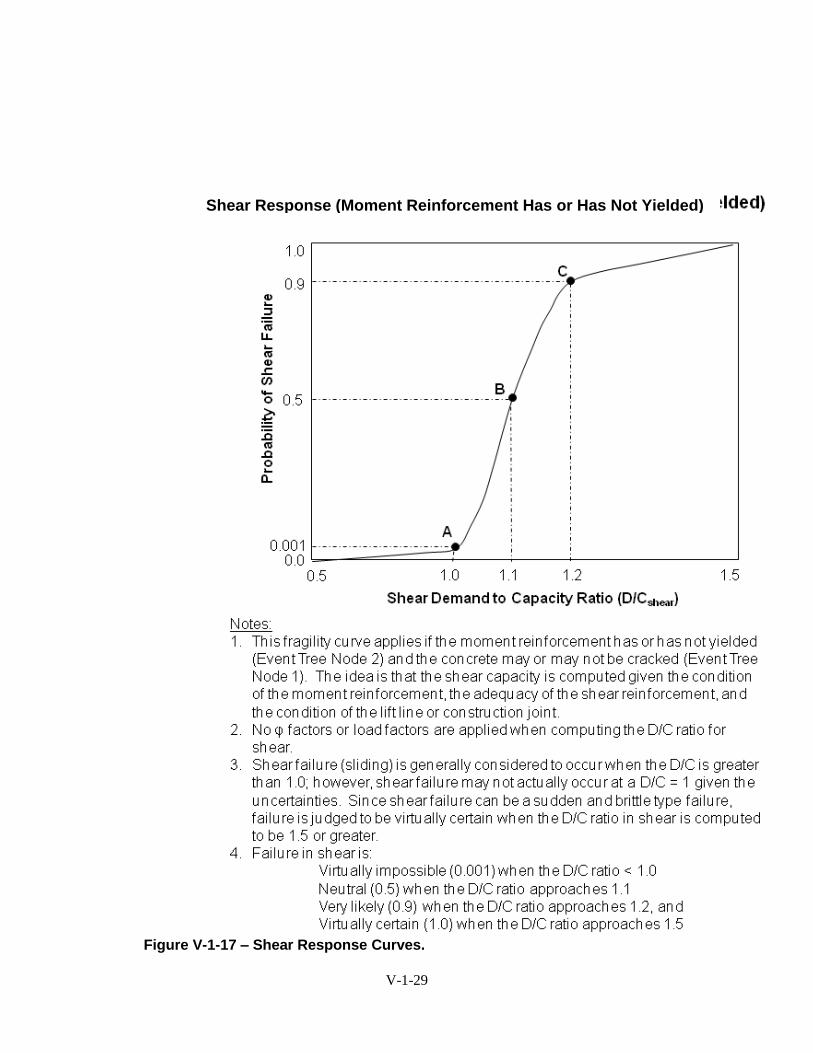
The response curve shown on Figure V-1-17 is an example that may be used for
estimating likelihood values of shear failure given the demand to capacity (D/C) for
shear. However, the risk analysis team should develop their own shear response curve
based on the existing condition of the structural members under investigation and the
team’s expertise and judgment.
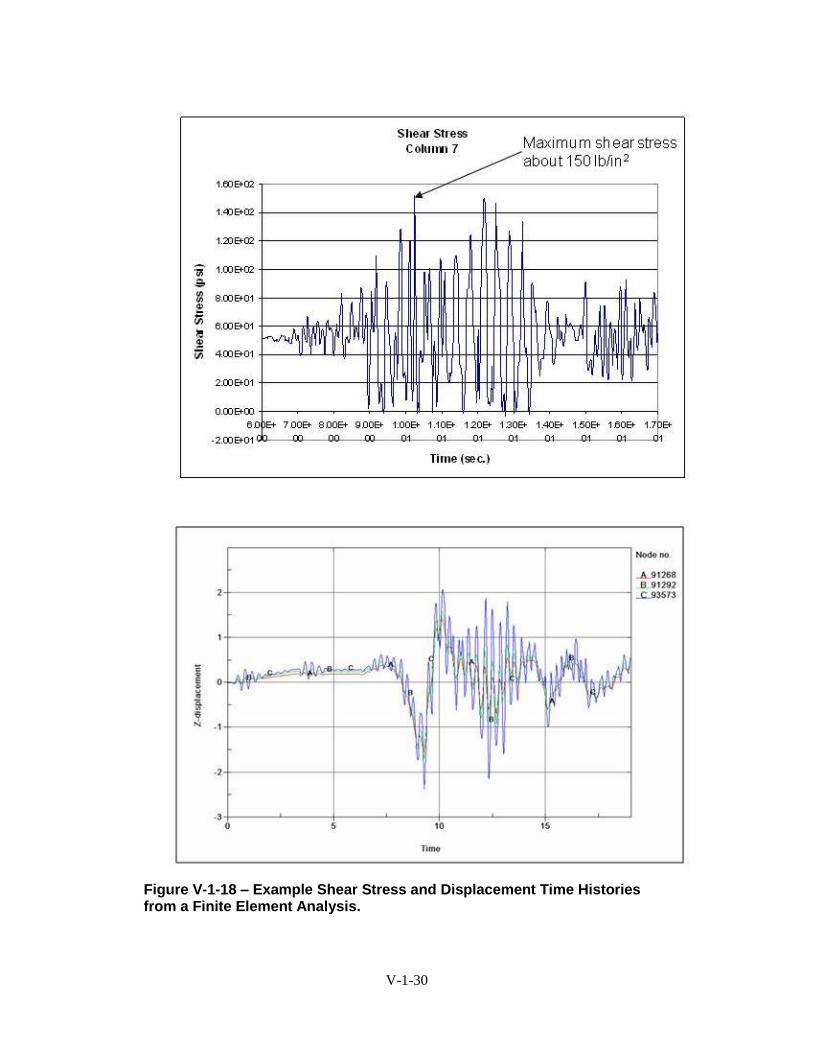
Shear stress along a slide plane to be used for computing demand-capacity ratios may be
computed in a number of ways. Figure V-1-18 shows an example of shear stresses output
from a finite element study. Care must be taken to ensure sufficient mesh density when
calculating shear stresses, as a coarse mesh will result in an overly simplified (and low)
shear stress distribution. The extent of overstressing over the entire structure is
considered.
The shear capacity should be computed considering the height to width ratio of the
member, the amount and orientation of shear reinforcement developing a clamping
(normal) force, the condition of construction joints, the normal stress acting on the
section under investigation, and the amount of yielding of the flexural reinforcement.
For reinforced hydraulic structures that are massive and lightly reinforced, resistance to
shear may be evaluated using block sliding methodology similar to what is used for
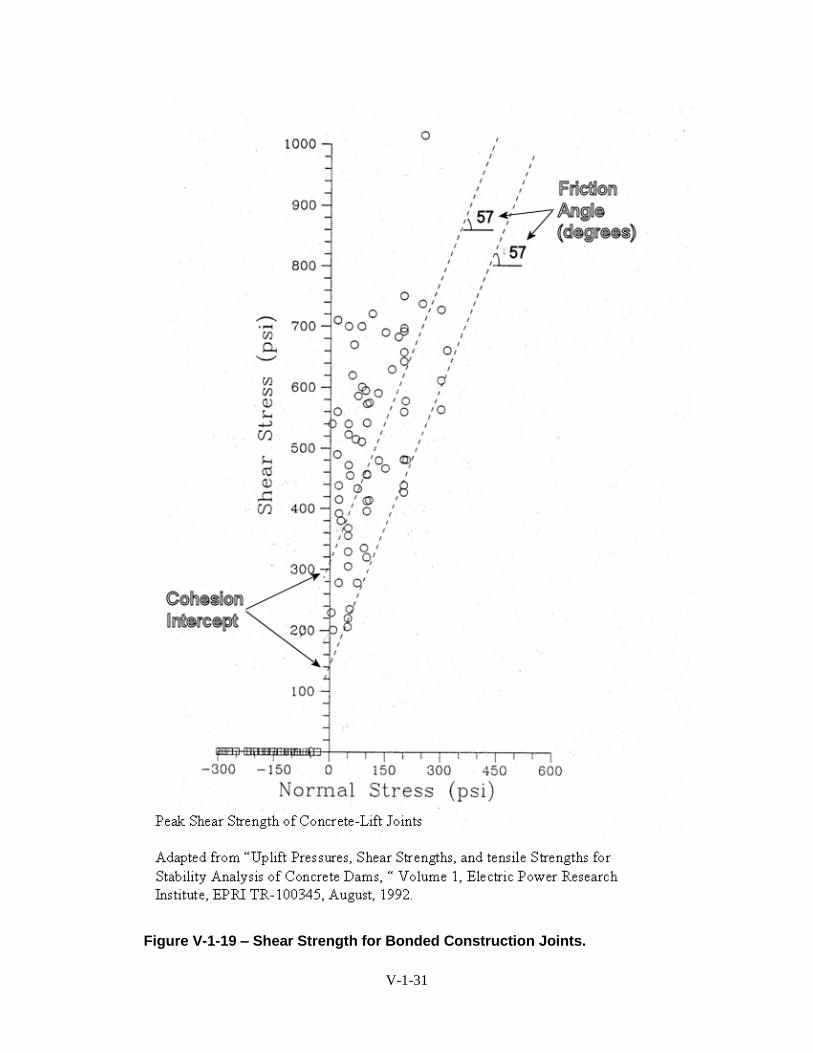
evaluation of sliding for concrete gravity dams. Specifically, recommendations for the
shear strength of lightly reinforced massive members are presented by Electric Power
Research Institute (EPRI) in Figure V-1-19 for intact structures with fully bonded
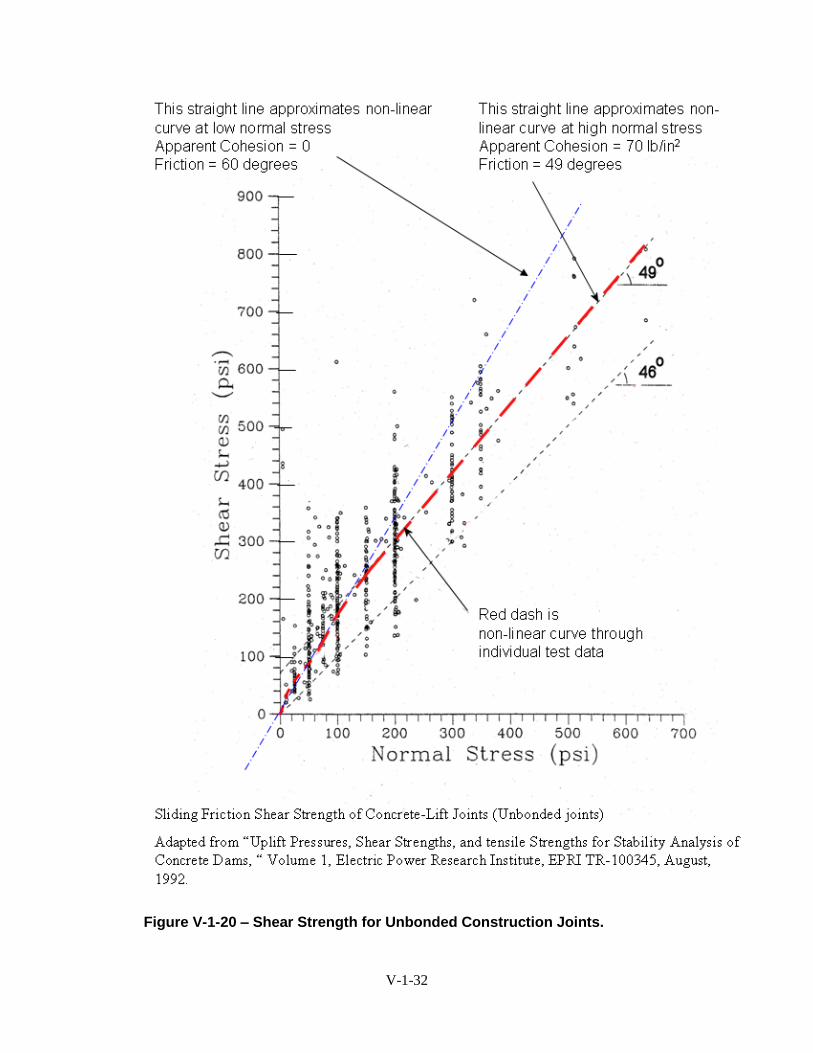
construction joints, and Figure V-1-20 for cracked (but not severely damaged) structures
or structures with unbounded construction joints. It is recommended that the EPRI data
should be used for reinforced concrete members that are short-stocky members with
small height to width ratios, have little to no shear reinforcement, and have horizontal
sliding surfaces that are bonded or unbonded. The way to use the curves shown on
Figures V-1-19 and V-1-20 is to resolve the forces acting on the section (including
weight, driving force, and tensile forces in the steel) normal and parallel to the crack (or
potential sliding plane), and use the normal force to estimate the range of expected shear
strengths.
V-1-9
The EPRI shear data of Figures V-1-19 and V-1-20 was obtained from tests on mass
concrete. The normal force acting on the slide plane in relation to the failure envelope
determines the shear capacity. The data is intended for large unreinforced or lightly
reinforced deep members with height to depth ratios of 4 or less. Figure V-1-19 is for
bonded (uncracked) concrete construction joints and Figure V-1-20 is for unbonded
construction joints. A straight line fit through the data is expressed as cohesion (shear
strength at zero normal stress) and friction angle. The intercept of the line at zero normal
stress is called the “true” cohesion for a bonded member and called the “apparent”
cohesion for an unbonded member. When using the EPRI data, if the concrete section
has cracked, the true (bonded) cohesion of the concrete should no longer be used. In this
case, the shear strength is nonlinear, passing through zero strength at zero normal stress
as illustrated by the red dashed line on Figure V-1-20. Apparent cohesion should be used
with extreme care and depends on the normal stress acting on the slide surface. The
normal stress on a surface should be relatively constant and relatively easy to compute.
The effective friction angle at low normal stress levels, typical of massive hydraulic
structures, is likely to be high (in excess of 45 degrees). For higher values of normal
stress, a combination of apparent cohesion and lower friction angle may be used if it is
impractical to use a nonlinear failure envelope.
It should be noted that many concrete sections associated with hydraulic structure are
much more massive than representative sections considered in the ACI code. As such,
shear friction plays a more significant role in the shear strength of a member as well as
the sliding stability (Node 5). Shear frictional resistance is not only produced by the
weight of the concrete on the cracked surface, but also by tensioning of the steel during
shear dilation of the rough cracked surface, which results in additional normal stress and
frictional resistance across the crack. Estimates of roughness can be used to help
establish the amount of crack opening and steel tensioning that would occur during
shearing of a rough crack. Shear friction for unreinforced members is computed using
the equation shown in Figure V-1-21. The normal force generated from tensioning of the
reinforcing steel can be added to the normal force in this equation.
The ACI code provides considerable guidance for shear strength of reinforced concrete
members. The ACI code can be used to calculate the shear demand capacity ratios, but
care must be taken to use the equations that are appropriate to the case being studied.
This requires careful consideration of the orientation of the crack, the orientation of the
reinforcing steel relative to the crack, and the ratio of steel area to concrete area. The ACI
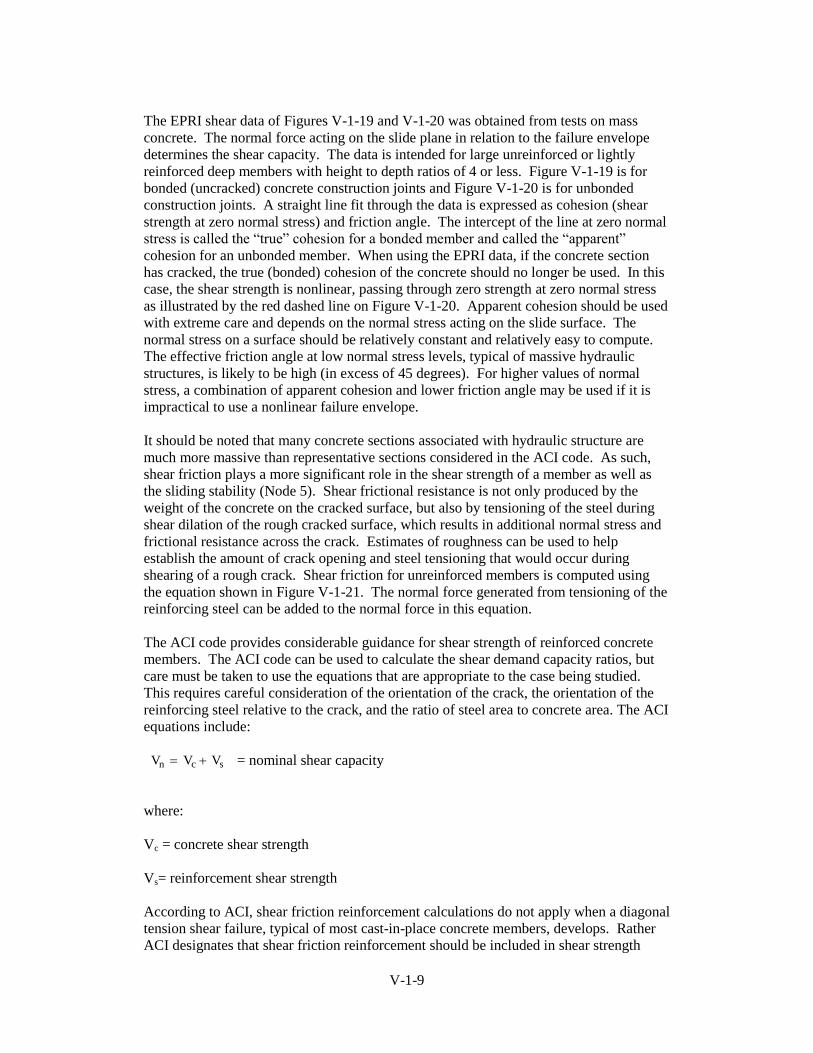
equations include:
= nominal shear capacity
where:
Vc = concrete shear strength
Vs= reinforcement shear strength
According to ACI, shear friction reinforcement calculations do not apply when a diagonal
tension shear failure, typical of most cast-in-place concrete members, develops. Rather
ACI designates that shear friction reinforcement should be included in shear strength
Vn Vc Vs
V-1-10
calculations for shear transfer across a given plane such as an existing or potential crack,
an interface between dissimilar materials, or an interface between two concretes cast at
different times. In addition, shear friction reinforcement should be supplemental to the
primary flexural reinforcement. In some cases, the ACI code may provide a conservative
estimate of shear strength and for more massive structures, such as spillway piers, using
the sliding friction approach and the curves in Figures V-1-19 and V-1-20 may be more
appropriate.
In the case where a member is severely damaged by many cycles of loading, it may not
be appropriate to apply the shear friction approach as described above. The concrete may
be so badly damaged that the steel is ineffective and the concrete may be nearly rubble.
Judgment is required to determine if this is likely, and if so, what the shear strength is
likely to be.
Caltrans provides guidance to compute the shear strength for reinforced concrete
members with yielded moment reinforcement and less than adequate shear reinforcement.
However, this criterion was developed largely for tied columns with adequate confining
reinforcement, and should be applied with caution to hydraulic structures. In this case,
the concrete core remains intact because the tie reinforcement limits spalling.
Failure can progress in a rapid and brittle manner if the shear capacity is exceeded.
Figure V-1-17 is provided as an example for estimating failure likelihoods for a potential
shear failure scenario. In the example shear response curve of Figure V-1-17, the shear
failure probabilities are estimated to be approximately neutral for shear D/C ratios of 1.1,
very likely when shear D/C ratios approach 1.2, and virtually certain when shear D/C
ratios approach 1.5. Similar to the flexural response curve of Node 2, shear response
curves should be developed on a case-by-case basis considering the computed shear D/C
ratio, the estimated amount of reinforcement that has yielded, the frictional resistance
produced by the member weight, the orientation of the failure plane, the strength of the
concrete, the strength of the reinforcement, the magnitude of shear force, the static or
cyclical nature of the loading, and the duration of loading.
Node 4 – Displacement Criteria Node 4 of the event tree evaluates the displacement of the section if the reinforcement
has yielded. Even if the section has adequate shear capacity, Branch 4A of Figure V-1-
13 represents the potential for the section to fail by uncontrolled inelastic displacement
that could lead to subsequent failure of the spillway gates or collapse of the wall. If the
section meets the yield displacement criteria and the shear criteria of Node 3D, then the
structure may be considered viable. For an event tree dealing exclusively with static
loading, this node should generally be eliminated from the event tree since uncontrolled
inelastic deflections are virtually certain to occur under static moment demands that
exceed the yield moment capacity of the section unless the member is part of a highly
redundant structural system (generally not the case for typical hydraulic structures).
where:
= computed deflection
yield = yield displacement
≤ 2 to 3yield
V-1-11
More specifically, Node 4 of the event tree evaluates if the probability that inelastic
deflections of the structure, resulting from the yielded cross section of Node 2, progress
to the point structural instability. Research at the University of Illinois at Champagne-
Urbana by Dr. Mete Sozen has shown that reinforced sections can deform beyond the
yield displacement of the section and still remain stable (Gulkan and Sozen, 1974; Otani
and Sozen, 1974; Nuss, et al., 1994). The yield displacement is the amount of
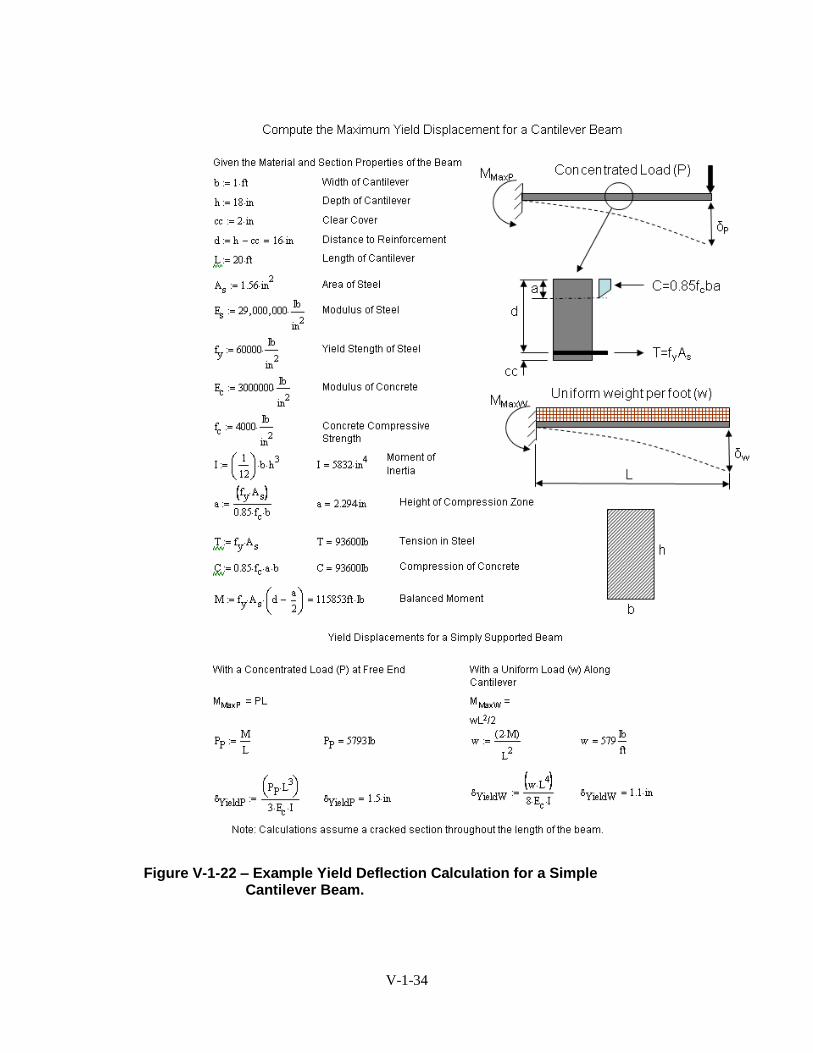
displacement a section needs to deflect to yield the reinforcement. Figure V-1-22 shows
the calculations for the yield displacement of a reinforced concrete cantilever beam. As
shown on Figure V-1-22, the yield displacement is different for a concentrated load
compared to a uniform load. Therefore, the yield displacement must be calculated for
specific loads that cause yielding of the reinforcement based on the configuration of the
entire structural system. The yield deflection occurs when the reinforcement first
experiences yield tension, assuming the load transfers directly through the crack.
However, the load needs to be developed within the reinforcement by creating strain over
the development length and, as a result, the actual yield deflection will generally be
greater than those computed using equations such as those presented in Figure V-1-22.
The displacements of the member in a damaged state with cracked concrete and yielded
reinforcement will be greater than displacements if all material remains intact. The
preferred method to compute the damaged displacement is using a non-linear finite
element model (developed using finite element software such as LS-DYNA). A
completely cracked through concrete section or a completely unbonded construction joint
can be modeled with contact surfaces and the reinforcement can be modeled with shell
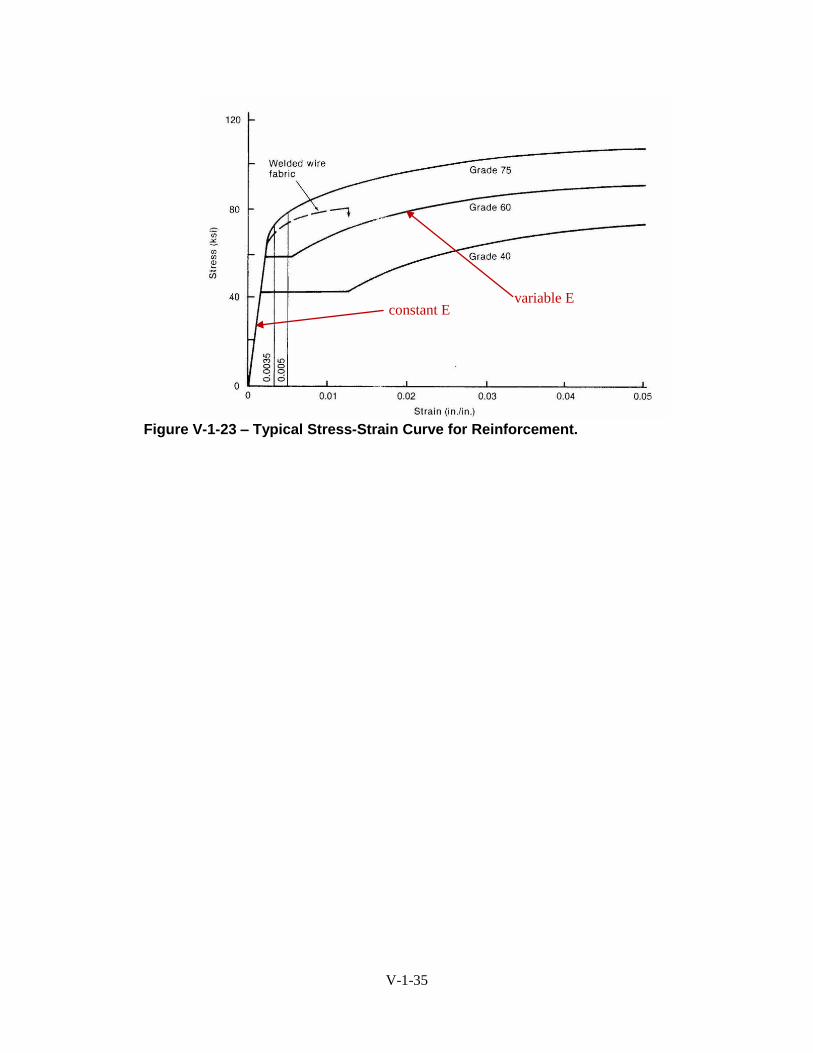
elements or truss members using non-linear steel properties as shown on the elastic-
plastic stress-strain curve of Figure V-1-23. As computing capacity continues to
increase, the level of sophistication and degree of non-linearity that can be modeled has
significantly improved the ability to predict failure of hydraulic structures.
Computing the damaged displacement using traditional methods or using a linear-elastic
finite element model is less accurate and introduces a high level of uncertainty associated
with predicting this node of the event tree. The computation of the expected deflection
using traditional methods may more appropriately consider a moment of inertia based on
a cracked section (Icracked) instead of an uncracked section (I). When linear elastic
analyses are used, the modulus of elasticity of the concrete in the damaged zone is
typically reduced to one-third to one-half the original value as suggested by Dr. Mete
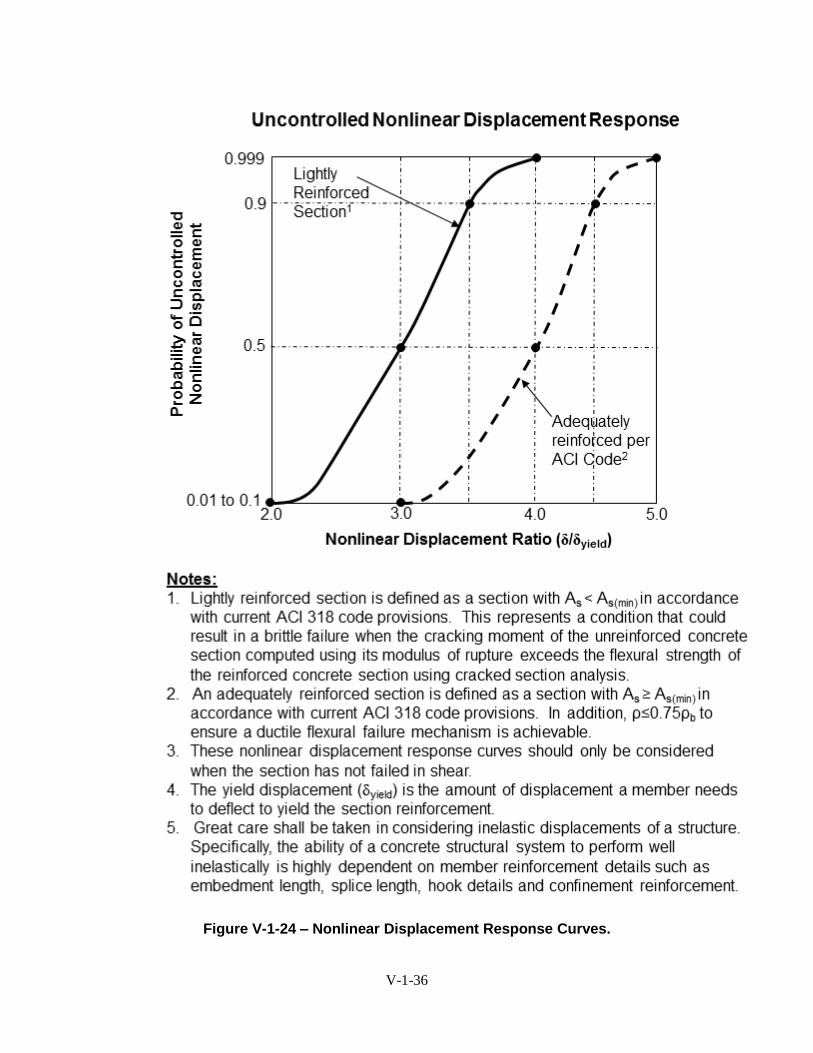
Sozen (Nuss, et al., 1994). For typical reinforced sections, research performed by Dr.
Mete Sozen), indicates calculated displacements for a damaged member of 2 to 3 times
the yield displacement are very unlikely to unlikely to result in uncontrolled nonlinear
displacements; displacements of 3 to 4 times the yield displacement are neutral in terms
of resulting in uncontrolled nonlinear displacements; and displacements of 4 to 5 times
the yield displacement or greater are virtually certain to result in uncontrolled nonlinear
displacements. Figure V-1-24 provides response curves consistent with these values that
may be used for risk analyses. However, great care should be used in evaluating yield
displacements based on structural analysis results. Specifically, the ability of a concrete
structural system to perform well inelastically is also highly dependent on member
reinforcement details such as embedment length, splice length, hook details and
confinement reinforcement, which are details that are generally not included in finite
element models.
V-1-12
Node 5 – Kinematic Instability Node 5 of the event tree evaluates the kinematic stability of the section. Kinematic
failure is the sliding or toppling of a concrete section that is completely independent or
essentially separated from the main concrete structure or in a yielded configuration. At
this point, the concrete has cracked through; the section has failed in shear or yielded in
flexure severely deforming the reinforcement; and the section is effectively acting as an
independent concrete member separate from the connecting or supporting member or as a
yielded structure requiring consideration of P-δ effects. In either case, the damaged
member can either slide or topple depending on the magnitude and duration of the
applied loads and the side restraint.
As a result, Node 5 represents the kinematic failure of the damaged member that has
either: 1) failed in shear, forming an independent concrete block separate from the rest of
the structure, 2) failed due to uncontrolled displacements of the yielded member (most
likely during a seismic event), or 3) failed due to post-seismic instability of the yielded
member. The evaluation of this node considers the possibility that the damaged section
can remain stable or sustain minor movements that do not adversely affect its ability to
retain the reservoir rather than slide or topple resulting in an uncontrolled release of the
reservoir. Kinematic failures caused by static loads (e.g. post-earthquake) that exceed the
resistance of the damaged member are generally considered virtually certain because
there may be no mechanism to stop the movements. Kinematic movement caused by
seismic loads may not be sufficient to fail the structure if the post-earthquake loads are
less than the resistance of the damaged member. In addition, it is possible that
surrounding appurtenant features or geometric limitations could preclude kinematic
instability. Otherwise, sufficient duration and magnitude of earthquake shaking is
required to fail a structure. The amount of sliding of a separated concrete block can be
computed with nonlinear finite element analyses or Newmark analyses. Changes in uplift
pressures on potential sliding planes as a result of earthquake movement need to be
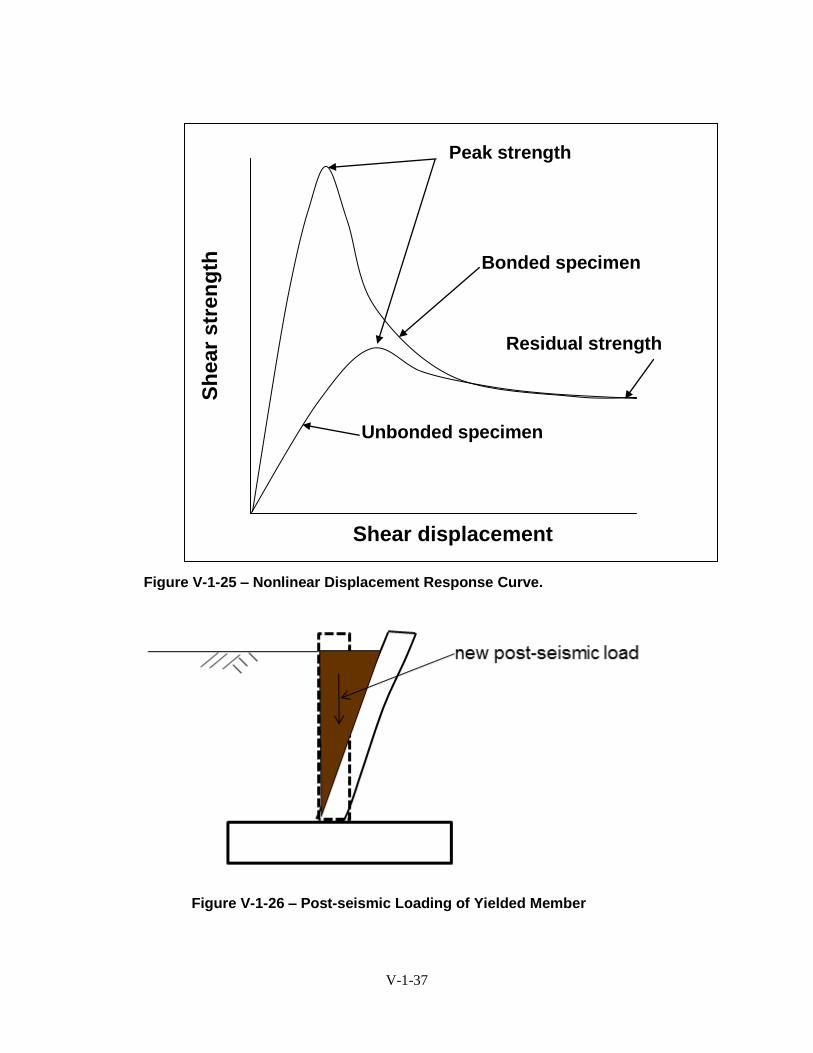
considered. In addition, the risk analysis team needs to consider that the shear resistance
(friction) reduces the farther a member slides and eventually reaches the residual strength
of the material as shown on Figure V-1-25 because the roughness of the slide plane gets
ground down. Post-seismic stability may need to consider new static loads based on the
yielded shape of the member in terms of second-order P-δ analyses as illustrated in
Figure V-1-26.
V-1-13
References
1. Concrete Reinforcing Steel Institute, “Evaluation of Reinforcing Bars in Old
Reinforced Concrete Structures,” Engineering Data Report Number 48, 2001.
2. Electric Power Research Institute, “Uplift Pressures, Shear Strengths, and Tensile
Strengths for Stability Analysis of Concrete Dams,” Volume 1, August, 1992.
3. O’Shea, K and R. Koltuniuk, “Structural Dynamic Analysis of Parker Dam with
Spillway Superstructure,” Proceedings, USSD Conference, 2006.
4. Nuss, L.K., T.L. Payne, and M.A. Sozen, “Case Study of the Dynamic Analyses
of an Existing Multiple Arch Dam: Bartlett Dam, Phoenix, Arizona, USA,” Dam
Fracture Conference, Chambery, France, March, 1994.
5. Portland Cement Association, pcaColumn, Computer Program to Compute P-M
Interaction Diagrams.
6. Gulkan, P. and Sozen, M., Inelastic Responses of Reinforced Concrete Structures
to Earthquake Motions, ACI Journal, December 1974.
7. Otani, S. and Sozen, M., Simulated Earthquake Tests of R/C Frames, Journal of
the Structural Division, ASCE, March 1974.
8. American Society of Engineers (ASCE) 41 Seismic Rehabilitation of Existing
Buildings.
9. American Society of Engineers (ASCE) 31 Seismic Evaluations of Existing
Buildings.
V-1-14
Figure V-1-1 – Typical Geometry and Support Conditions for Reinforced
Concrete Members in Hydraulic Structures.
V-1-15
Figure V-1-2 – Typical Spillway Wall Configurations.
Glendo Dam Chute Walls
Stampede Dam Control Structure
Stampede Dam Stilling Basin
V-1-16
Figure V-1-3 – Typical Spillway Pier Configurations.
Canyon Ferry Dam Gate Piers
Glen Canyon Dam Gate Piers
Minidoka Dam Canal Headworks Gate Piers
V-1-17
Coolidge Dam Thick Buttress Construction
Stony Gorge Dam Thin Buttress Construction
Figure V-1-4 – Typical Dam Buttress Configurations.
V-1-18
Figure V-1-5 – Typical Dynamic Response Spectrum Plot.
V-1-19
Figure V-1-6 – Equations for Calculating Natural Frequency of Beams Including a Lumped Mass.
V-1-20
Figure V-1-7 – Equations for Calculating Natural Frequency of Beams.
V-1-21
Figure V-1-8 – Equations for Calculating the Natural Frequency of a Gravity Wall and a Cantilever Wall.
V-1-22
Figure V-1-9 – Uniform hazard spectra (UHS) for earthquake return periods between 1,000 and 50,000 years.
V-1-23
Figure V-1-10 – Inadequate Reinforcement Details.
Embedment/Splice Length
Splicing of Transverse Reinforcement and Hook Ends
Shear Reinforcement
V-1-24
Figure V-1-11 – Stress Time-History Results at the Base of a Superstructure
for a 50,000-year Earthquake.
Figure V-1-12 – Hook Details Comparing Seismically Unacceptable and
Seismically Acceptable Stirrup Details.
Last Modified 4/22/2015
V-1-25
Figure V-1-13 – Example Event Tree for Failure of a Reinforced Concrete Member.
Last Modified 4/22/2015
V-1-26
Figure V-1-14 – Example of a Moment Demand-Capacity Evaluation Using
an Axial Force (P) vs. Moment (M) Interaction Diagram Based on Results
from a Time History Analysis.
V-1-27
Figure V-1-15 – Conversion of Force and Moment to Stress.
V-1-28
Figure V-1-16 – Flexural Yielding Response Curves.
V-1-29
Figure V-1-17 – Shear Response Curves.
Shear Response (Moment Reinforcement Has or Has Not Yielded)
V-1-30
Figure V-1-18 – Example Shear Stress and Displacement Time Histories from a Finite Element Analysis.
V-1-31
Figure V-1-19 – Shear Strength for Bonded Construction Joints.
V-1-32
Figure V-1-20 – Shear Strength for Unbonded Construction Joints.

V-1-33
Figure V-1-21 – Shear Resistance Equation for Sliding Evaluations of
Massive Hydraulic Structures.
Figure 10-10d Reclamation Equation for Shear Resistance used in
combination with the EPRI values for cohesion (or apparent cohesion) and
friction angle
CAUNSF )(
where:
SF = Shear resistance
N = Normal force on the sliding plane
U = Uplift forces along sliding plane
μ = Friction coefficient (tangent of the friction angle)
C = Cohesion (or apparent cohesion)
A = Area of slide surface
EPRI
V-1-34
Figure V-1-22 – Example Yield Deflection Calculation for a Simple Cantilever Beam.
V-1-35
Figure V-1-23 – Typical Stress-Strain Curve for Reinforcement.
constant E variable E
V-1-36
Figure V-1-24 – Nonlinear Displacement Response Curves.
V-1-37
Figure V-1-25 – Nonlinear Displacement Response Curve.
Figure V-1-26 – Post-seismic Loading of Yielded Member
Peak strength
Residual strength
Bonded specimen
Sh
ear
str
en
gth
Unbonded specimen
Shear displacement
Reduction of shear strength as sliding displacement increases