Embed Size (px)
Citation preview

Working Families Success
Network &
How to Measure the Impact of
Integrated Services Delivery
ALC 2014 September 17, 2014

The CWF Approach is Adopted Across the Country: Working Families Success Network
2
WFSN Service Providers Bundle Services Within and Across Three Strategy Areas
Employment/ Career Services
Income/ Work Supports
Financial Services/ Asset Building
Job readiness, job placement
Public benefits access Educational workshops and
financial coaching
Hard skills training, job placement
Tax credits One-on-one financial coaching
and counseling
Career advancement: education and skill training, advising
Student financial aid
Financial services & products: access to better priced products (check cashing, loans, savings)

WFSN Data and Outcomes
• Data helps practitioner understand program design and allows for performance management
• Who is getting bundled services and what types of outcomes do they achieve?
• We track all stories and client efforts, but want to know the bottom line impact
• Data helps practitioners understand what needs to be improved
• Provides opportunities to celebrate victories and success
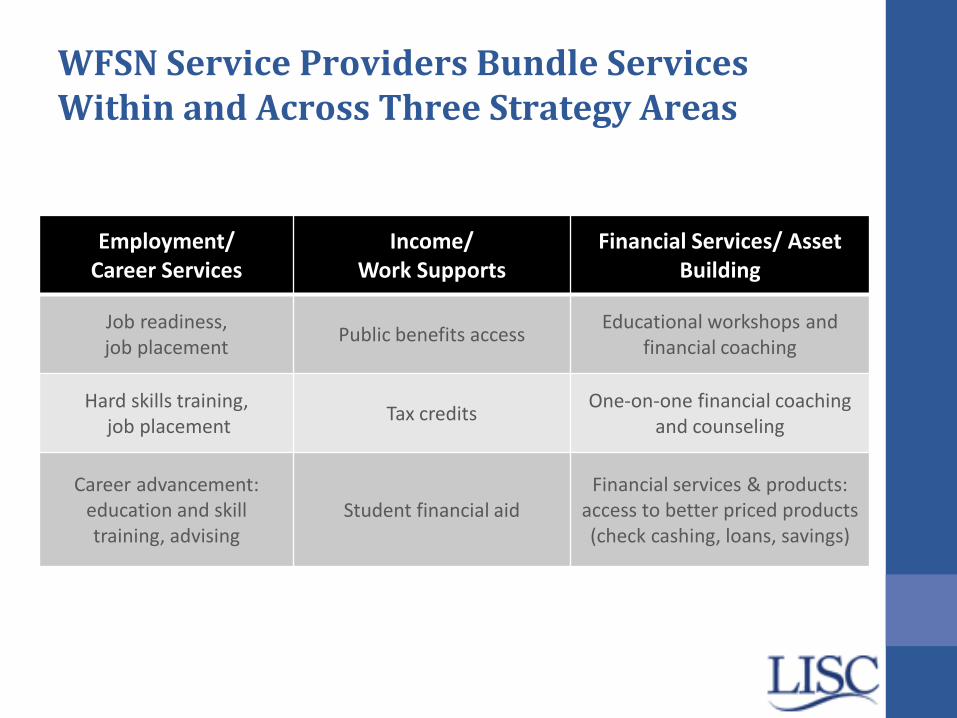
Why the Data Matters
• So we know our work matters
• Build the policy case for public and private funding
• Informs practitioners to improve service delivery
• Tell our story!

Contact & Resources
Seung Kim
Director, Family Income & Wealth Building
LISC
www.lisc.org/isd
http://workingfamiliessuccess.com/

CFED 2014 ASSETS LEARNING CONFERENCE:
PLATFORMS FOR PROSPERITY
HOW TO MEASURE THE IMPACT OF INTEGRATED SERVICES
WASHINGTON, DC
SEPTEMBER 17, 2014
PRESENTED BY
CAROLYN SEWARD
DIRECTOR-MET CENTER OPERATIONS
PRESIDENT/CEO, FAMILY AND WORKFORCE CENTERS OF AMERICA
Working Families Success Network (WFSN)

MISSION The MET Center is a strategic partnership created to stimulate the economic self-sufficiency of individuals living in low-income communities of the St. Louis Region.
The Center seeks to accomplish this mission by delivering focused, comprehensive, and accessible job training, placement, assessment, career development services and transportations services.
We serve the underemployed, unemployed, and displaced workers, leading to sustainable work and a competitive regional economy.
• Centrally Located Near the MetroLink
• Comprehensive Skill-Based Training
• Focused Individual Employment Planning
• Accessible Career Development and Placement Services
• Personal Financial Education/Transportation Services
•Early Childhood Development Center

WFSN/MET CENTER INTREGRATED SERVICE DELIVERY MODEL
Customer Recruiting Orientation
Eligibility for financialAssistance, client services,
ITAs
Program Enrollment(Bundling of Services begins
here)
Adult Education Literacy
Transportation, Job Search,Mobility, Counseling Services
Bundling & Sequencing
Work Readiness TrainingFinancial Literacy and Asset Building –
2 - 4 WeeksBundling & Sequencing of Service
Skill Based Training ProgramsBusiness Services B.O.A.T. (STLCC) BTT (STLCC)Transportation Diesel (STLCC)Career Pathways to Employers/ Pre-Employment Services (FWCA)Manufacturing HVAC (MTA) CNC (MTA) CAD (MTA) ICP (MTA)Healthcare LPN (SSD)BioScience Technology (FWCA)Distance Learning (FWCA)
Financial Services / Asset Building
Employment Services
Graduates from all programs can immediately obtain
employment
America’s Job Center – Placement Services
Supportive services(Based on Funding)
MET Mobility CenterCounselingJob Search
Entrepreneurship Training Program - PrivateBank
Tax PrepFinancial Literacy - St. Louis
Community Credit UnionHousing Counseling
Legal ServicesFSD – Resource Center
CWFPATHWAY
Employer SpecificOrientation
for Job Seeker
Services Educational Programs Placement & Retention

WFSN/MET CENTER PROCESS FLOW
Assessments (Individual Plans)
1. IEP: Case Manager
2. ITP: Case Manager
3. IFP: Financial Literacy Coach
Individuals Receiving Services (Enrollments) Each enrollment requires CWF Snapshot Form
Performance Measures (Placement/Retention/Advancements)
Employment Career and Education Service
Job Readiness Training
Skilled Training
ABE/GED/ESL
Career Counseling
Financial Services & Asset Building
Attending Financial Literacy
Classes
Participating in On-On-One
Financial counseling
Applying for a Credit Score
Work Support Service
Applying for DWD/FSD/SS benefits
Screening for Benefits
Participating in income / tax prep services
Missouri Career Center Services
Bundling of Services
(%) of All Customers Received Bundled Services
Employment & Career Advancement
Became employed
Achieved 3, 6, 12 month retentions
Achieved Career/Life Advancements
Completed ABE/GED/ESL
Completed Job Readiness
Completed Skilled Training
Financial Stability and Asset Building
Obtain credit report
Correct errors on credit report
Improve credit score
Savings Account
Retirement Account
Drivers License Car
Saving for down payment on home
Purchased home
Work Support
Receiving Public Benefits
Received Transportation Services
Received Tax Refund
Received EITC
Intake/Recruitment
Assessment/Orientation
Pre-Assessment Services
1. TABE
2. Work Keys
CWF—MET Center St. Louis
Funnel Process
7-1-06 – 6-30-14
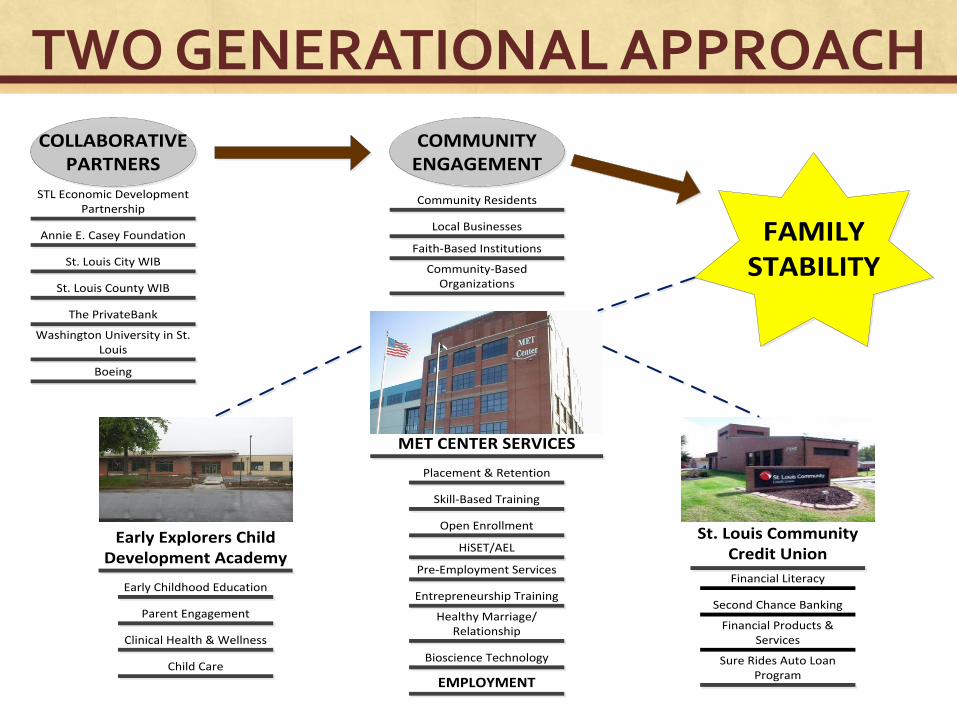
TWO GENERATIONAL APPROACH
St. Louis Community Credit Union
MET CENTER SERVICES
Early Explorers Child Development Academy
COLLABORATIVE PARTNERS
STL Economic Development Partnership
Annie E. Casey Foundation
St. Louis City WIB
St. Louis County WIB
The PrivateBank
Washington University in St. Louis
Boeing
Placement & Retention
Skill-Based Training
Open Enrollment
HiSET/AEL
Pre-Employment Services
Entrepreneurship Training
Healthy Marriage/Relationship
Bioscience Technology
Early Childhood Education
Parent Engagement
Clinical Health & Wellness
Financial Literacy
Second Chance Banking
Financial Products & Services
COMMUNITY ENGAGEMENT
Community Residents
Local Businesses
Faith-Based Institutions
Community-Based Organizations
Sure Rides Auto Loan Program
Child Care
EMPLOYMENT
FAMILY STABILITY
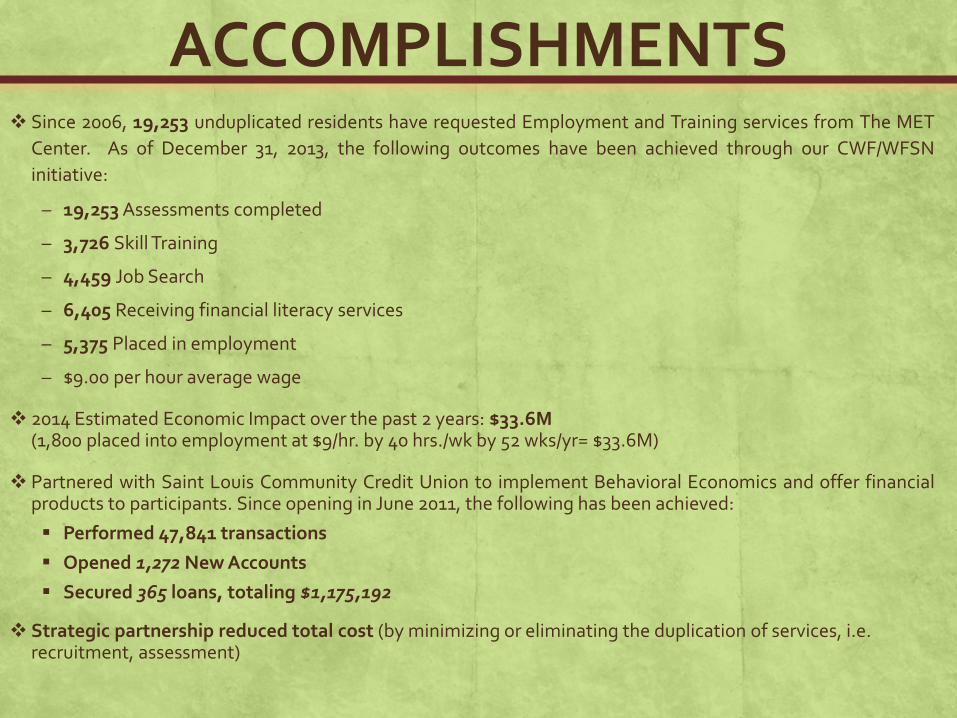
ACCOMPLISHMENTS Since 2006, 19,253 unduplicated residents have requested Employment and Training services from The MET
Center. As of December 31, 2013, the following outcomes have been achieved through our CWF/WFSN
initiative: – 19,253 Assessments completed
– 3,726 Skill Training
– 4,459 Job Search
– 6,405 Receiving financial literacy services
– 5,375 Placed in employment
– $9.00 per hour average wage
2014 Estimated Economic Impact over the past 2 years: $33.6M (1,800 placed into employment at $9/hr. by 40 hrs./wk by 52 wks/yr= $33.6M) Partnered with Saint Louis Community Credit Union to implement Behavioral Economics and offer financial
products to participants. Since opening in June 2011, the following has been achieved:
Performed 47,841 transactions
Opened 1,272 New Accounts
Secured 365 loans, totaling $1,175,192
Strategic partnership reduced total cost (by minimizing or eliminating the duplication of services, i.e. recruitment, assessment)

CONTACT INFORMATION
CAROLYN D. SEWARD
MET CENTER/FAMILY AND WORKFORCE CENTERS OF AMERICA 6347 PLYMOUTH AVENUE
ST. LOUIS, MO 63133 (314) 746-0752 - OFFICE
(314) 746-0735 – FAX
EMAIL: [email protected] WEBSITE: WWW.FWCA-STL.COM
WEBSITE: WWW.METCENTERSTL.COM

SparkPoint Centers San Francisco Bay Area
Ena Yasuhara Li
Director, SparkPoint Network
United Way of the Bay Area
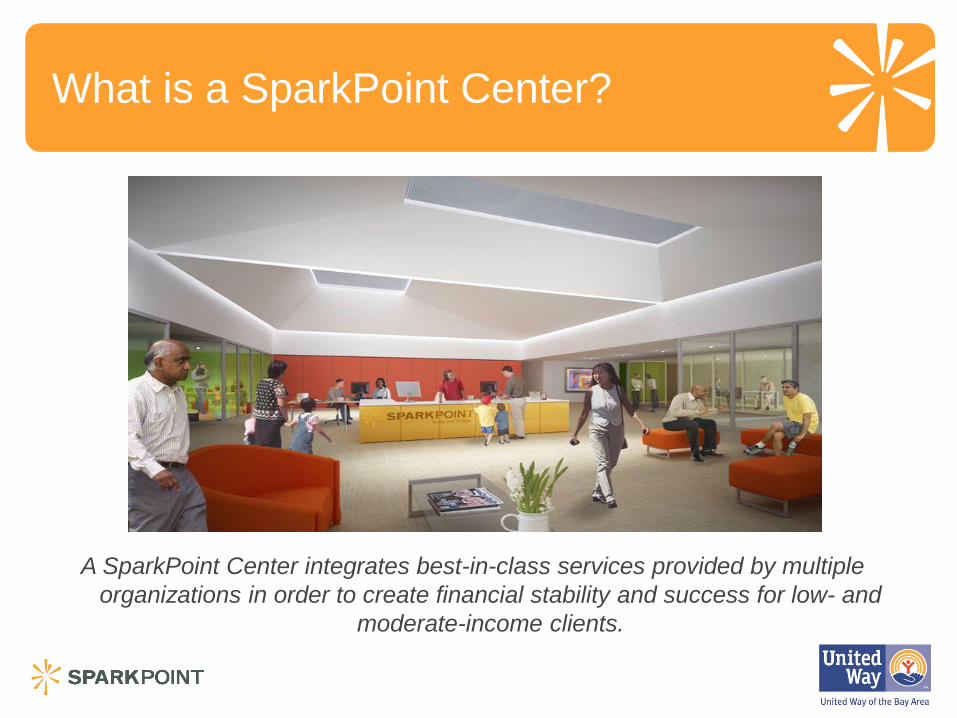
What is a SparkPoint Center?
15
A SparkPoint Center integrates best-in-class services provided by multiple
organizations in order to create financial stability and success for low- and
moderate-income clients.

16
Services include
• Financial coaching
• Credit/debt counseling
• Job coaching
• Employment training
• Benefits access
• Tax preparation
• First time homebuyer
assistance
What is a SparkPoint Center?

How do we measure success?
17
All Centers share a
primary goal of
helping individuals
achieve a goal of
financial stability, as
defined by

Clients are achieving financial success
Over 16,000 people served since 2009
Last year:
• 80% made 5% or more progress in increasing
income, credit, savings, or decreasing debt
• 69% of clients achieved 30% or more progress
in increasing income, credit, savings, or
decreasing debt
• 49 clients achieved all four long-term goals
• Average wage of clients last year: $16.49

Performance-Based Rubric

New Outcomes Measuring Progress
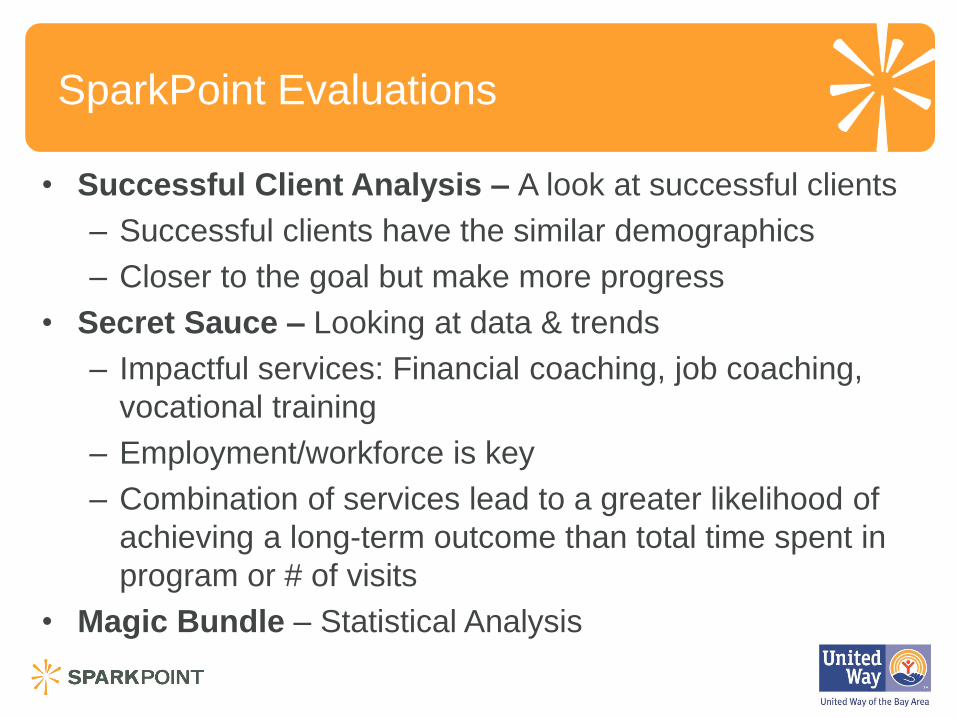
SparkPoint Evaluations
• Successful Client Analysis – A look at successful clients
– Successful clients have the similar demographics
– Closer to the goal but make more progress
• Secret Sauce – Looking at data & trends
– Impactful services: Financial coaching, job coaching,
vocational training
– Employment/workforce is key
– Combination of services lead to a greater likelihood of
achieving a long-term outcome than total time spent in
program or # of visits
• Magic Bundle – Statistical Analysis

The “Magic Bundle”
Magic Bundle =
1:1 Financial Coaching + 1:1 Job Coaching
Financial coaching includes:
– Budgeting and Spending Plan
– Financial Goals (including savings)
Job coaching includes:
– Addressing barriers to employment
– Setting career goals
– Preparing job search tools (resume, interview skills, etc)
– Maintaining employment

The “Magic Bundle”
Clients who receive the magic bundle…
• reduce their distance to self-sufficient income by $100-
$700 on average (depending on the center)
• are more likely to make progress on achieving self-
sufficient income
• make greater progress towards saving
• are more likely to take up other services
• are more likely to have complete financial information
• have similar baseline profile to clients who do not take
up the bundle

CONTACT INFORMATION
Contact Information
Ena Yasuhara Li
Director, SparkPoint Network
United Way of the Bay Area
(415) 808-4426

LISC Financial Opportunity Centers The FOC Bundle
1) Employment Services • One-on-one employment
counseling • Job readiness / job placement • Access to education / training (community college presence)
2) Income Support Services • One-on-one benefits counseling • SNAP • Housing and energy subsidies • Earned Income Tax Credit (EITC)
3) Financial Services • One-on-one financial counseling • Pull/ review credit report • Establish household budget &
balance sheet • Connect to mainstream financial
product Household scenario adapted from Aspen Institute report
Expense
exceeds Income

Client Outcomes
Outcomes • Increases in Credit score
• Long term job retention
• Increases in Net income
• Increases in Net worth
Household scenario adapted from Aspen Institute report Income exceeds Expense
Focus on lasting impact • Client empowered in the
relationship
• Behavior changes
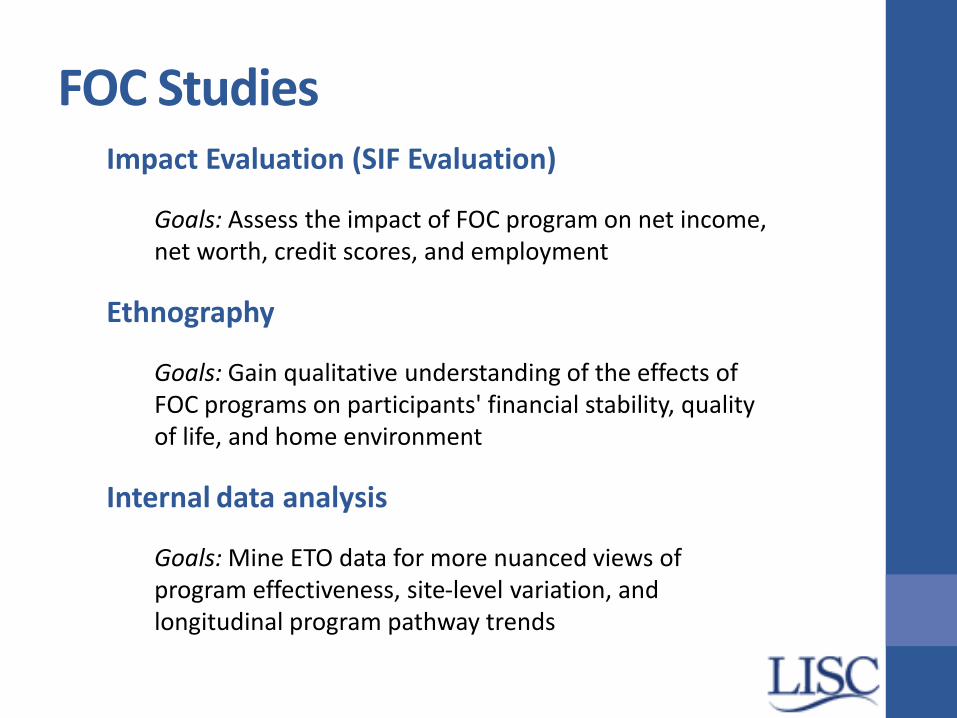
Impact Evaluation (SIF Evaluation)
Goals: Assess the impact of FOC program on net income, net worth, credit scores, and employment
Ethnography
Goals: Gain qualitative understanding of the effects of FOC programs on participants' financial stability, quality of life, and home environment
Internal data analysis
Goals: Mine ETO data for more nuanced views of program effectiveness, site-level variation, and longitudinal program pathway trends
FOC Studies
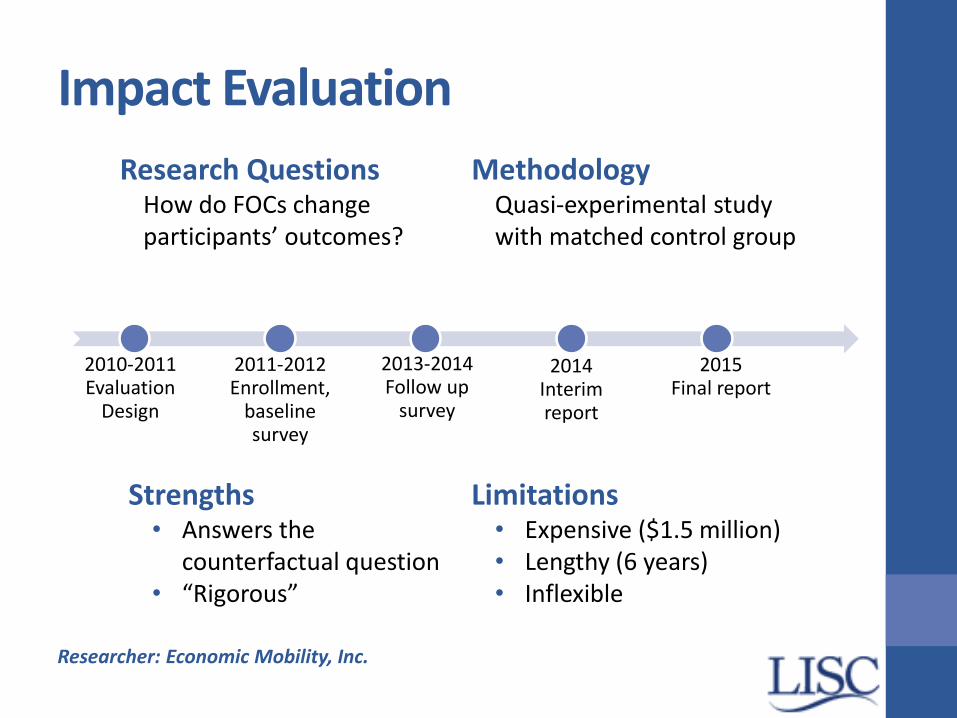
2010-2011 Evaluation
Design
2011-2012 Enrollment,
baseline survey
2013-2014 Follow up
survey
2014 Interim report
2015 Final report
Research Questions How do FOCs change participants’ outcomes?
Methodology Quasi-experimental study with matched control group
Impact Evaluation
Strengths • Answers the
counterfactual question • “Rigorous”
Limitations • Expensive ($1.5 million) • Lengthy (6 years) • Inflexible
Researcher: Economic Mobility, Inc.

Impact Evaluation: Interim Findings

Impact Evaluation: Interim Findings

Research Questions How do FOCs affect participants’ quality of life?
Methodology Biannual ethnographic interviews with 12 FOC participants
Ethnography
Strengths • Richer information –
nuanced stories • Flexible design • Relatively inexpensive
($22K/survey wave)
Limitations • No counterfactual, no
statistical validity • “How does it work,” not
“Does it work” • Need ethnographer,
trust of participants, ethics review
2015 Final
report
2013-2015 Interviews
every 6 months
2012 Evaluation Design &
IRB
Researcher: Matt Maronick, U. Chicago
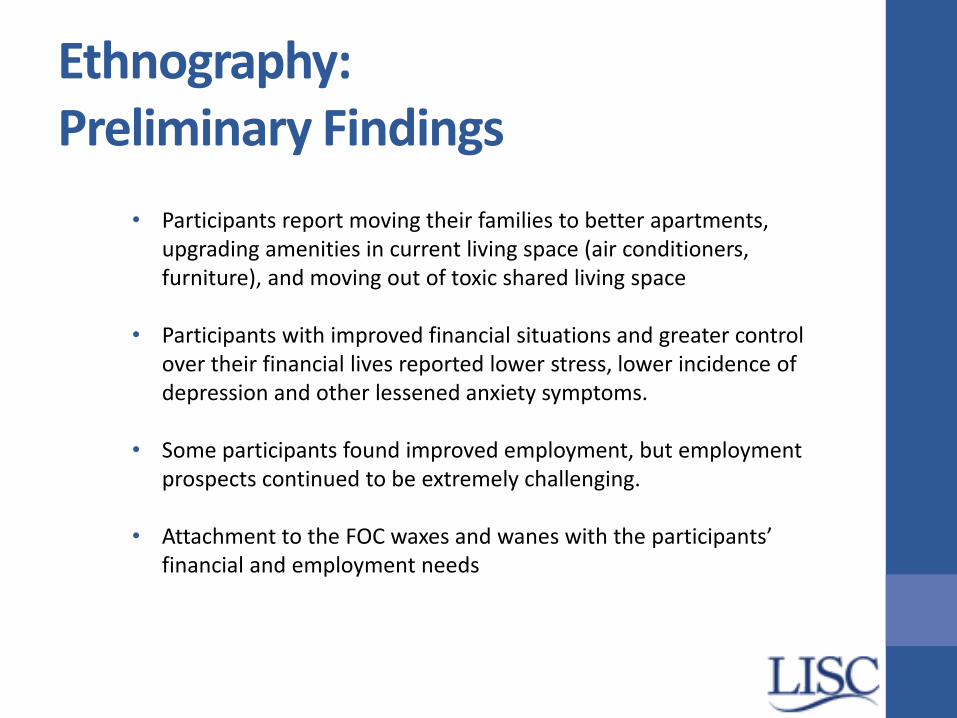
• Participants report moving their families to better apartments, upgrading amenities in current living space (air conditioners, furniture), and moving out of toxic shared living space
• Participants with improved financial situations and greater control over their financial lives reported lower stress, lower incidence of depression and other lessened anxiety symptoms.
• Some participants found improved employment, but employment prospects continued to be extremely challenging.
• Attachment to the FOC waxes and wanes with the participants’ financial and employment needs
Ethnography: Preliminary Findings

Research Questions • What factors affect
outcomes? • What do financial
pathways look like? • What metrics should we
be tracking?
Methodology
• Program data: 22 months, 40,000 clients, 62 FOCs, 15 markets
• Program contacts, budgets, balance sheets, and job holding
Internal data analysis
Strengths • Flexible analysis • Extremely rich dataset
Limitations • No control
group/counterfactual • Program data limitations

Internal Data Analysis: Preliminary Findings
26% 32%
39% 46%
22% 28%
34% 39%
0%
10%
20%
30%
40%
50%
EC Only EC + ISC EC + FC All Programs
Job Placement by Program Mix
Any Placement Unsubsidized Placement

Internal Data Analysis: Preliminary Findings
81%
62%
45%
18%
86%
69%
52%
28%
85%
73%
56%
32%
88%
76%
59%
35%
0%
20%
40%
60%
80%
100%
30 Day Retention 90 Day Retention 180 Day Retention 365 Day Retention
Retention by Program Mix
EC Only EC + ISC EC + FC All Programs

Sarah Rankin
Senior Research Associate
Local Initiatives Support Corporation
Contact
![[2013] FWCA 3966 - Amazon S3 · [2013] FWCA 3966 DECISION Fair Work Act 2009 s.185 -Application for approval of a single-enterprise agreement Pacific National (NSW) Pty Ltd and Asciano](https://img.pdfslide.net/doc/110x75/5e12d1e40894471f413c131e/2013-fwca-3966-amazon-s3-2013-fwca-3966-decision-fair-work-act-2009-s185.jpg)


![WELCOME ABOARD · [2016] FWCA 3633 DECISION [2016] FWCA 3633 2 [4] The Agreement was approved on 3 June 2016 and, in accordance with s.54, will operate from 10 June 2016. The nominal](https://img.pdfslide.net/doc/110x75/5f9e611ff0665c5d6c5cffb3/welcome-aboard-2016-fwca-3633-decision-2016-fwca-3633-2-4-the-agreement-was.jpg)
![[2013] FWCA 2454 - :: Home · St Leonard’s College (AG2013/842) ST LEONARD’S COLLEGE AGREEMENT2013 Educational services COMMISSIONER BISSETT MELBOURNE, 22 APRIL 2013 Application](https://img.pdfslide.net/doc/110x75/602fe5635167fc02b85613d7/2013-fwca-2454-home-st-leonardas-college-ag2013842-st-leonardas-college.jpg)
![[2014] FWCA 6481 Associate to Deputy President Booth Dated ...nswnma.asn.au/wp-content/uploads/2013/07/Maari-Ma... · [2014] FWCA 6481 The attached document replaces the document](https://img.pdfslide.net/doc/110x75/5fbb49f022f38b565058795a/2014-fwca-6481-associate-to-deputy-president-booth-dated-2014-fwca-6481.jpg)
![[2013] FWCA 6370 - NSWNMA · 2019. 8. 20. · [2013] FWCA 6370 2 The Agreement is approved and, in accordance with s.54 of the Act, will operate from 6 September 2013. The nominal](https://img.pdfslide.net/doc/110x75/613c65c64c23507cb6355b70/2013-fwca-6370-nswnma-2019-8-20-2013-fwca-6370-2-the-agreement-is-approved.jpg)
![DECISION - rtbuvic.com.au · [2016] FWCA 5738 DECISION [2016] FWCA 5738 2 [7] The Agreement is approved and, in accordance with s.54 of the Act, will operate from 23 August 2016](https://img.pdfslide.net/doc/110x75/5f8a85cbb1c7e85c8f719c02/decision-2016-fwca-5738-decision-2016-fwca-5738-2-7-the-agreement-is-approved.jpg)
![[2014] FWCA 3554 - SDA Nationalsda.org.au/download/enterprise-agreements/NONI-B-ENTERPRISE... · Noni B gives the following written undertakings with regards to the Noni B Enterprise](https://img.pdfslide.net/doc/110x75/5bcc31a009d3f2761f8dc1cf/2014-fwca-3554-sda-noni-b-gives-the-following-written-undertakings-with.jpg)


![[2013] FWCA 5001 - SDA Nationalsda.org.au/download/enterprise-agreements/MCDONALDS-AUSTRALIA... · MCDONALD'S AUSTRALIA ENTERPRISE AGREEMENT 2013 1 Title This Agreement shall be known](https://img.pdfslide.net/doc/110x75/5c74b44409d3f22e5a8c0802/2013-fwca-5001-sda-mcdonalds-australia-enterprise-agreement-2013-1-title.jpg)