Embed Size (px)
Citation preview

2010 Virginia Polytechnic Institute and State University 3009-1460
Virginia Cooperative Extension programs and employment are open to all, regardless of race, color, national origin, sex, religion, age, disability, political beliefs, sexual orientation, or marital or family status. An equal opportunity/affirmative action employer. Issued in furtherance of Cooperative Extension work, Virginia Polytechnic Institute and State University, Virginia State University, and the U.S. Department of
Agriculture cooperating. Alan L. Grant, Dean, College of Agriculture and Life Sciences, and Interim Director, Virginia Cooperative Extension, Virginia Tech, Blacksburg; Wondi Mersie, Interim Administrator, 1890 Extension Program, Virginia State, Petersburg.
PEANUT CROP PHYSIOLOGY RELATED PROJECTS AT TIDEWATER AGRICULTURAL RESEARCH & EXTENSION
CENTER 2009
Maria Balota, Ph.D.
Assistant Professor, Crop Physiology
Steve McGrath Graduate Research Assistant
Pat Phipps
Professor, Plant Pathology
Tom Isleib, Ph. D. Professor, Peanut Breeder
TECHNICAL SUPPORT:
F. Bryant, Ag Specialist D. Redd, Ag Specialist
P. Copeland, Office Services Specialist C. Daughtrey, Ag Technician B. Kennedy, Ag Technician L. Mehalko, Lab Assistant T. Balota, Ag Technician
Virginia Polytechnic Institute and State University
Virginia Agricultural Experiment Station Tidewater Agricultural Research and Extension Center
Suffolk, Virginia 23437
Information Series No. 493 May 2010
i
ACKNOWLEDGEMENTS
FINANCIAL SUPPORT
The author gratefully acknowledges financial support from the following institutions and organizations:
VirginiaAgriculturalCouncil
VirginiaPeanutBoard
VIRGINIA CROP IMPROVEMENT ASSOCIATION

ii
TECHNICAL SUPPORT
The following agricultural specialists, technicians, and lab assistants are gratefully acknowledged for their
professionalism, and dedication to achieve tasks on time and in a collegial manner: F. Bryant, D. Redd, C.
Daughtrey, B. Kennedy, P. Copeland, L. Mehalko, T. Balota, and graduate research assistant S. McGrath.
Carolyn Daughtrey, below
Brenda Kennedy, above
Doug Redd (left) and Frank Bryant (right)
Louis Mehalko, left, and Pam Copland, right
iii
All of the following cooperators are also acknowledged for their various support provided to the PVQE program in
2009.
LIST OF COOPERATORS
Co-Principal Investigators
Dr. Beth Grabau, PPWS
Dr. Pat Phipps, Tidewater AREC
Dr. Ruth Grene, PPWS
Dr. Eva Collakova, PPWS
Virginia Tech, Virginia Agricultural Experiment Station, and VCIA
Mr. R. D. Ashburn, Farm Manager, Tidewater AREC
Dr. D. A. Herbert, Jr., Tidewater AREC
Dr. D. Holshouser, Tidewater AREC
Mr. B. Beahm, VCIA
Commodity Groups
Mr. D. Cotton, Virginia Peanut Board
Mr. B. Sutter, North Carolina Peanut Board
Companies
Mr. F. Garner, Birdsong Peanut
Mr. K. Bennett, Birdsong Peanut
Mr. J. Laine, Wakefield Peanut Company
Amadas Industries DuPont AMVAC
BASF Corporation Dow Agro Sciences LLC
Bayer Crop Science Helena
Coastal Chemical Corporation Syngenta Crop Protection
Monsanto Valent USA Corporation

iv
ABBREVIATIONS
% Loose Shelled Kernels (%LSK), percent of kernels or portions of kernels free from hulls and scattered throughout
the pod sample.
% Foreign Material (%FM), percent of anything other than mature pods found in the sample, including dirt, vines,
sticks, stones, insects, broken shells, and raisins (immature pods with shriveled and shrunken shells that cannot be
mechanically shelled.
% Moisture, percent kernel moisture at grading, as determined by an electronic moisture meter.
% Fancy, percent pods that ride the 34/64 inch spacing set on the pre-sizer.
% Extra Large Kernels (%ELK), percent kernels which ride a 21.5/64 x 1 inch slotted screen.
% Sound Splits (%SS), percent split or broken kernels which are not damaged. Portions less than 1/4 of a whole
kernel are not included but go into other kernels.
% Damaged Kernels (%DK), percent moldy and decayed kernels, or with skin and flesh discoloration due to insects and weather damage.
% Other Kernels (%OK), percent kernels passing through a 15/64 x 1 inch slotted screen. Splits and broken pieces,
1/4 kernel or larger which pass through this screen are considered SS or DK depending upon their condition.
% Sound Mature Kernels (%SMK), percent whole kernels which ride a 15/64 x 1 inch slotted screen. Splits that ride
this screen are included as SS or DK, as the case may be.
% Total Kernels, percent all kernels in the shelling sample including SMK, SS, OK, and DK.
Support Price ($/cwt), price based on a standard loan price ($358.26 per ton for Virginia-type and $354.40 per ton
for runner-type peanut) taking the various grade factors into consideration.
Yield (lb/A), plot weights converted to an acre basis. All yields are adjusted to a standard 7% moisture with %FM
deducted.
Value ($/A), crop value computed by the following formula:
Value = [Yield - (% LSK)(Yield)] [Support Price/lb] + Yield (% LSK)($.07/lb LSK)

v
TABLE OF CONTENTS
Acknowledgements and Financial Support .................................................................................................... i
Technical Support..........................................................................................................................................ii
List of Cooperators .......................................................................................................................................iii
Abbreviations................................................................................................................................................ iv
List of Tables ................................................................................................................................................vi
Comparisons of Runner- and Virginia-type peanuts ..................................................................................... 1
Comparisons of Advanced Breeding Lines from Virginia & North Carolina............................................. 13
Peanut Variety & Quality Evaluation - Crop Physiology Comparisons ..................................................... 19
vi
List of Tables
1. Names and growth habit of genotypes evaluated in the Runner vs. Virginia Tests in 2009........................ 1 2. Cultural practices used in the Runner vs. Virginia Tests in 2009 ................................................................ 2 3. Effect of variety on emergence and growth of peanut in Field # 6 in 2009................................................. 3 4. Effect of peanut variety on disease incidence in Field # 6........................................................................... 4 5. Effect of variety on the content and brightness of jumbo and fancy pods of the Virginia-type peanut in Field #6 in 2009............................................................................................................................ 5 6. Effect of variety on yield, support price, value and grade characteristics of peanut grown in Field #6 in 2009................................................................................................................. 6 7. Effect of variety on peanut development ..................................................................................................... 7 8. Effect of variety on emergence and growth of peanut in Field # 27 ............................................................ 8 9. Effect of peanut variety on disease incidence in Field # 27......................................................................... 9 10. Effect of variety on yield, value, and grade characteristics of peanut grown in Field # 27 ....................... 10 11. Effect of variety on the content and brightness of jumbo and fancy pods of the Virginia-type peanut in Field # 27 ....................................................................................................... 11 12. Effect of variety on peanut development ................................................................................................... 12 13. Names and growth habit of twenty Virginia-type peanut lines.................................................................. 13 14. Cultural practices used in Breeder/Crop Physiology Test in Field # 6 in 2009 ......................................... 14 15. Effect of variety on emergence and growth of peanut in the Breeder/Crop Physiology Test.................... 15 16. Effect of variety on disease incidence on peanut in the Breeder/Crop Physiology Test ........................... 16 17. Effect of variety on yield, price per pound, value and grade characteristics ............................................. 17 18. Effect of variety on content and brightness of the jumbo and fancy pods ................................................. 18 19. Name and growth habit of genotypes evaluated in the PVQE Test ........................................................... 19 20. Effect of variety and planting date on emergence of peanut in PVQE Test .............................................. 20 21. Effect of variety, planting date, and location on emergence of peanut in PVQE tests in 2009 ................. 21 22. Effect of variety and planting time on emergence of peanut in PVQE tests at Tidewater AREC, Martin Co., NC and Southampton Co., VA ................................................................. 22 23. Effect of variety, planting date, and growth stage on plant dry weight in 2009 ........................................ 23 24. Effect of variety on plant dry weight, pod number, and pod mass per plant in 2009 ................................ 24 25. Effect of variety and planting date on harvest index in PVQE test in 2009 .............................................. 25 26. Reproductive stages of entries in the PVQE test at TAREC, Planting Date 1........................................... 26 27. Reproductive stages of entries in the PVQE test at TAREC, Planting Date 2........................................... 27 28. Reproductive stage observations from the PVQE Test, Planting date 3 .................................................... 28 29. Maturity of peanut cultivars based on color of pod mesocarp after pod blasting at TAREC, Planting Date 1 .......................................................................................................... 29 30. Maturity of peanut cultivars based on color of pod mesocarp after pod blasting at TAREC, Planting Date 2 .......................................................................................................... 30 31. Maturity of peanut cultivars based on color of pod mesocarp after pod blasting at TAREC, Planting Date 3 .......................................................................................................... 31 32. Specific leaf area and leaf area of fifteen fully developed leaves on the main stem.................................. 32 33. Leaf area and stomata number per leaf and leaf sample from Southampton Co., VA............................... 33 34. Leaf area and stomata number per leaf and leaf sample from Tidewater AREC....................................... 34 35. Carbon dioxide assimilation, stomata conductance to water vapor, and transpiration efficiency of peanut plants in early June .................................................................................................... 35 36. Carbon dioxide assimilation, stomata conductance to water vapor, and transpiration efficiency of peanut plants in late June ...................................................................................................... 36 37. Carbon dioxide assimilation, stomata conductance to water vapor, and transpiration efficiency of peanut plants in early July..................................................................................................... 37

vii

1
Peanut Crop Physiology Related Projects @ Tidewater AREC – 2009
Comparisons of Runner- and Virginia-type Peanuts
1. RUNNER vs. VIRGINIA TEST
2. PURPOSE: To test the suitability of growing runner type peanut in V – C region under high input growing conditions.
3. EXPERIMENTAL DESIGN a) Two locations: Hare Farm (Field # 6) and Wayne Farm (Field # 27) b) Four randomized complete blocks with cultivars as the main treatment @ each location c) Plots were 2 × 30-ft long and 36″ wide
4. PLANT MATERIAL
Eleven genotypes are commercial cultivars. Titan is a niche market peanut type released in 2010. 97x22-HO2-2-B2-1-1-1-B is a Florida breeding line. N70-8-24-5-34-9 is a genetically transformed line with Sclerotinia blight resistance gene derived from NC-7. Similarly, W73-25-17-34-8-2-4B and P39-7-9-43-10-10 are transformed lines from Wilson and Perry, respectively.
Table 1. Name, market type, and growth habit of the genotypes evaluated in the Runner vs. Virginia Test in 2009.
Number Variety
Market Type
Growth Habit1
1 Florida 07 Runner R 2 GA Green Runner R 3 GA 03L Runner R 4 AP-4 Runner R 5 CHAMPS Virginia IR 6 Bailey Virginia IR 7 NC-7 Virginia IR 8 Wilson Virginia IR 9 Perry Virginia IR 10 Titan (VT 9506083-3) Virginia IR 11 Sugg Virginia IR 12 97x22-HO2-2-B2-1-1-2-B Virginia IR 13 N70-8-24-5-34-9 Virginia IR 14 W73-25-17-34-8-2-4-B Virginia IR 15 P39-7-9-43-10-10 Virginia IR
1 Plant growth habit classifications: IR = Intermediate Runner; R =Runner

2
Peanut Crop Physiology Related Projects @ Tidewater AREC – 2009
Comparisons of Runner- and Virginia-type Peanuts
5. CULTURAL PRACTICES
Table 2. Soil and crop information for the Runner vs. Virginia Tests, at TAREC (Suffolk), VA, in 2009.
Field # 6 Planting Date April 28, 2009 Seeding Rate: 3 seeds per foot row Harvest Date October 8, 2009 Harvested plot size: 0.0041 acre Soil Type Uchee, Nansemond & Eunola Soil Tests Results pH 6.2 P 23 K 83 Ca 371 Mg 24 Zn 0.6 Mn 2.3 Rotation Corn, cotton, peanut Rain and irrigation 26 inches
Field #27
Planting Date April 29, 2009 Seeding rate: 3 seeds per foot row Harvest Date October 6, 2009 Harvested plot size: 0.0041 acre Soil Type Emporia & Uchee Soil Test Results pH 6.3 P 44 K 65 Ca 272 Mg 45 Zn 1.0 Mn 2.6 Rotation Cotton monoculture Rain and irrigation 23 inches
Field # 6 and # 27 Cultivation 6/23 Soil Fumigant 4/12 – Vapam @ 7.5 gals/A Landplaster 6/19 – Peanut Maker @ 1200 lbs/A
HERBICIDES INSECTICIDES Date Product Rate/Ac Date Product Rate/Ac 4/12 Dual Magnum 1.5 pt 4/28 Temik 7lbs 5/2 Intro 2 qt 5/22 Orthene 97 6 oz 5/2 Gramoxone 14 oz 6/23 Lorsban 13 lbs 5/10 Intro 2 qt 6/30 Asana 6 oz 5/10 Gramoxone 12 oz 8/10 Danitol 10 oz 6/1 Storm 1.5 pts 8/21 Danitol 9 oz 6/23 Intro 1 qt 8/3 Omega 1 pt 8/21 Headline 10 oz 9/1 Omega 1 pt
FERTILISERS FUNGICIDES Date Product Rate/Ac Date Product Rate/Ac 4/12 Boron 1 qt 6/15 Bravo 8 oz 7/27 Boron 1 qt 7/22 Folicur 7.2 oz

3
6/18 Manganese 1.5 qt 8/3 Provost 10 oz 7/27 Manganese 1.5 qt 9/13 Bravo 1.5 pt
Peanut Crop Physiology Related Projects @ Tidewater AREC – 2009
Comparisons of Runner- and Virginia-type Peanuts
6. RESULTS
Table 3. Effect of variety on emergence and growth of peanut in Field # 6. Stand count was taken on 20 May. Plant height and width were measured on 17 July. Variety
Stand Counts1
Plant Height2
Plant Width3
inches NC-7 158.8 a 19.6 ab 74.9 ab Wilson 156.5 ab4 16.4 de 68.5 b-d CHAMPS 154.8 ab 17.6 b-d 79.4 a P39-7-9-43-10-10 153.3 ab 17.3 cd 79.0 a Florida 07 153.3 ab 14.5 ef 75.3 ab N70-8-24-5-34-9 150.5 a-c 20.4 a 70.3 b-d
Perry 147.0 a-c 18.5 a-d 76.3 ab GA Green 145.8 a-d 14.6 ef 65.0 cd AP-4 144.5 a-d 13.3 f 63.6 d Bailey 139.3 a-d 19.5 ab 70.8 b-d Sugg 134.3 b-d 19.8 ab 72.3 a-c W73-25-17-34-8-2-4-B 132.5 b-d 19.1 a-c 71.5 a-d 97x22-HO2-2-B2-1-1-2-B 124.8 cd 17.8 b-d 74.8 ab Titan (VT 9506083-3) 124.5 cd 18.6 a-c 73.8 ab GA 03L 122.8 d 17.0 cd 71.4 a-d Mean 142.8 17.6 72.5 LSD 0.05
5 24.0 2.2 8.2 1 Total number of emerged plants in 2 × 30-ft row plots. To get the number of plants/ft, divide stand count by 60.
2 Main stem height. Each mean is an average of eight plants. 3 Plant maximum lateral spread. Each mean is an average of eight plants. 4 Means sharing the same letter(s) are not statistically different. 5 Fisher’s protected least significant difference (LSD) at P = 0.05.

4
Peanut Crop Physiology Related Projects @ Tidewater AREC – 2009
Comparisons of Runner- and Virginia-type Peanuts
Table 4. Effect of peanut variety on disease incidence in Field # 6. Disease ratings were taken a few days before digging.
Variety Tomato spotted wilt
virus Sclerotinia blight Cylindrocladium
black rot hit count1
Bailey 0.5 e2 0.0 a 0.0 b GA 03L 0.8 e 0.0 a 0.0 b 97x22-HO2-2-B2-1-1-2-B 1.0 de 0.0 a 0.0 b Florida 07 1.3 c-e 0.0 a 0.0 b Wilson 2.5 b-e 0.0 a 0.0 b Sugg 2.5 b-e 0.0 a 0.0 b CHAMPS 3.5 a-d 0.0 a 0.0 b AP-4 3.8 a-c 0.0 a 0.0 b Perry 3.8 a-c 0.0 a 0.0 b Titan (VT 9506083-3) 4.0 ab 0.3 a 0.0 b W73-25-17-34-8-2-4-B 4.0 ab 0.0 a 0.0 b P39-7-9-43-10-10 4.5 ab 0.3 a 0.0 b GA Green 4.8 ab 0.0 a 0.0 b NC-7 4.8 ab 0.3 a 0.0 b N70-8-24-5-34-9 6.0 a 0.0 a 0.3 a Mean 3.19 0.06 0.02 LSD 0.05
3 2.65 0.33 0.18 1 Hit count is a one foot row with plants showing symptoms of Tomato spotted wilt virus, Sclerotinia blight
and Cylindrocladium black rot. 2 Means sharing the same letter(s) are not statistically different. 3 Fisher’s protected least significant difference (LSD) at P = 0.05.
5
Peanut Crop Physiology Related Projects @ Tidewater AREC – 2009
Comparisons of Runner- and Virginia-type Peanuts
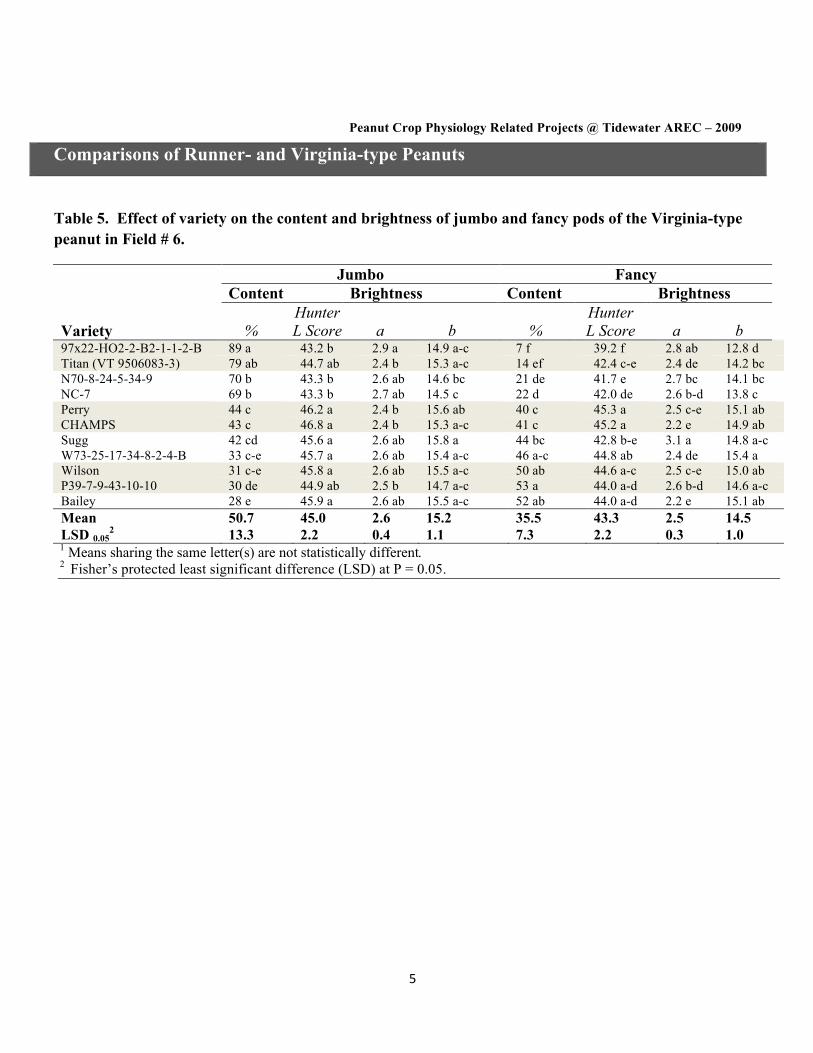
Table 5. Effect of variety on the content and brightness of jumbo and fancy pods of the Virginia-type peanut in Field # 6.
Jumbo Fancy Content Brightness Content Brightness
Variety
% Hunter L Score
a
b
%
Hunter L Score
a
b
97x22-HO2-2-B2-1-1-2-B 89 a 43.2 b 2.9 a 14.9 a-c 7 f 39.2 f 2.8 ab 12.8 d Titan (VT 9506083-3) 79 ab 44.7 ab 2.4 b 15.3 a-c 14 ef 42.4 c-e 2.4 de 14.2 bc N70-8-24-5-34-9 70 b 43.3 b 2.6 ab 14.6 bc 21 de 41.7 e 2.7 bc 14.1 bc NC-7 69 b 43.3 b 2.7 ab 14.5 c 22 d 42.0 de 2.6 b-d 13.8 c Perry 44 c 46.2 a 2.4 b 15.6 ab 40 c 45.3 a 2.5 c-e 15.1 ab CHAMPS 43 c 46.8 a 2.4 b 15.3 a-c 41 c 45.2 a 2.2 e 14.9 ab Sugg 42 cd 45.6 a 2.6 ab 15.8 a 44 bc 42.8 b-e 3.1 a 14.8 a-c W73-25-17-34-8-2-4-B 33 c-e 45.7 a 2.6 ab 15.4 a-c 46 a-c 44.8 ab 2.4 de 15.4 a Wilson 31 c-e 45.8 a 2.6 ab 15.5 a-c 50 ab 44.6 a-c 2.5 c-e 15.0 ab P39-7-9-43-10-10 30 de 44.9 ab 2.5 b 14.7 a-c 53 a 44.0 a-d 2.6 b-d 14.6 a-c Bailey 28 e 45.9 a 2.6 ab 15.5 a-c 52 ab 44.0 a-d 2.2 e 15.1 ab Mean 50.7 45.0 2.6 15.2 35.5 43.3 2.5 14.5 LSD 0.05
2 13.3 2.2 0.4 1.1 7.3 2.2 0.3 1.0 1 Means sharing the same letter(s) are not statistically different. 2 Fisher’s protected least significant difference (LSD) at P = 0.05.
6
Peanut Crop Physiology Related Projects @ Tidewater AREC – 2009
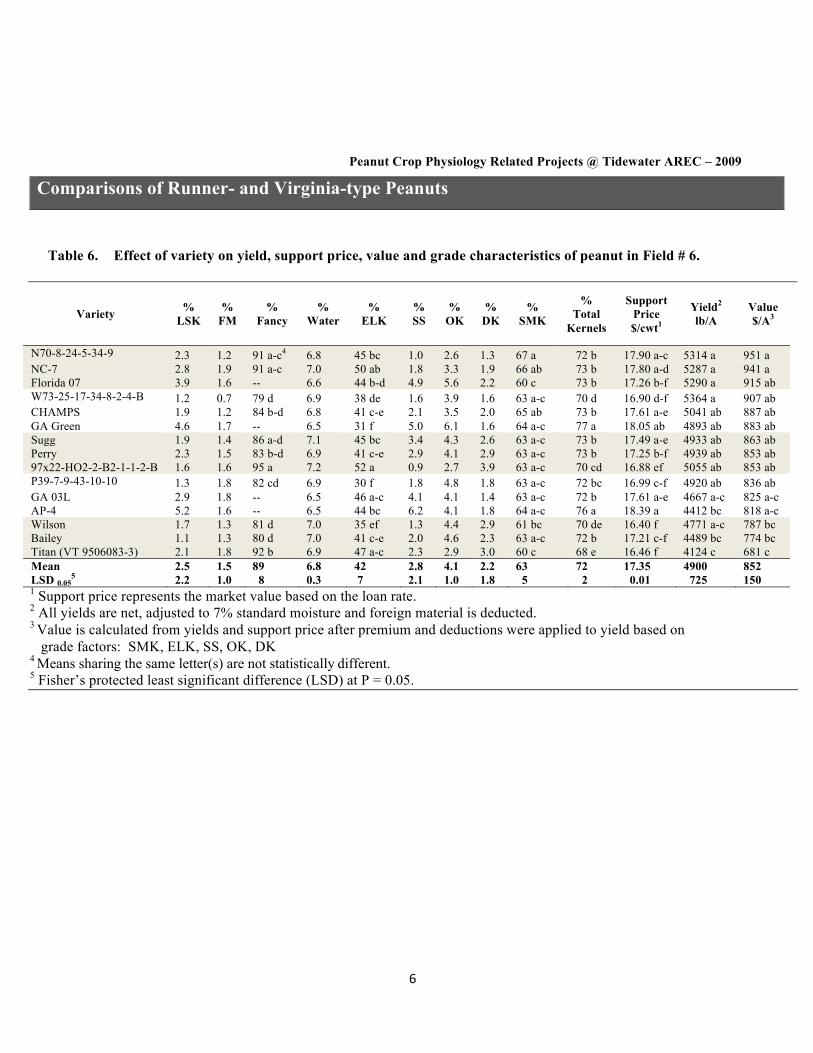
Comparisons of Runner- and Virginia-type Peanuts Table 6. Effect of variety on yield, support price, value and grade characteristics of peanut in Field # 6.
Variety % LSK
% FM
% Fancy
% Water
% ELK
% SS
% OK
% DK
% SMK
% Total
Kernels
Support Price $/cwt1
Yield2 lb/A
Value $/A3
N70-8-24-5-34-9 2.3 1.2 91 a-c4 6.8 45 bc 1.0 2.6 1.3 67 a 72 b 17.90 a-c 5314 a 951 a NC-7 2.8 1.9 91 a-c 7.0 50 ab 1.8 3.3 1.9 66 ab 73 b 17.80 a-d 5287 a 941 a Florida 07 3.9 1.6 -- 6.6 44 b-d 4.9 5.6 2.2 60 c 73 b 17.26 b-f 5290 a 915 ab W73-25-17-34-8-2-4-B 1.2 0.7 79 d 6.9 38 de 1.6 3.9 1.6 63 a-c 70 d 16.90 d-f 5364 a 907 ab CHAMPS 1.9 1.2 84 b-d 6.8 41 c-e 2.1 3.5 2.0 65 ab 73 b 17.61 a-e 5041 ab 887 ab GA Green 4.6 1.7 -- 6.5 31 f 5.0 6.1 1.6 64 a-c 77 a 18.05 ab 4893 ab 883 ab Sugg 1.9 1.4 86 a-d 7.1 45 bc 3.4 4.3 2.6 63 a-c 73 b 17.49 a-e 4933 ab 863 ab Perry 2.3 1.5 83 b-d 6.9 41 c-e 2.9 4.1 2.9 63 a-c 73 b 17.25 b-f 4939 ab 853 ab 97x22-HO2-2-B2-1-1-2-B 1.6 1.6 95 a 7.2 52 a 0.9 2.7 3.9 63 a-c 70 cd 16.88 ef 5055 ab 853 ab P39-7-9-43-10-10 1.3 1.8 82 cd 6.9 30 f 1.8 4.8 1.8 63 a-c 72 bc 16.99 c-f 4920 ab 836 ab GA 03L 2.9 1.8 -- 6.5 46 a-c 4.1 4.1 1.4 63 a-c 72 b 17.61 a-e 4667 a-c 825 a-c AP-4 5.2 1.6 -- 6.5 44 bc 6.2 4.1 1.8 64 a-c 76 a 18.39 a 4412 bc 818 a-c Wilson 1.7 1.3 81 d 7.0 35 ef 1.3 4.4 2.9 61 bc 70 de 16.40 f 4771 a-c 787 bc Bailey 1.1 1.3 80 d 7.0 41 c-e 2.0 4.6 2.3 63 a-c 72 b 17.21 c-f 4489 bc 774 bc Titan (VT 9506083-3) 2.1 1.8 92 b 6.9 47 a-c 2.3 2.9 3.0 60 c 68 e 16.46 f 4124 c 681 c Mean 2.5 1.5 89 6.8 42 2.8 4.1 2.2 63 72 17.35 4900 852 LSD 0.05
5 2.2 1.0 8 0.3 7 2.1 1.0 1.8 5 2 0.01 725 150 1 Support price represents the market value based on the loan rate. 2 All yields are net, adjusted to 7% standard moisture and foreign material is deducted. 3 Value is calculated from yields and support price after premium and deductions were applied to yield based on grade factors: SMK, ELK, SS, OK, DK 4 Means sharing the same letter(s) are not statistically different. 5 Fisher’s protected least significant difference (LSD) at P = 0.05.

7
Peanut Crop Physiology Related Projects @ Tidewater AREC – 2009
Comparisons of Runner- and Virginia-type Peanuts Table7. Effect of variety on peanut development. Observations on reproductive stages were taken daily throughout the growing season.
Variety DAP 50R11
DAP R2
DAP R3
DAP R4
DAP R5
DAP R6
DAP R7
Number of days from
50R1to R4
Number of days from R4to R7
Bailey 47.5 a2 52.3 a 77.3 a 78.5 c 83.0 cd 90.5 e-g -- 26.3 b -- N03091T 47.5 a 52.3 a 76.3 ab 79.5 bc 83.0 cd 95.5 b-e 135.3 a 27.3 b 51.3 a Florida 07 46.8 ab 52.5 a 76.0 ab 80.5 a-c 92.0 ab 100.0 ab 132.5 ab 28.0 b 40.5 a-c Perry 46.5 ab 53.3 a 78.0 a 79.8 bc 86.3 b-d 97.0 b-d 130.7 ab 26.5 b 42.3 a-c P39-7-9-43-10-10 46.5 ab 51.8 ab 77.8 a 80.0 bc 89.8 b-d 97.0 b-d 130.0 ab 28.3 ab 39.0 a-c GA 03L 46.3 ab 52.5 a 78.0 a 80.0 bc 92.0 ab 99.0 a-c 122.5 b 27.5 b 30.5 bc CHAMPS 46.3 ab 52.0 a 76.0 ab 79.0 bc 84.5 b-d 92.0 d-f 125.8 ab 27.0 b 41.3 a-c N70-8-24-5-34-9 46.0 bc 51.5 ab 76.0 ab 78.8 bc 81.0 d 86.0 g 127.0 ab 27.3 b 46.0 ab NC-7 44.8 bc 51.5 ab 72.3 b 78.8 bc 80.5 d 86.0 g 133.3 ab 27.3 b 52.8 a W73-25-17-34-8-2-4-B 43.8 cd 52.0 ab 74.3 ab 78.8 bc 84.0 b-d 92.0 d-f 134.3 ab 26.8 b 50.3 a GA Green 42.8 c-e 52.3 a 77.8 a 84.3 a 97.8 a 103.5 a 129.0 ab 32.0 a 31.3 bc Wilson 42.5 de 51.3 ab 76.3 ab 79.3 bc 84.0 b-d 93.8 d-f 125.3 ab 28.0 ab 39.3 a-c AP-4 42.0 d-f 53.5 a 77.3 a 79.0 bc 87.5 b-d 98.5 a-c 132.8 ab 25.5 b 45.3 ab 97x22-HO2-2-B2-1-1-2-B 41.0 ef 53.3 a 78.0 a 82.8 ab 95.8 a 100.5 ab 122.5 b 29.5 ab 26.8 c Titan (VT 9506083-3) 40.3 f 49.5 b 76.0 ab 81.5 a-c 83.5 cd 89.3 fg 123.5 ab 32.0 a 40.0 a-c Mean 44.7 52.1 76.5 80.0 87.0 94.7 128.9 28.0 41.2 LSD 0.05
3 2.0 2.4 4.4 4.2 8.0 6.0 12.1 4.0 16.2 1 DAP = Days after planting; 50R1 = 50% of plants in a plot have at least one flower; R2 = beginning peg; R3 = beginning pod; R4
= full pod; R5 = beginning seed; R6 = full seed; R7 = beginning maturity. 2 Means sharing the same letter(s) are not statistically different. 3 Fisher’s protected least significant difference (LSD) at P = 0.05.

8
Peanut Crop Physiology Related Projects @ Tidewater AREC – 2009
Comparisons of Runner- and Virginia-type Peanuts
Table 8. Effect of variety on emergence and growth of peanut in Field # 27. Stand count was taken on 22 May. Plant height and width was taken on 17 July.
Variety
Stand Counts1
Plant Height2
Plant Width3
inches NC-7 173.8 a4 16.3 ab 64.9 c-e GA Green 167.5 ab 11.9 f 60.8 de Wilson 166.8 ab 15.1 b-d 69.8 a-c P39-7-9-43-10-10 164.8 a-c 13.6 de 60.1 e AP-4 162.5 a-d 12.0 ef 60.1 e Perry 161.3 a-d 13.8 cd 63.6 de Sugg 159.8 a-d 17.6 a 63.5 de Florida 07 156.8 b-d 11.3 f 66.0 b-d CHAMPS 153.0 b-e 14.5 cd 69.8 a-c N70-8-24-5-34-9 149.8 c-e 15.4 bc 65.4 c-e 97x22-HO2-2-B2-1-1-2-B 148.5 c-e 13.8 cd 71.4 ab Bailey 147.5 de 14.9 b-d 63.8 de W73-25-17-34-8-2-4-B 139.3 ef 14.5 cd 66.1 b-d Titan (VT 9506083-3) 127.5 fg 16.3 ab 73.3 a GA 03L 121.3 g 14.6 b-d 65.0 c-e Mean 153.3 14.4 65.6 LSD 0.05
5 16.6 1.7 5.7 1 Total number of emerged plants in two, 30-ft row plots. To get the number of plants/ft, divide stand count by 60.
2 Main stem height. Each mean is an average of eight plants. 3 Plant maximum lateral spread. Each mean is an average of eight plants. 4 Means sharing the same letter(s) are not statistically different. 5 Fisher’s protected least significant difference (LSD) at P = 0.05.
9
Peanut Crop Physiology Related Projects @ Tidewater AREC – 2009
Comparisons of Runner- and Virginia-type Peanuts
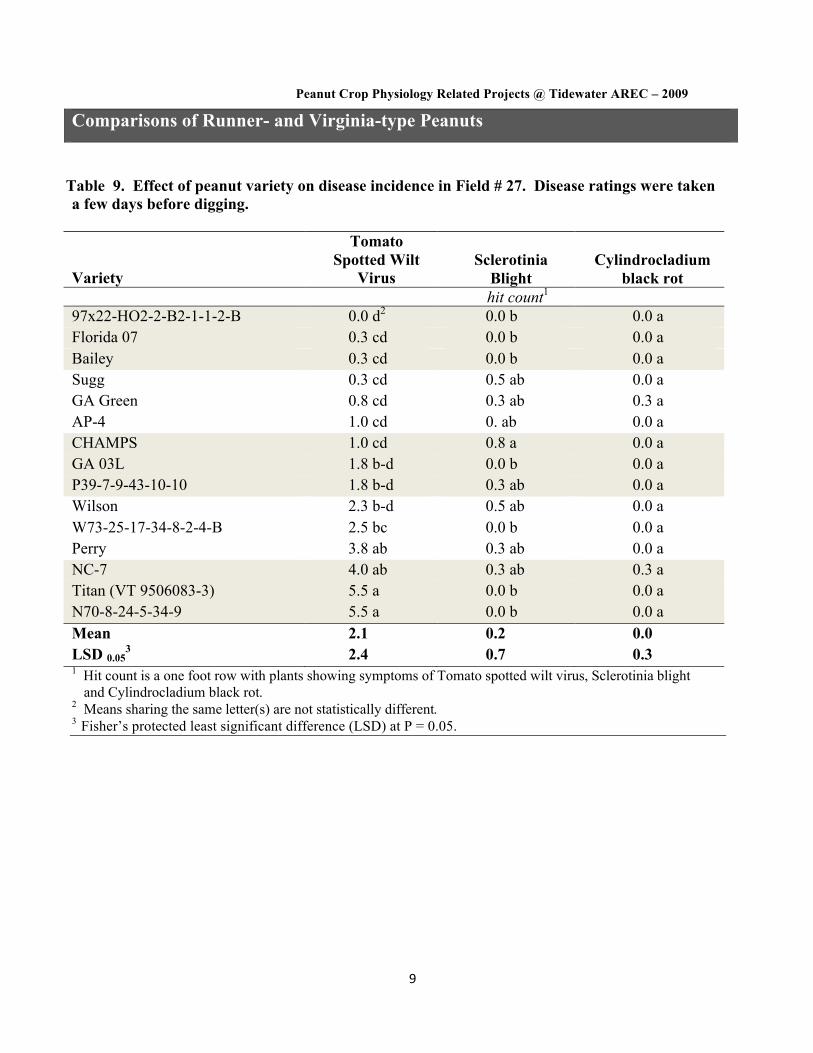
Table 9. Effect of peanut variety on disease incidence in Field # 27. Disease ratings were taken a few days before digging.
Variety
Tomato Spotted Wilt
Virus Sclerotinia
Blight Cylindrocladium
black rot hit count1
97x22-HO2-2-B2-1-1-2-B 0.0 d2 0.0 b 0.0 a Florida 07 0.3 cd 0.0 b 0.0 a Bailey 0.3 cd 0.0 b 0.0 a Sugg 0.3 cd 0.5 ab 0.0 a GA Green 0.8 cd 0.3 ab 0.3 a AP-4 1.0 cd 0. ab 0.0 a CHAMPS 1.0 cd 0.8 a 0.0 a GA 03L 1.8 b-d 0.0 b 0.0 a P39-7-9-43-10-10 1.8 b-d 0.3 ab 0.0 a Wilson 2.3 b-d 0.5 ab 0.0 a W73-25-17-34-8-2-4-B 2.5 bc 0.0 b 0.0 a Perry 3.8 ab 0.3 ab 0.0 a NC-7 4.0 ab 0.3 ab 0.3 a Titan (VT 9506083-3) 5.5 a 0.0 b 0.0 a N70-8-24-5-34-9 5.5 a 0.0 b 0.0 a Mean 2.1 0.2 0.0 LSD 0.05
3 2.4 0.7 0.3 1 Hit count is a one foot row with plants showing symptoms of Tomato spotted wilt virus, Sclerotinia blight
and Cylindrocladium black rot. 2 Means sharing the same letter(s) are not statistically different. 3 Fisher’s protected least significant difference (LSD) at P = 0.05.
10
Peanut Crop Physiology Related Projects @ Tidewater AREC – 2009
Comparisons of Runner- and Virginia-type Peanuts
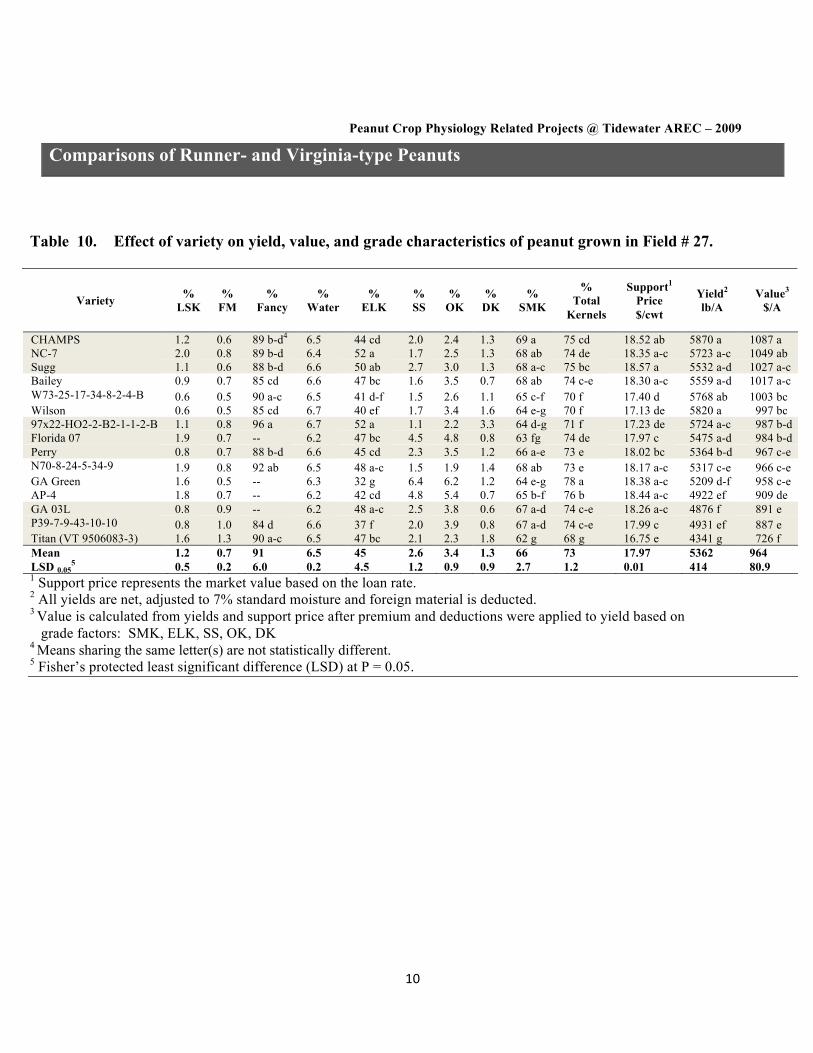
Table 10. Effect of variety on yield, value, and grade characteristics of peanut grown in Field # 27.
Variety % LSK
% FM
% Fancy
% Water
% ELK
% SS
% OK
% DK
% SMK
% Total
Kernels
Support1
Price $/cwt
Yield2 lb/A
Value3
$/A
CHAMPS 1.2 0.6 89 b-d4 6.5 44 cd 2.0 2.4 1.3 69 a 75 cd 18.52 ab 5870 a 1087 a NC-7 2.0 0.8 89 b-d 6.4 52 a 1.7 2.5 1.3 68 ab 74 de 18.35 a-c 5723 a-c 1049 ab Sugg 1.1 0.6 88 b-d 6.6 50 ab 2.7 3.0 1.3 68 a-c 75 bc 18.57 a 5532 a-d 1027 a-c Bailey 0.9 0.7 85 cd 6.6 47 bc 1.6 3.5 0.7 68 ab 74 c-e 18.30 a-c 5559 a-d 1017 a-c W73-25-17-34-8-2-4-B 0.6 0.5 90 a-c 6.5 41 d-f 1.5 2.6 1.1 65 c-f 70 f 17.40 d 5768 ab 1003 bc Wilson 0.6 0.5 85 cd 6.7 40 ef 1.7 3.4 1.6 64 e-g 70 f 17.13 de 5820 a 997 bc 97x22-HO2-2-B2-1-1-2-B 1.1 0.8 96 a 6.7 52 a 1.1 2.2 3.3 64 d-g 71 f 17.23 de 5724 a-c 987 b-d Florida 07 1.9 0.7 -- 6.2 47 bc 4.5 4.8 0.8 63 fg 74 de 17.97 c 5475 a-d 984 b-d Perry 0.8 0.7 88 b-d 6.6 45 cd 2.3 3.5 1.2 66 a-e 73 e 18.02 bc 5364 b-d 967 c-e N70-8-24-5-34-9 1.9 0.8 92 ab 6.5 48 a-c 1.5 1.9 1.4 68 ab 73 e 18.17 a-c 5317 c-e 966 c-e GA Green 1.6 0.5 -- 6.3 32 g 6.4 6.2 1.2 64 e-g 78 a 18.38 a-c 5209 d-f 958 c-e AP-4 1.8 0.7 -- 6.2 42 cd 4.8 5.4 0.7 65 b-f 76 b 18.44 a-c 4922 ef 909 de GA 03L 0.8 0.9 -- 6.2 48 a-c 2.5 3.8 0.6 67 a-d 74 c-e 18.26 a-c 4876 f 891 e P39-7-9-43-10-10 0.8 1.0 84 d 6.6 37 f 2.0 3.9 0.8 67 a-d 74 c-e 17.99 c 4931 ef 887 e Titan (VT 9506083-3) 1.6 1.3 90 a-c 6.5 47 bc 2.1 2.3 1.8 62 g 68 g 16.75 e 4341 g 726 f Mean 1.2 0.7 91 6.5 45 2.6 3.4 1.3 66 73 17.97 5362 964 LSD 0.05
5 0.5 0.2 6.0 0.2 4.5 1.2 0.9 0.9 2.7 1.2 0.01 414 80.9 1 Support price represents the market value based on the loan rate. 2 All yields are net, adjusted to 7% standard moisture and foreign material is deducted. 3 Value is calculated from yields and support price after premium and deductions were applied to yield based on grade factors: SMK, ELK, SS, OK, DK 4 Means sharing the same letter(s) are not statistically different. 5 Fisher’s protected least significant difference (LSD) at P = 0.05.
11
Peanut Crop Physiology Related Projects @ Tidewater AREC – 2009
Comparisons of Runner- and Virginia-type Peanuts
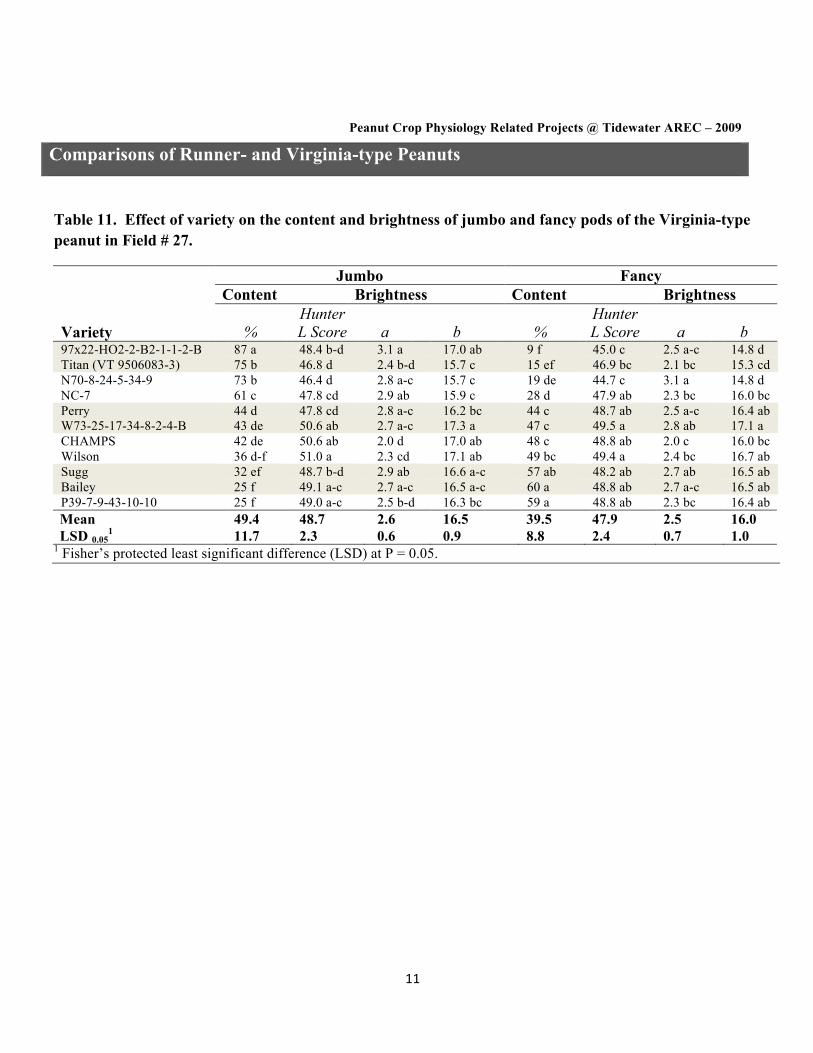
Table 11. Effect of variety on the content and brightness of jumbo and fancy pods of the Virginia-type peanut in Field # 27.
Jumbo Fancy Content Brightness Content Brightness
Variety
% Hunter L Score
a
b
%
Hunter L Score
a
b
97x22-HO2-2-B2-1-1-2-B 87 a 48.4 b-d 3.1 a 17.0 ab 9 f 45.0 c 2.5 a-c 14.8 d Titan (VT 9506083-3) 75 b 46.8 d 2.4 b-d 15.7 c 15 ef 46.9 bc 2.1 bc 15.3 cd N70-8-24-5-34-9 73 b 46.4 d 2.8 a-c 15.7 c 19 de 44.7 c 3.1 a 14.8 d NC-7 61 c 47.8 cd 2.9 ab 15.9 c 28 d 47.9 ab 2.3 bc 16.0 bc Perry 44 d 47.8 cd 2.8 a-c 16.2 bc 44 c 48.7 ab 2.5 a-c 16.4 ab W73-25-17-34-8-2-4-B 43 de 50.6 ab 2.7 a-c 17.3 a 47 c 49.5 a 2.8 ab 17.1 a CHAMPS 42 de 50.6 ab 2.0 d 17.0 ab 48 c 48.8 ab 2.0 c 16.0 bc Wilson 36 d-f 51.0 a 2.3 cd 17.1 ab 49 bc 49.4 a 2.4 bc 16.7 ab Sugg 32 ef 48.7 b-d 2.9 ab 16.6 a-c 57 ab 48.2 ab 2.7 ab 16.5 ab Bailey 25 f 49.1 a-c 2.7 a-c 16.5 a-c 60 a 48.8 ab 2.7 a-c 16.5 ab P39-7-9-43-10-10 25 f 49.0 a-c 2.5 b-d 16.3 bc 59 a 48.8 ab 2.3 bc 16.4 ab Mean 49.4 48.7 2.6 16.5 39.5 47.9 2.5 16.0 LSD 0.05
1 11.7 2.3 0.6 0.9 8.8 2.4 0.7 1.0 1 Fisher’s protected least significant difference (LSD) at P = 0.05.
12
Peanut Crop Physiology Related Projects @ Tidewater AREC – 2009
Comparisons of Runner- and Virginia-type Peanuts
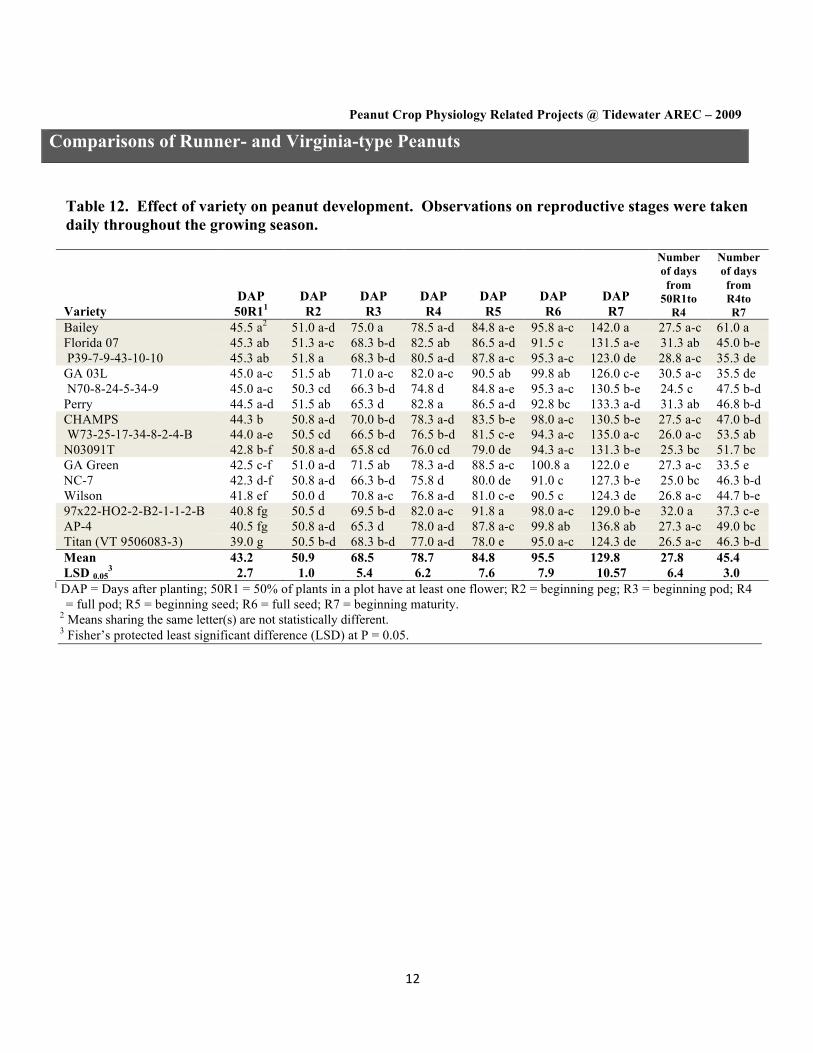
Table 12. Effect of variety on peanut development. Observations on reproductive stages were taken daily throughout the growing season.
Variety DAP
50R11 DAP R2
DAP R3
DAP R4
DAP R5
DAP R6
DAP R7
Number of days from
50R1to R4
Number of days from R4to R7
Bailey 45.5 a2 51.0 a-d 75.0 a 78.5 a-d 84.8 a-e 95.8 a-c 142.0 a 27.5 a-c 61.0 a Florida 07 45.3 ab 51.3 a-c 68.3 b-d 82.5 ab 86.5 a-d 91.5 c 131.5 a-e 31.3 ab 45.0 b-e P39-7-9-43-10-10 45.3 ab 51.8 a 68.3 b-d 80.5 a-d 87.8 a-c 95.3 a-c 123.0 de 28.8 a-c 35.3 de GA 03L 45.0 a-c 51.5 ab 71.0 a-c 82.0 a-c 90.5 ab 99.8 ab 126.0 c-e 30.5 a-c 35.5 de N70-8-24-5-34-9 45.0 a-c 50.3 cd 66.3 b-d 74.8 d 84.8 a-e 95.3 a-c 130.5 b-e 24.5 c 47.5 b-d Perry 44.5 a-d 51.5 ab 65.3 d 82.8 a 86.5 a-d 92.8 bc 133.3 a-d 31.3 ab 46.8 b-d CHAMPS 44.3 b 50.8 a-d 70.0 b-d 78.3 a-d 83.5 b-e 98.0 a-c 130.5 b-e 27.5 a-c 47.0 b-d W73-25-17-34-8-2-4-B 44.0 a-e 50.5 cd 66.5 b-d 76.5 b-d 81.5 c-e 94.3 a-c 135.0 a-c 26.0 a-c 53.5 ab N03091T 42.8 b-f 50.8 a-d 65.8 cd 76.0 cd 79.0 de 94.3 a-c 131.3 b-e 25.3 bc 51.7 bc GA Green 42.5 c-f 51.0 a-d 71.5 ab 78.3 a-d 88.5 a-c 100.8 a 122.0 e 27.3 a-c 33.5 e NC-7 42.3 d-f 50.8 a-d 66.3 b-d 75.8 d 80.0 de 91.0 c 127.3 b-e 25.0 bc 46.3 b-d Wilson 41.8 ef 50.0 d 70.8 a-c 76.8 a-d 81.0 c-e 90.5 c 124.3 de 26.8 a-c 44.7 b-e 97x22-HO2-2-B2-1-1-2-B 40.8 fg 50.5 d 69.5 b-d 82.0 a-c 91.8 a 98.0 a-c 129.0 b-e 32.0 a 37.3 c-e AP-4 40.5 fg 50.8 a-d 65.3 d 78.0 a-d 87.8 a-c 99.8 ab 136.8 ab 27.3 a-c 49.0 bc Titan (VT 9506083-3) 39.0 g 50.5 b-d 68.3 b-d 77.0 a-d 78.0 e 95.0 a-c 124.3 de 26.5 a-c 46.3 b-d Mean 43.2 50.9 68.5 78.7 84.8 95.5 129.8 27.8 45.4 LSD 0.05
3 2.7 1.0 5.4 6.2 7.6 7.9 10.57 6.4 3.0 1 DAP = Days after planting; 50R1 = 50% of plants in a plot have at least one flower; R2 = beginning peg; R3 = beginning pod; R4
= full pod; R5 = beginning seed; R6 = full seed; R7 = beginning maturity. 2 Means sharing the same letter(s) are not statistically different. 3 Fisher’s protected least significant difference (LSD) at P = 0.05.

13
Peanut Crop Physiology Related Projects @ Tidewater AREC – 2009
Comparison of Advanced Breeding Lines from Virginia & North Carolina
1. BREEDER/CROP PHYSIOLOGY TEST
2. PURPOSE: To compare yield, grade, and disease of a set of 19 advanced breeding lines of the Virginia-type peanut
3. 4. EXPERIMENTAL DESIGN
a) Four randomized complete blocks with cultivars as the main treatment @ each location b) Plots were 2 × 30-ft long and 36″ wide
5. PLANT MATERIAL
Table 13. Name. source, and growth habit of nineteen Virginia-type peanut advanced breeding lines and CHAMPS used as the check.
Number Variety
Market Type
Growth Habit
1 CHAMPS Check IR 2 VT 024077 Virginia Tech IR 3 VT 004152 Virginia Tech IR 4 VT 003194 Virginia Tech IR 5 VT 003069 Virginia Tech IR 6 VT 003191 Virginia Tech IR 7 VT 003192 Virginia Tech IR 8 VT 003200 Virginia Tech IR 9 VT 024024 Virginia Tech IR 10 VT 023117 Virginia Tech IR 11 VT 024051 Virginia Tech IR 12 N06054C NCSU IR 13 N06056LT NCSU IR 14 N06065CT NCSU IR 15 N06066T NCSU IR 16 N07001 NCSU IR 17 N07020JLSm NCSU IR 18 N07033olSm NCSU IR 19 N07036olSmT NCSU IR 20 N07037olSm NCSU IR
1 Plant growth habit classifications: IR = Intermediate Runner

14
Peanut Crop Physiology Related Projects @ Tidewater AREC – 2009
Comparisons of Advanced Breeding Lines from Virginia & North Carolina
6. CULTURAL PRACTICES
Table 14. Cultural practices used in Breeder/Crop Physiology Test, at TAREC (Suffolk), VA, in 2009.
Planting Date April 28, 2009 Seeding rate: 3 seeds per foot row Harvest Date October 13, 2009 Harvested plot size: 0.0041 acre Soil Type Uchee, Nansemond & Eunola Rotation Corn, cotton, peanut Soil Test Results pH P K Ca Mg Zn Mn 6.43 23 83 371 24 0.6 2.3 Rain and irrigation 26 inches Cultivation 6/23 Soil Fumigant 4/11 – Vapam @ 7.5 gals/A Landplaster 6/19 – Peanut Maker @ 1200 lbs/A
HERBICIDES INSECTICIDES Date Product Rate/Ac Date Product Rate/Ac 4/12 Dual 1.5 pt 4/28 Temik 7.5 lbs 5/12 Intro 2 qt 4/28 Lorsban 6/23 5/12 Gramoxone 14 oz 6/30 Orthene 97 6 0z 6/21 Intro 1 qt 6/30 Asana 6 oz 5/10 Gramoxone 12 oz 8/3 Danitol 10 oz 6/1 Storm 1.5 pt 8/21 Danitol 9 oz 6/23 Intro 1 qt 8/3 Omega 1 pt 8/21 Headline 10 oz 8/21 Omega 1 pt FERTILISERS FUNGICIDES Date Product Rate/Ac Date Product Rate/Ac 4/12 Boron 1 qt 6/15 Bravo 3/4 pt 7/22 Boron 1 qt 7/22 Folicur 7.2 oz 6/15 Manganese 1.5 qt 8/3 Provost 10 oz 7/22 Manganese 1 qt 9/1 Bravo 1.5 pt
15
Peanut Crop Physiology Related Projects @ Tidewater AREC – 2009
Comparisons of Advanced Breeding Lines from Virginia & North Carolina
7. RESULTS
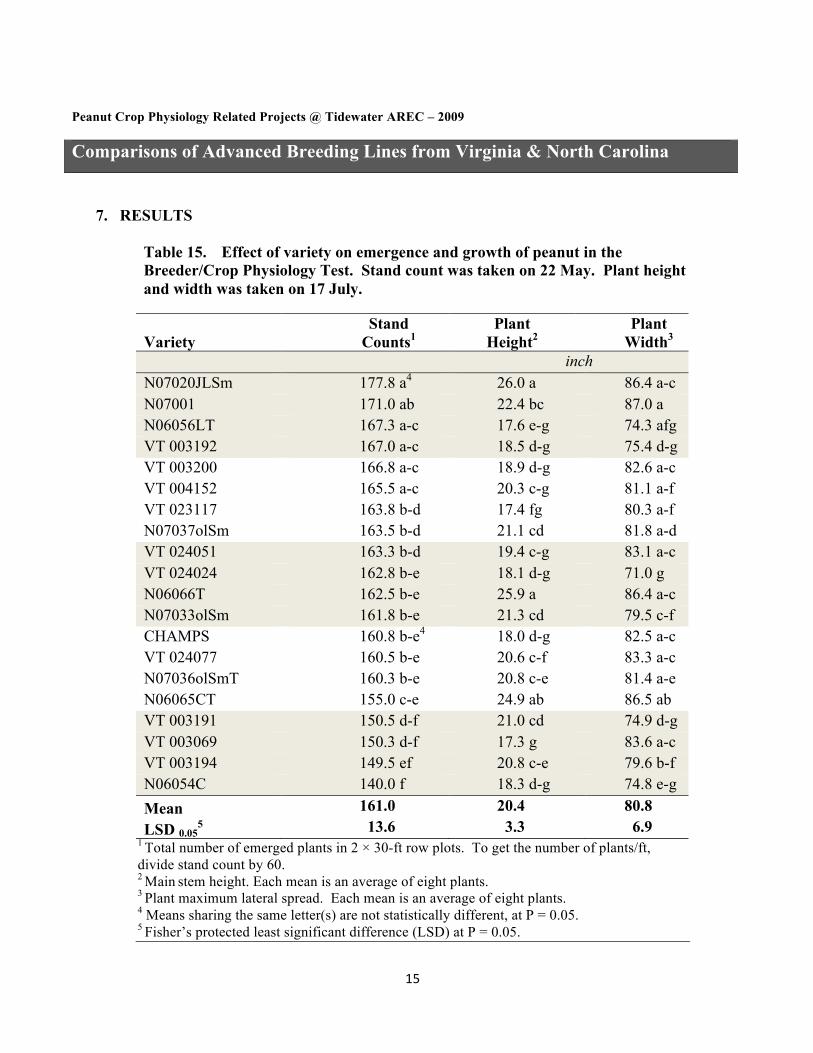
Table 15. Effect of variety on emergence and growth of peanut in the Breeder/Crop Physiology Test. Stand count was taken on 22 May. Plant height and width was taken on 17 July.
Variety
Stand Counts1
Plant Height2
Plant Width3
inch N07020JLSm 177.8 a4 26.0 a 86.4 a-c N07001 171.0 ab 22.4 bc 87.0 a N06056LT 167.3 a-c 17.6 e-g 74.3 afg VT 003192 167.0 a-c 18.5 d-g 75.4 d-g VT 003200 166.8 a-c 18.9 d-g 82.6 a-c VT 004152 165.5 a-c 20.3 c-g 81.1 a-f VT 023117 163.8 b-d 17.4 fg 80.3 a-f N07037olSm 163.5 b-d 21.1 cd 81.8 a-d VT 024051 163.3 b-d 19.4 c-g 83.1 a-c VT 024024 162.8 b-e 18.1 d-g 71.0 g N06066T 162.5 b-e 25.9 a 86.4 a-c N07033olSm 161.8 b-e 21.3 cd 79.5 c-f CHAMPS 160.8 b-e4 18.0 d-g 82.5 a-c VT 024077 160.5 b-e 20.6 c-f 83.3 a-c N07036olSmT 160.3 b-e 20.8 c-e 81.4 a-e N06065CT 155.0 c-e 24.9 ab 86.5 ab VT 003191 150.5 d-f 21.0 cd 74.9 d-g VT 003069 150.3 d-f 17.3 g 83.6 a-c VT 003194 149.5 ef 20.8 c-e 79.6 b-f N06054C 140.0 f 18.3 d-g 74.8 e-g Mean 161.0 20.4 80.8 LSD 0.05
5 13.6 3.3 6.9 1 Total number of emerged plants in 2 × 30-ft row plots. To get the number of plants/ft, divide stand count by 60. 2 Main stem height. Each mean is an average of eight plants. 3 Plant maximum lateral spread. Each mean is an average of eight plants. 4 Means sharing the same letter(s) are not statistically different, at P = 0.05. 5 Fisher’s protected least significant difference (LSD) at P = 0.05.
16
Peanut Crop Physiology Related Projects @ Tidewater AREC – 2009
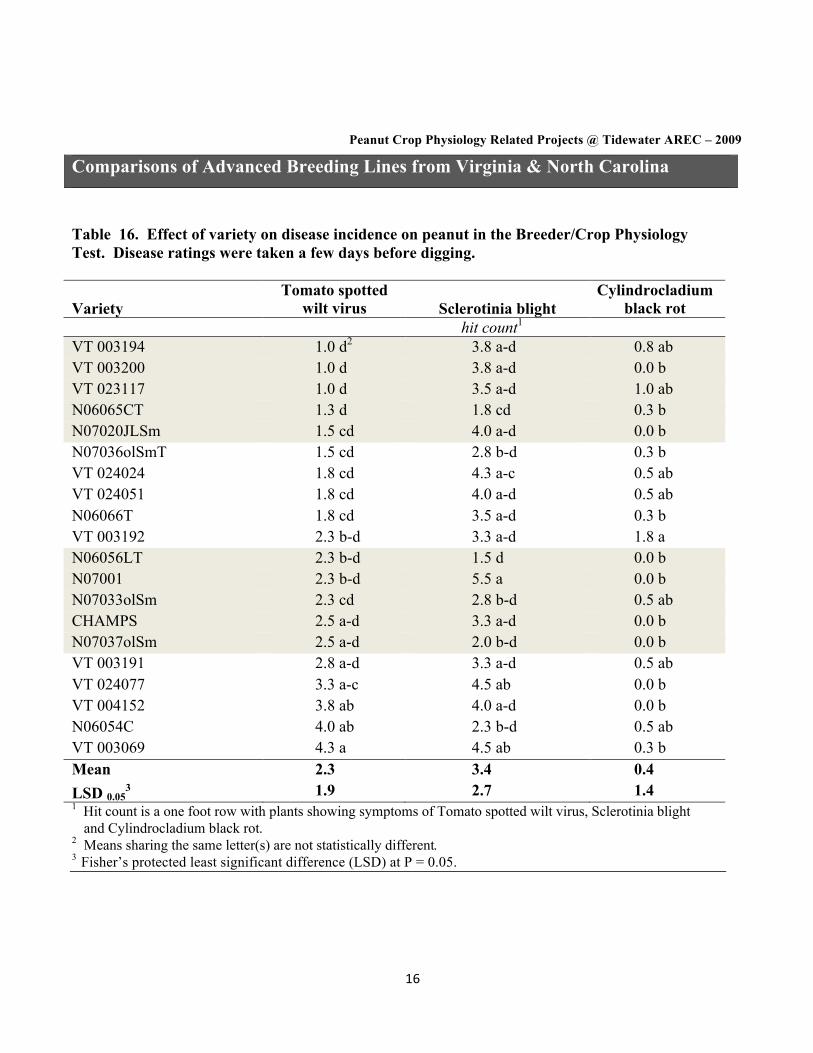
Comparisons of Advanced Breeding Lines from Virginia & North Carolina Table 16. Effect of variety on disease incidence on peanut in the Breeder/Crop Physiology Test. Disease ratings were taken a few days before digging.
Variety Tomato spotted
wilt virus Sclerotinia blight Cylindrocladium
black rot hit count1
VT 003194 1.0 d2 3.8 a-d 0.8 ab VT 003200 1.0 d 3.8 a-d 0.0 b VT 023117 1.0 d 3.5 a-d 1.0 ab N06065CT 1.3 d 1.8 cd 0.3 b N07020JLSm 1.5 cd 4.0 a-d 0.0 b N07036olSmT 1.5 cd 2.8 b-d 0.3 b VT 024024 1.8 cd 4.3 a-c 0.5 ab VT 024051 1.8 cd 4.0 a-d 0.5 ab N06066T 1.8 cd 3.5 a-d 0.3 b VT 003192 2.3 b-d 3.3 a-d 1.8 a N06056LT 2.3 b-d 1.5 d 0.0 b N07001 2.3 b-d 5.5 a 0.0 b N07033olSm 2.3 cd 2.8 b-d 0.5 ab CHAMPS 2.5 a-d 3.3 a-d 0.0 b N07037olSm 2.5 a-d 2.0 b-d 0.0 b VT 003191 2.8 a-d 3.3 a-d 0.5 ab VT 024077 3.3 a-c 4.5 ab 0.0 b VT 004152 3.8 ab 4.0 a-d 0.0 b N06054C 4.0 ab 2.3 b-d 0.5 ab VT 003069 4.3 a 4.5 ab 0.3 b Mean 2.3 3.4 0.4 LSD 0.05
3 1.9 2.7 1.4 1 Hit count is a one foot row with plants showing symptoms of Tomato spotted wilt virus, Sclerotinia blight
and Cylindrocladium black rot. 2 Means sharing the same letter(s) are not statistically different. 3 Fisher’s protected least significant difference (LSD) at P = 0.05.
17
Peanut Crop Physiology Related Projects @ Tidewater AREC – 2009
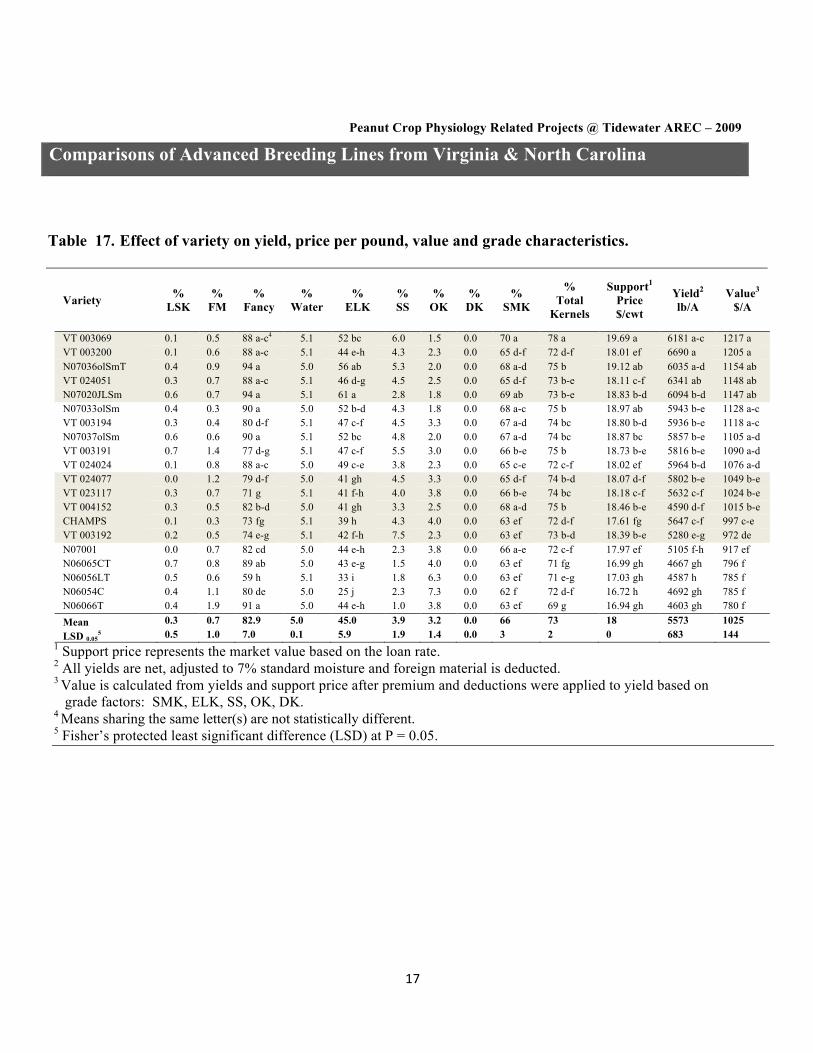
Comparisons of Advanced Breeding Lines from Virginia & North Carolina Table 17. Effect of variety on yield, price per pound, value and grade characteristics.
Variety % LSK
% FM
% Fancy
% Water
% ELK
% SS
% OK
% DK
% SMK
% Total
Kernels
Support1
Price $/cwt
Yield2 lb/A
Value3
$/A
VT 003069 0.1 0.5 88 a-c4 5.1 52 bc 6.0 1.5 0.0 70 a 78 a 19.69 a 6181 a-c 1217 a VT 003200 0.1 0.6 88 a-c 5.1 44 e-h 4.3 2.3 0.0 65 d-f 72 d-f 18.01 ef 6690 a 1205 a N07036olSmT 0.4 0.9 94 a 5.0 56 ab 5.3 2.0 0.0 68 a-d 75 b 19.12 ab 6035 a-d 1154 ab VT 024051 0.3 0.7 88 a-c 5.1 46 d-g 4.5 2.5 0.0 65 d-f 73 b-e 18.11 c-f 6341 ab 1148 ab N07020JLSm 0.6 0.7 94 a 5.1 61 a 2.8 1.8 0.0 69 ab 73 b-e 18.83 b-d 6094 b-d 1147 ab N07033olSm 0.4 0.3 90 a 5.0 52 b-d 4.3 1.8 0.0 68 a-c 75 b 18.97 ab 5943 b-e 1128 a-c VT 003194 0.3 0.4 80 d-f 5.1 47 c-f 4.5 3.3 0.0 67 a-d 74 bc 18.80 b-d 5936 b-e 1118 a-c N07037olSm 0.6 0.6 90 a 5.1 52 bc 4.8 2.0 0.0 67 a-d 74 bc 18.87 bc 5857 b-e 1105 a-d VT 003191 0.7 1.4 77 d-g 5.1 47 c-f 5.5 3.0 0.0 66 b-e 75 b 18.73 b-e 5816 b-e 1090 a-d VT 024024 0.1 0.8 88 a-c 5.0 49 c-e 3.8 2.3 0.0 65 c-e 72 c-f 18.02 ef 5964 b-d 1076 a-d VT 024077 0.0 1.2 79 d-f 5.0 41 gh 4.5 3.3 0.0 65 d-f 74 b-d 18.07 d-f 5802 b-e 1049 b-e VT 023117 0.3 0.7 71 g 5.1 41 f-h 4.0 3.8 0.0 66 b-e 74 bc 18.18 c-f 5632 c-f 1024 b-e VT 004152 0.3 0.5 82 b-d 5.0 41 gh 3.3 2.5 0.0 68 a-d 75 b 18.46 b-e 4590 d-f 1015 b-e CHAMPS 0.1 0.3 73 fg 5.1 39 h 4.3 4.0 0.0 63 ef 72 d-f 17.61 fg 5647 c-f 997 c-e VT 003192 0.2 0.5 74 e-g 5.1 42 f-h 7.5 2.3 0.0 63 ef 73 b-d 18.39 b-e 5280 e-g 972 de N07001 0.0 0.7 82 cd 5.0 44 e-h 2.3 3.8 0.0 66 a-e 72 c-f 17.97 ef 5105 f-h 917 ef N06065CT 0.7 0.8 89 ab 5.0 43 e-g 1.5 4.0 0.0 63 ef 71 fg 16.99 gh 4667 gh 796 f N06056LT 0.5 0.6 59 h 5.1 33 i 1.8 6.3 0.0 63 ef 71 e-g 17.03 gh 4587 h 785 f N06054C 0.4 1.1 80 de 5.0 25 j 2.3 7.3 0.0 62 f 72 d-f 16.72 h 4692 gh 785 f N06066T 0.4 1.9 91 a 5.0 44 e-h 1.0 3.8 0.0 63 ef 69 g 16.94 gh 4603 gh 780 f Mean 0.3 0.7 82.9 5.0 45.0 3.9 3.2 0.0 66 73 18 5573 1025 LSD 0.05
5 0.5 1.0 7.0 0.1 5.9 1.9 1.4 0.0 3 2 0 683 144 1 Support price represents the market value based on the loan rate. 2 All yields are net, adjusted to 7% standard moisture and foreign material is deducted. 3 Value is calculated from yields and support price after premium and deductions were applied to yield based on grade factors: SMK, ELK, SS, OK, DK. 4 Means sharing the same letter(s) are not statistically different. 5 Fisher’s protected least significant difference (LSD) at P = 0.05.
18
Peanut Crop Physiology Related Projects @ Tidewater AREC – 2009
Comparisons of Advanced Breeding Lines from Virginia & North Carolina
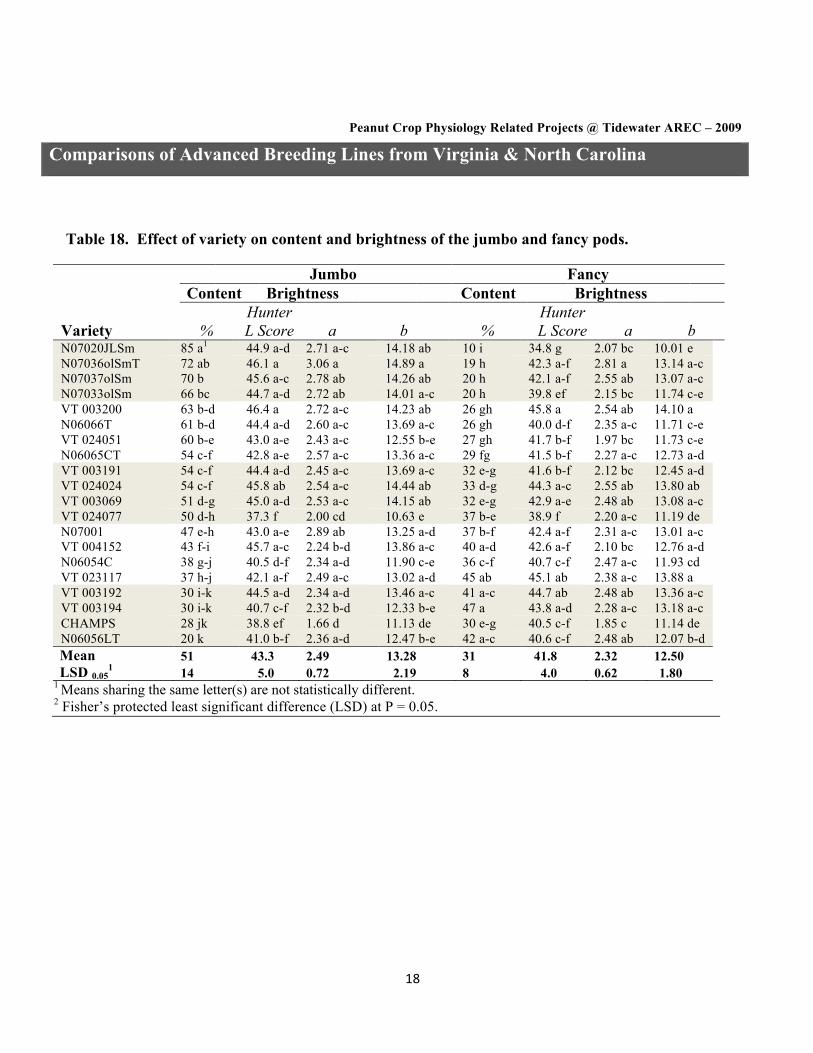
Table 18. Effect of variety on content and brightness of the jumbo and fancy pods.
Jumbo Fancy Content Brightness Content Brightness
Variety
% Hunter L Score
a
b
%
Hunter L Score
a
b
N07020JLSm 85 a1 44.9 a-d 2.71 a-c 14.18 ab 10 i 34.8 g 2.07 bc 10.01 e N07036olSmT 72 ab 46.1 a 3.06 a 14.89 a 19 h 42.3 a-f 2.81 a 13.14 a-c N07037olSm 70 b 45.6 a-c 2.78 ab 14.26 ab 20 h 42.1 a-f 2.55 ab 13.07 a-c N07033olSm 66 bc 44.7 a-d 2.72 ab 14.01 a-c 20 h 39.8 ef 2.15 bc 11.74 c-e VT 003200 63 b-d 46.4 a 2.72 a-c 14.23 ab 26 gh 45.8 a 2.54 ab 14.10 a N06066T 61 b-d 44.4 a-d 2.60 a-c 13.69 a-c 26 gh 40.0 d-f 2.35 a-c 11.71 c-e VT 024051 60 b-e 43.0 a-e 2.43 a-c 12.55 b-e 27 gh 41.7 b-f 1.97 bc 11.73 c-e N06065CT 54 c-f 42.8 a-e 2.57 a-c 13.36 a-c 29 fg 41.5 b-f 2.27 a-c 12.73 a-d VT 003191 54 c-f 44.4 a-d 2.45 a-c 13.69 a-c 32 e-g 41.6 b-f 2.12 bc 12.45 a-d VT 024024 54 c-f 45.8 ab 2.54 a-c 14.44 ab 33 d-g 44.3 a-c 2.55 ab 13.80 ab VT 003069 51 d-g 45.0 a-d 2.53 a-c 14.15 ab 32 e-g 42.9 a-e 2.48 ab 13.08 a-c VT 024077 50 d-h 37.3 f 2.00 cd 10.63 e 37 b-e 38.9 f 2.20 a-c 11.19 de N07001 47 e-h 43.0 a-e 2.89 ab 13.25 a-d 37 b-f 42.4 a-f 2.31 a-c 13.01 a-c VT 004152 43 f-i 45.7 a-c 2.24 b-d 13.86 a-c 40 a-d 42.6 a-f 2.10 bc 12.76 a-d N06054C 38 g-j 40.5 d-f 2.34 a-d 11.90 c-e 36 c-f 40.7 c-f 2.47 a-c 11.93 cd VT 023117 37 h-j 42.1 a-f 2.49 a-c 13.02 a-d 45 ab 45.1 ab 2.38 a-c 13.88 a VT 003192 30 i-k 44.5 a-d 2.34 a-d 13.46 a-c 41 a-c 44.7 ab 2.48 ab 13.36 a-c VT 003194 30 i-k 40.7 c-f 2.32 b-d 12.33 b-e 47 a 43.8 a-d 2.28 a-c 13.18 a-c CHAMPS 28 jk 38.8 ef 1.66 d 11.13 de 30 e-g 40.5 c-f 1.85 c 11.14 de N06056LT 20 k 41.0 b-f 2.36 a-d 12.47 b-e 42 a-c 40.6 c-f 2.48 ab 12.07 b-d Mean 51 43.3 2.49 13.28 31 41.8 2.32 12.50 LSD 0.05
1 14 5.0 0.72 2.19 8 4.0 0.62 1.80 1 Means sharing the same letter(s) are not statistically different. 2 Fisher’s protected least significant difference (LSD) at P = 0.05.

19
Peanut Crop Physiology Related Projects @ Tidewater AREC – 2009
Peanut Variety and Quality Evaluations – Crop Physiological Tests 1. PEANUT VARIETY AND QUALITY EVALUATION 2. PURPOSE: To identify early maturing and water use efficient cultivars and lines 3. EXPERIMENTAL DESIGN:
a) Location: Suffolk and Southampton Co., VA, and Martin Co., NC. b) Three randomized complete blocks with planting date and genotype as treatments @ each
location c) Plots were 2 × 40-ft long and 36″ wide
4. PLANT MATERIAL Table 19. Name, source, market type, and growth habit of the genotypes evaluated in the PVQE Test at Tidewater AREC (Suffolk), VA in 2009.
Variety or Line Source Market Type Growth Habit1
NC-V 11 Commercial cultivar Virginia IR Gregory Commercial cultivar Virginia IR Perry Commercial cultivar Virginia IR CHAMPS Commercial cultivar Virginia R Phillips Commercial cultivar Virginia IR Bailey Commercial cultivar Virginia IR Georgia 08V Commercial cultivar Virginia IR Florida Fancy Commercial cultivar Virginia IR VA 98R Commercial cultivar Virginia R Sugg Commercial cultivar Virginia IR VT 024077 Virginia Tech Virginia IR VT 004152 Virginia Tech Virginia IR VT 003194 Virginia Tech Virginia IR VT 003069 Virginia Tech Virginia IR VT 003191 Virginia Tech Virginia IR VT 003192 Virginia Tech Virginia IR VT 003200 Virginia Tech Virginia IR VT 024024 Virginia Tech Virginia IR VT 023117 Virginia Tech Virginia IR VT 024051 Virginia Tech Virginia IR N03023EF NCSU Virginia IR N04074FCT NCSU Virginia IR N05006 NCSU Virginia IR N05007 NCSU Virginia IR N05008 NCSU Virginia IR N05018 NCSU Virginia IR N03088T NCSU Virginia IR N05024J NCSU Virginia IR N05049J NCSU Virginia IR
20
HST 02-08 NCSU Virginia B 1 Plant growth habit classifications: IR = Intermediate Runner; B = Bunch; R = Runner

21
Peanut Crop Physiology Related Projects @ Tidewater AREC – 2009
Peanut Variety & Quality Evaluation Crop Physiology Comparisons
5. CULTURAL PRACTICES @ http://pubs.ext.vt.edu/3001/3001-1432/3001-1432.html 6. RESULTS
Table 20. Effect of variety and planting date on emergence of peanut in PVQE test at Tidewater AREC (Suffolk), VA in 2009.
Stand Count1
Variety Plant Date 04/20/09 Plant Date 05/01/09 (13 May) (1 June) N03088T 186.7 a2 199.0 a-e VT 024051 183.3 ab 219.7 a VT 003191 179.7 a-c 190.7 a-e VT 003192 178.3 a-d 210.0 a-c N04074FCT 177.7 a-d 199.7 a-e VT 003194 176.0 a-d 201.7 a-d N05024J 176.0 a-d 216.3 ab N05007 175.3 a-e 203.7 a-d VT 023117 175.0 a-e 212.7 a-c Phillips 174.7 a-e 215.7 ab VT 024077 173.0 a-e 195.7 a-e Sugg 171.7 a-f 186.7 a-e N03023EF 171.7 a-f 179.3 c-e VT 003069 171.0 a-f 185.3 a-e N05018 170.7 a-f 201.0 a-d VT 003200 168.3 a-f 198.3 a-e NC-V 11 167.7 a-f 204.3 a-d N05049J 166.0 a-f 194.3 a-e CHAMPS 164.3 a-g 205.3 a-d N05006 161.7 a-g 174.3 de VT 004152 161.3 a-g 203.0 a-d Perry 161.0 a-g 192.0 a-e HST 02-08 157.3 b-h 216.7 ab Bailey 155.7 b-h 183.0 b-e VA 98R 155.0 c-h 212.3 a-c Gregory 150.7 d-h 199.0 a-e VT 024024 147.7 e-h 212.3 a-c N05008 145.0 f-h 188.0 a-e Florida Fancy 138.0 gh 178.7 c-e Georgia 08V 130.7 h 165.0 e Mean 165.71 198.12 LSD 0.05
3 27.69 34.98 1 Total number of emerged plants in 2 × 40-ft row plots. To get the number of plants/ft, divide stand count by 60. 2 Means sharing the same letter(s) are not statistically different. 3 Fisher’s protected least significant difference (LSD) at P = 0.05.
22
Peanut Crop Physiology Related Projects @ Tidewater AREC – 2009
Peanut Variety & Quality Evaluation Crop Physiology Comparisons
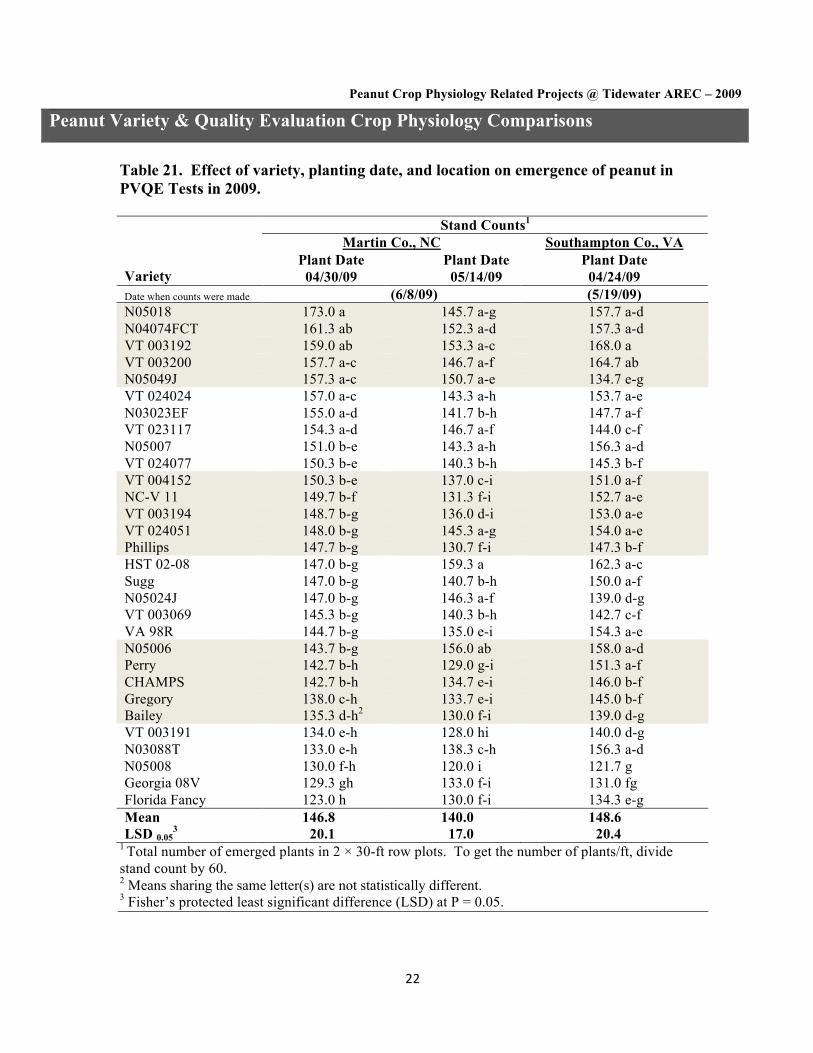
Table 21. Effect of variety, planting date, and location on emergence of peanut in PVQE Tests in 2009.
Stand Counts1
Martin Co., NC Southampton Co., VA
Variety Plant Date 04/30/09
Plant Date 05/14/09
Plant Date 04/24/09
Date when counts were made (6/8/09) (5/19/09) N05018 173.0 a 145.7 a-g 157.7 a-d N04074FCT 161.3 ab 152.3 a-d 157.3 a-d VT 003192 159.0 ab 153.3 a-c 168.0 a VT 003200 157.7 a-c 146.7 a-f 164.7 ab N05049J 157.3 a-c 150.7 a-e 134.7 e-g VT 024024 157.0 a-c 143.3 a-h 153.7 a-e N03023EF 155.0 a-d 141.7 b-h 147.7 a-f VT 023117 154.3 a-d 146.7 a-f 144.0 c-f N05007 151.0 b-e 143.3 a-h 156.3 a-d VT 024077 150.3 b-e 140.3 b-h 145.3 b-f VT 004152 150.3 b-e 137.0 c-i 151.0 a-f NC-V 11 149.7 b-f 131.3 f-i 152.7 a-e VT 003194 148.7 b-g 136.0 d-i 153.0 a-e VT 024051 148.0 b-g 145.3 a-g 154.0 a-e Phillips 147.7 b-g 130.7 f-i 147.3 b-f HST 02-08 147.0 b-g 159.3 a 162.3 a-c Sugg 147.0 b-g 140.7 b-h 150.0 a-f N05024J 147.0 b-g 146.3 a-f 139.0 d-g VT 003069 145.3 b-g 140.3 b-h 142.7 c-f VA 98R 144.7 b-g 135.0 e-i 154.3 a-e N05006 143.7 b-g 156.0 ab 158.0 a-d Perry 142.7 b-h 129.0 g-i 151.3 a-f CHAMPS 142.7 b-h 134.7 e-i 146.0 b-f Gregory 138.0 c-h 133.7 e-i 145.0 b-f Bailey 135.3 d-h2 130.0 f-i 139.0 d-g VT 003191 134.0 e-h 128.0 hi 140.0 d-g N03088T 133.0 e-h 138.3 c-h 156.3 a-d N05008 130.0 f-h 120.0 i 121.7 g Georgia 08V 129.3 gh 133.0 f-i 131.0 fg Florida Fancy 123.0 h 130.0 f-i 134.3 e-g Mean 146.8 140.0 148.6 LSD 0.05
3 20.1 17.0 20.4 1 Total number of emerged plants in 2 × 30-ft row plots. To get the number of plants/ft, divide stand count by 60. 2 Means sharing the same letter(s) are not statistically different. 3 Fisher’s protected least significant difference (LSD) at P = 0.05.
23
Peanut Crop Physiology Related Projects @ Tidewater AREC – 2009
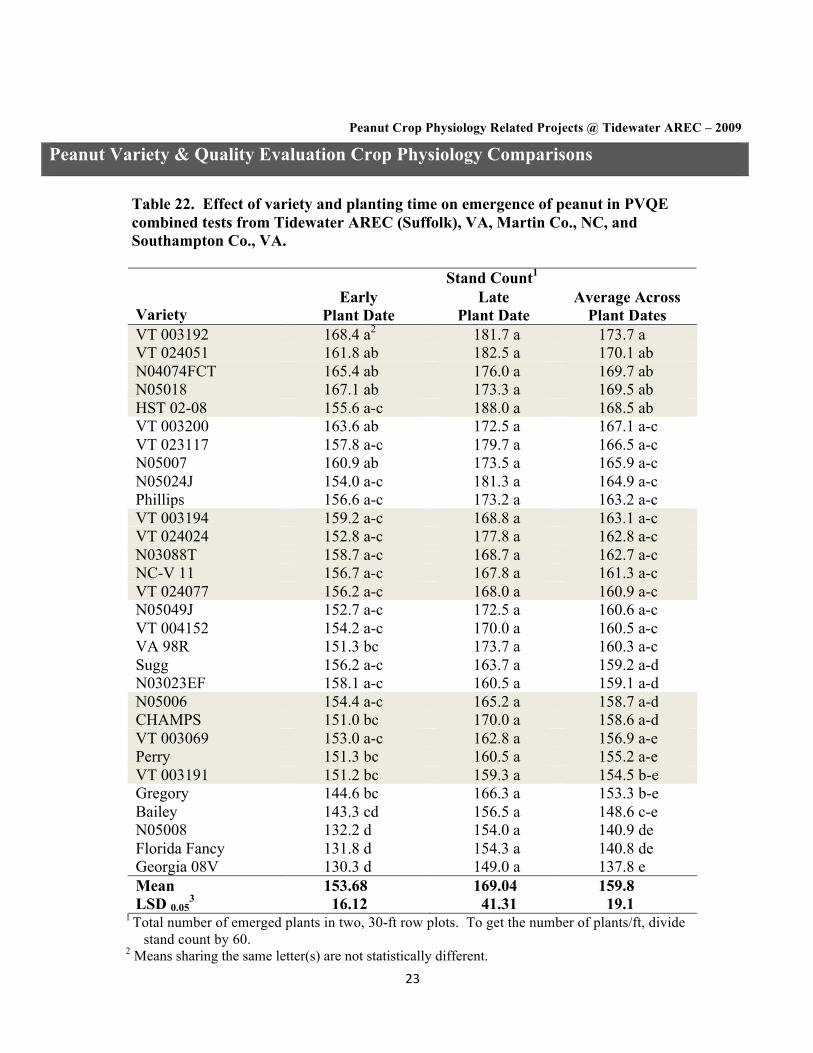
Peanut Variety & Quality Evaluation Crop Physiology Comparisons Table 22. Effect of variety and planting time on emergence of peanut in PVQE combined tests from Tidewater AREC (Suffolk), VA, Martin Co., NC, and Southampton Co., VA.
Stand Count1
Variety Early
Plant Date Late
Plant Date Average Across
Plant Dates VT 003192 168.4 a2 181.7 a 173.7 a VT 024051 161.8 ab 182.5 a 170.1 ab N04074FCT 165.4 ab 176.0 a 169.7 ab N05018 167.1 ab 173.3 a 169.5 ab HST 02-08 155.6 a-c 188.0 a 168.5 ab VT 003200 163.6 ab 172.5 a 167.1 a-c VT 023117 157.8 a-c 179.7 a 166.5 a-c N05007 160.9 ab 173.5 a 165.9 a-c N05024J 154.0 a-c 181.3 a 164.9 a-c Phillips 156.6 a-c 173.2 a 163.2 a-c VT 003194 159.2 a-c 168.8 a 163.1 a-c VT 024024 152.8 a-c 177.8 a 162.8 a-c N03088T 158.7 a-c 168.7 a 162.7 a-c NC-V 11 156.7 a-c 167.8 a 161.3 a-c VT 024077 156.2 a-c 168.0 a 160.9 a-c N05049J 152.7 a-c 172.5 a 160.6 a-c VT 004152 154.2 a-c 170.0 a 160.5 a-c VA 98R 151.3 bc 173.7 a 160.3 a-c Sugg 156.2 a-c 163.7 a 159.2 a-d N03023EF 158.1 a-c 160.5 a 159.1 a-d N05006 154.4 a-c 165.2 a 158.7 a-d CHAMPS 151.0 bc 170.0 a 158.6 a-d VT 003069 153.0 a-c 162.8 a 156.9 a-e Perry 151.3 bc 160.5 a 155.2 a-e VT 003191 151.2 bc 159.3 a 154.5 b-e Gregory 144.6 bc 166.3 a 153.3 b-e Bailey 143.3 cd 156.5 a 148.6 c-e N05008 132.2 d 154.0 a 140.9 de Florida Fancy 131.8 d 154.3 a 140.8 de Georgia 08V 130.3 d 149.0 a 137.8 e Mean 153.68 169.04 159.8 LSD 0.05
3 16.12 41.31 19.1 1 Total number of emerged plants in two, 30-ft row plots. To get the number of plants/ft, divide
stand count by 60. 2 Means sharing the same letter(s) are not statistically different.
24
3 Fisher’s protected least significant difference (LSD) at P = 0.05.
Peanut Crop Physiology Related Projects @ Tidewater AREC – 2009
Peanut Variety & Quality Evaluation Crop Physiology Comparisons
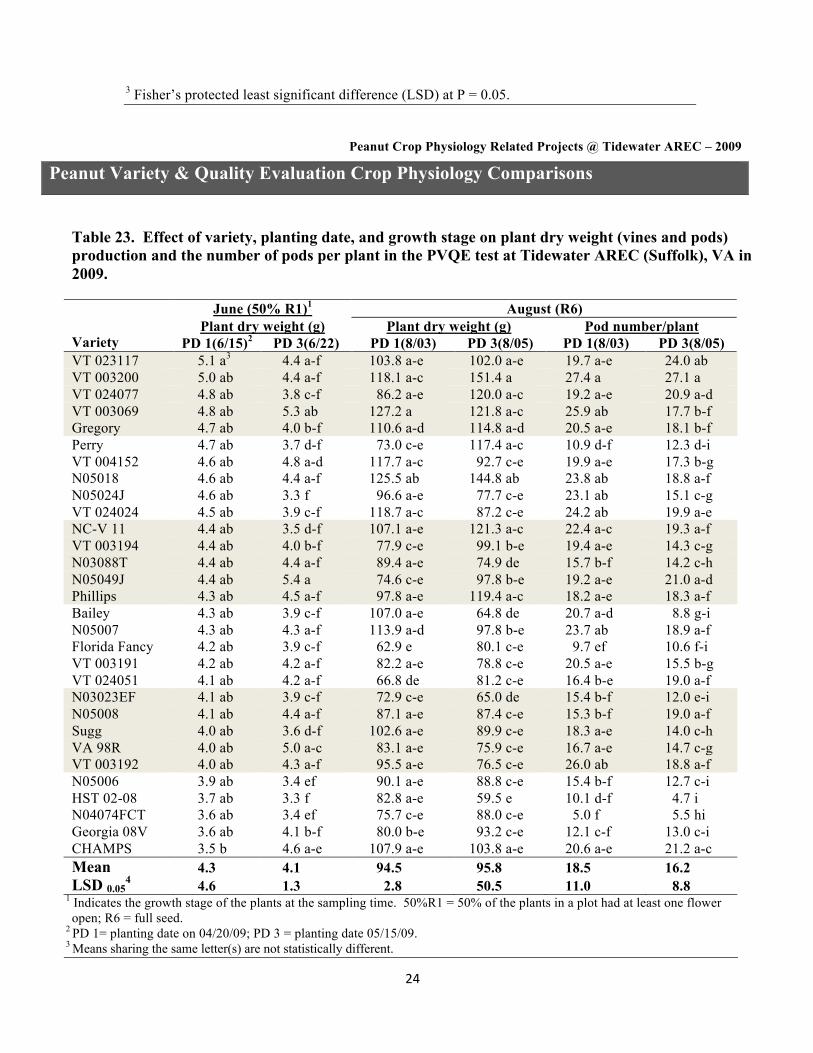
Table 23. Effect of variety, planting date, and growth stage on plant dry weight (vines and pods) production and the number of pods per plant in the PVQE test at Tidewater AREC (Suffolk), VA in 2009.
June (50% R1)1 August (R6) Plant dry weight (g) Plant dry weight (g) Pod number/plant
Variety PD 1(6/15)2 PD 3(6/22) PD 1(8/03) PD 3(8/05) PD 1(8/03) PD 3(8/05) VT 023117 5.1 a3 4.4 a-f 103.8 a-e 102.0 a-e 19.7 a-e 24.0 ab VT 003200 5.0 ab 4.4 a-f 118.1 a-c 151.4 a 27.4 a 27.1 a VT 024077 4.8 ab 3.8 c-f 86.2 a-e 120.0 a-c 19.2 a-e 20.9 a-d VT 003069 4.8 ab 5.3 ab 127.2 a 121.8 a-c 25.9 ab 17.7 b-f Gregory 4.7 ab 4.0 b-f 110.6 a-d 114.8 a-d 20.5 a-e 18.1 b-f Perry 4.7 ab 3.7 d-f 73.0 c-e 117.4 a-c 10.9 d-f 12.3 d-i VT 004152 4.6 ab 4.8 a-d 117.7 a-c 92.7 c-e 19.9 a-e 17.3 b-g N05018 4.6 ab 4.4 a-f 125.5 ab 144.8 ab 23.8 ab 18.8 a-f N05024J 4.6 ab 3.3 f 96.6 a-e 77.7 c-e 23.1 ab 15.1 c-g VT 024024 4.5 ab 3.9 c-f 118.7 a-c 87.2 c-e 24.2 ab 19.9 a-e NC-V 11 4.4 ab 3.5 d-f 107.1 a-e 121.3 a-c 22.4 a-c 19.3 a-f VT 003194 4.4 ab 4.0 b-f 77.9 c-e 99.1 b-e 19.4 a-e 14.3 c-g N03088T 4.4 ab 4.4 a-f 89.4 a-e 74.9 de 15.7 b-f 14.2 c-h N05049J 4.4 ab 5.4 a 74.6 c-e 97.8 b-e 19.2 a-e 21.0 a-d Phillips 4.3 ab 4.5 a-f 97.8 a-e 119.4 a-c 18.2 a-e 18.3 a-f Bailey 4.3 ab 3.9 c-f 107.0 a-e 64.8 de 20.7 a-d 8.8 g-i N05007 4.3 ab 4.3 a-f 113.9 a-d 97.8 b-e 23.7 ab 18.9 a-f Florida Fancy 4.2 ab 3.9 c-f 62.9 e 80.1 c-e 9.7 ef 10.6 f-i VT 003191 4.2 ab 4.2 a-f 82.2 a-e 78.8 c-e 20.5 a-e 15.5 b-g VT 024051 4.1 ab 4.2 a-f 66.8 de 81.2 c-e 16.4 b-e 19.0 a-f N03023EF 4.1 ab 3.9 c-f 72.9 c-e 65.0 de 15.4 b-f 12.0 e-i N05008 4.1 ab 4.4 a-f 87.1 a-e 87.4 c-e 15.3 b-f 19.0 a-f Sugg 4.0 ab 3.6 d-f 102.6 a-e 89.9 c-e 18.3 a-e 14.0 c-h VA 98R 4.0 ab 5.0 a-c 83.1 a-e 75.9 c-e 16.7 a-e 14.7 c-g VT 003192 4.0 ab 4.3 a-f 95.5 a-e 76.5 c-e 26.0 ab 18.8 a-f N05006 3.9 ab 3.4 ef 90.1 a-e 88.8 c-e 15.4 b-f 12.7 c-i HST 02-08 3.7 ab 3.3 f 82.8 a-e 59.5 e 10.1 d-f 4.7 i N04074FCT 3.6 ab 3.4 ef 75.7 c-e 88.0 c-e 5.0 f 5.5 hi Georgia 08V 3.6 ab 4.1 b-f 80.0 b-e 93.2 c-e 12.1 c-f 13.0 c-i CHAMPS 3.5 b 4.6 a-e 107.9 a-e 103.8 a-e 20.6 a-e 21.2 a-c Mean 4.3 4.1 94.5 95.8 18.5 16.2 LSD 0.05
4 4.6 1.3 2.8 50.5 11.0 8.8 1 Indicates the growth stage of the plants at the sampling time. 50%R1 = 50% of the plants in a plot had at least one flower open; R6 = full seed.
2 PD 1= planting date on 04/20/09; PD 3 = planting date 05/15/09. 3 Means sharing the same letter(s) are not statistically different.

25
4 Fisher’s protected least significant difference (LSD) at P = 0.05.
Peanut Crop Physiology Related Projects @ Tidewater AREC – 2009
Peanut Variety & Quality Evaluation Crop Physiology Comparisons
Table 24. Effect of variety on plant dry weight (vine and pods), pod number, and pod mass per plant at harvest of peanut varieties in the PVQE tests at Tidewater AREC (Suffolk), VA in 2009.
Plant dry weight (g)/plant Pod number/plant Pod dry weight (g)/plant Variety PD 1 PD 2 PD 3 PD 1 PD 2 PD 3 PD 1 PD 2 PD 3 VT 003200 214.6 a 170.7 b-e 203.0 a-f 74.5 a 48.4 c-g 63.5 a-f 122.1 a 83.5 c-g 111.0 b-f Florida Fancy 214.0 a 211.4 a-d 198.7 a-f 44.2 b-g 56.7 b-g 47.0 b-h 106.2 ab 97.1 b-g 86.0 c-i N05018 209.4 ab 215.1 a-d 194.7 a-h 65.2 ab 68.4 b-d 54.6 a-g 106.1 ab 132.0 a-e 95.6 b-h HST 02-08 197.9 a-c 153.8 c-e 173.3 d-i 53.2 a-g 35.0 gh 47.6 b-h 86.1 a-e 60.1 fg 74.7 e-j VT 024024 191.9 a-c 208.4 a-d 145.7 f-i 62.1 a-c 54.3 b-g 28.1 hi 100.4 a-c 114.2 a-f 48.2 ij VT 004152 190.1 a-c 284.1 a 258.0 a 49.9 a-g 75.9 b 68.2 a-d 88.5 a-e 138.6 a-d 127.0 a-c N05007 189.4 a-c 135.6 de 189.1 b-i 57.4 a-f 34.4 gh 57.3 a-g 102.0 a-c 66.6 e-g 100.0 b-h Bailey 187.3 a-c 246.6 a-c 243.7 ab 61.2 a-c 62.8 b-f 79.8 a 91.9 a-d 167.0 a 154.0 a VA 98R 184.9 a-d 135.4 de 167.0 d-i 61.8 a-c 30.5 gh 65.9 a-e 91.9 a-d 54.2 fg 88.0 c-i Gregory 181.4 a-d 136.7 de 168.7 d-i 50.5 a-g 38.2 f-h 35.9 g-i 91.4 a-d 103.0 a-g 69.8 f-j VT 003194 177.0 a-d 165.0 c-e 201.6 a-f 57.7 a-f 39.7 e-h 60.1 a-g 91.7 a-d 79.2 d-g 95.8 b-h VT 003069 173.4 a-d 156.2 c-e 175.1 d-i 51.5 a-g 39.9 e-h 46.0 b-h 93.4 a-d 76.4 d-g 77.0 e-i CHAMPS 168.9 a-d 193.0 a-e 167.6 d-i 46.1 b-g 57.1 b-g 42.5 d-i 83.5 b-e 102.5 a-g 78.1 e-i N05049J 168.0 a-d 144.7 c-e 162.8 e-i 59.8 a-f 36.4 f-h 44.2 c-h 90.8 a-d 67.1 e-g 82.8 d-i Georgia 08V 165.5 a-d 94.6 e 131.6 hi 60.3 a-d 20.7 h 18.1 i 100.0 a-c 39.2 g 34.4 j VT 003191 162.3 a-e 288.5 a 239.3 a-c 52.6 a-g 71.2 bc 55.7 a-g 78.2 b-e 148.0 a-c 112.3 a-e NC-V 11 161.9 a-e 151.7 c-e 197.1 a-g 50.1 a-g 49.7 b-g 69.0 a-c 81.6 b-e 82.9 d-g 110.0 b-f Perry 160.7 a-e 203.6 a-d 177.3 c-i 60.2 a-e 37.7 f-h 50.1 b-h 80.0 b-e 154.3 ab 92.4 b-h N03088T 157.6 a-e 207.6 a-d 204.4 a-f 48.4 b-g 51.6 b-g 52.9 b-h 76.6 b-e 112.5 a-f 102.3 b-h N05008 156.4 a-e 162.1 c-e 149.6 f-i 49.5 b-g 51.5 b-g 52.9 b-h 84.2 b-e 98.4 b-g 95.3 b-h N04074FCT 151.4 b-e 274.9 ab 225.4 a-e 40.1 c-g 103.6 a 71.0 ab 61.1 de 157.5 ab 120.2 a-d N03023EF 150.5 b-e 247.4 a-c 227.8 a-d 42.7 b-g 66.9 b-e 64.8 a-e 70.0 b-e 152.9 ab 133.4 ab Phillips 148.9 b-e 167.1 c-e 182.4 b-i 39.0 c-g 43.8 d-h 49.6 b-h 65.2 c-e 58.7 fg 94.4 b-h Sugg 148.2 b-e 154.4 c-e 130.2 i 35.7 e-g 41.6 d-h 40.6 e-i 70.9 b-e 75.3 d-g 63.1 h-j VT 023117 145.7 c-e 135.7 de 169.5 d-i 41.9 c-g 39.4 f-h 52.0 b-h 68.0 c-e 62.8 fg 82.1 d-i VT 003192 143.7 c-e 169.6 c-e 155.6 f-i 42.7 b-g 46.3 c-h 41.8 e-i 73.4 b-e 77.1 d-g 72.3 e-j N05024J 142.5 c-e 168.1 c-e 153.5 f-i 36.4 d-g 50.0 b-g 37.7 f-i 72.8 b-e 75.5 d-g 65.8 h-j VT 024077 142.2 c-e 184.0 a-e 152.1 f-i 42.9 b-g 43.3 d-h 40.3 e-i 75.3 b-e 95.2 b-g 77.9 e-i VT 024051 124.4 de 206.4 a-d 188.4 b-i 32.2 g 55.9 b-g 59.6 a-g 68.8 b-e 116.2 a-f 107.7 b-g N05006 102.4 e 119.7 de 133.1 g-i 35.6 fg 36.5 f-h 41.2 e-i 51.9 e 61.3 fg 61.4 h-j Mean 167.1 183.1 182.2 50.2 49.6 51.3 84.1 97.0 90.4 LSD 0.05
3 61.7 104.5 64.2 24.6 27.4 25.9 37.8 68.3 42.3 1 PD 1= Planting date on 04/20/09; PD 2 = 05/01/09; PD 3 = planting date 05/15/09. 2 Means sharing the same letter(s) are not statistically different. 3 Fisher’s protected least significant difference (LSD) at P = 0.05.
26
Peanut Crop Physiology Related Projects @ Tidewater AREC – 2009
Peanut Variety & Quality Evaluation Crop Physiology Comparisons
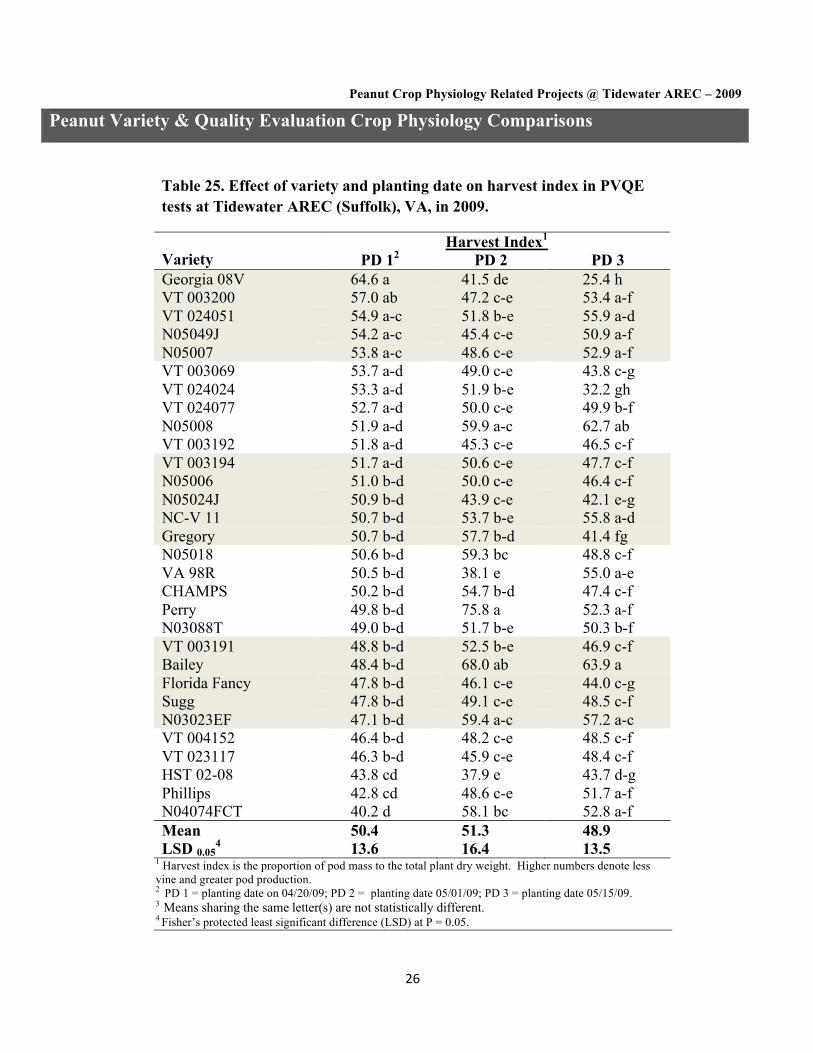
Table 25. Effect of variety and planting date on harvest index in PVQE tests at Tidewater AREC (Suffolk), VA, in 2009.
Harvest Index1
Variety PD 12 PD 2 PD 3 Georgia 08V 64.6 a 41.5 de 25.4 h VT 003200 57.0 ab 47.2 c-e 53.4 a-f VT 024051 54.9 a-c 51.8 b-e 55.9 a-d N05049J 54.2 a-c 45.4 c-e 50.9 a-f N05007 53.8 a-c 48.6 c-e 52.9 a-f VT 003069 53.7 a-d 49.0 c-e 43.8 c-g VT 024024 53.3 a-d 51.9 b-e 32.2 gh VT 024077 52.7 a-d 50.0 c-e 49.9 b-f N05008 51.9 a-d 59.9 a-c 62.7 ab VT 003192 51.8 a-d 45.3 c-e 46.5 c-f VT 003194 51.7 a-d 50.6 c-e 47.7 c-f N05006 51.0 b-d 50.0 c-e 46.4 c-f N05024J 50.9 b-d 43.9 c-e 42.1 e-g NC-V 11 50.7 b-d 53.7 b-e 55.8 a-d Gregory 50.7 b-d 57.7 b-d 41.4 fg N05018 50.6 b-d 59.3 bc 48.8 c-f VA 98R 50.5 b-d 38.1 e 55.0 a-e CHAMPS 50.2 b-d 54.7 b-d 47.4 c-f Perry 49.8 b-d 75.8 a 52.3 a-f N03088T 49.0 b-d 51.7 b-e 50.3 b-f VT 003191 48.8 b-d 52.5 b-e 46.9 c-f Bailey 48.4 b-d 68.0 ab 63.9 a Florida Fancy 47.8 b-d 46.1 c-e 44.0 c-g Sugg 47.8 b-d 49.1 c-e 48.5 c-f N03023EF 47.1 b-d 59.4 a-c 57.2 a-c VT 004152 46.4 b-d 48.2 c-e 48.5 c-f VT 023117 46.3 b-d 45.9 c-e 48.4 c-f HST 02-08 43.8 cd 37.9 e 43.7 d-g Phillips 42.8 cd 48.6 c-e 51.7 a-f N04074FCT 40.2 d 58.1 bc 52.8 a-f Mean 50.4 51.3 48.9 LSD 0.05
4 13.6 16.4 13.5 1 Harvest index is the proportion of pod mass to the total plant dry weight. Higher numbers denote less vine and greater pod production. 2 PD 1 = planting date on 04/20/09; PD 2 = planting date 05/01/09; PD 3 = planting date 05/15/09. 3 Means sharing the same letter(s) are not statistically different. 4 Fisher’s protected least significant difference (LSD) at P = 0.05.

27
Peanut Crop Physiology Related Projects @ Tidewater AREC – 2009
Peanut Variety & Quality Evaluation Crop Physiology Comparisons
Table 26. Reproductive stages of varieties in the PVQE tests at TAREC (Suffolk), VA, Planting Date 1, 20 April, 2009. Observations on reproductive stages were taken daily throughout the growing season.
Variety
DAP 50R11
DAP R2
DAP R3
DAP R4
DAP R5
DAP R6
DAP R7
Number of days from
50R1 TO R4
Number of days from R4 to
R7 Bailey 51.67 a2 58.00 b 72.00 b 88.00 ab 94.00 ab 101.67 a-c 144.00 ab 36.33 a-e 56.00 a-c Perry 50.67 ab 57.00 c 68.33 b-g 83.33 a-f 86.00 b-e 93.00 e 131.67 c-e 32.67 a-f 48.33 bc Georgia 08V 50.67 ab 59.67 a 72.00 b 86.33 a-e 89.33 a-d 96.00 c-e 139.67 a-d 35.67 a-f 53.33 a-c VA 98R 50.67 ab 57.67 bc 67.33 d-g 71.33 g 74.00 fg 97.67 b-e 129.33 de 20.67 h 58.00 a-c VT 004152 50.67 ab 57.67 bc 70.00 b-f 86.00 a-e 87.33 b-d 96.00 c-e 147.33 a 35.33 a-f 60.33 ab NC-V 11 50.33 ab 57.67 bc 67.00 d-g 86.00 a-e 87.33 b-d 101.67 a-c 141.00 a-c 35.67 a-f 55.00 a-c Gregory 50.33 ab 58.00 b 70.00 c-f 86.33 a-e 89.33 a-d 93.00 e 129.67 de 36.00 a-e 43.33 c Florida Fancy 50.33 ab 57.33 bc 71.33 bc 87.00 a-d 90.33 a-c 96.33 c-e 137.00 a-d 36.67 a-d 50.00 a-c Sugg 50.33 ab 57.67 bc 68.33 b-g 77.33 d-g 87.33 b-d 97.67 b-e 129.67 de 28.67 c-h 52.33 a-c VT 003192 50.33 ab 57.67 bc 70.67 b-d 84.67 a-e 89.33 a-d 98.67 b-e 138.00 a-d 34.33 a-f 53.33 a-c N05049J 50.33 ab 58.00 b 66.33 fg 88.67 a 91.00 a-c 94.67 de 137.00 a-d 38.33 a-c 48.33 bc Phillips 50.00 ab 58.00 b 69.33 b-g 79.67 a-g 82.00 c-f 93.00 e 135.00 b-e 29.67 b-h 55.33 a-c VT 003194 50.00 ab 57.67 bc 69.33 b-g 88.00 ab 89.67 a-d 101.00 a-d 136.33 a-d 38.00 a-d 48.33 bc VT 003200 50.00 ab 57.67 bc 67.33 d-g 76.67 e-g 80.67 d-g 96.00 c-e 135.00 b-e 26.67 e-h 58.33 a-c VT 024024 50.00 ab 57.67 bc 70.00 b-f 84.67 a-e 88.00 b-d 93.00 e 138.00 a-d 34.67 a-f 53.33 a-c VT 024051 50.00 ab 57.33 bc 69.00 b-g 78.33 b-g 83.33 c-f 93.00 e 131.00 c-e 28.33 d-h 52.67 a-c N03088T 50.00 ab 57.67 bc 72.00 b 81.67 a-f 88.00 b-d 93.00 e 138.00 a-d 31.67 a-g 56.33 a-c HST 02-08 49.67 a-c 59.67 a 78.67 a 87.33 a-c 98.67 a 105.67 a 139.33 a-d 37.67 a-d 52.00 a-c VT 024077 49.33 a-c 57.67 bc 71.33 bc 85.00 a-e 87.33 b-d 99.3 a-e 135.67 a-d 35.67 a-f 50.67 a-c VT 023117 49.00 b-d 57.33 bc 66.67 e-g 71.00 g 72.33 g 93.00 e 124.00 e 22.00 gh 53.00 a-c N04074FCT 49.00 b-d 57.33 bc 70.33 b-e 88.00 ab 95.00 ab 103.33 ab 138.00 a-d 39.00 ab 50.00 a-c N05006 48.67 b-e 57.67 bc 68.33 b-g 86.00 a-e 88.67 b-d 97.67 b-e 136.33 a-d 37.33 a-d 50.33 a-c N05007 48.67 b-e 58.00 b 68.00 c-g 82.00 a-f 86.00 b-e 94.67 de 137.33 a-d 33.33 a-f 55.33 a-c N05018 48.67 b-e 57.67 bc 66.00 g 74.67 fg 87.00 b-e 93.00 e 138.67 a-d 26.00 f-h 64.00 a N05024J 48.67 b-e 57.67 bc 69.67 b-g 83.33 a-f 85.67 b-e 93.00 e 144.00 ab 34.67 a-f 60.67 ab VT 003191 48.33 b-e 57.33 bc 66.00 g 86.33 a-e 88.00 b-d 94.67 de 131.00 c-e 38.00 a-d 44.67 c CHAMPS 47.33 c-e 57.33 bc 70.33 b-e 87.67 a-c 90.33 a-c 94.67 de 141.00 a-c 40.33 a 53.33 a-c VT 003069 46.67 de 57.67 bc 69.00 b-g 81.33 a-f 83.00 c-f 93.00 e 135.00 b-e 34.67 a-f 53.67 a-c N03023EF 46.33 e 57.33 bc 66.67 e-g 86.67 a-d 93.00 ab 101.67 a-c 136.33 a-d 40.33 a 49.67 a-c N05008 46.33 e 57.33 bc 68.33 b-g 78.00 c-g 77.67 e-g 94.67 de 132.00 c-e 31.67 a-g 54.00 a-c Mean 49.43 57.75 69.32 83.04 86.99 96.46 136.21 33.67 53.13 LSD 0.05
3 2.61 0.83 3.76 9.83 9.42 6.65 11.05 9.86 15.09 1 DAP = Days after planting; 50R1 = 50% of plants in a plot have at least one flower; R2 = beginning peg; R3=beginning pod; R4 = full pod; R5 = beginning seed; R6 = full seed; R7 = beginning maturity.
2 Means sharing the same letter(s) are not statistically different. 3 Fisher’s protected least significant difference (LSD) at P = 0.05.
28
Peanut Crop Physiology Related Projects @ Tidewater AREC – 2009
Peanut Variety & Quality Evaluation Crop Physiology Comparisons
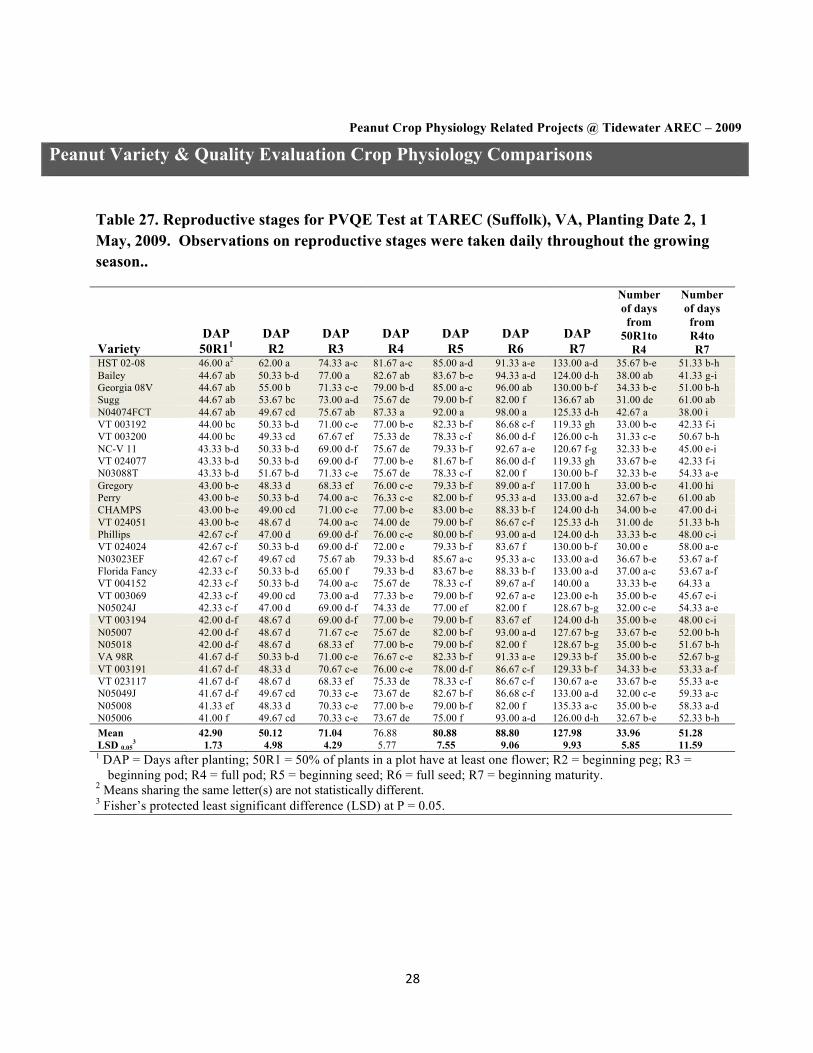
Table 27. Reproductive stages for PVQE Test at TAREC (Suffolk), VA, Planting Date 2, 1 May, 2009. Observations on reproductive stages were taken daily throughout the growing season..
Variety DAP 50R11
DAP R2
DAP R3
DAP R4
DAP R5
DAP R6
DAP R7
Number of days from
50R1to R4
Number of days from R4to R7
HST 02-08 46.00 a2 62.00 a 74.33 a-c 81.67 a-c 85.00 a-d 91.33 a-e 133.00 a-d 35.67 b-e 51.33 b-h Bailey 44.67 ab 50.33 b-d 77.00 a 82.67 ab 83.67 b-e 94.33 a-d 124.00 d-h 38.00 ab 41.33 g-i Georgia 08V 44.67 ab 55.00 b 71.33 c-e 79.00 b-d 85.00 a-c 96.00 ab 130.00 b-f 34.33 b-e 51.00 b-h Sugg 44.67 ab 53.67 bc 73.00 a-d 75.67 de 79.00 b-f 82.00 f 136.67 ab 31.00 de 61.00 ab N04074FCT 44.67 ab 49.67 cd 75.67 ab 87.33 a 92.00 a 98.00 a 125.33 d-h 42.67 a 38.00 i VT 003192 44.00 bc 50.33 b-d 71.00 c-e 77.00 b-e 82.33 b-f 86.68 c-f 119.33 gh 33.00 b-e 42.33 f-i VT 003200 44.00 bc 49.33 cd 67.67 ef 75.33 de 78.33 c-f 86.00 d-f 126.00 c-h 31.33 c-e 50.67 b-h NC-V 11 43.33 b-d 50.33 b-d 69.00 d-f 75.67 de 79.33 b-f 92.67 a-e 120.67 f-g 32.33 b-e 45.00 e-i VT 024077 43.33 b-d 50.33 b-d 69.00 d-f 77.00 b-e 81.67 b-f 86.00 d-f 119.33 gh 33.67 b-e 42.33 f-i N03088T 43.33 b-d 51.67 b-d 71.33 c-e 75.67 de 78.33 c-f 82.00 f 130.00 b-f 32.33 b-e 54.33 a-e Gregory 43.00 b-e 48.33 d 68.33 ef 76.00 c-e 79.33 b-f 89.00 a-f 117.00 h 33.00 b-e 41.00 hi Perry 43.00 b-e 50.33 b-d 74.00 a-c 76.33 c-e 82.00 b-f 95.33 a-d 133.00 a-d 32.67 b-e 61.00 ab CHAMPS 43.00 b-e 49.00 cd 71.00 c-e 77.00 b-e 83.00 b-e 88.33 b-f 124.00 d-h 34.00 b-e 47.00 d-i VT 024051 43.00 b-e 48.67 d 74.00 a-c 74.00 de 79.00 b-f 86.67 c-f 125.33 d-h 31.00 de 51.33 b-h Phillips 42.67 c-f 47.00 d 69.00 d-f 76.00 c-e 80.00 b-f 93.00 a-d 124.00 d-h 33.33 b-e 48.00 c-i VT 024024 42.67 c-f 50.33 b-d 69.00 d-f 72.00 e 79.33 b-f 83.67 f 130.00 b-f 30.00 e 58.00 a-e N03023EF 42.67 c-f 49.67 cd 75.67 ab 79.33 b-d 85.67 a-c 95.33 a-c 133.00 a-d 36.67 b-e 53.67 a-f Florida Fancy 42.33 c-f 50.33 b-d 65.00 f 79.33 b-d 83.67 b-e 88.33 b-f 133.00 a-d 37.00 a-c 53.67 a-f VT 004152 42.33 c-f 50.33 b-d 74.00 a-c 75.67 de 78.33 c-f 89.67 a-f 140.00 a 33.33 b-e 64.33 a VT 003069 42.33 c-f 49.00 cd 73.00 a-d 77.33 b-e 79.00 b-f 92.67 a-e 123.00 e-h 35.00 b-e 45.67 e-i N05024J 42.33 c-f 47.00 d 69.00 d-f 74.33 de 77.00 ef 82.00 f 128.67 b-g 32.00 c-e 54.33 a-e VT 003194 42.00 d-f 48.67 d 69.00 d-f 77.00 b-e 79.00 b-f 83.67 ef 124.00 d-h 35.00 b-e 48.00 c-i N05007 42.00 d-f 48.67 d 71.67 c-e 75.67 de 82.00 b-f 93.00 a-d 127.67 b-g 33.67 b-e 52.00 b-h N05018 42.00 d-f 48.67 d 68.33 ef 77.00 b-e 79.00 b-f 82.00 f 128.67 b-g 35.00 b-e 51.67 b-h VA 98R 41.67 d-f 50.33 b-d 71.00 c-e 76.67 c-e 82.33 b-f 91.33 a-e 129.33 b-f 35.00 b-e 52.67 b-g VT 003191 41.67 d-f 48.33 d 70.67 c-e 76.00 c-e 78.00 d-f 86.67 c-f 129.33 b-f 34.33 b-e 53.33 a-f VT 023117 41.67 d-f 48.67 d 68.33 ef 75.33 de 78.33 c-f 86.67 c-f 130.67 a-e 33.67 b-e 55.33 a-e N05049J 41.67 d-f 49.67 cd 70.33 c-e 73.67 de 82.67 b-f 86.68 c-f 133.00 a-d 32.00 c-e 59.33 a-c N05008 41.33 ef 48.33 d 70.33 c-e 77.00 b-e 79.00 b-f 82.00 f 135.33 a-c 35.00 b-e 58.33 a-d N05006 41.00 f 49.67 cd 70.33 c-e 73.67 de 75.00 f 93.00 a-d 126.00 d-h 32.67 b-e 52.33 b-h Mean 42.90 50.12 71.04 76.88 80.88 88.80 127.98 33.96 51.28 LSD 0.05
3 1.73 4.98 4.29 5.77 7.55 9.06 9.93 5.85 11.59 1 DAP = Days after planting; 50R1 = 50% of plants in a plot have at least one flower; R2 = beginning peg; R3 =
beginning pod; R4 = full pod; R5 = beginning seed; R6 = full seed; R7 = beginning maturity. 2 Means sharing the same letter(s) are not statistically different. 3 Fisher’s protected least significant difference (LSD) at P = 0.05.
29
Peanut Crop Physiology Related Projects @ Tidewater AREC – 2009
Peanut Variety & Quality Evaluation Crop Physiology Comparisons
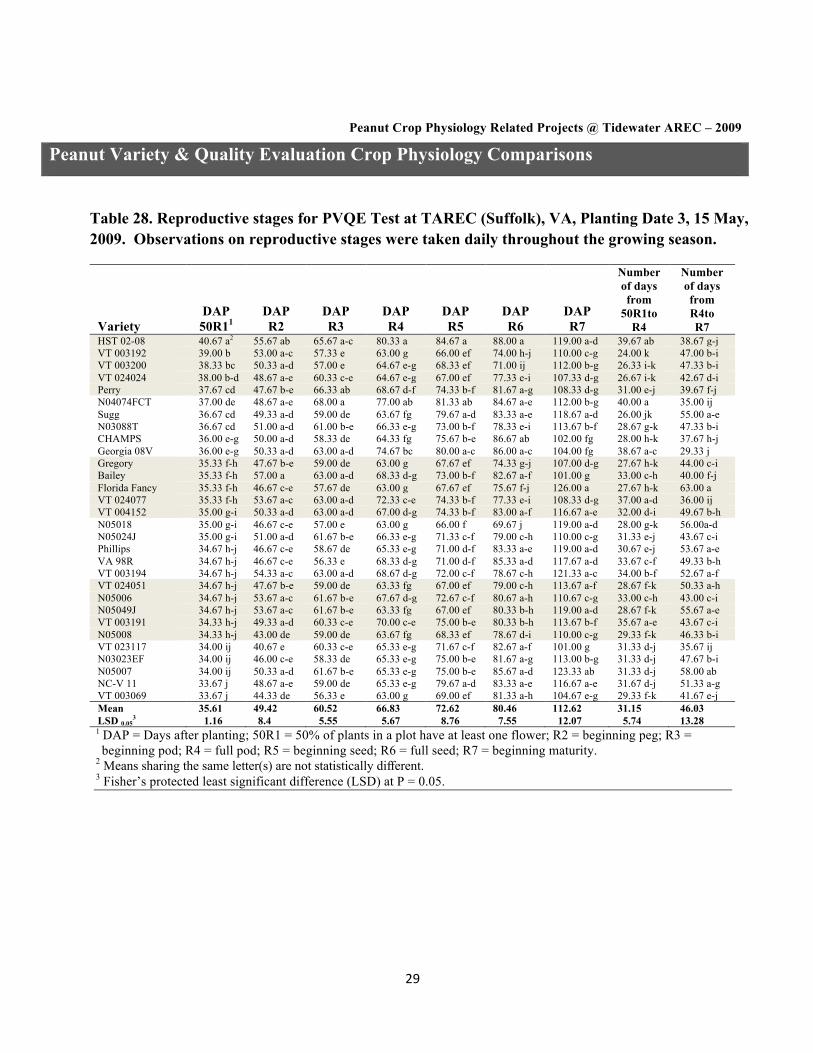
Table 28. Reproductive stages for PVQE Test at TAREC (Suffolk), VA, Planting Date 3, 15 May, 2009. Observations on reproductive stages were taken daily throughout the growing season.
Variety DAP 50R11
DAP R2
DAP R3
DAP R4
DAP R5
DAP R6
DAP R7
Number of days from
50R1to R4
Number of days from R4to R7
HST 02-08 40.67 a2 55.67 ab 65.67 a-c 80.33 a 84.67 a 88.00 a 119.00 a-d 39.67 ab 38.67 g-j VT 003192 39.00 b 53.00 a-c 57.33 e 63.00 g 66.00 ef 74.00 h-j 110.00 c-g 24.00 k 47.00 b-i VT 003200 38.33 bc 50.33 a-d 57.00 e 64.67 e-g 68.33 ef 71.00 ij 112.00 b-g 26.33 i-k 47.33 b-i VT 024024 38.00 b-d 48.67 a-e 60.33 c-e 64.67 e-g 67.00 ef 77.33 e-i 107.33 d-g 26.67 i-k 42.67 d-i Perry 37.67 cd 47.67 b-e 66.33 ab 68.67 d-f 74.33 b-f 81.67 a-g 108.33 d-g 31.00 e-j 39.67 f-j N04074FCT 37.00 de 48.67 a-e 68.00 a 77.00 ab 81.33 ab 84.67 a-e 112.00 b-g 40.00 a 35.00 ij Sugg 36.67 cd 49.33 a-d 59.00 de 63.67 fg 79.67 a-d 83.33 a-e 118.67 a-d 26.00 jk 55.00 a-e N03088T 36.67 cd 51.00 a-d 61.00 b-e 66.33 e-g 73.00 b-f 78.33 e-i 113.67 b-f 28.67 g-k 47.33 b-i CHAMPS 36.00 e-g 50.00 a-d 58.33 de 64.33 fg 75.67 b-e 86.67 ab 102.00 fg 28.00 h-k 37.67 h-j Georgia 08V 36.00 e-g 50.33 a-d 63.00 a-d 74.67 bc 80.00 a-c 86.00 a-c 104.00 fg 38.67 a-c 29.33 j Gregory 35.33 f-h 47.67 b-e 59.00 de 63.00 g 67.67 ef 74.33 g-j 107.00 d-g 27.67 h-k 44.00 c-i Bailey 35.33 f-h 57.00 a 63.00 a-d 68.33 d-g 73.00 b-f 82.67 a-f 101.00 g 33.00 c-h 40.00 f-j Florida Fancy 35.33 f-h 46.67 c-e 57.67 de 63.00 g 67.67 ef 75.67 f-j 126.00 a 27.67 h-k 63.00 a VT 024077 35.33 f-h 53.67 a-c 63.00 a-d 72.33 c-e 74.33 b-f 77.33 e-i 108.33 d-g 37.00 a-d 36.00 ij VT 004152 35.00 g-i 50.33 a-d 63.00 a-d 67.00 d-g 74.33 b-f 83.00 a-f 116.67 a-e 32.00 d-i 49.67 b-h N05018 35.00 g-i 46.67 c-e 57.00 e 63.00 g 66.00 f 69.67 j 119.00 a-d 28.00 g-k 56.00a-d N05024J 35.00 g-i 51.00 a-d 61.67 b-e 66.33 e-g 71.33 c-f 79.00 c-h 110.00 c-g 31.33 e-j 43.67 c-i Phillips 34.67 h-j 46.67 c-e 58.67 de 65.33 e-g 71.00 d-f 83.33 a-e 119.00 a-d 30.67 e-j 53.67 a-e VA 98R 34.67 h-j 46.67 c-e 56.33 e 68.33 d-g 71.00 d-f 85.33 a-d 117.67 a-d 33.67 c-f 49.33 b-h VT 003194 34.67 h-j 54.33 a-c 63.00 a-d 68.67 d-g 72.00 c-f 78.67 c-h 121.33 a-c 34.00 b-f 52.67 a-f VT 024051 34.67 h-j 47.67 b-e 59.00 de 63.33 fg 67.00 ef 79.00 c-h 113.67 a-f 28.67 f-k 50.33 a-h N05006 34.67 h-j 53.67 a-c 61.67 b-e 67.67 d-g 72.67 c-f 80.67 a-h 110.67 c-g 33.00 c-h 43.00 c-i N05049J 34.67 h-j 53.67 a-c 61.67 b-e 63.33 fg 67.00 ef 80.33 b-h 119.00 a-d 28.67 f-k 55.67 a-e VT 003191 34.33 h-j 49.33 a-d 60.33 c-e 70.00 c-e 75.00 b-e 80.33 b-h 113.67 b-f 35.67 a-e 43.67 c-i N05008 34.33 h-j 43.00 de 59.00 de 63.67 fg 68.33 ef 78.67 d-i 110.00 c-g 29.33 f-k 46.33 b-i VT 023117 34.00 ij 40.67 e 60.33 c-e 65.33 e-g 71.67 c-f 82.67 a-f 101.00 g 31.33 d-j 35.67 ij N03023EF 34.00 ij 46.00 c-e 58.33 de 65.33 e-g 75.00 b-e 81.67 a-g 113.00 b-g 31.33 d-j 47.67 b-i N05007 34.00 ij 50.33 a-d 61.67 b-e 65.33 e-g 75.00 b-e 85.67 a-d 123.33 ab 31.33 d-j 58.00 ab NC-V 11 33.67 j 48.67 a-e 59.00 de 65.33 e-g 79.67 a-d 83.33 a-e 116.67 a-e 31.67 d-j 51.33 a-g VT 003069 33.67 j 44.33 de 56.33 e 63.00 g 69.00 ef 81.33 a-h 104.67 e-g 29.33 f-k 41.67 e-j Mean 35.61 49.42 60.52 66.83 72.62 80.46 112.62 31.15 46.03 LSD 0.05
3 1.16 8.4 5.55 5.67 8.76 7.55 12.07 5.74 13.28 1 DAP = Days after planting; 50R1 = 50% of plants in a plot have at least one flower; R2 = beginning peg; R3 = beginning pod; R4 = full pod; R5 = beginning seed; R6 = full seed; R7 = beginning maturity.
2 Means sharing the same letter(s) are not statistically different. 3 Fisher’s protected least significant difference (LSD) at P = 0.05.

30
Peanut Crop Physiology Related Projects @ Tidewater AREC – 2009
Peanut Variety & Quality Evaluation Crop Physiology Comparisons
Table 29. Maturity of peanut cultivars based on color of pod mesocarp after pod blasting at TAREC (Suffolk), VA, Planting Date 1 (20 April, 2009).
Number of pods % Maturity
Variety Total pods
White/ yellow Orange
Brown/ black
Brown/ black
Orange/ brown/ black
VT 003069 109 a1 15 c-e 58 a 36 b-e 32 b-f 85 a-c HST 02-08 108 ab 23 b-e 55 ab 30 c-f 29 d-f 78 a-d VT 023117 107 a-c 8 e 42 ab 58 a 54 ab 93 a VT 003192 106 a-d 20 b-e 33 ab 53 ab 52 a-c 82 a-d Perry 104 a-e 40 ab 31 b 33 b-f 31 c-f 61 de CHAMPS 104 a-e 13 de 33 ab 58 a 56 a 88 ab VA 98R 104 a-e 25 a-e 38 ab 41 a-e 40 a-e 77 a-d VT 024077 104 a-e 31 a-e 37 ab 36 b-e 35 a-f 70 b-e VT 024024 102 a-f 12 de 55 ab 35 b-e 35 a-f 88 ab N03088T 102 a-f 16 c-e 38 ab 48 a-c 47 a-d 85 a-c N05024J 102 a-f 14 c-e 52 ab 36 b-e 35 a-f 86 ab VT 024051 101 a-f 25 a-e 33 ab 43 a-d 42 a-e 75 a-d Bailey 100 a-f 37 a-c 31 b 32 b-f 33 b-f 63 c-e Sugg 100 a-f 22 b-e 37 ab 41 a-e 41 a-e 78 a-d N05008 100 a-f 15 c-e 43 ab 41 a-e 41 a-e 84 a-c VT 003191 99 a-f 33 a-d 31 b 35 b-e 35 a-f 66 b-e VT 003200 99 a-f 33 a-d 44 ab 23 d-f 23 ef 67 b-e Gregory 98 a-f 20 b-e 45 ab 33 b-f 34 b-f 79 a-d N03023EF 98 a-f 28 a-e 33 ab 37 a-e 38 a-e 72 a-d N05018 98 a-f 21 b-e 43 ab 34 b-f 35 a-f 78 a-d VT 003194 97 a-f 15 c-e 50 ab 31 c-f 32 b-f 84 a-c NC-V 11 96 a-f 20 b-e 45 ab 31 c-f 32 b-f 79 a-d Florida Fancy 96 a-f 18 b-e 46 ab 32 b-f 34 a-f 82 a-d VT 004152 95 c-f 15 c-e 46 ab 33 b-f 35 a-f 84 a-c N05049J 95 b-f 25 a-e 38 ab 32 b-f 34 b-f 74 a-d Phillips 94 d-f 24 a-e 36 ab 34 b-f 36 a-f 76 a-d N05006 94 d-f 37 a-c 36 ab 22 ef 23 ef 61 de N05007 94 c-f 18 b-e 45 ab 31 c-f 33 b-f 81 a-d N04074FCT 92 ef 23 b-e 37 ab 33 b-f 36 a-f 75 a-d Georgia 08V 90 f 47 a 30 b 14 f 16 f 48 e Mean 100 23 41 36 36 77 LSD0.05
2 13 23 25 21 22 23 1 Means sharing the same letter(s) are not statistically different. 2 Fisher’s protected least significant difference (LSD) at P = 0.05.

31
Peanut Crop Physiology Related Projects @ Tidewater AREC – 2009
Peanut Variety & Quality Evaluation Crop Physiology Comparisons
Table 30. Maturity of peanut cultivars based on color of pod mesocarp after pod blasting at TAREC (Suffolk), VA, Planting Date 2, (1 May, 2009).
Number of pods % Maturity
Variety Total pods
White/ yellow Orange
Brown/ black
Brown/ black
Orange/ brown/ black
VT 024077 114 a1 16 d 40 b-e 58 a 51 a 86 a VT 003069 114 a 19 cd 61 ab 34 b-h 30 c-i 84 ab HST 02-08 113 a 37 a-c 44 a-e 33 b-h 28 d-i 68 b-e VT 003191 109 a 28 a-d 39 c-e 43 a-e 40 a-g 75 a-e N05008 109 a 29 a-d 46 a-e 34 b-h 30 c-i 73 a-e N05024J 109 a 40 a 40 b-e 28 d-h 25 f-i 63 de NC-V 11 108 a 19 cd 51 a-e 38 b-f 34 a-g 82 a-c Sugg 108 a 25 a-d 48 a-e 35 b-g 32 b-i 77 a-e N04074FCT 108 a 36 a-c 45 a-e 26 e-h 24 g-i 66 b-e VT 004152 107 a 21 b-d 39 c-e 47 a-d 45 a-e 81 a-d VT 003194 107 a 36 a-c 42 b-e 29 d-h 27 e-i 66 b-e VT 003200 107 a 22 a-d 39 c-e 46 a-d 43 a-f 80 a-d VT 023117 107 a 20 b-d 37 c-e 50 a-c 46 a-d 82 a-c N05018 107 a 30 a-d 48 a-e 29 d-h 27 e-i 72 a-e N03088T 107 a 18 cd 40 b-e 50 a-c 48 a-c 84 ab Perry 106 a 30 a-d 48 a-e 28 d-h 26 e-i 71 a-e Bailey 106 a 27 a-d 44 a-e 35 b-h 32 a-i 75 a-e VT 003192 106 a 25 a-d 40 b-e 41 a-e 38 a-g 76 a-e N05006 106 a 36 a-c 34 de 36 b-g 33 a-h 65 c-e N05049J 106 a 14 d 50 a-e 42 a-e 39 a-g 87 a Phillips 105 a 21 b-d 55 a-c 29 d-h 26 f-i 80 a-d N03023EF 105 a 24 a-d 30 e 52 ab 49 ab 77 a-e Georgia 08V 103 a 39 ab 47 a-e 18 gh 16 hi 61 e Florida Fancy 103 a 23 a-d 65 a 15 h 15 i 76 a-e VA 98R 103 a 22 a-d 50 a-e 32 c-h 31 c-i 79 a-e VT 024024 103 a 25 a-d 46 a-e 33 b-h 32 b-i 76 a-e VT 024051 102 a 23 a-d 38 c-e 41 a-e 40 a-g 78 a-e N05007 101 a 21 b-d 54 a-d 26 e-h 26 f-i 79 a-e CHAMPS 99 a 30 a-d 40 b-e 29 d-h 29 d-i 70 a-e Gregory 83 b 21 a-d 41 b-e 20 f-h 24 g-i 74 a-e Mean 106 26 45 35 33 75 LSD0.05
2 16 19 21 20 18 18 1 Means sharing the same letter(s) are not statistically different. 2 Fisher’s protected least significant difference (LSD) at P = 0.05.
32
Peanut Crop Physiology Related Projects @ Tidewater AREC – 2009
Peanut Variety & Quality Evaluation Crop Physiology Comparisons
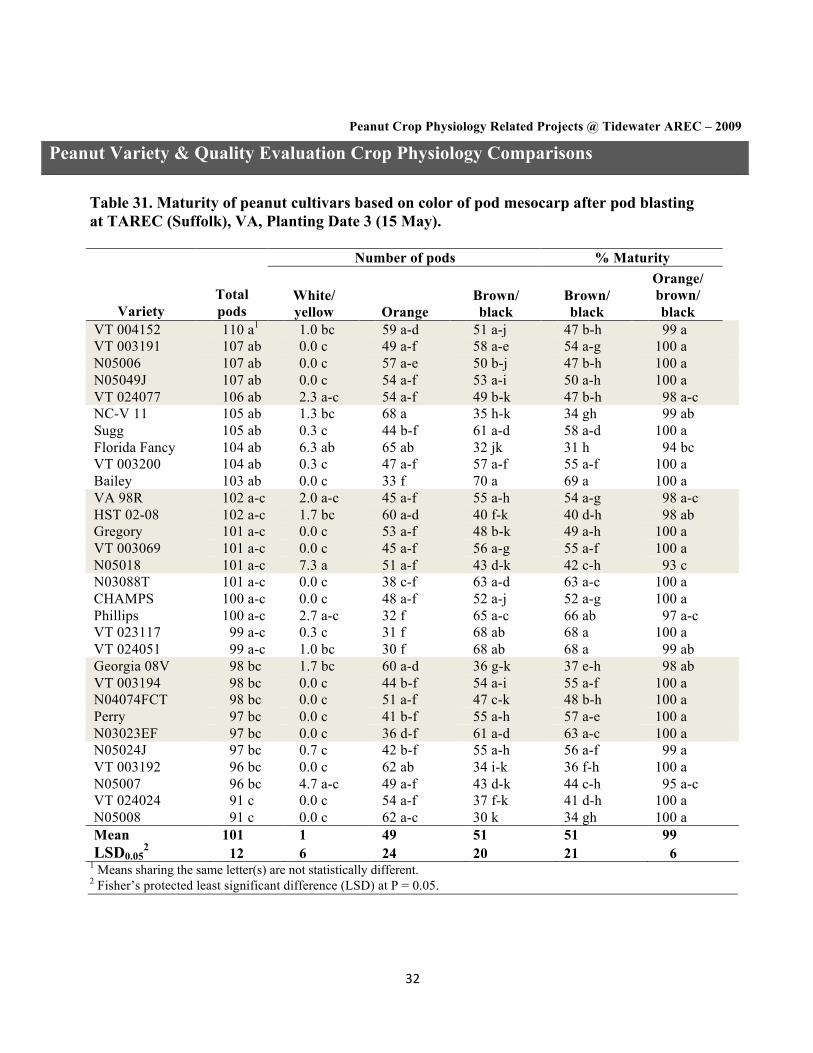
Table 31. Maturity of peanut cultivars based on color of pod mesocarp after pod blasting at TAREC (Suffolk), VA, Planting Date 3 (15 May).
Number of pods % Maturity
Variety Total pods
White/ yellow Orange
Brown/ black
Brown/ black
Orange/ brown/ black
VT 004152 110 a1 1.0 bc 59 a-d 51 a-j 47 b-h 99 a VT 003191 107 ab 0.0 c 49 a-f 58 a-e 54 a-g 100 a N05006 107 ab 0.0 c 57 a-e 50 b-j 47 b-h 100 a N05049J 107 ab 0.0 c 54 a-f 53 a-i 50 a-h 100 a VT 024077 106 ab 2.3 a-c 54 a-f 49 b-k 47 b-h 98 a-c NC-V 11 105 ab 1.3 bc 68 a 35 h-k 34 gh 99 ab Sugg 105 ab 0.3 c 44 b-f 61 a-d 58 a-d 100 a Florida Fancy 104 ab 6.3 ab 65 ab 32 jk 31 h 94 bc VT 003200 104 ab 0.3 c 47 a-f 57 a-f 55 a-f 100 a Bailey 103 ab 0.0 c 33 f 70 a 69 a 100 a VA 98R 102 a-c 2.0 a-c 45 a-f 55 a-h 54 a-g 98 a-c HST 02-08 102 a-c 1.7 bc 60 a-d 40 f-k 40 d-h 98 ab Gregory 101 a-c 0.0 c 53 a-f 48 b-k 49 a-h 100 a VT 003069 101 a-c 0.0 c 45 a-f 56 a-g 55 a-f 100 a N05018 101 a-c 7.3 a 51 a-f 43 d-k 42 c-h 93 c N03088T 101 a-c 0.0 c 38 c-f 63 a-d 63 a-c 100 a CHAMPS 100 a-c 0.0 c 48 a-f 52 a-j 52 a-g 100 a Phillips 100 a-c 2.7 a-c 32 f 65 a-c 66 ab 97 a-c VT 023117 99 a-c 0.3 c 31 f 68 ab 68 a 100 a VT 024051 99 a-c 1.0 bc 30 f 68 ab 68 a 99 ab Georgia 08V 98 bc 1.7 bc 60 a-d 36 g-k 37 e-h 98 ab VT 003194 98 bc 0.0 c 44 b-f 54 a-i 55 a-f 100 a N04074FCT 98 bc 0.0 c 51 a-f 47 c-k 48 b-h 100 a Perry 97 bc 0.0 c 41 b-f 55 a-h 57 a-e 100 a N03023EF 97 bc 0.0 c 36 d-f 61 a-d 63 a-c 100 a N05024J 97 bc 0.7 c 42 b-f 55 a-h 56 a-f 99 a VT 003192 96 bc 0.0 c 62 ab 34 i-k 36 f-h 100 a N05007 96 bc 4.7 a-c 49 a-f 43 d-k 44 c-h 95 a-c VT 024024 91 c 0.0 c 54 a-f 37 f-k 41 d-h 100 a N05008 91 c 0.0 c 62 a-c 30 k 34 gh 100 a Mean 101 1 49 51 51 99 LSD0.05
2 12 6 24 20 21 6 1 Means sharing the same letter(s) are not statistically different. 2 Fisher’s protected least significant difference (LSD) at P = 0.05.
33
Peanut Crop Physiology Related Projects @ Tidewater AREC – 2009
Peanut Variety & Quality Evaluation Crop Physiology Comparisons
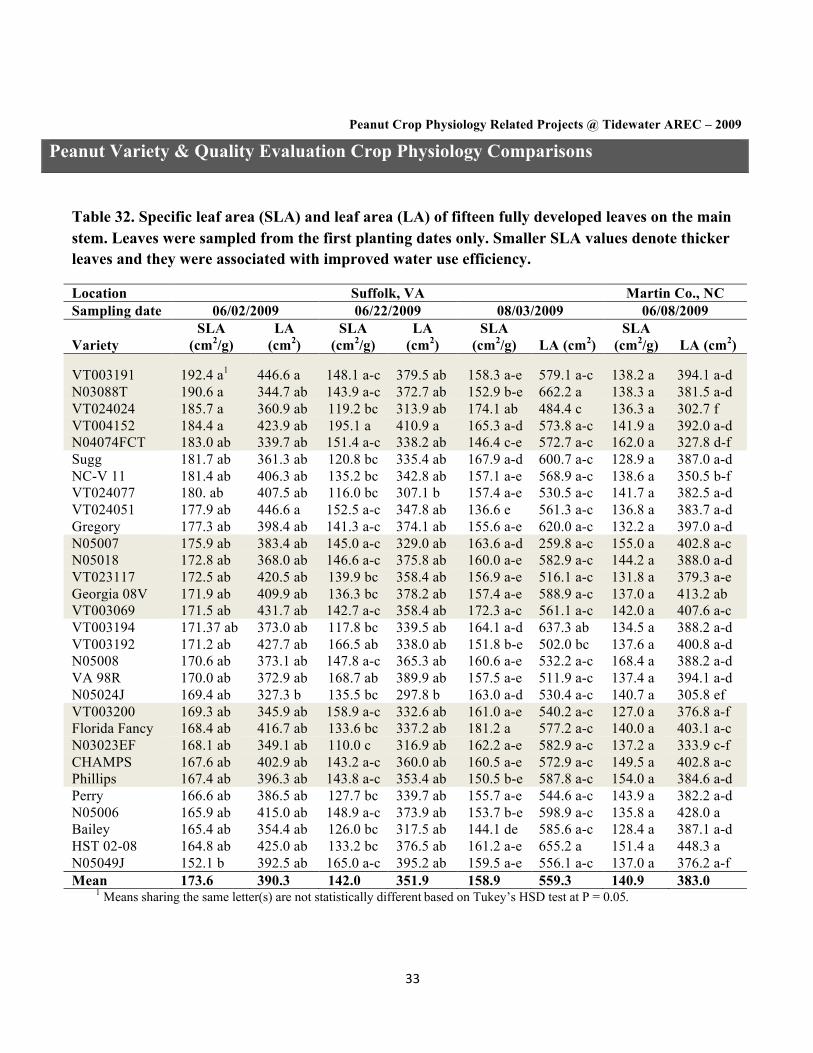
Table 32. Specific leaf area (SLA) and leaf area (LA) of fifteen fully developed leaves on the main stem. Leaves were sampled from the first planting dates only. Smaller SLA values denote thicker leaves and they were associated with improved water use efficiency.
Location Suffolk, VA Martin Co., NC Sampling date 06/02/2009 06/22/2009 08/03/2009 06/08/2009
Variety SLA
(cm2/g) LA
(cm2) SLA
(cm2/g) LA
(cm2) SLA
(cm2/g) LA (cm2) SLA
(cm2/g) LA (cm2)
VT003191 192.4 a1 446.6 a 148.1 a-c 379.5 ab 158.3 a-e 579.1 a-c 138.2 a 394.1 a-d N03088T 190.6 a 344.7 ab 143.9 a-c 372.7 ab 152.9 b-e 662.2 a 138.3 a 381.5 a-d VT024024 185.7 a 360.9 ab 119.2 bc 313.9 ab 174.1 ab 484.4 c 136.3 a 302.7 f VT004152 184.4 a 423.9 ab 195.1 a 410.9 a 165.3 a-d 573.8 a-c 141.9 a 392.0 a-d N04074FCT 183.0 ab 339.7 ab 151.4 a-c 338.2 ab 146.4 c-e 572.7 a-c 162.0 a 327.8 d-f Sugg 181.7 ab 361.3 ab 120.8 bc 335.4 ab 167.9 a-d 600.7 a-c 128.9 a 387.0 a-d NC-V 11 181.4 ab 406.3 ab 135.2 bc 342.8 ab 157.1 a-e 568.9 a-c 138.6 a 350.5 b-f VT024077 180. ab 407.5 ab 116.0 bc 307.1 b 157.4 a-e 530.5 a-c 141.7 a 382.5 a-d VT024051 177.9 ab 446.6 a 152.5 a-c 347.8 ab 136.6 e 561.3 a-c 136.8 a 383.7 a-d Gregory 177.3 ab 398.4 ab 141.3 a-c 374.1 ab 155.6 a-e 620.0 a-c 132.2 a 397.0 a-d N05007 175.9 ab 383.4 ab 145.0 a-c 329.0 ab 163.6 a-d 259.8 a-c 155.0 a 402.8 a-c N05018 172.8 ab 368.0 ab 146.6 a-c 375.8 ab 160.0 a-e 582.9 a-c 144.2 a 388.0 a-d VT023117 172.5 ab 420.5 ab 139.9 bc 358.4 ab 156.9 a-e 516.1 a-c 131.8 a 379.3 a-e Georgia 08V 171.9 ab 409.9 ab 136.3 bc 378.2 ab 157.4 a-e 588.9 a-c 137.0 a 413.2 ab VT003069 171.5 ab 431.7 ab 142.7 a-c 358.4 ab 172.3 a-c 561.1 a-c 142.0 a 407.6 a-c VT003194 171.37 ab 373.0 ab 117.8 bc 339.5 ab 164.1 a-d 637.3 ab 134.5 a 388.2 a-d VT003192 171.2 ab 427.7 ab 166.5 ab 338.0 ab 151.8 b-e 502.0 bc 137.6 a 400.8 a-d N05008 170.6 ab 373.1 ab 147.8 a-c 365.3 ab 160.6 a-e 532.2 a-c 168.4 a 388.2 a-d VA 98R 170.0 ab 372.9 ab 168.7 ab 389.9 ab 157.5 a-e 511.9 a-c 137.4 a 394.1 a-d N05024J 169.4 ab 327.3 b 135.5 bc 297.8 b 163.0 a-d 530.4 a-c 140.7 a 305.8 ef VT003200 169.3 ab 345.9 ab 158.9 a-c 332.6 ab 161.0 a-e 540.2 a-c 127.0 a 376.8 a-f Florida Fancy 168.4 ab 416.7 ab 133.6 bc 337.2 ab 181.2 a 577.2 a-c 140.0 a 403.1 a-c N03023EF 168.1 ab 349.1 ab 110.0 c 316.9 ab 162.2 a-e 582.9 a-c 137.2 a 333.9 c-f CHAMPS 167.6 ab 402.9 ab 143.2 a-c 360.0 ab 160.5 a-e 572.9 a-c 149.5 a 402.8 a-c Phillips 167.4 ab 396.3 ab 143.8 a-c 353.4 ab 150.5 b-e 587.8 a-c 154.0 a 384.6 a-d Perry 166.6 ab 386.5 ab 127.7 bc 339.7 ab 155.7 a-e 544.6 a-c 143.9 a 382.2 a-d N05006 165.9 ab 415.0 ab 148.9 a-c 373.9 ab 153.7 b-e 598.9 a-c 135.8 a 428.0 a Bailey 165.4 ab 354.4 ab 126.0 bc 317.5 ab 144.1 de 585.6 a-c 128.4 a 387.1 a-d HST 02-08 164.8 ab 425.0 ab 133.2 bc 376.5 ab 161.2 a-e 655.2 a 151.4 a 448.3 a N05049J 152.1 b 392.5 ab 165.0 a-c 395.2 ab 159.5 a-e 556.1 a-c 137.0 a 376.2 a-f Mean 173.6 390.3 142.0 351.9 158.9 559.3 140.9 383.0
1 Means sharing the same letter(s) are not statistically different based on Tukey’s HSD test at P = 0.05.
34
Peanut Crop Physiology Related Projects @ Tidewater AREC – 2009
Peanut Variety & Quality Evaluation Crop Physiology Comparisons
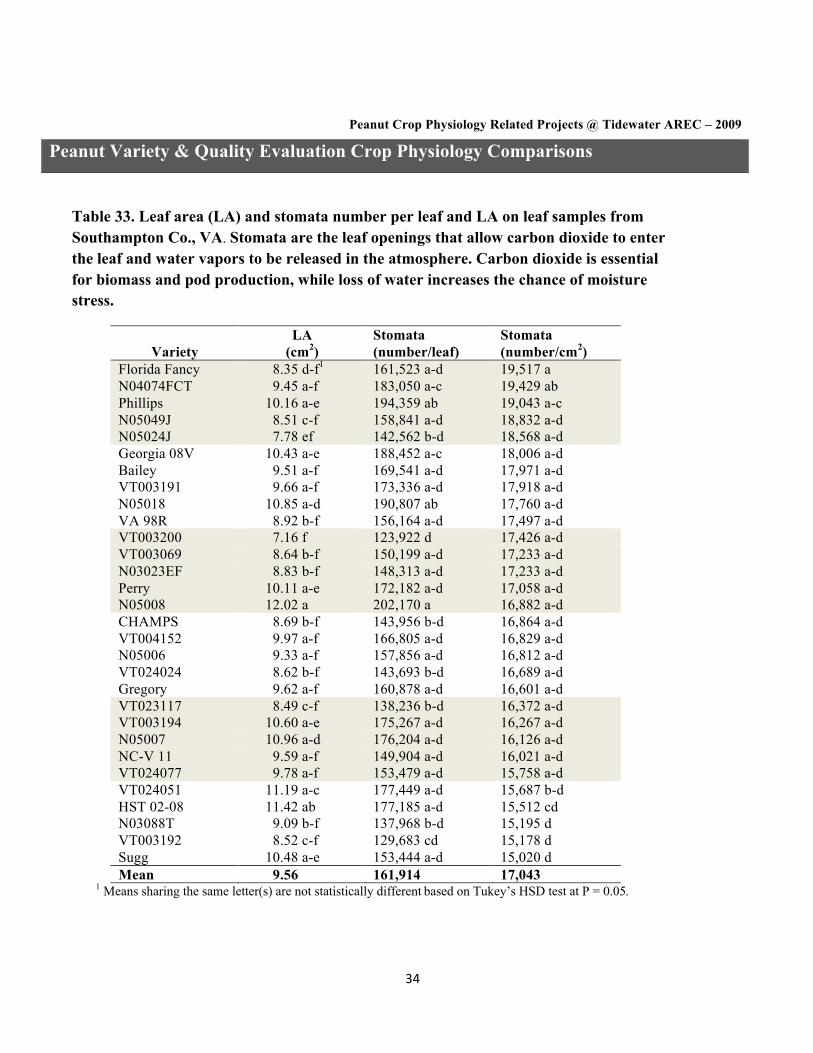
Table 33. Leaf area (LA) and stomata number per leaf and LA on leaf samples from Southampton Co., VA. Stomata are the leaf openings that allow carbon dioxide to enter the leaf and water vapors to be released in the atmosphere. Carbon dioxide is essential for biomass and pod production, while loss of water increases the chance of moisture stress.
Variety LA
(cm2) Stomata (number/leaf)
Stomata (number/cm2)
Florida Fancy 8.35 d-f1 161,523 a-d 19,517 a N04074FCT 9.45 a-f 183,050 a-c 19,429 ab Phillips 10.16 a-e 194,359 ab 19,043 a-c N05049J 8.51 c-f 158,841 a-d 18,832 a-d N05024J 7.78 ef 142,562 b-d 18,568 a-d Georgia 08V 10.43 a-e 188,452 a-c 18,006 a-d Bailey 9.51 a-f 169,541 a-d 17,971 a-d VT003191 9.66 a-f 173,336 a-d 17,918 a-d N05018 10.85 a-d 190,807 ab 17,760 a-d VA 98R 8.92 b-f 156,164 a-d 17,497 a-d VT003200 7.16 f 123,922 d 17,426 a-d VT003069 8.64 b-f 150,199 a-d 17,233 a-d N03023EF 8.83 b-f 148,313 a-d 17,233 a-d Perry 10.11 a-e 172,182 a-d 17,058 a-d N05008 12.02 a 202,170 a 16,882 a-d CHAMPS 8.69 b-f 143,956 b-d 16,864 a-d VT004152 9.97 a-f 166,805 a-d 16,829 a-d N05006 9.33 a-f 157,856 a-d 16,812 a-d VT024024 8.62 b-f 143,693 b-d 16,689 a-d Gregory 9.62 a-f 160,878 a-d 16,601 a-d VT023117 8.49 c-f 138,236 b-d 16,372 a-d VT003194 10.60 a-e 175,267 a-d 16,267 a-d N05007 10.96 a-d 176,204 a-d 16,126 a-d NC-V 11 9.59 a-f 149,904 a-d 16,021 a-d VT024077 9.78 a-f 153,479 a-d 15,758 a-d VT024051 11.19 a-c 177,449 a-d 15,687 b-d HST 02-08 11.42 ab 177,185 a-d 15,512 cd N03088T 9.09 b-f 137,968 b-d 15,195 d VT003192 8.52 c-f 129,683 cd 15,178 d Sugg 10.48 a-e 153,444 a-d 15,020 d Mean 9.56 161,914 17,043
1 Means sharing the same letter(s) are not statistically different based on Tukey’s HSD test at P = 0.05.
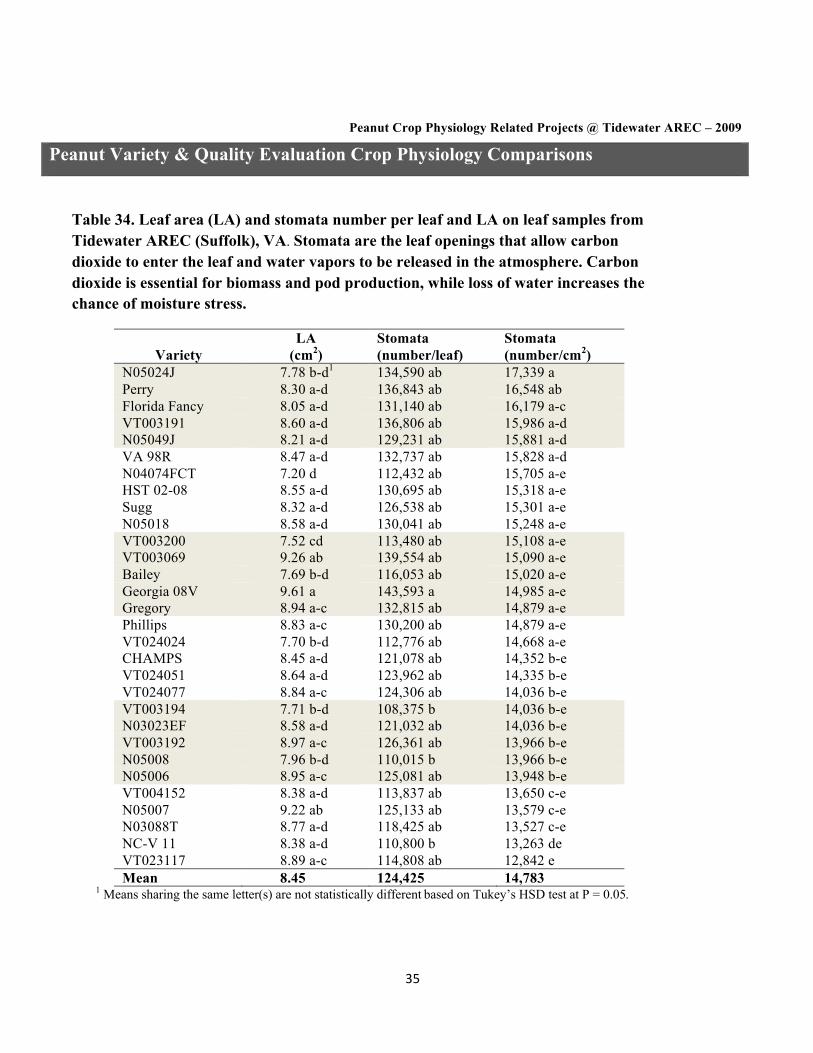
35
Peanut Crop Physiology Related Projects @ Tidewater AREC – 2009
Peanut Variety & Quality Evaluation Crop Physiology Comparisons
Table 34. Leaf area (LA) and stomata number per leaf and LA on leaf samples from Tidewater AREC (Suffolk), VA. Stomata are the leaf openings that allow carbon dioxide to enter the leaf and water vapors to be released in the atmosphere. Carbon dioxide is essential for biomass and pod production, while loss of water increases the chance of moisture stress.
Variety LA
(cm2) Stomata (number/leaf)
Stomata (number/cm2)
N05024J 7.78 b-d1 134,590 ab 17,339 a Perry 8.30 a-d 136,843 ab 16,548 ab Florida Fancy 8.05 a-d 131,140 ab 16,179 a-c VT003191 8.60 a-d 136,806 ab 15,986 a-d N05049J 8.21 a-d 129,231 ab 15,881 a-d VA 98R 8.47 a-d 132,737 ab 15,828 a-d N04074FCT 7.20 d 112,432 ab 15,705 a-e HST 02-08 8.55 a-d 130,695 ab 15,318 a-e Sugg 8.32 a-d 126,538 ab 15,301 a-e N05018 8.58 a-d 130,041 ab 15,248 a-e VT003200 7.52 cd 113,480 ab 15,108 a-e VT003069 9.26 ab 139,554 ab 15,090 a-e Bailey 7.69 b-d 116,053 ab 15,020 a-e Georgia 08V 9.61 a 143,593 a 14,985 a-e Gregory 8.94 a-c 132,815 ab 14,879 a-e Phillips 8.83 a-c 130,200 ab 14,879 a-e VT024024 7.70 b-d 112,776 ab 14,668 a-e CHAMPS 8.45 a-d 121,078 ab 14,352 b-e VT024051 8.64 a-d 123,962 ab 14,335 b-e VT024077 8.84 a-c 124,306 ab 14,036 b-e VT003194 7.71 b-d 108,375 b 14,036 b-e N03023EF 8.58 a-d 121,032 ab 14,036 b-e VT003192 8.97 a-c 126,361 ab 13,966 b-e N05008 7.96 b-d 110,015 b 13,966 b-e N05006 8.95 a-c 125,081 ab 13,948 b-e VT004152 8.38 a-d 113,837 ab 13,650 c-e N05007 9.22 ab 125,133 ab 13,579 c-e N03088T 8.77 a-d 118,425 ab 13,527 c-e NC-V 11 8.38 a-d 110,800 b 13,263 de VT023117 8.89 a-c 114,808 ab 12,842 e Mean 8.45 124,425 14,783
1 Means sharing the same letter(s) are not statistically different based on Tukey’s HSD test at P = 0.05.

36
Peanut Crop Physiology Related Projects @ Tidewater AREC – 2009
Peanut Variety & Quality Evaluation Crop Physiology Comparisons
Table 35. Carbon dioxide assimilation, stomata conductance to water vapors, and transpiration efficiency of peanut plants planted on 15 April, 2009 at Tidewater AREC (Suffolk), VA. Measurements were taken in the early part of June, when plants had plentiful moisture. The higher
the transpiration efficiency is the better plants conserve water.
Variety
Carbon dioxide assimilation
A (µmol/m2/s)
Stomata conductance to water vapors
gs (mol/m2/s)
Transpiration efficiency
A:gs (mmol/m2/s)
Perry 38.29 a1 0.83 bc 53.8 a N03088T 35.01 a 0.80 bc 53.3 a VT003192 36.25 a 0.78 bc 52.5 a Gregory 36.71 a 0.80 bc 52.0 a Bailey 33.51 a 0.70 c 51.3 a N05008 34.23 a 0.75 bc 51.3 a Georgia 08V 39.31 a 0.86 bc 49.7 ab NC-V 11 37.29 a 0.81 bc 49.1 ab Phillips 38.43 a 0.90 a-c 48.4 ab VT003200 33.83 a 0.75 bc 48.0 ab N05049J 36.32 a 0.77 bc 47.8 ab VT003191 35.88 a 0.88 a-c 47.5 ab N05007 36.50 a 0.79 bc 47.5 ab N03023EF 36.14 a 0.81 bc 47.4 ab VT024051 37.22 a 0.82 bc 47.2 ab VT024024 36.44 a 0.80 bc 47.1 ab VT003194 35.98 a 0.86 bc 45.9 ab N05006 39.91 a 0.90 a-c 45.9 ab VT024077 36.13 a 0.89 a-c 45.6 ab N04074FCT 36.86 a 0.84 bc 45.1 ab Florida Fancy 38.72 a 0.92 a-c 44.9 ab VT004152 37.08 a 0.88 a-c 44.8 ab CHAMPS 38.64 a 0.93 a-c 44.4 ab VA 98R 38.19 a 1.00 a-c 43.4 ab VT023117 39.46 a 1.00 a-c 43.1 ab HST 02-08 40.64 a 1.03 a-c 43.0 ab N05024J 40.57 a 1.08 ab 42.8 ab VT003069 37.64 a 0.92 a-c 41.9 ab Sugg 40.28 a 1.03 a-c 40.2 ab N05018 41.83 a 1.25 a 34.9 b Mean 37.44 0.88 46.7
37
1 Means sharing the same letter(s) are not statistically different based on Tukey’s HSD test at P = 0.05.

38
Peanut Crop Physiology Related Projects @ Tidewater AREC – 2009
Peanut Variety & Quality Evaluation Crop Physiology Comparisons
Table 36. Carbon dioxide assimilation, stomata conductance to water vapors, and transpiration efficiency of peanut plants planted on 15 April, 2009 at Tidewater AREC (Suffolk), VA. Measurements were taken in the late part of June, when plants were under water- stressed. The higher the transpiration efficiency is the better plants conserve water. Under water stress, plants assimilated less carbon and conserved water better than in early June (Table 34) when water was plentiful.
Variety
Carbon dioxide assimilation
A (µmol/m2/s)
Stomata conductance to water vapors
gs (mol/m2/s)
Transpiration efficiency
A:gs (mmol/m2/s)
N05006 22.9 c1 0.31 c 93.2 a N05008 22.8 c 0.30 c 92.6 ab N04074FCT 23.5 bc 0.34 c 91.4 a-c N05049J 25.7 a-c 0.40 a-c 84.6 a-d VT003191 25.4 a-c 0.33 c 82.2 a-d NC-V 11 26.1 a-c 0.35 c 77.4 a-e VA 98R 25.2 a-c 0.40 a-c 77.1 a-e VT024051 25.3 a-c 0.37 c 76.1 a-e N05018 26.5 a-c 0.43 a-c 73.7 a-e VT024024 24.4 a-c 0.40 bc 72.1 a-e CHAMPS 26.0 a-c 0.39 bc 71.9 a-e Florida Fancy 26.7 a-c 0.44 a-c 71.6 a-e VT004152 26.1 a-c 0.40 a-c 70.6 a-e VT003192 27.3 a-c 0.41 a-c 70.0 a-e VT003069 26.0 a-c 0.43 a-c 69.9 a-e N05007 28.3 a-c 0.46 a-c 67.9 a-e N03088T 25.4 a-c 0.43 a-c 67.6 a-e N03023EF 28.4 a-c 0.50 a-c 66.5 a-e Gregory 27.0 a-c 0.51 a-c 64.8 a-e Perry 30.2 a-c 0.52 a-c 64.0 a-e N05024J 27.8 a-c 0.50 a-c 62.5 a-e Sugg 27.4 a-c 0.48 a-c 61.7 a-e VT003200 28.0 a-c 0.52 a-c 61.7 a-e VT024077 28.3 a-c 0.47 a-c 61.0 b-e HST 02-08 29.2 a-c 0.51 a-c 60.6 b-e Bailey 27.0 a-c 0.52 a-c 59.3 c-e VT023117 29.3 a-c 0.54 a-c 59.0 de VT003194 29.2 a-c 0.57 a-c 54.2 de Phillips 31.4 ab 0.71 a 49.0 e Georgia 08V 32.3 a 0.71 ab 47.9 e Mean 26.9 0.46 69.4 1 Means sharing the same letter(s) are not statistically different based on Tukey’s HSD test at P = 0.05.

39
Peanut Crop Physiology Related Projects @ Tidewater AREC – 2009
Peanut Variety & Quality Evaluation Crop Physiology Comparisons
Table 37. Carbon dioxide assimilation, stomata conductance to water vapors, and transpiration efficiency of peanut plants planted on 15 April, 2009 at Tidewater AREC (Suffolk), VA. Measurements were taken in early July, when plants recovered from water stress after rainfall. The higher the transpiration efficiency is the better plants conserve water. Under optimum water conditions, plants regain carbon assimilation but transpiration efficiency is low.
Variety
Carbon dioxide assimilation
A (µmol/m2/s)
Stomata conductance to water vapors
gs (mol/m2/s)
Transpiration efficiency A:gs
(mmol/m2/s) N05008 30.8 ab1 0.64 cd 56.2 a N04074FCT 29.4 b 0.62 d 53.8 ab N05006 32.4 ab 0.72 b-d 47.5 a-c Perry 31.9 ab 0.87 a-d 46.7 a-c N03023EF 31.2 ab 0.73 b-d 46.7 a-c NC-V 11 32.4 ab 0.74 b-d 45.2 a-c VT004152 33.2 a 0.84 a-d 44.8 a-c VT003191 32.0 ab 0.80 a-d 43.0 a-c Sugg 32.1 ab 0.84 a-d 42.3 a-c VT023117 32.9 ab 0.81 a-d 42.2 a-c Georgia 08V 34.0 ab 0.84 a-d 42.0 a-c N05049J 34.2 ab 0.92 a-d 41.5 a-c N05007 32.5 ab 0.82 a-d 40.9 a-c N05024J 33.1 ab 0.85 a-d 40.4 bc Bailey 33.0 ab 0.86 a-d 39.9 bc VT003200 32.9 ab 0.89 a-d 39.8 bc VT024051 33.4 ab 0.90 a-d 39.7 bc CHAMPS 34.3 ab 0.91 a-d 38.8 bc VT003194 33.6 ab 0.90 a-d 38.4 bc VT003192 33.5 ab 0.96 a-d 37.4 c Gregory 33.5 ab 0.93 a-d 37.0 c VA 98R 33.8 ab 0.98 a-c 36.3 c N05018 34.4 a 1.01 ab 36.3 c N03088T 32.0 ab 0.91 a-d 36.2 c VT024077 34.1 ab 0.99 ab 35.2 c VT024024 34.4 a 1.02 ab 34.7 c HST 02-08 35.2 a 1.03 ab 34.4 c Florida Fancy 35.6 a 1.10 a 33.6 c VT003069 33.2 ab 1.04 ab 32.8 c Phillips 34.3 ab 1.09 a 32.1 c Mean 33.1 0.89 40.5 1 Means sharing the same letter(s) are not statistically different based on Tukey’s HSD test at P = 0.05.