Embed Size (px)
Citation preview
*S49796A01212*12
BLANK PAGE
Every effort has been made to contact copyright holders to obtain their permission for the use of copyright material. Pearson Education Ltd. will, if notified, be happy to rectify any errors or omissions and include any such rectifications in future editions.
Turn over
*S49796A*S49796A©2016 Pearson Education Ltd.
1/1/1/1/1
Do not return this Resource Booklet with the question paper.
Pearson Edexcel Level 3 GCE
Sample assessment material for first teaching September 2016Resource Booklet
GeographyAdvancedPaper 3
Paper Reference
9GE0/03
Turn over
145Pearson Edexcel Level 3 Advanced GCE in Geography – Sample Assessment Materials – Issue 2 – February 2017 © Pearson Education Limited 2017
PMT
2S49796A
Resource exploitation in the Congo Basin of west central Africa
Section A: The region and its forests
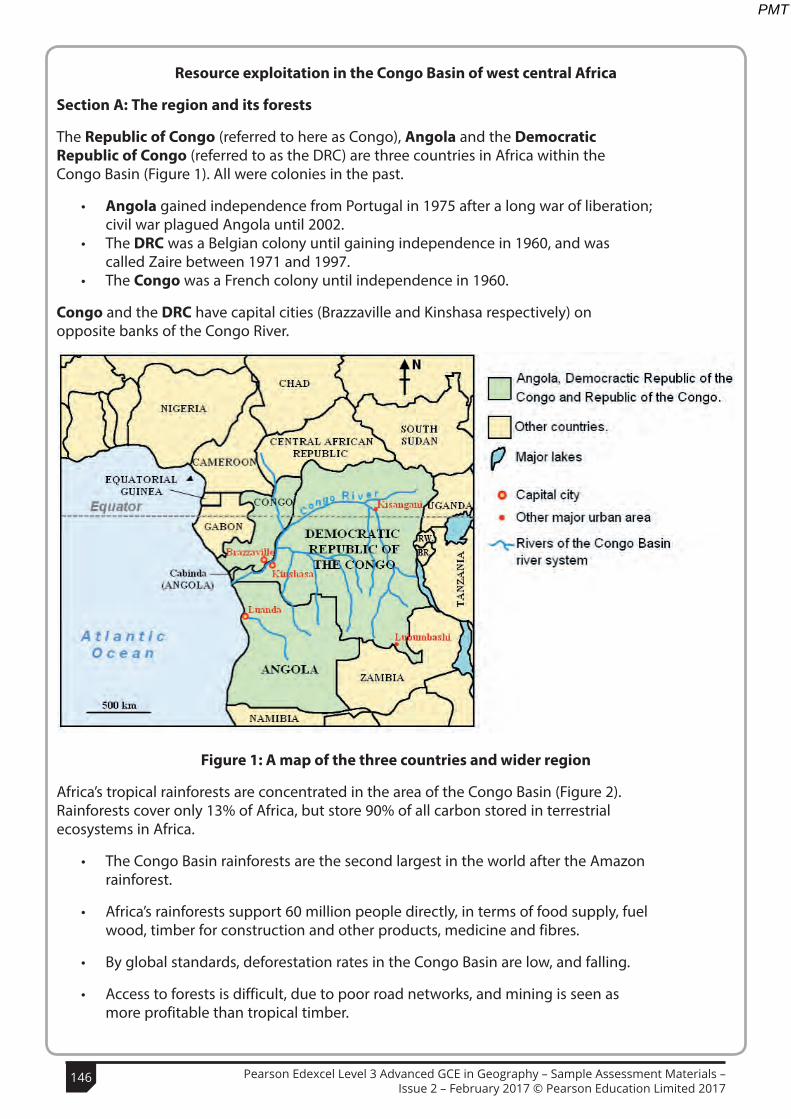
The Republic of Congo (referred to here as Congo), Angola and the Democratic Republic of Congo (referred to as the DRC) are three countries in Africa within the Congo Basin (Figure 1). All were colonies in the past.
• Angola gained independence from Portugal in 1975 after a long war of liberation; civil war plagued Angola until 2002.
• The DRC was a Belgian colony until gaining independence in 1960, and was called Zaire between 1971 and 1997.
• The Congo was a French colony until independence in 1960.
Congo and the DRC have capital cities (Brazzaville and Kinshasa respectively) on opposite banks of the Congo River.
Figure 1: A map of the three countries and wider region
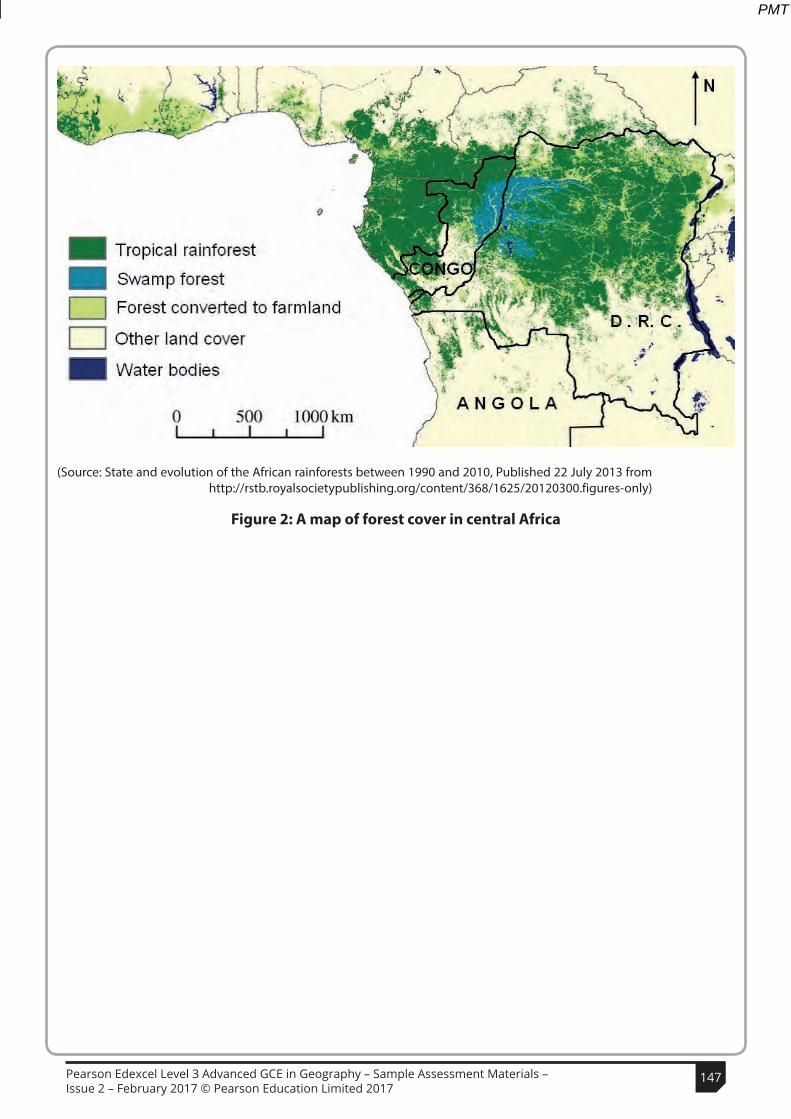
Africa’s tropical rainforests are concentrated in the area of the Congo Basin (Figure 2). Rainforests cover only 13% of Africa, but store 90% of all carbon stored in terrestrial ecosystems in Africa.
• The Congo Basin rainforests are the second largest in the world after the Amazon rainforest.
• Africa’s rainforests support 60 million people directly, in terms of food supply, fuel wood, timber for construction and other products, medicine and fibres.
• By global standards, deforestation rates in the Congo Basin are low, and falling.
• Access to forests is difficult, due to poor road networks, and mining is seen as more profitable than tropical timber.
3S49796A
Turn over
(Source: State and evolution of the African rainforests between 1990 and 2010, Published 22 July 2013 from http://rstb.royalsocietypublishing.org/content/368/1625/20120300.figures-only)
Figure 2: A map of forest cover in central Africa
146 Pearson Edexcel Level 3 Advanced GCE in Geography – Sample Assessment Materials – Issue 2 – February 2017 © Pearson Education Limited 2017
PMT
2S49796A
Resource exploitation in the Congo Basin of west central Africa
Section A: The region and its forests
The Republic of Congo (referred to here as Congo), Angola and the Democratic Republic of Congo (referred to as the DRC) are three countries in Africa within the Congo Basin (Figure 1). All were colonies in the past.
• Angola gained independence from Portugal in 1975 after a long war of liberation; civil war plagued Angola until 2002.
• The DRC was a Belgian colony until gaining independence in 1960, and was called Zaire between 1971 and 1997.
• The Congo was a French colony until independence in 1960.
Congo and the DRC have capital cities (Brazzaville and Kinshasa respectively) on opposite banks of the Congo River.
Figure 1: A map of the three countries and wider region
Africa’s tropical rainforests are concentrated in the area of the Congo Basin (Figure 2). Rainforests cover only 13% of Africa, but store 90% of all carbon stored in terrestrial ecosystems in Africa.
• The Congo Basin rainforests are the second largest in the world after the Amazon rainforest.
• Africa’s rainforests support 60 million people directly, in terms of food supply, fuel wood, timber for construction and other products, medicine and fibres.
• By global standards, deforestation rates in the Congo Basin are low, and falling.
• Access to forests is difficult, due to poor road networks, and mining is seen as more profitable than tropical timber.
3S49796A
Turn over
(Source: State and evolution of the African rainforests between 1990 and 2010, Published 22 July 2013 from http://rstb.royalsocietypublishing.org/content/368/1625/20120300.figures-only)
Figure 2: A map of forest cover in central Africa
147Pearson Edexcel Level 3 Advanced GCE in Geography – Sample Assessment Materials – Issue 2 – February 2017 © Pearson Education Limited 2017
PMT

4S49796A
SECTION B
Development, economic and trade data
The DRC and Angola are classified as Least Developed Countries (LDCs) by the United Nations, and are two of 34 LDCs in Africa.
• 70%+ of people in the DRC live on less than US$1.25 per day (40% in Angola and 30% in Congo).
• Only two countries in Africa (Botswana and Cape Verde) have managed to ‘escape’ the classification, since the LDC country classification was introduced in 1971.
• While these countries are poor by global standards, they are rich in terms of natural resources.
• The mineral resources of the DRC have been estimated to be worth US$24 trillion and both Congo and Angola have $ billions of crude oil still to exploit.
Country
Inco
me
per
pers
on (U
S$)
Popu
latio
n ag
ed
0-14
(%)
Popu
latio
n w
ith
elec
tric
ity (%
)
Infa
nt m
orta
lity
rate
(per
100
0 liv
e bi
rths
)
Life
exp
ecta
ncy
Aver
age
annu
al
GD
P gr
owth
(%)
2003
-201
3
Gin
i co-
effic
ient
(in
com
e eq
ualit
y)
Angola 5170 48 35 102 52 10.3 58.6
Congo 2590 43 37 36 58 4.5 47.3
DRC 430 45 15 86 49.5 6.2 44.4
Figure 3: A table showing selected development indicators for the three countries, 2013-14
5S49796A
Turn over
SECTION C
Economic and trade data
This region of Africa produces resources that are important globally.
• In 2014 Angola was the world’s 16th largest producer of crude oil and Congo the 39th.
• The DRC is the world’s largest producer of cobalt ores. • The DRC is the world’s 8th largest producer of copper ore. • The mineral coltan (or columbite-tantalite) is produced in the DRC and nearby
Rwanda; the DRC is the world’s 3rd largest source of coltan.
These metals are found in a wide variety of consumers products (Figure 4).
(Source:Image 19049807 – Sergeii Kolesnyk/123RF \ Image 19671147 – bloomua/ 123RF \ Image 14270106 - martm/123RF)
Figure 4: Detail of three resources from Africa used in consumer electronics
148 Pearson Edexcel Level 3 Advanced GCE in Geography – Sample Assessment Materials – Issue 2 – February 2017 © Pearson Education Limited 2017
PMT

4S49796A
SECTION B
Development, economic and trade data
The DRC and Angola are classified as Least Developed Countries (LDCs) by the United Nations, and are two of 34 LDCs in Africa.
• 70%+ of people in the DRC live on less than US$1.25 per day (40% in Angola and 30% in Congo).
• Only two countries in Africa (Botswana and Cape Verde) have managed to ‘escape’ the classification, since the LDC country classification was introduced in 1971.
• While these countries are poor by global standards, they are rich in terms of natural resources.
• The mineral resources of the DRC have been estimated to be worth US$24 trillion and both Congo and Angola have $ billions of crude oil still to exploit.
Country
Inco
me
per
pers
on (U
S$)
Popu
latio
n ag
ed
0-14
(%)
Popu
latio
n w
ith
elec
tric
ity (%
)
Infa
nt m
orta
lity
rate
(per
100
0 liv
e bi
rths
)
Life
exp
ecta
ncy
Aver
age
annu
al
GD
P gr
owth
(%)
2003
-201
3
Gin
i co-
effic
ient
(in
com
e eq
ualit
y)
Angola 5170 48 35 102 52 10.3 58.6
Congo 2590 43 37 36 58 4.5 47.3
DRC 430 45 15 86 49.5 6.2 44.4
Figure 3: A table showing selected development indicators for the three countries, 2013-14
5S49796A
Turn over
SECTION C
Economic and trade data
This region of Africa produces resources that are important globally.
• In 2014 Angola was the world’s 16th largest producer of crude oil and Congo the 39th.
• The DRC is the world’s largest producer of cobalt ores. • The DRC is the world’s 8th largest producer of copper ore. • The mineral coltan (or columbite-tantalite) is produced in the DRC and nearby
Rwanda; the DRC is the world’s 3rd largest source of coltan.
These metals are found in a wide variety of consumers products (Figure 4).
(Source:Image 19049807 – Sergeii Kolesnyk/123RF \ Image 19671147 – bloomua/ 123RF \ Image 14270106 - martm/123RF)
Figure 4: Detail of three resources from Africa used in consumer electronics
149Pearson Edexcel Level 3 Advanced GCE in Geography – Sample Assessment Materials – Issue 2 – February 2017 © Pearson Education Limited 2017
PMT
6S49796A
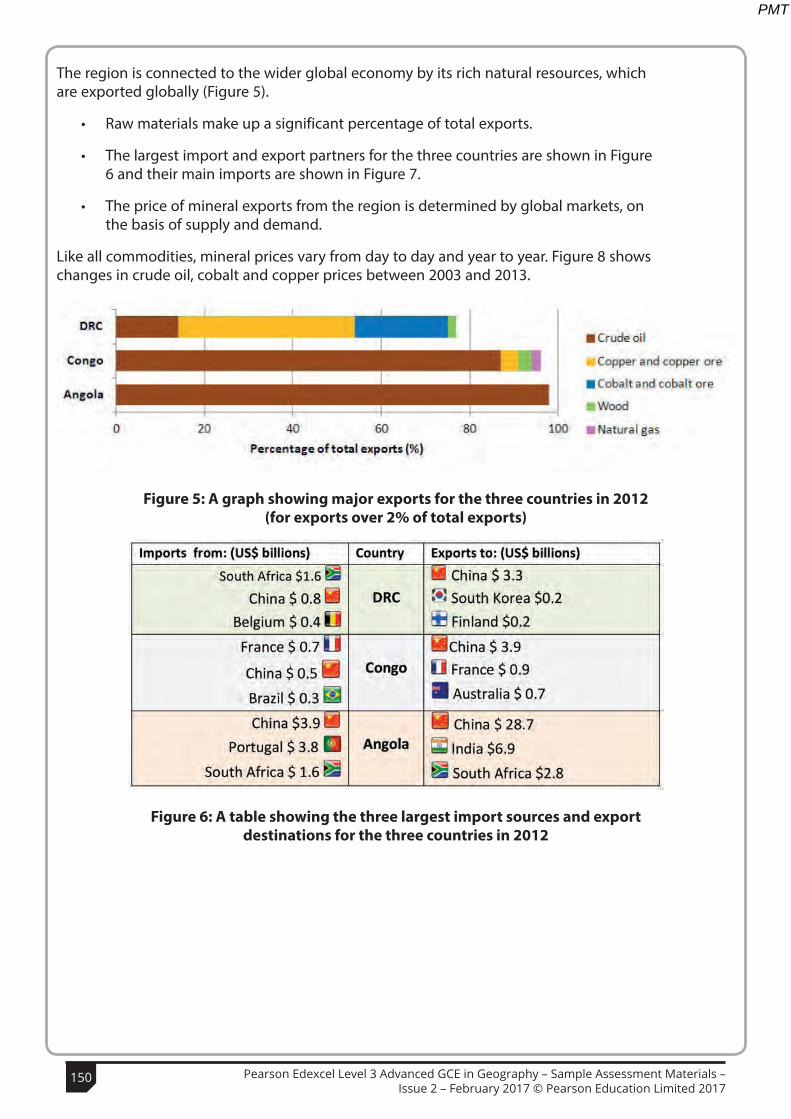
The region is connected to the wider global economy by its rich natural resources, which are exported globally (Figure 5).
• Raw materials make up a significant percentage of total exports.
• The largest import and export partners for the three countries are shown in Figure 6 and their main imports are shown in Figure 7.
• The price of mineral exports from the region is determined by global markets, on the basis of supply and demand.
Like all commodities, mineral prices vary from day to day and year to year. Figure 8 shows changes in crude oil, cobalt and copper prices between 2003 and 2013.
Figure 5: A graph showing major exports for the three countries in 2012 (for exports over 2% of total exports)
Figure 6: A table showing the three largest import sources and export destinations for the three countries in 2012
7S49796A
Turn over
Figure 7: A graph showing major imports for the three countries in 2012 (for imports over 2% of total imports)
Figure 8: A graph showing crude oil, cobalt and copper prices 2003-2013
150 Pearson Edexcel Level 3 Advanced GCE in Geography – Sample Assessment Materials – Issue 2 – February 2017 © Pearson Education Limited 2017
PMT

6S49796A
The region is connected to the wider global economy by its rich natural resources, which are exported globally (Figure 5).
• Raw materials make up a significant percentage of total exports.
• The largest import and export partners for the three countries are shown in Figure 6 and their main imports are shown in Figure 7.
• The price of mineral exports from the region is determined by global markets, on the basis of supply and demand.
Like all commodities, mineral prices vary from day to day and year to year. Figure 8 shows changes in crude oil, cobalt and copper prices between 2003 and 2013.
Figure 5: A graph showing major exports for the three countries in 2012 (for exports over 2% of total exports)
Figure 6: A table showing the three largest import sources and export destinations for the three countries in 2012
7S49796A
Turn over
Figure 7: A graph showing major imports for the three countries in 2012 (for imports over 2% of total imports)
Figure 8: A graph showing crude oil, cobalt and copper prices 2003-2013
151Pearson Edexcel Level 3 Advanced GCE in Geography – Sample Assessment Materials – Issue 2 – February 2017 © Pearson Education Limited 2017
PMT

8S49796A
Figure 9: A scattergraph of natural resources exports versus income per person (2013)
9S49796A
Turn over
SECTION D
Although abundant natural resources might be considered a blessing for a country, the concept of the ‘Resource Curse’ is that abundant natural resources sometimes prevent economic development rather than promote it.
• Resource-rich countries may rely on exporting raw materials, often cheaply, preventing the development of manufacturing and service industries.
• Investment, whether local or foreign, may focus on exploiting resources rather than invested in other sectors such as manufacturing or services.
152 Pearson Edexcel Level 3 Advanced GCE in Geography – Sample Assessment Materials – Issue 2 – February 2017 © Pearson Education Limited 2017
PMT
8S49796A
Figure 9: A scattergraph of natural resources exports versus income per person (2013)
9S49796A
Turn over
SECTION D
Although abundant natural resources might be considered a blessing for a country, the concept of the ‘Resource Curse’ is that abundant natural resources sometimes prevent economic development rather than promote it.
• Resource-rich countries may rely on exporting raw materials, often cheaply, preventing the development of manufacturing and service industries.
• Investment, whether local or foreign, may focus on exploiting resources rather than invested in other sectors such as manufacturing or services.
153Pearson Edexcel Level 3 Advanced GCE in Geography – Sample Assessment Materials – Issue 2 – February 2017 © Pearson Education Limited 2017
PMT
10S49796A
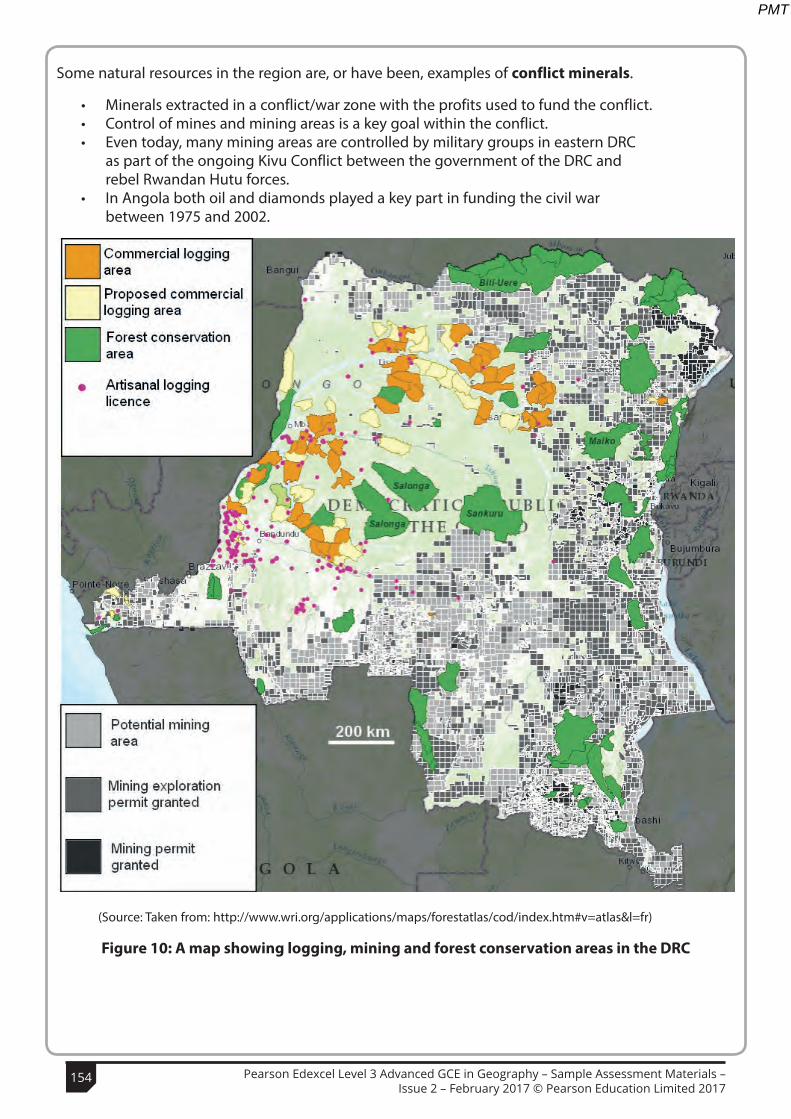
Some natural resources in the region are, or have been, examples of conflict minerals.
• Minerals extracted in a conflict/war zone with the profits used to fund the conflict. • Control of mines and mining areas is a key goal within the conflict. • Even today, many mining areas are controlled by military groups in eastern DRC
as part of the ongoing Kivu Conflict between the government of the DRC and rebel Rwandan Hutu forces.
• In Angola both oil and diamonds played a key part in funding the civil war between 1975 and 2002.
(Source: Taken from: http://www.wri.org/applications/maps/forestatlas/cod/index.htm#v=atlas&l=fr)
Figure 10: A map showing logging, mining and forest conservation areas in the DRC
11S49796A
Turn over
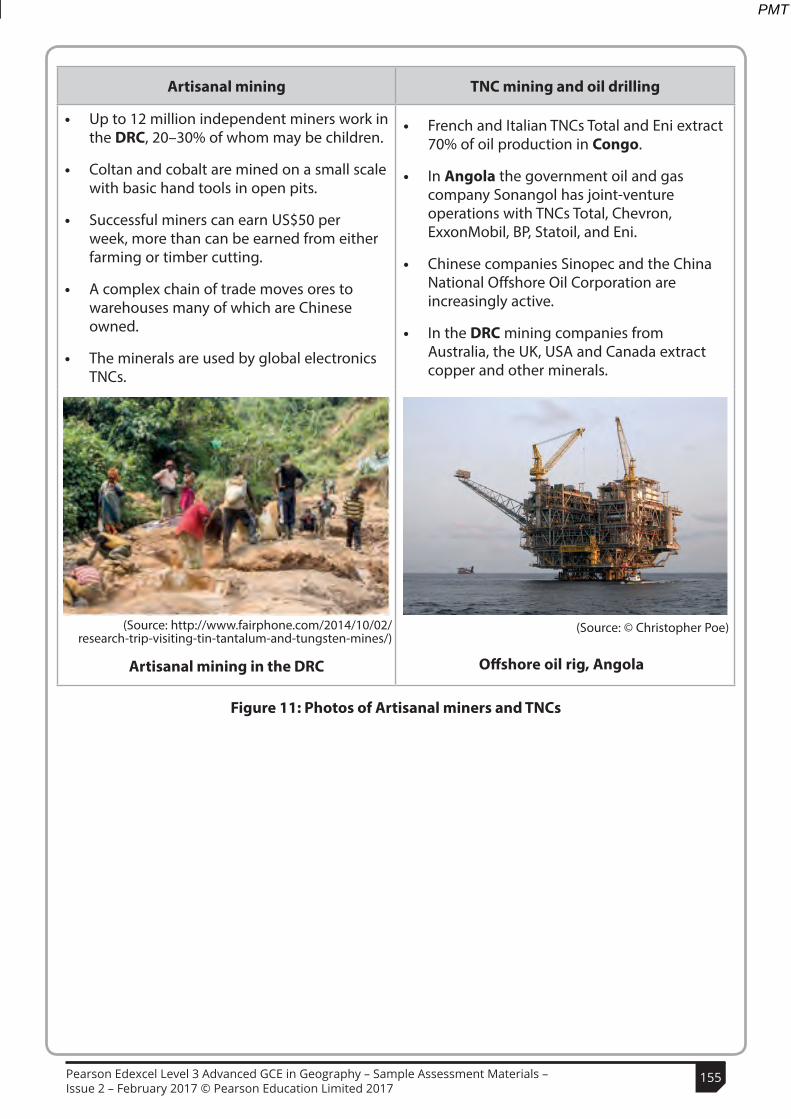
Artisanal mining TNC mining and oil drilling
• Up to 12 million independent miners work in the DRC, 20–30% of whom may be children.
• Coltan and cobalt are mined on a small scale with basic hand tools in open pits.
• Successful miners can earn US$50 per week, more than can be earned from either farming or timber cutting.
• A complex chain of trade moves ores to warehouses many of which are Chinese owned.
• The minerals are used by global electronics TNCs.
• French and Italian TNCs Total and Eni extract 70% of oil production in Congo.
• In Angola the government oil and gas company Sonangol has joint-venture operations with TNCs Total, Chevron, ExxonMobil, BP, Statoil, and Eni.
• Chinese companies Sinopec and the China National Offshore Oil Corporation are increasingly active.
• In the DRC mining companies from Australia, the UK, USA and Canada extract copper and other minerals.
Artisanal mining in the DRC
Offshore oil rig, Angola
Figure 11: Photos of Artisanal miners and TNCs
(Source: © Christopher Poe)(Source: http://www.fairphone.com/2014/10/02/research-trip-visiting-tin-tantalum-and-tungsten-mines/)
154 Pearson Edexcel Level 3 Advanced GCE in Geography – Sample Assessment Materials – Issue 2 – February 2017 © Pearson Education Limited 2017
PMT
10S49796A
Some natural resources in the region are, or have been, examples of conflict minerals.
• Minerals extracted in a conflict/war zone with the profits used to fund the conflict. • Control of mines and mining areas is a key goal within the conflict. • Even today, many mining areas are controlled by military groups in eastern DRC
as part of the ongoing Kivu Conflict between the government of the DRC and rebel Rwandan Hutu forces.
• In Angola both oil and diamonds played a key part in funding the civil war between 1975 and 2002.
(Source: Taken from: http://www.wri.org/applications/maps/forestatlas/cod/index.htm#v=atlas&l=fr)
Figure 10: A map showing logging, mining and forest conservation areas in the DRC
11S49796A
Turn over
Artisanal mining TNC mining and oil drilling
• Up to 12 million independent miners work in the DRC, 20–30% of whom may be children.
• Coltan and cobalt are mined on a small scale with basic hand tools in open pits.
• Successful miners can earn US$50 per week, more than can be earned from either farming or timber cutting.
• A complex chain of trade moves ores to warehouses many of which are Chinese owned.
• The minerals are used by global electronics TNCs.
• French and Italian TNCs Total and Eni extract 70% of oil production in Congo.
• In Angola the government oil and gas company Sonangol has joint-venture operations with TNCs Total, Chevron, ExxonMobil, BP, Statoil, and Eni.
• Chinese companies Sinopec and the China National Offshore Oil Corporation are increasingly active.
• In the DRC mining companies from Australia, the UK, USA and Canada extract copper and other minerals.
Artisanal mining in the DRC
Offshore oil rig, Angola
Figure 11: Photos of Artisanal miners and TNCs
(Source: © Christopher Poe)(Source: http://www.fairphone.com/2014/10/02/research-trip-visiting-tin-tantalum-and-tungsten-mines/)
155Pearson Edexcel Level 3 Advanced GCE in Geography – Sample Assessment Materials – Issue 2 – February 2017 © Pearson Education Limited 2017
PMT
12S49796A
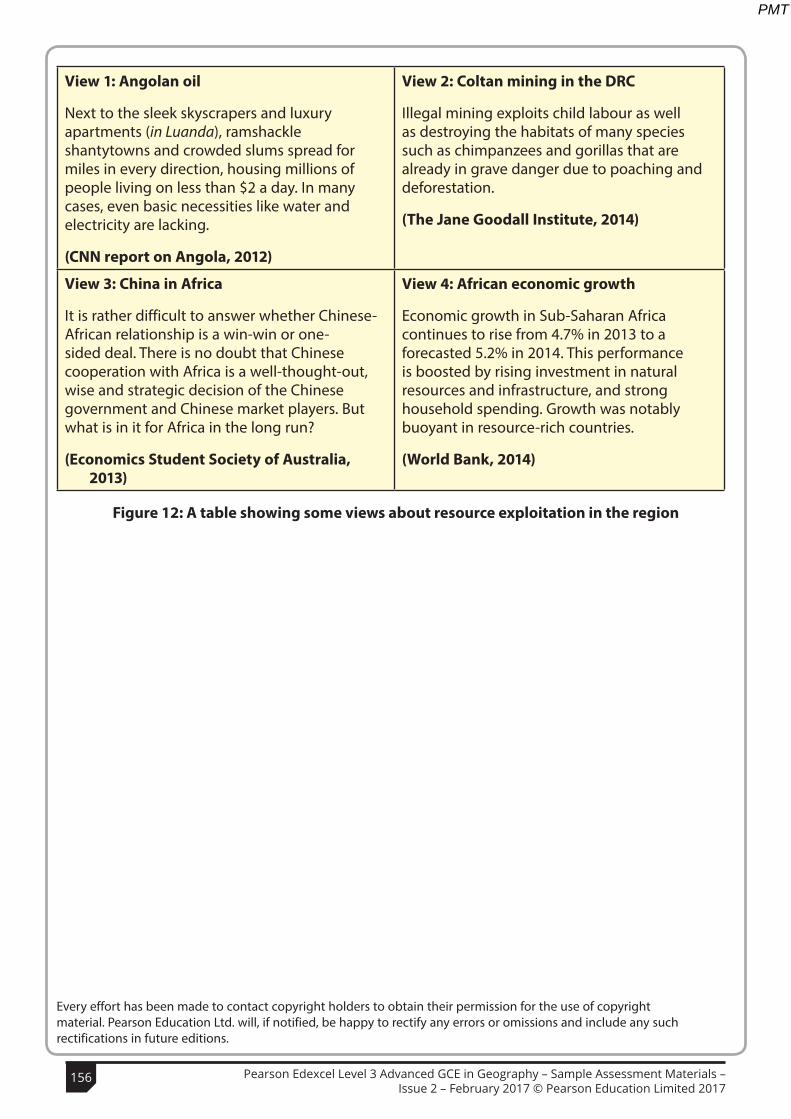
View 1: Angolan oil
Next to the sleek skyscrapers and luxury apartments (in Luanda), ramshackle shantytowns and crowded slums spread for miles in every direction, housing millions of people living on less than $2 a day. In many cases, even basic necessities like water and electricity are lacking.
(CNN report on Angola, 2012)
View 2: Coltan mining in the DRC
Illegal mining exploits child labour as well as destroying the habitats of many species such as chimpanzees and gorillas that are already in grave danger due to poaching and deforestation.
(The Jane Goodall Institute, 2014)
View 3: China in Africa
It is rather difficult to answer whether Chinese-African relationship is a win-win or one-sided deal. There is no doubt that Chinese cooperation with Africa is a well-thought-out, wise and strategic decision of the Chinese government and Chinese market players. But what is in it for Africa in the long run?
(Economics Student Society of Australia, 2013)
View 4: African economic growth
Economic growth in Sub-Saharan Africa continues to rise from 4.7% in 2013 to a forecasted 5.2% in 2014. This performance is boosted by rising investment in natural resources and infrastructure, and strong household spending. Growth was notably buoyant in resource-rich countries.
(World Bank, 2014)
Figure 12: A table showing some views about resource exploitation in the region
Every effort has been made to contact copyright holders to obtain their permission for the use of copyright material. Pearson Education Ltd. will, if notified, be happy to rectify any errors or omissions and include any such rectifications in future editions.
12S49796A
View 1: Angolan oil
Next to the sleek skyscrapers and luxury apartments (in Luanda), ramshackle shantytowns and crowded slums spread for miles in every direction, housing millions of people living on less than $2 a day. In many cases, even basic necessities like water and electricity are lacking.
(CNN report on Angola, 2012)
View 2: Coltan mining in the DRC
Illegal mining exploits child labour as well as destroying the habitats of many species such as chimpanzees and gorillas that are already in grave danger due to poaching and deforestation.
(The Jane Goodall Institute, 2014)
View 3: China in Africa
It is rather difficult to answer whether Chinese-African relationship is a win-win or one-sided deal. There is no doubt that Chinese cooperation with Africa is a well-thought-out, wise and strategic decision of the Chinese government and Chinese market players. But what is in it for Africa in the long run?
(Economics Student Society of Australia,2013)
View 4: African economic growth
Economic growth in Sub-Saharan Africa continues to rise from 4.7% in 2013 to a forecasted 5.2% in 2014. This performance is boosted by rising investment in natural resources and infrastructure, and strong household spending. Growth was notably buoyant in resource-rich countries.
(World Bank, 2014)
Figure 12: A table showing some views about resource exploitation in the region
Every effort has been made to contact copyright holders to obtain their permission for the use of copyright material. Pearson Education Ltd. will, if notified, be happy to rectify any errors or omissions and include any such rectifications in future editions.
Question number
Indicative content Mark
1 AO1 (4 marks) Award 1 mark for identifying a reason why tropical rainforests are a globally important physical system, and a further 3 marks for expansion up to a maximum of 4 marks. For example:
• Key role in carbon sequestration (1) because, duringphotosynthesis, carbon from the atmosphere is convertedinto biomass (a carbon store) (1) which, in addition, meansforests play a key role in climate regulation by balancingglobal CO2 levels (1) and the ‘lungs of the Earth’ idea interms of oxygen generation (1).
• Key role in the water cycle (1), in terms ofinfiltration/interception and storing water rather thanpromoting surface runoff and flooding (1) copiousevaporation/transpiration aids the production of clouds andmaintains the equatorial climate (1) and the rainfallassociated with the ITCZ climate belt (1).
Reject arguments based on mineral wealth/other resources that involve the destruction of the forest. Accept any other appropriate response.
(4)
Question number
Indicative content Mark
2 (a) AO3 (4 marks)
Award 1 mark for completion of empty d and d2 rows:
6 36 4 16 0 0 4 16
Award 1 mark for the sum of d2 column (Σ) = 80
Award 1 mark for the correct working of equation:
1 −6 x 80
10! − 10 𝐨𝐨𝐨𝐨𝐨𝐨𝐨𝐨 1 −
480990
= R
Award 1 mark for answers that round to R = 0.52 OR Award full marks for the correct value of R alone. Allow error carried forward from each step.
(4)
Paper 3 mark scheme
156 Pearson Edexcel Level 3 Advanced GCE in Geography – Sample Assessment Materials – Issue 2 – February 2017 © Pearson Education Limited 2017
PMT