Embed Size (px)
Citation preview

Special edition paperSpecial edition paperSpecial edition paperSpecial edition paperSpecial edition paperSpecial edition paperSpecial edition paperSpecial edition paperSpecial edition paperSpecial edition paperSpecial edition paperSpecial edition paperSpecial edition paper
JR EAST Technical Review-No.1264
Use of the heavy compound catenary equipment—the standard
overhead contact line system for the Shinkansen—is limited
to speeds of up to around 240 km/h. So, in order to carry out
running tests at around 360 km/h, considerable improvement and
development was required. Since the period from planning to start
of the tests using FASTECH360 was only a year, we went to work
on the development of the overhead contact line system taking into
account shortening of the work period.
As is widely known, improving the wave propagation velocity of
the overhead contact line c shown in formula (1) is effective for
increasing the running speed. For that reason, we have increased the
tension of and decreased the weight of the contact wire.
c= (T / r) 1/2 × 3.6 [km/h] · · · (1)
T: Tension of the overhead contact line [N],
r: Weight per unit length of the overhead contact line [kg/m]
Table 1 and Fig. 1 shows the compound catenary equipment
deployed for JR East Shinkansen.
The “Higher tension heavy compound catenary equipment” in
Table 1 is the overhead contact line system that was improved when
we increased the speed of the Tohoku Shinkansen to 275 km/h, and
the “CS heavy compound catenary equipment” is the system that
was improved in tests 15 years before where we successfully increased
the speed to 425 km/h using the STAR21 test train on the Joetsu
Shinkansen.
In the high speed running tests this time, performance equivalent
to that of the CS heavy compound catenary equipment was required.
We were concerned, however, that development and construction
could not be done in time, because the section that needed
improvement was as long as approx. 60 km (60 drums) between
Sendai and Kitakami.
3.1 Issues in Current Collection Performance
In running tests in 2003 using an operating train to get basic data for
tests with FASTECH360, we measured remarkable strain (stress) on
the contact wire over 1,000 μst at 360 km/h.
We presumed the cause to be the compound effect of short
intervals of 50 m for pantographs of the test train, single-arm contact
strips and heavy pull-off arms. Also, we thought that another cause
was that wave propagation was prevented because sufficient wave
In order to increase Shinkansen operational speeds, we need to conduct development on the overhead contact line equipment that
supplies power to rolling stock in addition to development for rolling stock. At the start of the tests using FASTECH360, we introduced a
new overhead contact line system that replaces conventional compound overhead contact line equipment (hereafter “improved compound
catenary equipment”). But, as speeds in tests increased, we found many problems due to the change of the height of the overhead contact
lines and the arrangement of pantographs that were not major concerns at present operational speeds. We addressed those problems
through simulations and tests using an actual train and finally gained a good perspective on supplying power in the speed range of 360 km/h.
In this paper, I will introduce the development of the new system.
Optimization of Overhead Contact Lines for Shinkansen Speed Increases
Introduction1
Overhead Contact Line System Suitable for Increased Speed2
Issues in Improvement of the Overhead Contact Line System3
*Railway Technical Research Institute (Previously at Technical Center, Research and Development Center of JR East Group)
Kunio Ikeda*
Messenger wire
Higher tensionheavy compound
catenary equipment
CS heavy compound catenary equipment
Auxiliary messenger wire Contact wire Running speed
CS: Copper clad Steel contact wire
Table 1 Example of Overhead Contact Line System for the Shinkansen
Bracket
Pull-off arm
Dropper
HangerContact wire
Messenger wire
Auxiliary catenary wire
Fig. 1 Heavy Compound Catenary Equipment
l Keywords: Speed increases, Overhead contact lines, Current collection performance
Special edition paper
JR EAST Technical Review-No.12 65
propagation velocity was not secured due to loose tension of the
auxiliary messenger wire.
3.2 Issues in Construction
When we conducted improvement work of the CS heavy compound
catenary equipment for the running tests of STAR21, for example,
it took three days to improve one drum length (see Table 4). It was
clear that if applying the same work method to the improvement
this time, work would take more than half a year. Considering that
and a balanced schedule with other maintenance work, we had to
drastically shorten the work period.
In improvements to enable a higher tension heavy compound catenary
equipment to handle 360 km/h running, we set the following targets
as requirements to improve the current collection performance and,
at the same time, to allow effective work.
1) Approx. 500 km/h1)* wave propagation velocity for the contact
wire
2) No change of the total tension of the overhead contact line
system to avoid modification of support components
3) Shortening the work period to 2/3 that of past work
*1) Train speed ≤ wave propagation velocity multiplied by approx. 0.7 or 0.8 is desirable.
In order to achieve 1), we made the diameter of the contact
wire thinner (lighter in weight), from 170 mm2 to 110 mm2, and
increased the tension from 17.6 kN to 19.6 kN.
Regarding 2), to maintain 53.9 kN total tension of the overhead
contact line system, the total tension of the messenger wire and the
auxiliary messenger wire needed to be decreased. As for the CS system,
we decided to decrease the tension of the auxiliary messenger wire
while keeping the tension of the messenger wire the same; but that
could result in insufficient wave propagation velocity of the auxiliary
messenger wire.
And, since we kept the tension of the messenger wire as-is in spite of
the lighter contact wire, we had to replace all droppers to maintain the
height of the contact wire. That work took a lot of time and manpower.
Accordingly, we tested a method of reducing the tension of the
messenger wire according to the reduced tension of the messenger wire,
to eliminate the replacement work of droppers. Also, we added that
reduced weight of the contact wire to the auxiliary messenger wire to
improve the wave propagation velocity up to the test speed (360 km/h)
with an aim of improving the current collection performance.
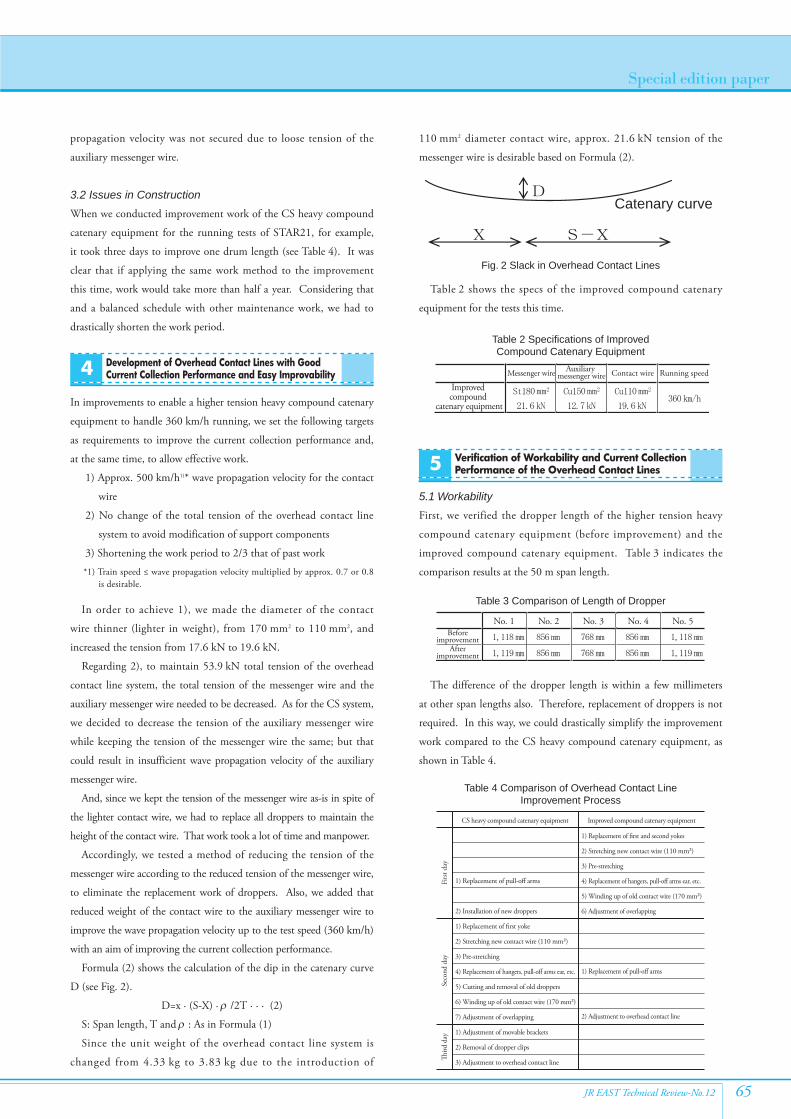
Formula (2) shows the calculation of the dip in the catenary curve
D (see Fig. 2).
D=x · (S-X) · r /2T · · · (2)
S: Span length, T and r : As in Formula (1)
Since the unit weight of the overhead contact line system is
changed from 4.33 kg to 3.83 kg due to the introduction of
110 mm2 diameter contact wire, approx. 21.6 kN tension of the
messenger wire is desirable based on Formula (2).
Table 2 shows the specs of the improved compound catenary
equipment for the tests this time.
5.1 Workability
First, we verified the dropper length of the higher tension heavy
compound catenary equipment (before improvement) and the
improved compound catenary equipment. Table 3 indicates the
comparison results at the 50 m span length.
The difference of the dropper length is within a few millimeters
at other span lengths also. Therefore, replacement of droppers is not
required. In this way, we could drastically simplify the improvement
work compared to the CS heavy compound catenary equipment, as
shown in Table 4.
Development of Overhead Contact Lines with Good Current Collection Performance and Easy Improvability4
Verification of Workability and Current Collection Performance of the Overhead Contact Lines5
Catenary curve
Fig. 2 Slack in Overhead Contact Lines
Messenger wire Auxiliary messenger wire Contact wire Running speed
Improved compound
catenary equipment
Table 2 Specifications of Improved Compound Catenary Equipment
No. 1 No. 2 No. 3 No. 4 No. 5Before
improvementAfter
improvement
Table 3 Comparison of Length of Dropper
CS heavy compound catenary equipment
Firs
t day
Seco
nd d
ayTh
ird d
ay
Improved compound catenary equipment
1) Replacement of pull-off arms
2) Installation of new droppers
1) Replacement of first yoke
2) Stretching new contact wire (110 mm²)
3) Pre-stretching
4) Replacement of hangers, pull-off arms ear, etc.
5) Cutting and removal of old droppers
6) Winding up of old contact wire (170 mm²)
7) Adjustment of overlapping
1) Adjustment of movable brackets
2) Removal of dropper clips
3) Adjustment to overhead contact line
1) Replacement of first and second yokes
2) Stretching new contact wire (110 mm²)
3) Pre-stretching
4) Replacement of hangers, pull-off arms ear, etc.
5) Winding up of old contact wire (170 mm²)
6) Adjustment of overlapping
1) Replacement of pull-off arms
2) Adjustment to overhead contact line
Table 4 Comparison of Overhead Contact Line Improvement Process

Special edition paper
JR EAST Technical Review-No.1266
As shown in the above table, we could shorten the improvement
work time of almost three days to two days. For the change of the
tension of the messenger wire (replacement of anchor yokes), one
of our partner companies developed a special jig to shorten the
work time.
The comparison of before and after the improvement work using
the data of an electric and track inspection car proved that the
status before the improvement such as the height and deviation of
the overhead contact lines could be duplicated well; and almost no
adjustment after the work was needed.
5.2 Current Collection Performance
In addition to shortening the work period, we aimed at reducing the
stress of the contact wire by increasing the tension of the auxiliary
catenary wire, and examined that effect by simulation. Fig. 3 and 4
show part of the simulation results.
The simulations showed that the maximum uplift of the contact
wire considerably decreased from 70 mm to 35 mm just as the
contact force decreased as shown in Fig. 3. That suggests that the
fatigue (stress) of the contact wire could be eased.
The contact loss ratio, which increased as shown in Fig. 4, could
be kept within the allowable range of 30%. Since it has been
confirmed that multi-fractioned contact strips with less weight of
movable parts significantly reduces contact loss, we expect that the
actual contact loss ratio can be reduced to only a few percent.
6.1 Change of the Height of the Overhead Contact Lines
After starting the tests, we could observe favorable current collection
including better contact loss ratio than expected; but as the running
speed increased, we suddenly faced an event where many contact loss
cases occurred in a certain section (drum). Fig. 6 shows the event.
As we tried running with only one pantograph that was considered
difficult, reduction of contact loss was an issue to be overcome.
We found a large contact loss that occurred in every supporting
point as a characteristic of the section with many contact losses. So,
assuming that the contact loss occurred due to the change of the
height of the overhead contact lines between the supporting points,
we compared the change of that height and the contact loss ratio
between drums2)* (see Fig. 7).
*2: The unit length between anchors of the line is called a drum.
Checking the height chart of the contact wire taken by an
inspection car, we found that the deviation was caused by pre-sagging
of the contact wire (see Fig. 8).
Since the simulation also confirmed that approx. 30 mm pre-
sagging caused significant increase of contact losses in the 360 km/h
speed range, we immediately added work to eliminate pre-sagging3)*.
*3) Pre-sagging: Giving sag to overhead contact lines taking in account uplifting by pantographs.
Obstructions to Stable Current Collection6
Velocity (km/h)
Con
tact
forc
e (N
)
Test sample pantograph: PS207(one pantograph, in the running direction)
Ax: Auxiliary catenary wire
PMAX: Maximum contact force
PDIV: Deviation of contact force
Fig. 3 Simulation Results of Contact Force
PS207 pantographPS207 pantograph
not collecting current
Fig. 5 Train Set in Speed Increase Tests
Con
tact
loss
rat
io (
%)
Fig. 6 Measurement Results of Contact Loss Ratioin 360 km/h Speed Range
Con
tact
loss
rat
io (
%)
Standard deviation of height (mm)
345 km/h (July 9)
355 km/h (July 12)
375 km/h (July 23)
Fig. 7 Relationship between Standard Deviation of Height of Contact Wire and Contact Loss Ratio
Deviation ofcontact wire
Overlap
Height ofcontact wire
20 - 30mm pre-sagging with every span
377D20.7%
279Dless than 5%
Fig. 8 Abstract of Contact Wire Height Chart by Inspection Car
Test sample pantograph: PS207(one pantograph, in the running direction)
Velocity (km/h)
Contact loss ratio, Ax = 1 t
Contact loss ratio, Ax = 1.3 t
Con
tact
loss
rat
io (
%)
Fig. 4 Simulation Results of Contact Loss Ratio

Special edition paper
JR EAST Technical Review-No.12 67
In the test with those train sets, we observed interesting results
regarding contact loss.
Fig. 11 shows that while the contact loss ratio in the 360 km/h
speed range on the outbound line was in some sections in excess of
the 10% that is considered good due to bad overlap configuration
etc, that was mostly by just a few percent; and the duration of
contact loss was shorter than a few tens of milliseconds, the standard
of the good contact loss ratio. On the other hand, on the inbound
line, the duration of contact loss was less than 100 ms, but the
contact loss ratio reached nearly 30%, the worst acceptable standard.
We considered that the cause of the difference between the
outbound and inbound lines was the difference of the interval of
pantographs; so, we carried out a study for improvement.
As shown in Fig. 12, the simulation clarified that rear pantographs
only contacted the contact wire weakly at a 138 m interval; so, those
easily lost contact at speeds over 275 km/h.
Accordingly, we changed the intervals of current collecting
pantographs as shown in Fig. 13 to test the effect of the intervals.
*Car No. 7 pantograph – Car No. 15 pantograph: 138 m
(usual interval on inbound line)
*Car No. 7 pantograph – Car No. 12 pantograph: 91 m
(the shortest interval)
*Car No. 2 pantograph – Car No. 12 pantograph: 198 m
(usual interval on outbound line)
*Car No. 2 pantograph – Car No. 15 pantograph: 246 m
(the longest interval)
The contact loss ratio per interval is as shown in Fig. 14. In the
tests, the running speed was 275 km/h and the results shown are the
Replacing pantographs4)* significantly improved contact losses
too and almost no contact losses occurred after the pre-sagging
elimination work as shown in Fig. 9. We could thus confirm the
effect of those countermeasures.
*4) We replaced pantographs with the low-noise ones that have single arms and higher compliance characteristics from multi-fractioned contact strips.
Pre-sagging had been originally taken to improve current
collection performance; but we found that it is better to keep the
height of the overhead contact lines the same as much as possible in
the high speed range over 300 km/h.
6.2 Pantograph Interval and Dynamic Characteristics
Since our actual trains with the highest speed are coupled Shinkansen-
exclusive cars and cars for through service on conventional and
Shinkansen lines, we carried out the tests using a coupled train of
two train sets.
Fig. 10 briefly illustrates the tested train sets. Pantographs are the
above-mentioned low-noise type.
Tokyo
Tokyo
Morioka
Outbound
Inbound
Morioka
Fig. 10 Test Train Set
Velocity [km/h]
Con
tact
loss
[%]
Front pantoRear panto
Fig. 12 Simulation Results of Contact Loss Ratioat 138 m Interval
Tokyo Morioka
Fig. 13 Difference in Intervals According to Change ofCurrent Collecting Pantographs
Contact wire drum
Con
tact
loss
rat
ioC
onta
ct lo
ss r
atio
Contact wire drum
Fig. 11 Measurement Results of Contact Loss Ratio(Upper: Outbound line, Bottom: Inbound line)
Drum
Before improvementAfter improvement
Con
tact
loss
rat
io (
%)
Fig. 9 Measurement Results of Contact Loss Ratio Before and After Elimination of Pre-Sagging

Special edition paper
JR EAST Technical Review-No.1268
Fig. 16 shows the test results of the contact loss ratio with the
increased uplifting force.
We could mostly reduce the contact loss ratio to less than 10% as
expected from the simulation results. Comparing that to the results
in Fig. 11, we were able to confirm a large improvement effect.
I have explained up to now about the tests for the compound
catenary equipment. Now I will introduce the tests for the simple
catenary equipment used in the projected Shinkansen line section.
Comparing simple catenary equipment and compound catenary
equipment, change of the spring constant within a span (rate of
uplifting force of a pantograph to the uplift of a contact line) is larger
in a simple system. Furthermore, simple catenary equipment has a
unique structural characteristic where large vibration remains after
passing of a pantograph. In this context, we were concerned with
deterioration of current collection performance of simple catenary
equipment.
In order to equalize the spring constant to reduce residual
vibration, it could be effective to insert spring hangers that have
attenuation performance (hereafter “damper hangers”).
Fig. 17 shows an example of calculation for a 50 m span. The
figure shows that the values of hangers near supporting points (2.5 m
and 7.5 m from the supporting point) are remarkably large; so, the
spring constant within a span can be equalized by inserting damper
hangers there.
We thus introduced damper hangers to a section between the
Iwate Ichinohe tunnel and the Ninohe station to check the effect.
results of the rear pantographs.
The order of better results is
91 m ≥ 198 m > 246 m > 138 m.
The order clarifies that the contact loss ratio is affected by wave
propagation and reflection too; so, longer pantograph intervals are
not always better.
Looking at the characteristics of pantographs in each pattern,
rear pantographs are positioned in the running direction at 246 m
and 138 m intervals, while those are positioned on the opposite
direction5)* at 91 m and 198 m intervals. In this context, we
can estimate that contact loss is affected not only by pantograph
intervals, but also by the characteristics of pantographs including
differences in aerodynamic characteristics based on the direction.
*5: The > direction to the ← running direction.
Since pantographs in the running direction cannot generate
sufficient lifting force and the insufficient contact to the contact
wire could cause much contact loss, we carried out the test while
increasing stationary uplifting force of rear pantographs.
As the simulation results in Fig. 15 show, we expect that contact
loss ratio can be improved to approx. 10%—the standard good ratio
—with 138 m pantograph intervals by increasing the stationary
uplifting force from 54 N to 74 N.
Comparison by pantograph intervals (running at 275 km/h)
Drum No.
138 m (initial pantograph interval)
246 m (increased interval)
198 m (decreased interval)91 m (shortest interval)
Con
tact
loss
rat
io (
%)
Fig. 14 Change of Contact Loss Ratio According to Differencein Pantograph Interval
Velocity [km/h]
Con
tact
loss
[%]
Front pantoRear panto
Fig. 15 Simulation Results with Increased Stationary Uplifting Force
Distance [m]
Usual hanger
Damper hanger
Supporting point Supporting point
Spr
ing
cons
tant
[kN
/m]
Fig. 17 Distribution of Spring Constant within a Span (Example of Simple Catenary Equipment for
Projected Shinkansen)
Velocity (km/h)
Damper hanger
Usual hanger
Con
tact
wire
upl
ift (
mm
)
Fig. 18 Uplift of Contact Wire (in Open Section)
Drum No.
Con
tact
loss
rat
io After improvement
Fig. 16 Improvement of Contact Loss Ratioby Increasing Stationary Uplifting Force
High Speed Suitability of High-Speed Simple Catenary Equipment7

Special edition paper
JR EAST Technical Review-No.12 69
speed. That might lead to smaller allowable wear, and we are thus
concerned about a shorter lifespan.
On the other hand, the number of pantographs that slide
on the contact wire will be reduced (for example, the number
of pantographs of Hayate-Komachi type Shinkansen will be
reduced from four to two because single train set will use only one
pantograph); so, we can expect longer lifespan.
For the time being, we will be watching the results of those
conflicting effects.
8.2 New Equipment Diagnosis Method
Recent advances in optical sensing technology have enabled
easier measurement at points where high voltage is applied, and a
measurement method of the contact force of pantographs to the
contact wire is even allowing for multi-fractioned contact strips to be
established.
If we can identify the contact force of pantographs, we can expect
the following new equipment diagnosis methods to be established.
· Continuous measurement of the stress on the contact wire that
we can now measure only at fixed points
· Daytime measurement of contact loss that we can now measure
only at night or in tunnels
· Detection of improper equipment structure such as bad overlap
configuration
· Estimation of progress of wear of contact wire
We have repeated running tests for almost three years since 2005.
The test results are being applied to the coming increase of operation
speed to 320 km/h, and the equipment and facilities are being
improved right now.
Based on the tests, we gained a perspective on stably supplying
power in the 360 km/h speed range. I hope this paper will pass down
valuable data to future railways in the process of increasing speeds.
Fig. 18 and 19 respectively show examples of the observed results
of the uplift of the contact wire and the strain.
As shown in Fig. 17, the results with damper hangers recorded
larger values for the uplift of the contact wire because the spring
constant at the supporting point became smaller. Still, the values
were under the target value of 100 mm.
As for strain, we found no distinct difference between cases with
and without damper hangers. Although larger uplift usually results
in larger bending stress (strain), elasticity of springs probably brought
about that effect in this case.
But, we have to pay attention to the fact that the strain exceeded
the target value of 500 μ at speeds over 300 km/h.
In order to solve this problem, it would be effective to replace
pull-off arms with lighter ones equivalent to those that have been
deployed to the sections with the compound system and to replace
the contact wire with PHC (Precipitation-Hardened Copper Alloy)
contact wire.
Now, Fig. 20 shows the result of contact loss ratio.
Regardless whether or not damper hangers are used, we could
achieve good contact loss ratio less than a few percent.
Finally, I would like to go over some trends for future maintenance.
8.1 Replacement Period of Contact Wire
Based on the test results of the FASTECH360, we will increase
the tension from 17.6 kN to 19.6 kN while continuing use of
170 mm2 diameter contact wire to achieve 320 km/h operation
Con
tact
loss
rat
io (
%)
Damper hangerDamperhanger
Fig. 20 Contact Loss Ratio
Future Maintenance8
Conclusion9
Velocity (km/h)
Damper hangerUsual hanger
Str
ain
at s
uppo
rtin
g po
int (
µst)
Fig. 19 Strain in Contact Wire (in Open Section)