Embed Size (px)
Citation preview
Chapter 0
Pedestrian Recognition Based on 24GHz RadarSensors
Steffen Heuel and Hermann Rohling
Additional information is available at the end of the chapter
http://dx.doi.org/10.5772/53007
1. Introduction
Radar sensors offer in general the capability to measure extremely accurately target range,radial velocity, and azimuth angle for all objects inside the observation area. These targetparameters can be measured simultaneously even in multiple target situations, which is atechnical challenge for the waveform design and signal processing procedure. Furthermore,radar systems fulfil these requirements in all weather conditions, even in rain and fog, whichis important for all automotive applications, [1], [2]. Advanced driver assistant systems(ADAS) are currently under investigation to increase comfort and safety in general. ForAdaptive Cruise Control (ACC) applications a single 77 GHz radar sensor is used, which hasa maximum range of 200 m and covers a narrow azimuth angle area of 15 degree for example.Many other and additional automotive applications, like Stop & Go, Pre-Crash or ParkingAid, consider a completely different observation area [3]. In this case a maximum range of50 m, but a wide azimuth angle area of 120 degrees is required. For these applications 24 GHzradar sensors are used. Besides the range and velocity parameters, additional informationconcerning the target type are of great interest, as one of the main objectives of future safetysystems will be the increased protection of all pedestrians and other vulnerable road users.
By extending the radar signal processing part of a 24 GHz radar sensor with a pedestrianrecognition scheme, the same radar sensor which is used for the mentioned applications canbe applied additionally for pedestrian recognition and allows the design of pedestrian safetysystems. Therefore, the radar signal processing part has to be adapted to the assumption ofextended targets with a characteristic range profile and a velocity profile (e.g. based on theDoppler Spectrum) in general [4]. The detailed analysis of the resulting range profile andtarget’s velocities is possible and can be used to recognize pedestrians in urban areas withconventional 24 GHz radar sensors.
2. Radar sensor and measurements
Several proposals for pedestrian recognition schemes have been described, which are basedon video cameras and computer vision systems [7], [8]. But automotive radar sensors in the
©2013 Heuel and Rohling, licensee InTech. This is an open access chapter distributed under the terms ofthe Creative Commons Attribution License (http://creativecommons.org/licenses/by/3.0),which permitsunrestricted use, distribution, and reproduction in any medium, provided the original work is properlycited.
Chapter 10
2 Will-be-set-by-IN-TECH
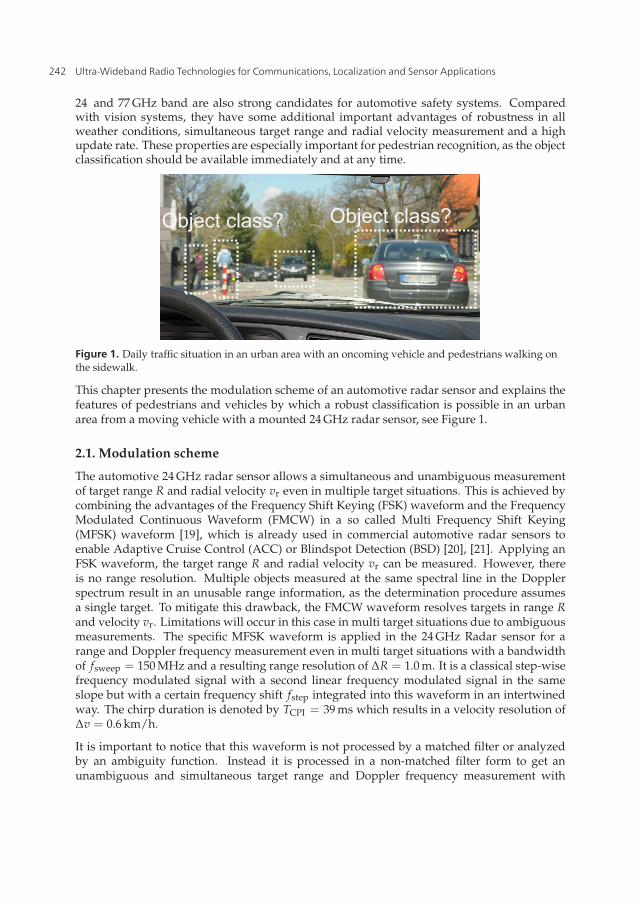
24 and 77 GHz band are also strong candidates for automotive safety systems. Comparedwith vision systems, they have some additional important advantages of robustness in allweather conditions, simultaneous target range and radial velocity measurement and a highupdate rate. These properties are especially important for pedestrian recognition, as the objectclassification should be available immediately and at any time.
Object class?Object class?
Figure 1. Daily traffic situation in an urban area with an oncoming vehicle and pedestrians walking onthe sidewalk.
This chapter presents the modulation scheme of an automotive radar sensor and explains thefeatures of pedestrians and vehicles by which a robust classification is possible in an urbanarea from a moving vehicle with a mounted 24 GHz radar sensor, see Figure 1.
2.1. Modulation scheme
The automotive 24 GHz radar sensor allows a simultaneous and unambiguous measurementof target range R and radial velocity vr even in multiple target situations. This is achieved bycombining the advantages of the Frequency Shift Keying (FSK) waveform and the FrequencyModulated Continuous Waveform (FMCW) in a so called Multi Frequency Shift Keying(MFSK) waveform [19], which is already used in commercial automotive radar sensors toenable Adaptive Cruise Control (ACC) or Blindspot Detection (BSD) [20], [21]. Applying anFSK waveform, the target range R and radial velocity vr can be measured. However, thereis no range resolution. Multiple objects measured at the same spectral line in the Dopplerspectrum result in an unusable range information, as the determination procedure assumesa single target. To mitigate this drawback, the FMCW waveform resolves targets in range Rand velocity vr. Limitations will occur in this case in multi target situations due to ambiguousmeasurements. The specific MFSK waveform is applied in the 24 GHz Radar sensor for arange and Doppler frequency measurement even in multi target situations with a bandwidthof fsweep = 150 MHz and a resulting range resolution of ΔR = 1.0 m. It is a classical step-wisefrequency modulated signal with a second linear frequency modulated signal in the sameslope but with a certain frequency shift fstep integrated into this waveform in an intertwinedway. The chirp duration is denoted by TCPI = 39 ms which results in a velocity resolution ofΔv = 0.6 km/h.
It is important to notice that this waveform is not processed by a matched filter or analyzedby an ambiguity function. Instead it is processed in a non-matched filter form to get anunambiguous and simultaneous target range and Doppler frequency measurement with
242 Ultra-Wideband Radio Technologies for Communications, Localization and Sensor Applications
Pedestrian Recognition Based on 24 GHz Radar Sensors 3
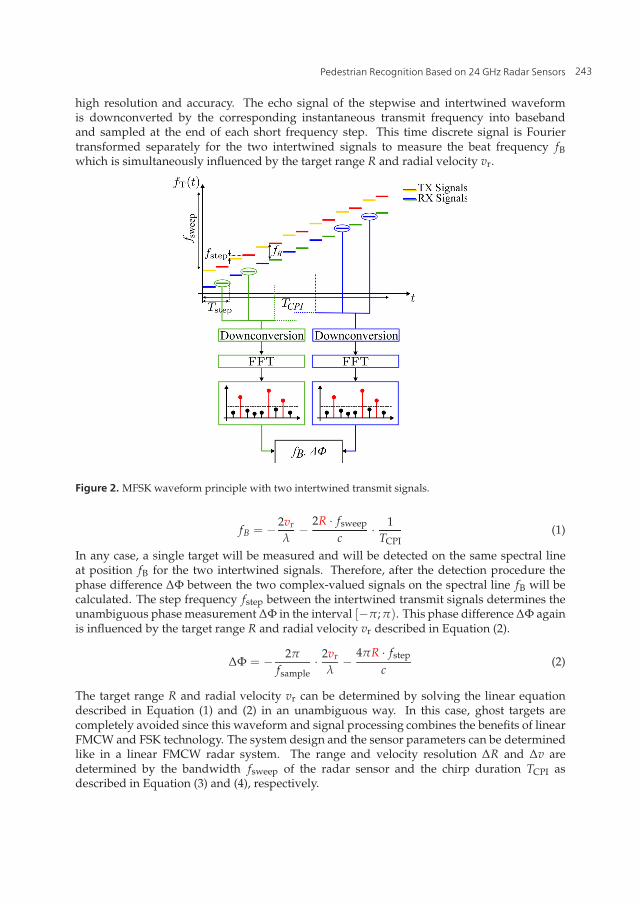
high resolution and accuracy. The echo signal of the stepwise and intertwined waveformis downconverted by the corresponding instantaneous transmit frequency into basebandand sampled at the end of each short frequency step. This time discrete signal is Fouriertransformed separately for the two intertwined signals to measure the beat frequency fBwhich is simultaneously influenced by the target range R and radial velocity vr.
Figure 2. MFSK waveform principle with two intertwined transmit signals.
fB = − 2vr
λ− 2R · fsweep
c· 1
TCPI(1)
In any case, a single target will be measured and will be detected on the same spectral lineat position fB for the two intertwined signals. Therefore, after the detection procedure thephase difference ΔΦ between the two complex-valued signals on the spectral line fB will becalculated. The step frequency fstep between the intertwined transmit signals determines theunambiguous phase measurement ΔΦ in the interval [−π; π). This phase difference ΔΦ againis influenced by the target range R and radial velocity vr described in Equation (2).
ΔΦ = − 2π
fsample· 2vr
λ− 4πR · fstep
c(2)
The target range R and radial velocity vr can be determined by solving the linear equationdescribed in Equation (1) and (2) in an unambiguous way. In this case, ghost targets arecompletely avoided since this waveform and signal processing combines the benefits of linearFMCW and FSK technology. The system design and the sensor parameters can be determinedlike in a linear FMCW radar system. The range and velocity resolution ΔR and Δv aredetermined by the bandwidth fsweep of the radar sensor and the chirp duration TCPI asdescribed in Equation (3) and (4), respectively.
243Pedestrian Recognition Based on 24 GHz Radar Sensors
4 Will-be-set-by-IN-TECH
ΔR =c2· 1
fsweep(3)
Δv = −λ
2· 1
TCPI(4)
The table below shows the system parameters of the automotive radar sensor in detail.
Carrier Frequency fT = 24 GHzSweep Bandwdith fsweep = 150 MHzMaximum Range Rmax = 200 mRange Resolution ΔR = 1 mChirp Length TCPI = 39 msMaximum Velocity vmax = 250 km/h
Velocity Resolution Δv = 0.6 km/h
Table 1. 24 GHz Radar Sensor Parameters.
Classical UWB-Radar Sensors have a sweep bandwidth of fsweep = 2 GHz. Usingsuch a bandwidth, a high range resolution is determined, which allows also pedestrianclassification. The technical challenge in this chapter is to realize pedestrian recognitionbased on a 24 GHz radar sensor with a bandwidth of only 150 MHz. This sensor is used inautomotive applications, therefore an extension of the signal processing in terms of pedestrianclassification is desirable.
2.2. Radar echo signal measurements
The possibility to recognize pedestrians with a static radar sensor using the Doppler effect hasbeen shown in [15]. A moving vehicle is equipped with an automotive radar sensor with abuilt-in feature extraction and classification to recognize pedestrians. The feature extractionin the backscattered radar echo signals resulting from superposition of the reflection pointsof an object is done automatically in the radar sensor signal processing. Detected targets aretherefore tracked in the environment and an additional feature extraction and classification isperformed.
To distinguish between the echo signal characteristics of pedestrians and vehicles, a targetrecognition model is described which is based on the specific velocity profile and rangeprofile for each object separately [4]. The velocity profile describes the extension of thedifferent velocities of an object measured by the radar sensor, while the range profile showsthe physical expansion of a target.
In case of a longitudinally moving pedestrian, different reflection points at the trunk, armsand legs with different velocities are characteristic in radar propagation. Therefore an extendedvelocity profile will be observed in a single radar measurement of a pedestrian as the velocityresolution Δv of the radar sensor is higher than the occuring velocities. Carrying out severalmeasurements with a time duration of 39 ms each, a sinusoidal spreading and contractionof the velocity profile can be observed in the case of a pedestrian, due to the movement ofarms and legs for example in the swing and stand-phase of the legs. For a laterally moving
244 Ultra-Wideband Radio Technologies for Communications, Localization and Sensor Applications
Pedestrian Recognition Based on 24 GHz Radar Sensors 5
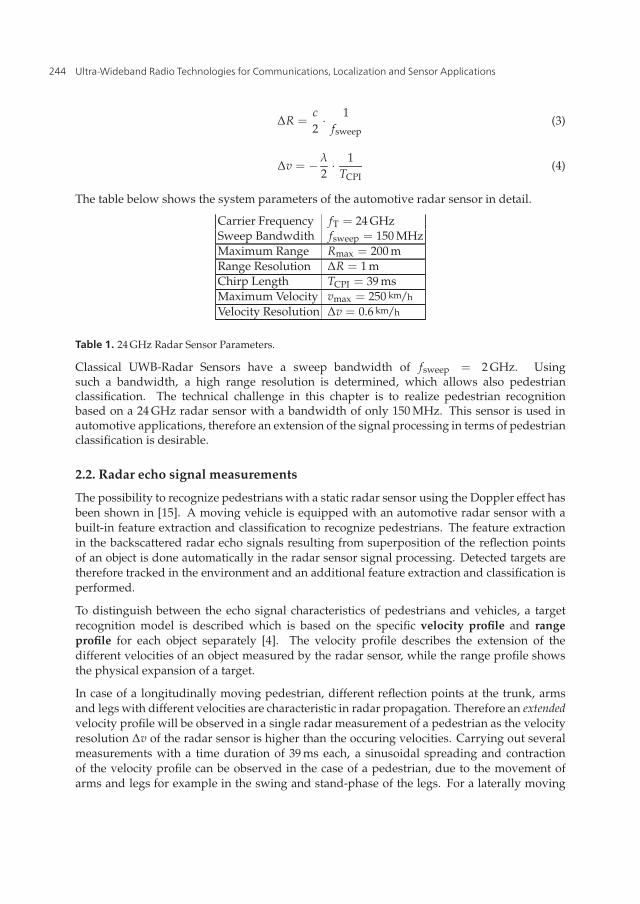
pedestrian, the velocity profile is less extended due to the moving direction of the pedestrian.Furthermore, the extension depends mainly on the azimuth angle under which the pedestrianis measured. In contrast, the radar echo signal in case of a vehicle shows a very narrow (pointshaped) velocity profile due to a uniform motion.
Additionally, a point shaped range profile will occur in the case of a longitudinally or laterallymoving pedestrian as the physical expansion is small compared to the range resolution ofΔR = 1.0 m. In contrast, a vehicle shows an extended range profile, due to several reflectionpoints spaced in several range cells. The measurement result of a single observation is shownin the range Doppler diagram in Figure 4.
0 4 8 1212
16
20
24
Ran
ge [m
]
Velocity [m/s]
v
Rprofile,veh
v
Rprofile,ped
profile,ped
profile,veh
Figure 3. Range profile and velocity profile of a single measurement.
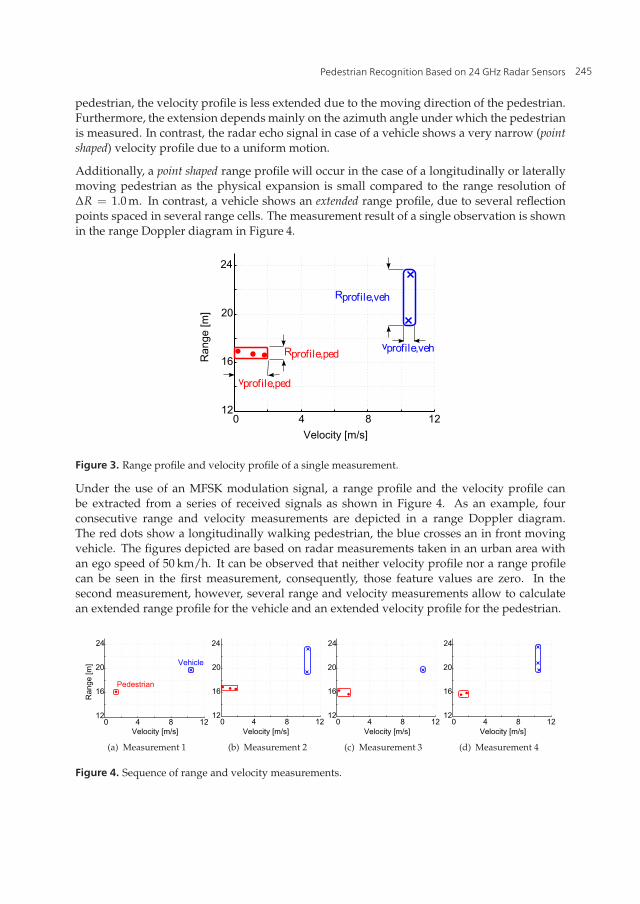
Under the use of an MFSK modulation signal, a range profile and the velocity profile canbe extracted from a series of received signals as shown in Figure 4. As an example, fourconsecutive range and velocity measurements are depicted in a range Doppler diagram.The red dots show a longitudinally walking pedestrian, the blue crosses an in front movingvehicle. The figures depicted are based on radar measurements taken in an urban area withan ego speed of 50 km/h. It can be observed that neither velocity profile nor a range profilecan be seen in the first measurement, consequently, those feature values are zero. In thesecond measurement, however, several range and velocity measurements allow to calculatean extended range profile for the vehicle and an extended velocity profile for the pedestrian.
(a) Measurement 1 (b) Measurement 2 (c) Measurement 3 (d) Measurement 4
Figure 4. Sequence of range and velocity measurements.
245Pedestrian Recognition Based on 24 GHz Radar Sensors
6 Will-be-set-by-IN-TECH
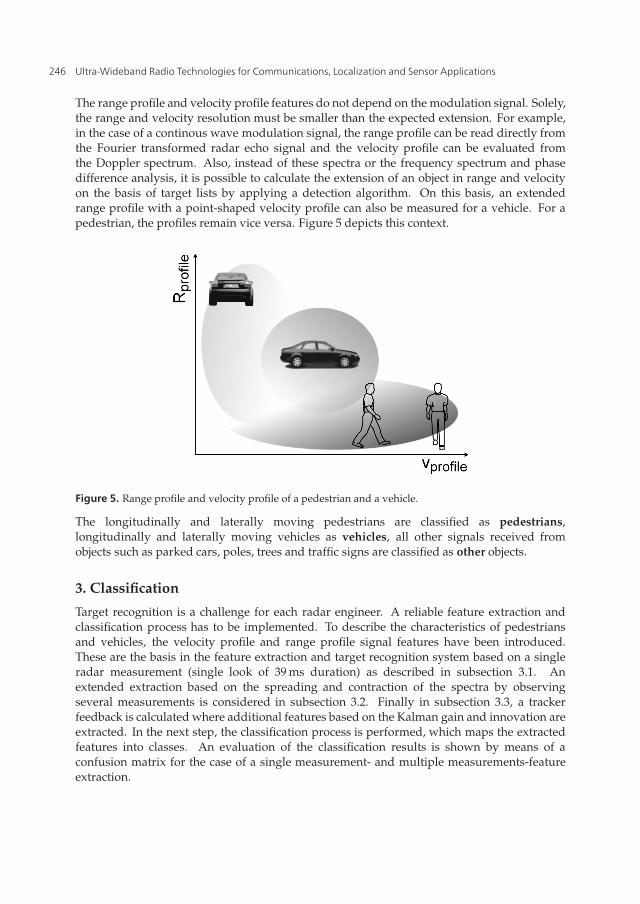
The range profile and velocity profile features do not depend on the modulation signal. Solely,the range and velocity resolution must be smaller than the expected extension. For example,in the case of a continous wave modulation signal, the range profile can be read directly fromthe Fourier transformed radar echo signal and the velocity profile can be evaluated fromthe Doppler spectrum. Also, instead of these spectra or the frequency spectrum and phasedifference analysis, it is possible to calculate the extension of an object in range and velocityon the basis of target lists by applying a detection algorithm. On this basis, an extendedrange profile with a point-shaped velocity profile can also be measured for a vehicle. For apedestrian, the profiles remain vice versa. Figure 5 depicts this context.
Figure 5. Range profile and velocity profile of a pedestrian and a vehicle.
The longitudinally and laterally moving pedestrians are classified as pedestrians,longitudinally and laterally moving vehicles as vehicles, all other signals received fromobjects such as parked cars, poles, trees and traffic signs are classified as other objects.
3. Classification
Target recognition is a challenge for each radar engineer. A reliable feature extraction andclassification process has to be implemented. To describe the characteristics of pedestriansand vehicles, the velocity profile and range profile signal features have been introduced.These are the basis in the feature extraction and target recognition system based on a singleradar measurement (single look of 39 ms duration) as described in subsection 3.1. Anextended extraction based on the spreading and contraction of the spectra by observingseveral measurements is considered in subsection 3.2. Finally in subsection 3.3, a trackerfeedback is calculated where additional features based on the Kalman gain and innovation areextracted. In the next step, the classification process is performed, which maps the extractedfeatures into classes. An evaluation of the classification results is shown by means of aconfusion matrix for the case of a single measurement- and multiple measurements-featureextraction.
246 Ultra-Wideband Radio Technologies for Communications, Localization and Sensor Applications
Pedestrian Recognition Based on 24 GHz Radar Sensors 7
3.1. Classification based on a single radar measurement
Radar sensors provide continuously available measurement results in an interval of a fewmilliseconds. This interval is determined by the duration of the transmission signal TCPI =39 ms in which a single MFSK signal is transmitted. The echo signal is downconverted andFourier-transformed, which allows the described features to be extracted continuously. Ratherthan examinating a received sequence of radar echoes, this subchapter will initially focus ona single radar measurement of TCPI = 39 ms.
3.1.1. Feature extraction
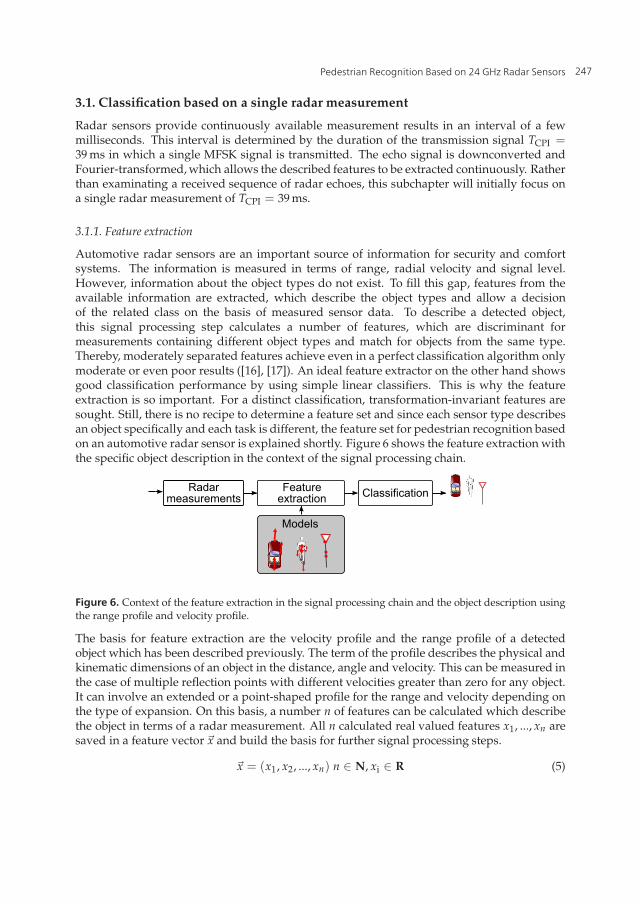
Automotive radar sensors are an important source of information for security and comfortsystems. The information is measured in terms of range, radial velocity and signal level.However, information about the object types do not exist. To fill this gap, features from theavailable information are extracted, which describe the object types and allow a decisionof the related class on the basis of measured sensor data. To describe a detected object,this signal processing step calculates a number of features, which are discriminant formeasurements containing different object types and match for objects from the same type.Thereby, moderately separated features achieve even in a perfect classification algorithm onlymoderate or even poor results ([16], [17]). An ideal feature extractor on the other hand showsgood classification performance by using simple linear classifiers. This is why the featureextraction is so important. For a distinct classification, transformation-invariant features aresought. Still, there is no recipe to determine a feature set and since each sensor type describesan object specifically and each task is different, the feature set for pedestrian recognition basedon an automotive radar sensor is explained shortly. Figure 6 shows the feature extraction withthe specific object description in the context of the signal processing chain.
Radar measurements
Featureextraction Classification
Models
Figure 6. Context of the feature extraction in the signal processing chain and the object description usingthe range profile and velocity profile.
The basis for feature extraction are the velocity profile and the range profile of a detectedobject which has been described previously. The term of the profile describes the physical andkinematic dimensions of an object in the distance, angle and velocity. This can be measured inthe case of multiple reflection points with different velocities greater than zero for any object.It can involve an extended or a point-shaped profile for the range and velocity depending onthe type of expansion. On this basis, a number n of features can be calculated which describethe object in terms of a radar measurement. All n calculated real valued features x1, ..., xn aresaved in a feature vector �x and build the basis for further signal processing steps.
�x = (x1, x2, ..., xn) n ∈ N, xi ∈ R (5)
247Pedestrian Recognition Based on 24 GHz Radar Sensors
8 Will-be-set-by-IN-TECH
Exemplarily, the calculation of the range profile Rprofile is given in Equation (6). Analogously,the velocity profile vprofile of the spectrum can be calculated, Equation (7).
x1 = Rprofile = Rmax − Rmin (6)
x5 = vprofile = vmax − vmin (7)
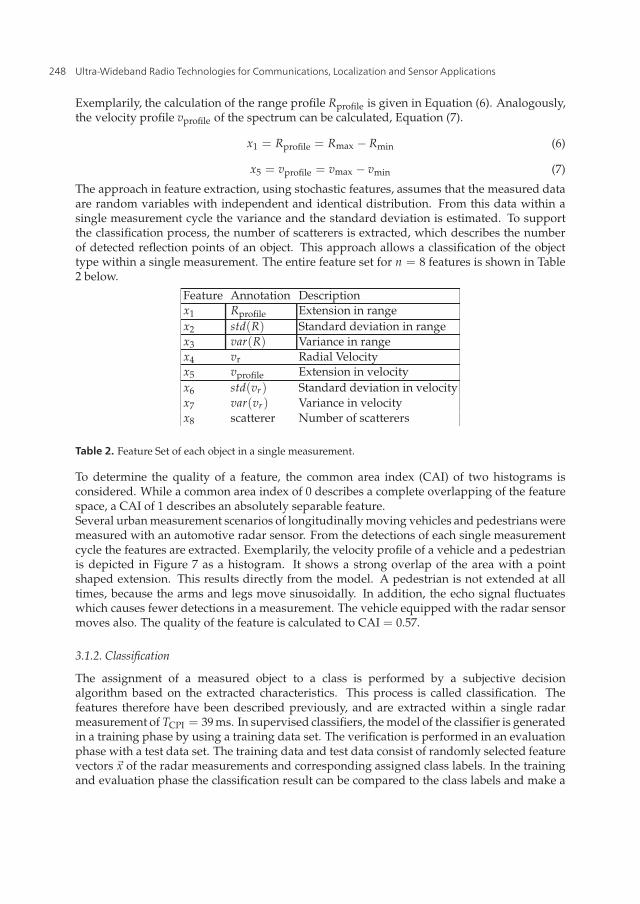
The approach in feature extraction, using stochastic features, assumes that the measured dataare random variables with independent and identical distribution. From this data within asingle measurement cycle the variance and the standard deviation is estimated. To supportthe classification process, the number of scatterers is extracted, which describes the numberof detected reflection points of an object. This approach allows a classification of the objecttype within a single measurement. The entire feature set for n = 8 features is shown in Table2 below.
Feature Annotation Descriptionx1 Rprofile Extension in rangex2 std(R) Standard deviation in rangex3 var(R) Variance in rangex4 vr Radial Velocityx5 vprofile Extension in velocityx6 std(vr) Standard deviation in velocityx7 var(vr) Variance in velocityx8 scatterer Number of scatterers
Table 2. Feature Set of each object in a single measurement.
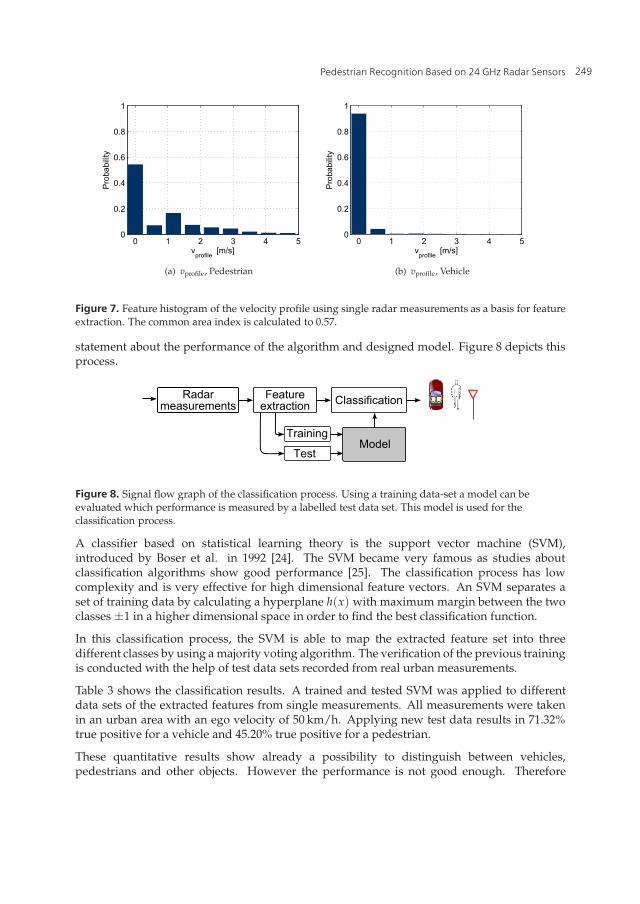
To determine the quality of a feature, the common area index (CAI) of two histograms isconsidered. While a common area index of 0 describes a complete overlapping of the featurespace, a CAI of 1 describes an absolutely separable feature.Several urban measurement scenarios of longitudinally moving vehicles and pedestrians weremeasured with an automotive radar sensor. From the detections of each single measurementcycle the features are extracted. Exemplarily, the velocity profile of a vehicle and a pedestrianis depicted in Figure 7 as a histogram. It shows a strong overlap of the area with a pointshaped extension. This results directly from the model. A pedestrian is not extended at alltimes, because the arms and legs move sinusoidally. In addition, the echo signal fluctuateswhich causes fewer detections in a measurement. The vehicle equipped with the radar sensormoves also. The quality of the feature is calculated to CAI = 0.57.
3.1.2. Classification
The assignment of a measured object to a class is performed by a subjective decisionalgorithm based on the extracted characteristics. This process is called classification. Thefeatures therefore have been described previously, and are extracted within a single radarmeasurement of TCPI = 39 ms. In supervised classifiers, the model of the classifier is generatedin a training phase by using a training data set. The verification is performed in an evaluationphase with a test data set. The training data and test data consist of randomly selected featurevectors �x of the radar measurements and corresponding assigned class labels. In the trainingand evaluation phase the classification result can be compared to the class labels and make a
248 Ultra-Wideband Radio Technologies for Communications, Localization and Sensor Applications
Pedestrian Recognition Based on 24 GHz Radar Sensors 9
0 1 2 3 4 50
0.2
0.4
0.6
0.8
1
vprofile
[m/s]
Probability
(a) vprofile, Pedestrian
0 1 2 3 4 50
0.2
0.4
0.6
0.8
1
vprofile
[m/s]
Probability
(b) vprofile, Vehicle
Figure 7. Feature histogram of the velocity profile using single radar measurements as a basis for featureextraction. The common area index is calculated to 0.57.
statement about the performance of the algorithm and designed model. Figure 8 depicts thisprocess.
Radar measurements
Featureextraction Classification
ModelTraining
Test
Figure 8. Signal flow graph of the classification process. Using a training data-set a model can beevaluated which performance is measured by a labelled test data set. This model is used for theclassification process.
A classifier based on statistical learning theory is the support vector machine (SVM),introduced by Boser et al. in 1992 [24]. The SVM became very famous as studies aboutclassification algorithms show good performance [25]. The classification process has lowcomplexity and is very effective for high dimensional feature vectors. An SVM separates aset of training data by calculating a hyperplane h(x) with maximum margin between the twoclasses ±1 in a higher dimensional space in order to find the best classification function.
In this classification process, the SVM is able to map the extracted feature set into threedifferent classes by using a majority voting algorithm. The verification of the previous trainingis conducted with the help of test data sets recorded from real urban measurements.
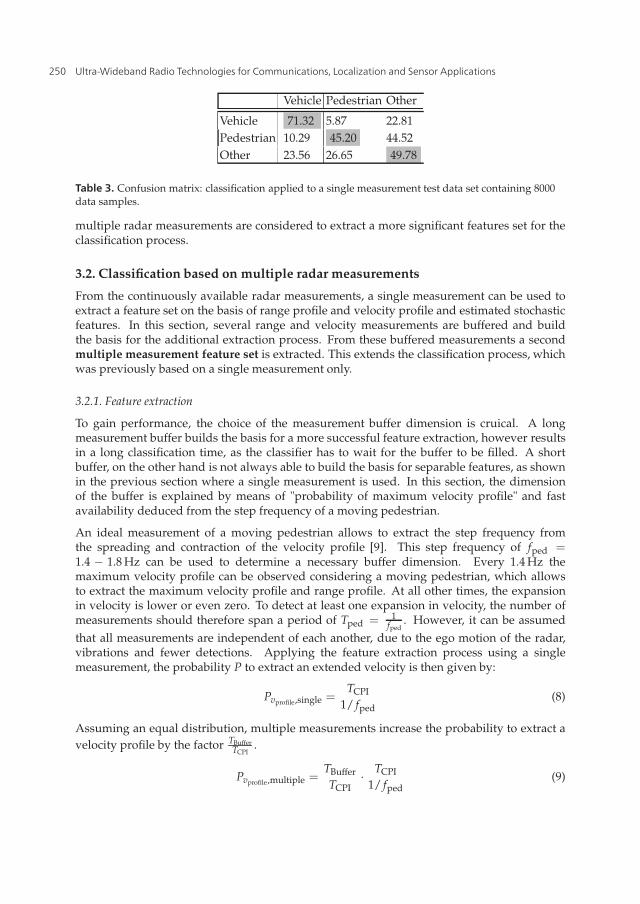
Table 3 shows the classification results. A trained and tested SVM was applied to differentdata sets of the extracted features from single measurements. All measurements were takenin an urban area with an ego velocity of 50 km/h. Applying new test data results in 71.32%true positive for a vehicle and 45.20% true positive for a pedestrian.
These quantitative results show already a possibility to distinguish between vehicles,pedestrians and other objects. However the performance is not good enough. Therefore
249Pedestrian Recognition Based on 24 GHz Radar Sensors
10 Will-be-set-by-IN-TECH
Vehicle Pedestrian Other
Vehicle 71.32 5.87 22.81Pedestrian 10.29 45.20 44.52Other 23.56 26.65 49.78
Table 3. Confusion matrix: classification applied to a single measurement test data set containing 8000data samples.
multiple radar measurements are considered to extract a more significant features set for theclassification process.
3.2. Classification based on multiple radar measurements
From the continuously available radar measurements, a single measurement can be used toextract a feature set on the basis of range profile and velocity profile and estimated stochasticfeatures. In this section, several range and velocity measurements are buffered and buildthe basis for the additional extraction process. From these buffered measurements a secondmultiple measurement feature set is extracted. This extends the classification process, whichwas previously based on a single measurement only.
3.2.1. Feature extraction
To gain performance, the choice of the measurement buffer dimension is cruical. A longmeasurement buffer builds the basis for a more successful feature extraction, however resultsin a long classification time, as the classifier has to wait for the buffer to be filled. A shortbuffer, on the other hand is not always able to build the basis for separable features, as shownin the previous section where a single measurement is used. In this section, the dimensionof the buffer is explained by means of "probability of maximum velocity profile" and fastavailability deduced from the step frequency of a moving pedestrian.
An ideal measurement of a moving pedestrian allows to extract the step frequency fromthe spreading and contraction of the velocity profile [9]. This step frequency of fped =1.4 − 1.8 Hz can be used to determine a necessary buffer dimension. Every 1.4 Hz themaximum velocity profile can be observed considering a moving pedestrian, which allowsto extract the maximum velocity profile and range profile. At all other times, the expansionin velocity is lower or even zero. To detect at least one expansion in velocity, the number ofmeasurements should therefore span a period of Tped = 1
fped. However, it can be assumed
that all measurements are independent of each another, due to the ego motion of the radar,vibrations and fewer detections. Applying the feature extraction process using a singlemeasurement, the probability P to extract an extended velocity is then given by:
Pvprofile,single =TCPI
1/ fped(8)
Assuming an equal distribution, multiple measurements increase the probability to extract avelocity profile by the factor TBuffer
TCPI.
Pvprofile,multiple =TBufferTCPI
· TCPI1/ fped
(9)
250 Ultra-Wideband Radio Technologies for Communications, Localization and Sensor Applications
Pedestrian Recognition Based on 24 GHz Radar Sensors 11
It can be seen that a long measurement buffer increases the probability to detect themaximum velocity profile. But even a smaller velocity profile can be detected and fulfils therequirements. In these measurements, a buffer of TBuffer = 150 ms is applied.
Using current and time delayed range measurements leads to incorrect range profiles, due tothe movement of the objects during the elapsed buffer time. To cope this, the correspondingrange measurements inside the buffer must therefore be predicted in range. Each storedmeasurement is predicted in range by the elapsed time ΔTBuffer and the velocity �v = (vx, vy)
during the measurements to compensate the movement. A new estimated range ̂R = | �R∗| canbe calculated by a cartesian representation using velocity and elapsed time:
�R∗ = �R + ΔTBuffer ·�v with �R = (X, Y) and �v = (vx, vy) (10)
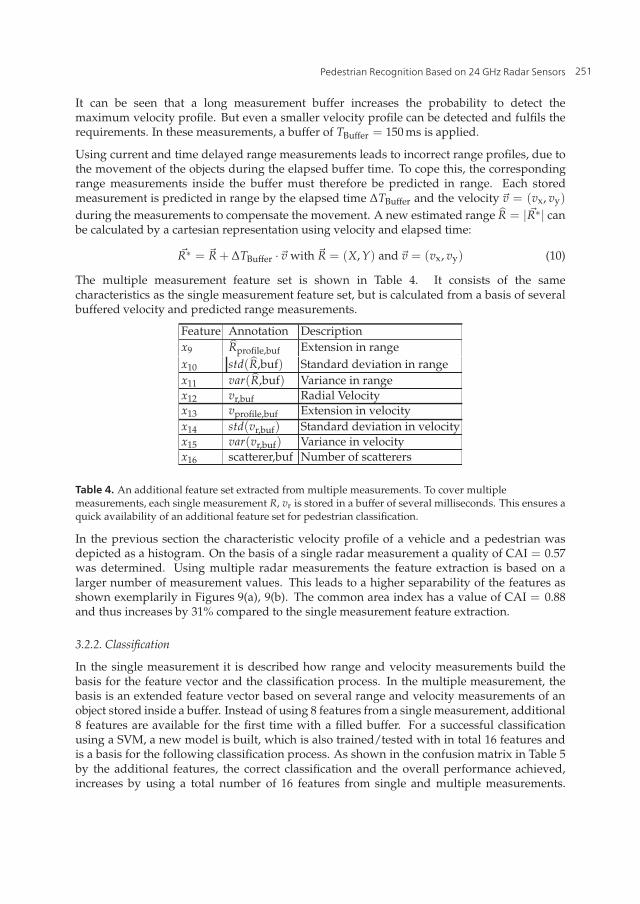
The multiple measurement feature set is shown in Table 4. It consists of the samecharacteristics as the single measurement feature set, but is calculated from a basis of severalbuffered velocity and predicted range measurements.
Feature Annotation Descriptionx9 ̂Rprofile,buf Extension in rangex10 std(̂R,buf) Standard deviation in rangex11 var(̂R,buf) Variance in rangex12 vr,buf Radial Velocityx13 vprofile,buf Extension in velocityx14 std(vr,buf) Standard deviation in velocityx15 var(vr,buf) Variance in velocityx16 scatterer,buf Number of scatterers
Table 4. An additional feature set extracted from multiple measurements. To cover multiplemeasurements, each single measurement R, vr is stored in a buffer of several milliseconds. This ensures aquick availability of an additional feature set for pedestrian classification.
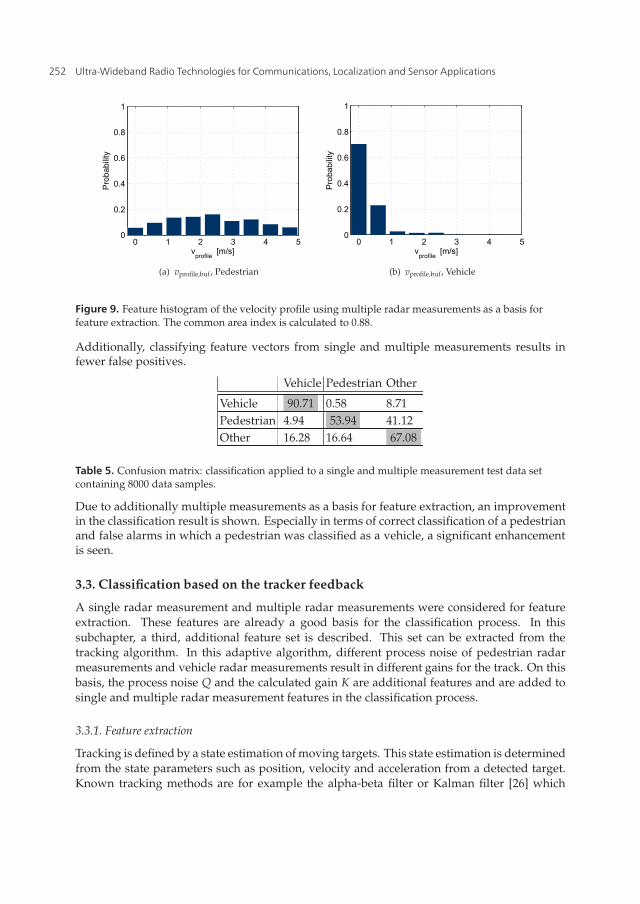
In the previous section the characteristic velocity profile of a vehicle and a pedestrian wasdepicted as a histogram. On the basis of a single radar measurement a quality of CAI = 0.57was determined. Using multiple radar measurements the feature extraction is based on alarger number of measurement values. This leads to a higher separability of the features asshown exemplarily in Figures 9(a), 9(b). The common area index has a value of CAI = 0.88and thus increases by 31% compared to the single measurement feature extraction.
3.2.2. Classification
In the single measurement it is described how range and velocity measurements build thebasis for the feature vector and the classification process. In the multiple measurement, thebasis is an extended feature vector based on several range and velocity measurements of anobject stored inside a buffer. Instead of using 8 features from a single measurement, additional8 features are available for the first time with a filled buffer. For a successful classificationusing a SVM, a new model is built, which is also trained/tested with in total 16 features andis a basis for the following classification process. As shown in the confusion matrix in Table 5by the additional features, the correct classification and the overall performance achieved,increases by using a total number of 16 features from single and multiple measurements.
251Pedestrian Recognition Based on 24 GHz Radar Sensors
12 Will-be-set-by-IN-TECH
0 1 2 3 4 50
0.2
0.4
0.6
0.8
1
vprofile
[m/s]
Probability
(a) vprofile,buf, Pedestrian
0 1 2 3 4 50
0.2
0.4
0.6
0.8
1
vprofile
[m/s]
Probability
(b) vprofile,buf, Vehicle
Figure 9. Feature histogram of the velocity profile using multiple radar measurements as a basis forfeature extraction. The common area index is calculated to 0.88.
Additionally, classifying feature vectors from single and multiple measurements results infewer false positives.
Vehicle Pedestrian Other
Vehicle 90.71 0.58 8.71Pedestrian 4.94 53.94 41.12Other 16.28 16.64 67.08
Table 5. Confusion matrix: classification applied to a single and multiple measurement test data setcontaining 8000 data samples.
Due to additionally multiple measurements as a basis for feature extraction, an improvementin the classification result is shown. Especially in terms of correct classification of a pedestrianand false alarms in which a pedestrian was classified as a vehicle, a significant enhancementis seen.
3.3. Classification based on the tracker feedback
A single radar measurement and multiple radar measurements were considered for featureextraction. These features are already a good basis for the classification process. In thissubchapter, a third, additional feature set is described. This set can be extracted from thetracking algorithm. In this adaptive algorithm, different process noise of pedestrian radarmeasurements and vehicle radar measurements result in different gains for the track. On thisbasis, the process noise Q and the calculated gain K are additional features and are added tosingle and multiple radar measurement features in the classification process.
3.3.1. Feature extraction
Tracking is defined by a state estimation of moving targets. This state estimation is determinedfrom the state parameters such as position, velocity and acceleration from a detected target.Known tracking methods are for example the alpha-beta filter or Kalman filter [26] which
252 Ultra-Wideband Radio Technologies for Communications, Localization and Sensor Applications
Pedestrian Recognition Based on 24 GHz Radar Sensors 13
estimate a new state using a well-known prior state (e.g. position, velocity, acceleration). Thisreduces false alarms and smoothes movements of the objects.
The Kalman filter is a linear, recursive filter, whose goal is to determine an optimal estimateof the state parameters. The optimal estimate is based on available measurements and themodels which describe the observed objects. In the equation of the motion model andobservation model, the measurement noise is assumed to be average free, white Gaussiannoise with the known covariance Qk−1 and Rk respectively. Under the given conditions, i.e.,linear models and Gaussian statistics, the Kalman filter provides the optimal solution for theestimation of the state in the sense of minimizing the mean squared error, as described in [26].
The tracking for the object described by the motion model of the Kalman filter works fineas long as the motion models fit to the object. Pedestrians, vehicles, and static objects havedifferent motion, which makes the tracking more difficult. Instead of creating a differentmotion and observation model for each object, it is proposed to determine the covarianceof process noise Qk and the measurement noise Rk adaptively. The process noise considersa non-modeled behavior in the motion model, while the measurement noise consideresuncertainty in the measurement. The original Kalman filter is not adaptive, which is whydeviations from the model can not be handled. The gain matrix K, which is calculated fromthe process and measurement noise, reaches a stable condition after a short measurement time.An increase in the covariance Qk leads to a larger value for K, so that the measured values areweighted more strongly, a decrease in Qk relies more on the estimation.
In addition to an improved tracking effect, additional features can be extracted from theadaptive adjustment of the process noise, as pedestrian measurements in range and velocitydiffer from those of vehicles. Next to the process noise Qk,v of the velocity, the Kalman gainKv (velocity component of the matrix K) is a good feature as measurements show. Anyhow,in an adaptive adjustment of the process noise, a compromise between the compensation ofnon-modeled movements and the filtering effect to reduce noise must be found, even thoughfeatures are extracted.
The process noise matrix Q describes object-specific measurement properties that are initiallyset and are readjusted during operation of the tracker. For example, the readjustment of asingle coefficient Qk,v in the Q matrix at the measurement k in respect to the velocity v isbased on the actual target range R, the velocity v, the parameters a and b in an alpha-beta filter.Equation (11) shows the relation. The velocity of a pedestrian deviates between consecutivemeasurements, while the velocity deviation of a car within consecutive measurements is smallor even zero. Consequently, the velocity v can be used to update the matrix Q.
Qk,v = (1− β)Qk−1,v + β|zk,v − vk|k−1|
Rk|k · a + b(11)
The predicted covariance matrix Pk|k−1 in the tracking process depends on the motion modelFk−1, the currently measured covariance Pk−1|k−1 and the process noise Qk−1 as shown inEquation (12).
Pk|k−1 = Fk−1Pk−1|k−1FTk−1Qk−1 (12)
253Pedestrian Recognition Based on 24 GHz Radar Sensors
14 Will-be-set-by-IN-TECH
Under the use of this covariance matrix Pk|k−1 and the innovation covariance Sk, the gain Kkcan be calculated.
Kk = Pk|k−1S−1k (13)
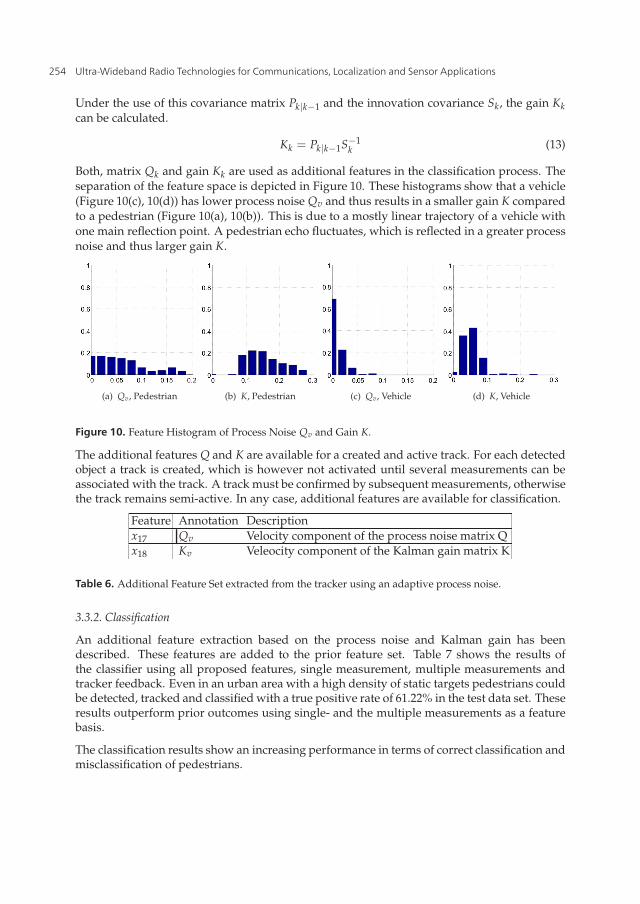
Both, matrix Qk and gain Kk are used as additional features in the classification process. Theseparation of the feature space is depicted in Figure 10. These histograms show that a vehicle(Figure 10(c), 10(d)) has lower process noise Qv and thus results in a smaller gain K comparedto a pedestrian (Figure 10(a), 10(b)). This is due to a mostly linear trajectory of a vehicle withone main reflection point. A pedestrian echo fluctuates, which is reflected in a greater processnoise and thus larger gain K.
(a) Qv, Pedestrian (b) K, Pedestrian (c) Qv, Vehicle (d) K, Vehicle
Figure 10. Feature Histogram of Process Noise Qv and Gain K.
The additional features Q and K are available for a created and active track. For each detectedobject a track is created, which is however not activated until several measurements can beassociated with the track. A track must be confirmed by subsequent measurements, otherwisethe track remains semi-active. In any case, additional features are available for classification.
Feature Annotation Descriptionx17 Qv Velocity component of the process noise matrix Qx18 Kv Veleocity component of the Kalman gain matrix K
Table 6. Additional Feature Set extracted from the tracker using an adaptive process noise.
3.3.2. Classification
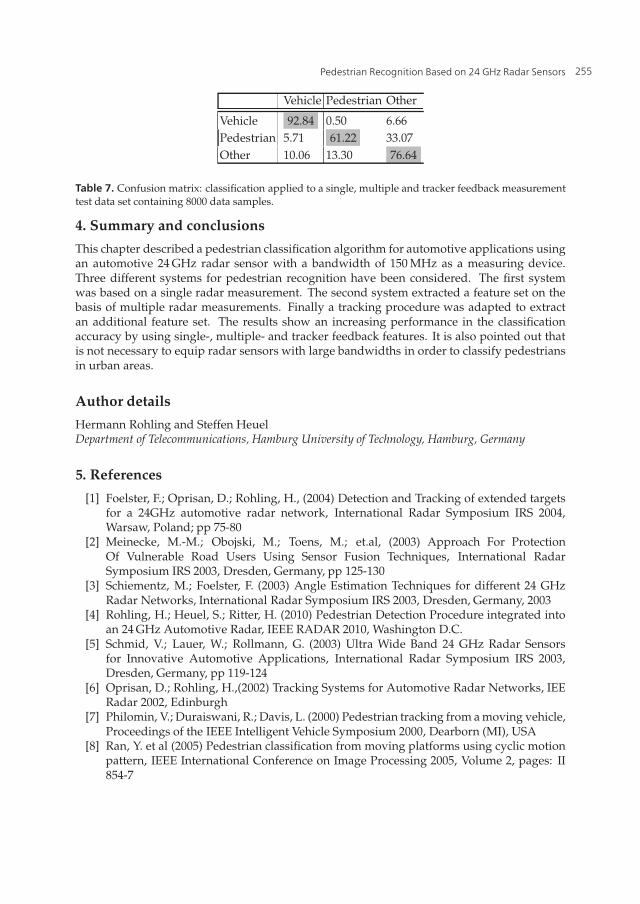
An additional feature extraction based on the process noise and Kalman gain has beendescribed. These features are added to the prior feature set. Table 7 shows the results ofthe classifier using all proposed features, single measurement, multiple measurements andtracker feedback. Even in an urban area with a high density of static targets pedestrians couldbe detected, tracked and classified with a true positive rate of 61.22% in the test data set. Theseresults outperform prior outcomes using single- and the multiple measurements as a featurebasis.
The classification results show an increasing performance in terms of correct classification andmisclassification of pedestrians.
254 Ultra-Wideband Radio Technologies for Communications, Localization and Sensor Applications
Pedestrian Recognition Based on 24 GHz Radar Sensors 15
Vehicle Pedestrian Other
Vehicle 92.84 0.50 6.66Pedestrian 5.71 61.22 33.07Other 10.06 13.30 76.64
Table 7. Confusion matrix: classification applied to a single, multiple and tracker feedback measurementtest data set containing 8000 data samples.
4. Summary and conclusions
This chapter described a pedestrian classification algorithm for automotive applications usingan automotive 24 GHz radar sensor with a bandwidth of 150 MHz as a measuring device.Three different systems for pedestrian recognition have been considered. The first systemwas based on a single radar measurement. The second system extracted a feature set on thebasis of multiple radar measurements. Finally a tracking procedure was adapted to extractan additional feature set. The results show an increasing performance in the classificationaccuracy by using single-, multiple- and tracker feedback features. It is also pointed out thatis not necessary to equip radar sensors with large bandwidths in order to classify pedestriansin urban areas.
Author details
Hermann Rohling and Steffen HeuelDepartment of Telecommunications, Hamburg University of Technology, Hamburg, Germany
5. References
[1] Foelster, F.; Oprisan, D.; Rohling, H., (2004) Detection and Tracking of extended targetsfor a 24GHz automotive radar network, International Radar Symposium IRS 2004,Warsaw, Poland; pp 75-80
[2] Meinecke, M.-M.; Obojski, M.; Toens, M.; et.al, (2003) Approach For ProtectionOf Vulnerable Road Users Using Sensor Fusion Techniques, International RadarSymposium IRS 2003, Dresden, Germany, pp 125-130
[3] Schiementz, M.; Foelster, F. (2003) Angle Estimation Techniques for different 24 GHzRadar Networks, International Radar Symposium IRS 2003, Dresden, Germany, 2003
[4] Rohling, H.; Heuel, S.; Ritter, H. (2010) Pedestrian Detection Procedure integrated intoan 24 GHz Automotive Radar, IEEE RADAR 2010, Washington D.C.
[5] Schmid, V.; Lauer, W.; Rollmann, G. (2003) Ultra Wide Band 24 GHz Radar Sensorsfor Innovative Automotive Applications, International Radar Symposium IRS 2003,Dresden, Germany, pp 119-124
[6] Oprisan, D.; Rohling, H.,(2002) Tracking Systems for Automotive Radar Networks, IEERadar 2002, Edinburgh
[7] Philomin, V.; Duraiswani, R.; Davis, L. (2000) Pedestrian tracking from a moving vehicle,Proceedings of the IEEE Intelligent Vehicle Symposium 2000, Dearborn (MI), USA
[8] Ran, Y. et al (2005) Pedestrian classification from moving platforms using cyclic motionpattern, IEEE International Conference on Image Processing 2005, Volume 2, pages: II854-7
255Pedestrian Recognition Based on 24 GHz Radar Sensors
16 Will-be-set-by-IN-TECH
[9] Van Dorp, P.; Groen, F. (2003) Real-Time Human Walking Estimation with Radar,International Radar Symposium IRS 2003, Dresden, Germany, pp 645-650
[10] Lei, J.; Lu, C. (2005) Target Classification Based on Micro-Doppler Signatures, IEEEInternational Radar Conference 2005; Arlington, USA; pp 179-183
[11] Klotz, M. (2002) An Automotive Short Range High Resolution Pulse Radar Network,Phd. Thesis, Hamburg University of Technology, Hamburg, Germany
[12] Luebbert, U. (2005) Target Position Estimation with a Continuous Wave Radar Network,Phd. Thesis, Hamburg University of Technology, Hamburg, Germany
[13] Foelster, F., Rohling, H. and Meinecke, M. M. (2005) Pedestrian recognition based onautomotive radar sensors, 5th European Congress on Intelligent Transportation Systemsand Services 2005, Hannover, Germany
[14] Heuel, S.; Rohling, H. (2011) Two-Stage Pedestrian Classification in Automotive RadarSystems, International Radar Symposium IRS 2011, Leipzig, Germany
[15] Nalecz, M.; Rytel-Andrianik, R.; Wojtkiewicz, A. (2003) Micro-doppler analysis ofsignals received by FMCW radar, Proceedings of International Radar Symposium 2003,Dresden, Germany, pp. 651-656
[16] Duda, R. O.; Hart, P. E.; Stork, D. G. (2001) Pattern classification, Wiley, New York[17] Schuermann, J. (1996) Pattern Classification - A Unified View of Statistical and Neural
Approaches, Wiley, New York[18] Schiementz, M. (2005) Postprocessing Architecture for an Automotive Radar Network,
Phd. Thesis, Hamburg University of Technology, Hamburg, Germany[19] Meinecke, M.-M.; Rohling, H. (2000) Combination of LFMCW and FSK modulation
principles for automotive, German Radar Symposium GRS 2000, Berlin, Germany[20] Winner, H., Hakuli, S., Wolf, G., (2009), Handbuch Fahrerassistenzsysteme,
Vieweg+Teubner Verlag / GWV Fachverlage GmbH, Wiesbaden, Germany[21] Smart Microwave Sensors GmbH, (2012), UMRR | LCA BSD Technical Information
Sheet, available athttp://www.smartmicro.de/images/stories/contentimage/automotive/LCA andBSD Technical Information.pdf, Accessed: 30 August 2012
[22] Perry, J. (1992) Gait Analysis - Normal and Pathological Function, SLACK Incorporated,ISBN 1556421923
[23] Foelster, F.; Ritter, H., Rohling, H. (2007) Lateral Velocity Estimation for AutomotiveRadar Applications, The IET International Conference on Radar Systems, Edinburgh,Great Britain
[24] Boser, B. E.; Guyon, I. M.; Vapnik, V. N. (1992) A training algorithm for optimal marginclassifiers, In D. Haussler, editor, 5th Annual ACM Workshop on COLT, Pittsburgh, PA,pp. 144-152
[25] Wu, X.; Kumar, V.; Ross Quinlan, J.; Ghosh, J.; Yang, Q.; Motoda, H.; McLachlan, G. J.;Ng, A.; Liu, B., Yu, P. S. and others (2008) Top 10 algorithms in data mining, Knowledgeand Information Systems, Vol. 14, No. 1., pp. 1-37
[26] Branko, R.; Sanjeev, A.; Nei, G. (2004) Beyond the Kalman Filter: Particle Filters ForTracking Applications, Artech House Inc.
256 Ultra-Wideband Radio Technologies for Communications, Localization and Sensor Applications