Embed Size (px)
Citation preview
Copyright 2017, FAIR Health, Inc. All rights reserved.
Spotlight on Five Key Urban Centers and Their Respective States
Peeling Back the Curtain on Regional
Variation in the Opioid Crisis
A FAIR Health White Paper, June 2017
2
Peeling Back the Curtain on Regional Variation in the Opioid Crisis
Summary
The opioid epidemic, involving both prescription pain relievers and heroin, is affecting the entire nation,
but not in the same way or to the same extent in every location. Having previously published white papers
on national trends in the opioid epidemic1 and the impact of the epidemic on the healthcare system,2
FAIR Health now turns its attention in this third white paper in the series to regional variations in the
effects of the opioid crisis. A national, independent, nonprofit organization dedicated to transparency in
healthcare costs and health insurance information, FAIR Health analyzed data from its database of
billions of privately billed healthcare claims to study the opioid crisis in rural and urban settings and in the
nation’s five most populous cities and the states in which they are situated during the recent ten-year
period 2007 to 2016. Among the findings from the database’s private insurance claims:
Claim lines with opioid abuse and dependence diagnoses were more concentrated among
middle-aged people in rural than urban settings, where they were spread more broadly among
young and middle-aged people.
Of the five most populous cities in the country—Chicago, Houston, Los Angeles, New York and
Philadelphia—Philadelphia had the greatest percentage of claim lines with opioid-related
diagnoses compared to all services in the state. It far outstripped the others in this measure:
number of claim lines with opioid-related diagnoses in a city compared to number of claim lines
for all medical care in the relevant state.
Of six regions in California, the greatest increase in claim lines with opioid-related diagnoses from
2007 to 2016 was in southern California (including Los Angeles), where the increase was 31,897
percent—more than five times as great as the next largest increase.
In New York State, New York City constituted 43 percent of the population but only 13 percent of
the distribution of claim lines with opioid-related diagnoses.
In Texas, San Antonio and its immediate surrounding areas constituted 5 percent of the
population, but 66 percent of the distribution of claim lines with opioid-related diagnoses.
In both Illinois and Pennsylvania, claim lines with an opioid dependence diagnosis occurred more
frequently in males than females in all age groups—but the gap narrowed over the age of 50
years, with males at 55 percent and females at 45 percent.
The top five procedures associated with opioid-related diagnoses, and the top five expenditures,
differed in each of the five states profiled in this study.
Background
A number of studies have been conducted on geographic variations in the opioid epidemic. A 2007 study,
for example, found that abuse of prescription opioids was disproportionately high relative to their
therapeutic use in very small urban, suburban, and rural areas.3 A 2012 study revealed that counties with
the highest opioid prescribing rates were found disproportionately in Appalachia and in southern and
1 The Opioid Crisis among the Privately Insured: The Opioid Abuse Epidemic as Documented in Private Claims Data, A FAIR Health White Paper, FAIR Health, July 2016, http://www.fairhealth.org/servlet/servlet.FileDownload?file=01532000001nwD2. 2 The Impact of the Opioid Crisis on the Healthcare System: A Study of Privately Billed Services, A FAIR
Health White Paper, FAIR Health, September 2016, http://www.fairhealth.org/servlet/servlet.FileDownload?file=01532000001g4i3. 3 Theodore J. Cicero et al., “Relationship between Therapeutic Use and Abuse of Opioid Analgesics in Rural, Suburban, and Urban Locations in the United States,” Pharmacoepidemiol Drug Saf 16, no. 8 (2007): 827-40; doi:10.1002/pds.1452.
3
Peeling Back the Curtain on Regional Variation in the Opioid Crisis
western states.4 The Centers for Disease Control and Prevention (CDC) maintains statistics on the drug
overdose death rate in all 50 states and the District of Columbia.5 Nevertheless, there remains a need for
more information on the regional level. A recent paper noted that, even as late as 2016, most information
about illicit drug use came from large urban areas, despite the known widespread use of illicit drugs in
rural areas.6
To help meet that need, FAIR Health consulted its database of more than 23 billion privately billed
healthcare claims dating back to 2002, the largest such repository in the country. Focusing on the most
recent ten-year period—i.e., from 2007 to 2016—FAIR Health examined claims data from rural and urban
settings, the country’s five most populous cities and the states where those cities are located.
Methodology
Using the International Classification of Diseases (ICD-9-CM and ICD-10-CM) diagnostic codes reported
on claims in the FAIR Health dataset, FAIR Health examined claims of professional providers and
segregated data that were indicative of opioid dependence (e.g., ICD-9-CM 304.00, opioid-type
dependence, unspecified, and ICD-10-CM F11.20, opioid dependence, uncomplicated), opioid abuse
(e.g., ICD-9-CM 305.51, opioid abuse, continuous, and ICD-10-CM F11.10, opioid abuse,
uncomplicated), heroin overdose and overdose of opioids excluding heroin.
Data were then evaluated by stratifying the location in which the service was performed using a
combination of the United States Census Bureau’s classification categorizations, including the urban-rural
data and the metropolitan statistical areas, and the FAIR Health geozip paradigm.
Studies were conducted on CPT®7 codes (maintained by the American Medical Association [AMA]) and
HCPCS Level II codes (maintained by the Centers for Medicare & Medicaid Services [CMS]), such as
laboratory tests (e.g., CPT 83925, opiates, drug and metabolites, each procedure), alcohol and/or drug
services/therapy (e.g., HCPCS H0015, alcohol and/or drug services; intensive outpatient), evaluation and
management (E&M; e.g., CPT 99283, emergency department visit moderate severity) and hospitalization
(e.g., CPT 99233, subsequent hospital care per day, 35 minutes) and their individual component
procedure codes.
The data were aggregated by a variety of key fields, including state, city, procedure code (e.g., CPT
99213, 15-minute office visit, or HCPCS H0015, alcohol and/or drug services; intensive outpatient),
gender, age and year of service, to identify trends and patterns in utilization and cost by both charges and
imputed allowed amounts. The data were evaluated with single and multiple variables to look for distinct
trends and associations, which were then used to create graphical representations of the information.
In the graphical representations, below, the term “claim lines” refers to the individual procedures or services listed on an insurance claim. “Percent of claim lines” is the percent of all claim lines associated with a given grouping of diagnosis codes (e.g., codes associated with opioid abuse and dependence) in a given time period as a function of all the claim lines which were associated with the state for that same time period. All charges and allowed amounts are based on data in the FAIR Health repository, which represents the claims experience for approximately 150 million covered lives annually.
4 Douglas C. McDonald, Kenneth Carlson and David Izrael, “Geographic Variation in Opioid Prescribing in the U.S.,” J Pain 13, no. 10 (2012): 988-96; doi:10.1016/j.jpain.2012.07.007. 5 “Drug Overdose Death Data: 2015 Deaths,” Centers for Disease Control and Prevention (CDC), last updated: December 16, 2016, https://www.cdc.gov/drugoverdose/data/statedeaths.html. 6 Kirk Dombrowski et al., “Current Rural Drug Use in the US Midwest,” J Drug Abuse, 2, no. 3 (2016): pii: 22; Epub August 7, 2016. 7 CPT © 2016 American Medical Association (AMA). All rights reserved.
4
Peeling Back the Curtain on Regional Variation in the Opioid Crisis
When the term “opioid-related diagnoses” is used in this report, it refers to four diagnoses: opioid abuse,
opioid dependence, heroin overdose and opioid overdose (i.e., overdose of opioids excluding heroin).
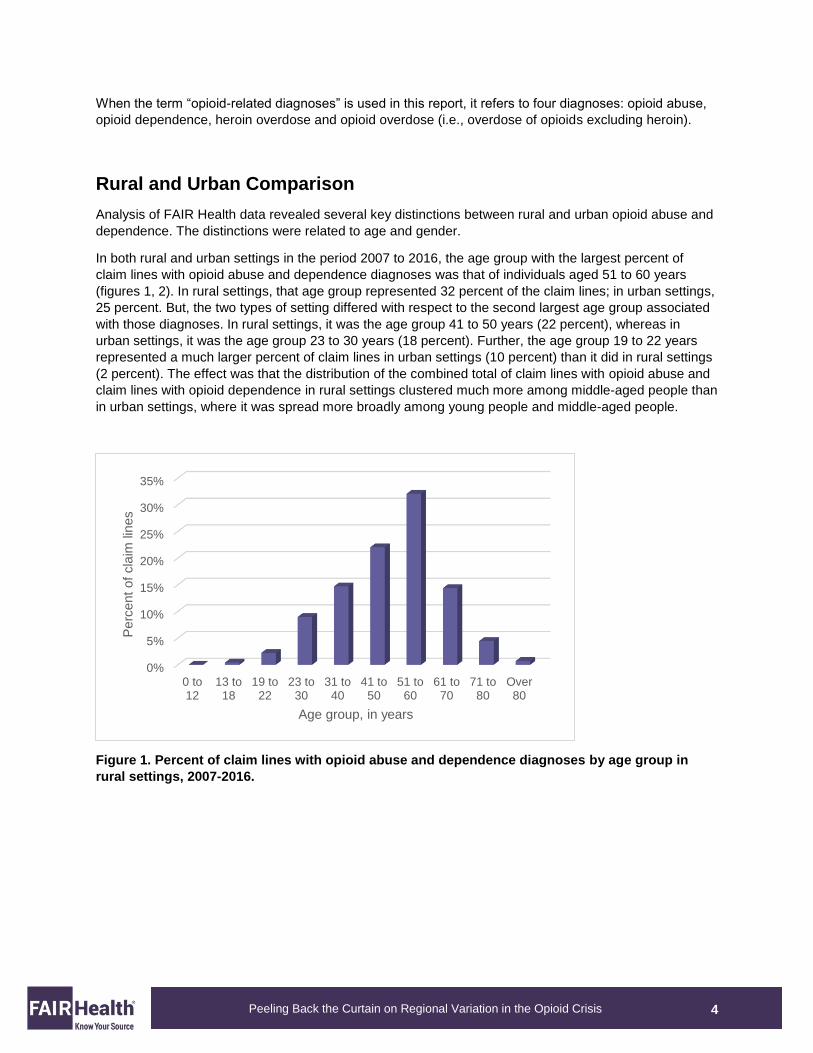
Rural and Urban Comparison
Analysis of FAIR Health data revealed several key distinctions between rural and urban opioid abuse and
dependence. The distinctions were related to age and gender.
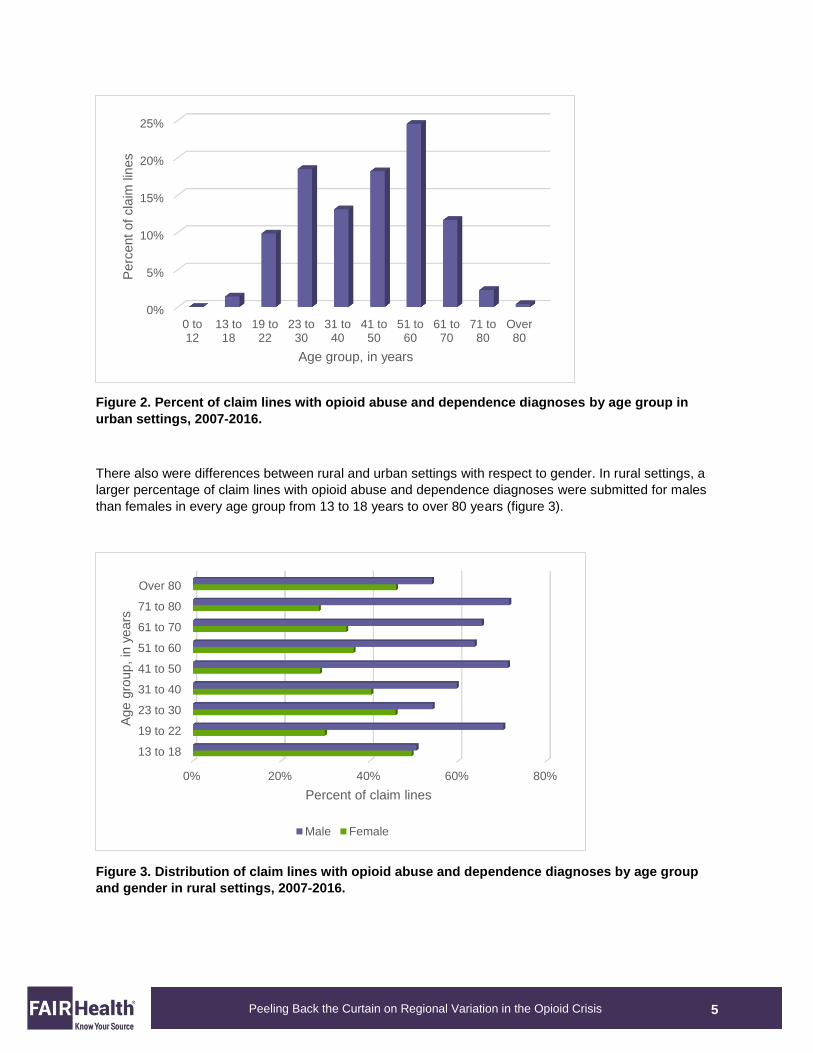
In both rural and urban settings in the period 2007 to 2016, the age group with the largest percent of
claim lines with opioid abuse and dependence diagnoses was that of individuals aged 51 to 60 years
(figures 1, 2). In rural settings, that age group represented 32 percent of the claim lines; in urban settings,
25 percent. But, the two types of setting differed with respect to the second largest age group associated
with those diagnoses. In rural settings, it was the age group 41 to 50 years (22 percent), whereas in
urban settings, it was the age group 23 to 30 years (18 percent). Further, the age group 19 to 22 years
represented a much larger percent of claim lines in urban settings (10 percent) than it did in rural settings
(2 percent). The effect was that the distribution of the combined total of claim lines with opioid abuse and
claim lines with opioid dependence in rural settings clustered much more among middle-aged people than
in urban settings, where it was spread more broadly among young people and middle-aged people.
Figure 1. Percent of claim lines with opioid abuse and dependence diagnoses by age group in
rural settings, 2007-2016.
0%
5%
10%
15%
20%
25%
30%
35%
0 to12
13 to18
19 to22
23 to30
31 to40
41 to50
51 to60
61 to70
71 to80
Over80
Perc
ent
of
cla
im lin
es
Age group, in years
5
Peeling Back the Curtain on Regional Variation in the Opioid Crisis
Figure 2. Percent of claim lines with opioid abuse and dependence diagnoses by age group in
urban settings, 2007-2016.
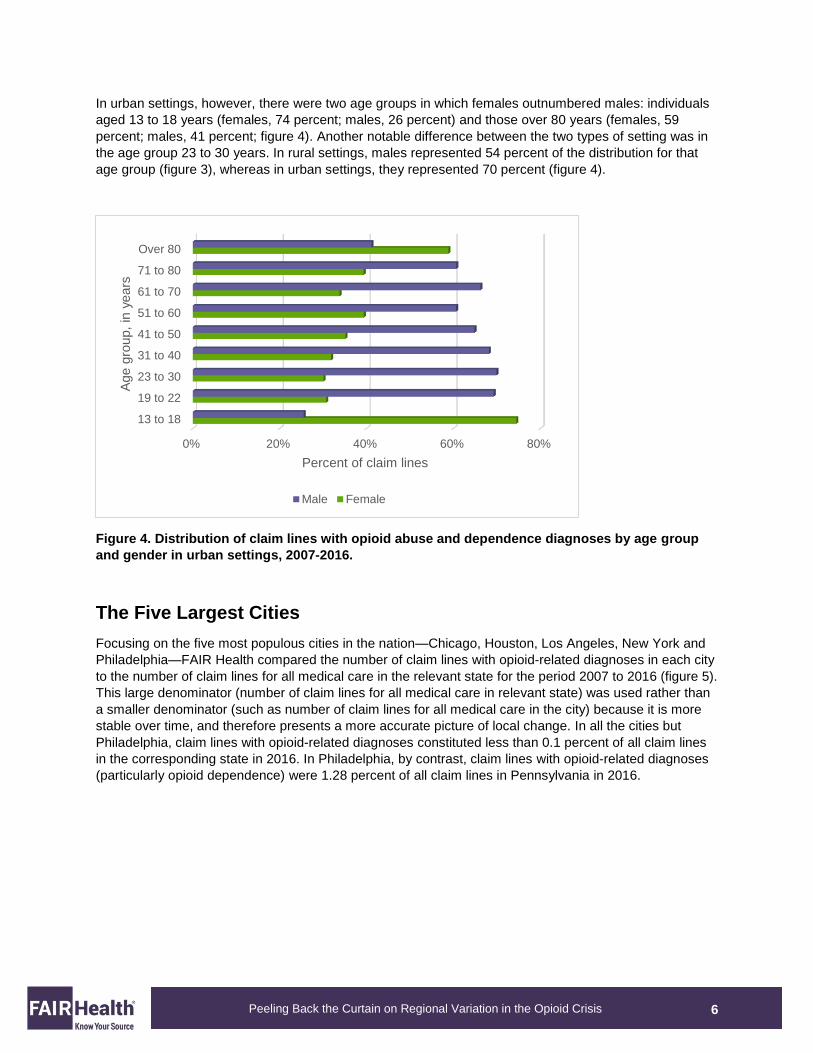
There also were differences between rural and urban settings with respect to gender. In rural settings, a
larger percentage of claim lines with opioid abuse and dependence diagnoses were submitted for males
than females in every age group from 13 to 18 years to over 80 years (figure 3).
Figure 3. Distribution of claim lines with opioid abuse and dependence diagnoses by age group
and gender in rural settings, 2007-2016.
0%
5%
10%
15%
20%
25%
0 to12
13 to18
19 to22
23 to30
31 to40
41 to50
51 to60
61 to70
71 to80
Over80
Perc
ent
of
cla
im lin
es
Age group, in years
0% 20% 40% 60% 80%
13 to 18
19 to 22
23 to 30
31 to 40
41 to 50
51 to 60
61 to 70
71 to 80
Over 80
Percent of claim lines
Age g
roup,
in y
ears
Male Female
6
Peeling Back the Curtain on Regional Variation in the Opioid Crisis
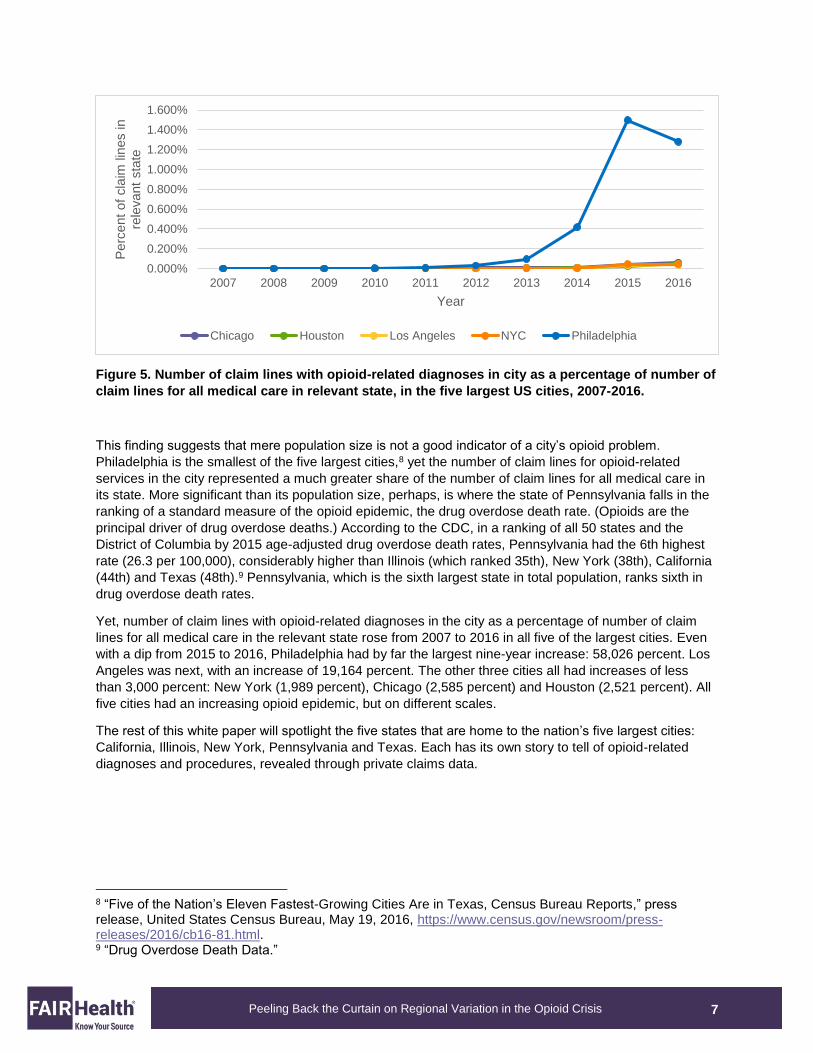
In urban settings, however, there were two age groups in which females outnumbered males: individuals
aged 13 to 18 years (females, 74 percent; males, 26 percent) and those over 80 years (females, 59
percent; males, 41 percent; figure 4). Another notable difference between the two types of setting was in
the age group 23 to 30 years. In rural settings, males represented 54 percent of the distribution for that
age group (figure 3), whereas in urban settings, they represented 70 percent (figure 4).
Figure 4. Distribution of claim lines with opioid abuse and dependence diagnoses by age group
and gender in urban settings, 2007-2016.
The Five Largest Cities
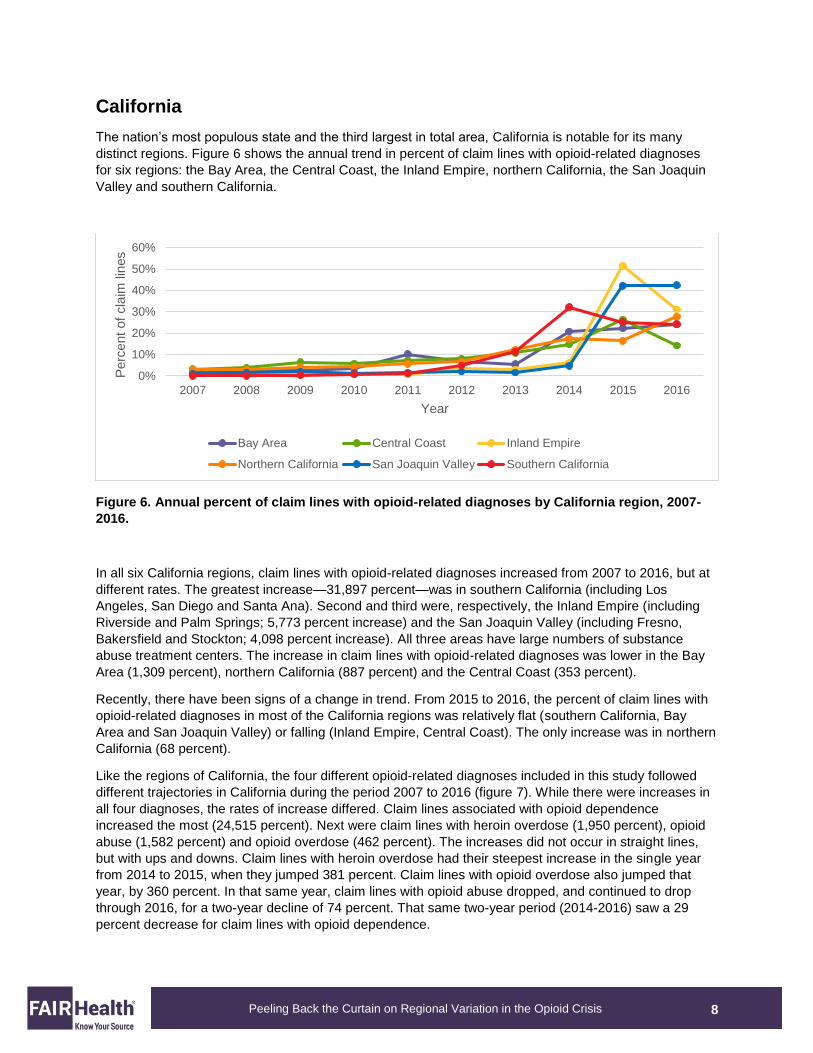
Focusing on the five most populous cities in the nation—Chicago, Houston, Los Angeles, New York and
Philadelphia—FAIR Health compared the number of claim lines with opioid-related diagnoses in each city
to the number of claim lines for all medical care in the relevant state for the period 2007 to 2016 (figure 5).
This large denominator (number of claim lines for all medical care in relevant state) was used rather than
a smaller denominator (such as number of claim lines for all medical care in the city) because it is more
stable over time, and therefore presents a more accurate picture of local change. In all the cities but
Philadelphia, claim lines with opioid-related diagnoses constituted less than 0.1 percent of all claim lines
in the corresponding state in 2016. In Philadelphia, by contrast, claim lines with opioid-related diagnoses
(particularly opioid dependence) were 1.28 percent of all claim lines in Pennsylvania in 2016.
0% 20% 40% 60% 80%
13 to 18
19 to 22
23 to 30
31 to 40
41 to 50
51 to 60
61 to 70
71 to 80
Over 80
Percent of claim lines
Age g
roup,
in y
ears
Male Female
7
Peeling Back the Curtain on Regional Variation in the Opioid Crisis
Figure 5. Number of claim lines with opioid-related diagnoses in city as a percentage of number of
claim lines for all medical care in relevant state, in the five largest US cities, 2007-2016.
This finding suggests that mere population size is not a good indicator of a city’s opioid problem.
Philadelphia is the smallest of the five largest cities,8 yet the number of claim lines for opioid-related
services in the city represented a much greater share of the number of claim lines for all medical care in
its state. More significant than its population size, perhaps, is where the state of Pennsylvania falls in the
ranking of a standard measure of the opioid epidemic, the drug overdose death rate. (Opioids are the
principal driver of drug overdose deaths.) According to the CDC, in a ranking of all 50 states and the
District of Columbia by 2015 age-adjusted drug overdose death rates, Pennsylvania had the 6th highest
rate (26.3 per 100,000), considerably higher than Illinois (which ranked 35th), New York (38th), California
(44th) and Texas (48th).9 Pennsylvania, which is the sixth largest state in total population, ranks sixth in
drug overdose death rates.
Yet, number of claim lines with opioid-related diagnoses in the city as a percentage of number of claim
lines for all medical care in the relevant state rose from 2007 to 2016 in all five of the largest cities. Even
with a dip from 2015 to 2016, Philadelphia had by far the largest nine-year increase: 58,026 percent. Los
Angeles was next, with an increase of 19,164 percent. The other three cities all had increases of less
than 3,000 percent: New York (1,989 percent), Chicago (2,585 percent) and Houston (2,521 percent). All
five cities had an increasing opioid epidemic, but on different scales.
The rest of this white paper will spotlight the five states that are home to the nation’s five largest cities:
California, Illinois, New York, Pennsylvania and Texas. Each has its own story to tell of opioid-related
diagnoses and procedures, revealed through private claims data.
8 “Five of the Nation’s Eleven Fastest-Growing Cities Are in Texas, Census Bureau Reports,” press release, United States Census Bureau, May 19, 2016, https://www.census.gov/newsroom/press-releases/2016/cb16-81.html. 9 “Drug Overdose Death Data.”
0.000%
0.200%
0.400%
0.600%
0.800%
1.000%
1.200%
1.400%
1.600%
2007 2008 2009 2010 2011 2012 2013 2014 2015 2016
Perc
ent
of
cla
im lin
es in
rele
vant
sta
te
Year
Chicago Houston Los Angeles NYC Philadelphia
8
Peeling Back the Curtain on Regional Variation in the Opioid Crisis
California
The nation’s most populous state and the third largest in total area, California is notable for its many
distinct regions. Figure 6 shows the annual trend in percent of claim lines with opioid-related diagnoses
for six regions: the Bay Area, the Central Coast, the Inland Empire, northern California, the San Joaquin
Valley and southern California.
Figure 6. Annual percent of claim lines with opioid-related diagnoses by California region, 2007-
2016.
In all six California regions, claim lines with opioid-related diagnoses increased from 2007 to 2016, but at
different rates. The greatest increase—31,897 percent—was in southern California (including Los
Angeles, San Diego and Santa Ana). Second and third were, respectively, the Inland Empire (including
Riverside and Palm Springs; 5,773 percent increase) and the San Joaquin Valley (including Fresno,
Bakersfield and Stockton; 4,098 percent increase). All three areas have large numbers of substance
abuse treatment centers. The increase in claim lines with opioid-related diagnoses was lower in the Bay
Area (1,309 percent), northern California (887 percent) and the Central Coast (353 percent).
Recently, there have been signs of a change in trend. From 2015 to 2016, the percent of claim lines with
opioid-related diagnoses in most of the California regions was relatively flat (southern California, Bay
Area and San Joaquin Valley) or falling (Inland Empire, Central Coast). The only increase was in northern
California (68 percent).
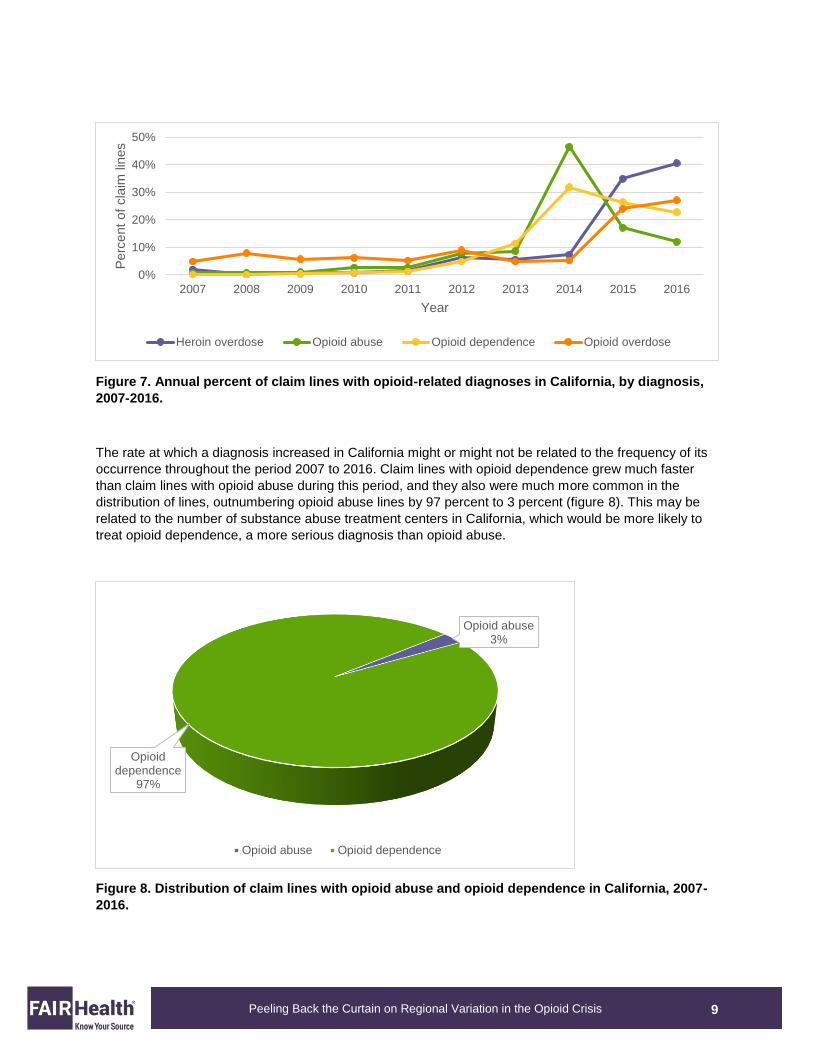
Like the regions of California, the four different opioid-related diagnoses included in this study followed
different trajectories in California during the period 2007 to 2016 (figure 7). While there were increases in
all four diagnoses, the rates of increase differed. Claim lines associated with opioid dependence
increased the most (24,515 percent). Next were claim lines with heroin overdose (1,950 percent), opioid
abuse (1,582 percent) and opioid overdose (462 percent). The increases did not occur in straight lines,
but with ups and downs. Claim lines with heroin overdose had their steepest increase in the single year
from 2014 to 2015, when they jumped 381 percent. Claim lines with opioid overdose also jumped that
year, by 360 percent. In that same year, claim lines with opioid abuse dropped, and continued to drop
through 2016, for a two-year decline of 74 percent. That same two-year period (2014-2016) saw a 29
percent decrease for claim lines with opioid dependence.
0%
10%
20%
30%
40%
50%
60%
2007 2008 2009 2010 2011 2012 2013 2014 2015 2016
Perc
ent
of
cla
im lin
es
Year
Bay Area Central Coast Inland Empire
Northern California San Joaquin Valley Southern California
9
Peeling Back the Curtain on Regional Variation in the Opioid Crisis
Figure 7. Annual percent of claim lines with opioid-related diagnoses in California, by diagnosis,
2007-2016.
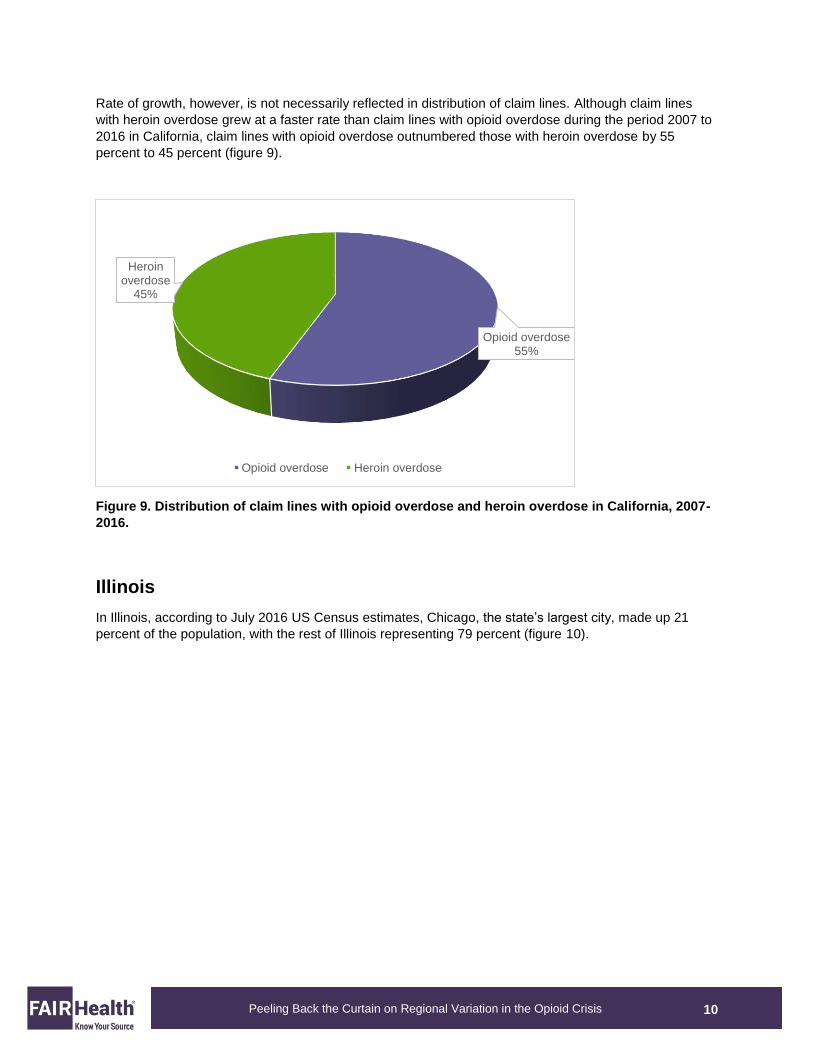
The rate at which a diagnosis increased in California might or might not be related to the frequency of its
occurrence throughout the period 2007 to 2016. Claim lines with opioid dependence grew much faster
than claim lines with opioid abuse during this period, and they also were much more common in the
distribution of lines, outnumbering opioid abuse lines by 97 percent to 3 percent (figure 8). This may be
related to the number of substance abuse treatment centers in California, which would be more likely to
treat opioid dependence, a more serious diagnosis than opioid abuse.
Figure 8. Distribution of claim lines with opioid abuse and opioid dependence in California, 2007-
2016.
0%
10%
20%
30%
40%
50%
2007 2008 2009 2010 2011 2012 2013 2014 2015 2016
Perc
ent
of
cla
im lin
es
Year
Heroin overdose Opioid abuse Opioid dependence Opioid overdose
Opioid abuse3%
Opioid dependence
97%
Opioid abuse Opioid dependence
10
Peeling Back the Curtain on Regional Variation in the Opioid Crisis
Rate of growth, however, is not necessarily reflected in distribution of claim lines. Although claim lines
with heroin overdose grew at a faster rate than claim lines with opioid overdose during the period 2007 to
2016 in California, claim lines with opioid overdose outnumbered those with heroin overdose by 55
percent to 45 percent (figure 9).
Figure 9. Distribution of claim lines with opioid overdose and heroin overdose in California, 2007-
2016.
Illinois
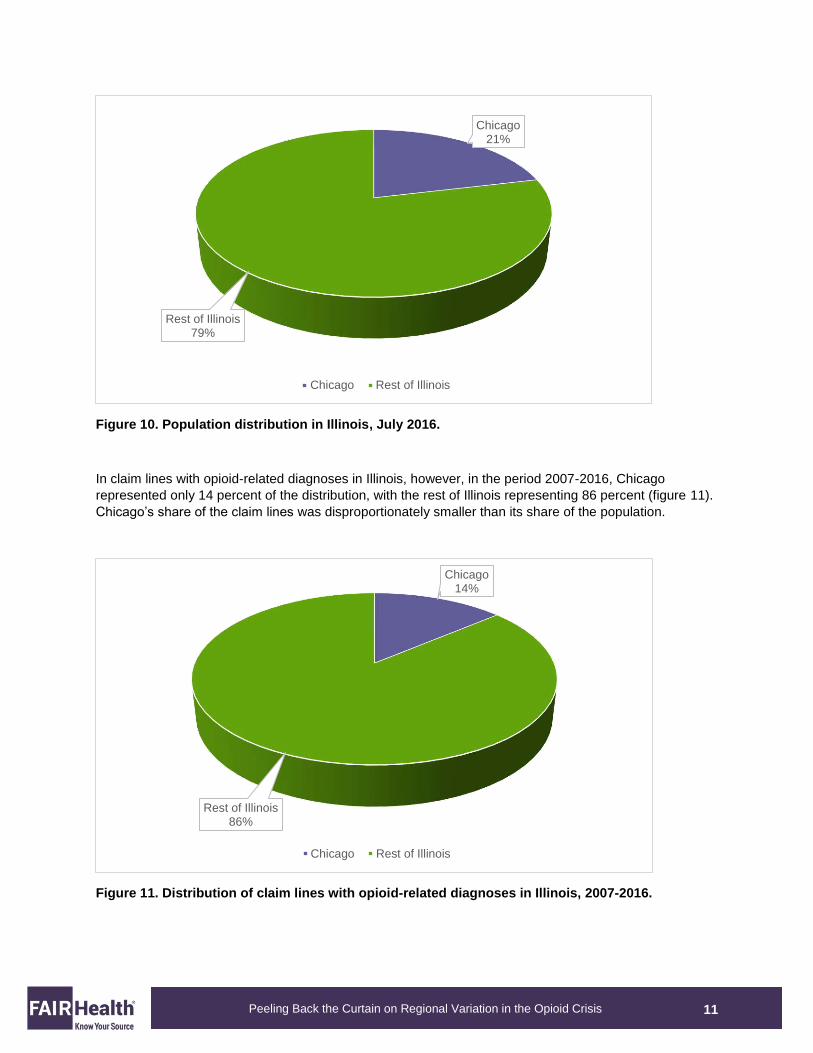
In Illinois, according to July 2016 US Census estimates, Chicago, the state’s largest city, made up 21
percent of the population, with the rest of Illinois representing 79 percent (figure 10).
Opioid overdose55%
Heroin overdose
45%
Opioid overdose Heroin overdose
11
Peeling Back the Curtain on Regional Variation in the Opioid Crisis
Figure 10. Population distribution in Illinois, July 2016.
In claim lines with opioid-related diagnoses in Illinois, however, in the period 2007-2016, Chicago
represented only 14 percent of the distribution, with the rest of Illinois representing 86 percent (figure 11).
Chicago’s share of the claim lines was disproportionately smaller than its share of the population.
Figure 11. Distribution of claim lines with opioid-related diagnoses in Illinois, 2007-2016.
Chicago21%
Rest of Illinois79%
Chicago Rest of Illinois
Chicago14%
Rest of Illinois86%
Chicago Rest of Illinois
12
Peeling Back the Curtain on Regional Variation in the Opioid Crisis
There are several possible explanations for this difference. It may be that, at least among the privately
insured, Chicago has relatively fewer instances of opioid-related diagnoses than the rest of Illinois. It may
be that Chicago has a larger population using Medicaid for opioid-related treatment than the rest of
Illinois; FAIR Health data do not include Medicaid. And, it may be that Chicago has more higher-income
individuals who do not use insurance to cover substance abuse treatment.
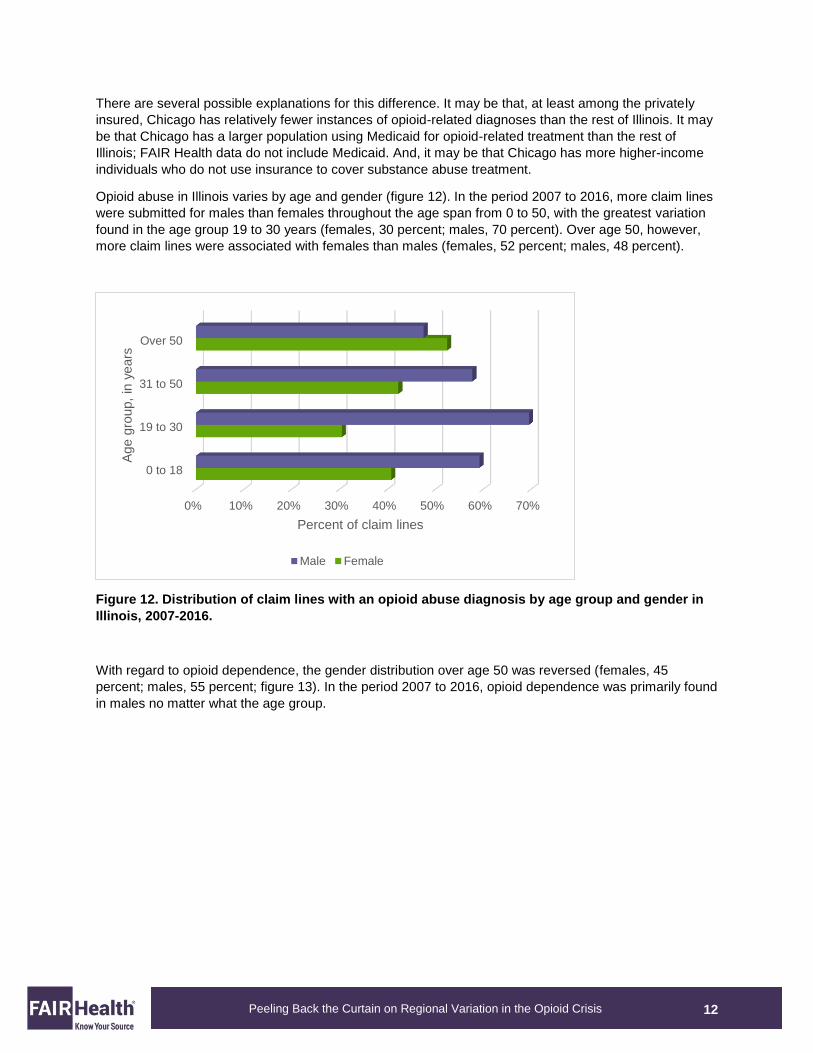
Opioid abuse in Illinois varies by age and gender (figure 12). In the period 2007 to 2016, more claim lines
were submitted for males than females throughout the age span from 0 to 50, with the greatest variation
found in the age group 19 to 30 years (females, 30 percent; males, 70 percent). Over age 50, however,
more claim lines were associated with females than males (females, 52 percent; males, 48 percent).
Figure 12. Distribution of claim lines with an opioid abuse diagnosis by age group and gender in
Illinois, 2007-2016.
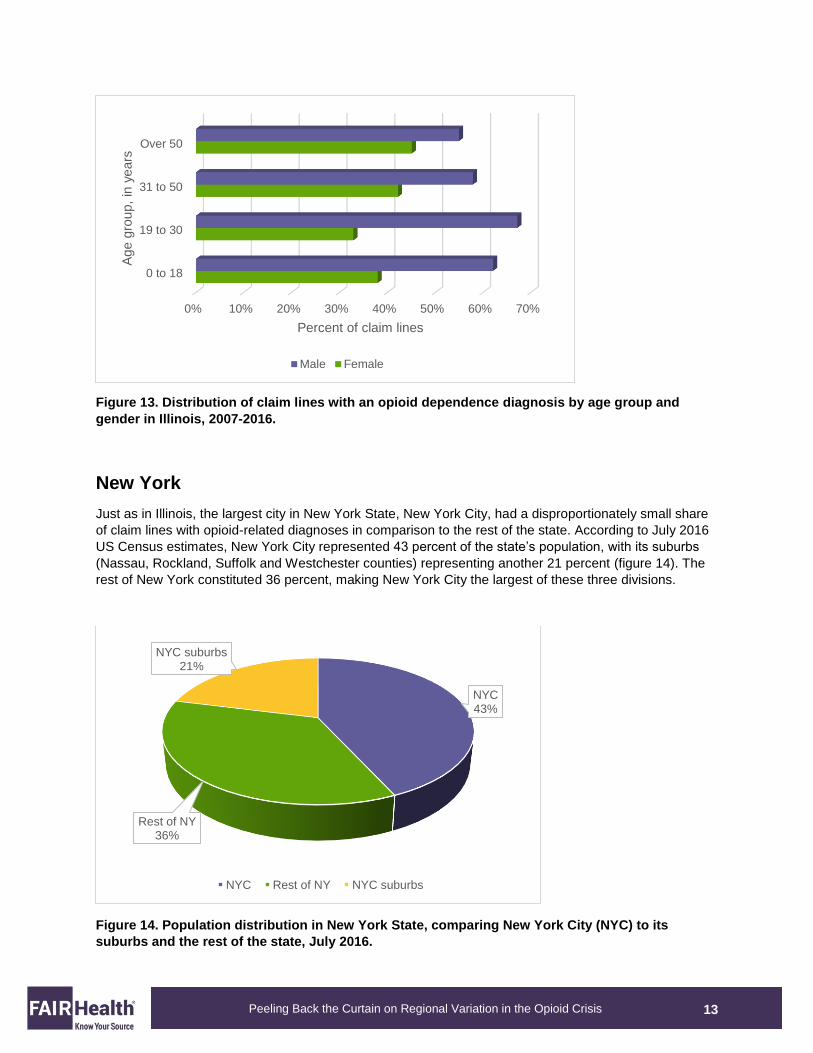
With regard to opioid dependence, the gender distribution over age 50 was reversed (females, 45
percent; males, 55 percent; figure 13). In the period 2007 to 2016, opioid dependence was primarily found
in males no matter what the age group.
0% 10% 20% 30% 40% 50% 60% 70%
0 to 18
19 to 30
31 to 50
Over 50
Percent of claim lines
Age g
roup,
in y
ears
Male Female
13
Peeling Back the Curtain on Regional Variation in the Opioid Crisis
Figure 13. Distribution of claim lines with an opioid dependence diagnosis by age group and
gender in Illinois, 2007-2016.
New York
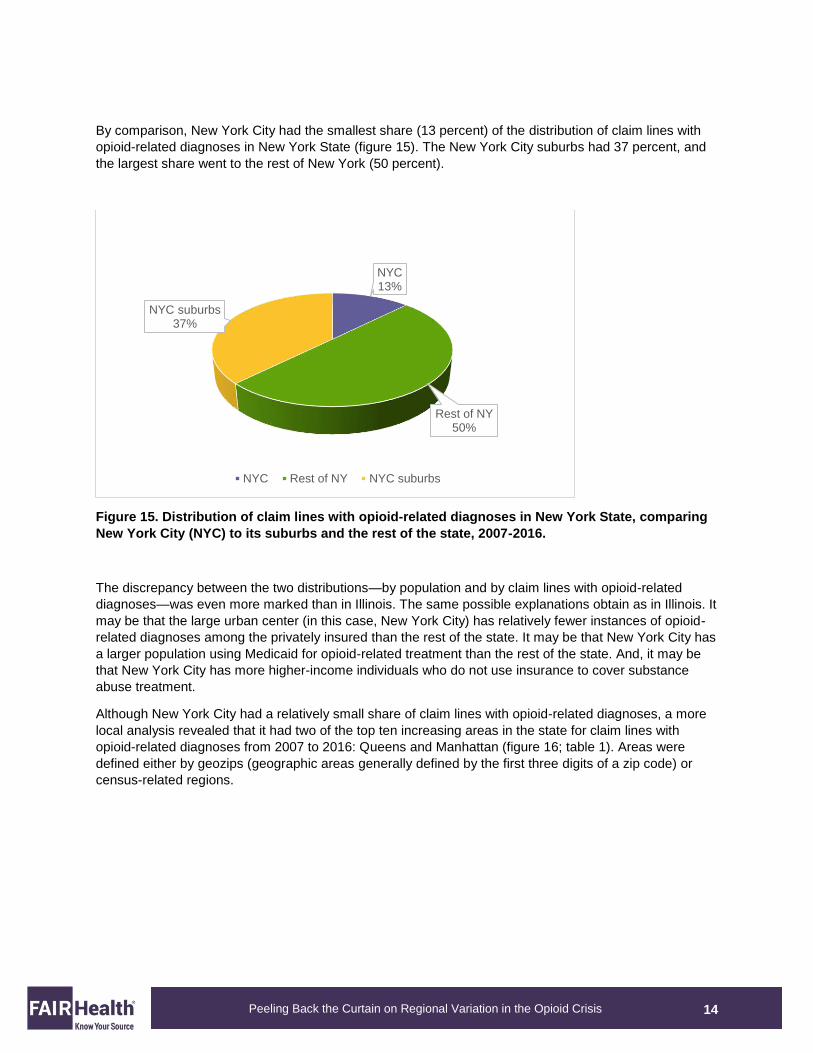
Just as in Illinois, the largest city in New York State, New York City, had a disproportionately small share
of claim lines with opioid-related diagnoses in comparison to the rest of the state. According to July 2016
US Census estimates, New York City represented 43 percent of the state’s population, with its suburbs
(Nassau, Rockland, Suffolk and Westchester counties) representing another 21 percent (figure 14). The
rest of New York constituted 36 percent, making New York City the largest of these three divisions.
Figure 14. Population distribution in New York State, comparing New York City (NYC) to its
suburbs and the rest of the state, July 2016.
0% 10% 20% 30% 40% 50% 60% 70%
0 to 18
19 to 30
31 to 50
Over 50
Percent of claim lines
Age g
roup,
in y
ears
Male Female
NYC43%
Rest of NY36%
NYC suburbs21%
NYC Rest of NY NYC suburbs
14
Peeling Back the Curtain on Regional Variation in the Opioid Crisis
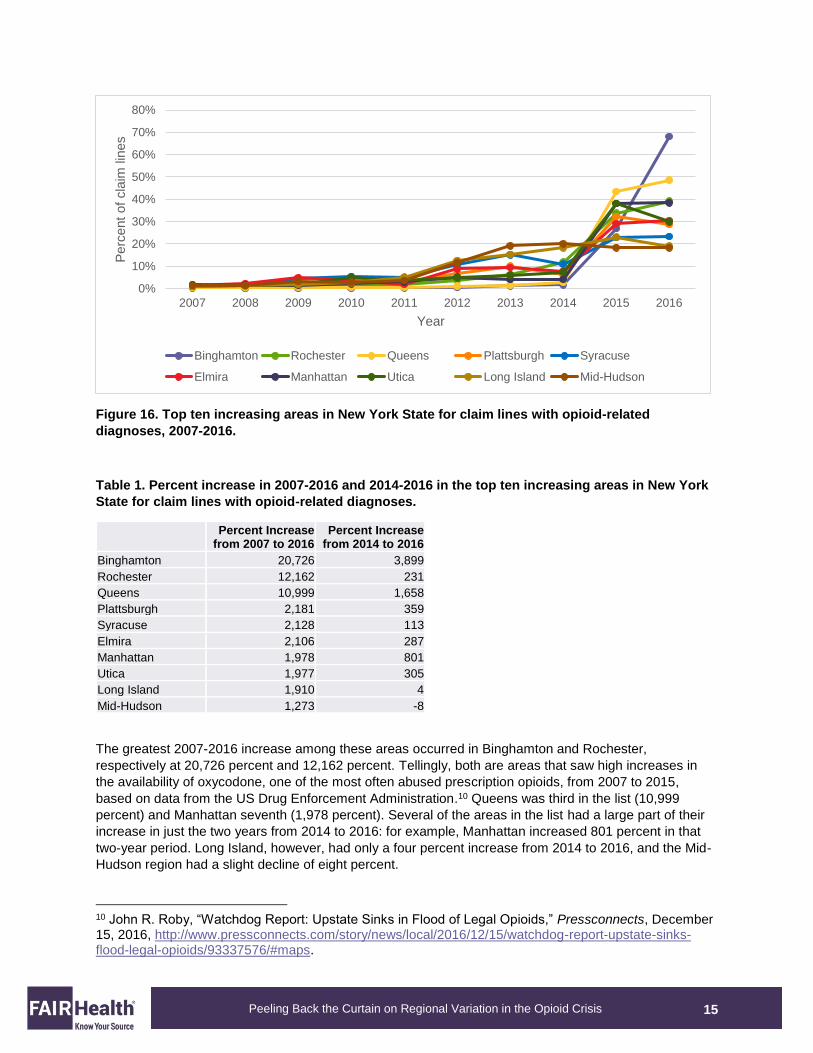
By comparison, New York City had the smallest share (13 percent) of the distribution of claim lines with
opioid-related diagnoses in New York State (figure 15). The New York City suburbs had 37 percent, and
the largest share went to the rest of New York (50 percent).
Figure 15. Distribution of claim lines with opioid-related diagnoses in New York State, comparing
New York City (NYC) to its suburbs and the rest of the state, 2007-2016.
The discrepancy between the two distributions—by population and by claim lines with opioid-related
diagnoses—was even more marked than in Illinois. The same possible explanations obtain as in Illinois. It
may be that the large urban center (in this case, New York City) has relatively fewer instances of opioid-
related diagnoses among the privately insured than the rest of the state. It may be that New York City has
a larger population using Medicaid for opioid-related treatment than the rest of the state. And, it may be
that New York City has more higher-income individuals who do not use insurance to cover substance
abuse treatment.
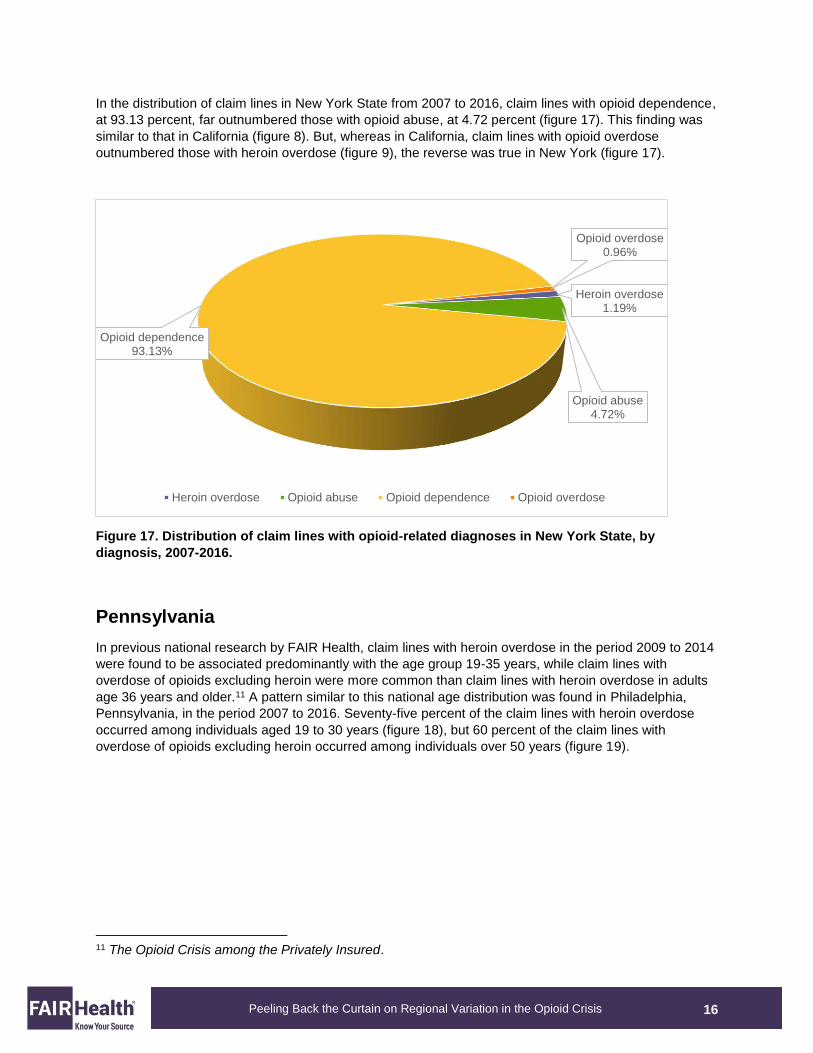
Although New York City had a relatively small share of claim lines with opioid-related diagnoses, a more
local analysis revealed that it had two of the top ten increasing areas in the state for claim lines with
opioid-related diagnoses from 2007 to 2016: Queens and Manhattan (figure 16; table 1). Areas were
defined either by geozips (geographic areas generally defined by the first three digits of a zip code) or
census-related regions.
NYC13%
Rest of NY50%
NYC suburbs37%
NYC Rest of NY NYC suburbs
15
Peeling Back the Curtain on Regional Variation in the Opioid Crisis
Figure 16. Top ten increasing areas in New York State for claim lines with opioid-related
diagnoses, 2007-2016.
Table 1. Percent increase in 2007-2016 and 2014-2016 in the top ten increasing areas in New York
State for claim lines with opioid-related diagnoses.
Percent Increase
from 2007 to 2016 Percent Increase
from 2014 to 2016 Binghamton 20,726 3,899 Rochester 12,162 231 Queens 10,999 1,658 Plattsburgh 2,181 359 Syracuse 2,128 113 Elmira 2,106 287 Manhattan 1,978 801 Utica 1,977 305 Long Island 1,910 4 Mid-Hudson 1,273 -8
The greatest 2007-2016 increase among these areas occurred in Binghamton and Rochester,
respectively at 20,726 percent and 12,162 percent. Tellingly, both are areas that saw high increases in
the availability of oxycodone, one of the most often abused prescription opioids, from 2007 to 2015,
based on data from the US Drug Enforcement Administration.10 Queens was third in the list (10,999
percent) and Manhattan seventh (1,978 percent). Several of the areas in the list had a large part of their
increase in just the two years from 2014 to 2016: for example, Manhattan increased 801 percent in that
two-year period. Long Island, however, had only a four percent increase from 2014 to 2016, and the Mid-
Hudson region had a slight decline of eight percent.
10 John R. Roby, “Watchdog Report: Upstate Sinks in Flood of Legal Opioids,” Pressconnects, December 15, 2016, http://www.pressconnects.com/story/news/local/2016/12/15/watchdog-report-upstate-sinks-flood-legal-opioids/93337576/#maps.
0%
10%
20%
30%
40%
50%
60%
70%
80%
2007 2008 2009 2010 2011 2012 2013 2014 2015 2016
Perc
ent
of
cla
im lin
es
Year
Binghamton Rochester Queens Plattsburgh Syracuse
Elmira Manhattan Utica Long Island Mid-Hudson
16
Peeling Back the Curtain on Regional Variation in the Opioid Crisis
In the distribution of claim lines in New York State from 2007 to 2016, claim lines with opioid dependence,
at 93.13 percent, far outnumbered those with opioid abuse, at 4.72 percent (figure 17). This finding was
similar to that in California (figure 8). But, whereas in California, claim lines with opioid overdose
outnumbered those with heroin overdose (figure 9), the reverse was true in New York (figure 17).
Figure 17. Distribution of claim lines with opioid-related diagnoses in New York State, by
diagnosis, 2007-2016.
Pennsylvania
In previous national research by FAIR Health, claim lines with heroin overdose in the period 2009 to 2014
were found to be associated predominantly with the age group 19-35 years, while claim lines with
overdose of opioids excluding heroin were more common than claim lines with heroin overdose in adults
age 36 years and older.11 A pattern similar to this national age distribution was found in Philadelphia,
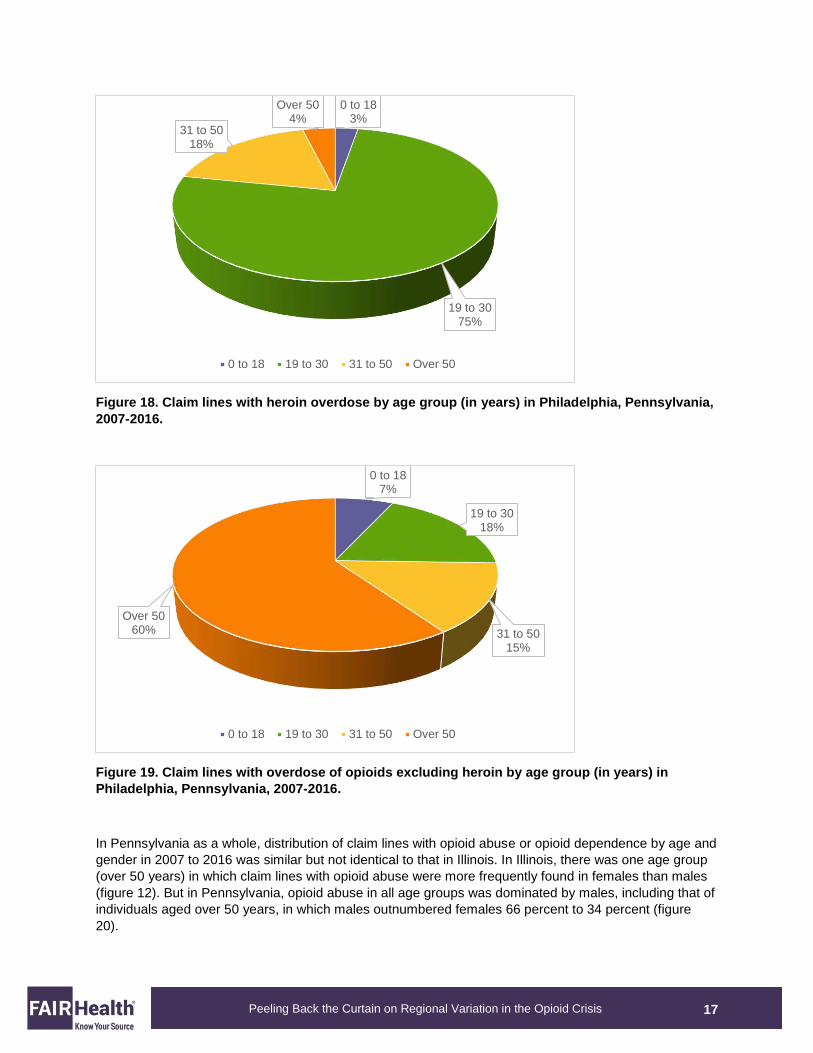
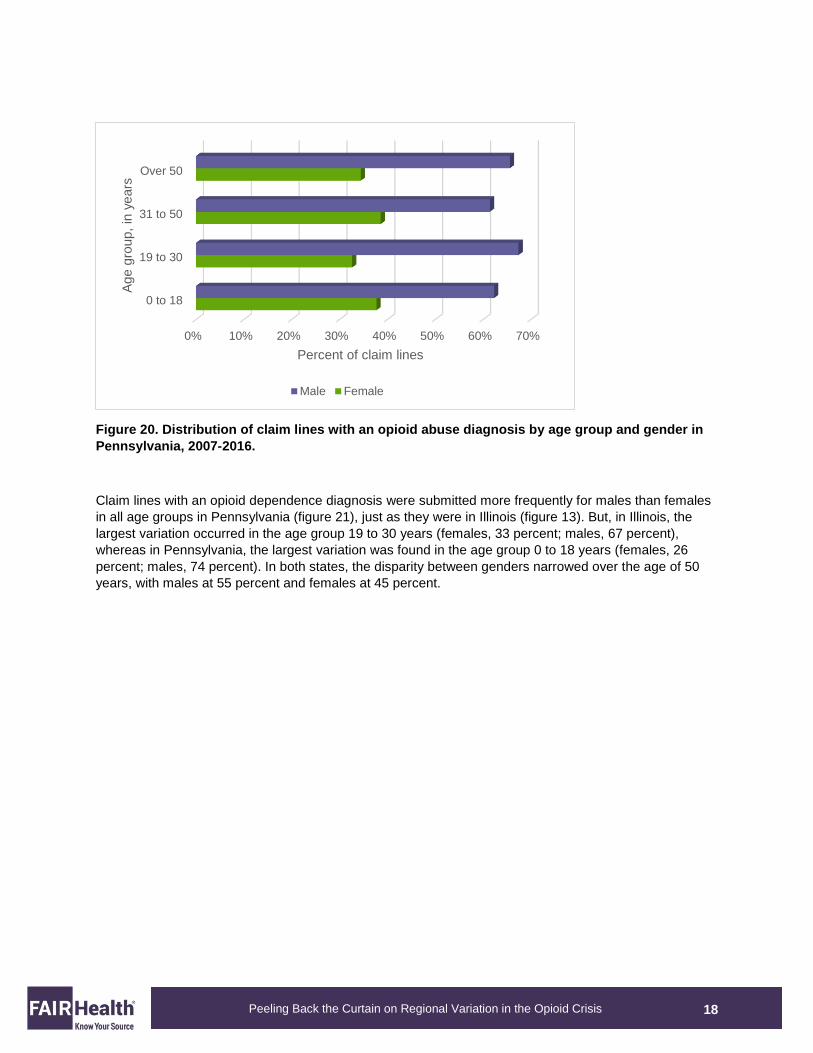
Pennsylvania, in the period 2007 to 2016. Seventy-five percent of the claim lines with heroin overdose
occurred among individuals aged 19 to 30 years (figure 18), but 60 percent of the claim lines with
overdose of opioids excluding heroin occurred among individuals over 50 years (figure 19).
11 The Opioid Crisis among the Privately Insured.
Heroin overdose1.19%
Opioid abuse4.72%
Opioid dependence93.13%
Opioid overdose0.96%
Heroin overdose Opioid abuse Opioid dependence Opioid overdose
17
Peeling Back the Curtain on Regional Variation in the Opioid Crisis
Figure 18. Claim lines with heroin overdose by age group (in years) in Philadelphia, Pennsylvania,
2007-2016.
Figure 19. Claim lines with overdose of opioids excluding heroin by age group (in years) in
Philadelphia, Pennsylvania, 2007-2016.
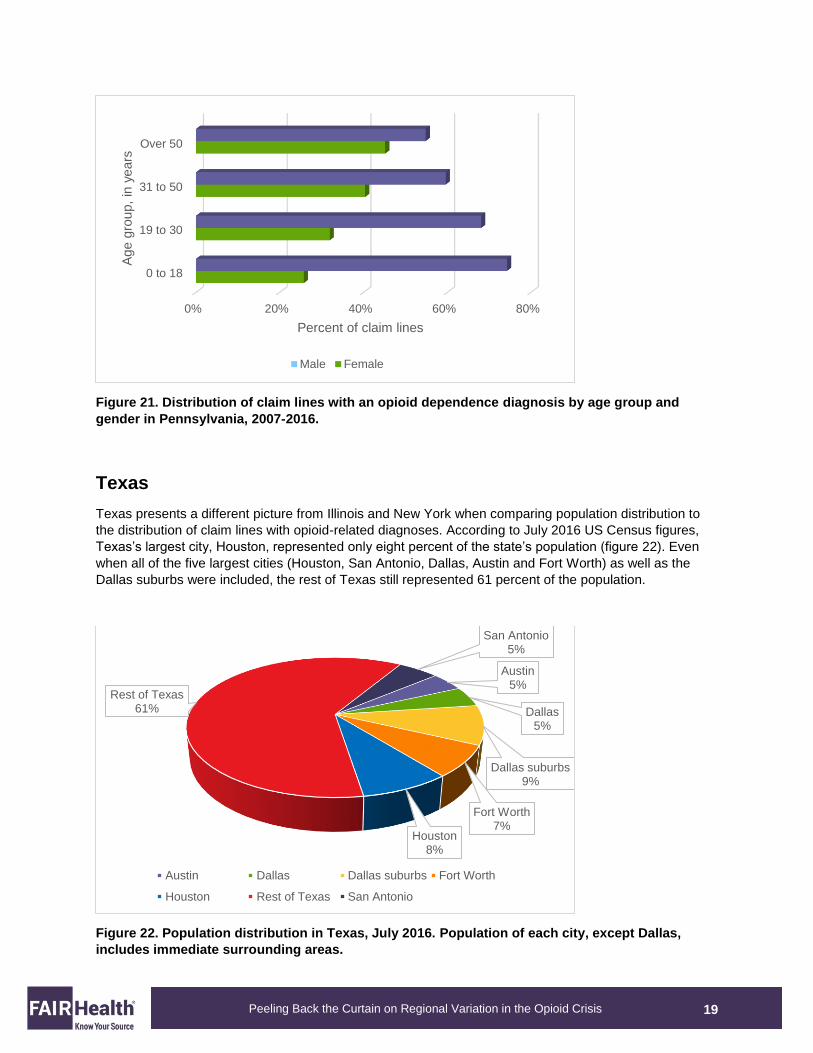
In Pennsylvania as a whole, distribution of claim lines with opioid abuse or opioid dependence by age and
gender in 2007 to 2016 was similar but not identical to that in Illinois. In Illinois, there was one age group
(over 50 years) in which claim lines with opioid abuse were more frequently found in females than males
(figure 12). But in Pennsylvania, opioid abuse in all age groups was dominated by males, including that of
individuals aged over 50 years, in which males outnumbered females 66 percent to 34 percent (figure
20).
0 to 183%
19 to 3075%
31 to 5018%
Over 504%
0 to 18 19 to 30 31 to 50 Over 50
0 to 187%
19 to 3018%
31 to 5015%
Over 5060%
0 to 18 19 to 30 31 to 50 Over 50
18
Peeling Back the Curtain on Regional Variation in the Opioid Crisis
Figure 20. Distribution of claim lines with an opioid abuse diagnosis by age group and gender in
Pennsylvania, 2007-2016.
Claim lines with an opioid dependence diagnosis were submitted more frequently for males than females
in all age groups in Pennsylvania (figure 21), just as they were in Illinois (figure 13). But, in Illinois, the
largest variation occurred in the age group 19 to 30 years (females, 33 percent; males, 67 percent),
whereas in Pennsylvania, the largest variation was found in the age group 0 to 18 years (females, 26
percent; males, 74 percent). In both states, the disparity between genders narrowed over the age of 50
years, with males at 55 percent and females at 45 percent.
0% 10% 20% 30% 40% 50% 60% 70%
0 to 18
19 to 30
31 to 50
Over 50
Percent of claim lines
Age g
roup,
in y
ears
Male Female
19
Peeling Back the Curtain on Regional Variation in the Opioid Crisis
Figure 21. Distribution of claim lines with an opioid dependence diagnosis by age group and
gender in Pennsylvania, 2007-2016.
Texas
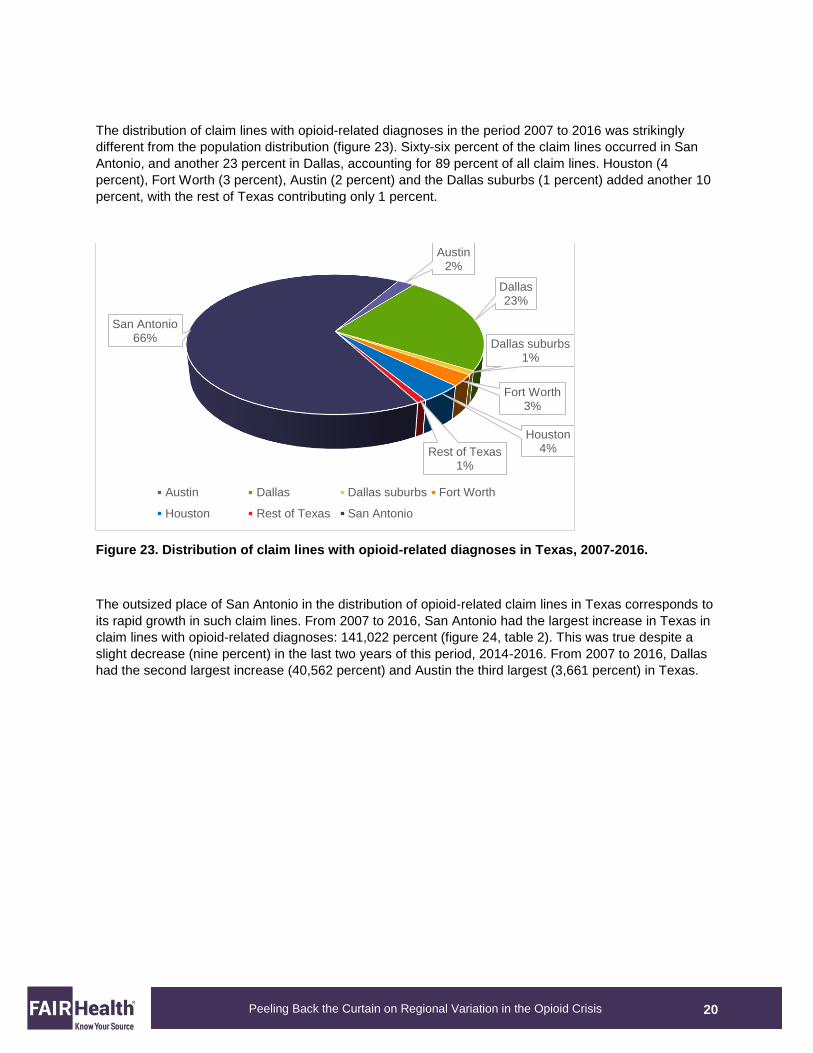
Texas presents a different picture from Illinois and New York when comparing population distribution to
the distribution of claim lines with opioid-related diagnoses. According to July 2016 US Census figures,
Texas’s largest city, Houston, represented only eight percent of the state’s population (figure 22). Even
when all of the five largest cities (Houston, San Antonio, Dallas, Austin and Fort Worth) as well as the
Dallas suburbs were included, the rest of Texas still represented 61 percent of the population.
Figure 22. Population distribution in Texas, July 2016. Population of each city, except Dallas,
includes immediate surrounding areas.
0% 20% 40% 60% 80%
0 to 18
19 to 30
31 to 50
Over 50
Percent of claim lines
Age g
roup,
in y
ears
Male Female
Austin5%
Dallas5%
Dallas suburbs9%
Fort Worth7%
Houston8%
Rest of Texas61%
San Antonio5%
Austin Dallas Dallas suburbs Fort Worth
Houston Rest of Texas San Antonio
20
Peeling Back the Curtain on Regional Variation in the Opioid Crisis
The distribution of claim lines with opioid-related diagnoses in the period 2007 to 2016 was strikingly
different from the population distribution (figure 23). Sixty-six percent of the claim lines occurred in San
Antonio, and another 23 percent in Dallas, accounting for 89 percent of all claim lines. Houston (4
percent), Fort Worth (3 percent), Austin (2 percent) and the Dallas suburbs (1 percent) added another 10
percent, with the rest of Texas contributing only 1 percent.
Figure 23. Distribution of claim lines with opioid-related diagnoses in Texas, 2007-2016.
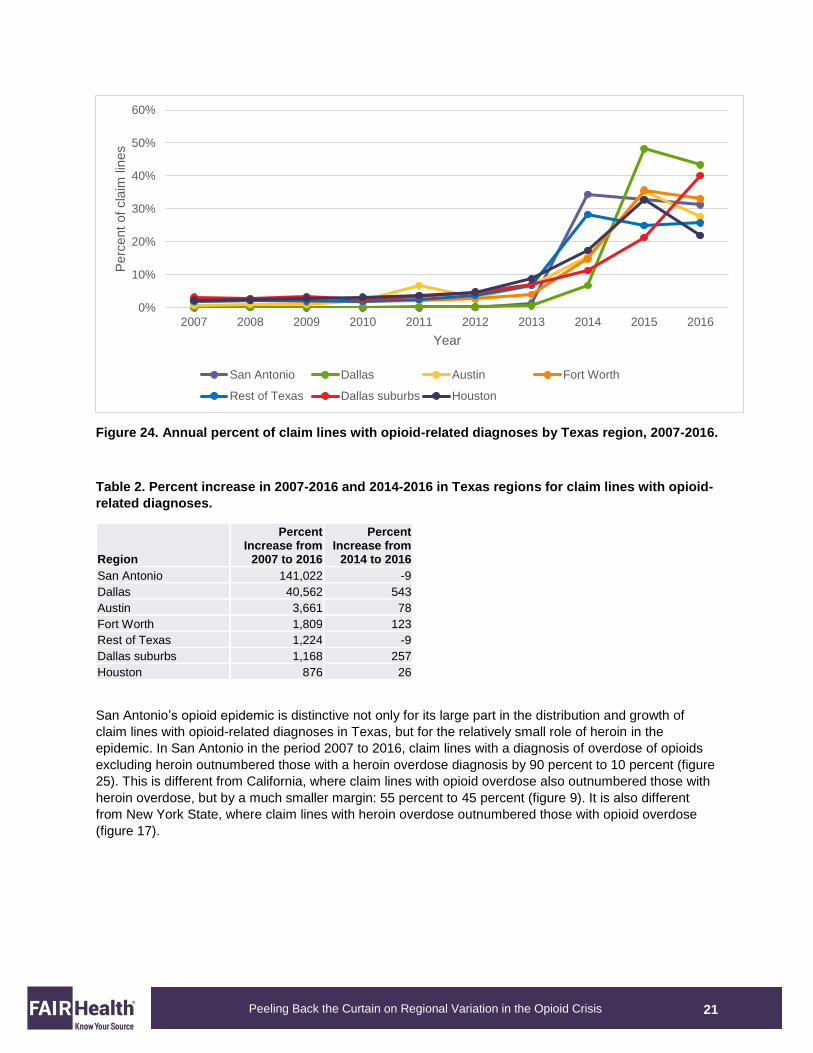
The outsized place of San Antonio in the distribution of opioid-related claim lines in Texas corresponds to
its rapid growth in such claim lines. From 2007 to 2016, San Antonio had the largest increase in Texas in
claim lines with opioid-related diagnoses: 141,022 percent (figure 24, table 2). This was true despite a
slight decrease (nine percent) in the last two years of this period, 2014-2016. From 2007 to 2016, Dallas
had the second largest increase (40,562 percent) and Austin the third largest (3,661 percent) in Texas.
Austin2%
Dallas23%
Dallas suburbs1%
Fort Worth3%
Houston4%Rest of Texas
1%
San Antonio66%
Austin Dallas Dallas suburbs Fort Worth
Houston Rest of Texas San Antonio
21
Peeling Back the Curtain on Regional Variation in the Opioid Crisis
Figure 24. Annual percent of claim lines with opioid-related diagnoses by Texas region, 2007-2016.
Table 2. Percent increase in 2007-2016 and 2014-2016 in Texas regions for claim lines with opioid-
related diagnoses.
Region
Percent Increase from
2007 to 2016
Percent Increase from
2014 to 2016
San Antonio 141,022 -9
Dallas 40,562 543
Austin 3,661 78
Fort Worth 1,809 123
Rest of Texas 1,224 -9
Dallas suburbs 1,168 257
Houston 876 26
San Antonio’s opioid epidemic is distinctive not only for its large part in the distribution and growth of
claim lines with opioid-related diagnoses in Texas, but for the relatively small role of heroin in the
epidemic. In San Antonio in the period 2007 to 2016, claim lines with a diagnosis of overdose of opioids
excluding heroin outnumbered those with a heroin overdose diagnosis by 90 percent to 10 percent (figure
25). This is different from California, where claim lines with opioid overdose also outnumbered those with
heroin overdose, but by a much smaller margin: 55 percent to 45 percent (figure 9). It is also different
from New York State, where claim lines with heroin overdose outnumbered those with opioid overdose
(figure 17).
0%
10%
20%
30%
40%
50%
60%
2007 2008 2009 2010 2011 2012 2013 2014 2015 2016
Perc
ent
of
cla
im lin
es
Year
San Antonio Dallas Austin Fort Worth
Rest of Texas Dallas suburbs Houston
22
Peeling Back the Curtain on Regional Variation in the Opioid Crisis
Figure 25. Distribution of claim lines with opioid overdose and heroin overdose in San Antonio,
Texas, 2007-2016.
Procedures Associated with Opioid-Related Diagnoses
The procedures most commonly associated with opioid-related diagnoses differed in each of the five
states profiled in this study. In 2016, each state had its own distinct set of five most common procedures,
which in turn differed from the five procedures that represented the highest expenditures for that state.
(Expenditures were calculated from providers’ billed charges.) The procedures shed light on how each
state has been handling its opioid epidemic, indicating that they may be pursuing different strategies. The
following figures and tables display these procedures, using either CPT or HCPCS codes.
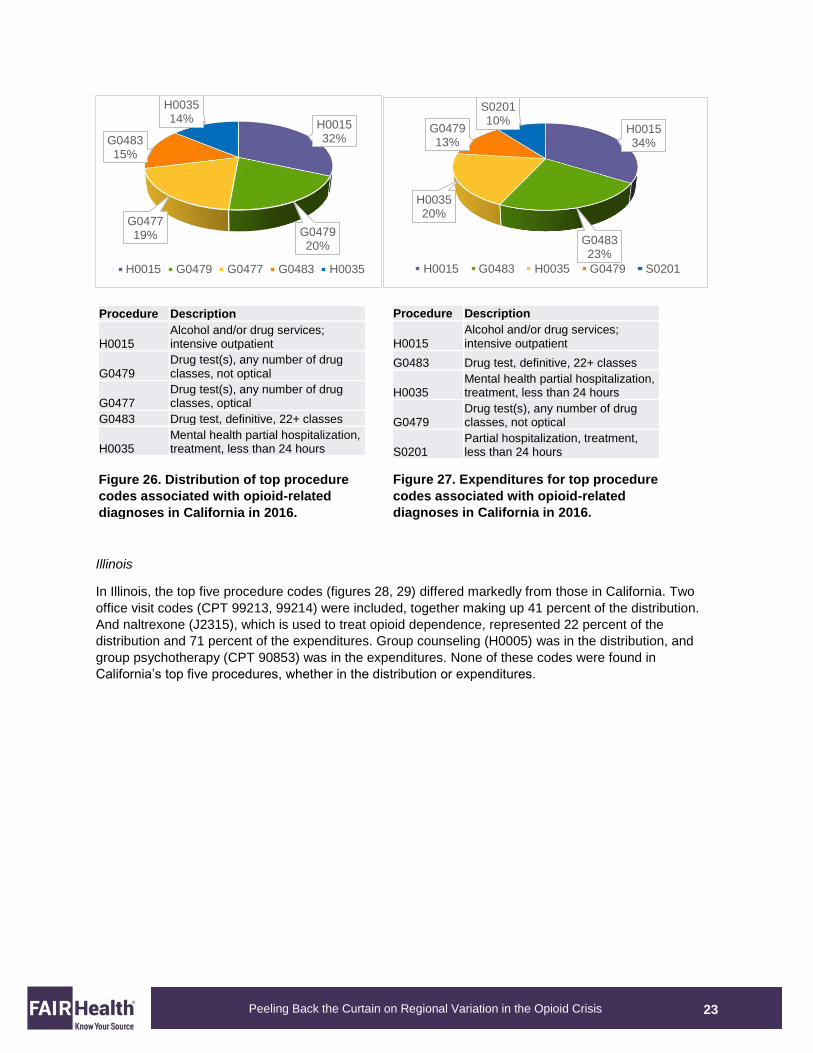
California
In California, the most common procedure codes were for outpatient services and drug tests (figures 26,
27).
Heroin overdose
10%
Opioid overdose90%
Heroin overdose Opioid overdose
23
Peeling Back the Curtain on Regional Variation in the Opioid Crisis
Illinois
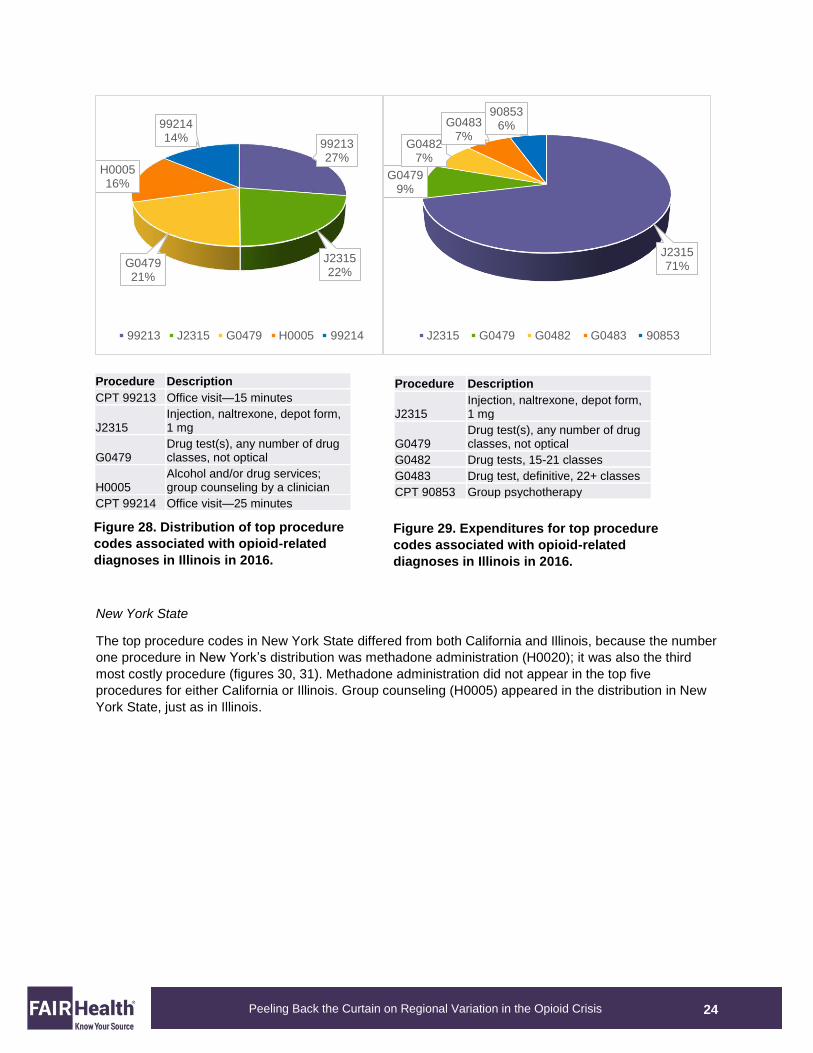
In Illinois, the top five procedure codes (figures 28, 29) differed markedly from those in California. Two
office visit codes (CPT 99213, 99214) were included, together making up 41 percent of the distribution.
And naltrexone (J2315), which is used to treat opioid dependence, represented 22 percent of the
distribution and 71 percent of the expenditures. Group counseling (H0005) was in the distribution, and
group psychotherapy (CPT 90853) was in the expenditures. None of these codes were found in
California’s top five procedures, whether in the distribution or expenditures.
H001532%
G047920%
G047719%
G048315%
H003514%
H0015 G0479 G0477 G0483 H0035
H001534%
G048323%
H003520%
G047913%
S020110%
H0015 G0483 H0035 G0479 S0201
Figure 26. Distribution of top procedure
codes associated with opioid-related
diagnoses in California in 2016.
Figure 27. Expenditures for top procedure
codes associated with opioid-related
diagnoses in California in 2016.
Procedure Description
H0015 Alcohol and/or drug services; intensive outpatient
G0479 Drug test(s), any number of drug classes, not optical
G0477 Drug test(s), any number of drug classes, optical
G0483 Drug test, definitive, 22+ classes
H0035 Mental health partial hospitalization, treatment, less than 24 hours
Procedure Description
H0015 Alcohol and/or drug services; intensive outpatient
G0483 Drug test, definitive, 22+ classes
H0035 Mental health partial hospitalization, treatment, less than 24 hours
G0479 Drug test(s), any number of drug classes, not optical
S0201 Partial hospitalization, treatment, less than 24 hours
24
Peeling Back the Curtain on Regional Variation in the Opioid Crisis
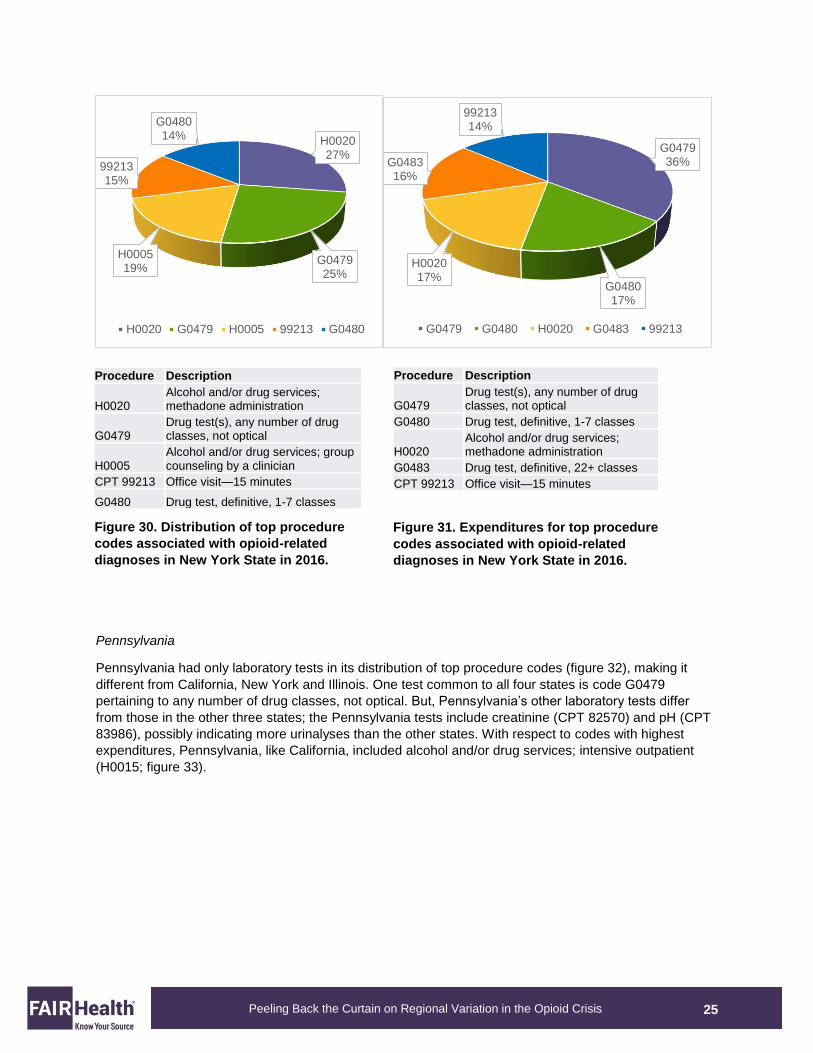
New York State
The top procedure codes in New York State differed from both California and Illinois, because the number
one procedure in New York’s distribution was methadone administration (H0020); it was also the third
most costly procedure (figures 30, 31). Methadone administration did not appear in the top five
procedures for either California or Illinois. Group counseling (H0005) appeared in the distribution in New
York State, just as in Illinois.
9921327%
J231522%
G047921%
H000516%
9921414%
99213 J2315 G0479 H0005 99214
J231571%
G04799%
G04827%
G04837%
908536%
J2315 G0479 G0482 G0483 90853
Procedure Description
J2315 Injection, naltrexone, depot form, 1 mg
G0479 Drug test(s), any number of drug classes, not optical
G0482 Drug tests, 15-21 classes G0483 Drug test, definitive, 22+ classes CPT 90853 Group psychotherapy
Figure 28. Distribution of top procedure
codes associated with opioid-related
diagnoses in Illinois in 2016.
Figure 29. Expenditures for top procedure
codes associated with opioid-related
diagnoses in Illinois in 2016.
Procedure Description CPT 99213 Office visit—15 minutes
J2315 Injection, naltrexone, depot form, 1 mg
G0479 Drug test(s), any number of drug classes, not optical
H0005 Alcohol and/or drug services; group counseling by a clinician
CPT 99214 Office visit—25 minutes
25
Peeling Back the Curtain on Regional Variation in the Opioid Crisis
Pennsylvania
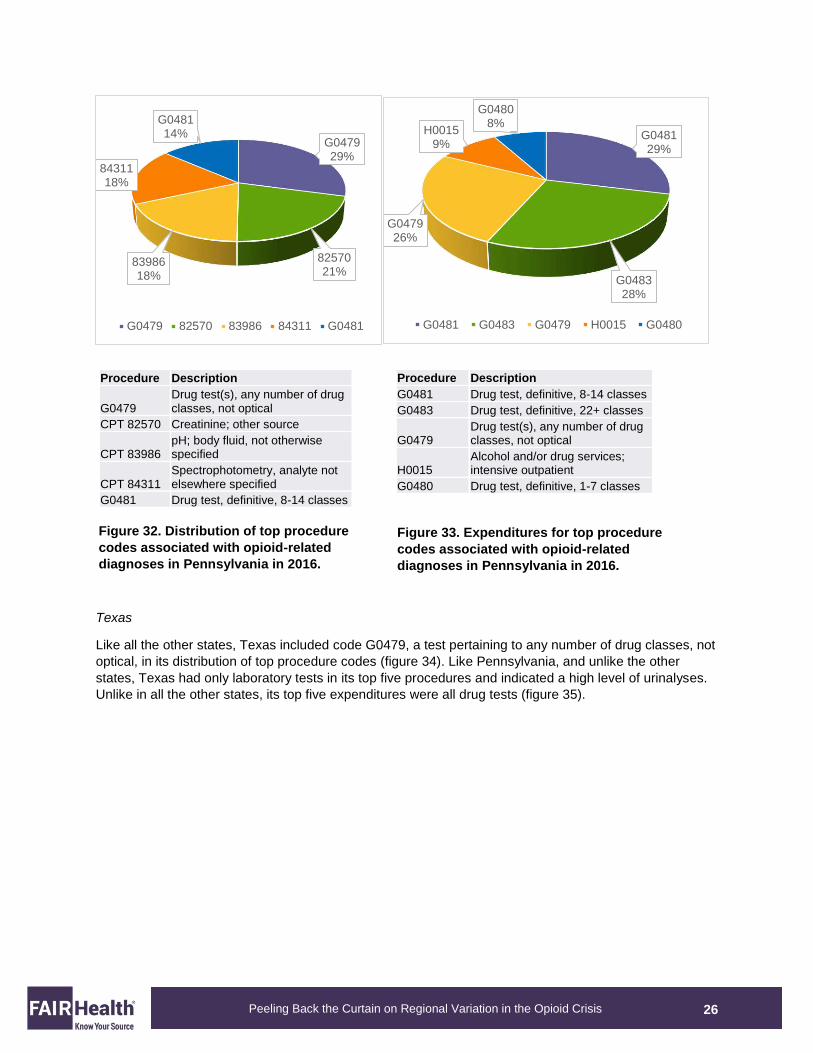
Pennsylvania had only laboratory tests in its distribution of top procedure codes (figure 32), making it
different from California, New York and Illinois. One test common to all four states is code G0479
pertaining to any number of drug classes, not optical. But, Pennsylvania’s other laboratory tests differ
from those in the other three states; the Pennsylvania tests include creatinine (CPT 82570) and pH (CPT
83986), possibly indicating more urinalyses than the other states. With respect to codes with highest
expenditures, Pennsylvania, like California, included alcohol and/or drug services; intensive outpatient
(H0015; figure 33).
H002027%
G047925%
H000519%
9921315%
G048014%
H0020 G0479 H0005 99213 G0480
G047936%
G048017%
H002017%
G048316%
9921314%
G0479 G0480 H0020 G0483 99213
Figure 30. Distribution of top procedure
codes associated with opioid-related
diagnoses in New York State in 2016.
Figure 31. Expenditures for top procedure
codes associated with opioid-related
diagnoses in New York State in 2016.
Procedure Description
H0020 Alcohol and/or drug services; methadone administration
G0479 Drug test(s), any number of drug classes, not optical
H0005 Alcohol and/or drug services; group counseling by a clinician
CPT 99213 Office visit—15 minutes G0480 Drug test, definitive, 1-7 classes
Procedure Description
G0479 Drug test(s), any number of drug classes, not optical
G0480 Drug test, definitive, 1-7 classes
H0020 Alcohol and/or drug services; methadone administration
G0483 Drug test, definitive, 22+ classes CPT 99213 Office visit—15 minutes
26
Peeling Back the Curtain on Regional Variation in the Opioid Crisis
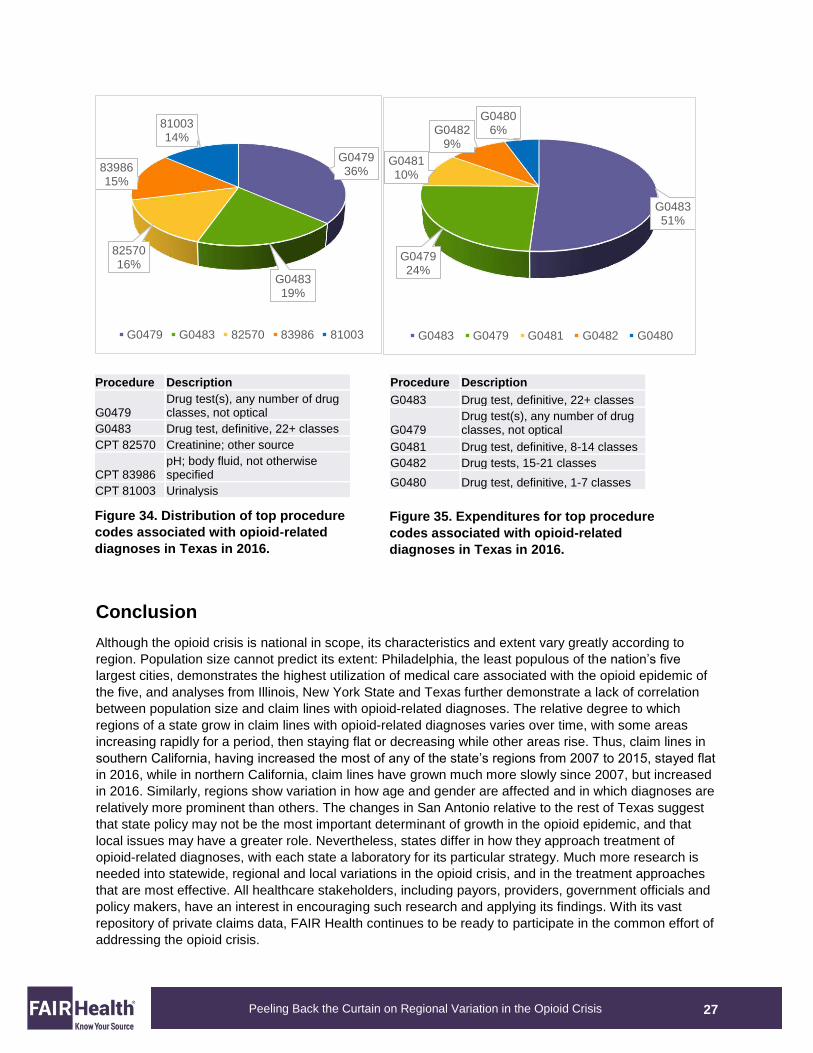
Texas
Like all the other states, Texas included code G0479, a test pertaining to any number of drug classes, not
optical, in its distribution of top procedure codes (figure 34). Like Pennsylvania, and unlike the other
states, Texas had only laboratory tests in its top five procedures and indicated a high level of urinalyses.
Unlike in all the other states, its top five expenditures were all drug tests (figure 35).
G047929%
8257021%
8398618%
8431118%
G048114%
G0479 82570 83986 84311 G0481
G048129%
G048328%
G047926%
H00159%
G04808%
G0481 G0483 G0479 H0015 G0480
Figure 32. Distribution of top procedure
codes associated with opioid-related
diagnoses in Pennsylvania in 2016.
Figure 33. Expenditures for top procedure
codes associated with opioid-related
diagnoses in Pennsylvania in 2016.
Procedure Description
G0479 Drug test(s), any number of drug classes, not optical
CPT 82570 Creatinine; other source
CPT 83986 pH; body fluid, not otherwise specified
CPT 84311 Spectrophotometry, analyte not elsewhere specified
G0481 Drug test, definitive, 8-14 classes
Procedure Description G0481 Drug test, definitive, 8-14 classes G0483 Drug test, definitive, 22+ classes
G0479 Drug test(s), any number of drug classes, not optical
H0015 Alcohol and/or drug services; intensive outpatient
G0480 Drug test, definitive, 1-7 classes
27
Peeling Back the Curtain on Regional Variation in the Opioid Crisis
Conclusion
Although the opioid crisis is national in scope, its characteristics and extent vary greatly according to
region. Population size cannot predict its extent: Philadelphia, the least populous of the nation’s five
largest cities, demonstrates the highest utilization of medical care associated with the opioid epidemic of
the five, and analyses from Illinois, New York State and Texas further demonstrate a lack of correlation
between population size and claim lines with opioid-related diagnoses. The relative degree to which
regions of a state grow in claim lines with opioid-related diagnoses varies over time, with some areas
increasing rapidly for a period, then staying flat or decreasing while other areas rise. Thus, claim lines in
southern California, having increased the most of any of the state’s regions from 2007 to 2015, stayed flat
in 2016, while in northern California, claim lines have grown much more slowly since 2007, but increased
in 2016. Similarly, regions show variation in how age and gender are affected and in which diagnoses are
relatively more prominent than others. The changes in San Antonio relative to the rest of Texas suggest
that state policy may not be the most important determinant of growth in the opioid epidemic, and that
local issues may have a greater role. Nevertheless, states differ in how they approach treatment of
opioid-related diagnoses, with each state a laboratory for its particular strategy. Much more research is
needed into statewide, regional and local variations in the opioid crisis, and in the treatment approaches
that are most effective. All healthcare stakeholders, including payors, providers, government officials and
policy makers, have an interest in encouraging such research and applying its findings. With its vast
repository of private claims data, FAIR Health continues to be ready to participate in the common effort of
addressing the opioid crisis.
G047936%
G048319%
8257016%
8398615%
8100314%
G0479 G0483 82570 83986 81003
G048351%
G047924%
G048110%
G04829%
G04806%
G0483 G0479 G0481 G0482 G0480
Figure 34. Distribution of top procedure
codes associated with opioid-related
diagnoses in Texas in 2016.
Figure 35. Expenditures for top procedure
codes associated with opioid-related
diagnoses in Texas in 2016.
Procedure Description
G0479 Drug test(s), any number of drug classes, not optical
G0483 Drug test, definitive, 22+ classes CPT 82570 Creatinine; other source
CPT 83986 pH; body fluid, not otherwise specified
CPT 81003 Urinalysis
Procedure Description G0483 Drug test, definitive, 22+ classes
G0479 Drug test(s), any number of drug classes, not optical
G0481 Drug test, definitive, 8-14 classes G0482 Drug tests, 15-21 classes G0480 Drug test, definitive, 1-7 classes
28
Peeling Back the Curtain on Regional Variation in the Opioid Crisis
About FAIR Health
FAIR Health is a national, independent, nonprofit organization dedicated to bringing transparency to
healthcare costs and health insurance information through data products, consumer resources and health
systems research support. FAIR Health oversees the nation’s largest collection of healthcare claims data,
which includes a repository of over 23 billion billed medical and dental procedures that reflect the claims
experience of over 150 million privately insured individuals, and separate data representing the
experience of more than 55 million individuals enrolled in Medicare. Certified by the Centers for Medicare
& Medicaid Services (CMS) as a Qualified Entity, FAIR Health receives all of Medicare Parts A, B and D
claims data for use in nationwide transparency efforts. FAIR Health licenses its privately billed data and
data products—including benchmark modules, data visualizations, custom analytics, episodes of care
analytics and market indices—to commercial insurers and self-insurers, employers, hospitals and
healthcare systems, government agencies, researchers and others. FAIR Health has earned HITRUST
CSF and Service Organization Controls (SOC 2) certifications by meeting the rigorous data security
standards of those organizations. As a testament to FAIR Health’s data security and validation protocols,
its data have been incorporated in statutes and regulations around the country and designated as the
official, neutral data source for a variety of state health programs, including workers’ compensation and
personal injury protection (PIP) programs. FAIR Health data serve as an official reference point in support
of certain state balance billing laws that protect consumers against bills for surprise out-of-network and
emergency services. FAIR Health also uses its database to power a free consumer website available in
English and Spanish and as an English/Spanish mobile app, which enable consumers to estimate and
plan their healthcare expenditures and offer a rich educational platform on health insurance. The website
has been honored by the White House Summit on Smart Disclosure, the Agency for Healthcare Research
and Quality (AHRQ), URAC, the eHealthcare Leadership Awards, appPicker, Employee Benefit News
and Kiplinger’s Personal Finance. FAIR Health also is named a top resource for patients in Elisabeth
Rosenthal’s new book, An American Sickness: How Healthcare Became Big Business and How You Can
Take It Back. For more information on FAIR Health, visit fairhealth.org.
FAIR Health, Inc. 530 Fifth Avenue, 18th Floor New York, NY 10036 212-370-0704 fairhealth.org
fairhealthconsumer.org
consumidor.fairhealth.org
Copyright 2017, FAIR Health, Inc. All rights reserved.