Embed Size (px)
Citation preview
PPEEEERR
2002 PEER Annual Meeting
PEER 2002 Annual Meeting
Practical Application of the PEER
Limit State Checking Methodolgy
Allin Cornell with F. Jalayer, M. Motahari,
D. Vamvatsikos, and P. Bazzurro Stanford University
Based on Results from a PEER Core Project and
PEER/PG&E Lifelines Project
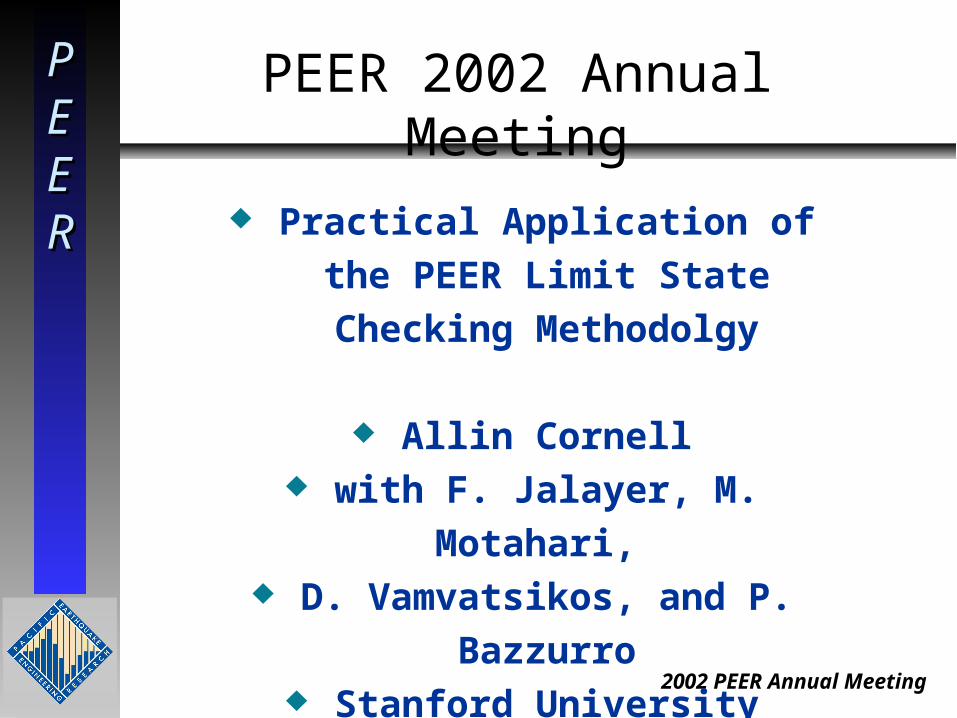
PBEE Limit State OptionsPBEE Limit State Options
Current (FEMA 273):Current (FEMA 273): Several Performance Several Performance Levels and Tolerable Levels and Tolerable Ground MotionGround Motion Probabilities Probabilities
Several Performance Levels and Tolerable Several Performance Levels and Tolerable Performance StatePerformance State Probabilities in “LRFD-like” Form Probabilities in “LRFD-like” Form
CD CSS|D fPa
a⋅φ≤⋅γ
0
PEER PROPOSALPEER PROPOSAL
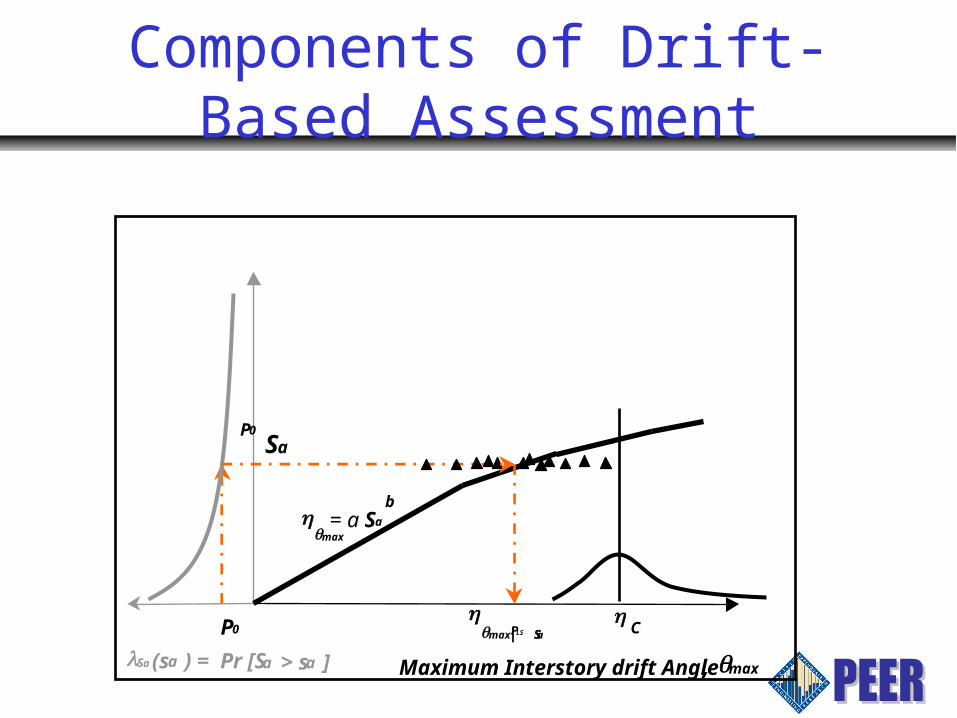
Components of Drift-Based Assessment
, max Sa(sa a > sa ]
= a Sa b
0
S 0
max
| sa PLS C
Maximum Interstory drift Angle) = Pr [S
P
aP
max

The Safety Checking Equation
CD CSS|D fPa
a⋅φ≤⋅γ
0
]b
kexp[
a
a
S|D
S|D
2
2β
=γ
]b
kexp[
C
C
2
2β
=φ
Median
CapacityMedian Demand
under records with
Sa at hazard level Pfo
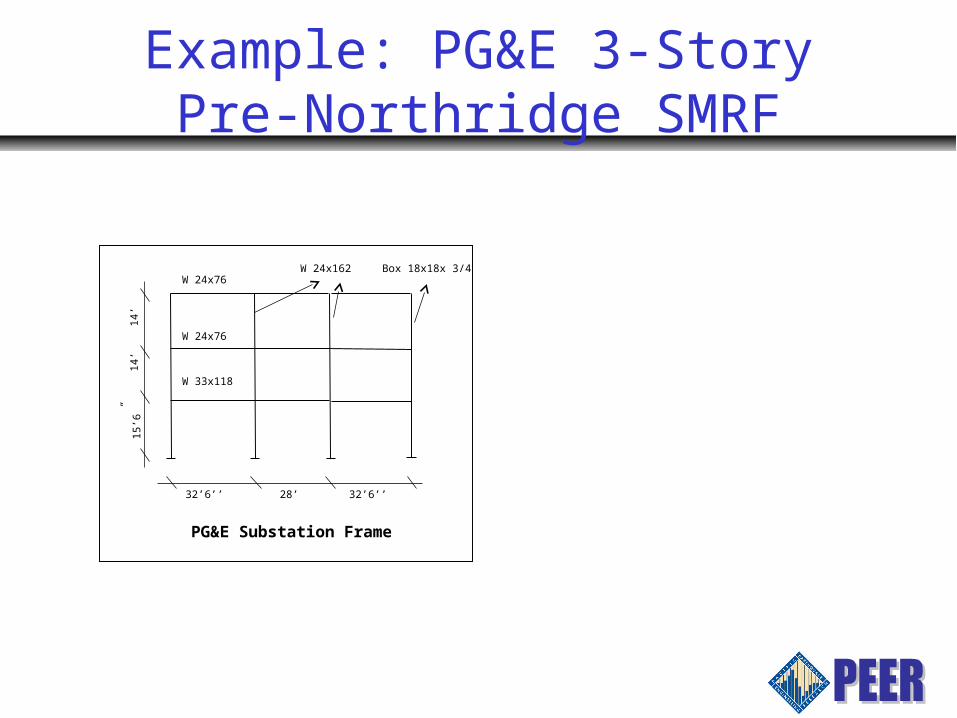
Example: PG&E 3-Story Pre-Northridge SMRF
32’6’’32’6’’ 28’
14’
14’
W 24x76
W 24x76
Box 18x18x 3/4
W 33x118
PG&E Substation Frame
15’6
”
W 24x162
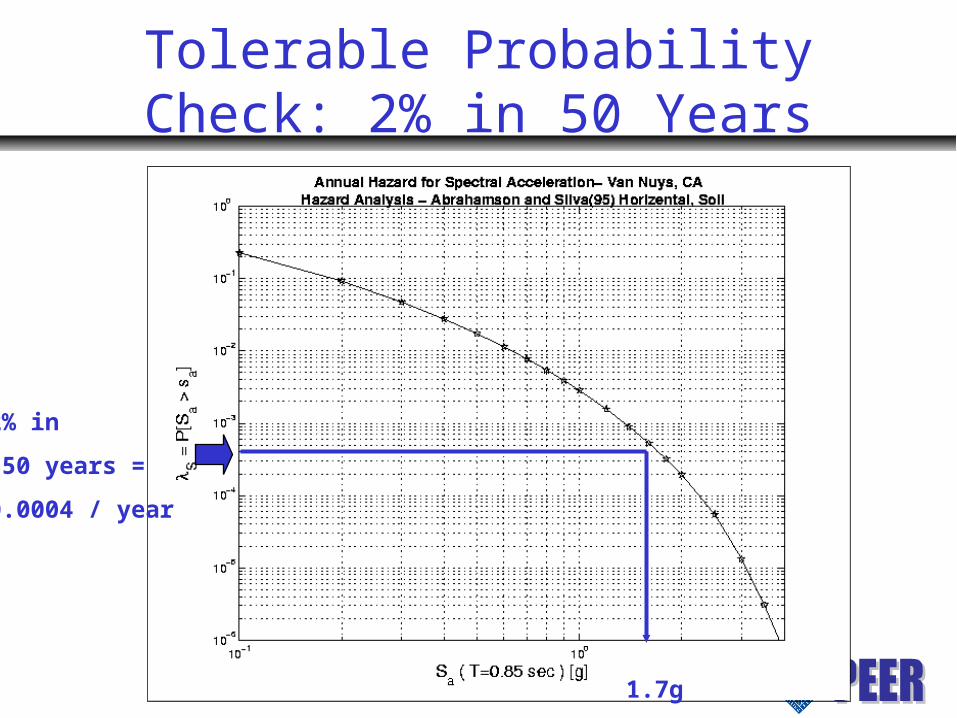
Tolerable Probability Check: 2% in 50 Years
2% in
50 years =
0.0004 / year
1.7g
DS1DS2
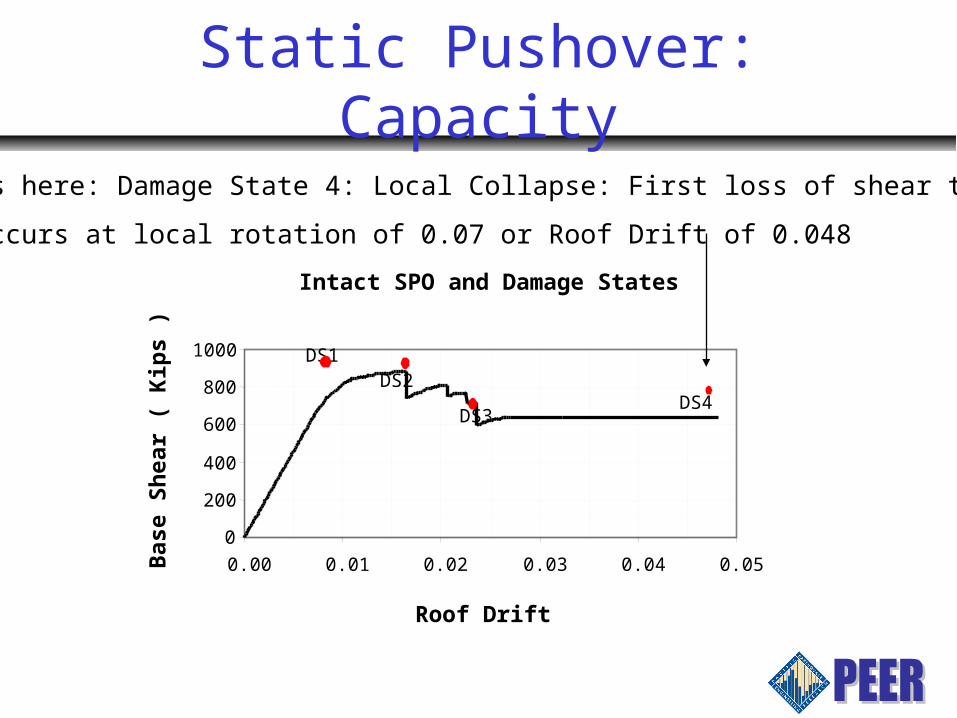
Static Pushover: Capacity
Intact SPO and Damage States
0
200
400
600
800
1000
0.00 0.01 0.02 0.03 0.04 0.05
Roof Drift
Bas
e S
hea
r (
Kip
s )
DS3DS4
Focus here: Damage State 4: Local Collapse: First loss of shear tab
It occurs at local rotation of 0.07 or Roof Drift of 0.048
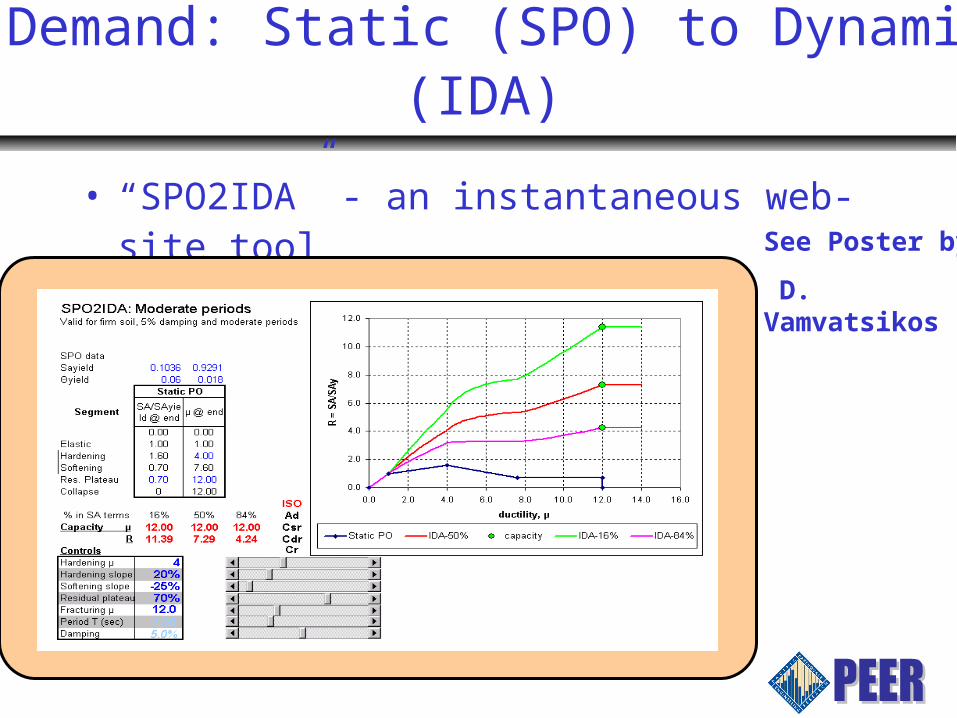
Demand: Static (SPO) to Dynamic (IDA)
• “SPO2IDA” - an instantaneous web-site tool See Poster by
D. Vamvatsikos

Roof Drift ( % )
Median
2.7%
84th %-tile
4.0%
BetaD =
ln (4/2.7)=
0.39
Dynamic Demand Results for This Structure
0.0
0.5
1.0
1.5
2.0
2.5
0.0 1.0 2.0 3.0 4.0 5.0
Sa
( g
) 1.7
Intact SPO
Median IDA 84% IDASa = 1.7 g

Limit State Safety Check
CD CSS|D fPa
a⋅φ≤⋅γ
0
)yearsin%(.P:Conclusion
..:OKCheck
%.%).)(.(C
%.%).)(.(D
.]).(exp[]b
kexp[
.]).(exp[]b
kexp[
b;k
%.C
%.D
fo
C
SD
Sa|DD
CC
S
Pfoa
Pfoa
502000404354
5484940
4372251
25139023
2
9402023
2
1384
72
22
22
<>
==φ
==γ
==β=γ
=−=β=φ
≈≈=
=
241241 241241 241241
157157
105105
105105
105105
106106
105105
105105
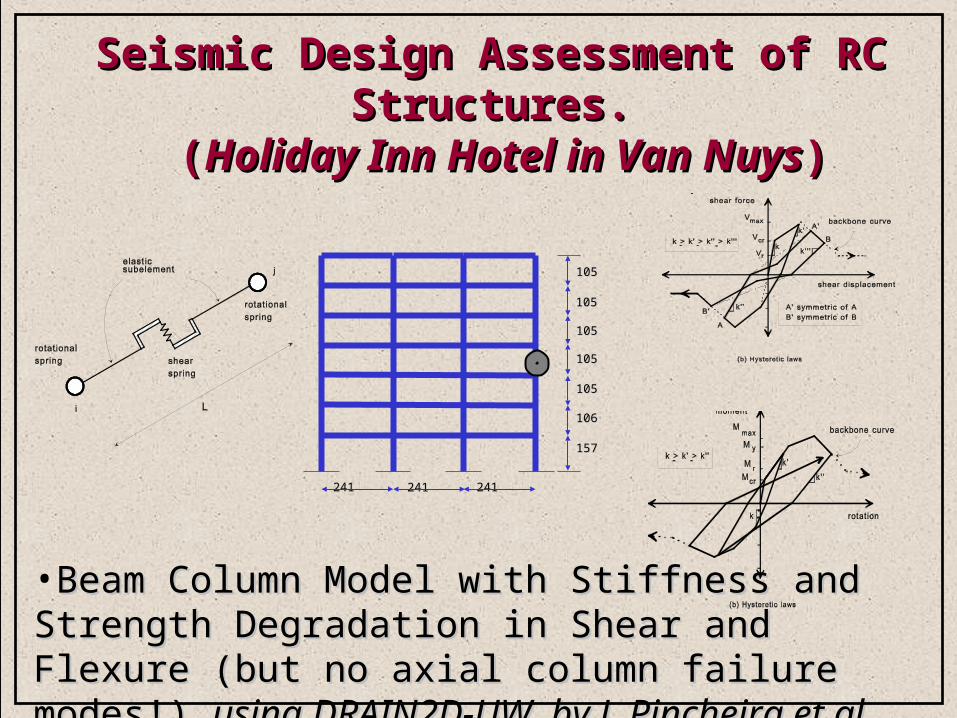
•Beam Column Model with Stiffness and Beam Column Model with Stiffness and Strength Degradation in Shear and Flexure Strength Degradation in Shear and Flexure (but no axial column failure modes!) (but no axial column failure modes!) using using DRAIN2D-UW by J. Pincheira et al.DRAIN2D-UW by J. Pincheira et al.
Seismic Design Assessment of RC Seismic Design Assessment of RC Structures.Structures.
( (Holiday Inn Hotel in Van NuysHoliday Inn Hotel in Van Nuys))
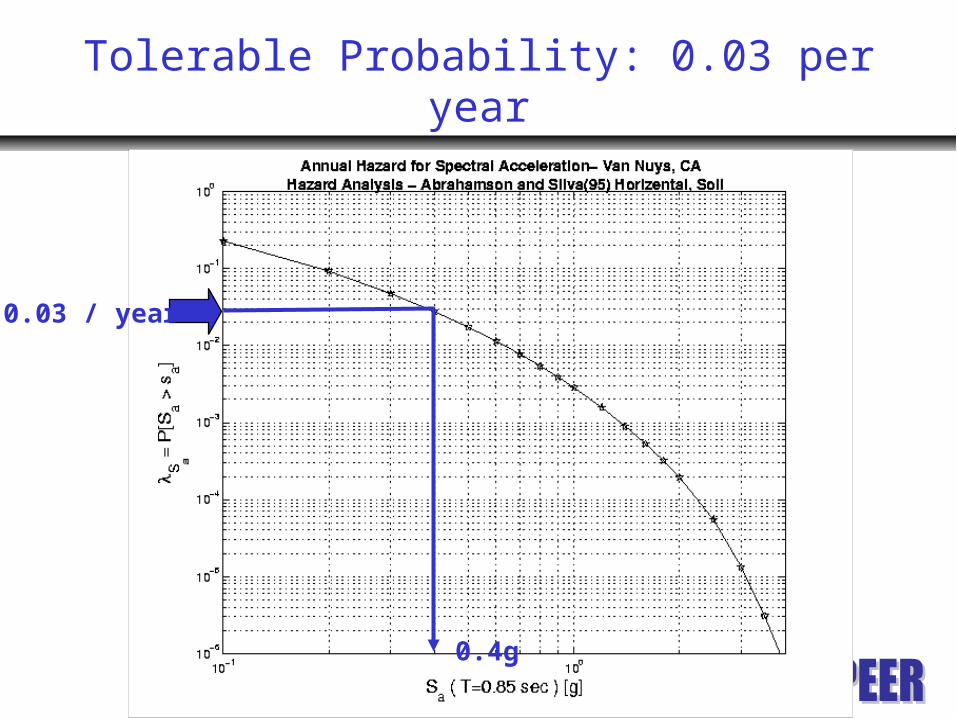
Tolerable Probability: 0.03 per year
0.4g
0.03 / year
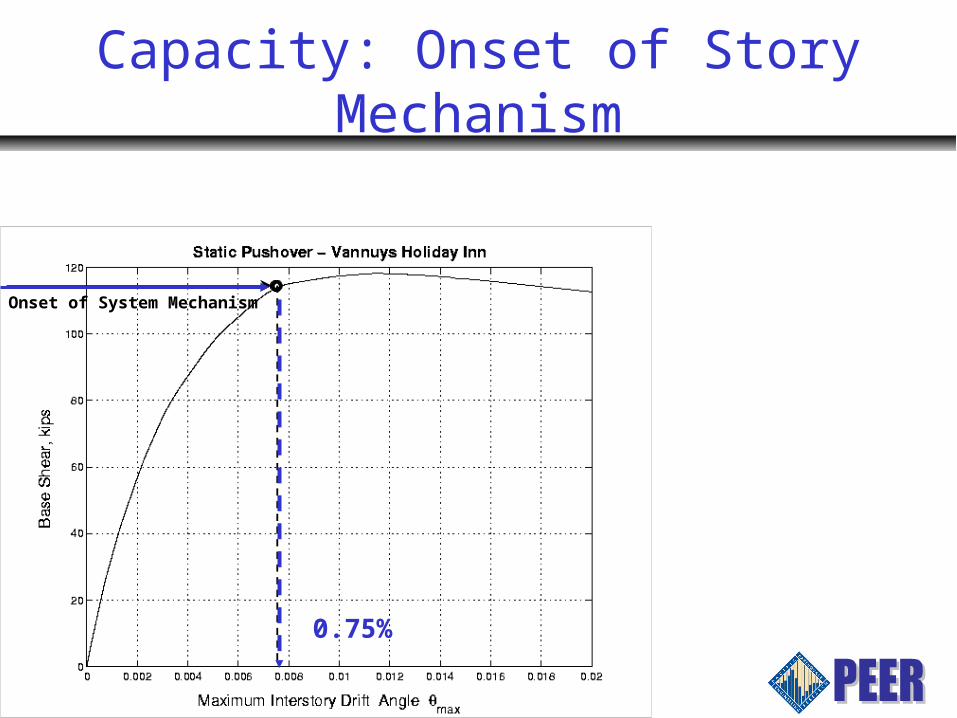
Capacity: Onset of Story Mechanism
Onset of System Mechanism
0.75%

Van Nuys: Drift Demand (via NLD Analysis)
SSaa==00..4400 ggPP00
39.040.0|max==aSβ
0046.0ˆ 40.0|max==aS
O.4g
Median: 0.46%
Dispersion; 0.39
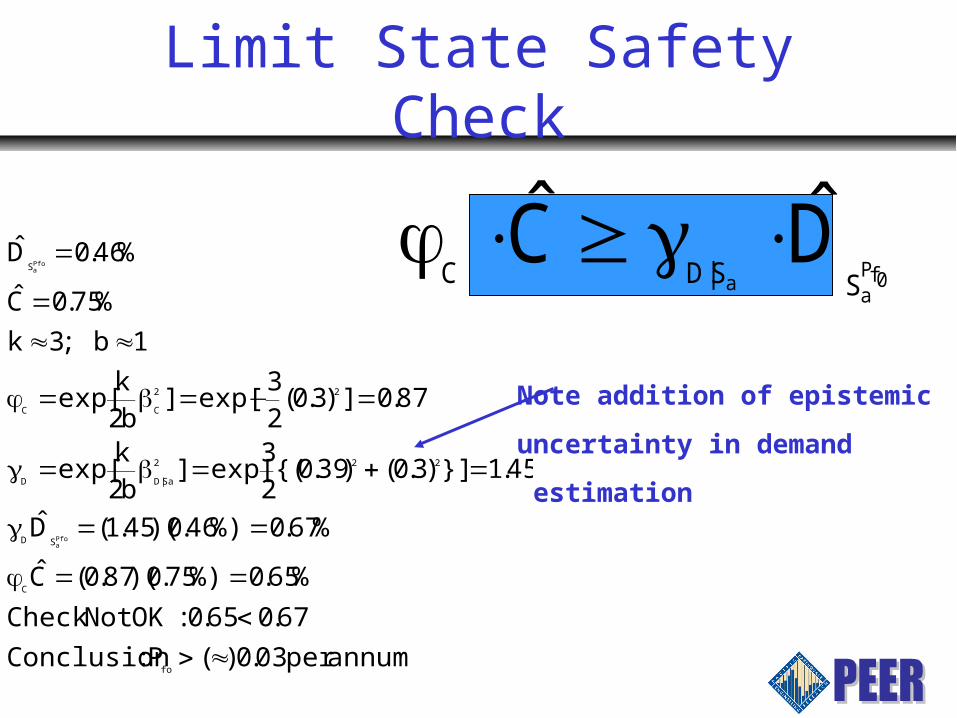
Limit State Safety Check
0fPa
a SS|DCDC ⋅γ≥⋅φ
annumper.)(P:Conclusion
..:OKNotCheck
%.%).)(.(C
%.%).)(.(D
.}]).().{(exp[]b
kexp[
.]).(exp[]b
kexp[
b;k
%.C
%.D
fo
C
SD
Sa|DD
CC
S
Pfoa
Pfoa
030670650
650750870
670460451
4513039023
2
8703023
2
13750
460
222
22
≈><==φ
==γ
=+=β=γ
=−=β=φ
≈≈=
=
Note addition of epistemic
uncertainty in demand
estimation
PPEEEERR
2002 PEER Annual Meeting
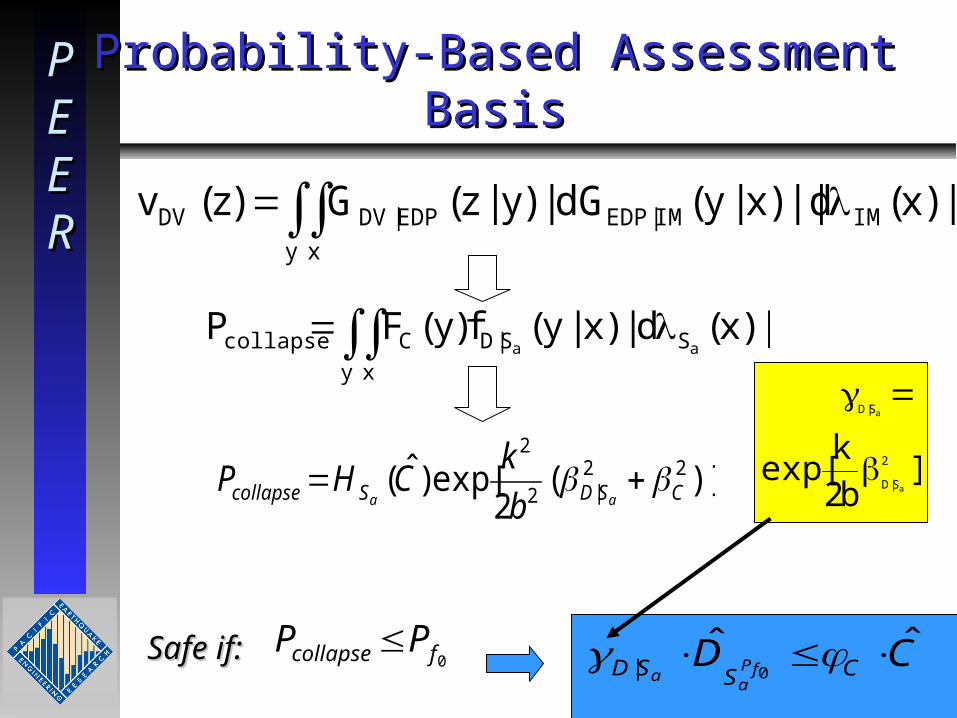
Probability-Based Assessment BasisProbability-Based Assessment Basis
∫∫ =y x
SS|DCcollapse |)x(d|)x|y(f)y(FPaa
∫∫ =y x
IMIM|EDPEDP|DVDV |)x(d||)x|y(dG|)y|z(G)z(v
0fcollapse PP ≤Safe if:Safe if: CD CSSD fPa
a
ˆˆ0| ⋅≤⋅ φγ
)](2
exp[)ˆ( 22|2
2
CSDScollapse aa b
kCHP ββ += ]
b
kexp[
a
a
S|D
S|D
2
2β
=γ
Notes
For Codified Versions Some of These Demand and Capacity Betas
Might be Tabulated
The Estimation of Epistemic Uncertainties Demands Good Judgement
In the PEER/PG&E Buildings Fragility Project we are
Taking a Slightly Different Tact Based on the Same Methods.
The Objective is to Establish the Likelihoods of the Building
Being Yellow or Red Tagged