Embed Size (px)
Citation preview

RESEARCH ARTICLE
PEER INFLUENCE IN THE DIFFUSION OF IPHONE 3GOVER A LARGE SOCIAL NETWORK1
Miguel Godinho de MatosHeinz College, Carnegie Mellon University, Pittsburgh, PA 15213-3890 U.S.A. {[email protected]} and
Católica Lisbon School of Business and Economics, Palma de Cima, 1649-023 Lisbon, PORTUGAL
Pedro FerreiraHeinz College and Department of Engineering and Public Policy, Carnegie Mellon University,
Pittsburgh, PA 15213-3890 U.S.A. {[email protected]}
David KrackhardtHeinz College, Carnegie Mellon University, Pittsburgh, PA 15213-3890 U.S.A. {[email protected]}
In this paper, we study the effect of peer influence in the diffusion of the iPhone 3G across a number of commu-nities sampled from a large dataset provided by a major European Mobile carrier in one country. We identifytight communities of users in which peer influence may play a role and use instrumental variables to controlfor potential correlation between unobserved subscriber heterogeneity and friends’ adoption. We provideevidence that the propensity of a subscriber to adopt increases with the percentage of friends who have alreadyadopted. During a period of 11 months, we estimate that 14 percent of iPhone 3Gs sold by this carrier weredue to peer influence. This result is obtained after controlling for social clustering, gender, previous adoptionof mobile Internet data plans, ownership of technologically advanced handsets, and heterogeneity in theregions where subscribers move during the day and spend most of their evenings. This result remains quali-tatively unchanged when we control for changes over time in the structure of the social network. We provideresults from several policy experiments showing that, with this level of effect of peer influence, the carrierwould have hardly benefitted from using traditional marketing strategies to seed the iPhone 3G to benefit fromviral marketing.
Keywords: Peer influence, homophily, diffusion, community identification, viral marketing
Introduction1
The pervasiveness of simple, small, and light handsetschanged the way people communicate. The worldwide pene-tration of mobile handsets grew from 12 percent in 2000 to 87
percent in 2011 (ITU 2011). Smartphones accounted for asignificant part of this growth. Their penetration was 65 per-cent in the United States, 50 percent in Europe, and 29 per-cent worldwide in 2011 (Vakulenko 2011). The mobilehandset market is expected to reach $340 billion in revenuesby 2015. Smartphones are expected to account for 75 percentof this revenue, thus growing 24 percent per year on averagebetween 2010 and 2015. In recent years, handsets havebecome small computers. Accordingly, their value has shiftedtoward the software and the data services they provide (TheEconomist 2011). Manufacturers increasingly are bundling
1Ravi Bapna was the accepting senior editor for this paper. Sanjukta Smithserved as the associate editor.
The appendices for this paper are located in the “Online Supplements”section of the MIS Quarterly’s website (http://www.misq.org).
MIS Quarterly Vol. 38 No. 4, pp. 1103-1133/December 2014 1103
Godinho de Matos et al./Peer Influence in a Large Social Network
handsets with applications that generate positive networkexternalities. Examples include FaceTime and Google Talk,which allow consumers to video-call over the Internet at nocost. However, FaceTime requires an Apple device andGoogle Talk or a handset running Android. Hence, the utilityderived from using these applications, and therefore the utilityassociated with the respective handsets, increases with thenumber of people that use them. The seminal works byRohlfs (1974) and Katz and Shapiro (1986) show how thenumber of consumers buying a product may generate positivenetwork externalities leading to the well-known S-shapedcurve. This has been empirically demonstrated in severalinstances such as automatic teller machines (Saloner andShepard 1995) and spreadsheet software (Brynjolfsson andKemerer 1996). However, in the case of mobile commu-nication products, and from the perspective of an individual,who adopts the product is likely to be as important, if notmore, as how many people adopt because it is the exposure tothese products through friends that may significantly reduceuncertainty and trigger adoption.2 Yet, the role of peer influ-ence in the diffusion of telecommunication products has notbeen largely explored. Exceptions include the study of video-conferencing (Tucker 2008), applications for personalizednews (Aral et al.,2009) and caller ring back tones (Ma et al.2010).
The penetration of handsets has been measured per brand andper country (Botelho and Pinto 2004; Doganoglu and Grzy-bowski 2007; Gruber 2001) but the specific mechanisms bywhich they diffuse have not been studied in detail. However,handsets are fundamental devices in the telecommunicationsindustry. They are the gateways by which consumers talk toeach other and obtain access to information. The whole busi-ness of cell phone operators relies on spreading handsetsacross consumers. If peer influence shapes handset sales,then carriers must place significant care and effort in targetingthe right early adopters while reaching critical mass. If, onthe other hand, the effect of peer influence is only small, thencarriers are likely better off with mass marketing campaignsinstead of targeted advertising.
Diffusion denotes the dissemination of a trait, product, orservice within a social system (Strang and Soule 1998). Thesocial system comprises the set of individuals, groups, andinstitutions that might adopt the innovation. The members of
the social system use communication channels, such as face-to-face meetings, phone conversations and email messages, toexchange information about the innovation being diffused(Mahajan 1985, p. 7). Diffusion can be caused by externalinfluence, by mechanisms internal to the social system, or byboth. External triggers include, for example, policy require-ments (Mahajan 1985, p. 15; Valente 1996a, p. 95) and massmedia (Valente 1996a, p. 81). Internal mechanisms relatemostly to how one’s adoption depends on the behavior of theother members of the social system. In this context, peerinfluence arises as the dyadic process by which an individualshapes her behavior, beliefs, or attitudes according to what theother individuals in the social system think, express, or howthey behave (Leenders 2002).3
A number of studies use randomized experiments to identifythe effect of peer influence. Aral and Walker (2011) showevidence of contagious adoption of a Facebook applicationthat allows users to share comments related to the movieindustry. They seed the application to about 10,000 users andobserve viral messaging. Bapna and Umyarov (2014) useLast.fm, a music-sharing website. They award free premiumsubscriptions to a random set of users and show that beingconnected to users that subscribe to the premium serviceincreases the likelihood of acquiring this service. Mostresearch on peer influence to date studies the diffusion ofcheap, or even free, digital goods. However, it is not clearhow the results found in these studies extend to settings inwhich consumers have to risk money to purchase physicalproducts. While sometimes a good sold at a higher price isperceived as being better (McConnell 1968; Shiv et al. 2005;Stafford and Enis 1969), in other instances free goods mayseem superior (Shampanier et al. 2007). It is, therefore,unclear how price determines consumption and, moreimportantly, how price mediates the effect of peer influence.
Empirical evidence on how information from friends mayshape the consumption of costly goods is still lacking. Thisis not surprising because it is difficult to run randomizedexperiments with costly goods. On one hand, consumerswould likely need to be compensated for the money theyspend. On the other hand, it is hard to design such experi-ments in dense network settings in which treated and control
2Peer influence has been shown to play a significant role in many different contexts such as academic performance (Boucher et al. 2010; Carrell et al.2009; Sacerdote 2001), smoking and drinking behavior (Case and Katz 1991;Mercken et al. 2010), sexual conduct (Romer et al. 1994), trade unions(Hedström 1994), vaccinations (Rao et al. 2007), new drugs (Burt 1987;Coleman et al. 1966; Strang and Tuma 1993; Valente 1996a) and electronichealth records (Zheng et al. 2010).
3A broad range of mechanisms can drive peer influence (Leenders 2002;Strang and Soule 1998; Van den Bulte and Lilien 2001), such as informationtransfer (when individuals get to know about the innovation through previousadopters; Katz and Lazarsfeld 1955), competition (when individuals look attheir rivals as frames of reference), conformity (when individuals complywith the behavior and attitudes of the groups to which they belong; Menzel1960), network externalities (when the utility of adopting an innovation increases with the number of adopters; Katz and Shapiro 1994), and spatialproximity (the fact that geographical proximity facilitates all types of inter-actions across individuals; Strang and Soule 1998).
1104 MIS Quarterly Vol. 38 No. 4/December 2014
Godinho de Matos et al./Peer Influence in a Large Social Network
individuals connect, potentially contaminating results (Araland Walker 2011). In these settings, a promising course ofaction might be to try to tease out the effect of peer influencefrom observational data (Aral 2010; Aral et al. 2009). This,however, is also hard to accomplish (Manski 1993; Van denBulte and Lilien 2001). Difficulties arise, for example, whenone cannot identify the group to which each individualbelongs. Today’s increased ability to collect data that cap-tures the structure of the relationships among people faci-litates identifying these groups (Wasserman and Faust 1994). Yet, collecting such data is expensive and only a handful ofstudies, such as Anagnostopoulos et al. (2008) and Aral et al.(2009), did so in large, real-world settings. In addition, theseauthors primarily look only at cheap digital goods.
Another difficulty in observational studies arises whenunobserved heterogeneity across individuals that influencesbehavior also influences the formation of social ties (Aral etal. 2009). Peer effects models (Bramoulle et al. 2009;Oestreicher-Singer and Sundararajan 2012) and matching inhigh resolution panels (Aral et al. 2009) have been used tocontrol for such unobservables. Other approaches includeusing structural models (Ma et al. 2010), propensity scorematching (Aral et al. 2009), randomization (Anagostopouloset al. 2009), and instrumental variables (Tucker 2008). Interestingly, identifying groups of users and controlling forhomophily are deeply interconnected. In fact, homophilysuggests that social networks develop around groups ofindividuals that share similar unobserved traits, often calledcommunities in the literature (Leskovec et al. 2009; Newman2006). Therefore, controlling for community structure mayhelp alleviate concerns with unobserved homophily (Shaliziand Thomas 2011). In particular, community membershipmay capture part of the unobservables that determine networkstructure, reducing the scope for unobserved characteristicsthat influence behavior and determine the formation of tiesacross individuals. Once communities of users have beenidentified, one can also use stochastic agent-based models todescribe the coevolution of adoption and of the formation ofsocial ties within and between communities (Snijders et al.2010). These models can also help separate the contributionof homophily and peer influence for the diffusion of aninnovation across a social system.
Our paper is an observational study aimed at characterizingthe diffusion of the iPhone 3G in a large social network. Wehypothesize that the likelihood of an individual adopting thishandset is associated with her level of exposure to it (Valente1996a) through her friends (Leenders 2010; Valente 1996b).This idea is in line with the arguments of Rogers (1995)whereby interactions between non-adopters and adoptersmitigate the risk and uncertainty associated with the innova-tion, increasing the likelihood of adoption. As such, our
paper contributes to the set of IS literature that identifies peereffects in the adoption of technology in several new ways.
First, we study the effect of peer influence with a costlyphysical good. This complements the current literaturelooking at peer influence with cheap digital goods. Second,we do so in the context of a large social network from whichwe identify tight communities of individuals. In particular,we develop a new algorithm to identify communities withadopters when adoption is a rare event. This algorithm mayinspire other researchers to study influence with costly goods,in which case adoption is likely to be limited. Third, wecombine community identification with instrumental variablesto identify the effect of peer influence. We also use agent-based modeling to measure this effect with a time-varyingsocial network. Finally, we provide results from policy simu-lations characterizing the virality of this handset.4
We use a large dataset from a major European mobile carrierin one country, hereinafter called EuroMobile, to identify theeffect of peer influence in the diffusion of the iPhone 3G.This is an expensive handset in the country analyzed andtherefore it is unclear whether peer influence can affect itssales. We analyze call detailed records (CDRs) fromthousands of users, their friends, and friends of their friends,between August 2008 and June 2009 to model their socialnetwork. We then explore the structure of this social networkto identify the effect of peer influence. We combine com-munity identification (Newman and Girvan 2004) withinstrumental variables to alleviate endogeneity concerns. Inparticular, we instrument friends’ adoption with the adoptionof the friends of friends that are not friends of the ego and thatlive in a city different from that where the ego does to alle-viate endogeneity concerns. We also use stochastic agent-based models (Snijders et al. 2010) to look at how theevolution of the social network over time correlates to theadoption of the iPhone 3G.
We find that if all friends adopt the iPhone 3G, then theprobability of the ego to adopt increases by 15 percent onaverage. We obtain this result after controlling for hetero-geneity across regions, across subscribers, and over time.This result is robust across specifications including differentapproaches to define our instruments as well as different waysto code the adjacency matrix across subscribers. We alsoshow that peer influence accounted for roughly 14 percent ofiPhone 3G sales during the first 11 months at EuroMobile.We provide results from several policy simulations showing
4In addition, our paper also complements the literature that measures thepenetration of handsets in countries such as Germany (Singh 2008), India(Chu et al. 2009), Japan (Park and Ueda 2011), Korean (Park and Ueda2011), Portugal (Botelho and Pinto 2004), and Taiwan (Chu et al. 2009),
MIS Quarterly Vol. 38 No. 4/December 2014 1105

Godinho de Matos et al./Peer Influence in a Large Social Network
that EuroMobile would have hardly benefitted from seedingthe iPhone 3G to increase its penetration in light of themodest magnitude for the effect of peer influence that we findin this paper. This finding, however, depends highly on howmuch of the handset is subsidized to the seeds. In this regard,our paper contributes to improve our understanding of thepotential of viral marketing (Leskovec et al. 2007; Watts et al.2007) for costly products.
The reminder of this paper is structured as follows. The nextsection introduces EuroMobile and discusses the release ofthe iPhone 3G. The subsequent section describes our ap-proach to identify communities of users. We then introduceour model and empirical strategy, after which we present ourresults and robustness checks. Following that, we show theresults from policy simulations and, finally, present ourconclusions.
Mobile Carrier and the Releaseof iPhone 3G
Our industrial partner EuroMobile is the market leader ofmobile services in this country. EuroMobile granted usaccess to all its detailed call records (CDRs) in one Europeancountry between August 2008 and June 2009. EuroMobilereleased the iPhone 3G in this country in July 2008. Forevery call placed or received by a EuroMobile subscriber, wehave the anonimized phone numbers of the initiator andrecipient, the GPS coordinates for the cell towers used, atimestamp, and the duration of the call. For every sent textmessage (sms) initiated or received by a EuroMobile sub-scriber, we have the anonimized phone numbers of theinitiator and recipient and a timestamp. We also have a set ofsubscriber characteristics such as date of birth, gender, typeof contract, tariff plan, handset, zip code for the accountowner, and changes in all these covariates over time. Ourdataset spans 5 million active phone numbers. We have about3.7 billion calls and 13 billion sms in this dataset.
The Social Network Graph
We use all CDRs in this dataset to define an undirected graphof communications across EuroMobile subscribers. Wetrimmed subscribers from other providers because we did nothave sufficient information on them, such as whether theyadopted the iPhone 3G. An edge between two EuroMobilesubscribers is added to our graph if one of them called or sentan sms to the other and the latter answered back with a call oran sms within the same calendar month. This procedure dis-regards communications that are unlikely to proxy social
proximity such as those involving message bots, shortnumbers, and call centers.5
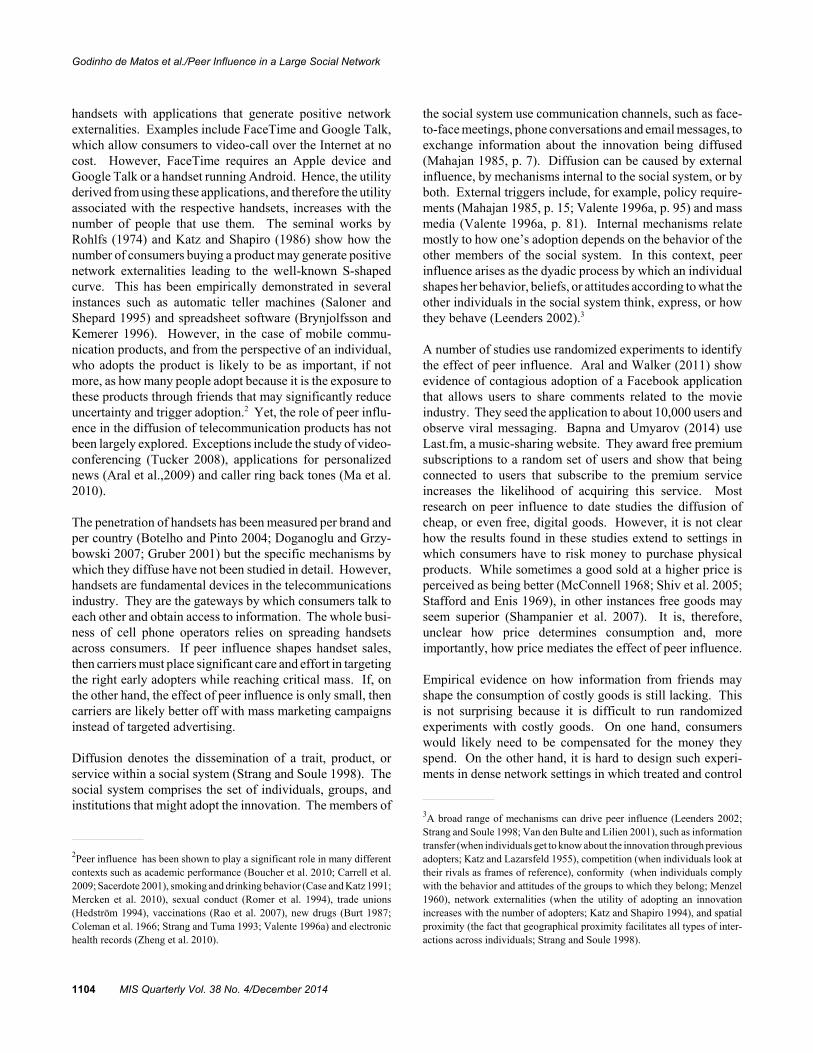
The resulting graph includes 4,986,313 subscribers and57,069,798 edges. The undirected graph density is4.59 * 10!6 and the mean degree is 22.9 with a standarddeviation of 25.5. The median degree is 13. Figure 1 plotsthe empirical degree distribution for EuroMobile subscribers.We say that two EuroMobile subscribers are friends if theyare connected through an edge in this graph. Hereafter, thenumber of friends of a EuroMobile subscriber is her degree.
The Release of the iPhone 3G
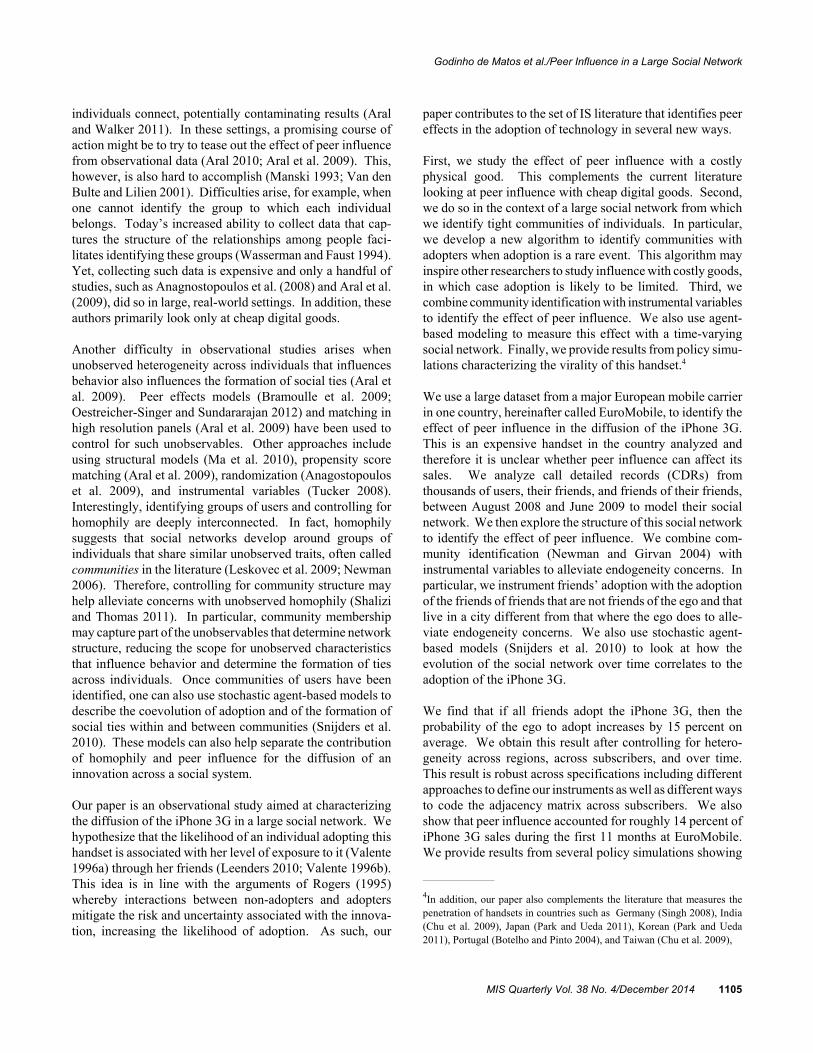
EuroMobile released the iPhone 3G in the country analyzedin July 2008. This was the first Apple smartphone commer-cialized in this country.6 Smartphones accounted only for 11percent of all handset sales during 2008. Figure 2 shows thatease of use, price, size, and weight were among the mostimportant factors that consumers in this country consideredwhen purchasing a handset. However, the iPhone 3G was aconspicuous luxury product in this market. The 8Gb modellaunched for 500 Euros without a contract with a carrier.7
Furthermore, subscribers could only benefit from its fullpotential if they subscribed to a data plan. Figure 2 showsthat in 2008 consumers in this country did not care much forInternet connectivity or network coverage on their handset.These facts suggest that there was significant uncertaintyabout the iPhone 3G, which likely motivated consumers toseek opinions from their friends. Therefore, the case of theiPhone 3G in this country in 2008 provides an appropriatesetting to study the potential effect of peer influence. Duringthe first 11 months in the market, less than 1 percent ofEuroMobile subscribers adopted the iPhone 3G.
5We also removed from our analysis phone numbers that switched betweenpre-paid and post-paid because in these cases we are unable to track theirhistory reliably. These operations eliminate less than 5 percent of the sub-scribers. We also trim from this graph subscribers whose degree is threestandard deviations above the mean. This removes private branch machines(which only route calls among the internal telephones of an organization) and ensures that the size of our graph is computationally manageable. Thiseliminates less than 1.6 percent of the subscribers.
6At that time, Nokia was the preferred mobile phone brand with a marketshare above 40 percent, followed closely by Samsung. LG, and Sony, eachwith roughly a 10 percent market share.
7Prices ranged between 130 and 400 Euros with contracts. Contracts wouldlast for 24 months and significant penalties applied to terminate them beforeexpiry. All iPhones were sold with a SW lock to the carrier selling thedevice. This could be unlocked at no charge after 24 months or before 24months for a 200 Euro fee. Monthly contract fees ranged between 30 and 65Euros across carriers. People in this country spent 20 Euros per month onaverage for mobile communications during 2008.
1106 MIS Quarterly Vol. 38 No. 4/December 2014
Godinho de Matos et al./Peer Influence in a Large Social Network
Note: Grey dots represent subscribers whose degree is three standard deviations below the mean.
Figure 1. Degree Distribution across EuroMobile Subscribers
Note: Percent of total respondents who checked each particular characteristic.
Figure 2. Most Important Characteristics Considered When Purchasing a New Handset
Working with Communities
Peer influence is a local phenomenon. It measures whetherpeers play a part in someone’s decision to undertake actions. For this reason, peer influence is likely to occur within com-munities of friends, that is, groups of people with manyconnections within the group and only a few connections topeople outside the group. We argue that in order to study
peer influence one must identify tight communities ofindividuals in which peer influence can be meaningful insteadof looking for average peer influence effects across largenetworks of people which are unlikely to embed real socialmeaning. In this paper, we aim at studying how friendsinfluence one’s decision to purchase the iPhone 3G but con-trolling for the fact that potential influence occurs within thescope of communities of friends. For this purpose, we focus
MIS Quarterly Vol. 38 No. 4/December 2014 1107

Godinho de Matos et al./Peer Influence in a Large Social Network
on communities with about 100 people, which according toLeskovec et al. (2009) is the size beyond which clusters tendto start blending into a giant component of the social graphand thus start to lose social meaning.
Furthermore, identifying communities of subscribers yieldsadditional empirical advantages. For example, social net-works tend to aggregate individuals that share commonunobserved traits. These latent unobservables confound theidentification of peer influence. Yet, community membershipis likely to capture part of the unobservables that determinenetwork structure and, at the same time, drive behavior.Thus, controlling for community membership is likely to helpcontrol for unobserved homophily (Shalizi and Thomas 2011).
Estimating peer effects on a community basis is also likely toreduce the downward bias that may arise from consideringlarge networks of consumers. To see this, consider two com-munities, one completely immune to a disease and the othervulnerable to it. Introducing sick individuals into the formerwould lead us to think that the disease is not contagious.Introducing sick individuals into the latter would allow us todetermine the rate of contagion. Studying contagion in thispopulation as a whole would underestimate the virulence ofthe disease. Firms are typically interested in measuring peereffects in communities that are likely to purchase their pro-ducts. In fact, they tailor their products to market segmentsseparately in ways they believe might accelerate sales. Froma managerial point of view, one is not interested in overallpeer effects but rather in local influence effects. In the caseof the expensive iPhone 3G, subscribers susceptible toadopting this handset might be very different from the averageEuroMobile subscriber. Our interest is in identifying peerinfluence among adopters.
Finally, identifying communities also permits working withsamples of independent, cohesive groups of consumers, whichcan be used to correct standard errors and avoid claimingeffects when there might be none. Treating observations asindependent and identically distributed when dealing withsocial network data is a major drawback of many empiricalanalyses which we try to limit in this paper.
Algorithms to Identify Communities
Table 1, based on the survey in Fortunato (2010), provides alist of algorithms used in the literature to identify commu-nities in social graphs. Most of these algorithms cannot beapplied to large social networks due to their computationalcomplexity. The comparative studies in Pons and Latapy(2006), Lancichinetti et al. (2008), and Lancichinetti andFortunato (2009) show clearly that the first 10 algorithms in
this table are unable to process a network with 5 millionnodes and 57 million edges. For this reason, in this paper, wefocus on algorithms 11 to 15.
Most of the algorithms in this table are based on greedy opti-mizations of the modularity index.8 However, as Fortunatoand Barthelemy (2007) show, this index has a resolution limitand fails to identify small communities in large social graphs.Therefore, we do not use modularity in our case. Not only isour network very large but our interest resides in identifyingtight and small communities where peer influence can havereal social meaning. Instead, we use the internal external ratio(IER) introduced in Krackhardt and Stern (1988) to measurethe cohesiveness of communities. In our case, IER = (I ! E)/(I + E), where I denotes the number of calls and smsexchanged by individuals within the community and Edenotes the number of calls and sms exchanged with indi-viduals outside the community.9 IER balances the effort thatindividuals place in maintaining friendships within versusoutside the community (I ! E). In this regard, it is a goodmeasure of the relative investment that individuals place inconnecting with people within their community. Also, IERmeasures this effort relative to all of the effort that individualsplace in maintaining friendships (I + E). Therefore, IER alsocontrols well for the heterogeneity in the effort to managefriendships across individuals.
Table 2 shows that the algorithms used to identify commu-nities introduced above perform poorly when applied to ourgraph. Columns 4 to 7 show that more than half of the com-munities identified have at most 2 people. Column 6 showsthat most individuals are placed in large communities, whichare unlikely to entail social meaning. Columns 8 to 14 showthat if one limits the analysis to communities with 25 to 200people, then few of them have adopters. Columns 15 and 16show that if one further limits the analysis to communitieswith positive IERs, then one is left with virtually no adopters. In sum, the communities identified by these algorithms canhardly be used to study peer influence with rare events.
8 Modularity compares the number of edges within a given community to thenumber of edges that this community would have if network ties had beenrandomly established. Therefore, it assumes that any two people in thenetwork can connect. This, however, is unlikely as networks grow.
9IER varies in [!1, +1]. The lower bound is attained when all commu-nication involves individuals outside the community. The upper bound isattained when all communication remains within the community. The higherthe IER, the more isolated the community. Negative IERs identify poorcommunities, in the sense that in such communities people talk more oftento people outside the community rather than to people inside the community.
1108 MIS Quarterly Vol. 38 No. 4/December 2014

Godinho de Matos et al./Peer Influence in a Large Social Network
Table 1. Community Detection Algorithms and Their Computational Complexity
# Authors Computational Complexity
1 Palla et al. (2005) O(exp(n))
2 Newman and Girvan (2004) O(m2n)
3 Girvan and Newman (2002) O(mn2)
4 Furtunato et al. (2004) O(n4)
5 Bragow and Bollt (2004) O(n3)
6 Donetti and Munoz (2005) O(n2)
7 Zhou and Lipowsky (2005) O(n2)
8 Duch and Arenas (2005) O(n2log(n))
9 Radicchi et al. (2004) O(n2)
10 Newman (2003) O(n2)
11 Zhang et al. (2011) O(n2c (nc + nb))
12 Pons and Latapy (2006) O(n2log(n))
13 Clauset et al. (2004) O(nlog2 (n))
14 Blondel et al. (2008) O(m)
15 Rosvall and Bergstrom (2008) O(m)
Note 1: Adapted from Fortunato (2010). Note 2: n denotes the number of nodes in the social network, m denotes the number of edges in thesocial network, nc denotes the target number of nodes in the subpopulation of interest, nb denotes the number of nodes in the boundary of the sub-population of interest.
Table 2. Summary of Results Obtained with Community Detection Algorithms
All Communities Communities with Size between 25 and 200 IER > 0
ColumnNumber 1 3 4 5 6 7 8 9 10 11 12 13 14 15 16 17
Community Size CommunitiesAdopters perCommunity
Com-munities
Edg
e W
eigh
ts
Exe
cutio
n T
ime
Com
mun
ities
Min
Med
Max
Mea
n
All
With
Ado
pter
s
All
Ado
pter
s
Mea
n
Min
Med
Max
All
Ado
pter
s
Pons andLatapy(2006)
Yes 1 week 977,999 1 1 488,471 5.0 2,996 313
447
0.149 0 0 8 70 15
Blondel etal. (2008)
No 3 hours 8,417 2 2 886,764 592.4 47 3 8 0.179 0 0 6 46 8
Rosvall andBergstrom(2008)
No 4 hours 8,113 2 2 1,564,858 614.6 24 2 2 0.018 0 0 1 20 2
Rosvall andBergstrom(2008)
Yes 4 hours 8,081 2 2 2,490,201 617.6 14 0 10 0.000 0 0 0 10 0
Clauset etal. (2004)
Yes 1 month 25,373 2 2 317,426 179.3 232 17 37 0.159 0 0 3 21 0
MIS Quarterly Vol. 38 No. 4/December 2014 1109

Godinho de Matos et al./Peer Influence in a Large Social Network
Table 3. Summary of Results Obtained Using the Modified T-CLAP Algorithms
All Communities Communities with Size between 25 and 200 IER > 0
ColumnNumber 1 3 4 5 6 7 8 9 10 11 12 13 14 15 16 17
Community Size CommunitiesAdopters perCommunity
Com-munities
Edg
e W
eigh
ts
Exe
cutio
n T
ime
Com
mun
ities
Min
Med
Max
Mea
n
All
With
Ado
pter
s
All
Ado
pter
s
Mea
n
Min
Med
Max
All
Ado
pter
s
Zhang et al.(2011)
Yes 3weeks
2,134 2 103 115 96.7 2,134 1,936 72,995 36.5 0 16 115 263 1,758
A Modified Version of T-CLAP
We devise an alternative algorithm to extract communitiesfrom our large social network. This algorithm is inspired inT-CLAP (Zhang and Krackhardt 2010), which was previouslyused in the literature to identify small and tight communities. T-CLAP does not consider the entire social graph. Instead, itsnowballs from a random seed and prunes nodes according totheir IER. However, in our case, randomly sampling seeds isunlikely to ever hit an iPhone 3G adopter.10
Therefore, we change T-CLAP to (1) snowball starting froman iPhone 3G adopter, and (2) to discard non-adopters withhigher probability. Appendix A shows the pseudocode forour modified version of T-CLAP. Note that in our version ofthis algorithm, if pruning a community results in two or moredisjoint communities, then we proceed using the communitywith the highest IER. This helps us find communities withhigh IERs.
The computational complexity of T-CLAP is O(n2c(nc + nb)),
where nc denotes the number of nodes in the subpopulation ofinterest and nb denotes the number of nodes in the boundaryof this subpopulation. Our modified version of T-CLAP issimpler because it skips clustering. In this case it takes O(nc)time to create the graph with the subpopulation of interestusing snowball sampling. Computing IERs takes linear timeon both nc and the number of edges originating and reachingthe subpopulation of interest, which we call mc. Thus, ourmodified version of T-CLAP would take O(n(nc + mc)) timeto run in a network with n users. The majority of our code to
identify communities is developed in R, making use of iGraph(Csardi and Nepusz 2005).11
Communities Identified Using the New T-CLAP
Table 3 shows the characteristics of the communities iden-tified using our modified version of T-CLAP. We identify2,134 communities comprising 72,995 adopters. More than90 percent of these communities have adopters. We filterthese communities and keep the ones that do not overlap,have at least one adopter, and positive IER. We are left with263 communities comprising 1,758 adopters, which we use inthe remainder of this paper. Figure 3 shows that there is noparticular relationship between the size, the density, and theIER of these 263 communities.
Furthermore, these 263 communities are quite disconnectedfrom each other. To see this, we select two communities atrandom and, also at random, we select one subscriber in eachof these communities. We compute the length of the shortestpath between these subscribers and repeat this process500,000 times. Figure 4 shows the empirical distribution forthe length of the shortest paths. The average length is 4.76edges with a standard deviation of 0.66.
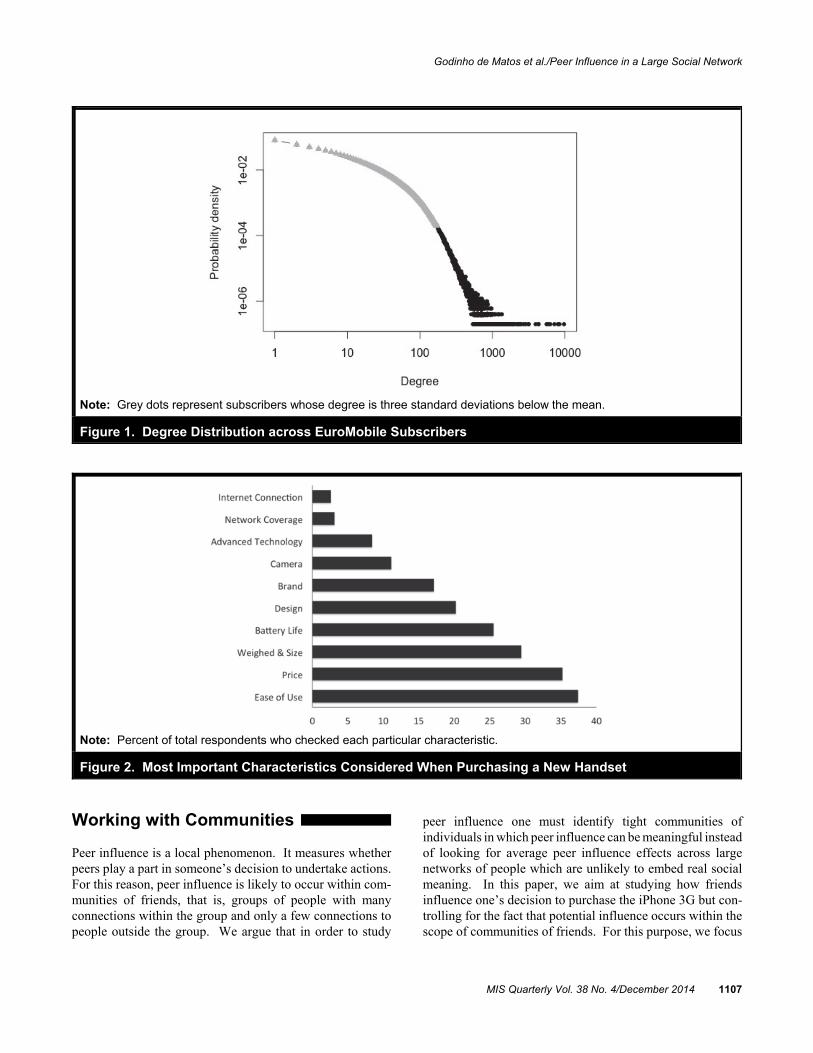
We also look at whether subscribers have friends in othercommunities. We perform a 1-wave snowball sample from allsubscribers in these 263 communities and look for inter-sections. Figure 5 shows that more than 75 percent of thesubscribers have no friends in other communities and 95 per-
10Recall that the adoption rate of the iPhone 3G was less than 1 percent in thecountry we analyze.
11The majority of our figures are generated using ggplot (Wickham 2009) andour tables are formatted using stargazer (Hlavac 2013).
1110 MIS Quarterly Vol. 38 No. 4/December 2014

Godinho de Matos et al./Peer Influence in a Large Social Network
Figure 3. IER, Size, and Density for the Communities Extracted with the Modified T-CLAP
Figure 4. Length of the Shortest Path between Random Subscribers in Distinct Communities
cent have at most one friend in another community. Onaverage, a community connects to 27.1 friends in othercommunities. The latter belong to 18.4 communities onaverage. Figure 6 shows the distribution of the averagenumber of links that tie communities to each other. Theoverall average number of edges between two communities is1.5 with a standard deviation of 0.6.12 Taken together, thesestatistics show that these 263 communities are only sparselyconnected.
Model and Empirical Strategy
Consumer Utility Model
Let Uit represent the difference in utility for subscriber ibetween adopting and not adopting the iPhone 3G at time t. We assume that Uit is given by the following reduced formequation:
Uit = α + Xiβ + Zit γ + ρWiYt ! 1 + εit (1)
Xi and Zit are time invariant and time variant subscriber-specific characteristics, respectively. W is an adjacencymatrix. Entry wij is zero when subscribers i and j are not
12An undirected graph with 263 communities as nodes could have at most34,453 edges. Only 7 percent of these edges are present in our case and 75percent of them comprise only one edge between subscribers in the commu-nities they connect.
MIS Quarterly Vol. 38 No. 4/December 2014 1111
Godinho de Matos et al./Peer Influence in a Large Social Network
Figure 5. Cumulative Distribution of the Number of Friends that Belong to Other Communities
Figure 6. Distribution of the Average Number of Links Tying Communities
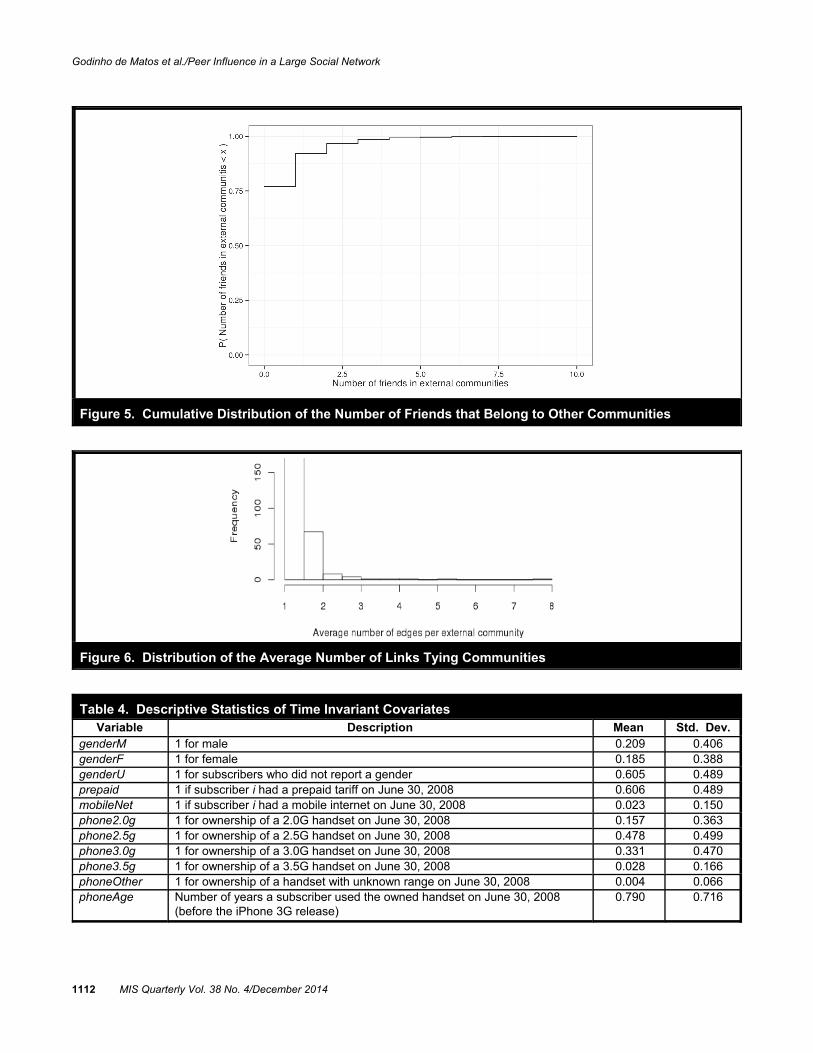
Table 4. Descriptive Statistics of Time Invariant CovariatesVariable Description Mean Std. Dev.
genderM 1 for male 0.209 0.406genderF 1 for female 0.185 0.388genderU 1 for subscribers who did not report a gender 0.605 0.489prepaid 1 if subscriber i had a prepaid tariff on June 30, 2008 0.606 0.489mobileNet 1 if subscriber i had a mobile internet on June 30, 2008 0.023 0.150phone2.0g 1 for ownership of a 2.0G handset on June 30, 2008 0.157 0.363phone2.5g 1 for ownership of a 2.5G handset on June 30, 2008 0.478 0.499phone3.0g 1 for ownership of a 3.0G handset on June 30, 2008 0.331 0.470phone3.5g 1 for ownership of a 3.5G handset on June 30, 2008 0.028 0.166phoneOther 1 for ownership of a handset with unknown range on June 30, 2008 0.004 0.066phoneAge Number of years a subscriber used the owned handset on June 30, 2008
(before the iPhone 3G release)0.790 0.716
1112 MIS Quarterly Vol. 38 No. 4/December 2014

Godinho de Matos et al./Peer Influence in a Large Social Network
Figure 7. Box Plot for the Proportion of Friend Adopters Over Time
friends and the inverse of the degree of subscriber i otherwise. Wi is the ith row of W and Yt ! 1 is a column vector that stacksthe adoption decisions of all individuals up to time t ! 1. εit
is the idiosyncratic error term. User i adopts the iPhone 3Gat time t iff Uit > 0. Therefore, Yit = 1{Uit > 0}. The termα + Xiβ + Zitγ captures the intrinsic utility of subscriber i fromadopting the iPhone 3G. Parameter ρ measures the effect ofpeer influence. If ρ > 0, adoption increases with the numberof friends that adopt as well as with the number of friends offriends that adopt recursively, which in turn increases thepropensity to adopt. In this case, this model originates thewell-known s-shape diffusion curve as times goes by. If,however, ρ # 0 and the intrinsic utility to adopt the iPhone 3Gis small, few people will adopt and the handset will not spreadlargely across the population.
Table 4 shows descriptive statistics for the covariates usedin our model. We control for gender, for the sophisticationof the handset owned prior to the release of the iPhone 3G,for how long the subscriber owned that handset, for the typeof tariff plan subscribed, and for how long the subscriberhas been with EuroMobile (tenure).13 Figure 7 details the
evolution of the proportion of friends that adopted the iPhone3G over the period of analysis.
Identification Strategy
Allison (1982) and Tucker (2008) discuss how the model inequation 1 can be empirically estimated with pooled probit aslong as the standard errors are adjusted to account forcorrelation in the error term using either a sandwich estimatoror block bootstrap.14 However, unobserved heterogeneitymay bias our estimates of peer influence. This happens, inparticular, if Ei[WiYt!1, εit] … 0; that is, if unobserved reasonsthat lead subscriber i to adopt the iPhone 3G relate to thereasons why she befriends other subscribers. We refer to thiscondition as 1-hop homophily. Our approach to deal with thisproblem is twofold. First, we use many controls to reduce thepotential relevant unobserved effects in εit. We control forheterogeneity across regions, across subscribers, and overtime. Subscribers living in large cities are likely to face lower
13Gender has been shown to play an important role in how people perceivethe benefit of a new technology (Gefen and Straub 1997; Venkatesh andMorris 2000; Venkatesh et al. 2003). Prior studies have also shown thatexperience with technologies similar to the new product increases thelikelihood of adoption (Karahanna et al. 2006; Venkatesh et al. 2003).Therefore, in our case, we would expect subscribers with more sophisticatedhandsets to be more likely to adopt the iPhone 3G. We also control for how
long the subscriber has that handset to account, for example, for the sub-scriber’s propensity to be an early adopter. We control for tariff plan becausepost-paid subscribers are typically wealthier. Finally, tenure might proxyhow much the subscriber trusts EuroMobile in order to acquire a new andexpensive handset from it.
14To do so, the data must be organized into a panel and observations after thefirst adoption need to be removed from the sample.
MIS Quarterly Vol. 38 No. 4/December 2014 1113

Godinho de Matos et al./Peer Influence in a Large Social Network
Table 5. Descriptive Statistics for All Dummy Variables
Variable Description MeanStd. Dev.
geoWageV L 1 if the user spends most days in regions where salaries are 2 standarddeviations below the national average
0.001 0.065
geoWageL 1 if the user spends most days in regions were salaries are between 1 and 2standard deviations below the national average
0.009 0.095
geoWageA 1 if the user spends most days in regions within 1 standard deviation of thenational average
0.312 0.463
geoWageH 1 if the user spends most days in regions were salaries are between 1 and 2standard deviations above the national average
0.439 0.496
geoWageVH 1 if the user spends most days in regions 2 standard deviations above thenational average
0.237 0.425
Subscriber/Dummy
N Dummies MeanStd. Dev
Zio_Code_FE Dummy variables for home zip code 70 342.3 521.8Community_FE Dummy variables for community membership 263 91.7 17.2Month_FE Dummy variables for each month 12 23,064 532.8
Note 1: Regions are studied at municipal level and daytime is 8 a.m. – 8 p.m.
search costs because the iPhone 3G was mostly availablefrom EuroMobile franchises located in major shopping malls.Subscribers in these cities may also find it more beneficial touse the iPhone 3G because network coverage is likely to bebetter in urban areas to support Internet access. We useregional dummies to control for these effects. We account forwhere subscribers live, which we identify from the zip codeof the account holder, and for where they spend most of theirdaytime, which we identify from the GPS coordinates of thecell towers used to route calls between 8 a.m. and 8 p.m. thatwe match to wage information obtained from the last Census. Yet, and as described by Manski (1993) and Shalizi andThomas (2011), unobservable group effects may still lead tothe adoption of the iPhone 3G and confound our estimates ofpeer influence.15 We include community dummies to helpcontrol for these effects. These dummies capture some of theunobserved homophily reducing the potential for unobserv-ables that drive both network formation and adoption of theiPhone 3G. Finally, we add time dummies to control for thefact that the net benefit from adopting the iPhone 3G changesover time with seasonal promotions and declining pricetrends. Table 5 summarizes the dummy variables mentionedearlier.
Second, we explore the structure of the social network toderive an instrumental variable at the subscriber level and
thus further alleviate endogeneity concerns. Consider twosubscribers, i and j, who are friends. Consider a third sub-scriber, k, who is a friend of subscriber j but not of subscriberi. We argue that subscriber k’s decision to adopt the iPhone3G relates to subscriber j’s decision to do so and to subscriberi’s decision to do so only through subscriber j’s decision. Subscriber k’s decision to adopt the iPhone 3G is correlatedto subscriber j’s decision to do so. Subscriber j becomesexposed to the iPhone 3G through her friends, which reducesher uncertainty about the utility of the new handset and thusincreases her likelihood to adopt it. Furthermore, subscriberk’s and subscriber j’s decisions to adopt are correlated due to1-hop homophily, which has been widely reported to arise insocial networks (McPherson et al. 2001). Finally, even if ourcommunities fail to exhibit 1-hop homophily, our instrumentis algebraically related to our dependent endogenous variableby construction.16
15One example is a set of subscribers that communicates frequently withinthe group because they work for the same company and the company adoptsthe iPhone 3G (or another handset, for that matter) as the primary handset forits employees.
16To see this, note that W² codifies the friends of friends and (1 ! W)W² thefriends of friends not friends of the ego. Therefore, both the instrument andthe endogenous variable depend on W. According to Bramoulle et al. (2009),this type of instrument can provide identification as long as I, W, and W² arelinearly independent, which is the case in our data.
1114 MIS Quarterly Vol. 38 No. 4/December 2014

Godinho de Matos et al./Peer Influence in a Large Social Network
Table 6. Descriptive Statistics for the Instrumental Variable
Variable Description Mean Std. Dev.
ffnf_adopterst!1 Proportion of friends not friends of the ego who adopted the iPhone 3G 0.009 0.011
ffnfdc_adopterst!1 Proportion of friends not friends of the ego who live in a city different fromwhere the ego who adopted the iPhone 3G does
0.010 0.009
N_ff Number of friends of friends 1333.279 1081.448
N_ffnf Number of friends of friends not friends 1311.574 1064.555
N_ffnfdc Number of friends of friends not friends of the ego living in a city differentfrom where the ego does
566.580 586.7173
Note 1: Mean and standard deviation for the time varying instruments were calculated considering the entire panel. Note 2: Mean and standarddeviation for time invariant covariates is calculated over the subscribers in the sample.
However, our instrument only works properly if, in addition,we assume that Ei[W2
iYt!1, εit] = 0. We refer to this conditionas absence of 2-hop homophily. We note that 1-hophomophily does not necessarily entail 2-hop homophily.17
Yet, 2-hop homophily may still be present in our data. Weaddress this concern in several ways. We only use the deci-sion to adopt the iPhone 3G of the friends of friends of theego not friends of the ego. This provides additional separa-tion between our instrument and our dependent variable,which helps reduce the potential correlation between sub-scriber i’s and subscriber k’s decisions to adopt the iPhone 3Gto that arising only through subscriber j’s decision. We alsointroduce geographical separation between subscriber i andsubscriber k to further lessen the likelihood of sharedunobserved homophily. We used the GPS coordinates of thecell towers used to route calls to identify the cities wheresubscribers live. Appendix B provides additional details ofhow this has been accomplished. We used only the adoptiondecisions of friends of friends of the ego that are not friendsof the ego and that live in a city different from where the egodoes as instruments. Previous literature has shown thatgeographic proximity facilitates interactions (Strang andSoule 1998) and that the frequency of both face-to-face andelectronic interactions reduce with geographic separation(Tillema et al. 2010). Clearly, using instruments that are notfriends of the ego and that are geographically far apart fromthe latter lessens significantly the opportunities for correlatedunobserved homophily. Combining social network data withgeography is an innovative approach to identification uniqueto our paper that we could pursue given the richness of ourdataset. In our section on robustness checks, we discuss other
strategies to find additional instruments and use them toprovide additional results.
Table 6 provides descriptive statistics for our instrumentalvariable, which is computed before applying T-CLAP.
Finally, we note that our identification strategy with IV intro-duces limitations for inference purposes. In short, we need torestrict the population in which we measure the effect of peerinfluence because we have no evidence that this effect is thesame across all subscribers in our communities. In our case,we can look at treated egos as subscribers i with friends,subscribers j, that adopted the iPhone 3G and we can think ofcompliers as subscribers j that do not adopt the iPhone 3Gwhen their friends, subscribers k, do not and that adopt theiPhone 3G when their friends (subscribers k) do. Refer toImbens and Angrist (1994), Angrist et al. (1996), andWooldridge and Imbens (2007) for more details on theseconcepts. With one-side non-compliance (Bloom 1984), thatis, when subscribers j do not adopt the iPhone 3G if theirfriends (subscribers k) do not, we can identify the effect ofpeer influence in the subpopulation of friends of compliers.Subscribers j and subscribers k do not adopt the iPhone 3G in15 percent of our observations. Only in 0.14 percent of obser-vations did we see subscribers j adopt the iPhone 3G whensubscribers k did not. Therefore, we find strong evidence ofone-side non-compliance in our case. Now, note that the sub-population of friends of compliers, in which we can identifythe effect of peer influence, is by definition the subpopulationreceiving treatment. Therefore, in our case, the measure ofthe average treatment effect on the treated (ATT) and theaverage partial effect (APE), reported in the next sections,should be interpreted along these lines. We note thatreporting treatment effects in a subpopulation of interest is notunique to our paper. For example, Aral and Walker (2011)report the ATT while Bapna and Umyarov (2014) study theATE on the non-treated.
17If it did, one could possibly use the decision to adopt the iPhone 3G of thefriends of friends of friends not friends of the ego as an instrument. Onecould possibly use this idea recursively to further reduce the potential bias inthe effect of peer influence. Yet, too many hops between egos and instru-ments may result in weak instruments.
MIS Quarterly Vol. 38 No. 4/December 2014 1115

Godinho de Matos et al./Peer Influence in a Large Social Network
Table 7. Marginal Effects for Peer Influence
(1)Probit
P(adoptedit)
(2)Probit
P(adoptedit)
(3)Probit
P(adoptedit)
frd_adopterst !1 (ρ)3.241***(0.269)
3.247***(0.256)
2.851***(0.258)
Observations 265,462 265,462 265,462
Community FE No No Yes
Zip Code FE No Yes Yes
Month FE Yes Yes Yes
Other Covariates Yes Yes Yes
Pseudo R2 0.112 0.117 0.157
Log Lik -9192 -9133 -8721
APE0.053***(0.005)
0.053***(0.005)
0.045***(0.004)
***p < 0.01, **p < 0.05, *p < 0.1Note 1: Cluster robust standard errors in parenthesis.
A Results for Peer Influence
Probit Results
Table 7 shows the results obtained without instruments.18 Weonly show results for the covariate of interest. All other co-variates behave as expected, as shown in Appendix D. Allspecifications in this table show a positive correlationbetween friends’ adoption and the ego’s adoption, as ex-pected. The Average Partial Effect (APE) varies between 4.5percent and 5.3 percent.19 The magnitude of the coefficientreduces from Column (2) to Column (3) when we includecommunity dummies. This provides evidence that usingcommunities is potentially capturing some homophily thatcould otherwise be interpreted as influence. As such, thisresult provides support in favor of using communities tomeasure peer influence in social networks.
IV Probit Results
Table 8 shows the results obtained after instrumentation.20
The results in this table provide clear evidence of contagiousadoption. If all friends of the ego adopt the iPhone 3G thenthe ego’s probability to adopt increases by 15 percent. Figure8 shows that this level of peer influence must have accountedfor approximately 14 percent of all iPhone 3G adoptionduring our period of analysis. Table E1 in Appendix E showsthe pseudocode of the algorithm used to compute this statistic.We note that the marginal effect of peer influence increasessignificantly after instrumentation. Budget constraints mightexplain this increase. People in the same household tend tocall each other often and therefore will appear as friends inour social graph.
However, budget constraints might preclude all family mem-bers from adopting the new and expensive iPhone 3G. Familymembers are friends that will not adopt the iPhone 3G even ifthey want to. This artifact may downplay the estimates ofpeer influence before instrumentation because it leads theerror term to be negatively correlated to our endogenousvariable.
18We use 265,462 observations over 258 communities out of the 263identified previously. Appendix C discusses why five communities weredropped from the analysis.
19For the probit estimator, APE is given by the partial derivative of theexpected value function, E [Φ(α + Zδ)]. The standard errors for the APE arecomputed using the Delta method as suggested in Wooldridge (2002).
20In the case of IV probit, and following Wooldridge (2002, p. 475), the APEis obtained from the partial derivative of Ev[αp + Zδp + θpv]. Subscript pindicates that IV probit estimates parameters up to a scale factor. Subscriptv denotes the residuals of the first stage regression. For more details on theNewey IV estimator and how to compute APE refer to Wooldridge andImbens (2007), which also describes in detail how to average out effects overtime.
1116 MIS Quarterly Vol. 38 No. 4/December 2014

Godinho de Matos et al./Peer Influence in a Large Social Network
Table 8. Marginal Effects for Peer Influence with IV
Instrument Variables
(1)IV Probit
ffnf adoptedit
(2)IV Probit
ffnfdc adoptedit
frd_adopterst !1 (ρ)7.864***(1.171)[1.185]
9.935***(1.952)[2.087]
Observations 265,462 265,462
Community FE Yes Yes
Zip Code FE Yes Yes
Month FE Yes Yes
Other Covariates Yes Yes
χ² p-value 0.000 0.000
APE 0.120*** 0.150***
[0.018] [0.032]
***p < 0.01, **p < 0.05, *p < 0.1Note 1: Newey estimator standard errors in ( ) for IV probit. Note 2: Community block-bootstrap standard errors in [ ] for IV probit (200 replicationsare used to calculate the significance level.
Figure 8. The Role of Peer Influence in the Adoption of the iPhone 3G
To better understand the potential effect of budget constraints,we assume that all phone numbers in the same billing accountbelong to the same person, to people in the same family, or toemployees of the same firm.21
On average, more than 20 percent of one’s friends belong tothe same account and therefore intra-account communicationis significant. Figure 9 plots the number of iPhone 3Gadopters in accounts with more than one and less than sixphone numbers, most likely associated with families. Mostaccounts have only one adopter, which is consistent with thehypothesis of budget constraints. A similar plot is obtainedfor accounts with more than five phone numbers, most likelyassociated with firms. This reinforces the hypothesis of bud-get get constraints and shows that only a few firms, if at all,adopted the iPhone 3G.
21Nothing prevents unrelated subscribers from sharing a common phone bill,but these cases are likely exceptions.
MIS Quarterly Vol. 38 No. 4/December 2014 1117

Godinho de Matos et al./Peer Influence in a Large Social Network
Figure 9. Adopters per Account for Accounts with Two to Five People
Robustness Checks
Functional Form
Instrumental variables with linear probability models (LPM)rely on less restrictive assumptions on the distribution of theerror term than nonlinear formulations. According to Allison(1982) and Wooldridge (2002), LPM estimates are often goodapproximations to the average partial effect in the population.Therefore, we estimate LPM versions of the model in equa-tion (1).
Table 9 shows the results obtained. Both the OLS result, inColumn (1), and the 2SLS results, in Columns (2) and (3),remain positive and highly statistically significant. Further-more, they are not statistically different from their probitcounterparts. Therefore, our results for the effect of peerinfluence do not seem to be an artifact of functional form.
Effect of the Period of Analysis
The iPhone 3G is a big ticket item, in particular in the marketstudied in our paper, which can introduce friction into theprocess of peer influence. Therefore, a month-long windowseems appropriate to analyze the effect of peer influence. Inany case, this might bias our estimates downward, forexample, by increasing the potential for contemporaneouspeer influence, for which we may fail to account. We repro-duce our results with weekly binning to check whether our
choice of period of analysis can be driving our results. Table10 shows the results obtained for OLS, 2SLS, probit, and IVprobit using weekly binning. These effects are four timessmaller than the effects obtained with monthly binning, whichsuggests that our choice of period of analysis does not seemto drive our findings.
Alternative Weighting Matrices
In the preceding sections, W was a row standardized versionof the adjacency matrix coding the social graph giving thesame weight to every friend. However, it is likely thatsubscribers weight differently the information they obtainabout the iPhone 3G from their friends. Below, we introducefive new ways to weight friends and show that our estimatesof peer influence remain unchanged. Table 11 shows theresults obtained using the friends of friends not friends of theego who live in a city different from where the ego does asour instrumental variable. We also center on the mean andstandardize the proportion of friends that adopted the iPhone3G to facilitate the comparison of the magnitude of the effectof peer influence across columns. Column (1) displays theresults obtained before. Column (2) weights friends ac-cording to the number of friends they have. This specificationcaptures the fact that subscribers may place more weight onfriends that are more connected, which therefore may conveymore information about the new handset. Column (3) weightsfriends according to air time over the entire period of analysis,which captures the fact that subscribers may give more weight
1118 MIS Quarterly Vol. 38 No. 4/December 2014

Godinho de Matos et al./Peer Influence in a Large Social Network
Table 9. Coefficient Estimates for the Linear Probability Model
Instruments Variables
(1)OLS
adoptedit
(2)2SLS
ffnfdc adoptedit
(3)2SLS
ffnfdc adoptedit
frd_adopterst!1 (ρ)0.058***(0.007)
0.094***(0.018)
0.128***(0.029)
Observations 265,462 265,462 265,462Community FE Yes Yes YesZip Code FE Yes Yes YesMonth FE Yes Yes YesOther Covariates Yes Yes YesR² 0.015 0.015 0.015
***p < 0.01, **p < 0.05, *p < 0.1Note 1: Community cluster robust standard errors in parentheses.
Table 10. Coefficient Estimates for IV Probit and the Linear Probability Model Using Weekly Binning
Instrument Variables
(1)OLS
adoptedit
(2)2SLS
ffnfdc_adoptedit
(3)Probit
adoptedit
(4)IV Probit
ffnfdc_adoptedit
frd_adopterst !1 (ρ)0.017***(0.001)
0.041***(0.007)
2.444*** (0.149)
8.526***(1.848)
Observations 1,169,364 1,169,364 1,169,364 1,169,364Community FE Yes Yes Yes YesZip Code FE Yes Yes Yes YesMonth FE Yes Yes Yes YesOther Covariates Yes Yes Yes YesR² 0.004 0.004
APE0.011*** 0.039***(0.002) (0.007)
***p < 0.01, **p < 0.05, *p < 0.1Note 1: Community cluster robust standard errors in parentheses.
Table 11. Peer Effects with Different Weighting Matrices
(1)IV Probitadoptedit
(2)IV Probitadoptedit
(3)IV Probitadoptedit
(4)IV Probitadoptedit
(5)IV Probitadoptedit
(6)IV Probitadoptedit
frd_adopterst!1 weighed by… Degree Calls + SMS Calls SMS Airtime
std_frd_adopterst!10.327***(0.0643)
0.358***(0.0660)
0.814***(0.144)
0.798***(0.141)
0.756***(0.134)
0.747***(0.133)
Observations 265,462 265,462 265,462 265,462 265,462 265,462Community FE Yes Yes Yes Yes Yes YesZip Code FE Yes Yes Yes Yes Yes YesMonth FE Yes Yes Yes Yes Yes YesOther Covariates Yes Yes Yes Yes Yes Yes
***p < 0.01, **p < 0.05, *p < 0.1Note 1: Network tenure, previous handset age, as well as dummies for gender, previous handset technology, regional wage level, type of contract(pre/post paid), and subscription to mobile internet data plans prior to the release of the iPhone 3G included in all regressions. std_f rd_adopterst!1
is the same as variable frd_adopterst!1, but mean centered and standardized to facilitate comparison across regressions. The instrument forstd_frd_adopterst!1 is the mean centered and standardized proportion of i’s friends of friends that are not simultaneously i’s friends and that spendmost of their time in regions with different NUTS-III code than i himself. Note 2: Newey estimator standard errors in parentheses.
MIS Quarterly Vol. 38 No. 4/December 2014 1119

Godinho de Matos et al./Peer Influence in a Large Social Network
Table 12. First Stage Regression for IV Analysis
Instrumental Variables
(1)OLS
wfwfnffrd_adopterst!1
(2)OLS
ffnf 1pathfrd_adopterst!1
(3)OLS
wfwfnf 1pathfrd_adopterst!1
X_adopterst!10.184***(0.028)
1.067***(0.0672)
0.183***(0.028)
Observations 265,462 265,462 265,462Community FE Yes Yes YesZip Code FE Yes Yes YesMonth FE Yes Yes YesOther Covariates Yes Yes YesUnderidentification and Weak Instrument TestsKleibergen-Paap rK LMχ² p-value
0.000 0.000 0.000
Kleibergen-Paap rK WaldF-stat
42.927 252.323 42.362
***p < 0.01, **p < 0.05, *p < 0.1Note 1: Community cluster robust standard errors in parentheses.
to friends with whom they communicate more often. Finally,Columns (4), (5), and (6) weight friends according to thenumber of calls and sms exchanged over the entire period ofanalysis. These specifications capture the fact that sub-scribers may give more weight to friends with whom theyinteract more often. The effect of peer influence remainspositive and highly statistically significant in all specifi-cations. Therefore, the effect of peer influence is robust tohow subscribers might weight their friends’ decisions.
Alternative Instrumental Variables
We test the sensitivity of our results to the definition of ourinstrumental variable by further exploring the structure of thesocial graph. The first alternative instrument we consider isthe friends of the friends of the ego that are not her friendsand that connect to her only through a single path in the socialgraph (ffnf_1path). Formally, when subscriber i is the ego,subscriber j is a friend of subscriber k and subscriber k is afriend of subscriber j not a friend of subscriber k, subscriberk’s decision to adopt the iPhone 3G is used as an instrumentfor subscriber j’s decision to adopt only if there is nosubscriber jN … j that is a friend of both subscriber k andsubscriber i, nor does there exists a subscriber jO that is afriend of both subscriber k and a friend of a friend ofsubscriber i recursively. Using only one path between sub-scriber i and subscriber k introduces additional separationbetween them, which further reduces the potential for unob-served 2-hop homophily between egos and instruments. Theonly connection between subscriber i and subscriber k is
through subscriber j, whose decision to adopt the iPhone 3Gis our endogenous variable.
The second alternative instrument we use is the decision toadopt the iPhone 3G of the weak friends of the weak friendsof the ego that are not her friends (wfwfnf). Using only pathsin the social graph through weak friends introduces additionalsocial separation between the instrument and the ego. Subscriber j is a weak friend of subscriber i if she is in thebottom quartile of the distribution of the number of calls andsms that subscriber i exchanges with her friends throughoutthe whole period of analysis. Using only weak friends helpsfurther reduce the potential for unobserved 2-hop homophilybetween subscriber i and subscriber k. Table 12 shows thefirst stage regressions and the Stock and Yogo tests for weakinstruments. Despite the separation that these new instru-ments introduce, they are not weak instruments. Table 13shows the second stage results. Column (1) uses the formeralternative, Column (2) uses the latter alternative, and Column(3) uses both of them combined. It is clear that the effect ofpeer influence remains positive and highly statisticallysignificant with similar magnitude across models.
These results provide additional evidence of the robustness ofour identification approach. In particular, the alternativeinstruments used in this section rely on mechanisms otherthan geographical distance to introduce separation betweeninstruments and the ego. Yet, all our results agree in terms ofstatistical significance and magnitude of the observed effectof peer influence.
1120 MIS Quarterly Vol. 38 No. 4/December 2014

Godinho de Matos et al./Peer Influence in a Large Social Network
Table 13. Peer Effects with Alternative Instrumental Variables
Instrumental Variables
(1)IV Probit
wfwfnf adoptedit
(2)IV Probit
ffnf_1path adoptedit
(3)IV Probit
wfwfnf_1path adoptedit
frd_adopterst!1
10.347*** (3.183)[2.761]
9.037*** (1.350)[1.228]
10.200*** (3.211)[3.116]
Observations 265,462 265,462 265,462
Community FE Yes Yes Yes
Zip Code FE Yes Yes Yes
Month FE Yes Yes Yes
Other Covariates Yes Yes Yes
χ² p-value 0.000 0.000 0.000
APE0.160***[0.041]
0.142***[0.018]
0.154***[0.046]
***p < 0.01, **p < 0.05, *p < 0.1Note 1: Community clusters robust standard errors in ( ) for probit. Note 2: Newey estimator standard errors in ( ) for IV probit. Note 3:Community block-bootstrap standard errors in [] for IV probit (200 replications) are used to calculate the significance level.
A Time-Varying Social Network
A central hypothesis of our analysis so far is that social tiesinferred from the CDR data are stable over the whole periodof analysis. We use stochastic actor-based models for the co-evolution of network dynamics and behavior (SAMCNDB) torelax this assumption. SAMCNDBs are used to model thedynamics of link formation across the members of a socialnetwork and the relationship between ties and behavior. SIENA (Snijders et al. 2010) provides an implementation ofsuch a model. It requires at least two snapshots of the socialnetwork and of the behavior of interest. Actors play a gamethat establishes a path from one snapshot to the next. At eachstage, an actor is selected to take action. The time betweenactions from the same actor is modeled as a Poisson processwith a constant rate, λ, common to all actors.
Two types of actions can occur:
(1) Actors can create or eliminate a tie in the social network.They do so to maximize the utility given by a function ofthe form , fk(B, x) = Σk Bk Sk(x), which is the sum over alleffects k of the utility associated with each effect, Ski(x),weighted by a scaling factor, Bk . The utility of an effectdepends on the state of the network, x.
(2) Actors can change their behavior. In our case, they canchoose to adopt the iPhone 3G. They do so to maximizethe utility given by a function of the form
, which is the sum over( ) ( )f B x z B S x ziZ Z
k
Z
k ki, , ,~~ ~=
all effects of the utility associated with each effect,~k
. In this case, utility depends on the state of the( )S x zki
Z~ ,
network and the behavior of all actors, z.
Functions S and SZ represent effects that, according to thetheory of social networks, influence the formation of ties andbehavior, respectively, such as transitivity and homophily. Borrowing from the econometric theory of random utilitymodels, SIENA introduces a separable unobservable in theutility of each actor. This error term follows a type I extremevalue distribution with mean 0 and a scale parameternormalized to 1. Consequently, the probability with which anactor chooses a particular action follows a multinomial logitfunction. Bk, B
Zk, and λ parameterize the probability distribu-
tion of a Markov process that captures the dynamics of thisgame. The likelihood function of this process is oftenimpossible to determine analytically (Snijders,1996). For thisreason, SIENA estimates parameters using a method ofmoments, whose solutions are approximated using MonteCarlo simulation.
In SIENA, a snapshot of the form [t1, t2] accumulates theeffect of all actions by all actors between the first day of t1
and the last day of t2.22 We partitioned our data into two
snapshots of the form [1, t] ! [t + 1, 11]. Appendix F shows
22SIENA requires changes in both network and behavior between con-secutive snapshots to embody enough variance allowing for estimating theparameters of interest. Still, these changes cannot be exaggeratedly large inorder to challenge the assumption that they pertain to a network that evolvessufficiently smoothly over time. For this reason, it is fundamental tocarefully prepare our data for a SIENA analysis.
MIS Quarterly Vol. 38 No. 4/December 2014 1121
Godinho de Matos et al./Peer Influence in a Large Social Network
results for all t = 2, 3, …, 9, which are all aligned with theones presented below for t = 4, which is the partition forwhich SIENA converges in most communities. This partitionprovides a good balance between the two non-overlappingperiods: 1,058 subscribers adopt the iPhone 3G in [1, 4] and700 do so in [5, 11]. Furthermore, the Jaccard Index for thenetworks at t = 4 and t = 11 is 0.816 (with a standard error of0.050), which provides evidence that a number of social tiesare stable from the first period to the second and thus likely toentail real social meaning.23
An adjacency matrix, Act is computed for each and everycommunity, c, at each and every time period, t. ac
itj indicates
whether subscriber i called or sent an sms to subscriber jduring time period t. Vector yct stacks the behavior of interest. yc
it indicates whether subscriber i owned the iPhone 3G during
time period t. We use the following covariates to explain theevolution of the social network: (1) out-degree, 3ja
citj,
measures the overall tendency to form ties that are costly toestablish and maintain; (2) reciprocity, 3jaijaji, controls for thefact that people tend to return calls and sms from their friends;(3) transitivity, 3jaij maxh(aih, ahj), controls for triad closurebias—people tend to communicate more with the friends oftheir friends; (4) adoption similarity, with( )a sim simij ij ij
−simij = 1{yi = yj }, which measures the subscribers’ tendencyto befriend subscribers with similar behavior and thuscaptures homophily (Snijders et al. 2010). Finally, we use3jaij simij / 3jaij to capture the effect of exposure to the newhandset through friends, which measures the effect of peerinfluence.
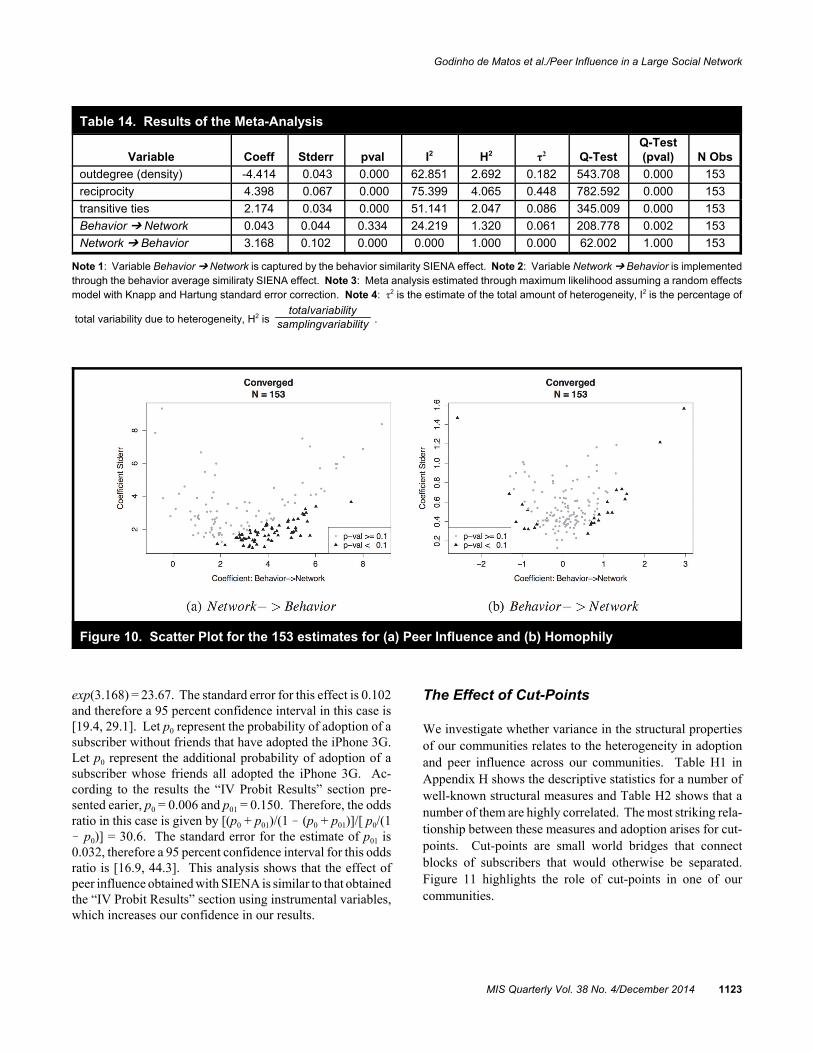
We use meta-analysis to combine the effects obtained fromrunning SIENA in each community (DerSimonian and Laird1986; Hedges and Olkin 1985; Viechtbauer 2010). A sum-mary effect for each parameter is obtained using a random-effects model to allow parameters to vary across communities(DerSimonian and Laird 1986). We use a restricted maximumlikelihood estimator and the standard error bias correctionsuggested by Paule and Mandel (1982), Rukhin et al. (2000),and Knapp and Hartung (2003). Table 14 provides the resultsobtained. The effect of peer influence is positive and highlystatistically significant. Therefore, we find strong evidence ofpeer influence even in the presence of a social network thatchanges over time. The summary effect of homophily ispositive but not statistically significant. Therefore, we do notfind evidence that homophily played a significant role in thestructure of the diffusion network of the iPhone 3G, that is,
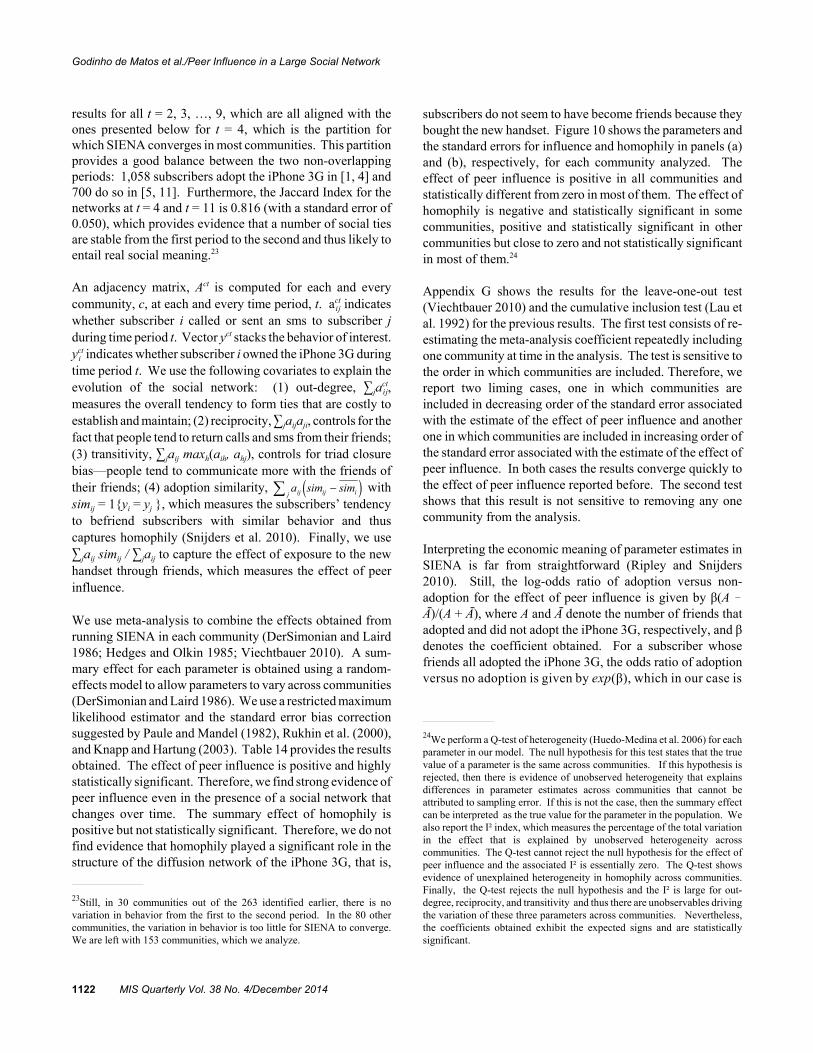
subscribers do not seem to have become friends because theybought the new handset. Figure 10 shows the parameters andthe standard errors for influence and homophily in panels (a)and (b), respectively, for each community analyzed. Theeffect of peer influence is positive in all communities andstatistically different from zero in most of them. The effect ofhomophily is negative and statistically significant in somecommunities, positive and statistically significant in othercommunities but close to zero and not statistically significantin most of them.24
Appendix G shows the results for the leave-one-out test(Viechtbauer 2010) and the cumulative inclusion test (Lau etal. 1992) for the previous results. The first test consists of re-estimating the meta-analysis coefficient repeatedly includingone community at time in the analysis. The test is sensitive tothe order in which communities are included. Therefore, wereport two liming cases, one in which communities areincluded in decreasing order of the standard error associatedwith the estimate of the effect of peer influence and anotherone in which communities are included in increasing order ofthe standard error associated with the estimate of the effect ofpeer influence. In both cases the results converge quickly tothe effect of peer influence reported before. The second testshows that this result is not sensitive to removing any onecommunity from the analysis.
Interpreting the economic meaning of parameter estimates inSIENA is far from straightforward (Ripley and Snijders2010). Still, the log-odds ratio of adoption versus non-adoption for the effect of peer influence is given by β(A !Ā)/(A + Ā), where A and Ā denote the number of friends thatadopted and did not adopt the iPhone 3G, respectively, and βdenotes the coefficient obtained. For a subscriber whosefriends all adopted the iPhone 3G, the odds ratio of adoptionversus no adoption is given by exp(β), which in our case is
23Still, in 30 communities out of the 263 identified earlier, there is novariation in behavior from the first to the second period. In the 80 othercommunities, the variation in behavior is too little for SIENA to converge. We are left with 153 communities, which we analyze.
24We perform a Q-test of heterogeneity (Huedo-Medina et al. 2006) for eachparameter in our model. The null hypothesis for this test states that the truevalue of a parameter is the same across communities. If this hypothesis isrejected, then there is evidence of unobserved heterogeneity that explainsdifferences in parameter estimates across communities that cannot beattributed to sampling error. If this is not the case, then the summary effectcan be interpreted as the true value for the parameter in the population. Wealso report the I² index, which measures the percentage of the total variationin the effect that is explained by unobserved heterogeneity acrosscommunities. The Q-test cannot reject the null hypothesis for the effect ofpeer influence and the associated I² is essentially zero. The Q-test showsevidence of unexplained heterogeneity in homophily across communities. Finally, the Q-test rejects the null hypothesis and the I² is large for out-degree, reciprocity, and transitivity and thus there are unobservables driving the variation of these three parameters across communities. Nevertheless,the coefficients obtained exhibit the expected signs and are statistically significant.
1122 MIS Quarterly Vol. 38 No. 4/December 2014
Godinho de Matos et al./Peer Influence in a Large Social Network
Table 14. Results of the Meta-Analysis
Variable Coeff Stderr pval I2 H2 τ2 Q-TestQ-Test(pval) N Obs
outdegree (density) -4.414 0.043 0.000 62.851 2.692 0.182 543.708 0.000 153
reciprocity 4.398 0.067 0.000 75.399 4.065 0.448 782.592 0.000 153
transitive ties 2.174 0.034 0.000 51.141 2.047 0.086 345.009 0.000 153
Behavior ö Network 0.043 0.044 0.334 24.219 1.320 0.061 208.778 0.002 153
Network ö Behavior 3.168 0.102 0.000 0.000 1.000 0.000 62.002 1.000 153
Note 1: Variable Behavior ö Network is captured by the behavior similarity SIENA effect. Note 2: Variable Network ö Behavior is implementedthrough the behavior average similiraty SIENA effect. Note 3: Meta analysis estimated through maximum likelihood assuming a random effectsmodel with Knapp and Hartung standard error correction. Note 4: τ2 is the estimate of the total amount of heterogeneity, I2 is the percentage of
total variability due to heterogeneity, H2 is .total variability
sampling variability
Figure 10. Scatter Plot for the 153 estimates for (a) Peer Influence and (b) Homophily
exp(3.168) = 23.67. The standard error for this effect is 0.102and therefore a 95 percent confidence interval in this case is[19.4, 29.1]. Let p0 represent the probability of adoption of asubscriber without friends that have adopted the iPhone 3G.Let p0 represent the additional probability of adoption of asubscriber whose friends all adopted the iPhone 3G. Ac-cording to the results the “IV Probit Results” section pre-sented earier, p0 = 0.006 and p01 = 0.150. Therefore, the oddsratio in this case is given by [(p0 + p01)/(1 ! (p0 + p01)]/[ p0/(1! p0)] = 30.6. The standard error for the estimate of p01 is0.032, therefore a 95 percent confidence interval for this oddsratio is [16.9, 44.3]. This analysis shows that the effect ofpeer influence obtained with SIENA is similar to that obtainedthe “IV Probit Results” section using instrumental variables,which increases our confidence in our results.
The Effect of Cut-Points
We investigate whether variance in the structural propertiesof our communities relates to the heterogeneity in adoptionand peer influence across our communities. Table H1 inAppendix H shows the descriptive statistics for a number ofwell-known structural measures and Table H2 shows that anumber of them are highly correlated. The most striking rela-tionship between these measures and adoption arises for cut-points. Cut-points are small world bridges that connectblocks of subscribers that would otherwise be separated.Figure 11 highlights the role of cut-points in one of ourcommunities.
MIS Quarterly Vol. 38 No. 4/December 2014 1123

Godinho de Matos et al./Peer Influence in a Large Social Network
Figure 11. Cut-Points, Their Friends, and Some Blocks of Subscribers in One Community in OurSample
Cut-points serve as pathways for information to flow to theseblocks of subscribers that have no other connection to the“core” of the community. Communities with many cut-pointsmay be more fragile but also less redundant. Dense networkswith only a few cut-points may trigger inertia and be morelikely to exhibit the status quo, which, in our case, is littleadoption of the iPhone 3G.
Table 15 shows the results obtained from regressing adoptionon a subset of the measures identified in Table H1. Columns(1), (2), and (3) in this table show that communities with morecut-points have higher (monthly) adoption rates, more monthswith adoption, and adoption over longer periods of time,respectively. The fact that more cut-points is associated withmore adoption over a longer period of time shows the poten-tially important role of cut-points in spreading informationabout the iPhone 3G in these communities. These results areobtained after controlling for density, average path length, andaverage betweenness. Together, these covariates measurehow big a community is and how connected its members are.These covariates exhibit the expected signs in these regres-sions but only average path length is statistically significantin the last specification.
We also focus on the relationship between cut-points and peerinfluence. Cut-points can exert more influence over their
friends when the degree of the latter is low. Otherwise, cut-points are just one friend among many. Therefore, we look atwhether the effect of peer influence is different in com-munities with many cut-points whose friends have lowdegree. Column (4) in Table 15 shows the results obtainedusing the coefficient from the SIENA analysis as a measureof peer influence. Communities with many cut-points,namely above the median, exhibit more peer influence.However, this effect is attenuated by the degree of the friendsof the cut-points. Therefore, we find suggestive evidence thatcut-points play an important role in adoption and shape peerinfluence when their friends have few friends.
Policy Experiments
We test whether EuroMobile could have increased its profitby seeding the iPhone 3G to appropriate subscribers. Wecode the simulator described in Table I1 in the Appendix I forthis purpose. This simulator computes the expected numberof additional adopters (AA) as a function of the seedingstrategy (k), the number of seeds (n), an exogenous marginaleffect for peer influence (m) and a model for how consumers
1124 MIS Quarterly Vol. 38 No. 4/December 2014

Godinho de Matos et al./Peer Influence in a Large Social Network
Table 15. Regression Results
log(adoption_rate)(1)
months_with_adoption(2)
adoption_span(3)
peer-influence1
(4)
Density 1.560(5.806)
-5.168(19.627)
22.947(21.188)
22.266(17.293)
Average path length -0.120(0.119)
-0.534(0.401)
-0.759*(0.433)
-0.869*(0.477)
Average betweenness 0.001(0.002)
0.006(0.006)
0.004(0.007)
0.019**(0.007)
Number of cut-points 0.037***(0.014)
0.078*(0.047)
0.120**(0.050)
Average degree of cut-pointsfriends
-0.042(0.288)
High number of cut-points2 4.730**(2.320)
High number of cut-points *Average degree of cut-pointsfriends
-0.955**(0.446)
Constant -0.897*(0.475)
5.679***(1.607)
7.87***(1.735)
3.233(2.178)
Observations 153 153 153 153
R² 0.096 0.061 0.047 0.078
Adjusted R² 0.071 0.036 0.022 0.040
Residual Standard Error 0.567 (df = 148) 1.915 (df = 148) 2.068 (df = 148) 1.806 (df = 146)
F Statistic 3.922***(df = 4; 148)
2.423*(df = 4; 148)
1.843(df = 4; 148)
2.057*(df = 6; 146)
Note 1: Peer influence measured by the coefficient obtained in the SIENA analysis. Note 2: High number of cut-points indicates a communitywith more cut-points than the median. *p < 0.1; **p < 0.05; ***p < 0.01
decide whether to purchase the iPhone 3G. Table 16 definesthe five seeding strategies considered. These are commonheuristics used in marketing as described in Watts et al.(2007) and Hinz et al. (2011). We use the estimate for themarginal effect of peer influence obtained in the “IV ProbitResults” section in our simulations. Therefore, they applyonly to treated subscribers as discussed in the “IdentificationStrategy” section.
For each set of parameters, we present results for month 11(T) in our panel. These results are averages over 1,000simulations. We provide three types of results. Figure 12shows the number of additional adopters as a function of theseeding policy, the number of seeds, and the exogenousmarginal effect of peer influence. We observe that local andglobal degree yield the largest number of additional adopters. Random seeding performs poorly but global low degreeperforms even worse.
Figure 13 shows the cost to revenue ratio C/R that allowsEuroMobile to breakeven as a function of the seeding stra-
tegy, the number of seeds and the exogenous marginal effectof peer influence when EuroMobile subsidizes 50 percent ofthe handset to the seeds (ν = 0.5).25
We observe again that local and global degree perform thebest. However, the former strategy allows for significantlyhigher C/R ratios for small sized campaigns.
Finally, Figure 14 shows the ratio of EuroMobile profits withseeding relative to no seeding for C/R = 0.526 and ν = 0.5.27
25C is the cost of iPhone 3G to EuroMobile and R is the price charged byEuroMobile per handset. The revenue generated by EuroMobile fromseeding the iPhone 30 is given by AA(R – C). The cost of seeding is givenby nR(1 – v). Therefore, EuroMobile breaks even when C /R = 1 – (1 –v)n/AA.
26According to iSuppli (http://www.isuppli.com/), the marginal cost of theiPhone 3G is roughly 50 percent of the revenue.
27The profit with seeding is given by AA(R – C) – nR(1 – ν) whereas theprofit without seeding must have been AO(R – C).
MIS Quarterly Vol. 38 No. 4/December 2014 1125

Godinho de Matos et al./Peer Influence in a Large Social Network
Table 16. Seeding Policy Interventions Tested
Policy t = 0 Policy Description
Random Award the iPhone 3G to a random sample of n subscribers in S
Global Degree Award the iPhone 3G to the n subscribers in S with highest degree
GlobalBetweenness
Award the iPhone 3G to n subscribers in S with highest betweenness
Local Degree Randomly select n communities with replacement and at each draw award the iPhone 3G to thesubscriber with the highest degree in that community without and iPhone 3G
Low Degree Award the iPhone 3G to the n subscribers in S with lowest degree
Figure 12. Additional Adopters as a Function of the Seeding Policy, Marginal Peer Effect, and Numberof Seeds
1126 MIS Quarterly Vol. 38 No. 4/December 2014

Godinho de Matos et al./Peer Influence in a Large Social Network
Figure 13. Additional Adopters as a Function of the Seeding Policy, Marginal Peer Effect, and Numberof Seeds
We observe that EuroMobile can hardly benefit from seedingthe iPhone 3G given the modest marginal effects of peerinfluence found in this paper. However, these results are verysensitive to how much EuroMobile subsidizes the iPhone 3Gto the seeds. Figure 15 shows that EuroMobile can actuallydouble its profit by using local or global degree to seed 5,000subscribers when the marginal effect of peer influence istwice as much as that observed in our data and the subsidy isrelatively small.
In sum, the effect of peer influence found in this paper issmaller than other peer effects reported in the literature suchas in Aral and Walker (2011) and Bapna and Umyarov(2014). However, the settings in these papers are not directlycomparable to ours. In particular, we study the effect of peerinfluence for an expensive new handset. It is, therefore,
reasonable to observe a smaller effect of peer influence in ourcase. In fact, our paper shows that the potential of viral mar-keting strategies for expensive physical products might not bethe same as for inexpensive digital products. While theremight still be peer influence in the former, ultimately thedecision to adopt lies with each consumer individually andpurchasing expensive products entails significant financialrisks that previous studies have not been able to capture.
Conclusions
This paper complements the literature that looks at contagionin the case of cheap and free digital goods by studying theeffect of peer influence in the diffusion of a costly physical
MIS Quarterly Vol. 38 No. 4/December 2014 1127

Godinho de Matos et al./Peer Influence in a Large Social Network
Figure 14. Additional Adopters as a Function of the Seeding Policy, Marginal Peer Effect, and Numberof Seeds
product. We argue that the results previously reported in theliterature do not extend to costly products but studying thelatter type of products provides for more realistic settings. Inparticular, it is hard for firms to breakeven when seedingcostly goods to benefit from peer influence. In these cases,the effect of peer influence would need to be significant inmagnitude to compensate for the high costs of seeding. Inthis paper we show that while there is peer influence in theadoption of the iPhone 3G, the magnitude of the effect willhardly justify seeding iPhones for free. Firms seeding othercostly products are likely to face similar concerns and thusthink that mass marketing is more appropriate in these cases.Yet, two additional alternatives might be considered. One isto reduce the cost of seeding. Instead of offering the productfor free, firms can try to offer the product to seeds at adiscount. This will facilitate breaking even. However, it maybe hard to convince consumers to purchase costly productseven when these are offered at discounted prices. Another
approach is to explicitly incentivize peer influence, forexample, offering the product, for free or at a discount, toseeds that bring friends who may also purchase the product. This way, the firm actively rewards peer influence, which isthus likely to increase to a level that allows for breaking even.
We contribute with a new methodology to measure the effectof peer influence using observational data, which rests onidentifying tight communities of likely adopters when adop-tion is a rare event and exploring the structure of the socialnetwork to derive instrumental variables at the individuallevel. We develop a new algorithm capable of identifyingthese communities in large network graphs. This algorithmcan be easily applied in other settings where the productstudied is expensive, which is likely to lead to little adoption.We work with a major European cell phone provider(EuroMobile) to study the role of peer influence in the diffu-sion of the iPhone 3G. We use call detailed records (CDRs)
1128 MIS Quarterly Vol. 38 No. 4/December 2014

Godinho de Matos et al./Peer Influence in a Large Social Network
Figure 15. Additional Adopters as a Function of the Seeding Policy, Marginal Peer Effect, and Numberof Seeds
from millions of EuroMobile users that we follow over aperiod of 11 months. We infer a social graph across usersusing these CDRs and identify tight communities of friendswhose majority of calling behavior occurs inside thecommunity. We work with 263 non-overlapping communitiescomprising 24,131 users of which 1,758 adopted the iPhone3G. We posit that the subscribers’ decision to adopt theiPhone 3G depends on whether their friends adopted thishandset. Yet, unobserved heterogeneity correlated withfriends’ adoption may render our estimates of peer influencebiased. We add a number of dummy variables to our modelto control for heterogeneity across regions, across subscribers,and over time. Furthermore, we also examine adoption withthe adoption of the friends of the friends of the ego not friendsof the ego living in cities other than where the ego does. Weprovide a series of results showing the appropriateness androbustness of this instrument.
We show that if all friends adopt the iPhone 3G, then theego’s probability to adopt increases by 15 percent on average.Using this estimate, we show that peer influence might haveaccounted for roughly 14 percent of iPhone 3G sales atEuroMobile during the 11 months of data we analyze. Wealso use SIENA, which is an implementation of a stochasticactor-nased model for the coevolution of network dynamicsand behavior, to model a time-varying social network inwhich subscribers can adopt the iPhone 3G. Using SIENAwe find an effect of peer influence consistent both in statis-tical significance and magnitude with our IV estimates, whichincreases our confidence in our findings. We use differentsnapshots of our data to parameterize these simulations and allof them yield similar results. Finally, we provide results fromseveral policy simulations showing that, with the modestmagnitude of the effect of peer influence found in this paper,EuroMobile would have hardly benefitted from using com-
MIS Quarterly Vol. 38 No. 4/December 2014 1129

Godinho de Matos et al./Peer Influence in a Large Social Network
mon marketing strategies to seed the iPhone 3G as a way toaccelerate its diffusion. This finding, however, dependshighly on how much the handset is subsidized to the seeds.
Our paper also comes with limitations. Our analysis relies ona single random sample of communities derived from theCDRs. While identifying communities is important to controlfor unobserved confounders that can drive both adoption andsocial proximity, it is still the case that the clustering criteriawe used are not unique and even multiple runs of our samp-ling strategy could produce different communities whichcould, in principle, lead to additional variance in our results.Yet, we show that most of the algorithms previously used inthe literature to identify communities cannot process real-world, large social networks. We use CDRs to proxy socialproximity. However, we know that subscribers in our samplemust have communicated over other channels, such as face-to-face meetings, e-mail, Twitter, and Facebook, which wecannot measure. In addition, EuroMobile was not the onlywireless provider in the country analyzed and thus the sub-scribers we analyzed had friends that we could not observe.Still, the second and the third largest providers in this countrydid not launch the iPhone 3G until much later, which reducessignificantly the likelihood of having friends with othercarriers that adopted the iPhone 3G. Finally, we identify theeffect of peer influence but we are unable to determine theunderlying mechanism by which influence occurs, such asinformation transmission, competition, or conformity.
Acknowledgments
This work was partially supported by the CMU-Portugal Programthrough Ph.D. fellowship SFRH/BD/33772/2009, and by the iLaband the Living Analytics Research Center at the Heinz College. Wealso thank our Industrial Partner for their support. We thank thesenior editor, the associate editor, and two anonymous reviewers fortheir valuable comments and ideas throughout the review process ofthis paper. We thank Rahul Telang and Rodrigo Belo for valuablecomments to earlier versions of this paper and for many brain-storming sessions. We also thank participants in the InternationalConference on Information Systems (2012) and in the Symposiumon Statistical Challenges in e-Commerce Research (2012) for thevaluable feedback received. All remaining errors are our own.
References
Allison, P. D. 1982. “Discrete-Time Methods for the Analysis ofEvent Histories,” SociologicalMethodology (13), pp. 61-98.
Anagnostopoulos, A., Kumar, R., and Mahdian, M. 2008. “Influ-ence and Correlation in Social Networks,” in Proceedings of the14th ACM SIGKDD International Conference on KnowledgeDiscovery and Data Mining, New York: ACM, pp. 7-15.
Angrist, J. D., Imbens, G. W., and Rubin, D. B. 1996. “Identi-fication of Causal Effects Using Instrumental Variables,” Journalof the American Statistical Association (91:434), pp. 444-455.
Aral, S. 2010. “Commentary—Identifying Social Influence: AComment on Opinion Leadership and Social Contagion in NewProduct Diffusion,” Marketing Science (30:2), pp. 217-223.
Aral, S., Muchnik, L., and Sundararajan, A. 2009. “DistinguishingInfluence Based Contagion from Homophily-Driven Diffusion inDynamic Networks,” Proceedings of the National Academy ofSciences (106:51), pp. 21544-21549.
Aral, S., and Walker, D. 2011. “Creating Social Contagion throughViral Product Design: A Randomized Trial of Peer Influence inNetworks,” Management Science (57:9), pp. 1623-1639.
Bagrow, J., and Bollt, E. 2004. “A Local Method for DetectingCommunities,” Physical Review E (72:4), p. 045108-1–045108-10.
Bapna, R., and Umyarov, A. 2014. “Do Your Online Friends MakeYou Pay? A Randomized Field Experiment in an Online MusicSocial Network,” Management Science, forthcoming.
Blondel, V. D., Guillaume, J.-L., Lambiotte, R., and Lefebvre, E. 2008. “Fast Unfolding of Communities in Large Networks,”Journal of Statistical Mechanics: Theory and Experiment (8:10),P10008.
Bloom, H. S. 1984. “Accounting for No-Shows in ExperimentalEvaluation Designs,” Evaluation Review (8:2), pp. 225-246.
Botelho, A., and Pinto, L. C. 2004. “The Diffusion of CellularPhones in Portugal,” Telecommunications Policy (28:5-6), pp.427-437.
Boucher, V., Bramoulle, Y., Djebbari, H., and Fortin, B. 2010. “DoPeers Affect Student Achievement? Evidence from CanadaUsing Group Size Variation,” Journal of Applied Econometrics(29:1), pp. 91-109.
Bramoulle, Y., Djebbari, H., and Fortin, B. 2009. “Identification ofPeer Effects through Social Networks,” Journal of Econometrics(150:1), pp. 41-55.
Brynjolfsson, E., and Kemerer, C. F. 1996. “Network Externalitiesin Microcomputer Software: An Econometric Analysis of theSpreadsheet Market,” Management Science (42:12), pp.1627-1647.
Burt, R. S. 1987. “Social Contagion and Innovation: CohesionVersus Structural Equivalence,” American Journal of Sociology(92:6), pp. 1287-1335.
Carrell, S. E., Fullerton, R. L., and West, J. E. 2009. “Does YourCohort Matter? Measuring Peer Effects in CollegeAchievement,” Journal of Labor Economics (27:3), pp. 439-464.
Case, A. C., and Katz, L. F. 1991. “The Company You Keep: TheEffects of Family and Neighborhood on Disadvantaged Youths,” National Bureau of Economic Research Working Paper SeriesNo. 3705.
Chu, W.-L., Wu, F.-S., Kao, K.-S., and Yen, D. C. 2009. “Diffusion of Mobile Telephony: An Empirical Study inTaiwan,” Telecommunications Policy (33:9), pp. 506-520.
Clauset, A., Newman, M. E. J. , and Moore, C. 2004. “FindingCommunity Structure in Very Large Networks,” Physical Review(70:6), 066111.
1130 MIS Quarterly Vol. 38 No. 4/December 2014

Godinho de Matos et al./Peer Influence in a Large Social Network
Coleman, J. S., Katz, E., Menzel, H., and Bureau of Applied SocialResearch. 1966. Medical Innovation: A Diffusion Study,Indianapolis, IN: Bobbs-Merrill Co.
Csardi, G., and Nepusz, T. 2005. iGraph Reference Manual(http://igraph.org/c/doc/igraph-docs.pdf).
DerSimonian, R., and Laird, N. 1986. “Meta-Analysis in ClinicalTrials,” Controlled Clinical Trials (7:3), pp. 177-188.
Doganoglu, T., and Grzybowski, L. 2007. “Estimating NetworkEffects in Mobile Telephony in Germany,” InformationEconomics and Policy (19:1), pp. 65-79.
Donetti, L., and Munoz, M. A. 2005. “Improved SpectralAlgorithm for the Detection of Network Communities,” AIPConference Proceedings (779:1), pp. 104-107.
Duch, J., and Arenas, A. 2005. “Community Detection in ComplexNetworks Using Extremal Optimization,” Physical Review E(72:2), p. 027104.
Economist, The. 2011. “Nokia at the Crossroads: BlazingPlatforms,” The Economist, February 10.
Fortunato, S. 2010. “Community Detection in Graphs,” PhysicsReports (486:3-5), pp. 75-174.
Fortunato, S., and Barthelemy, N. 2007. “Resolution Limit inCommunity Detection,” Proceedings of the National Academyof Sciences (104:1), pp. 36-41.
Fortunato, S., Latora, V., and Marchiori, M. 2004. “A Method toFind Community Structures Based on Information Centrality,”Physical Review E (70), p. 056104.
Gefen, D., and Straub, D. W. 1997. “Gender Differences in thePerception and Use of E-Mail: An Extension to the TechnologyAcceptance Model,” MIS Quarterly (21:4), pp. 389-400.
Girvan, M., and Newman, M. E. J. 2002. “Community Structure inSocial and Biological Networks,” Proceedings of the NationalAcademy of Sciences of the United States of America (99:12), p.7821.
Gruber, H. 2001. “Competition and Innovation: The Diffusion ofMobile Telecommunications in Central and Eastern Europe,”Information Economics and Policy (13:1), pp. 19-34.
Hedges, L. V., and Olkin, I. 1985. Statistical Methods for Meta-Analysis (1st ed.), New York: Academic Press.
Hedström, P. 1994. “Contagious Collectivities: On the SpatialDiffusion of Swedish Trade Unions, 1890-1940,” AmericanJournal of Sociology (99:5), pp. 1157-1179.
Hinz, O., Skiera, B., Barrot, C., and Becker, J. U. 2011. “SeedingStrategies for Viral Marketing: An Empirical Comparison,”Journal of Marketing (75:6), pp. 55-71.
Hlavac, M. 2013. “Stargazer: LaTeX Code and ASCII Text forWell-Formatted Regression and Summary Statistics Tables,”https://sites.google.com/site/marekhlavac/stargazer.
Huedo-Medina, T. B., Sánchez-Meca, J., Marín-Martínez, F., andBotella, J. 2006. “Assessing Heterogeneity in Meta-Analysis: Q Statistic or i2 Index?,” Psychological Methods (11:2), pp. 193-206.
Imbens, G. W., and Angrist, J. D. 1994. “Identification and Estima-tion of Local Average Treatment Effects,” Econometrica (62:2),pp. 467-475.
ITU. 2011. “The World in 2011: ICT Facts and Figures,”International Telecommunication Union, Geneva.
Karahanna, E., Agarwal, A., and Angst, C. M. 2006. “Reconcep-tualizing Compatibility Beliefs in Technology AcceptanceResearch,” MIS Quarterly (30:4), pp. 781-804.
Katz, E., and Lazarfeld, P. F. 1955. Personal Influence: The PartPlayed by People in the Flow of Mass Communications, Glencoe,IL: The Free Press .
Katz, M. L., and Shapiro, C. 1986. “Technology Adoption in thePresence of Network Externalities,” Journal of PoliticalEconomy (94:4), pp. 822-841.
Katz, M. L., and Shapiro, C. 1994. “Systems Competition andNetwork Effects,” The Journal of Economic Perspectives (8:2),pp. 93-115.
Knapp, G., and Hartung, J. 2003. “Improved Tests for a RandomEffects Meta-Regression with a Single Covariate,” Statistics inMedicine (22), pp. 2693-2710.
Krackhardt, D., and Stern, R. N. 1988. “Informal Networks andOrganizational Crises: An Experimental Simulation,” SocialPsychology Quarterly (51:2), pp. 123-140.
Lancichinetti, A., and Fortunato, S. 2009. “Community DetectionAlgorithms: A Comparative Analysis,” Physical Review E(80:5), p. 056117.
Lancichinetti, A., Fortunato, S., and Radicchi, F. 2008. “Bench-mark Graphs for Testing Community Detection Algorithms,”Physical Review E (78:4), p. 046110.
Lau, J., Antman, E. M., Jimenez-Silva, J., Kupelnick, B., Mosteller,F., and Chalmers, T. C. 1992. “Cumulative Meta-Analysis ofTherapeutic Trials for Myocardial Infarction,” New EnglandJournal of Medicine (327:4), pp. 248-254.
Leenders, R. T. A. J. 2002. “Modeling Social Influence throughNetwork Autocorrelation: Constructing the Weight Matrix.”Social Networks (24:1), pp. 21-47.
Leskovec, J., Adamic, L. A., and Huberman, B. A. 2007. “TheDynamics of Viral Marketing,” ACM Transactions on the Web(1:1), Article 5.
Leskovec, J., Lang, K. J., Dasgupta, A., and Mahoney, M. W. 2009. “Community Structure in Large Networks: Natural Cluster Sizesand the Absence of Large Well-Defined Clusters,” InternetMathematics (6:1), pp. 29-123.
Ma, L., Krishnan, R., and Montgomery, A. 2010. “Homophily orInfluence? An Empirical Analysis of Purchase Within a SocialNetwork,” Working Paper, Carnegie Mellon University.
Mahajan, V. 1985. Models for Innovation Diffusion, NewburyPark, CA: Sage Publications, Inc.
Manski, C. F. 1993. “Identification of Endogenous Social Effects:The Reflection Problem,” The Review of Economic Studies(60:3), pp. 531-542.
McConnell, J. D. 1968. “The Price–Quality Relationship in anExperimental Setting,” Journal of Marketing Research (5:3), pp.300-303.
McPherson, M., Smith-Lovin, L., and Cook, J. M. 2001. “Birds ofa Feather: Homophily in Social Networks,” Annual Review ofSociology (27:1), pp. 415-444.
Menzel, H. 1960. “Innovation, Integration, and Marginality: ASurvey of Physicians,” American Sociological Review (25:2), pp.704-713.
MIS Quarterly Vol. 38 No. 4/December 2014 1131

Godinho de Matos et al./Peer Influence in a Large Social Network
Mercken, L., Snijders, T. A. B., Steglich, C., Vartiainen, E., deVries, H. 2010. “Dynamics of Adolescent Friendship Networksand Smoking Behavior,” Social Networks (32:1), pp. 72-81.
Newman, M. E. J. 2003. “Fast Algorithm for Detecting Commu-nity Structure in Networks,” Physical Review E (69), p. 066133.
Newman, M. E. J. 2006. “Modularity and Community Structure inMetworks,” Proceedings of the National Academy of Sciences(103:23), pp. 8577-8582.
Newman, M. E. J., and Givran, M. 2004. “Finding and EvaluatingCommunity Structure in Networks,” Physical Review E (69:2),p. 026113.
Oestreicher-Singer, G., and Sundararajan, A. 2012. “The VisibleHand? Demand Effects of Recommendation Networks in Elec-tronic Markets,” Management Science (58:11), pp. 1963-1981.
Palla, G., Derényi, I., Farkas, I., and Vicsek, T. 2005. “Uncoveringthe Overlapping Community Structure of Complex Networks inNature and Society,” Nature (435:7043), pp. 814-818.
Park, Y., and Ueda, M. 2011. “A Comparative Study on theDiffusion of Smartphones in Korea and Japan,” in Proceedingsof the IEEE/IPSJ 11th International Symposium on Applicationsand the Internet, Los Alamitos, CA: IEEE Computer Society, pp.545-549.
Paule, R. C., and Mandel, J. 1982. “Consensus Values andWeighting Factors,” Journal of Research of the National Bureauof Standards (87:5), pp. 377-385.
Pons, P., and Latapy, M. 2006. “Computing Communities in LargeNetworks Using Random Walks,” Journal of Graph Algorithmsand Applications (10:2), pp. 191-218.
Radicchi, F., Castellano, C., Cecconi, F., Loreto, V., and Parisim, D. 2004. “Defining and Identifying Communities in Networks,”Proceedings of the National Academy of Sciences of the UnitedStates of America (101:9), pp. 2658-2663.
Rao, N., Mobius, M. M., and Rosenblat, T. 2007. “Social Networksand Vaccination Decisions,” Working Paper No. 07-12, FederalReserve Bank of Boston.
Ripley, R. M., and Snijders, T. A. B. 2010. Manual for SIENAVersion 4.0, University of Oxford, Department of Statistics &Nuffield College.
Rogers, E. M. 1995. “Diffusion of Innovations,” New York: FreePress.
Rohlfs, J. 1974. “A Theory of Interdependent Demand for aCommunications Service,” The Bell Journal of Economics andManagement Science (5:1), pp. 16-37.
Romer, D., Black, M., Ricardo, I., Feigelman, S., Kaljee, L.,Galbraith, J., Nesbit, R., Hornik, R. C., and Stanton, B. 1994.“Social Influences on the Sexual Behavior of Youth at Risk forHIV Exposure,” American Journal of Public Health (84:6), pp.977-985.
Rosvall, M., and Bergstrom, C. T. 2008. “Maps of Random Walkson Complex Networks Reveal Community Structure,”Proceedings of the National Academy of Sciences (105:4), pp. 1118-1123.
Rukhin, A. L., Biggerstaff, B. J., and Vangel, M. G. 2000. “Restricted Maximum Likelihood Estimation of a Common Meanand the Mandel-Paule Algorithm,” Journal of StatisticalPlanning and Inference (83:2), pp. 319-330.
Sacerdote, B. 2001. “Peer Effects with Random Assignment: Results for Dartmouth Roommates,” The Quarterly Journal ofEconomics (116:2), pp. 681-704.
Saloner, G., and Shepard, A. 1995. “Adoption of Technologieswith Network Effects: An Empirical Examination of theAdoption of Automated Teller Machines,” The RAND Journal ofEconomics (26:3), pp. 479-501.
Shalizi, C. R., and Thomas, A. C. 2011. “Homophily and Conta-gion Are Generically Confounded in Observational SocialNetwork Studies,” Sociological Methods & Research (40:2), pp. 211-239.
Shampanier, K., Mazar, N., and Ariely, D. 2007. “Zero as a SpecialPrice: The True Value of Free Products,” Marketing Science(26:6), pp. 742-757.
Shiv, B., Carmon, Z., and Ariely, D. 2005. “Placebo Effects ofMarketing Actions: Consumers May Get What They Pay For,” Journal of Marketing Research (42:4), pp. 383-393.
Singh, S. K. 2008. “The Diffusion of Mobile Phones in India,”Telecommunications Policy (32:9-10), pp. 642-651.
Snijders, T. A. B. 1996. “Stochastic Actor-Oriented Models forNetwork Change,” Journal of Mathematical Sociology (21:1-2),pp. 149-172.
Snijders, T. A. B., van de Bunt, G. G., and Steglich, C. E. G. 2010. “Introduction to Stochastic Actor-Based Models for NetworkDynamics,” Social Networks (32:1), pp. 44-60.
Stafford, J. E., and Enis, B. M. 1969. “The Price–QualityRelationship: An Extension,” Journal of Marketing Research(6), pp. 456-458.
Strang, D., and Soule, S. A. 1998. “Diffusion in Organizations andSocial Movements: From Hybrid Corn to Poison Pills,” AnnualReview of Sociology (24), pp. 265-290.
Strang, D., and Tuma, N. B. 1993. “Spatial and TemporalHeterogeneity in Diffusion,” American Journal of Sociology(99:3), pp. 614-639.
Tillema, T., Dijst, M., and Schwanen, T. 2010. “Face-to-Face andElectronic Communications in Maintaining Social Networks: The Influence of Geographical and Relational Distance and ofInformation Content,” New Media & Society (12:6), pp. 965-983.
Tucker, C. 2008. “Identifying Formal and Informal Influence inTechnology Adoption with Network Externalities,” ManagementScience (54:12), pp. 2024-2038.
Valente, T. W. 1996a. “Network Models of the Diffusion of Inno-vations,” Computational and Mathematical Organization Theory(2:2), pp. 163-164.
Valente, T. W. 1996b. “Social Network Thresholds in theDiffusion of Innovations,” Social Networks (18:1), pp. 69-89.
Vakulenko, M. 2011. “Mobile Platforms: The Clash of Eco-systems,” Vision Mobile, November 7 (http://www.visionmobile.com/blog/2011/11/new-report-mobile-platforms-the-clash-of-ecosystems/).
Van den Bulte, C., and Lilien, G. L. 2001. “Medical InnovationRevisited: Social Contagion Versus Marketing Effort,” TheAmerican Journal of Sociology (106:5), pp. 1409-1435.
Venkatesh, V., and Morris, M. G. 2000. “Why Don’t Men EverStop to Ask for Directions? Gender, Social Influence, and TheirRole in Technology Acceptance and Usage Behavior,” MISQuarterly (24:1), pp. 115-139.
1132 MIS Quarterly Vol. 38 No. 4/December 2014
Godinho de Matos et al./Peer Influence in a Large Social Network
Venkatesh, V., Morris, M. G., Davis, G. B., and Davis, F. D. 2003. “User Acceptance of Information Technology: Toward a UnifiedView,” MIS Quarterly (27:3), pp. 425-478.
Viechtbauer, W. 2010. “Conducting Meta-Analyses in R with theMetafor Package,” Journal of Statistical Software (36:3), pp.1-48.
Wasserman, S., and Faust, K. 1994. Dynamic Network Analysis: Methods and Applications, New York: Cambridge UniversityPress.
Watts, D. J, Peretti, J., and Harvard Business School. 2007. ViralMarketing for the Real World, Boston: Harvard Business School.
Wickham, H., 2009. ggplot2: Elegant Graphics for Data Analysis,New York: Springer.
Wooldridge, J. M. 2002. Econometric Analysis of Cross Sectionand Panel Data. Cambridge, MA: The MIT Press.
Wooldridge, J. M., and Imbens, G. 2007. “What’s New inEconometrics?,” National Bureau of Economic Research(http://www.nber.org/WNE/lect_13_weakmany_iv.pdf).
Zhang, B., and Krackhardt, D. 2010. “Keeping up with the Joneses: an Empirical Investigation of Contagion on CRBT Adoption,”Working Paper, Carnegie Mellon University.
Zhang, B., Krackhardt, D., Krishnan, R., and Doreian, P. 2011. “An Effective and Efficient Subpopulation Extraction Method inVery Large Social Networks,” in Proceedings of the 32nd Inter-national Conference on Informatoin Systems, Shanghai (http://aisel.aisnet.org/icis2011/proceedings/breakthroughideas/7).
Zheng, K., Padrnan, R., Krackhardt, D., Johnson, M. P., andDiamond, H. S. 2010. “Social Networks and Physician Adop-tion of Electronic Health Records: Insights from an EmpiricalStudy,” Journal of the American Medical Informatics (17:3), pp.328-336.
Zhou, H., and Lipowsky, R. 2004. “Network Brownian Motion: AHew Method to Measure Vertex-Vertex Proximity and to IdentifyCommunities and Subcommunities,” Computational Science-ICCS, Berlin: Springer-Verlag, pp. 1062-1069.
About the Authors
Miguel Godinho de Matos is a post-doctoral researcher ofInformation Systems and Management at both Heinz College and
Católica Lisbon School of Business and Economics. He received aPh.D. in Telecommunications Policy and Management and a M.Sc. in Engineering and Public Policy from Carnegie Mellon University.Miguel’s research interests focus on the analysis of social networksand peer influence on consumer behavior and the impact ofdigitization on consumer search and choice. Miguel has publishedhis work in top peer-reviewed research conferences such as theInternational Conference of Information Systems, IEEE Conferenceon Social Computing and the Economics of Digitization SeminarSeries of the National Bureau of Economic Research.
Pedro Ferreira is an assistant professor of Information Systems andManagement at the Heinz College and at the Department ofEngineering and Public Policy, Carnegie Mellon University. Hereceived a Ph.D. in Telecommunications Policy from CMU and aM.Sc. in Electrical Engineering and Computer Science from theMassachusetts Institute of Technology. Pedro’s research interestslie in two major domains: identifying causal effects in densenetwork settings, with direct application to understanding the futureof the digital media industry, and the evolving role of technology inthe economics of education. Currently, he is working on a series oflarge-scale randomized experiments in network settings looking atidentifying the role of peer influence in the consumption of media. Pedro has published in top journals and top peer-reviewed researchconferences such as Management Science and the IEEE Conferenceon Social Computing.
David Krackhardt is a professor of organization at the HeinzCollege of Public Policy and the Tepper School of Business,Carnegie Mellon University. He received his Ph.D. in organi-zational behavior from the University of California, Irvine. Hisprimary focus is the development of theories and methods for thestudy of social networks, especially within organizations. He haspublished in top journals in the fields of anthropology, sociology,psychology, management, information systems, medicine, andstatistics. He has served on the editorial boards of several leadingjournals, including Administrative Science Quarterly, Academy ofManagement Journal, and Computational and MathematicalOrganizational Theory. He is the founding editor of Journal ofSocial Structure and currently serves as an associate editor forNetwork Science.
MIS Quarterly Vol. 38 No. 4/December 2014 1133

1134 MIS Quarterly Vol. 38 No. 4/December 2014

RESEARCH ARTICLE
PEER INFLUENCE IN THE DIFFUSION OF IPHONE 3GOVER A LARGE SOCIAL NETWORK
Miguel Godinho de MatosHeinz College, Carnegie Mellon University, Pittsburgh, PA 15213-3890 U.S.A. {[email protected]} and
Católica Lisbon School of Business and Economics, Palma de Cima, 1649-023 Lisbon, PORTUGAL
Pedro FerreiraHeinz College and Department of Engineering and Public Policy, Carnegie Mellon University,
Pittsburgh, PA 15213-3890 U.S.A. {[email protected]}
David KrackhardtHeinz College, Carnegie Mellon University, Pittsburgh, PA 15213-3890 U.S.A. {[email protected]}
Appendix A
Modified T-CLAP Algorithm
Our modified version of T-CLAP snowballs from a random adopter with depth d (three, in the case of our paper) and keeps pruning subscribersfrom this sample while the resulting community has more than s subscribers (115, in the case of our paper). H is the social network graph. H. S is the set of subscribers in this graph and A the set of adopters. The algorithm identifies the subscribers in H that are not adopters withthe lowest IER. These subscribers are kept in set V. If V is empty, then the algorithm identifies the subscribers in H that are adopters with thelowest IER. These subscribers are kept in V. This allows us to prune non-adopters with higher probability. A subscriber from V is then selectedat random and removed from H. This can, however, separate H into disjoint graphs. If this is the case, then H keeps only the subgraph withthe highest IER (ties decided at random).
MIS Quarterly Vol. 38 No. 4—Appendices/December 2014 A1

Godinho de Matos et al./Peer Influence in a Large Social Network
Table A1. Pseudocode of the Modified Version of T-CLAPVariablesG Network graphA Subset of adoptersd Maximum community depth s Target size for communities
Auxiliary variablesH Network graphV Set of subscribersC Set of network graphs
Algorithmfunction MTCLAP(G,A,s) - Modified T-CLAP
return NP(G, Snowball(G,random seed, d), A, s)end function
function NP(G,H ,A,s) - Node PruningCompute H .S.IE Rwhile |H .S| > s do
V = SubscribersLowestIE R(H , A)H = Subgraph(H ,V \ {v 0 V chosen at random })H = Com ponentH ighestIE R(H )
end whilereturn H
end function
function SUBSCRIBERSLOWESTIER(H ,A)V = {H .S(i) \ A : H .S(i).IE R = min{H .S.IE R}}if V.S == 0/ then
V = {H .S(i) : H .S(i).IE R = min{H .S.IE R}}end ifreturn V
end function
function COMPONENTHIGHESTIER(H )C = Com ponents(H )Compute C.IE RC = {C(k) 0 C : C(k).IE R = max{C.IE R}}return {c 0 C chosen at random}
end function
A2 MIS Quarterly Vol. 38 No. 4—Appendices/December 2014

Godinho de Matos et al./Peer Influence in a Large Social Network
Appendix B
Computing Our Instrumental Variables
Our dataset contains information that identifies the cellular towers that are used in each and every call placed or received by EuroMobilesubscribers. Cellular towers are associated with GPS coordinates that allow us to track subscribers through space and time. For every callplaced or received, we use the GPS coordinates of the cell towers to determine the NUTS-III region where the initiator and the recipient arelocated. We then use the mode of the NUTS-III regions obtained to determine the primary region for each individual (the one where he is mostoften observed). Cell tower ranges can cover from 1 km up to 30 km. Therefore, there is some uncertainty associated with the true locationof each subscriber, particularly in regions with low population density where there are few cell towers with broad ranges. On average, we used753.2 calls to identify the primary region of each subscriber.
NUTS codes (nomenclature of territorial units for statistics) are statistical divisions of the economic territory use throughout the EuropeanUnion designed to develop consistent regional statistics across countries (http://epp.eurostat.ec.europa.eu/). We choose NUTS-III for ouranalysis because, by construction, NUTS-III represents contiguous municipalities that face similar economic and development challenges andwithin which people are likely to move substantially. We only know the location of a subscriber when she places or receives a call. UsingNUTS-III ensures that we use large enough regions so that each subscriber moves most of the time within the region rather than betweenregions. Furthermore, we also try to capture the fact that the socio-economic challenges faced by subscribers within the same NUTS-III aresimilar. Figure B1 depicts the number of NUTS-III codes where each subscriber was seen receiving or placing calls. The average number ofNUTS-III per subscriber, for the entire population of subscribers, is 5.9 with a standard deviation of 4.5. Still, about 25 percent of thesubscribers were seen placing or receiving calls within a single NUTS-III region. iPhone 3G adopters were more mobile than the average userwith 10.4 NUTS-III per subscriber on average and a standard deviation of 5.6. This fact does not affect our separation strategy because lookingin detail at the number of calls that allowed for identifying each subscriber within each NUTS-III, an overwhelming majority of them wereplaced or received within the primary NUTS-III region. This is true both overall and for the iPhone 3G adopters in particular. This highlightsthat people do move around in their daily lives (particularly when considering a large span of time such as 11 months), but they tend to staywithin their primary region most of the time. Therefore, people with distinct primary (NUTS-III) regions will be clearly separatedgeographically almost all of the time. Figure B2 shows that the average proportion of calls placed within the primary NUTS-III region acrosssubscribers is 83 percent (median 88 percent) overall and 78 percent (median 82 percent) for iPhone 3G adopters.
Figure B1. Number of NUTS-III Codes Where Subscribers Received or Placed Calls from August 2008until July 2009
MIS Quarterly Vol. 38 No. 4—Appendices/December 2014 A3

Godinho de Matos et al./Peer Influence in a Large Social Network
Figure B2. Proportion of Phone Calls Within the Primary NUTS-III Region from August 2008 untilJuly 2009
Appendix C
Community Sample Details
Table C1 shows the number of observations included in the regressions reported in the “Results for Peer Influence” section of the paper. Fromthe original 263 communities with 24,131 users, we discarded 44 adopters and 241 non-adopters. These users were removed from the samplebecause of missing data for tenure, mobileNet ,and/or the dummies that described the previous handset that they owned. As a consequence,5 out of the 263 communities were removed from the sample because they had no adopters. Including them in the analysis would generatea problem of complete separation of the outcome (Albert and Anderson 1984). These 5 communities had 711 subscribers. An additional 269subscribers were also removed from the sample because they lived in zip codes where no one else adopted the iPhone 3G. Again, includingthem would lead to a problem of perfect separation of the outcome. Therefore, we estimate our model using 258 communities with a total of23,151 subscribers of which 1,714 adopted the iPhone 3G during the period of analysis.
Table C1. Observations Used in the Estimation of Our Empirical Model
Time
Adoption
TotalNo Yes
0123456789
1011
22,78222,55822,40322,25422,13321,94521,81321,73921,64221,56521,47721,437
3692241551491211881327497778840
23,15122,78222,55822,40322,25422,13321,94521,81321,73921,64221,56521,477
Total 263,748 1,714 265,462
A4 MIS Quarterly Vol. 38 No. 4—Appendices/December 2014

Godinho de Matos et al./Peer Influence in a Large Social Network
Appendix D
Complete Regression Output
Columns (1) and (2) of Table D1 show the complete regression output for column (3) of Table 7 and column (2) of Table 8, respectively. Theresults for the other models presented in this paper are similar but were omitted due to lack of space. The signs of the control variables areconsistent with what one would expect prior. This is true both before and after instrumentation. People with previous plans of mobile Internetwere more likely to adopt the iPhone 3G. This is also true for subscribers using handsets 2G or above prior to the release of the iPhone3G.EuroMobile subscribers that spent most of their daytime in regions with very high or high average wage levels were more likely to adopt thanindividuals spending most of their time in regions with wages close to the national average. The opposite was true for subscribers moving inlow and very low wage regions. Users subscribing to prepaid tariff plans before the release of the iPhone 3G were less likely to adopt, alsoas expected. The explanation is one of price because in order to buy the iPhone 3G and still remain a prepaid subscriber, consumers neededto pay the full price of the handset up front. The alternative would be to change from prepaid to postpaid, but in the country analyzed,consumers have a clear preference toward prepaid plans (approximately 80 percent of all subscribers are prepaid).
Finally, up to a certain point, network tenure contributed positively to the probability of adoption. This is likely to indicate that subscribersrequired some experience with the services provided by EuroMobile prior to purchasing a phone that would bind them for at least 24 months.For the sake of readability, note that the dummies dropped from the regression below are genderU, phone2.0g, and geoWageVL.
Table D1. Complete Regression Outputs for Probit and IV Probit
Variables
(1)Probit
adoptedt
(2)IV Probitadoptedt
frd_adopterst – 1 2851***(0258)
9.935***(1.952)[2.087]
Log(tenuret + 1) 0.300***(0.101)
0.329***(0.0955)[0.103]
Log(tenuret + 1)² -0.0330**(0.0138)
-0.0370***(0.0127)[0.0139]
prepaidY -0.548***(0.0283)
-0.508***(0.0274)[0.0307]
genderF -0.0616*(0.0343)
-0.0572(0.0332)[0.0351]
genderM 0.144***(0.0271)
0.1433***(0.0261)[0.0275]
mobileNetY 0.425***(0.0427)
0.398***(0.0397)[0.0445]
phone2.5g 0.484***(0.0547)
0.469***(0.0536)[0.0581]
phone3.0g 0.637***(0.0542)
0.628***(0.0537)[0.0596]
MIS Quarterly Vol. 38 No. 4—Appendices/December 2014 A5

Godinho de Matos et al./Peer Influence in a Large Social Network
Table D1. Complete Regression Outputs for Probit and IV Probit (continued)
Variables
(1)Probit
adoptedt
(2)IV Probitadoptedt
phone3.5g 0.917***(0.0658)
0.876***(0.0650)[0.0735]
phoneOther 0.575***(0.142)
0.503***(0.140)[0.162]
phoneAge -0.143***(0.0551)
-0.152***(0.0512)[0.0601]
phoneAge² 0.0256(0.0251)
0.0279(0.0240)[0.0273]
geoWageH 0.133***(0.0431)
0.113***(0.0381)[0.0420]
geoWageL -0.146(0.142)
-0.111(0.150)[0.150]
geoWageVH 0.198***(0.0563)
0.150***(0.0510)[0.0540]
Constant -3.602***(0.214)
-3.652***(0.310)[0.249]
Observations 265,462 265,462
Community FE Yes Yes
Zip Code FE Yes Yes
Month FE Yes Yes
Pseudo R² 0.157
Log Lik -8721
***p < 001; **p < 0.05; *p < 0.1Note 1: Community clusters robust standard errors in ( ) for Probit. Note 2: Newey estimator standard errors in ( ) for IV Probit. Note 3: Com-munity block-bootstrap standard errors in [] for IV Probit based on 200 replications.
A6 MIS Quarterly Vol. 38 No. 4—Appendices/December 2014

Godinho de Matos et al./Peer Influence in a Large Social Network
Appendix E
Pseudocode to Estimate Adoption Due to Peer Influence
Table E1. Pseudocode to Estimate Adoption Due to Peer InfluenceKey variablesm Marginal effect of peer (obtained from IV probit)D(t) Function that returns the marginal effect of time dummiesN(t) Function that returns the number of people who did not adopt the iPhone 3G. For t = 0 it returns the
sample size.AVG_FRD_ADP(t) The sample average for frd_adopterst !1
EAI(t) Expected adoptions that occur due to peer influence
Algorithmfor t = 0 6 T do
EAI(t) = N(t) * (m * AVG_FRD_ADP(t) + D(t))N(t + 1) = N(t) – EAI(t)end for
MIS Quarterly Vol. 38 No. 4—Appendices/December 2014 A7

Godinho de Matos et al./Peer Influence in a Large Social Network
Appendix F
Additional Time Partitions for the SIENA Analysis
Table F1. Mean Jaccard Index Across the 263 Communities in the Sample
Time Span AUG SEP OCT NOV DEC JAN FEB MAR APR MAY JUN
OneMonth
0.747(0.046)
0.765(0.041)
0.762(0.042)
0.721(0.047)
0.719(0.051)
0.761(0.045)
0.762(0.043)
0.761(0.044)
0.761(0.045)
0.761(0.046)
TwoMonths
0.794(0.043)
0.798(0.042)
0.797(0.039)
0.800(0.043)
0.762(0.049)
ThreeMonths
0.815(0.046)
0.816(0.041)
0.804(0.043)
[1; 2] – [3; 11] 0.749(0.056)
[1; 3] – [4; 11] 0.794(0.052)
[1; 4] – [5; 11] 0.816(0.050)
[1; 5] – [6; 11] 0.826(0.046)
[1; 6] – [7; 11] 0.828(0.045)
[1; 7] – [8; 11] 0.821(0.045)
[1; 8] – [9; 11] 0.802(0.048)
[1; 9] – [10; 11] 0.765(0.051)
[1; 10] – [11; 11] 0.681(0.058)
Note 1: Jaccard Index defined as Jaccard(g0, g1) = where e11 denotes the edges that are present in both graphs g0 and g1, e10 e
e e e11
11 10 01+ +denotes the edges that are only present in g0, and e10 denotes the edges that are only present in g1. Note 2: Standard errors in ( ).
A8 MIS Quarterly Vol. 38 No. 4—Appendices/December 2014

Godinho de Matos et al./Peer Influence in a Large Social Network
Table F2. Results of the Meta-Analysis Using SIENA for Different Time Partitions
Partition Name coeff stderr pval I² H² τ² Q-Test
Q-Test
(p-val) N obs
[1; 2
] – [3
; 11]
outdegree (density)
reciprocity
transitive ties
Behavior öNetworkNetwork ö Behavior
-4.214
5.014
2.538
0.011
3.347
0.052
0.090
0.045
0.069
0.107
0.000
0.000
0.000
0.875
0.000
62.458
59.418
56.025
34.931
0.000
2.665
2.464
2.274
1.537
1.000
0.169
0.421
0.113
0.134
0.000
325.644
269.346
263.453
164.549
43.340
0.000
0.000
0.000
0.000
0.000
104
104
104
104
104
[1; 3
] – [4
; 11]
outdegree (density)
reciprocity
transitive ties
Behavior öNetworkNetwork ö Behavior
-4.393
4.772
2.377
0.056
3.156
0.043
0.079
0.035
0.051
0.094
0.000
0.000
0.000
0.269
0.000
59.972
72.366
52.279
26.986
0.000
2.498
3.619
2.095
1.370
1.000
0.167
0.530
0.095
0.084
0.000
448.472
595.384
351.168
213.184
58.394
0.000
0.000
0.000
0.000
1.000
150
150
150
150
150
[1; 5
] – [6
; 11]
outdegree (density)
reciprocity
transitive ties
Behavior öNetworkNetwork ö Behavior
-4.370
4.107
1.939
0.037
2.857
0.053
0.073
0.036
0.054
0.232
0.000
0.000
0.000
0.498
0.000
66.291
75.442
47.098
29.333
27.452
2.967
4.072
1.890
1.415
1.378
0.204
0.404
0.070
0.077
2.014
374.884
475.923
230.529
167.707
121.619
0.000
0.000
0.000
0.000
0.231
112
112
112
112
112
[1; 6
] – [7
; 11]
outdegree (density)
reciprocity
transitive ties
Behavior öNetworkNetwork ö Behavior
-4.443
3.896
1.723
0.069
3.112
0.057
0.070
0.042
0.054
0.130
0.000
0.000
0.000
0.199
0.000
65.275
67.843
53.516
26.291
0.000
2.880
3.110
2.151
1.357
1.000
0.214
0.295
0.096
0.065
0.000
337.356
324.878
228.744
144.909
24.392
0.000
0.000
0.000
0.003
1.000
102
102
102
102
102
[1; 7
] – [8
; 11]
outdegree (density)
reciprocity
transitive ties
Behavior öNetworkNetwork ö Behavior
-4.504
3.777
1.495
0.054
3.173
0.061
0.073
0.042
0.060
0.129
0.000
0.000
0.000
0.374
0.000
65.212
65.190
48.672
26.053
0.000
2.875
2.873
1.948
1.352
1.000
0.226
0.286
0.079
0.061
0.000
299.468
265.460
186.580
147.948
16.742
0.000
0.000
0.000
0.000
1.000
92
92
92
92
92
[1; 8
] – [9
; 11]
outdegree (density)
reciprocity
transitive ties
Behavior öNetworkNetwork ö Behavior
-4.845
3.935
1.275
0.204
3.191
0.077
0.104
0.053
0.089
0.134
0.000
0.000
0.000
0.026
0.000
52.680
62.745
35.695
32.069
0.000
2.113
2.684
1.555
1.472
1.000
0.189
0.394
0.055
0.110
0.000
125.514
175.865
90.531
94.797
5.989
0.000
0.000
0.003
0.001
1.000
58
58
58
58
58
[1; 9
] – [1
0; 1
1] outdegree (density)
reciprocity
transitive ties
Behavior öNetworkNetwork ö Behavior
-5.118
4.072
1.082
0.138
2.664
0.133
0.158
0.084
0.093
0.183
0.000
0.000
0.000
0.148
0.000
62.162
52.273
51.543
0.001
0.000
2.653
2.095
2.064
1.000
1.000
0.339
0.365
0.096
0.000
0.000
103.865
65.433
64.265
29.795
2.410
0.000
0.000
0.000
0.424
1.000
30
30
30
30
30
[1; 1
0] –
11
outdegree (density)
reciprocity
transitive ties
Behavior öNetworkNetwork ö Behavior
-5.539
4.071
0.860
0.319
2.051
0.259
0.329
0.164
0.167
0.372
0.000
0.000
0.001
0.093
0.001
39.885
31.055
36.805
0.001
0.000
1.663
1.450
1.582
1.000
1.000
0.222
0.241
0.066
0.000
0.000
14.597
13.649
15.223
7.541
0.431
0.067
0.091
0.055
0.480
1.000
9
9
9
9
9
Note 1: Behavior öNetwork is captured by the behaviorsimilarity. Note 2: Network ö Behavior is implemented through behavioraveagesimilarity.
Note 3: Meta-analysis estimated through maximum likelihood assuming a random effects model with Knapp and Hartung standard error correction.
Note 4: τ² is the estimate of the total amount of heterogeneity. I² is the percentage of the total variability due to heterogeneity. H² is
.totalavailability
samplingvariabiity
MIS Quarterly Vol. 38 No. 4—Appendices/December 2014 A9

Godinho de Matos et al./Peer Influence in a Large Social Network
Table F3. Results of the Meta-Analysis Using SIENA with Three Snapshots
Partition Name coeff stderr pval I² H² τ² Q-TestQ-Test(p-val) N obs
[1; 2
] – [4
; 6] –
[7; 1
1]
outdegree (density)
reciprocity
transitive ties
Behavior öNetworkNetwork ö Behavior
-4.195
4.029
1.833
0.012
3.040
0.038
0.059
0.028
0.037
0.111
0.000
0.000
0.000
0.748
0.000
69.841
82.368
57.796
37.558
0.000
3.316
5.672
2.369
1.601
1.000
0.107
0.290
0.046
0.052
0.000
392.527
708.874
265.849
163.277
43.034
0.000
0.000
0.000
0.000
1.000
104
104
104
104
104
[1; 4
] – [5
; 8] –
[9; 1
1]
outdegree (density)
reciprocity
transitive ties
Behavior öNetworkNetwork ö Behavior
-4.320
3.884
1.677
0.067
3.009
0.051
0.072
0.039
0.042
0.133
0.000
0.000
0.000
0.113
0.000
71.312
81.336
64.556
25.463
0.000
3.486
5.358
2.821
1.342
1.000
0.129
0.288
0.067
0.031
0.000
272.047
419.031
211.380
97.622
25.731
0.000
0.000
0.000
0.024
1.000
73
73
73
73
73
Note 1: Behavior ö Network is captured by the behaviorsimilarity. Note 2: Network ö Behavior is implemented through behavioraveagesimilarity.
Note 3: Meta-analysis estimated through maximum likelihood assuming a random effects model with Knapp and Hartung standard error correction.
Note 4: τ² is the estimate of the total amount of heterogeneity. I² is the percentage of the total variability due to heterogeneity. H² is
.totalavailability
samplingvariabiity
A10 MIS Quarterly Vol. 38 No. 4—Appendices/December 2014

Godinho de Matos et al./Peer Influence in a Large Social Network
Appendix G
Robustness Checks on SIENA Analysis
Figure G1. Cumulative Inclusion of Communities in Decreasing Order of the Standard Error Associatedwith the Effect of Peer Influence
Figure G2. Cumulative Inclusion of Communities in Increasing Order of the Standard Error Associatedwith the Effect of Peer Influence
MIS Quarterly Vol. 38 No. 4—Appendices/December 2014 A11

Godinho de Matos et al./Peer Influence in a Large Social Network
Figure G3. Effect of Peer Influence Leaving One Community Out of the Analysis at a Time
A12 MIS Quarterly Vol. 38 No. 4—Appendices/December 2014

Godinho de Matos et al./Peer Influence in a Large Social Network
Appendix H
Community-Level Descriptive Statistics
Table H1. Definition and Descriptive Statistics for Community-Level Covariates Considered in OurStudy
avg sd min max definition
adoptersadoption_rate
months_with_adoptionadoption_span
8.810.574.336.83
6.780.432.253.59
1.000.081.000.00
49.003.50
10.0011.00
Number of adopters.Number of adoptions per month.Number of months in which adoption took place.Time between first and last adoption.
sizeedges
densitydiameter
avg_path_length
91.88211.98
0.059.254.57
17.1455.72
0.012.820.86
5.0091.00
0.035.002.78
115.00430.00
0.1119.00
7.38
Number of subscribers (N).Number of links between subscribers (E).2e/(n(N – 1).Longest path between subscribers (no cycles).
length of the shortest path between i( ) ( )( ) ( )p i j N N p i jji
, ; ,− 1
and j.av_degree 4.61 0.82 3.04 8.96 degree of subscriber i.( ) ( )deg degi N i
i;
avg_betweenness 160.10 57.26 16.65 364.37 number of shortest paths between( ) ( ) ( )bet i N g v st
st
vsts v ti
; ;=≠ ≠ σ
σ σs and t; σst(v) number of such paths through v.
avg_closeness 0.21 0.06 0.02 0.32 distance between v and t in( ) ( ) ( ) ( )clo i N g v d v td v tGt V vi
G; ; ,,
\= −
∈ 2G.
cengralization.deg 0.12 0.04 0.04 0.28 Measures how central the most central subscriber is relative to all
other subscribers . Cx(pi) is any centrality( ) ( )
( ) ( )Cx
C p C p
C p C p
x x ii
N
x x ii
N=
−
−=
=
*
*max
1
1
measure of point i and Cx(p*) is the largest such measure in thenetwork. Apply this column to the three rows of centralization.
centralizatio.bet 0.54 0.15 0.06 0.85
centralization.clo 0.25 0.11 0.00 0.46
transitivity
transitivity.corrcut-points
0.54
0.6817.11
0.08
0.045.43
0.32
0.454.00
0.90
0.8132.00
Number of closed triplets relative to the number of connected triples tovertices.Correlation between W and W²; W is the adjacency matrix.Number of subscribers that, if removed, separate the community inmore than one component.
MIS Quarterly Vol. 38 No. 4—Appendices/December 2014 A13

Godinho de Matos et al./Peer Influence in a Large Social Network
Table H2. Correlation Table Across the Community-Level Covariates Considered in Our Study(1) (2) (3) (4) (5) (6) (7) (8) (9) (10) (11) (12) (13) (14) (15) (16) (17) (18) (19) (20) (21
(1) adopters 1.00
(2) adoption_rate 1.00 1.00
(3) months_with_adoption 0.85 0.85 1.00
(4) adoption_span 0.57 0.57 0.74 1.00
(5) size 0.27 0.27 0.32 0.29 1.00
(6) density -0.29 -0.29 -0.32 -0.30 -0.75 1.00
(7) avg_path_length 0.18 0.18 0.09 0.04 0.28 -0.40 1.00
(8) diameter 0.13 0.13 0.06 -0.00 0.23 -0.29 0.88 1.00
(9) avg_pagerank -0.27 -0.27 -0.32 -0.29 -0.98 0.76 -0.28 -0.22 1.00
(10) avg_coreness -0.15 -0.15 -0.13 -0.12 -0.00 0.61 -0.24 -0.16 -0.01 1.00
(11) avg_degree -0.14 -0.14 -0.11 -0.11 0.06 0.59 -0.30 -0.19 -0.07 0.95 1.00
(12) avg_betweenness 0.25 0.25 0.21 0.15 0.67 -0.61 0.86 0.73 -0.65 -0.15 -0.16 1.00
(13) avg_closeness -0.13 -0.13 -0.12 -0.09 -0.29 0.40 -0.47 -0.47 0.30 0.22 0.27 -0.30 1.00
(14) centralization.deg -0.27 -0.27 -0.29 -0.28 -0.42 0.63 -0.45 -0.33 0.43 0.39 0.44 -0.48 0.41 1.00
(15) centralization.deg -0.09 -0.09 -0.09 -005 -0.02 -0.11 0.09 -0.10 0.01 -0.09 -0.21 .13 0.18 -0.04 1.00
(16) centralization.clo -0.09 -0.09 -0.05 0.01 -0.16 0.20 -0.47 -0.52 0.16 0.12 0.13 -0.26 0.92 0.27 0.39 1.00
(17) transitivity -0.04 -0.04 -0.05 -0.03 -0.12 0.41 0.08 0.04 0.10 0.68 0.48 -0.01 -0.06 0.02 0.19 -0.04 1.00
(18) transitivity.cor -0.06 -0.06 -0.05 -0.04 -0.00 0.22 0.04 0.01 -0.01 0.50 0.32 0.02 -0.08 -0.14 0.16 -0.03 0.78 1.00
(19) cut points 0.41 0.41 0.35 0.33 0.53 -0.71 0.56 0.44 -0.52 -0.41 -0.48 0.65 -038 -0.50 0.15 -0.21 -0.07 00.08 1.00
(20) cut points ff_avg_deg -0.11 -0.11 -0.10 -0.11 0.13 0.31 =0.45 -0.38 -0.13 0.56 0.67 -0.20 0.42 0.49 -0.24 0.29 0.04 0.06 -0.38 1.00
(21) logic(cliques_min_size_3) -0.03 -0.03 -0.01 -0.01 0.21 0.38 -0.12 -0.08 -0.23 0.91 0.87 0.04 0.11 0.31 -0.05 0.05 0.59 0.39 -0.19 0.50 1.00
Appendix I
Policy Simulator Code
Our simulator evolves a graph object over time of the form G(t) = (S(t), W) where S(t) is a set of subscribers and their characteristics and W isa fixed adjacency matrix. In our setting S(t, i) = (Xi, Zi,t , BPAt,i, PAt,i, AOt,i, At,i) is a data structure for subscriber i a t time t. BPA(t, i) represents
the baseline propensity for subscriber i to adopt the iPhone 3G at time t. This is given by ( ) ( )( )Φ . .,α β γ ρ+ + + − ∈X Z WG t S i S AOi i t i 1
and thus introduces heterogeneity across consumers and evolves over time. G(t) is the graph at time t, S(i) indexes subscriber i in that graphand AO is the adoption observed for that subscriber in our dataset. S(i 0 S) refers to a vector of all subscribers in S. The probability ofsubscriber i adopting the iPhone 3G at time t is given by the sum of BPA(t, i) and the effect that additional adopters exert on her, computedas mWi(G(t ! 1).S(i 0 S).A ! G(t ! 1).S(i 0 S).AO), where A represents whether the subscriber adopts the iPhone 3G in our simulation. A isdetermined using a random draw from a uniform distribution in [0, 1].
A14 MIS Quarterly Vol. 38 No. 4—Appendices/December 2014

Godinho de Matos et al./Peer Influence in a Large Social Network
Table I1. Pseudocode for Policy Simulator
Variablesn number of seedsm marginal peer influence effectS set of subscribers
parameters from probit estimation , , , α β γ ρW, Xi, Zit covariates in equation 1AO(i, t) adoptions generated in our datasetA(i, t) adoptions generated in simulationBPA(i, t) baseline probability of adoptionPA(i, t) probability of adoption
Algorithm
function AA(n, m, G) – Additional adoptersG(0).S(i 0 I).A = seedingpolicy(n, G(0).S(i 0 I))for t = 0 6T, i 0 S do
G(t).S(i 0 I).BPA = ( ) ( )( )Φ . .α β γ ρ+ + + − ∈X Z WG t S i I AOi it i 1end forfor t = 0 6T, i 0 S:A(i, t) == () do
G(t).S(i).PA = G(i).S(i).BPA + mWi(G(t – 1).S(i 0 I).A – G(t – 1).S(i 0 i).AO)G(t).S(i).A = 1 {draw U(0,1) > G(t).S(i).PA}
end forreturn 3i0SG(T).S(i).A
end function
Reference
Albert, A., and Anderson, J. A. 1984. “On the Existence of Maximum Likelihood Estimates in Logistic Regression Models.,” Biometrika(71:1), pp. 1-10.
MIS Quarterly Vol. 38 No. 4—Appendices/December 2014 A15