Embed Size (px)
Citation preview

Peer Review of Demonstrating the Safety and Crashworthiness of a 2020 Model-Year, Mass-Reduced Crossover Vehicle (Lotus Phase 2 Report)

Assessment and Standards Division Office of Transportation and Air Quality U.S. Environmental Protection Agency
Prepared for EPA bySystems Research and Appliction Corporation
EPA Contract No. EP-C-11-007Submitted February 2012
Peer Review of Demonstrating the Safety and Crashworthiness of a 2020 Model-Year, Mass-Reduced Crossover
Vehicle (Lotus Phase 2 Report)
EPA-420-R-12-028 September 2012

2
Peer Review of Demonstrating the Safety and Crashworthiness of a 2020 Model-Year, Mass-
Reduced Crossover Vehicle (Lotus Phase 2 Report)
Table of Contents
I. Peer Review of the Lotus Phase 2 Report, Conducted by SRA International p. 4
1. Background p. 4 2. Description of Review Process p. 5 3. Compilation of Review Comments p. 6 4. References p. 54 Appendices
A. Resumes of Peer Reviewers p. 55 B. Conflict of Interest Statements p. 75 C. Peer Review Charge & Conference Call Notes p. 93 D. Reviews p. 101
II. EPA’s Response to Peer Review Comments p. 142

3
Executive Summary
In September 2011, EPA contracted with SRA International (SRA) to conduct a peer review of Demonstrating the Safety and Crashworthiness of a 2020 Model-Year, Mass-Reduced Crossover Vehicle (Lotus Phase 2 Report), developed by Lotus Engineering, Inc. The peer reviewers selected by SRA were William Joost (U.S. Department of Energy), CG Cantemir, Glenn Daehn, David Emerling, Kristina Kennedy, Tony Luscher, and Leo Rusli (The Ohio State University), Douglas Richman (Kaiser Aluminum), and Srdjan Simunovic (Oak Ridge National Laboratory). In addition, Srdjan Simunovic and members of the OSU team reviewed various elements of the associated LS-DYNA modeling. EPA would like to extend its appreciation to all of the reviewers for their efforts in evaluating this report and the modeling. The reviewers brought useful and distinctive views in response to the charge questions. The first section of this document contains the final SRA report summarizing the peer review of the Lotus Phase 2 Report, including the detailed comments of each peer reviewer and a compilation of reviewer comments according to the series of specific questions set forth in the peer review charge. The SRA report also contains the peer reviewers’ resumes, completed conflict of interest and bias questionnaires for each reviewer, and the peer review charge letter. The second major section contains our responses to the peer reviewers’ comments. In this section, we repeat the compiled comments provided by SRA and, after each section of comments, provide our response. We have retained the organization reflected in SRA’s compilation of the comments to aid the reader in moving from the SRA report to our responses.

4
TO: Cheryl Caffrey, U.S. Environmental Protection Agency, Office of Transportation and Air
Quality (OTAQ) FROM: Brian Menard, SRA International
DATE: February 28, 2012
SUBJECT: Peer Review of Demonstrating the Safety and Crashworthiness of a 2020 Model-Year, Mass-Reduced Crossover Vehicle (Lotus Phase 2 Report), developed by Lotus Engineering, Inc.
1. Background In developing programs to reduce GHG emissions and increase fuel economy, the U.S. Environmental Protection Agency (EPA), the California Air Resources Board (CARB), and the National Highway Transportation Safety Administration (NHTSA) have to assess the use of mass-reduction technology in light-duty vehicles. The availability, feasibility, and validation of lightweight materials and design techniques in the 2020 – 2025 timeframe is of high importance, especially considering its potential to be one of the major technology areas that could be utilized to help achieve the vehicle GHG and fuel economy goals. The 2011 study by Lotus Engineering, Demonstrating the Safety and Crashworthiness of a 2020 Model-Year, Mass Reduced Crossover Vehicle, was done under contract from CARB, coordinated by EPA and CARB, and involved technical collaboration on safety with NHTSA. The study was conducted specifically to help assess a number of critical questions related to mass-reduced vehicle designs in the 2020 – 2025 timeframe. The Lotus study involves the design development and crashworthiness safety validation of a mass-reduced redesign of a crossover sport utility vehicle (i.e., starting from a 2009 Toyota Venza baseline) using advanced materials and design techniques. The research entails the full conceptual redesign of a vehicle. This review for the 2011 Lotus study is referred to as “Phase 2” because it builds upon Lotus’ previous 2010 study An Assessment of Mass Reduction Opportunities for a 2017–2020 Model Year Vehicle Program, which for context is referred to as “Phase 1” here and in the 2011 study. This is noted because the 2011 “Phase 2” study involves the non-body components (e.g., interior, suspension, chassis) relating back to “Phase 1” work. The Phase 1 BIW was redesigned in the Phase 2 work using an engineering design, safety testing, and validation of the vehicle’s body-in-white structure. This report documents the peer review of the Lotus Phase 2 Report. Section 2 of this memorandum describes the process for selecting reviewers, administering the review process, and closing the peer review. Section 3 summarizes reviewer comments according to the series of specific questions set forth in matrix contained in the peer review charge. The appendices to the memorandum contain the peer reviewers’ resumes, completed conflict of interest and bias questionnaires for each reviewer, and the peer review charge letter.
5
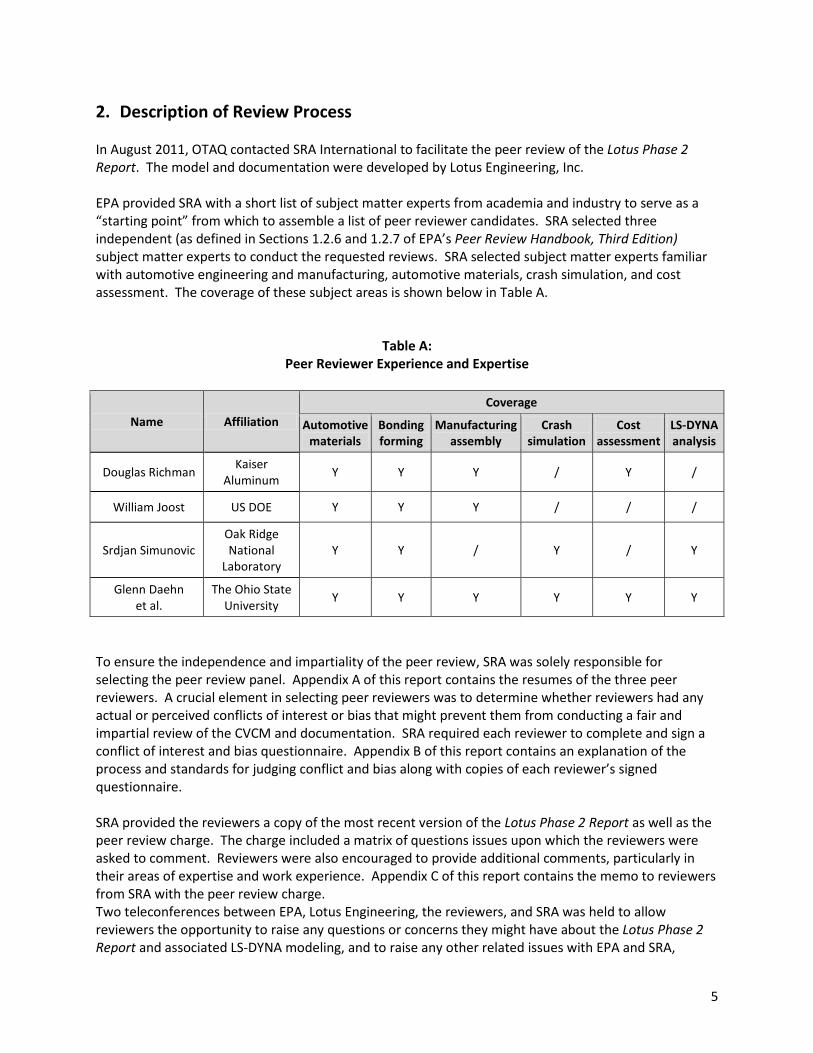
2. Description of Review Process In August 2011, OTAQ contacted SRA International to facilitate the peer review of the Lotus Phase 2 Report. The model and documentation were developed by Lotus Engineering, Inc. EPA provided SRA with a short list of subject matter experts from academia and industry to serve as a “starting point” from which to assemble a list of peer reviewer candidates. SRA selected three independent (as defined in Sections 1.2.6 and 1.2.7 of EPA’s Peer Review Handbook, Third Edition) subject matter experts to conduct the requested reviews. SRA selected subject matter experts familiar with automotive engineering and manufacturing, automotive materials, crash simulation, and cost assessment. The coverage of these subject areas is shown below in Table A.
Table A: Peer Reviewer Experience and Expertise
Name Affiliation Coverage
Automotive materials
Bonding forming
Manufacturing assembly
Crash simulation
Cost assessment
LS-DYNA analysis
Douglas Richman Kaiser Aluminum Y Y Y / Y /
William Joost US DOE Y Y Y / / /
Srdjan Simunovic Oak Ridge National
Laboratory Y Y / Y / Y
Glenn Daehn et al.
The Ohio State University Y Y Y Y Y Y
To ensure the independence and impartiality of the peer review, SRA was solely responsible for selecting the peer review panel. Appendix A of this report contains the resumes of the three peer reviewers. A crucial element in selecting peer reviewers was to determine whether reviewers had any actual or perceived conflicts of interest or bias that might prevent them from conducting a fair and impartial review of the CVCM and documentation. SRA required each reviewer to complete and sign a conflict of interest and bias questionnaire. Appendix B of this report contains an explanation of the process and standards for judging conflict and bias along with copies of each reviewer’s signed questionnaire. SRA provided the reviewers a copy of the most recent version of the Lotus Phase 2 Report as well as the peer review charge. The charge included a matrix of questions issues upon which the reviewers were asked to comment. Reviewers were also encouraged to provide additional comments, particularly in their areas of expertise and work experience. Appendix C of this report contains the memo to reviewers from SRA with the peer review charge. Two teleconferences between EPA, Lotus Engineering, the reviewers, and SRA was held to allow reviewers the opportunity to raise any questions or concerns they might have about the Lotus Phase 2 Report and associated LS-DYNA modeling, and to raise any other related issues with EPA and SRA,

6
including EPA’s expectations for the reviewers’ final review comments. The notes of this conference call are contained in Appendix C, following the peer review charge. SRA delivered the final review comments to EPA by the requested date. These reviews, contained in Appendix D of this report, included the reviewers’ response to the specific charge questions and any additional comments they might have had. 3. Compilation of Review Comments The Lotus Phase 2 Report was reviewed by William Joost (U.S. Department of Energy), CG Cantemir, Glenn Daehn, David Emerling, Kristina Kennedy, Tony Luscher, and Leo Rusli (The Ohio State University (OSU)), Douglas Richman (Kaiser Aluminum), and Srdjan Simunovic (Oak Ridge National Laboratory). In addition, Srdjan Simunovic and members of the OSU team reviewed various elements of the associated LS-DYNA modeling. Appendix A contains detailed resumes for each of the reviewers. This section provides a compilation of their comments. The complete comments may be found in Appendix D.

7
1. ASSUMPTIONS AND DATA SOURCES
COMMENTS
Please comment on the validity of any data sources and assumptions embedded in the study’s material choices, vehicle design, crash validation testing, and cost assessment that could affect its findings.
[Joost] The accuracy of the stress-strain data used for each material during CAE and crash analysis is critically important for determining accurate crash response. The sources cited for the material data are credible; however the Al yield stresses used appear to be on the high side of the expected properties for the alloy-temper systems proposed here. The authors may need to address the use of the slightly higher numbers (for example, 6061-T6 is shown with a yield stress of 308 MPa, where standard reported values are usually closer to 275 MPa). [Richman] Aluminum alloys and tempers selected and appropriate and proven for the intended applications. Engineering data used for those materials and product forms accurately represent minimum expected minimum expected properties normally used for automotive design purposes. Simulation results indicate a vehicle utilizing the PH 2 structure is potentially capable of meeting FMVSS requirements. Physical test results have not been presented to confirm model validity, some simulation results indicate unusual structural performance and the models do not address occupant loading conditions which are the FMVSS validation criteria. Simulation results alone would not be considered “validation” of PH 2 structure safety performance. Cost estimates for the PH 2 vehicle are questionable. Cost modeling methodology relies on engineering estimates and supplier cost projections. The level of analytical rigor in this approach raises uncertainties about resulting cost estimates. Inconsistencies in reported piece count differences between baseline and PH 2 structures challenge a major reported source of cost savings. Impact of blanking recovery on aluminum sheet product net cost was explicitly not considered. Labor rates assumed for BIW manufacturing were $20/Hr below prevailing Toyota labor rate implicit in baseline Venza cost analysis. Cost estimates for individual stamping tool are substantially below typical tooling cost experienced for similar products. Impact of blanking recovery and labor rates alone would increase BIW cost by over $200. [OSU] Material data, for the most part, seems reasonably representative of what would be used in this type of automotive construction. Some of the materials are more prevalent in other industries like rail, than in automotive. Material specifications used in this report were nominal; however, reviewers would like to see min/max material specifications taken into consideration.

8
If you find issues with data sources and assumptions, please provide suggestions for available data that would improve the study.
[Joost] Materials properties describing failure are not indicated (with the exception of Mg, which shows an in-plane failure strain of 6%). It seems unlikely that the Al and Steel components in the vehicle will remain below the strain localization or failure limits of the material; it’s not clear how failure of these materials was determined in the models. The authors should indicate how failure was accounted for; if it was not, the authors will need to explain why the assumption of uniform plasticity throughout the crash event is valid for these materials. This could be done by showing that the maximum strain conditions predicted in the model are below the typical localization or failure limits of the materials (if that is true, anyway). Empirical determination of the joint properties was a good decision for this study. The author indicates that lap-shear tests demonstrated that failure occurred outside of the bond, and therefore adhesive failure was not included in the model. However, the joints will experience a variety of stress states that differ from lap-shear during a crash event. While not a major deficiency, it would be preferable to provide some discussion of why lap-shear results can be extended to all stress states for joint failure mode. Alternatively, the author could also provide testing data for other joint stress states such as bending, torsion, and cross tension. [Richman] No comment. [OSU] References for all of the materials and adhesives would be very helpful. [Simunovic] The overall methodology used by the authors of the Phase 2 study is fundamentally solid and follows standard practices from the crashworthiness engineering. Several suggestions are offered that may enhance the outcome of the study. Material Properties and Models Reduction of vehicle weight is commonly pursued by use of lightweight materials and advanced designs. Direct substitution of materials on a component level is possible only conceptually because of the other constraints stemming from the material properties, function of the component, its dimensions, packaging, etc. Therefore, one cannot decide on material substitutions solely on potential weight savings. In general, an overall re-design is required, as was demonstrated in the study under review. An overview of the recent lightweight material concept vehicle initiatives is given in Lutsey, Nicholas P., "Review of Technical Literature and Trends Related to Automobile Mass-Reduction Technology." Institute of Transportation Studies, University of California, Davis, Research Report UCD-ITS-RR-10-10 (2010). The primary body material for the baseline vehicle, 2009 Toyota Venza, is mild steel. Except for about 8% of Dual Phase steel with 590 MPa designation, everything else is the material which has been used in automobiles for almost a century and for which extensive design experience and manufacturing technologies exist. On the other hand, the High Development vehicle concept employs novel lightweight materials, many of which are still under development, such as Mg

9
alloys and fiber reinforced polymer matrix composites. These materials are yet to be used in large quantities in mass production automobiles. Their lack of market penetration is due not only to a higher manufacturing cost , but also due to an insufficient understanding, experience and characterization of their mechanical behavior. To compensate for these uncertainties, designers must use higher safety factors, which then often eliminate any potential weight savings. In computational modeling, these uncertainties are manifested by the lack of material performance data, inadequate constitutive models and a lack of validated models for the phenomena that was not of a concern when designing with the conventional materials. For example, mild steel components dissipate crash energy through formation of deep folds in which material can undergo strains over 100%. Both analytical [Jones, Norman, "Structural Impact", Cambridge University Press (1997).] and computational methods [Ted Belytschko, T., Liu, W.-K., Moran, B., "Nonlinear Finite Elements for Continua and Structures", Wiley (2000).] of the continuum mechanics are sufficiently developed to be able to deal with such configurations. On the other hand, Mg alloys, cannot sustain such large deformations and strain gradients and, therefore, require development of computational methods to model material degradation, fracturing, and failure in general. The material data for the vehicle model is provided in section 4.4.2. of the Phase 2 report. The stress-strain curves in the figures are most likely curves of effective plastic strain and flow stress for isotropic plasticity material constitutive models that use that form of data, such as the LS-DYNA ["LS-DYNA Keyword User's Manual", Livermore Software Technology Corporation (LSTC), version 971, (2010).] constitutive model number 24, named MAT_PIECEWISE_LINEAR_PLASTICITY. A list detailing the constitutive model formulation for each of the materials of structural significance in the study would help to clarify this issue. Also the design rationale for dimensioning and selection of materials for the main structural parts would help in understanding the design decisions made by the authors of the study. The included material data does not include strain rate sensitivity, so it is assumed that the strain rate effect was not considered. Strain rate sensitivity can be an important strengthening mechanism in metals. For hcp (hexagonal close-packed) materials, such as AM60, high strain rate may also lead to change in the underlying mechanism of deformation, damage evolution, failure criterion, etc. Data for strain rate tests can be found in the open source [http://thyme.ornl.gov/Mg_new], although the properties can vary considerably with material processing and microstructure. The source of material data in the study was often attributed to private communications. Those should be included in the report, if possible, or in cases when the data is available from documented source, such as reference ["Atlas of Stress-Strain Curves", 2nd Ed., ASM International (2002).], referencing can be changed. Properties for aluminum and steel were taken from publicly available sources and private communications and are within accepted ranges. Material Parameters and Model for Magnesium Alloy AM60 The mechanical response of Mg alloys involves anisotropy, anisotropic hardening, yield asymmetry, relatively low ductility, strain rate sensitivity, and significant degradation of effective properties due to the formation and growth of micro-defects under loading [Nyberg EA, AA Luo, K Sadayappan, and W Shi, "Magnesium for Future Autos." Advanced Materials & Processes 166(10):35-37 (2008).]. It has been shown, for example, that ductility of die-cast AM60 depends strongly on its

10
microstructure [Chadha, G; Allison, JE; Jones, JW, "The role of microstructure and porosity in ductility of die cast AM50 and AM60 magnesium alloys," Magnesium Technology 2004, pp. 181-186 (2004).], and, by extension, on the section thickness of the samples. In case when a vehicle component does not play a strong role in crash, its material model and parameters can be described with simple models, such as isotropic plasticity, with piecewise linear hardening curve. However, magnesium is extensively used across the High Development vehicle design [An Assessment of Mass Reduction Opportunities for a 2017-2020 Model Year Vehicle Program, Lotus Engineering Inc., Rev 006A, (2010).]. In Phase 1 report, magnesium is found in many components that are in the direct path of the frontal crash (e.g. NCAP test). Pages 40-42 of Phase 1 report show magnesium as material for front-end module (FEM), shock towers, wheel housing, dash panel, toe board and front transition member. The front transition member seems to be the component that provides rear support for the front chassis rail. However, in Phase 2 report, pages 35-37, shock towers and this component were marked as made out of aluminum. A zoomed section of the Figure 4.2.3.d from the Phase 2 report is shown in Figure 1. [See Simunovic Comments, p. 4.] The presumed part identified as the front transition member is marked with an arrow. These assignments were not possible to confirm from the crash model since the input files were encrypted. In any case, since Mg AM60 alloy is used in such important role for the frontal crash, a more detailed material model than the one implied by the graph on page 32 of Phase 2 report [1] would be warranted. More accurate failure model is needed, as well. The failure criteria in LS-DYNA [6] are mostly limited to threshold values of equivalent strains and/or stresses. However, combination of damage model with plasticity and damage-initiated failure would probably yield a better accuracy for AM60. Material Models for Composites Understanding of mechanical properties for material denoted as Nylon_45_2a (reference [1] page 33) would be much more improved if the constituents and fiber arrangement were described in more detail. Numbers 45 and 2 may be indicating +/- 450 fiber arrangement, however, a short addition of material configuration would eliminate unnecessary speculation. An ideal plasticity model of 60% limit strain for this material seems to be overly optimistic. Other composite models available in LS-DYNA may be a much better option. [Simunovic, cont.] Joint Models Welded joints are modeled by variation of properties in the Heat Affected Zone (HAZ) and threshold force for cutoff strength. HAZs are relatively easy to identify in the model because their IDs are in 1,000,000 range as specified on page 21 of the report [1]. An example of the approach is shown in Figure 2 [See Simunovic Comments, p. 5.], where the arrows mark HAZs. This particular connection contains welds (for joining aluminum parts) and bolts (for joining aluminum and magnesium). HAZ properties were not given in the report and they could not be checked in the model due to encryption. The bolt model properties were described that it fails at 130 MPa (page 38 of the report [1]), which corresponds to the yield stress of

11
AM60. The importance of these joints cannot be overstated. They enforce stability of the axial deformation mode in the rails that in turn enables dissipation of the impact energy. The crash sequence of the connection between the front end module and the front rail is shown in Figure 3. [See Simunovic Comments, p. 6.] The cracks in the front end module (Figure 3.2) and the separation between the front end module and the front rail (Figure 3.3) are clearly visible. This zone experiences very large permanent deformations, as shown in Figure 4. [See Simunovic Comments, p. 6.] It is not clear from the simulations which failure criterion dominates the process. Is it the failure of the HAZ or is it the spot weld limit force or stress. Given the importance of this joint on the overall crash response, additional information about the joint sub-models would be very beneficial to a reader.
ADDITIONAL COMMENTS: [Richman] Study includes an impressive amount of design, crash, and cost analysis information. The radical part count reduction needs to be more fully explained or de-emphasized. Report also should address the greatly reduced tooling and assembly costs relative to the experience of today's automakers. Some conservatism would be appropriate regarding potential shortcomings in interior design and aesthetics influencing customer expectations and acceptance. [OSU] One broad comment is that this report needs to be more strongly placed in the context of the state of the art as established by available literature. For example the work only contains 7 formal references. Also, it is not clear where material data came from in specific cases (this should be formally referenced, even if a private communication) and the exact source of data such in as the comparative data in Figure 4.3.2 is not clear. Words like Intillicosting are used to denote the source of data and we believe that refers to a specific subcontract let to the firm ‘intellicosting’ for this work and those results are shown here. This needs to be made explicitly clear.

12
2. VEHICLE DESIGN METHODOLOGICAL RIGOR
COMMENTS
Please comment on the methods used to analyze the materials selected, forming techniques, bonding processes, and parts integration, as well as the resulting final vehicle design.
[Joost] While appropriate forming methods and materials appear to have been selected, a detailed description of the material selection and trade-off process is not provided. One significant exception is the discussion and tables regarding the replacement of Mg components with Al and steel components in order to meet crash requirements. Similarly, while appropriate joining techniques seem to have been used, the process for selecting the processes and materials is not clear. Additionally, little detail is provided on the joining techniques used here. A major technical hurdle in the implementation of multi-material systems is the quality, durability, and performance of the joints. Additional effort should be expended towards describing the joining techniques used here and characterizing the performance. [Richman] Adhesive bonding and FSW processes used in PH 2 have been proven in volume production and would be expected to perform well in this application. Some discussion of joining system for magnesium closure inner panels to aluminum external skin and AHSS “B” pillar to aluminum body would improve understanding and confidence in those elements of the design. Parts integration information is vague and appears inconsistent. Parts integration. Major mass and cost savings are attributed to parts integration. Data presented does not appear to results. Final design appears capable of meeting functional, durability and FMVSS requirements. Some increase in mass and cost are likely to resolve structure and NVH issues encountered in component and vehicle level physical testing. [OSU] More details are needed on the various aspects of joining and fastening. Comment on assembly.
Please describe the extent to which state-of-the-art design methods have been employed as well as the extent to which the associated analysis exhibits strong technical rigor.
[Joost] Design is a challenging process and the most important aspect is having a capable and experienced design team supporting the project; Lotus clearly meets this need and adds credibility to the design results. One area that is omitted from the analysis is durability (fatigue and corrosion) performance of the structure. Significant use of Al, Al joints, and multi-material joints introduces the potential for both fatigue and corrosion failure that are unacceptable in an automotive product. It would be helpful to include narrative describing the good durability performance of conventional (i.e. not Bentley, Ferrari, etc.) vehicles that use similar materials and joints in production without significant durability problems. In some cases, (say the weld-bonded Al-Mg joints), production examples do not exist so there should be an explanation of how these could meet durability requirements. [Richman] Vehicle design methodology utilizing Opti-Struct, NASTRAN and LS-Dyna is represents a comprehensive and

13
rigorous approach to BIW structural design and materials optimization. [OSU] In order to qualify for mass production, a process must be very repeatable. Figure 4.2.4.a shows the results from 5 test coupons. There are significant differences between all of these in peak strength and energy absorption. Such a spread of results would not be acceptable in terms of production. [Simunovic] The Phase 2 design study of the High Development vehicle considered large number of crash scenarios from the FMVSS and IIHS tests. The simulations show reasonable results and deformations. Energy measures show that models are stable and have no sudden spikes that would lead to instabilities. The discretization of the sheet material is primarily done by proportionate quadrilateral shell elements, with relatively few triangular elements. The mesh density is relatively uniform without large variations in element sizes and aspect ratios. However, in my opinion, there are two issues that need to be addressed. One is the modeling of material failure/fracture and the other is the design of the crush zone with respect to the overall stopping distance. While the former may be a part of proprietary technology, the latter issue should be added to the description in order to better understand the design at hand. Material Failure Models and Criteria One of the modeling aspects that is usually not considered in conventional designs is modeling of material fracture/failure. In the Phase 2 report [1] material failure is indicated only in AM60 although it may be reasonably expected in other materials in the model. Modeling of material failure in continuum mechanics is a fairly complex undertaking. In the current Lotus High Development model, material failure and fracture are apparently modeled by element deletion. In this approach, when a finite element reaches some failure criteria, the element is removed from simulations, which then allows for creation of free surfaces and volumes in the structure. This approach is notoriously mesh-dependent. It implies that the characteristic dimension for the material strain localization is of the size of the finite element where localization and failure happen to occur. Addition of the strain rate sensitivity to a material model can both improve fidelity of the material model, and as an added benefit, it can also help to regularize the response during strain localization. Depending on the amount of stored internal energy and stiffness in the deleted elements, the entire simulation can be polluted by the element deletion errors and become unstable. Assuming that only AM60 parts in the Lotus model have failure criterion, it would not be too difficult for the authors to describe it in more depth. Since AM60 is such a critical material in the design, perturbation of its properties, mesh geometry perturbations and different discretization densities, should be considered and investigate how do they affect the convergence of the critical measures, such as crash distances. A good illustration of the importance of the failure criteria is the response of the AM60 front end module during crash. This component is always in the top group of components ranked by the dissipated energy. Figure 5 [See Simunovic Comments, p. 7.] shows deformation of the front end module during the full frontal crash. Notice large cracks open in the mid span, on the sides, and punched out holes at the locations of the connection with the front rail and the shotgun. Mesh refinement study of this component would be interesting and could also indicate the

14
robustness of the design. Decision to design such a structurally important part out of Mg would be interesting to a reader. There are other components that also include failure model even though they are clearly not made out of magnesium nor are their failure criteria defined in the Phase 2 report. Figure 6 [See Simunovic Comments, p. 8.] shows the sequence of deformation of the front left rail as viewed from the right side of the vehicle. The axial crash of the front rails is ensured by their connection to the front end, rear S-shaped support and to the connections to the sub-frame. Figure 7 [See Simunovic Comments, p. 8.] shows the detail of the connectors between the left crush rail to the subframe. Tearing of the top of the support (blue) can be clearly observed in Figure 7. The importance of this connection for the overall response may warrant parametric studies for failure parameters and mesh discretization. Crash Performance of the High Development Vehicle Design From the safety perspective, the most challenging crash scenario is the full profile frontal crash into a flat rigid barrier. The output files for the NCAP 35 mph test were provided by Lotus Engineering and used for evaluation of the vehicle design methodological rigor. The two accelerometer traces from the simulation at the lower B-pillar locations are shown in Figure 8. [See Simunovic Comments, p. 9.] When compared with NHTSA test 6601, the simulation accelerometer and displacement traces indicate much shorter crush length than the baseline vehicle. When compared vehicle deformations before and after the crush, it becomes obvious where the deformation occurs. Figure 9 [See Simunovic Comments, p. 10.] shows the deformation of the front rail members. It can be seen that almost all deformation occurs in the space spanned by the front frame rails. As marked in Figure 1, the front transition member (or a differently named component in case my material assignment assumption was not correct), supports the front rail so that it axially crushed and dissipated as much energy, as possible. For that purpose, this front rail rear support was made extremely stiff and it does not appreciably deform during the crash (Figure 10). [See Simunovic Comments, p. 10.] It has internal reinforcing structure that has not been described in the report. These reinforcements enables it to reduce bending and axial deformations in order to provide steady support for the axial crush of the aluminum rail tube. This design decision reduces the possible crush zone and stopping distance to the distance between the front of the bumper and the front of the rail support (Figure 9). The effective crash length can be clearly seen in Figure 11. [See Simunovic Comments, p. 11.]

15
We can see from the above figure that the front rail supports undergo minimal displacements and that all the impact energy must be dissipated in a very short span. Figure 12 [See Simunovic Comments, p. 12.] shows the points of interest to determine the boundary of the crush zone, and an assumption that crash energy dissipation occurs ahead of the front support for the lower rail. Figure 13 [See Simunovic Comments, p. 12.] gives the history of the axial displacements for the two points above. At their maximum points, the relative reduction of their distance from the starting condition is 0.7 inches. Since the distance between the front of the rail support and the rocker remains practically unchanged during the test, we can reasonably assume that majority of the crash energy is dissipated in less than 22 inches. To quickly evaluate the feasibility of the proposed design, we can use the concept of the Equivalent Square Wave (ESW) ["Vehicle crashworthiness and occupant protection", American Iron and Steel Institute, Priya, Prasad and Belwafa, Jamel E., Eds. (2004).]. ESW assumes constant, rectangular, impact pulse for the entire length of the stopping distance (in our case equal to 22 in) from initial velocity (35 mph). ESW represents an equivalent constant rectangular shaped pulse to an arbitrary input pulse. In our case ESW is about 22 g. Sled tests and occupant model simulations indicate that crash pulses exceeding ESW of 20 g will have difficulties to satisfy FMVSS 208 crash dummy performance criteria [11]. For a flat front barrier crash of 35 mph and an ESW of 20 g, the minimum stopping distance is 24 in. Advanced restraint systems and early trigger airbags may need to be used in order to satisfy the injury criteria and provide sufficient ride down time for the vehicle occupants. The authors of the study do not elaborate on the safety indicators. I firmly believe that such a discussion would be very informative and valuable to a wide audience. On several places, the authors state values for average accelerations up to 30 ms from the impact, and average accelerations after 30 ms. When stated without a context, these numbers do not help the readers who are not versed in the concepts of crashworthiness. The authors most likely refer to the effectiveness time of the restraint systems. An overview of the concepts followed by a discussion of the occupant safety calculations for this particular design would be very valuable.
If you are aware of better methods employed and documented elsewhere to help select and analyze advanced vehicle materials and design engineering rigor for 2020-2025 vehicles, please suggest how they might be used to improve this study.
[Joost] No comment. [Richman] No comment. [OSU] No suggestions at this time.

16
ADDITIONAL COMMENTS: [Joost] This is a very thorough design process, undertaken by a very credible design organization (Lotus). There are a variety of design assumptions and trade-offs that were made during the process (as discussed above), but this would be expected for any study of this type. Having a design team from Lotus adds credibility to the assumptions and design work that was done here. Section 4.5.8.1 uses current “production” vehicles as examples for the feasibility of these techniques. However, many of the examples are for extremely high-end vehicles (Bentley, Lotus Evora, McLaren) and the remaining examples are for low-production, high-end vehicles (MB E class, Dodge Viper, etc.). The cost of some technologies can be expected to come down before 2020, but it is not reasonable to assume that (for example) the composites technologies used in Lamborghinis will be cost competitive on any time scale; significant advances in composite technology will need to be made in order to be cost competitive on a Venza, and the resulting material is likely to differ considerably (in both properties and manufacturing technique) from the Lamborghini grade material. [Richman] [1] Achieving a 37% BIW mass reduction with a multi material design optimized for safety performance is consistent with recent research and production vehicle experience. BIW mass reductions resulting from conversion of conventional BIW structures to aluminum based multi-material BIW have ranged from 35%-39% (Jaguar XJ, Audi A8) to 47% (OEM study). BIW related mass reductions above 40% were achieved where the baseline structure was predominantly mild steel. A recent University of Aachen (Germany) concluded BIW structures optimized for safety performance utilizing low mass engineering materials can achieve 35-40% mass reduction compared to a BIW optimized using conventional body materials. A recent BIW weight reduction study conducted at the University of Aachen (Germany)”. http://www.eaa.net/en/applications/automotive/studies/
Most of the BIW content (materials, manufacturing processes) selected for the PH 2 vehicle have been in successful volume auto industry production for several years. [2] Closures/Fenders: Mass reduction in the closure and fender group is 59 Kg, 41% of baseline Venza. This level of mass reduction is consistent with results of the Aachen and IBIS studies and industry experience on current production vehicles. Hood and fenders on the PH 2 vehicle are aluminum. Recent Ducker Worldwide Survey of 2012 North American Vehicles found over 30% of all North American vehicles have aluminum hoods and over 15% of vehicle have aluminum fenders. PH 2 use of aluminum for closure panels is consistent with recognized industry trends for these components. PH 2 doors utilize aluminum outer skins over cast magnesium inner panels. [3] Material properties: Aluminum alloy and temper selection for BIW and Closures are appropriate for those components. Those materials have been used in automotive applications for several years and are growing in popularity in future vehicle programs. [4] Typical vs. Minimum properties: Automobile structural designs are typically based on minimum mechanical properties. Report does not identify the data used (minimum or typical). Aluminum property data used in for the PH 2 design represents expected minimum values for the alloys and tempers. This reviewer is not able to comment on property values used for the other materials used in the BIW. [5] Aluminum pre-treatment: PH 2 vehicle structure utilizes adhesive bonding of major structural elements. Production vehicle experience confirms pre-

17
treatment of sheet and extruded aluminum bonding surfaces is required to achieve maximum joint integrity and durability. PH 2 vehicle description indicates sheet material is anodized as a pre-treatment. From the report it is not clear that pretreatment is also applied to extruded elements. The majority of high volume aluminum programs in North America have moved away from electrochemical anodizing as a pre-treatment. Current practice is use of a more effective, lower cost and environmentally compatible chemical conversion process. These processes are similar to Alodine treatment. Predominant aluminum pre-treatments today are provided by Novelis (formerly Alcan Rolled Products) and Alcoa (Alcoa 951). Both processes achieve similar results and need to be applied to the sheet and extruded elements that will be bonded in assembly [6] Suspension and Chassis: Suspension/chassis PH 2 mass reduction is 162 Kg (43% of baseline). This level of mass reduction is higher than has been seen in similar studies. Lotus PH 2 includes conversion of steering knuckles, suspension arms and the engine cradle to aluminum castings. Mass reductions estimated for conversion of those components are estimated at approximately 50%. Recent Ducker study found aluminum knuckles are currently used on over 50% of North American vehicles and aluminum control arms are used on over 30% of North American vehicles. Achieving 50% mass reduction through conversion of these components to aluminum is consistent with industry experience. [7] Wheel/Tire: Total wheel and tire mass reduction of 64 Kg (46%) is projected for the wheel and tire group. Project mass reduction is achieved through a reduction in wheel and tire masses and elimination of the spare tire and tool kit. Tire mass reduction is made possible by a 30% reduction in vehicle mass. Projected tire mass reduction is 6 Kg for 4 tires combined. This mass reduction is consistent with appropriate tire selection for PH 2 vehicle final mass. Road wheel mass reduction is 5.6 Kg (54%) per wheel. It is not clear from the report how this magnitude of reduction is achieved. The report attributes wheel mass reduction to possibilities with the Ablation casting process. PH 1 report discussion of Ablation casting states: “The process would be expected to save approximately 1 Kg per wheel.” Considering the magnitude of this mass reduction a more detailed description of wheel mass reduction would be appropriate. Elimination of the spare tire and jack reduces vehicle mass by 23 Kg. This is feasible but has customer perceptions of vehicle utility implications. Past OEM initiatives to eliminate a spare tire have encountered consumer resistance leading to reinstatement of the spare system in some vehicles. [8] Engine and Driveline: Engine and driveline for the PH 2 vehicle were defined by the study sponsors and not evaluated for additional mass reduction in the Lotus study. Baseline Venza is equipped with a technically comprehensive conventional 2.7 L4 with aluminum engine block and heads and conventional 6 speed transmission. PH 2 vehicle is equipped with a dual mode hybrid drive system powered by a turbocharged 1.0 L L-4 balance shaft engine. Engine was designed by Lotus and sized to meet the PH 2 vehicle performance and charging requirements. Mass reduction achieved with the PH 2 powertrain is 54 Kg. This level of mass reduction appears achievable based on results of secondary mass reductions resulting from vehicle level mass reductions in excess of 20%. [9] Interior: Lotus PH 2 design includes major redesign of the baseline Venza interior. Interior design changes achieve 97 Kg (40%) weight reduction from the baseline interior. Majority of interior weight reduction is achieved in the seating (43 Kg) and trim (28 Kg). Interior weight reduction strategies in the PH 2 design represent significant departures from baseline Venza interior. New seating designs and interior concepts (i.e.: replacing carpeting with bare floors and floor mats) may not be consistent with consumer wants and expectations in those areas. Interior trim and seating designs used in the PH 2 vehicle have been

18
explored generically by OEM design studios for many years. [10] Energy balance: Is presented as validation of the FEM analysis. For each load case an energy balance is presented. Evaluating energy balance is a good engineering practice when modeling complex structures. Energy balance gives confidence in the mathematical fidelity of the model and that there are no significant mathematical instabilities in the calculations. Energy balance does not confirm model accuracy in simulating a given physical structure.

19
3. VEHICLE CRASHWORTHINESS TESTING METHODOLOGICAL RIGOR.
COMMENTS
Please comment on the methods used to analyze the vehicle body structure’s structural integrity and safety crashworthiness.
[Joost] Regarding my comment on joint failure under complex stress states, note that in figure 4.3.12.a the significant plastic strains are all located at the bumper-rail joints. While this particular test was only to indicate the damage (and cost to repair), the localization of plastic strain at the joint is somewhat concerning. The total-vehicle torsional stiffness result is remarkably high. If this is accurate, it may contribute to an odd driving “feel”, particularly by comparison to a conventional Venza; higher torsional stiffness is usually viewed as a good thing, but the authors may need to address whether or not such extreme stiffness values would be appealing to consumers of this type of vehicle. While there doesn’t appear to be a major source of error in the torsional stiffness analysis, the result does call into question the accuracy; this is either an extraordinarily stiff vehicle, or there was an error during the analysis. [Richman] LS-Dyna and MSC-Nastran are current and accepted tools for this kind of analysis. FEM analysis is part art as well as science, the assumption had to be made that Lotus has sufficient skills and experience to generate a valid simulation model. [OSU] The crash simulations that were completed seem to be well created models of the vehicle that they represent. The geometry was formed from mid-surface models of the sheet metal. Seat belt and child restraint points are logically modeled.
Please describe the extent to which state-of-the-art crash simulation testing methods have been employed as well as the extent to which the associated analysis exhibits strong technical rigor.
[Joost] This is outside of my area of expertise [Richman] Model indicates the PH 2 structure could sustain a peak load of 108 kN under FMVSS 216 testing. This is unusually high for an SUV roof, and stronger than any roof on any vehicle produced to date. Result questions stiffness and strength results of the simulations. Intrusion velocities and deformation are used as performance criteria in the side impact simulations. Performance acceptability judgments made using those results, but no data was given for comparison to any other vehicle. Occupant protection performance cannot be judged based entirely on deformations and intrusion velocities. Report states that “the mass-reduced vehicle was validated for meeting the listed FMVSS requirements.” This is an overstatement of what the analysis accomplished. FMVSS test performance is judged based on crash dummy accelerations and loads. The FEM analysis looked only at BIW acceleration and intrusion levels. While these can provide a good basis for

20
engineering judgment, no comparison to physical crash test levels is provided. “Acceptable” levels were defined by Lotus without explanation. Results may be good, but would not be sufficient to “validate” the design for meeting FMVSS requirements. Model has not been validated against any physical property. In normal BIW design development, an FEM is developed and calibrated against a physical test. The calibrated model is considered validated for moderate A:B comparisons. [OSU] Animations of all of the crash tests were reviewed. These models were checks for structural consistence and it was found that all parts were well attached. The deformation seen in the structure during crash seems representative of these types of collisions. Progressive deformation flows in a logical manner from the point of impact throughout the vehicle. [Simunovic] The documented results in the study show that authors have employed current state-of-the-art for crashworthiness modeling and followed systematic technical procedures. This methodology led them through a sequence of model versions and continuous improvement of the fidelity of the models. I would suggest that a short summary be added describing the major changes of the Phase 2 design with respect to the original High Development vehicle body design.
For reviewers with vehicle crash simulation capabilities to run the LS-DYNA model, can the Lotus design and results be validated?*
[Joost] N/A [Richman] Some validation can be done by reviewing modeling technique and assumptions, but without any form of physical test comparison, the amount of error is unknown and can be significant. FEM validation was presented in the form of an energy balance for each load case. Energy balance is useful in confirming certain internal aspects of the model are working correctly. Energy balance does not validate how accurately the model simulates the physical structure. Presenting energy balance for each load case and suggesting balance implies FEM accuracy is misleading. [OSU] The actual LS-DYNA model crash simulations were not rerun. Without any changes to the inputs there would be no changes in the output. Discussion of the input properties occurs in Section 2. [Simunovic] The authors had several crash tests of the baseline vehicle, 2009 Toyota Venza, to use for comparison and trends. Tests 6601 and 6602 were conducted in 2009 so that they could be readily used for the development. The data from test 6601 was used in the Phase 2 report for comparison. Test 6602 was not used for comparison in the report. While the report abounds with crash simulations and graphs documenting tremendous amount of work that authors have done, it would have been very valuable to add comparison with the 6602 test even at the expense of some graphs. Page 72 of the Phase 2 report starts with comparison of the simulations with the tests and that is one of the most engaging parts of the document. I suggest that it warrants a section in itself. It is currently located out of place, in between the simulation

21
results and it needs to be emphasized more. This new section would also be a good place for discussion on occupant safety modeling and general formulas for the subject. One of the intriguing differences between the simulations and baseline vehicle crash test is the amount and the type of deformation in the frontal crash. As noted previously, computational model is very stiff with very limited crush zone. Viewed from the left side (Figure 14) [See Simunovic Comments, p. 14.], and from below (Figure 15) [See Simunovic Comments, p. 15.], we can see that the majority of the deformation is in the frame rail, and that the subframe’s rear supports do not fail. The strong rear support to the frame rail, does not appreciably deform, and thereby establishes the limit to the crash deformation. The overall side kinematics of the crash is shown in Figure 16. [See Simunovic Comments, p. 15.] The front tires barely touch the wheel well indicating a high stiffness of the design. Note that the vehicle does not dive down at the barrier. The numbers 1-4 below the images denote times after impact of 0ms , 35ms, 40 ms, and 75ms, respectively. The times were selected based on characteristic event times observed in crash simulations. The following images are from the NHTSA NCAP crash test 7179 for 2011 Toyota Venza. The response is essentially the same as for the 2009 version, but the images are of much higher quality so that they have been selected for comparison. These times corresponding to the times in Figures 15 and 16 are shown in Figure 17. [See Simunovic Comments, p. 16.] The subframe starts to rapidly break off of the vehicle floor around 40 ms, and therefore allows for additional deformation. In Lotus vehicle this connection remains intact so that it cannot contribute to additional crash length. The left side view of the test vehicle during crash at the same times is shown in Figure 18. [See Simunovic Comments, p. 17.] There is an obvious difference between the simulations and the tests. The developed lightweight model and the baseline vehicle do represent two different types of that share general dimensions, so that the differences in the responses can be large. However, diving down during impact is so common across the passenger vehicles so that different kinematics automatically raises questions about the accuracy of the suspension system and the mass distribution. If such kinematic outcome was a design objective, than it can be stated in the tests.
If you are aware of better methods and tools employed and documented elsewhere to help validate advanced materials and design engineering rigor for 2020-2025 vehicles, please suggest how they might be used to improve the study.
[Joost] While it’s not made explicit in the report, it seems that the components are likely modeled with the materials in a zero-strain condition – i.e. the strain hardening and local change in properties that occurs during stamping is not considered in the properties of the components. While not widely used in crash modeling (as far as I am aware), including the effects of strain hardening on local properties from the stamping process is beginning to find use in some design tools. While none of the materials used in this study have extreme strain hardening properties (such as you might find in TRIP steels or 5000 series Al), all of these sheet materials will experience some change in properties during stamping. I do not consider the study deficient for having used zero-strain components, but it may be worth undergoing a simple

22
study to determine the potential effects on some of the components. This is complicated by the further changes that may occur during the paint bake cycle. [Richman] Cannot truly be validated without building a physical prototype for comparison. [OSU] LS-DYNA is the state of the art for this type of analysis. As time allows for the 2020-2025 model year, additional more detailed material modeling should occur. As an example the floor structure properties can be further investigated to answer structural creep and strength concerns.
ADDITIONAL COMMENTS: [Richman] Study is very thorough in their crash loadcase selections and generated a lot of data for evaluation. Might have included IIHS Offset ODB and IIHS Side Impact test conditions which most OEM's consider. Study is less thorough in analyzing normal loads that influence BIW and chassis design (i.e. pot holes, shipping, road load fatigue, curb bump, jacking, twist ditch, 2g bump, etc.). Report indicates “Phase 2 vehicle model was validated for conforming to the existing external data for the Toyota Venza, meeting best-in-class torsional and bending stiffness, and managing customary running loads.” Only torsional stiffness is reported.
Modal frequency analysis data Is not reported. Conclusions for many of the crash load cases (primarily dynamic) did not use simulation results to draw quantitative comparisons to the Toyota Venza or other peer vehicles. For instance, intrusion velocities for side impacts are reported. But, no analytical comparison is made to similar vehicles that currently meet the requirements. Comparable crash tests are often available from NHTSA or IIHS. Remarkable strength exhibited by the FEM roof under an FMVSS test load raises questions validity of the model. Model assumes no failures of adhesive bonding in materials during collisions. Previous crash testing experience suggest[s] some level of bonding separation and resulting structure strength reduction is likely to occur. Unusual simulation results – [1] Models appear reasonable and indicate the structure has the potential to meet collision safety requirements. Some unusual simulation results raise questions about detail accuracy of the models. [2] FMVSS 216 quasi-static roof strength: Model indicates peak roof strength of 108 KN. This is unusually high strength for an SUV type vehicle. The report attributes this high strength to the major load being resisted by the B-pillar. Several current vehicles employ this construction but have not demonstrated roof strength at this level. The report indicates the requirement of 3X curb weight is reached within 20 mm which is typically prior to the test platen applying significant load directly into the b-pillar.
23
[3] 35 MPH frontal rigid barrier simulation: Report indicates the front tires do not contact the sill in a 35 MPH impact. This is highly unusual structural performance. Implications are the model or the structure is overly stiff. [4] Body torsional stiffness: Torsional stiffness is indicated to be 32.9 kN/deg. Higher than any comparable vehicles listed in the report. PH 2 structure torsional stiffness is comparable to significantly more compact body structures like the Porsche Carrera, BMW 5 series, Audi A8. It is not clear what elements of the PH 2 structure contribute to achieving the predicted stiffness. [5] Door beam modeling: Door beams appear to stay tightly joined to the body structure with no tilting, twisting or separation at the lock attachments in the various side impact load modes. This is highly unusual structural behavior. No door opening deformation is observed in any frontal crash simulations. This suggests the door structure is modeled as an integral load path. FMVSS requires that doors are operable after crash testing. Door operability is not addressed in the report. [6] Safety analysis of the PH2 structure is based on collision simulation results using LS-Dyna and Nastran software simulations. Both software packages are widely used throughout the automotive industry to perform the type of analysis in this report. Accuracy of simulated mechanical system performance is highly dependent on how well the FEM model represents the characteristics of the physical structure being studied. Accurately modeling a complete vehicle body structure for evaluation under non-linear loading conditions experienced in collisions is a challenging task. Small changes in assumed performance of nodes and joints can have a significant impact on predicted structure performance. Integration of empirical joint test data into the modeling process has significantly improved the correlation between simulated and actual structure performance. [OSU] This reviewer sat down with the person who created and ran the LS-DYNA FEA models. Additional insight into how the model performs and specific questions were answered on specific load cases. All questions were answered. Another reviewer which did not visit Lotus commented on the following: 1. The powertrain has more than 15% of the vehicle mass and therefore the right powertrains should be used in simulation. 2. The powertrain is always mounted on the body by elastic mounts. The crash behavior of the elastic mounts might easy introduce a 10% error in determination of the peak deceleration (failure vs not failure might be much more than 10%). So modeling a close-to-reality powertrain and bushing looks like a must (at least for me). 3. Although not intuitive, the battery pack might have a worst crash behavior than the fuel tank. Therefore the shoulder to shoulder position might be inferior to a tandem configuration (with the battery towards the center of the vehicle). 4. The battery pack crash behavior is of high importance of its own. It is very possible that after a crash an internal collapse of the cells and/or a penetration might produce a short-circuit. It should be noted that by the time of writing there are not developed any reasonable solutions to mitigate an internal short-circuit. Although not directly life treating, this kind of event will produce a vehicle loss.
24
Also, very important, but subtle would be literature references that give an idea of how accurate the community can expect LS-DYNA crash simulations to be in a study such as this. Often manufacturers have the luxury of testing similar bodies, materials and joining methodologies and tuning their models to match broad behavior and then the effects of specific changes can be accurately measured. Here the geometric configuration, many materials and many joining methods are essentially new. Can Lotus provide examples that show how accurate such ‘blind’ predictions may be? Model calibration – Analytical models have the potential to closely represent complex non-liner structure performance under dynamic loading. With the current state of modeling technology, achieving accurate modeling normally requires calibration to physical test results of an actual structure. Models developed in this study have not been compared or calibrated to a physical test. While these simulations may be good representations of actual structure performance, the models cannot be regarded as validated without some correlation to physical test results. Project task list includes dynamic body structure modal analysis. Report Summary of Safety Testing Results” indicates the mass reduced body exhibits “best in class” torsional and bending stiffness. The report discusses torsional stiffness but there is no information on predicted bending stiffness. No data on modal performance data or analysis is presented.

25
4. VEHICLE MANUFACTURING COST METHODOLOGICAL RIGOR
COMMENTS
Please comment on the methods used to analyze the mass-reduced vehicle body structure’s manufacturing costs.
[Joost] The report does a good job of identifying, in useful detail, the number of workstations, tools, equipment, and other resources necessary for manufacturing the BIW of the vehicle. These are all, essentially, estimates by EBZ; to provide additional credibility to the manufacturing assessment it would be helpful to include a description of other work that EBZ has conducted where their manufacturing design work was implemented for producing vehicles. Lotus is a well-known name, EBZ is less well known. [Richman] Notable strengths of this analysis, besides the main focus on crash analysis, are the detail of assembly facility design, labor content, and BIW component tooling identification. Main weakness of the cost analysis is the fragmented approach of comparing costs derived in different approaches and different sources, and trying to infer relevant information from these differences. [OSU] Flat year-over-year wages for the cost analysis seems unrealistic. Additional source information requested for wage rates for various locations.
Please describe the extent to which state-of-the-art costing methods have been employed as well as the extent to which the associated analysis exhibits strong technical rigor.
[Joost] This is not my area of expertise [Richman] Vulnerability in this cost study appears to be validity and functional equivalence of BIW design with 169 pieces vs. 407 for the baseline Venza. Total tooling investment of $28MM for the BIW not consistent with typical OEM production experience. BIW tooling of $150-200MM would not be uncommon for conventional BIW manufacturing. If significant parts reduction could be achieved, it would mean less tools, but usually larger and more complex ones, requiring larger presses and slower cycle times. [OSU] Difficult to evaluate since this portion of the report was completed by a subcontractor. The forming dies seem to be inexpensive as compared to standard steel sheet metal forming dies.
If you are aware of better methods and tools employed and documented elsewhere to help
[Joost] This is not my area of expertise [Richman] Applying a consistent costing approach to each vehicle and vehicle system using a manufacturing cost model

26
estimate costs for advanced vehicle materials and design for 2020-2025 vehicles, please suggest how they might be used to improve this study.
approach. This approach would establish a more consistent and understandable assessment of cost impacts of vehicle mass reduction design and technologies. [OSU] None.
ADDITIONAL COMMENTS: [Joost] The assessment of the energy supply includes a description of solar, wind, and biomass derived energy. While the narrative is quite positive on the potential for each of these energy sources, it’s not clear in the analysis how much of the power for the plant is produced using these techniques. If the renewable sources provide a significant portion of the plant power, then the comparison of the Ph2 BIW cost against the production Venza cost may not be fair. The cost of the Venza BIW is determined based on the RPE and several other assumptions and therefore includes the cost of electricity at the existing plant. Therefore, if an automotive company was going to invest in a new plant to build either the Ph2 BIW or the current Venza BIW (and the new plant would have the lower cost power) then the cost delta between the two BIWs would be different than shown here (because the current Venza BIW produced at a new plant would be less expensive). The same argument could be made for the labor costs and their impact on BIW cost. By including factors such as power and labor costs into the analysis, it’s difficult to determine what the cost savings/penalty is due only to the change in materials and assembly – the impact of labor and energy are mixed into the result. [OSU] The number of workers assigned to vehicle assembly in this report seems quite low. Extra personal need to be available to replace those with unexcused absences. Do these assembly numbers also include material handling personnel to stock each of the workstations? While this work does make a compelling case it downplays some of the very real issues that slow such innovation in auto manufacturing. Examples: multi-material structures can suffer accelerated corrosion if not properly isolated in joining. Fatigue may also limit durability in aluminum, magnesium or novel joints. Neither of these durability concerns is raised. Also, automotive manufacturing is very conservative in using new processes because one small process problem can stop an entire auto manufacturing plant. Manufacturing engineers may be justifiably weary of extensive use of adhesives, until these are proven in mass production in other environments. These very real impediments to change should be mentioned in the background and conclusions. [Richman] Summary – Cost projections . . . lack sufficient rigor to support confidence in cost projections and in some cases are based on “optimistic” assumptions. Significant cost reduction is attributed to parts consolidation in the body structure. Part count data presented in the report appears to reflect inconsistent content between baseline and PH 2 designs. Body manufacturing labor rates and material blanking recovery are not consistent with actual industry experience. Using normal industry experience for those two factors alone would add $273 to body manufacturing cost. Tooling cost estimates for individual body dies appear to be less than half normal industry experience for dies of this type. Cost modeling -- Assessing cost implications of the PH 2 design [is] a critically important element of the project. Total vehicle cost was derived from vehicle list price using estimated Toyota mark-up for overhead and profit. This process assumes average Toyota mark-up applies to Venza pricing. List price for specific vehicles is regularly influenced by business and competitive marketing factors. (Chevrolet Volt is believed to be

27
priced significantly below GM corporate average margin on sales, while the Corvette is believed to be above target margin on sales.) System cost assumptions based on average sales margin and detailed engineering judgments can be a reasonable first order estimate. These estimates can be useful in allocation of relative to costs to individual vehicle systems, but lack sufficient rigor to support definitive cost conclusions Baseline Venza system costs were estimated by factoring estimated total vehicle cost and allocating relative cost factors for each major sub-system (BIW, closures, chassis, bumpers, suspension, …) based on engineering judgment. Cost of PH 2 purchased components were developed using a combination of estimated baseline vehicle system estimated costs, engineering judgment and supplier estimates. Cost estimates for individual purchased components appear realistic. Body costs for PH 2 design were estimated by combining scaled material content from baseline vehicle (Venza) and projected manufacturing cost from a new production processes and facility developed for this project. This approach is logical and practical, but lacks the rigor to support reliable estimates of new design cost implications when the design changes represent significant departures from the baseline design content. Body piece cost and tooling investment estimates were developed by Intgellicosting. No information was provided on Intellicosting methodology. Purchased component piece cost estimates (excluding BIW) are in line with findings in similar studies. Tooling costs supplied by Intellicosting are significantly lower than actual production experience would suggest. Assembly costs were based on detailed assembly plant design, work flow analysis and labor content estimates. Assembly plant labor content (minutes) is consistent with actual BIW experienced in other OEM production projects. The PH 2 study indicates and aluminum based multi material body (BIW, closures) can be produced for at a cost reduction of $199 relative to a conventional steel body. That conclusion is not consistent with general industry experience. This inconsistency may result from PH 2 assumptions of material recovery, labor rates and pars consolidation. A recent study conducted by IBIS Associates “Aluminum Vehicle Structure: Manufacturing and Life Cycle Cost Analysis” estimated a cost increase $560 for an aluminum vehicle BIW and closures. http://aluminumintransportation.org/members/files/active/0/IBIS%20Powertrain%20Study%20w%20cover.pdf That study was conducted with a major high volume OEM vehicle producer and included part cost estimates using detailed individual part cost estimates. Majority of cost increases for the low mass body are offset by weight related cost reductions in powertrain, chassis and suspension components. Conclusions from the IBIS study are consistent with similar studies and production experience at other OEM producers. BIW Design Integration -- Report identifies BIW piece count reduction from a baseline of 419 pieces to 169 for PH 2. Significant piece cost and labor cost savings are attributed to the reduction in piece count. Venza BOM lists 407 pieces in the baseline BIW. A total of 120 pieces are identified as having “0” weight and “0” cost. Another 47 pieces are listed as nuts or bolts. PH 2 Venza BOM lists no nuts or bolts and has no “0” mass/cost components. With the importance

28
attributed to parts integration, these differences need to be addressed. Closure BOM for PH 2 appears to not include a number of detail components that are typically necessary in a production ready design. An example of this is the PH 2 hood. PH 2 Hood BOM lists 4 parts, an inner and outer panel and 2 hinges. Virtually all practical aluminum hood designs include 2 hinge bracket reinforcements, a latch support and a palm reinforcement. Absence of these practical elements of a production hood raise questions about the functional equivalency (mounting and reinforcement points, NVH, aesthetics,…) of the two vehicle designs. Contents of the Venza BOM should be reviewed for accuracy and content in the PH 2 BOM should be reviewed for practical completeness. Tooling Investment -- Tooling estimates from Intellicosting are significantly lower than have been seen in other similar studies or production programs and will be challenged by most knowledgeable automotive industry readers. Intellicosting estimates total BIW tooling at $28MM in the tooling summary and $70 MM in the report summary. On similar production OEM programs complete BIW tooling has been in the range of $150MM to $200MM. The report attributes low tooling cost to parts consolidation. This does not appear to completely explain the significant cost differences between PH 2 tooling and actual production experience. Parts consolidation typically results in fewer tools while increasing size, complexity and cost of tools used. The impact of parts consolidation on PH 2 weight and cost appears to be major. The report does not provide specific examples of where parts consolidation was achieved and the specific impact of consolidation. Considering the significant impact attributed to parts consolidation, it would be helpful provide specific examples of where this was achieved and the specific impact on mass, cost and tooling. Based on actual production experience, PH 2 estimates for plant capital investment, tooling cost and labor rates would be viewed as extremely optimistic Material Recovery -- Report states estimates of material recovery in processing were not included in the cost analysis. Omitting this cost factor can have a significant impact on cost of sheet based aluminum products used in this study. Typical auto body panel blanking process recovery is 60%. This recovery rate is typical for steel and aluminum sheet. When evaluation material cost of an aluminum product the impact of recovery losses should be included in the analysis. Potential impact of material recovery for body panels: Approximate aluminum content (BIW, Closures) 240 Kg Input material required at 60% recovery 400 Kg Blanking off-all 160 Kg Devaluation of blanking off-all (rough estimate) Difference between raw material and Blanking off-all $1.30/Kg $211
Blanking devaluation increases cost of aluminum sheet products by over $ 0.90/Kg.
Appropriate estimates of blanking recoveries and material devaluation should be included in cost estimates for stamped aluminum sheet components. Recovery rates for steel sheet products are similar to aluminum, but the economic impact of steel sheet devaluation is a significantly lower factor in finished part cost per pound.

29
Report indicates total cost of resistance spot welding (RSW) is 5X the cost of friction spot welding (FSW). Typical total body shop cost (energy, labor, maintenance, consumable tips) of a RSW is $0.05 - $0.10. For the stated ratio to be accurate, FSW total cost would be $0.01-$0.02 which appears unlikely. It is possible the 5X cost differential apply to energy consumption and not total cost. Labor rates -- Average body plant labor rates used in BIW costing average $35 fully loaded. Current North American average labor rates for auto manufacturing (typically stamping, body production and vehicle assembly)
Toyota $55 GM $56 (including two tier) Ford $58 Honda $50 Nissan $47 Hyundai $44 VW $38
Labor rate of $35 may be achievable (VW) in some regions and circumstances. The issue of labor rate is peripheral to the central costing issue of this study which is assessing the cost impact of light weight engineering design. Method used to establish baseline BIW component costs inherently used current Toyota labor rates. Objective assessment of design impact on vehicle cost would use same labor rates for both configurations. Labor cost or BIW production is reported to be $108 using an average rate of $35. Typical actual BIW labor content from other cost studies with North American OEM’s found actual BIW labor content approaching $200. Applying the current Toyota labor rate of $55 to the PH 2 BIW production plan increases labor content to $170 (+$62) per vehicle.

30
5. CONCLUSION AND FINDINGS
COMMENTS
Are the study’s conclusions adequately backed up by the methods and analytical rigor of the study?
[Joost] In the summary section there is an analysis that attempts to project the “potential weight savings” for vehicle classes beyond the Venza. The analysis is based on specific density which assumes that the architecture of the vehicles is the same. For example, the front-end crash energy management system in a micro car is likely quite different from the comparable system in a large luxury car (aside from differences in gauge to account for limited crash space, as discussed in the report). While this analysis provides a good starting point, I do not feel that it is reasonable to expect the weight reduction potential to scale with specific density. In other words, I think that the 32.4 value used in the analysis also changes with vehicle size due to changes in architecture. Similarly, the cost analysis projecting cost factor for other vehicle classes is a good start, but it’s unlikely that the numbers scale so simply. [Richman] Summary – General: Engineering analysis is very thorough and reflects the vehicle engineering experience and know-how of the Lotus organization. Study presents a realistic perspective of achievable vehicle total vehicle mass reduction using available design optimization tools, practical light weight engineering materials an available manufacturing processes. Results of the study provide important insight into potential vehicle mass reduction generally achievable by 2020. Summary – Conclusions: Report Conclusions overstate the level of design “validation” achievable utilizing state-of-the- art modeling techniques with no physical test of a representative structure. From the work in this study it is reasonable to conclude the PH 2 structure has the potential to pass FMVSS and IIHS safety criteria. Summary – Mass Reduction: Majority of mass reduction concepts utilized are consistent with general industry trends. Mass reduction potential attributed to individual components appear reasonable and consistent with industry experience with similar components. As an advanced design concept study, the PH 2 project is a valuable and important piece of work.
The PH 2 study did not include physical evaluation of a prototype vehicle or major vehicle sub system. Majority of the chassis and suspension content was derived from similar components for which there is extensive volume production experience. Some of the technologies included in the design are “speculative” and may not mature to production readiness or achieve projected mass reduction estimates by 2020. For those reasons, the PH 2 study is a “high side” estimate of practical overall vehicle mass reduction potential.
Summary – Safety: Major objective of this study is to “validate” safety performance of the PH 2 vehicle concept. Critical issue is the term “validate”. Simulation modeling and simulation tools used by Lotus are widely recognized as state-of-the-

31
art. Lotus modeling skills are likely to among the best available in the global industry. Project scope did not include physical test of the structure to confirm model accuracy. Safety performance data presented indicates the current structure has the potential to meet all FMVSS criteria, but would not be generally considered sufficient to “validated” safety performance of the vehicle. Physical test correlation is generally required to establish confidence in simulation results. Some simulation results presented are not consistent with test results of similar vehicles. Explanations provided for the unusual results do not appear consistent with actual structure content. Overstating the implications of available safety results discredits the good design work and conclusions of this study. FMVSS test performance conclusions are based on simulated results using an un-validated FE model. Accuracy of the model is unknown. Some simulation results are not typical of similar structures suggesting the model may not accurately represent the actual structure under all loading conditions. [OSU] Yes.
Are the conclusions about the design, development, validation, and cost of the mass-reduced design valid?
[Joost] Yes. Despite some of the critical commentary provided above, I believe that this study does a good job of validating the technical and cost potential of the mass-reduced design. The study is lacking durability analysis and, on a larger scale, does not include constructing a demonstration vehicle to validate the model assumptions; both items are significant undertakings and, while they would add credibility to the results, the current study provides a useful and sound indication of potential. [Richman] Safety performance and cost conclusions are not clearly support by data provided. Safety Conclusion – A major objective of the PH 2 study is to “validate” the light weight vehicle structure for compliance with FMVSS requirements. State of the art FEM and dynamic simulations models were developed. Those models indicate the body structure has the potential to satisfy FMVSS requirements. FMVSS requirements for dynamic crash test performance is defined with respect to occupant loads and accelerations as measured using calibrated test dummies. The FEM simulations did not include interior, seats, restraint systems or occupants. Analytical models in this project evaluate displacements, velocities, and accelerations of the body structure. Predicting occupant response based on body structural displacements velocities and accelerations is speculative. Simulation results presented are a good indicator of potential performance. These simulations alone would not be considered adequate validation the structure for FMVSS required safety performance. [OSU] Yes.

32
Are you aware of other available research that better evaluates and validates the technical potential for mass-reduced vehicles in the 2020-2025 timeframe?
[Joost] The World Auto Steel Ultra Light Steel Auto Body, the EU SuperLight Car, and the DOE/USAMP Mg Front End Research and Development design all provide addition insight into weight reduction potential. However, none are as thorough as this study in assessing potential in the 2020-2025 timeframe. [Richman] Most studies employing a finite element model validate a base model against physical testing, then do variational studies to look at effect. Going directly from an unvalidated FEM to quantitative results is risky, and the level of accuracy is questionable [OSU] No.
ADDITIONAL COMMENTS:

33
6. OTHER POTENTIAL AREAS FOR COMMENT
COMMENTS
Has the study made substantial improvements over previous available works in the ability to understand the feasibility of 2020-2025 mass-reduction technology for light-duty vehicles? If so, please describe.
[Joost] Yes. The best example was the Phase 1 study, which lacked much of the detail and focus included here. The other studies that I mentioned above do not go into this level of detail or are not focused on the same time frame. [Richman] Fundamental engineering work is very good and has the potential to make a substantial and important contribution to industry understanding of mass reduction opportunities. The study will receive intense and detailed critical review by industry specialists. To achieve potential positive impact on industry thinking, study content and conclusions must be recognized as credible. Unusual safety simulation results and questionable cost estimates (piece cost, tooling) need to be explained or revised. As currently presented, potential contributions of the study are likely to be obscured by unexplained simulation results and cost estimates that are not consistent with actual program experience. [OSU] Yes.
Do the study design concepts have critical deficiencies in its applicability for 2020-2025 mass-reduction feasibility for which revisions should be made before the report is finalized? If so, please describe.
[Joost] There is nothing that I would consider a “critical deficiency” however many of the comments outlined above could be addressed prior to release of the report. [Richman] Absolutely. Recommended adjustments summarized in Safety analysis, and cost estimates (recommendations summarized in attached review report). Credibility of study would be significantly enhanced with detail explanations or revisions in areas where unusual and potentially dis-crediting results are reported. Conservatism in assessing CAE based safety simulations and cost estimates (component and tooling) would improve acceptance of main report conclusions. Impact of BIW plant site selection discussion and resulting labor rates confuse important assessment of design driven cost impact. Suggest removing site selection discussion. Using labor and energy cost factors representative of the Toyota Venza production more clearly identifies the true cost impact of PH 2 design content. [OSU] No.
Are there fundamentally different lightweight vehicle design technologies that you expect to be much more common (either in addition to or instead of) than the one Lotus has assessed for the 2020-2025 timeframe?
[Joost] Some effort was made in the report to discuss joining and corrosion protection techniques, however it is possible that new techniques will be available prior to 2025. For example, there was very little discussion on how a vehicle which combines so many different materials could be pre-treated, e-coated, and painted in an existing shop. There will likely be new technologies in this area. [Richman] Technologies included in the PH 2 design are the leading candidates to achieve safe cost effective vehicle mass reduction in the 2020-25 timeframe. Most technologies included in PH 2 are in current volume production or will be fully

34
production ready by 2015. [OSU] No.
Are there any other areas outside of the direct scope of the analysis (e.g., vehicle performance, durability, drive ability, noise, vibration, and hardness) for which the mass-reduced vehicle design is likely to exhibit any compromise from the baseline vehicle?
[Joost] As discussed above, durability is a major factor in vehicle design and it is not addressed here. The use of advanced materials and joints calls into question the durability performance of a vehicle like this. NVH may also be unacceptable given the low density materials and extraordinary vehicle stiffness. [Richman] Most areas of vehicle performance other than crash performance were not addressed at all. Even basic bending stiffness and service loads (jacking, towing, 2-g bump, etc) were not addressed. The report claims to address bending stiffness and bending/torsional modal frequencies, but that analysis is not included in the report. [OSU] The proposed engine size is based on the assumption that decreasing the mass of the vehicle and holding the same power–to-weight ratio will keep the vehicle performances alike. This assumption is true only if the coefficient of drag (Cda) will also decrease (practically a perfect match in all the dynamic regards is not possible because the quadratic behavior of the air vs speed). The influence of the airdrag is typically higher than the general perception. In this particular case is very possible that more than half of the engine power will be used to overcome the airdrag at 65 mph. Therefore aerodynamic simulations are mandatory in order to validate the size of the engine.
ADDITIONAL COMMENTS: [Joost] Clallam county, WA is an interesting choice for the plant location (I grew up relatively nearby). Port Angeles is not a “major port” (total population <20,000 people) and access to the area from anywhere else in the state is inconvenient. [OSU] The Lotus design is very innovative and pushes the design envelope much further than other advanced car programs. The phase 1 report shows a great deal of topological innovation for the different components that are designed.

35
Please provide any comments not characterized in the tables above. [Joost] No comment. [Richman] State-of-the art in vehicle dynamic crash simulation can provide A/B comparisons and ranking of alternative designs, but cannot reliably produce accurate absolute results without careful correlation to crash results. CAE is effective in significantly reducing the need for hardware tests, making designs more robust, and giving guidance to select the most efficient and best performing design alternatives. OEM experience to date indicates CAE can reduce hardware and physical test requirements, but cannot eliminate the need for some level of crash load physical testing. Quasi-static test simulations show potential for eliminating most if not all hardware (FMVSS 216 etc.), simulations of FMVSS 208, 214, IIHS ODB and others still required several stages of hardware evaluation. Given the challenges of simulating the complex crash physics of a vehicle composed of advanced materials and fastening techniques, hardware testing would generally be considered necessarily to “validate” BIW structures for the foreseeable future. Editorial – [1] Report makes frequent reference to PH 1 vehicle LD and HD configurations. These references seem unnecessary and at times confusing. PH 1 study references do not enhance the findings or conclusions of the PH 2 study. Suggest eliminating reference to the PH 1 study. [2] Report would be clearer if content detail from PH 1 project that is part of PH 2 project (interior, closure, chassis content) is fully reported in PH 2 report. [3] Weight and Cost reduction references: Baseline shifts between Total Vehicle and Total Vehicle Less Powertrain. A consistent baseline may avoid confusion. Suggest using total vehicle as reference. [4] Cost increases statements: Report makes a number of cost references similar to:
Pg 4 - “The estimation of the BIW piece cost suggests an increase of 160 percent – over $700 – for the 37-percent mass-reduced body-in-white.”
The statement indicates the increase is 160%. The increase of $700 is an increase of 60% resulting in a total cost 160% of the baseline.
Site selection – [1] PH 2 project includes an extensive site selection study. Site selection is not related to product design. Including economics based on preferential site selection confuses the fundamental issue of the design exercise. Assumption of securing a comparable site and achieving the associated preferential labor rates and operating expenses are at best unlikely. Eliminating the site selection and associated cost would make the report more focused and cost projections more understandable and believable.
[2] Advantaged labor rates and possible renewable energy operating cost savings could be applied to any vehicle design. Entering those factors into the design study for the light weight redesign mixes design cost with site selection and construction issues.
[3] Site plan includes use of PV solar and wind turbines. Plant costs indicate general plant energy (lighting, support utilities, HVAC) (not processing energy) will be at “0” cost. True impact of renewable energy sources net of maintenance costs is at best controversial. Impact of general plant energy cost on

36
vehicle cost is minimal. The issue of renewable energy sources is valid but peripheral to the subject of vehicle design. It would be clearer to use conventional general plant energy overhead in cost analysis of the Phase II design cost.
Development experience – PH 2 vehicle design described is representative of a predevelopment design concept. All OEM production programs go through this development stage. Most vehicle programs experience some increase in mass and cost through the physical testing and durability development process. Those increases are typically driven by NVH or durability issues not detectable at the modeling stage. Mass dampers on the Venza front and rear suspension are examples of mass and cost increases. Vehicle mass increases of 2-3% through the development cycle are not unusual. It would be prudent to recognize some level of development related mass increase in the PH 2 mass projection. Vehicle content – Pg. 214 Bumpers: Need to check statement: “Current bumpers are generally constructed from steel extrusions, although some are aluminum and magnesium.” In North America 80% of all bumpers are rolled or stamped steel. Aluminum extrusions are currently 20% of the NA market. There are no extruded steel bumpers. There are no magnesium bumpers.
Technology – Majority of the design concepts utilized for PH 2 have been in reasonable volume automotive production for multiple years and on multiple vehicles. A few of the ideas represent a change in vehicle utility or are dependent on significant technology advancements that may not be achievable. Identifying the impact of currently proven technologies from speculative technologies may improve understanding of the overall study.
Specific speculative technologies:
[1] Eliminate spare tire, jack, tools (23 Kg) - feasible, may influence customer perception of utility [2] Eliminate carpeting - feasible, customer perception issue [3] Dual cast rotors (2 Kg) - have been tried, durability issues in volume production, differential expansion and bearing temperature issues may not be solvable [4] Wheels Ablation cast (22.4 Kg) - process has been run experimentally but has not been proven in volume. Benefit of process for wheel applications may not be achievable due to resultant metallurgical conditions of the as-cast surfaces. [OSU] No comment. [Simunovic] I would suggest that the organization of the document be reconsidered to add some information from the Phase 1 and more discussion about the design process. Especially interesting would be the guiding practical implementation of Lotus design steps as outlined at the beginning of the Phase 2 report.

37
Review of Lotus Engineering Study “Demonstrating the Safety and Crashworthiness of a 2020 Model-Year, Mass-Reduced Crossover Vehicle”
Srdjan Simunovic Oak Ridge National Laboratory [email protected] Summary This document provides expert opinions about the 2011 Lotus study titled “Demonstrating the Safety and Crashworthiness of a 2020 Model-Year, Mass-Reduced Crossover Vehicle” (Lotus Phase 2 Study). The Phase 2 Study used the High Development lightweight vehicle design from the previous study titled “An Assessment of Mass Reduction Opportunities for a 2017 – 2020 Model Year Vehicle Program” (Lotus Phase 1 Study), as the basis for the development of a new vehicle design that would meet the US Federal Motor Vehicle Safety Standards and the Insurance Institute for Highway Safety crash tests. The crashworthiness of the new design was evaluated using the computational modeling and simulations, only. This document reviews the methodologies, research findings, and conclusions from this study. In a nutshell, the Lotus Phase 2 crashworthiness study was performed in a consistent and professional manner, employing state-of-the-art computational modeling and simulation technology. Several design decisions, sub-model selections, discretization, material and failure assumptions have been identified for potential clarification and improvement. 1. Introduction This document provides expert review of the 2011 Lotus study “Demonstrating the Safety and Crashworthiness of a 2020 Model-Year, Mass-Reduced Crossover Vehicle“ [1]. The 2011 Lotus study builds on the previous 2010 Lotus project [2] that developed two lightweight conceptual designs of the existing vehicle, 2009 Toyota Venza. The first design, referred to as the “Low Development” vehicle, was based on the materials and technologies that were deemed feasible for 2017 production. Its estimated reduction in mass mass compared to the baseline production vehicle was 21%. The second version, named “High Development” vehicle, was designed based on the materials and technologies that are expected to be viable for mainstream production in 2020. Estimated weight savings for this vehicle were 38%. The study under review used the High Development concept as the basis for the development of a new engineering design that would be expected to pass crash tests specified by the US Federal Motor Vehicle Safety Standards and the Insurance Institute for Highway Safety. Compliance with the crash tests requirements was established using the computational models, only. This review offers opinions and suggestions about the methods and models used in computational simulations, and about the findings and conclusions derived from the simulations. The scope of the review is on the computational simulations of vehicle crashworthiness. The primary source of the review opinions was the Lotus Phase 2 report. Lotus Engineering, Inc. provided encrypted files for the crash models and crash configurations. Due to encryption, specifics of the material, failure, fracture, joining and structural sub-models employed in the models and simulations could not be evaluated. Later, Lotus Engineering Inc. also provided output files of simulation of FMVSS 208 front crash test into rigid barrier. This review is based on the above noted documents and files.
38
2. Methodology of the Review The review of the Lotus Phase 2 study was conducted in order to provide specific opinions on the following aspects of the study as charged by the EPA: (1) assumptions and data sources; (2) vehicle design methodological rigor; (3) vehicle crashworthiness testing methodological rigor; (4) vehicle manufacturing cost methodological rigor; (5) conclusion and findings; and (6) other comments. Each of the subjects is further split into sub-subjects as needed for an in-depth evaluation. As noted above, this review does not comment on item (4) as it is not in the field of expertise of the reviewer. The following sections follow the outline of the EPA charge questions.
3. Assumptions and Data Sources This section contains comments on validity of data sources, material modeling approaches, and joint models used in this study. The overall methodology used by the authors of the Phase 2 study is fundamentally solid and follows standard practices from the crashworthiness engineering. Several suggestions are offered that may enhance the outcome of the study.
Material Properties and Models Reduction of vehicle weight is commonly pursued by use of lightweight materials and advanced designs. Direct substitution of materials on a component level is possible only conceptually because of the other constraints stemming from the material properties, function of the component, its dimensions, packaging, etc. Therefore, one cannot decide on material substitutions solely on potential weight savings. In general, an overall re-design is required, as was demonstrated in the study under review. An overview of the recent lightweight material concept vehicle initiatives is given in reference [3].
The primary body material for the baseline vehicle, 2009 Toyota Venza, is mild steel. Except for about 8% of Dual Phase steel with 590 MPa designation, everything else is the material which has been used in automobiles for almost a century and for which extensive design experience and manufacturing technologies exist. On the other hand, the High Development vehicle concept employs novel lightweight materials, many of which are still under development, such as Mg alloys and fiber reinforced polymer matrix composites. These materials are yet to be used in large quantities in mass production automobiles. Their lack of market penetration is due not only to a higher manufacturing cost , but also due to an insufficient understanding, experience and characterization of their mechanical behavior. To compensate for these uncertainties, designers must use higher safety factors, which then often eliminate any potential weight savings. In computational modeling, these uncertainties are manifested by the lack of material performance data, inadequate constitutive models and a lack of validated models for the phenomena that was not of a concern when designing with the conventional materials. For example, mild steel components dissipate crash energy through formation of deep folds in which material can undergo strains over 100%. Both analytical [4] and computational methods [5] of the continuum mechanics are sufficiently developed to be able to deal with such configurations. On the other hand, Mg alloys, cannot sustain such large deformations and strain gradients and, therefore, require development of computational methods to model material degradation, fracturing, and failure in general.

39
The material data for the vehicle model is provided in section 4.4.2. of the Phase 2 report [1]. The stress-strain curves in the figures are most likely curves of effective plastic strain and flow stress for isotropic plasticity material constitutive models that use that form of data, such as the LS-DYNA [6] constitutive model number 24, named MAT_PIECEWISE_LINEAR_PLASTICITY. A list detailing the constitutive model formulation for each of the materials of structural significance in the study would help to clarify this issue. Also the design rationale for dimensioning and selection of materials for the main structural parts would help in understanding the design decisions made by the authors of the study. The included material data does not include strain rate sensitivity, so it is assumed that the strain rate effect was not considered. Strain rate sensitivity can be an important strengthening mechanism in metals. For hcp (hexagonal close-packed) materials, such as AM60, high strain rate may also lead to change in the underlying mechanism of deformation, damage evolution, failure criterion, etc. Data for strain rate tests can be found in the open source [7], although the properties can vary considerably with material processing and microstructure. The source of material data in the study was often attributed to private communications. Those should be included in the report, if possible, or in cases when the data is available from documented source, such as reference [8], referencing can be changed. Properties for aluminum and steel were taken from publicly available sources and private communications and are within accepted ranges.
Material Parameters and Model for Magnesium Alloy AM60 The mechanical response of Mg alloys involves anisotropy, anisotropic hardening, yield asymmetry, relatively low ductility, strain rate sensitivity, and significant degradation of effective properties due to the formation and growth of micro-defects under loading [9]. It has been shown, for example, that ductility of die-cast AM60 depends strongly on its microstructure [10], and, by extension, on the section thickness of the samples. In case when a vehicle component does not play a strong role in crash, its material model and parameters can be described with simple models, such as isotropic plasticity, with piecewise linear hardening curve. However, magnesium is extensively used accross the High Development vehicle design [2]. In Phase 1 report [2], magnesium is found in many components that are in the direct path of the frontal crash (e.g. NCAP test). Pages 40-42 of Phase 1 report [1] show magnesium as material for front-end module (FEM), shock towers, wheel housing, dash panel, toe board and front transition member. The front transition member seems to be the component that provides rear support for the front chassis rail. However, in Phase 2 report [1], pages 35-37, shock towers and this component were marked as made out of aluminum. A zoomed section of the Figure 4.2.3.d from the Phase 2 report [1] is shown in Figure 1. The presumed part identified as the front transition member is marked with an arrow.

40
Figure 1. Material assignments in the front end.
These assignments were not possible to confirm from the crash model since the input files were encrypted. In any case, since Mg AM60 alloy is used in such important role for the frontal crash, a more detailed material model than the one implied by the graph on page 32 of Phase 2 report [1] would be warranted. More accurate failure model is needed, as well. The failure criteria in LS-DYNA [6] are mostly limited to threshold values of equivalent strains and/or stresses. However, combination of damage model with plasticity and damage-initiated failure would probably yield a better accuracy for AM60.
Material Models for Composites Understanding of mechanical properties for material denoted as Nylon_45_2a (reference [1] page 33) would be much more improved if the constituents and fiber arrangement were described in more detail. Numbers 45 and 2 may be indicating +/- 450 fiber arrangement, however, a short addition of material configuration would eliminate unnecessary speculation. An ideal plasticity model of 60% limit strain for this material seems to be overly optimistic. Other composite models available in LS-DYNA may be a much better option.
Joint Models Welded joints are modeled by variation of properties in the Heat Affected Zone (HAZ) and threshold force for cutoff strength. HAZs are relatively easy to identify in the model because their IDs are in 1,000,000 range as specified on page 21 of the report [1]. An example of the approach is shown in Figure 2, where the arrows mark HAZs.

41
Figure 2. Joint between the front-end module and the crush rail.
This particular connection contains welds (for joining aluminum parts) and bolts (for joining aluminum and magnesium). HAZ properties were not given in the report and they could not be checked in the model due to encryption. The bolt model properties were described that it fails at 130 MPa (page 38 of the report [1]), which corresponds to the yield stress of AM60. The importance of these joints cannot be overstated. They enforce stability of the axial deformation mode in the rails that in turn enables dissipation of the impact energy. The crash sequence of the connection between the front end module and the front rail is shown in Figure 3.
Figure 3. Crush of the front rail and front end module connection.
The cracks in the front end module (Figure 3.2) and the separation between the front end module and the front rail (Figure 3.3) are clearly visible. This zone experiences very large permanent deformations, as shown in Figure 4.

42
Figure 4. Plastic deformation distribution in the front end joint. Colors denote magnitude of the equivalent plastic strain.
It is not clear from the simulations which failure criterion dominates the process. Is it the failure of the HAZ or is it the spot weld limit force or stress. Given the importance of this joint on the overall crash response, additional information about the joint sub-models would be very beneficial to a reader. 4. Vehicle Design Methodological Rigor The Phase 2 design study of the High Development vehicle considered large number of crash scenarios from the FMVSS and IIHS tests. The simulations show reasonable results and deformations. Energy measures show that models are stable and have no sudden spikes that would lead to instabilities. The discretization of the sheet material is primarily done by proportionate quadrilateral shell elements, with relatively few triangular elements. The mesh density is relatively uniform without large variations in element sizes and aspect ratios. However, in my opinion, there are two issues that need to be addressed. One is the modeling of material failure/fracture and the other is the design of the crush zone with respect to the overall stopping distance. While the former may be a part of proprietary technology, the latter issue should be added to the description in order to better understand the design at hand.
Material Failure Models and Criteria One of the modeling aspects that is usually not considered in conventional designs is modeling of material fracture/failure. In the Phase 2 report [1] material failure is indicated only in AM60 although it may be reasonably expected in other materials in the model. Modeling of material failure in continuum mechanics is a fairly complex undertaking. In the current Lotus High Development model, material failure and fracture are apparently modeled by element deletion. In this approach, when a finite element reaches some failure criteria, the element is removed from simulations, which then allows for creation of free surfaces and volumes in the structure. This approach is notoriously mesh-dependent. It implies that the characteristic dimension for the material strain localization is of the size of the finite element where localization and failure happen to occur. Addition of the strain rate sensitivity to a material model can both improve fidelity of the material model, and as an added benefit, it can also help to regularize the response during strain localization. Depending on the amount of stored internal energy
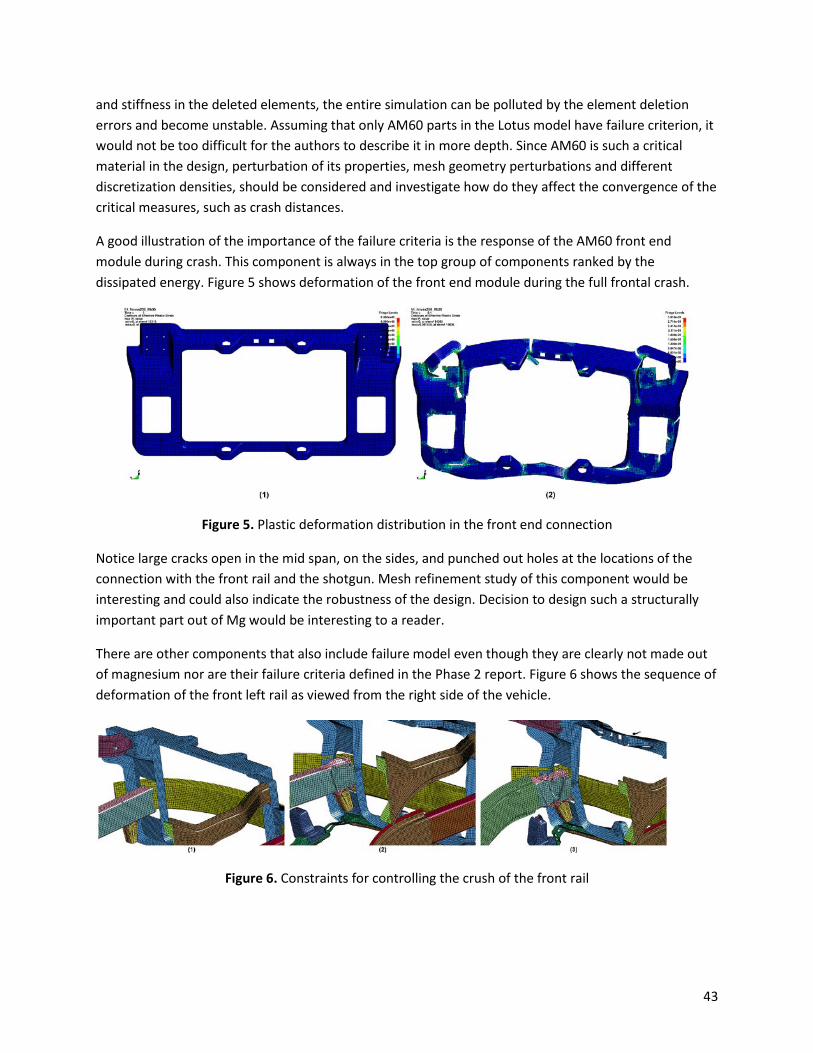
43
and stiffness in the deleted elements, the entire simulation can be polluted by the element deletion errors and become unstable. Assuming that only AM60 parts in the Lotus model have failure criterion, it would not be too difficult for the authors to describe it in more depth. Since AM60 is such a critical material in the design, perturbation of its properties, mesh geometry perturbations and different discretization densities, should be considered and investigate how do they affect the convergence of the critical measures, such as crash distances.
A good illustration of the importance of the failure criteria is the response of the AM60 front end module during crash. This component is always in the top group of components ranked by the dissipated energy. Figure 5 shows deformation of the front end module during the full frontal crash.
Figure 5. Plastic deformation distribution in the front end connection
Notice large cracks open in the mid span, on the sides, and punched out holes at the locations of the connection with the front rail and the shotgun. Mesh refinement study of this component would be interesting and could also indicate the robustness of the design. Decision to design such a structurally important part out of Mg would be interesting to a reader.
There are other components that also include failure model even though they are clearly not made out of magnesium nor are their failure criteria defined in the Phase 2 report. Figure 6 shows the sequence of deformation of the front left rail as viewed from the right side of the vehicle.
Figure 6. Constraints for controlling the crush of the front rail

44
The axial crash of the front rails is ensured by their connection to the front end, rear S-shaped support and to the connections to the sub-frame. Figure 7 shows the detail of the connectors between the left crush rail to the subframe.
Figure 7. Connections between the front rail and the subframe
Tearing of the top of the support (blue) can be clearly observed in Figure 8. The importance of this connection for the overall response may warrant parametric studies for failure parameters and mesh discretization.
Crash Performance of the High Development Vehicle Design From the safety perspective, the most challenging crash scenario is the full profile frontal crash into a flat rigid barrier. The output files for the NCAP 35 mph test were provided by Lotus Engineering and used for evaluation of the vehicle design methodological rigor.
The two accelerometer traces from the simulation at the lower B-pillar locations are shown in Figure 8. When compared with NHTSA test 6601, the simulation accelerometer and displacement traces indicate much shorter crush length than the baseline vehicle.

45
Figure 8. Accelerometers at the bases of B-pillars
When compared vehicle deformations before and after the crush, it becomes obvious where the deformation occurs. Figure 9 shows the deformation of the front rail members.
Figure 9. Top view of the crash deformation during NCAP test
It can be seen that almost all deformation occurs in the space spanned by the front frame rails. As marked in Figure 1, the front transition member (or a differently named component in case my material assignment assumption was not correct), supports the front rail so that it axially crushed and dissipated as much energy, as possible. For that purpose, this front rail rear support was made extremely stiff and it does not appreciably deform during the crash (Figure 10). It has internal reinforcing structure that has

46
not been described in the report. These reinforcements enables it to reduce bending and axial deformations in order to provide steady support for the axial crush of the aluminum rail tube.
Figure 10. Configuration of the front rail support
This design decision reduces the possible crush zone and stopping distance to the distance between the front of the bumper and the front of the rail support (Figure 9). The effective crash length can be clearly seen in Figure 11.
Figure 11. Crush zone for NCAP test
We can see from the above figure that the front rail supports undergo minimal displacements and that all the impact energy must be dissipated in a very short span. Figure 12 shows the points of interest to

47
determine the boundary of the crush zone, and an assumption that crash energy dissipation occurs ahead of the front support for the lower rail
Figure 12. Points of interest for determining crush zone
Figure 13 gives the history of the axial displacements for the two points above. At their maximum points, the relative reduction of their distance from the starting condition is 0.7 inches.
Figure 13. X displacements of the base of B-pillar (A) and front of the support rail (B) for the NCAP test

48
Since the distance between the front of the rail support and the rocker remains practically unchanged during the test, we can reasonably assume that majority of the crash energy is dissipated in less than 22 inches. To quickly evaluate the feasibility of the proposed design, we can use the concept of the Equivalent Square Wave (ESW) [11]. ESW assumes constant, rectangular, impact pulse for the entire length of the stopping distance (in our case equal to 22 in) from initial velocity (35 mph). ESW represents an equivalent constant rectangular shaped pulse to an arbitrary input pulse. In our case ESW is about 22g. Sled tests and occupant model simulations indicate that crash pulses exceeding ESW of 20 g will have difficulties to satisfy FMVSS 208 crash dummy performance criteria [11]. For a flat front barrier crash of 35 mph and an ESW of 20 g, the minimum stopping distance is 24 in. Advanced restraint systems and early trigger airbags may need to be used in order to satisfy the injury criteria and provide sufficient ride down time for the vehicle occupants.
The authors of the study do not elaborate on the safety indicators. I firmly believe that such a discussion would be very informative and valuable to a wide audience. On several places, the authors state values for average accelerations up to 30 ms from the impact, and average accelerations after 30 ms. When stated without a context, these numbers do not help the readers who are not versed in the concepts of crashworthiness. The authors most likely refer to the effectiveness time of the restraint systems. An overview of the concepts followed by a discussion of the occupant safety calculations for this particular design would be very valuable. 5. Vehicle Crashworthiness Testing Methodological Rigor The documented results in the study show that authors have employed current state-of-the-art for crashworthiness modeling and followed systematic technical procedures. This methodology led them through a sequence of model versions and continuous improvement of the fidelity of the models. I would suggest that a short summary be added describing the major changes of the Phase 2 design with respect to the original High Development vehicle body design.
The authors had several crash tests of the baseline vehicle, 2009 Toyota Venza, to use for comparison and trends. Tests 6601 and 6602 were conducted in 2009 so that they could be readily used for the development. The data from test 6601 was used in the Phase 2 report for comparison. Test 6602 was not used for comparison in the report. While the report abounds with crash simulations and graphs documenting tremendous amount of work that authors have done, it would have been very valuable to add comparison with the 6602 test even at the expense of some graphs. Page 72 of the Phase 2 report starts with comparison of the simulations with the tests and that is one of the most engaging parts of the document. I suggest that it warrants a section in itself. It is currently located out of place, in between the simulation results and it needs to be emphasized more. This new section would also be a good place for discussion on occupant safety modeling and general formulas for the subject.
One of the intriguing differences between the simulations and baseline vehicle crash test is the amount and the type of deformation in the frontal crash. As noted previously, computational model is very stiff with very limited crush zone. Viewed from the left side (Figure 14), and from below (Figure 15), we can see that the majority of the deformation is in the frame rail, and that the subframe’s rear supports do

49
not fail. The strong rear support to the frame rail, does not appreciably deform, and thereby establishes the limit to the crash deformation.
Figure 14. Crush zone of the front structure during the NCAP test.
Figure 15. Crush zone of the front structure during the NCAP test viewed from below. Note that the rear subframe connection does not fail.
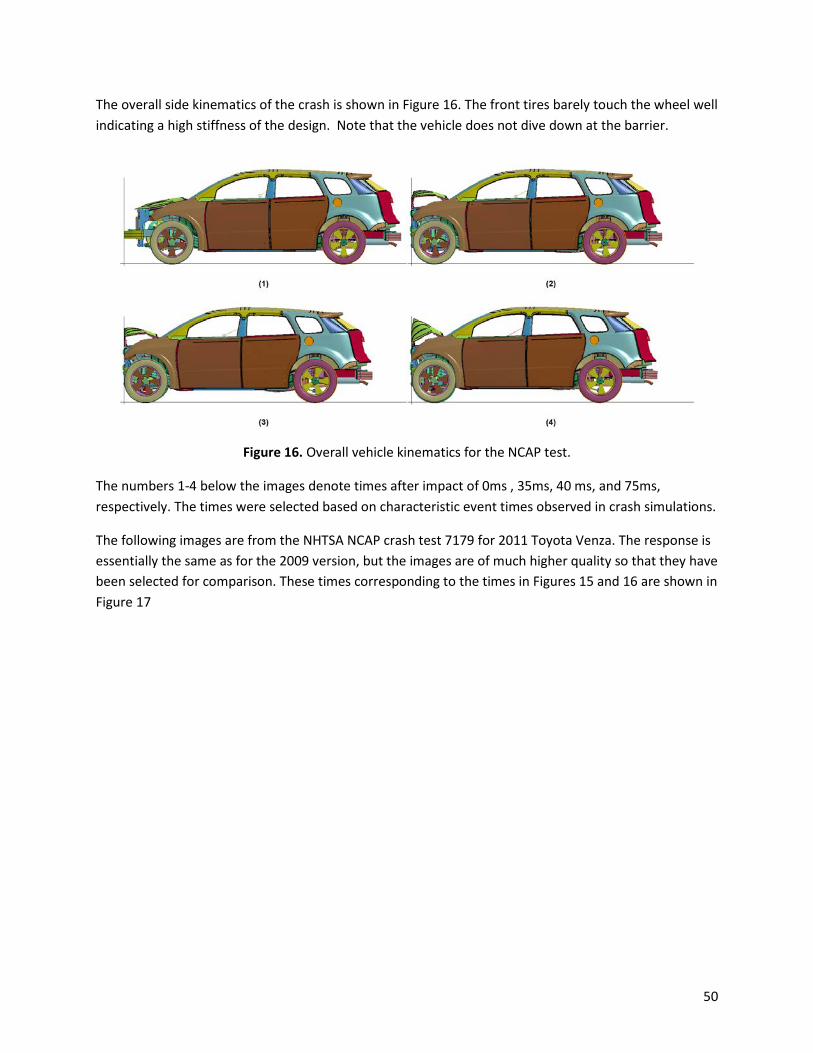
50
The overall side kinematics of the crash is shown in Figure 16. The front tires barely touch the wheel well indicating a high stiffness of the design. Note that the vehicle does not dive down at the barrier.
Figure 16. Overall vehicle kinematics for the NCAP test.
The numbers 1-4 below the images denote times after impact of 0ms , 35ms, 40 ms, and 75ms, respectively. The times were selected based on characteristic event times observed in crash simulations.
The following images are from the NHTSA NCAP crash test 7179 for 2011 Toyota Venza. The response is essentially the same as for the 2009 version, but the images are of much higher quality so that they have been selected for comparison. These times corresponding to the times in Figures 15 and 16 are shown in Figure 17

51
Figure 17. Vehicle subframe deformation for NCAP test
The subframe starts to rapidly break off of the vehicle floor around 40 ms, and therefore allows for additional deformation. In Lotus vehicle this connection remains intact so that it cannot contribute to additional crash length. The left side view of the test vehicle during crash at the same times is shown in Figure 18.

52
Figure 18. Vehicle side kinematics during NCAP test
There is an obvious difference between the simulations and the tests. The developed lightweight model and the baseline vehicle do represent two different types of that share general dimensions, so that the differences in the responses can be large. However, diving down during impact is so common across the passenger vehicles so that different kinematics automatically raises questions about the accuracy of the suspension system and the mass distribution. If such kinematic outcome was a design objective, than it can be stated in the tests. 6. Other Comments I would suggest that the organization of the document be reconsidered to add some information from the Phase 1 and more discussion about the design process. Especially interesting would be the guiding practical implementation of Lotus design steps as outlined at the beginning of the Phase 2 report. 7. Conclusions Lotus Phase 2 crashworthiness study has been reviewed based on the charge questions by the US EPA. It has been found that the study followed all the relevant technical guidelines and state-of-the-art practices for computational crash simulation and design. Several areas of improvement were suggested that pertain to material modeling, structural design and organization of the report.

53
References
1. Demonstrating the Safety and Crashworthiness of a 2020 Model-Year, Mass-Reduced Crossover Vehicle, Lotus Engineering Inc., Draft Report, (2011).
2. An Assessment of Mass Reduction Opportunities for a 2017-2020 Model Year Vehicle Program,
Lotus Engineering Inc., Rev 006A, (2010).
3. Lutsey, Nicholas P., "Review of Technical Literature and Trends Related to Automobile Mass-Reduction Technology." Institute of Transportation Studies, University of California, Davis, Research Report UCD-ITS-RR-10-10 (2010).
4. Jones, Norman, "Structural Impact", Cambridge University Press (1997).
5. Ted Belytschko, T., Liu, W.-K., Moran, B., "Nonlinear Finite Elements for Continua and
Structures", Wiley (2000).
6. "LS-DYNA Keyword User's Manual", Livermore Software Technology Corporation (LSTC), version 971, (2010).
7. http://thyme.ornl.gov/Mg_new
8. "Atlas of Stress-Strain Curves", 2nd Ed., ASM International (2002).
9. Nyberg EA, AA Luo, K Sadayappan, and W Shi, "Magnesium for Future Autos." Advanced
Materials & Processes 166(10):35-37 (2008).
10. Chadha, G; Allison, JE; Jones, JW, "The role of microstructure and porosity in ductility of die cast AM50 and AM60 magnesium alloys," Magnesium Technology 2004, pp. 181-186 (2004).
"Vehicle crashworthiness and occupant protection", American Iron and Steel Institute, Priya, Prasad and Belwafa, Jamel E., Eds. (2004).
54
4. References Lotus Engineering. Demonstrating the Safety and Crashworthiness of a 2020 Model-Year, Mass-Reduced Crossover Vehicle. 2012.

55
Appendix A: Resumes of Peer Reviewers
William Joost 3300 East West Hwy Apt 534 [email protected] Mobile: (202) 674-8900 Hyattsville, MD 20782 Education:
Working toward Ph.D. Materials Science and Engineering Est. May 2014 University of Maryland, College Park, MD. M.S. Materials Science and Engineering May 2009 Arizona State University, Tempe, AZ. B.S. Materials Engineering May 2005 Rensselaer Polytechnic Institute (RPI), Troy, NY.
Employment Experience:
General Engineer Jan. 2010-Present U.S. Department of Energy, Washington, DC
- Serves as the Technology Area Development Manager for the Lightweight Materials portfolio in the Vehicle Technologies Program (VTP). Supports research on improving properties, manufacturability & joining, and modeling & simulation of advanced steels, aluminum alloys, and magnesium alloys for automotive applications.
- Directs a budget of ~$10M per year supporting research in structural metals for conventional and electric drive vehicles. Manages projects that involve teams from diverse disciplines including materials science, mechanical engineering, computer science, and physics. Supports interaction between participants from industry, national laboratories, and academia.
- Develops solicitation topics, coordinates proposal reviews, and manages project performance. Participates in the formulation, justification, tracking, and execution of the Lightweight Materials budget. Manages publication of Annual Report for the Lightweight Materials sub-program. Coordinates activities in metals with the Office of Advanced Manufacturing, U.S Department of Energy.
- Led the light-duty vehicles portion of the 2011 VTP Advanced Materials Workshop. Used the industry-supported results to develop new program goals, establish weight reduction targets for vehicle systems, and draft road mapping priorities.
Manufacturing Engineer/Equipment Engineering Supervisor Apr. 2008-Dec. 2009 Heraeus Materials Technology LLC, Chandler, AZ
- Managed the Equipment Engineering Team, responsible for maintaining functionality, capability, and uptime of ~180 pieces of capital equipment including high power, high vacuum, and precision machining tools.
- Created a high yielding process technique for Pt-containing alloys, saving more than $500,000 per year in refining costs
- Developed vacuum induction melting (VIM) and hot rolling processing techniques for specialty Co, Ni, and Fe based alloys and intermetallic materials
- Introduced a scrap metal recycling process for machining chips of Co and Pt based alloys, reducing scrap costs by more than $40,000 per month
Process Engineer/Manufacturing Engineering Production Supervisor Oct. 2005-Apr. 2008 Heraeus Materials Technology LLC, Chandler, AZ
- Managed a 16-person rolling team across four shifts - Developed a stress/strain model of the hot rolling process which included equipment behavior and
material characteristics - Modeled material properties as a function of alloy and ingot dimensions to automate roll schedule creation - Applied Design of Experiments methodology in melting and hot rolling processes to identify significant
process factors and improve yields on high value sputtering targets

56
Research Experience: Graduate Researcher in Ph.D. program, Materials Science and Engineering Aug. 2010 - Present University of Maryland, College Park, MD
- Exploring the microstructural-scale deformation behavior of Ti alloys using computational materials science techniques
- Developing finite element models (ANSYS) of Ti microstructures and determining the impact of grain interaction stresses on the deformation mechanisms during creep
Graduate Researcher in M.S. program, Materials Science and Engineering Jan. 2007-May 2009 Arizona State University, Tempe, AZ
- Determined sputtering recipes for optimal deposition of textured Ru films in perpendicular magnetic recording media
- Characterized the effects of CoCrX alloy seed layers for Ru in perpendicular magnetic recording media by X-ray diffraction, Rutherford backscattering, atomic force microscopy, and transmission electron microscopy
- Demonstrated improved coherency at the interface of Ru films deposited on CoCrV seed layers by calculation of Ru film strain energy
Publications and Presentations
1) Joost, W., Das, A., Alford, T.L. "Effects of varying CoCrV seed layer deposition pressure on Ru crystallinity in perpendicular magnetic recording media" Journal of Applied Physics, 106, 073517 (2009). 2) Joost, W. “Lightweight Materials for Vehicles: Needs, Goals, and Future Technologies.” Invited presentation at the 47th Sagamore Army Materials Research Conference on Advanced Lightweight Metals Technology, St. Michaels, MD, 06/17/2010. 3) Joost, W. “Lightweight Materials for Vehicles: Needs, Goals, and Future Technologies.” Invited keynote presentation at the 3rd Annual Advanced Lightweight Materials for Vehicles conference, Detroit, MI, 8/11/2010. 4) Joost, W. “Materials Development for Vehicle Weight Reduction and the Impacts on Energy Efficiency.” Invited keynote presentation at the Materials Science and Technology (MS&T) 2011 conference, Columbus, OH, 10/18/2011.
57
Codrin-Gruie (CG) Cantemir Research Scientist Ohio State University Center for Automotive Research http://car.osu.edu [email protected]
Codrin-Gruie Cantemir is a Research Scientist with Ohio State University and he is the Center for Automotive Research Chief Designer. He received his Diplomat Engineer degree in 1989 (Electromechanics) and his Ph.D. in 1997 (Electric Drives), both from “Gh. Asachi” Technical University of Iasi in Romania. He has been with OSU-CAR since 2001 and he is responsible for research / design programs in hybrid-electric vehicles, drivetrains, heavy-duty vehicle and vehicle concept designs. Dr. Cantemir has a concept design portfolio of 12 conventional vehicles, 4 military vehicles, 2 aircrafts, 2 high-speed trains, 4 heat engines and 2 marine jet propulsion systems He also holds 18 patents and authored 2 books and 40+ technical papers. Dr. Cantemir’s special research interests are related to creative methods applied to advanced vehicle concepts and influence of new technologies in vehicle architecture and styling. He has also professional interests and is active in: Aerodynamics - Fundamental and applied works based on CFD modeling and testing. Bluff and non-laminar bodies. Application of Coanda and Miller effects. Forward Swept Wings aerodynamics. Small Reynolds number effects and applications Batteries Architecture, packaging, advanced active/passive safety features, cooling, drop an go systems, fuses, on board integration of the battery charger and BMS Cooling - Advanced cooling system architecture, design, modeling and simulation. Cooling systems for heavy duty electric drives and fuel cells (low ∆T). Unconventional cooling systems for armored vehicles (very small air in/out ports) Design- Development and application of creative methods for vehicle concept generation. Design space exploration and trend assessing procedures development. Engines – New thermodynamic cycles and mechanisms for implementation, “cycles on demand” solutions, free piston compound engines, turbo/super-charging and turbomachinery (including electronic management). Thermo-jet applications in marine and aviation propulsion Electric Drives - Fundamental research and applied design of high performance electric machines and power electronics. Development of new electric drives principles and applied technologies. High power drives Powertrain and Transmission - Conventional and hybrid electric powertrain design, modeling and simulation. Advance multi-role EVT and CVAWD (continuously variable all wheel drive) system concepts and development. Drive lines and high-torque CV joints Suspension - Advance independent suspension concepts for the trucking industry, design modeling and simulation. Novel architecture (multi stage) suspensions for high performance high

58
speed off road vehicles. New suspension mechanism and dynamics for multimode active/semi active suspensions. Structures - Steel based honeycomb type structures and afferent technologies. New high energy absorption principles and related structures.

59
GLENN S. DAEHN
Department of Materials Science and Engineering The Ohio State University
2041 College Road, Columbus, OH 43210 P: 614/292-6779, E: [email protected], W: osu.edu/mse/~daehn
EDUCATION:
STANFORD UNIVERSITY Palo Alto, CA Ph.D., Materials Science & Engineering, 1988.
STANFORD UNIVERSITY Palo Alto, CA M.S., Materials Science & Engineering, 1985.
NORTHWESTERN UNIVERSITY Evanston, Illinois
B.S. (departmental honors), Materials Science & Engineering, 1983. Received Gotaas Award for outstanding undergraduate research. EXPERIENCE: 11/87-pres Professor (1996-pres), Assoc, Asst. OHIO STATE UNIVERSITY, Columbus, OH
Teaching and research focus on mechanical behavior and processing of structural materials. High velocity sheet metal forming and mechanical behavior of composites are focus areas.
7/04-10/07 V. P. Technology EXCERA MATERIALS GROUP Worthington, OH Co-founder (1993) developer/manufacturer ceramic composites by reactive processing.
Sabbatical in 04-05 academic year. OSU-based, technology now commercialized by Fireline, Inc. & Rex Materials Group.
1/97-7/97 Visiting Scientist, ROCKWELL SCIENCE CENTER, Thousand Oaks, CA
Sabbatical period; engaged in manufacturing and materials performance issues. 9/83-11/87 Research Assistant, STANFORD UNIVERSITY, Palo Alto, CA
Dissertation under Oleg D. Sherby: laminated composites of superplastic ultrahigh carbon steel and stainless steel.
SELECT PROFESSIONAL AWARDS & ACTIVITIES: 2010 – pres Executive Director; Honda-Ohio State Partnership
2010 Named Fellow ASM International
2010 - Member, Board of Trustees, ASM Materials Education Foundation.
2010- Chair, International Impulse Forming Group
2009 - pres Director, Ohio Manufacturing Institute – New organization focused on linking industry and Ohio’s research assets
2009 Innovators Award of Ohio State College of Engineering
2008- Founding Vice-Chair, International Impulse Forming Group
2007 ASM Jacquet-Lucas Award for Excellence in Metallography.

60
2002-3 Served on National Research Council Committee on “Use of Lightweight Materials in 21st Century Army Trucks”
1996 One of 13 invited speakers at second National Academy of Engineering Frontiers of Engineering Meeting
1995-1997 Chair, TMS Shaping and Forming Committee
1995 Named Mars G. Fontana Professor of Metallurgical Engineering.
1992 National Young Investigator of National Science Foundation.
1992 Army Research Office Young Investigator Award.
1992&’00, 04 Lumley Research Award of Ohio State University College of Engineering.
1992 Robert Lansing Hardy Gold Medal of TMS, recognizing outstanding promise in the broad field of metallurgy.
1990 ASM Marcus A. Grossmann Young Author Award, for "Deformation of Whisker-Reinforced MMC's Under Changing Temperature Conditions".
SELECTED RECENT PUBLICATIONS “Creep Behavior and Deformation Mechanisms for Nanocluster-Strengthened Ferritic Steels”, M. C. Brandes, L. Kovarik, M. Miller, G. S. Daehn and M. J. Mills, in press: Acta Materialia (2011). “Predictive Mechanism for Anisotropy Development in the Earth’s Inner Core”, D. M. Reaman, G. S. Daehn and W. R. Panero, accepted in Earth Planetary Science Letters (2011). “Dislocation Mediated Time-Dependent Deformation in Crystalline Solids”, M. J. Mills and G. S. Daehn, Chapter in: Computational Methods for Microstructure-Property Relationships, S. Ghosh and D. M. Dimiduk, editors, Springer Science, 311-363 (2011). “Energy Field Methods and Electromagnetic Metal Forming”, G. S. Daehn, Chapter 18 in: Intelligent Energy Field Methods and Interdisciplinary Process Innovations, Wenwu Zhang, Editor, CRC Press, 2011, pp. 471-504. “Production of Low-Volume Aviation Components Using Disposable Electromagnetic Actuators” Steven Woodward, Christian Weddeling, Glenn Daehn, Verena Psyk, Bill Carson, A. Erman Tekkaya, Journal of Materials Processing Technology, 211, Iss. 5, pp. 886-895, (2011). “Electromagnetic Impulse Calibration of High Strength Sheet Metal Structures”, E. Iriondo, M. A. Gutiérrez, B. González, J. L. Alcaraz and G. S. Daehn, Journal of Materials Processing Technology, 211, Iss. 5, pp. 909-915, (2011). “Simulation and Instrumentation of Electromagnetic Compression of Steel Tubes”, A. Vivek, K-H Kim, and G. S. Daehn, Journal of Materials Processing Technology, 211, Iss. 5, pp. 840-850, (2011). Selected Patents and Applications “Low Temperature Spot Impact Welding Driven Without Contact”, Glenn D. Daehn and John C. Lippold. US Patent 8084710, Issued December 27, 2011. “Electromagnetic Actuator for Multiple Operations”, Glenn S. Daehn, PCT Applicaton: PCT/US08/61066, Filed 4/19/08. “Driver Plate for Electromagnetic Forming of Sheet Metal”, John R. Bradley and Glenn S. Daehn, US Patent Application 2009/0090162, Published 4/9/09.

61
“Electromagnetic Metal Forming” (Uniform Pressure Actuator), G. S. Daehn, U. S. Patent, 2,069,756, Issued 7/4/06. “Electromagetic Formation of Fuel Cell Plates” John, R. Bradley, James G. Schroth and Glenn S. Daehn, U.S. Patent 7,076.981, Issued 7/18/2006. “High Velocity Forming of Local Features Using a Projectile”, G. S. Daehn, U. S. Patent 7,000,300, Issued 2/21/06. “5000 series alloys with improved corrosion properties and methods for their manufacture and use”, M. C. Carroll, M. J. Mills, R. G. Buchheit, G. S. Daehn, B. Morere, P. Kobe, and H. S. Goodrich, US Patent Application 10/628579, published 5/13/04. Courses Developed and Recently Taught: Developed: Engineering 198a / “Engineering, Manufacturing and the Creation of Wealth” Developed: MSE 605: Quantitative Introduction to Materials Science and Engineering MSE 581.02: Materials Science Lab II (Junior Level) MSE 765: Mechanical Behavior of Materials MSE 863: Time Dependent Deformation of Solids MSE 561 Mechanical Behavior of Materials

62
David Emerling 1896 Cass Lake Front Rd (248) 877- 4718 Keego Harbor, MI 48320 [email protected]
ENGINEERING EXECUTIVE
Highly motivated and innovative Engineering Executive with a strong technical background. Excellent communicator with the ability to sell technical products to a customer. Six Sigma Green Belt certification. Demonstrated achievements in:
Expanding Sales Promoting innovative Product Solutions
Creating and leading Advanced Engineering and Program Teams
Developing and implementing Program Management Systems
Implementing Technical Shows and Exhibits Directing technical teams Working within Asian cultural differences Patenting new products
PROFESSIONAL EXPERIENCE
The Ohio State University (OSU), Columbus, OH 2008- Present Industrial Collaborations Director Executing a broad strategy targeted at attracting industrial funding for OSU in the form of consortium membership fees, gifts, student scholarships, fellowships, and research programs.
Microheat Incorporated (bankrupt), Farmington Hills, Michigan 2008 Program Director Responsible for all Microheat programs launching for Ford Motor Company. This includes responsibility for the programs over all timing, cost, open issues, tooling, testing, customer interface, ordering of parts, PPAP, and over all program success. Ford was a critical customer of Microheat’s expansion which would have led to $20 million dollars in sales. Lear Corporation, Southfield, Michigan 1988-2007 Director of Corporate Development-International Automotive Components – Lear JV (2007) Responsible for internal/external communications, including media relations and development of IACNA’s website; corporate identity Assigned as Member, Employee Involvement Team and Corporate Community Service Committee Director of Advanced Sales/Technical Support – Lear Asian OEM Division (1999-2007) Directed the advanced sales activity for the Asian OEMs, including Nissan, Toyota, Hyundai and Honda. Responsible for implementing private technology shows at the OEM plus creating a Lear technology booth at the Tokyo Motor Show, Japan SAE and the MEMA/JAMA Conference. Asian OEM representative to Corporate Patent Council Increased sales with Asian OEMs from $10M in 2002 to $175M in 2007. Invented and patented a MediaConsole, sold it to Nissan, designed and produced it adding $500K in sales. Provided technical support to the advanced sales team which was awarded over 50 patents and increased sales over
$36M annually. Hosted Japanese, Chinese, Korean and Indian delegations to Lear US Created an advanced engineering team which developed new products for sale to Asian OEMs Created a global company presentation database which saved over $1M per year and provided standardized presentations
quickly to the sales team. Speaker at Detroit Chinese Business Association convention Corporate champion for implementation of Chinese Certification Director of Advanced Engineering – Lear Donnelly – Lear JV (1989–1999) Created, hired and led a new team of advanced engineers to support the product development for the new joint venture. This team included interior, electrical/electronic engineers and process engineering.

63
Hired a team and created the systems to track new technology development resulting in sales increases. Invented and patented an overhead audio system trademarked as OASys Provided technical support to the sales team both internally and with customers.
Manager of Advanced Engineering – Interior Trim (Lear Technology Division) (1995–1998) Developed advanced technology and products, including door trim, door modules, visors, hard trim, liftgate modules, headliners and safety countermeasures Received Lear’s President’s Award for Outstanding Technological Innovation and Achievement
Design and Engineering Manager – Automotive Industries – Lear Acquisition (1993–1995) Responsible for 1997 Ford Winstar quarter panels and pillars, 1997 Ford Explorer quarter panels, pillars, scuffs and interior trim, and 1998 Ford F150/F250 entire interior of three cab configurations. Managed 10 engineers and 55 designers Oversaw design/engineering of components, program timing, progress tracking, engineering disciplines, tooling,
manpower, and design/engineering budget and profitability Advanced development of door products and manufacturing processes which kept the company portfolio on the cutting
edge of technologies and products. Team leader for development of a complete patented door module which is in production. Published technical paper on door modules by the Society of Automotive Engineers (SAE) Program Manager-Fibercraft//Descon – Lear Acquisition (1988–1995) 1993 Firebird/Camaro car total interior, HVAC, electrical and audio, exterior mirrors; 1995 Century IP, electrical and HVAC Assured program profitability, timing, progress tracking, invoicing of deliverables and sales related to design,
illustration, dimensional management and engineering clays Oversaw die model build, design for assembly, assembly process, quality assurance fixtures and mockup General Motors, Warren, Michigan 1981–1988 System Engineer – Firebird/Camaro Electrical Plant Resident Engineer Manager - Master Parts List Project Engineering Change Authorization Task force Senior Product Engineer – Interior and Electrical Test and Development Engineer
PATENTS
#7,050,593 Vehicular Audio System and Electromagnetic Transducer Assembly May 2006 #6,719,343 Vehicle Console Assembly (production 2002 – 2007) Apr 2004 #6,546,674 Vehicle Door Assembly with a Trim Panel forming a Structural Door Module Component Carrier (production 2006 to current) Apr 2003 #6,409,210 Integrated Side Air Curtain and Inflator Overhead System Jun 2002 #6,019,418 Modular Vehicle Liftgate Module Feb 2000 #6,125,030 Vehicle Overhead Console with Flip Down Navigation Unit Sep 2000 #5,904,002 Motor Vehicle Door Module May 1999

64
EDUCATION AND TRAINING
Bachelor of Science Degree, Mechanical Engineering Ohio State University, Columbus, OH
Dale Carnegie Course Taguchi Designed Experiments Six Sigma Green Belt Certified Karrass Effective Negotiating
PROFESSIONAL AFFILIATIONS
Society of Automotive Engineering – Detroit Chapter (30 years) Ohio State Alumni Club of Detroit – current/past president, treasurer and board member Ohio State Engineering CAR Consortium – advisory board member

65
Kristina Kennedy 7263 Fitzwilliam Drive ◊ Dublin, Ohio 43017 ◊ 614-395-3568 ◊ [email protected]
_____________________________________________________________________________________ EDUCATION THE OHIO STATE UNIVERSITY Columbus, OH Master of Business Administration August 2008 UNIVERSITY OF IOWA Iowa City, IA Bachelor of Science, Mechanical Engineering December 2000 _____________________________________________________________________________________ EXPERIENCE THE OHIO STATE UNIVERSITY Columbus, OH Business Development Manager, Ohio Manufacturing Institute Aug. 2010 - Present
• Coordinate collaborative R&D opportunities, including tracking possible opportunities, assembling multi-disciplinary teams, and assisting with proposal development in order to develop and improve the operation, visibility and effectiveness of OMI
• Successfully secured $100K+ seed funding and developed related procedures and documentation in order to launch Co-Located Internship Program in March 2011 to deploy OSU students to industry partners as technology transfer mechanisms within commercially-expected time-scales.
• Efficiently manage inquiries of potential customers of research and development services; develop and sustain customer satisfaction through new survey mechanism
GREIF Delaware, OH
Regional Marketing Manager (Midwest) Nov. 2008 – Oct. 2009 • Effectively managed cross functional engineering / marketing new product development team
to ensure timely and effective roll out of earth-friendly green consumer product line. • Key member of competitive intelligence team for green product line in charge of seeking out
competitor product offerings, customer base, sales strategy and sales channels in order to gain valuable competitive knowledge, create value added reports of findings, and make sales / strategy recommendations to upper management.
• Oversaw and implemented effective go-to-market pricing strategies for all product lines based on deep analysis of current market indices, close analysis of raw material prices, and segmentation of targeted customer base.
THE OHIO STATE UNIVERSITY Columbus, OH Assistant Director – Outreach Jan. 2006 – Oct. 2008 • Developed, managed and successfully executed all aspects of engineering outreach
programming for the College of Engineering in order to foster educational outreach initiatives and expand the recruitment candidate pool.
• In conjunction with Math and Science Departments, developed targeted retention strategy involving special activities, student involvement workshops, and free tutoring sessions which resulted in ~15% increase in retention of undergraduate students.
• Fostered relationships with corporate sponsors and community partners in order to cultivate funding for STEM outreach and education initiatives.
HONDA RESEARCH & DEVELOPMENT Raymond, OH Quality Engineer III Jan. 2001 – Jan. 2006 • Co-leader of special project team which successfully and efficiently developed and rolled out
company-wide Access database making competitive information, quality information, and warranty data easily and quickly accessible to over 1100 Honda associates.
• Managed cross functional joint design and test teams in order to identify vehicle problem items and develop cost effective, timely countermeasures for implementation.

66
• Project Manager of special market investigation teams that saved the company over $750K in future warranty costs based on successful implementation of design changes on models including Acura TL and Honda Pilot.
____________________________________________________________________________________ LEADERSHIP Society of Women Engineers, Central Ohio Section
• Outreach & Education Chair Jun. 2010 – Present • President Jun. 2008 – Jun. 2010 • Marketing / Communications Chair Jun. 2007 – Jun. 2008 • Member Sept. 1996 - Present Society of Manufacturing Engineers • Executive Board Member December 2011 - Present • Member Sept. 2010 – Present Women in Engineering Advocacy Network (WEPAN) • Communications Committee Co-Chair Jun. 2007 – Jun. 2008 • Distinguished Service Award (Communications Committee) Jun. 2008 Engineering Education Insights Magazine • Featured Monthly Columnist Aug. 2007 – Jun. 2008 Toastmasters, Honda R&D Section • Vice President Jan. 2005 – Dec. 2005
_____________________________________________________________________________________________

67
LEONARD (Leo) RUSLI, Ph.D.
Research Engineer Dept. of Mechanical and Aerospace Engineering The Ohio State University 201 W. 19th Ave., Columbus, OH 43210 Phone: (614) 805-2495 Email: [email protected]
PROFILE Development of practical design solutions as shown in the following areas: − Technical expertise in design: mechanical part assembly design, design optimization, assembly
product architecture, plastic part design and snap-fit assembly, assembly ergonomics. − Broad experience in experimental study: design of experiments (DOE), statistical analysis, design of
custom testing fixtures, and rapid prototyping. Measurement system design and testing instrumentation, sensor electronics, Instron/MTS machine.
− Project management: advised and supervised multiple student design teams for short term projects (3-6 months) and graduate student research. Managed research lab facility to support projects.
− Successful consulting in a wide variety of industrially sponsored design projects. EDUCATION Ph.D. in Mechanical Engineering, The Ohio State University, 2008 Ph.D. Dissertation: Design and Analysis of Mechanical Assembly via Kinematic Screw Theory Developed a design tool to evaluate and optimize assembly constraint feature and fastener location, orientation, quantity. M.S. in Mechanical Engineering, The Ohio State University, 2003 M.S. Thesis: A Study of the Effect of Force and Tactile Feedback to Snap-fit Manual Assembly Developed design guidelines to create a snap-fit assembly that enhances manual assembly force feedback. B.S. in Mechanical Engineering, The Ohio State University, 2000 B.S. Honor’s Thesis: Evaluation of Rapid Prototyping Methods for Functional Testing in Snap-fits Conducted an experimental study to evaluate suitability of rapid prototyping technologies (SLS, FDM, machined) for functional testing in snap-fits. WORK EXPERIENCE The Ohio State University Research Engineer and Lecturer, Mech. Eng. Dept. 2008-present The Ohio State University Graduate Research Associate, Mech. Eng. Dept. 2006-2008 The Ohio State University Capstone Design Program Coordinator, Mech. Eng. Dept. 2003-2006 The Ohio State University Graduate Teaching Associate, Math Dept. 2001-2003 Honeywell Engineering intern 2001

68
TRW Engineering intern 1998 Mettler - Toledo Engineering intern 1997 INDUSTRIAL AND RESEARCH PROJECTS • Current main research area: Design of lightweight multi-material assembly strategy using
electromagnetic formed joints (Alcoa, 2011-current) • Design of assembly verification system using infrared tracking and vision recognition (Honda of
America manufacturing, 2009-2011) • Optimization of lightweight bumper crush can for energy absorption (Honda R&D, 2010) • Shear pin design for sub-sea chemical injection valve (Cameron, 2010) • High pressure oil seal power loss experimental study (John Deere, 2010-2011) • Design of interchangeable tractor power take-off (PTO) shaft (John Deere, 2008-2009). • Experimental study of DC torque tool ergonomics using universal position ergonomic test stand and
hand stiffness tester (Honda of America manufacturing, 2008-2010). • Redesigned and optimized a medical spray housing end cap snap-fit assembly (Vivus, 2008). • Coordinated multiple capstone student design project as a project manager, technical advisor, and
industrial liaison for Goodrich aerospace, Rockwell automation, Honda of America, John Deere, Wright-Patterson Air Force Base, Columbus zoo (2003-2007)
• Designed a 4-axis adjustable MRI table for equestrian applications (OSU Vet School, 2000-2001) • Various manufacturing automation design projects as an engineering intern in work experience
(1998-2001)
TEACHING EXPERIENCE • Faculty advisor for multiple industrially sponsored capstone design course • Faculty advisor for SAE Baja student competition team • ENG 658, ME 564: Senior capstone design projects • ME 581: Senior experimental design laboratory • ME 563: Design of machine elements. • ME 410, 420: Engineering mechanics: statics and strength of materials
PUBLICATIONS • Rusli, L., Luscher, A., Schmiedeler, J., 2012, “Analysis of constraint configurations in mechanical
assembly via kinematic screw theory”, ASME Journal of Mechanical Design. • Rusli, L., Luscher, A., 2012,” Fastener identification via IR tracking”, Assembly Automation Journal. • Rusli, L., Derck, J., “OSU designs a lightweight tie rod for baja SAE”, SAE Momentum, Nov 2011. • Rusli, L., Luscher, A., Sommerich, C., 2010, "Force and tactile feedback in preloaded cantilever snap-
fits under manual assembly", International Journal of Industrial Ergonomics, 40(6), pp. 618-628 • Rusli, L., Luscher, A., 2001, "Evaluation of Rapid Prototyping Methods for Functional Testing in Snap-
fits", ANTEC conference Vol 3: Special areas, Paper no. 848.. • Rusli, L., Luscher, A., Schmiedeler, J., 2011, Design space exploration of constraint features location
and orientation in mechanical assembly via mechanical assembly via kinematic screw theory, under review for ASME Journal of Mechanical Design.

69
• Rusli, L., Luscher, A., 2012, “Use of machine vision technology for assembly verification”, under review for Assembly Automation Journal.
● Reviewer for Rapid Prototyping Journal

70
DOUGLAS A. RICHMAN
1660 Lochridge Business: 248.352.4630 X 220 Bloomfield Hills, Michigan 48302 E-mail: [email protected] KAISER ALUMINUM FABRICATED PRODUCTS, LLC 2002 - PRESENT VP - Engineering and Technology
Lead engineering group providing engineering support to customers and Kaiser plants serving technically demanding automotive and industrial markets. Assist customer engineering organizations with product design guidance, metallurgical engineering and design for manufacturing. Support customer design and development of innovative aluminum products to satisfy new end product requirements. Advanced process strategic planning supporting future product requirements.
Aluminum Association Kaiser technical representative to the Aluminum Association and ASTM. Aluminum Association – Member - Aluminum Transportation Group (ATG) Board of Directors – ATG Chairman – Technology Work Group (ATG) Member – Product Standards and Data Committee Steering Committee – Sustainability Work Group
BOSAL INTERNATIONAL, Ann Arbor, Michigan 1999-01 President North American Operations
P & L responsibility Bosal North America: 5 plants and Tech Center. Automotive exhaust system manufacturing and sales in the US, Canada and Mexico. North American sales of $100+MM Member, Board of Directors - Bosal International
KAISER ALUMINUM CORPORATION VP & General Manager Kaiser Automotive Castings and Kaiser K-Fab Operations 1996-99
P & L responsibility for Kaiser Foundry $18MM and K-Fab, extrusion fabrication $8MM businesses. ALCAN ALUMINUM CORPORATION1988-96 VP - Alcan Automotive Castings / General Manager Altek 1993-96
Business development and P&L responsibility for Altek, a 50/50 Joint Venture between Alcan and Teksid (Fiat),sales $30MM. International commercialization of cast aluminum automotive control arms.
General Manager – Automotive Castings Division- North America 1992-93 P & L responsibility, foundry producing automotive cylinder heads and intake manifolds. Expanded product focus to automotive control arms using innovative casting process technology.
Director - Engineering and Automotive Business Development 1988-91 Responsible for automotive market strategic planning and led product and process engineering support group. Business grew from start-up to over $100 MM in four years.
GENERAL MOTORS CORPORATION, Warren, MI 1969-88 Manager Engine Development Chevrolet-Pontiac-Cadillac Group
Manager Chevrolet L-4 and V-6 Advanced Design Senior Development Engineer – V-8 Engine Control Systems Development Engineer – V-8 Truck Engine Control Systems Passenger Fleet Planner – Chevrolet Fuel Economy Planning System Design Engineer – GM Transportation Systems

71
Product Assurance Analyst – Engineering Staff Manager – Chevrolet Military Vehicle Proving Ground Operations
PROFESSIONAL AFFILIATIONS:
MBA - University of Detroit – Finance and Operations Research BSME - General Motors Institute
Registered Professional Engineer, Michigan
Society of Automotive Engineers
Co-Director – Light Materials Section
American Extruders Council
Aluminum Association Aluminum Transportation Group (ATG) – Member (since 1990)
Member of the Executive Committee Chairman – Technology Work Group Aluminum Products and Standards Group – Member (since 1998) Sustainability Work Group – Member (since 2009)
Advanced studies / Certifications Ohio State Univ. (Fisher College) – Certified Lean Manager MIT – Lean Manufacturing / Value Stream Management Plante & Moran - Executive Leadership Forum Goldradt Institute - Theory of Constraints Leader Certification TMB - Kaizen Implementation

72
Srdjan Simunovic
Computational Engineering and Energy Sciences Group Computer Science and Mathematics Division Oak Ridge National Laboratory Department of Civil and Environmental Engineering University of Tennessee Knoxville
865-771-9919 865-241-0381(fax)
Education: University of Split, Croatia Civil Engineering B.S. 1988 Carnegie Mellon University, USA Civil Engineering M.S. 1991 Carnegie Mellon University, USA Civil Engineering Ph.D. 1993 Professional Expertise: My research expertise includes computational modeling of materials and structures, modeling of impact and armor materials, strain rate sensitivity of materials, high velocity loading tests, polymer composite materials manufacturing and crashworthiness, physics of fracture, and effect of size on material properties. Current projects involve development of the next generation multi-physics code for simulation of nuclear fuel and nuclear reactor thermomechanics problems, impact simulation of lightweight materials for transportation, and material design optimization for impact performance. Professional Experience: 2009 – Present Joint Faculty Appointment, University of Tennessee and ORNL. 2004 – Present Distinguished Research Staff, Computational Materials Science and Computational
Engineering and Energy Sciences Group, ORNL. 1999 – 2003 Group Leader, Computational Materials Science Group, ORNL. 1998 – 2003 Senior Research Staff, Computational Materials Science Group, ORNL. 1994 – 1998 Research Staff, Computational Materials Science Group,ORNL. 1993 – 1994 Postdoctoral Researcher, Modeling and Simulation Group, ORNL. 1990 – 1993 Graduate Researcher, Department of Civil Engineering, Carnegie Mellon
University, Pittsburgh, PA 1988 – 1990 Junior Lecturer, Civil Engineering Department, University of Split, Croatia Recent Journal Publications (2006+): 1. Piro, M. H. A., Besmann, , T. M., Simunovic, S., Lewis, B. J., Thompson, W. T., Numerical
verification of equilibrium thermodynamic computations in nuclear fuel performance codes Journal of Nuclear Materials, 414 (2011) pp. 399-407.
2. Wang, Y. L., Xu, H. B., Erdman, D. L.,Starbuck, M. J., Simunovic, S., Characterization of High-Strain Rate Mechanical Behavior of AZ31 Magnesium Alloy Using 3D Digital Image Correlation, Advanced Engineering Materials, 13 (2011) pp. 943-948.
3. Barai, P., Nukala, P. K. V. V., Sampath, R., and Simunovic, S., Scaling of surface roughness in perfectly plastic disordered media. Physical Review E. 82 (2010) 056116.
4. Mishra, S.K., Deymier, P.A., Muralidharan, K., Frantziskonis, G., Pannala, S. and Simunovic, S.
73
Modeling the coupling of reaction kinetics and hydrodynamics in a collapsing cavity. Ultrasonics Sonochemistry, 2010, 17(1), 258-265.
5. Nukala, P. K. V. V., Barai, P., Zapperi, S., Alava, M. J. and Simunovic, S., Fracture roughness in three-dimensional beam lattice systems. Physical Review E. 82 (2010) 026103.
6. Frantziskonis, G., Muralidharan, K., Deymier, P., Simunovic, S., Nukala, P. and Pannala, S. Time-parallel multiscale/multiphysics framework. Journal of Computational Physics, 2009, 228(21), 8085-8092.
7. Nukala, P. K. V. V., Zapperi, S., Alava, M. J. and Simunovic, S., Crack roughness in the two-dimensional random threshold beam model. Physical Review E. 78 (2008) 046105.
8. Nukala, P. K. V. V., Zapperi, S., Alava, M. J. and Simunovic, S., Anomalous roughness of fracture surfaces in 2D fuse models. International Journal of Fracture. 154 (2008) pp. 119 – 130.
9. Mishra, S.K., Muralidharan, K., Deymier, P.A., Frantziskonis, G., Pannala, S. and Simunovic, S. Wavelet-Based Spatial Scaling of Coupled Reaction-Diffusion Fields. International Journal for Multiscale Computational Engineering, 2008, 6(4), 281-297.
10. Mishra, S.K., Muralidharan, K., Pannala, S., Simunovic, S., Daw, C.S., Nukala, P., Fox, R., Deymier, P.A. and Frantziskonis, G.N. Spatiotemporal compound wavelet matrix framework for multiscale/multiphysics reactor simulation: Case study of a heterogeneous reaction/diffusion system. International Journal of Chemical Reactor Engineering, 2008, 6.
11. Muralidharan, K., Mishra, S.K., Frantziskonis, G., Deymier, P.A., Nukala, P., Simunovic, S. and Pannala, S. Dynamic compound wavelet matrix method for multiphysics and multiscale problems. Physical Review E, 2008, 77(2).
Synergistic Activities:
• US DOT FHWA sponsored projects: Development of Heavy Vehicle Models for Roadside Barriers o Finite Element Models for Semitrailer Trucks
http://thyme.ornl.gov/FHWA/TractorTrailer o Single-Unit Truck Heavy Vehicle Finite Element Model
http://thyme.ornl.gov/FHWA/F800WebPage • US DOT NHTSA sponsored project:
o Parametric Finite Element Model of Sport Utility Vehicle http://thyme.ornl.gov/newexplorer
• US DOE Office of Energy Efficiency and Renewable Energy sponsored projects on lightweight materials technologies:
o High Strain Rate Characterization of Magnesium Alloys http://thyme.ornl.gov/Mg_new
o Dynamic Characterization and Modeling of Advanced High Strength Steel http://thyme.ornl.gov/ASP_Main
o Development of material models for composite materials, fracture, and high strain rate deformation http://thyme.ornl.gov/composites
o Crashworthiness of Aluminum Intensive Vehicles

74
http://thyme.ornl.gov/audi o Steel Processing Properties and their Effect on Impact Deformation of Lightweight
Structures http://thyme.ornl.gov/aisi
• US DOE Office of Nuclear Energy: o Development of new multi-physics nuclear fuel simulation code AMP

75
Appendix B: Conflict of Interest Statements
Conflict of Interest and Bias for Peer Review Background Identification and management of potential conflict of interest (COI) and bias issues are vital to the successes and credibility of any peer review consisting of external experts. The questionnaire that follows is consistent with EPA guidance concerning peer reviews.1 Definitions Experts in a particular field will, in many cases, have existing opinions concerning the subject of the peer review. These opinions may be considered bias, but are not necessarily conflicts of interest. Bias: For a peer review, means a predisposition towards the subject matter to be discussed that could influence the candidate's viewpoint. Examples of bias would be situations in which a candidate:
1. Has previously expressed a position on the subject(s) under consideration by the panel; or 2. Is affiliated with an industry, governmental, public interest, or other group which has
expressed a position concerning the subject(s) under consideration by the panel.
Conflict of Interest: For a peer review, as defined by the National Academy of Sciences,2 includes any of the following:
1. Affiliation with an organization with financial ties directly related to the outcome; 2. Direct personal/financial investments in the sponsoring organization or related to the
subject; or 3. Direct involvement in the documents submitted to the peer review panel... that could
impair the individual's objectivity or create an unfair competitive advantage for the individual or organization.
1 U.S. EPA (2009). Science Policy Council Peer Review Handbook. OMB (2004). Final Information Quality Bulletin for Peer Review.
2 NAS (2003). "Policy and Procedures on Committee Composition and Balance and Conflict or Interest for Committees Used in the Development of Reports" (www.nationalacademies.org/coi).

76
Policy and Process ● Candidates with COI, as defined above, will not be eligible for membership on those panels
where their conflicts apply. ● In general, candidates with bias, as defined above, on a particular issue will be eligible for all
panel memberships; however, extreme biases, such as those likely to impair a candidate's ability to contribute to meaningful scientific discourse, will disqualify a candidate.
● Ideally, the composition of each panel will reflect a range of bias for a particular subject,
striving for balance. ● Candidates who meet scientific qualifications and other eligibility criteria will be asked to
provide written disclosure through a confidential questionnaire of all potential COI and bias issues during the candidate identification and selection process.
● Candidates should be prepared, as necessary, to discuss potential COI and bias issues. ● All bias issues related to selected panelists will be disclosed in writing in the final peer
review record.

77
Conflict of Interest and Bias Questionnaire
Lotus Mass-Reduction Report (Lotus 2) Peer Review
Instructions to Candidate Reviewers
1. Please check YES/NO/DON'T KNOW in response to each question. 2. If your answer is YES or DON'T KNOW, please provide a brief explanation of the
circumstances. 3. Please make a reasonable effort to answer accurately each question. For example, to the
extent a question applies to individuals (or entities) other than you (e.g., spouse, dependents, or their employers), you should make a reasonable inquiry, such as emailing the questions to such individuals/entities in an effort to obtain information necessary to accurately answer the questions.
Questions
1. Are you (or your spouse/partner or dependents) or your current employer, an author, contributor, or an earlier reviewer of the document(s) being reviewed by this panel? YES___ NO_X_ DON'T KNOW___
2. Do you (or you spouse/partner or dependents) or your current employer have current plans to conduct or seek work related to the subject of this peer review following the completion of this peer review panel?
YES___ NO_X_ DON'T KNOW___
3. Do you (or your spouse/partner or dependents) or your current employer have any known financial stake in the outcome of the review (e.g., investment interest in a business related to the subject of peer review)? YES___ NO_X_ DON'T KNOW___
4. Have you (or your spouse/partner or dependents) or your current employer commented,
reviewed, testified, published, made public statements, or taken positions regarding the subject of this peer review? YES___ NO_X_ DON'T KNOW___

78
5. Do you hold personal values or beliefs that would preclude you from conducting an objective, scientific evaluation of the subject of the review? YES___ NO_X_ DON'T KNOW___
6. Do you know of any reason that you might be unable to provide impartial advice or comments on the subject review of the panel? YES___ NO_X_ DON'T KNOW___
7. Are you aware of any other factors that may create potential conflict of interest or bias
issues for you as a member of the panel? YES___ NO_X_ DON'T KNOW___
Acknowledgment I declare that the disclosed information is true and accurate to the best of my knowledge, and that no real, potential, or apparent conflict of interest or bias is known to me except as disclosed. I further declare that I have made reasonable effort and inquiry to obtain the information needed to answer the questions truthfully, and accurately. I agree to inform SRA promptly of any change in circumstances that would require me to revise the answers that I have provided. William Joost Name
10/24/2011 Signature Date

79
Conflict of Interest and Bias Questionnaire
Lotus Mass-Reduction Report (Lotus 2) Peer Review
Instructions to Candidate Reviewers
1. Please check YES/NO/DON'T KNOW in response to each question. 2. If your answer is YES or DON'T KNOW, please provide a brief explanation of the
circumstances. 3. Please make a reasonable effort to answer accurately each question. For example, to the
extent a question applies to individuals (or entities) other than you (e.g., spouse, dependents, or their employers), you should make a reasonable inquiry, such as emailing the questions to such individuals/entities in an effort to obtain information necessary to accurately answer the questions.
Questions
1. Are you (or your spouse/partner or dependents) or your current employer, an author, contributor, or an earlier reviewer of the document(s) being reviewed by this panel? YES___ NO_X_ DON'T KNOW___
2. Do you (or you spouse/partner or dependents) or your current employer have current plans to conduct or seek work related to the subject of this peer review following the completion of this peer review panel?
YES___ NO_X_ DON'T KNOW___
3. Do you (or your spouse/partner or dependents) or your current employer have any known financial stake in the outcome of the review (e.g., investment interest in a business related to the subject of peer review)? YES___ NO_X_ DON'T KNOW___
4. Have you (or your spouse/partner or dependents) or your current employer commented,
reviewed, testified, published, made public statements, or taken positions regarding the subject of this peer review? YES___ NO_X_ DON'T KNOW___
80
5. Do you hold personal values or beliefs that would preclude you from conducting an objective, scientific evaluation of the subject of the review? YES___ NO_X_ DON'T KNOW___
6. Do you know of any reason that you might be unable to provide impartial advice or comments on the subject review of the panel? YES___ NO_X_ DON'T KNOW___
7. Are you aware of any other factors that may create potential conflict of interest or bias
issues for you as a member of the panel? YES___ NO_X_ DON'T KNOW___
Acknowledgment I declare that the disclosed information is true and accurate to the best of my knowledge, and that no real, potential, or apparent conflict of interest or bias is known to me except as disclosed. I further declare that I have made reasonable effort and inquiry to obtain the information needed to answer the questions truthfully, and accurately. I agree to inform SRA promptly of any change in circumstances that would require me to revise the answers that I have provided.
CG Cantemir Name 1/23/12 Signature Date

81
Conflict of Interest and Bias Questionnaire
Lotus Mass-Reduction Report (Lotus 2) Peer Review
Instructions to Candidate Reviewers
1. Please check YES/NO/DON'T KNOW in response to each question. 2. If your answer is YES or DON'T KNOW, please provide a brief explanation of the
circumstances. 3. Please make a reasonable effort to answer accurately each question. For example, to the
extent a question applies to individuals (or entities) other than you (e.g., spouse, dependents, or their employers), you should make a reasonable inquiry, such as emailing the questions to such individuals/entities in an effort to obtain information necessary to accurately answer the questions.
Questions
1. Are you (or your spouse/partner or dependents) or your current employer, an author, contributor, or an earlier reviewer of the document(s) being reviewed by this panel? YES___ NO_X_ DON'T KNOW___
2. Do you (or you spouse/partner or dependents) or your current employer have current plans to conduct or seek work related to the subject of this peer review following the completion of this peer review panel?
YES_X_ NO___ DON'T KNOW___ [Work will be indirectly related. This is a broad area.]
3. Do you (or your spouse/partner or dependents) or your current employer have any known financial stake in the outcome of the review (e.g., investment interest in a business related to the subject of peer review)? YES___ NO_X_ DON'T KNOW___
4. Have you (or your spouse/partner or dependents) or your current employer commented,
reviewed, testified, published, made public statements, or taken positions regarding the subject of this peer review? YES___ NO_X_ DON'T KNOW___

82
5. Do you hold personal values or beliefs that would preclude you from conducting an objective, scientific evaluation of the subject of the review? YES___ NO_X_ DON'T KNOW___
6. Do you know of any reason that you might be unable to provide impartial advice or comments on the subject review of the panel? YES___ NO_X_ DON'T KNOW___
7. Are you aware of any other factors that may create potential conflict of interest or bias
issues for you as a member of the panel? YES___ NO_X_ DON'T KNOW___
Acknowledgment I declare that the disclosed information is true and accurate to the best of my knowledge, and that no real, potential, or apparent conflict of interest or bias is known to me except as disclosed. I further declare that I have made reasonable effort and inquiry to obtain the information needed to answer the questions truthfully, and accurately. I agree to inform SRA promptly of any change in circumstances that would require me to revise the answers that I have provided. Glenn Daehn Name
10 Nov 2011 Signature Date

83
Conflict of Interest and Bias Questionnaire
Lotus Mass-Reduction Report (Lotus 2) Peer Review
Instructions to Candidate Reviewers
1. Please check YES/NO/DON'T KNOW in response to each question. 2. If your answer is YES or DON'T KNOW, please provide a brief explanation of the
circumstances. 3. Please make a reasonable effort to answer accurately each question. For example, to the
extent a question applies to individuals (or entities) other than you (e.g., spouse, dependents, or their employers), you should make a reasonable inquiry, such as emailing the questions to such individuals/entities in an effort to obtain information necessary to accurately answer the questions.
Questions
1. Are you (or your spouse/partner or dependents) or your current employer, an author, contributor, or an earlier reviewer of the document(s) being reviewed by this panel? YES___ NO_X_ DON'T KNOW___
2. Do you (or you spouse/partner or dependents) or your current employer have current plans to conduct or seek work related to the subject of this peer review following the completion of this peer review panel?
YES_X_ NO___ DON'T KNOW___ [OSU will form a lightweight structure consortium.]
3. Do you (or your spouse/partner or dependents) or your current employer have any known financial stake in the outcome of the review (e.g., investment interest in a business related to the subject of peer review)? YES___ NO_X_ DON'T KNOW___
4. Have you (or your spouse/partner or dependents) or your current employer commented,
reviewed, testified, published, made public statements, or taken positions regarding the subject of this peer review? YES___ NO_X_ DON'T KNOW___

84
5. Do you hold personal values or beliefs that would preclude you from conducting an objective, scientific evaluation of the subject of the review? YES___ NO_X_ DON'T KNOW___
6. Do you know of any reason that you might be unable to provide impartial advice or comments on the subject review of the panel? YES___ NO_X_ DON'T KNOW___
7. Are you aware of any other factors that may create potential conflict of interest or bias
issues for you as a member of the panel? YES_X_ NO___ DON'T KNOW___ [Reviewer has known the author of this report for many years but he says it will have no impact on his review.]
Acknowledgment I declare that the disclosed information is true and accurate to the best of my knowledge, and that no real, potential, or apparent conflict of interest or bias is known to me except as disclosed. I further declare that I have made reasonable effort and inquiry to obtain the information needed to answer the questions truthfully, and accurately. I agree to inform SRA promptly of any change in circumstances that would require me to revise the answers that I have provided. David Emerling Name 11/10/2011 Signature Date

85
Conflict of Interest and Bias Questionnaire
Lotus Mass-Reduction Report (Lotus 2) Peer Review
Instructions to Candidate Reviewers
1. Please check YES/NO/DON'T KNOW in response to each question. 2. If your answer is YES or DON'T KNOW, please provide a brief explanation of the
circumstances. 3. Please make a reasonable effort to answer accurately each question. For example, to the
extent a question applies to individuals (or entities) other than you (e.g., spouse, dependents, or their employers), you should make a reasonable inquiry, such as emailing the questions to such individuals/entities in an effort to obtain information necessary to accurately answer the questions.
Questions
1. Are you (or your spouse/partner or dependents) or your current employer, an author, contributor, or an earlier reviewer of the document(s) being reviewed by this panel? YES___ NO_X_ DON'T KNOW___
2. Do you (or you spouse/partner or dependents) or your current employer have current plans to conduct or seek work related to the subject of this peer review following the completion of this peer review panel?
YES___ NO_X_ DON'T KNOW___
3. Do you (or your spouse/partner or dependents) or your current employer have any known financial stake in the outcome of the review (e.g., investment interest in a business related to the subject of peer review)? YES___ NO_X_ DON'T KNOW___
4. Have you (or your spouse/partner or dependents) or your current employer commented,
reviewed, testified, published, made public statements, or taken positions regarding the subject of this peer review? YES___ NO_X_ DON'T KNOW___

86
5. Do you hold personal values or beliefs that would preclude you from conducting an objective, scientific evaluation of the subject of the review? YES___ NO_X_ DON'T KNOW___
6. Do you know of any reason that you might be unable to provide impartial advice or comments on the subject review of the panel? YES___ NO_X_ DON'T KNOW___
7. Are you aware of any other factors that may create potential conflict of interest or bias
issues for you as a member of the panel? YES___ NO_X_ DON'T KNOW___
Acknowledgment I declare that the disclosed information is true and accurate to the best of my knowledge, and that no real, potential, or apparent conflict of interest or bias is known to me except as disclosed. I further declare that I have made reasonable effort and inquiry to obtain the information needed to answer the questions truthfully, and accurately. I agree to inform SRA promptly of any change in circumstances that would require me to revise the answers that I have provided. Kristina Kennedy Name 11-15-11 Signature Date

87
Conflict of Interest and Bias Questionnaire
Lotus Mass-Reduction Report (Lotus 2) Peer Review
Instructions to Candidate Reviewers
1. Please check YES/NO/DON'T KNOW in response to each question. 2. If your answer is YES or DON'T KNOW, please provide a brief explanation of the
circumstances. 3. Please make a reasonable effort to answer accurately each question. For example, to the
extent a question applies to individuals (or entities) other than you (e.g., spouse, dependents, or their employers), you should make a reasonable inquiry, such as emailing the questions to such individuals/entities in an effort to obtain information necessary to accurately answer the questions.
Questions
1. Are you (or your spouse/partner or dependents) or your current employer, an author, contributor, or an earlier reviewer of the document(s) being reviewed by this panel? YES___ NO_X_ DON'T KNOW___
2. Do you (or you spouse/partner or dependents) or your current employer have current plans to conduct or seek work related to the subject of this peer review following the completion of this peer review panel?
YES___ NO_X_ DON'T KNOW___
3. Do you (or your spouse/partner or dependents) or your current employer have any known financial stake in the outcome of the review (e.g., investment interest in a business related to the subject of peer review)? YES___ NO_X_ DON'T KNOW___
4. Have you (or your spouse/partner or dependents) or your current employer commented,
reviewed, testified, published, made public statements, or taken positions regarding the subject of this peer review? YES___ NO_X_ DON'T KNOW___

88
5. Do you hold personal values or beliefs that would preclude you from conducting an objective, scientific evaluation of the subject of the review? YES___ NO_X_ DON'T KNOW___
6. Do you know of any reason that you might be unable to provide impartial advice or comments on the subject review of the panel? YES___ NO_X_ DON'T KNOW___
7. Are you aware of any other factors that may create potential conflict of interest or bias
issues for you as a member of the panel? YES___ NO_X_ DON'T KNOW___
Acknowledgment I declare that the disclosed information is true and accurate to the best of my knowledge, and that no real, potential, or apparent conflict of interest or bias is known to me except as disclosed. I further declare that I have made reasonable effort and inquiry to obtain the information needed to answer the questions truthfully, and accurately. I agree to inform SRA promptly of any change in circumstances that would require me to revise the answers that I have provided. Anthony Luscher Name 11/13/2011 Signature Date

89
Conflict of Interest and Bias Questionnaire
Lotus Mass-Reduction Report (Lotus 2) Peer Review
Instructions to Candidate Reviewers
1. Please check YES/NO/DON'T KNOW in response to each question. 2. If your answer is YES or DON'T KNOW, please provide a brief explanation of the
circumstances. 3. Please make a reasonable effort to answer accurately each question. For example, to the
extent a question applies to individuals (or entities) other than you (e.g., spouse, dependents, or their employers), you should make a reasonable inquiry, such as emailing the questions to such individuals/entities in an effort to obtain information necessary to accurately answer the questions.
Questions
1. Are you (or your spouse/partner or dependents) or your current employer, an author, contributor, or an earlier reviewer of the document(s) being reviewed by this panel? YES___ NO_X_ DON'T KNOW___
2. Do you (or you spouse/partner or dependents) or your current employer have current plans to conduct or seek work related to the subject of this peer review following the completion of this peer review panel?
YES_X_ NO___ DON'T KNOW___
3. Do you (or your spouse/partner or dependents) or your current employer have any known financial stake in the outcome of the review (e.g., investment interest in a business related to the subject of peer review)? YES_X_ NO___ DON'T KNOW___
4. Have you (or your spouse/partner or dependents) or your current employer commented,
reviewed, testified, published, made public statements, or taken positions regarding the subject of this peer review? YES_X_ NO___ DON'T KNOW___

90
5. Do you hold personal values or beliefs that would preclude you from conducting an objective, scientific evaluation of the subject of the review?
YES___ NO_X_ DON'T KNOW___
6. Do you know of any reason that you might be unable to provide impartial advice or comments on the subject review of the panel? YES___ NO_X_ DON'T KNOW___
7. Are you aware of any other factors that may create potential conflict of interest or bias
issues for you as a member of the panel? YES___ NO_X_ DON'T KNOW___
Acknowledgment I declare that the disclosed information is true and accurate to the best of my knowledge, and that no real, potential, or apparent conflict of interest or bias is known to me except as disclosed. I further declare that I have made reasonable effort and inquiry to obtain the information needed to answer the questions truthfully, and accurately. I agree to inform SRA promptly of any change in circumstances that would require me to revise the answers that I have provided. D. A. Richman________ Name __________________________ Oct 27, 2011_____ Signature Date

91
Conflict of Interest and Bias Questionnaire
Lotus Mass-Reduction Report (Lotus 2) Peer Review
Instructions to Candidate Reviewers
1. Please check YES/NO/DON'T KNOW in response to each question. 2. If your answer is YES or DON'T KNOW, please provide a brief explanation of the
circumstances. 3. Please make a reasonable effort to answer accurately each question. For example, to the
extent a question applies to individuals (or entities) other than you (e.g., spouse, dependents, or their employers), you should make a reasonable inquiry, such as emailing the questions to such individuals/entities in an effort to obtain information necessary to accurately answer the questions.
Questions
1. Are you (or your spouse/partner or dependents) or your current employer, an author, contributor, or an earlier reviewer of the document(s) being reviewed by this panel? YES___ NO_X_ DON'T KNOW___
2. Do you (or you spouse/partner or dependents) or your current employer have current plans to conduct or seek work related to the subject of this peer review following the completion of this peer review panel?
YES___ NO_X_ DON'T KNOW___
3. Do you (or your spouse/partner or dependents) or your current employer have any known financial stake in the outcome of the review (e.g., investment interest in a business related to the subject of peer review)? YES___ NO_X_ DON'T KNOW___
4. Have you (or your spouse/partner or dependents) or your current employer commented,
reviewed, testified, published, made public statements, or taken positions regarding the subject of this peer review? YES___ NO_X_ DON'T KNOW___

92
5. Do you hold personal values or beliefs that would preclude you from conducting an objective, scientific evaluation of the subject of the review? YES___ NO_X_ DON'T KNOW___
6. Do you know of any reason that you might be unable to provide impartial advice or comments on the subject review of the panel? YES___ NO_X_ DON'T KNOW___
7. Are you aware of any other factors that may create potential conflict of interest or bias
issues for you as a member of the panel? YES___ NO_X_ DON'T KNOW___
Acknowledgment I declare that the disclosed information is true and accurate to the best of my knowledge, and that no real, potential, or apparent conflict of interest or bias is known to me except as disclosed. I further declare that I have made reasonable effort and inquiry to obtain the information needed to answer the questions truthfully, and accurately. I agree to inform SRA promptly of any change in circumstances that would require me to revise the answers that I have provided. Srdjan Simunovic_ Name 10/21/2011 Signature Date

93
Appendix C: Peer Review Charge and Conference Call Notes
Charge to Peer Reviewers of Demonstrating the Safety and Crashworthiness of a 2020 Model-Year, Mass-Reduced Crossover Vehicle (Lotus 2 Report)
In developing programs to reduce GHG emissions and increase fuel economy, the U.S. Environmental Protection Agency (EPA), the California Air Resources Board (CARB), and the National Highway Transportation Safety Administration (NHTSA) have to assess the use of mass-reduction technology in light-duty vehicles. The availability, feasibility, and validation of lightweight materials and design techniques in the 2020 – 2025 timeframe is of high importance, especially considering its potential to be one of the major technology areas that could be utilized to help achieve the vehicle GHG and fuel economy goals. The 2011 study by Lotus Engineering, Demonstrating the Safety and Crashworthiness of a 2020 Model-Year, Mass Reduced Crossover Vehicle, was done under contract from CARB, coordinated by EPA and CARB, and involved technical collaboration on safety with NHTSA. The study was conducted specifically to help assess a number of critical questions related to mass-reduced vehicle designs in the 2020 – 2025 timeframe. The Lotus study involves the design development and crashworthiness safety validation of a mass-reduced redesign of a crossover sport utility vehicle (i.e., starting from a 2009 Toyota Venza baseline) using advanced materials and design techniques. The research entails the full conceptual redesign of a vehicle. This review for the 2011 Lotus study is referred to as “Phase 2” because it builds upon Lotus’ previous 2010 study An Assessment of Mass Reduction Opportunities for a 2017–2020 Model Year Vehicle Program, which for context is referred to as “Phase 1” here and in the 2011 study. This is noted because the 2011 “Phase 2” study involves the non-body components (e.g., interior, suspension, chassis) relating back to “Phase 1” work. The Phase 1 BIW was redesigned in the Phase 2 work using an engineering design, safety testing, and validation of the vehicle’s body-in-white structure. You are asked to review and provide expert written comments on the Phase 2 report, to which you are being provided full access. As background information (particularly on the interior/suspension and chassis components) you are being provided a copy of the Phase 1 report and the peer review of the Phase 1 report. You are not required to review either of the Phase 1 documents. EPA is seeking your expert opinion on the technologies utilized, methodologies employed, and validity of findings regarding the Lotus study. EPA asks that you orient your comments on the report toward the following six general areas: (1) assumptions and data sources; (2) vehicle design methodological rigor; (3) vehicle crashworthiness testing methodological rigor; (4) vehicle manufacturing cost methodological rigor; (5) conclusion and findings; and (6) other comments. These areas will be split into sub-issues in the final charge to reviewers. Although EPA is requesting response to these six areas, you will be expected to identify additional topics or depart from these examples as necessary to best apply your particular area(s) of expertise to review the overall study. You should provide your responses in the

94
table that will be attached to the peer reviewer charge, adding comments, as necessary, at the end of each table. The Lotus study covers areas of material properties, forming techniques, bonding techniques, manufacturing processes, bending and torsional tests, full vehicle crash simulation, and manufacturing cost estimation. We ask that you comment on all of these aspects, with emphasis on the sources of information, methods employed, crash simulation testing techniques, and whether improved studies and methods exist elsewhere to develop, validate, and estimate costs for the potential of mass-reduction technology in the 2020 – 2025 timeframe. This broad span of technical areas suggests that reviewers may well have much deeper technical expertise and experience in some areas and a working knowledge in others. As a result, the level of detailed technical review to be given by each reviewer might vary significantly across the general category areas. Your comments should be sufficiently clear and detailed to allow readers to thoroughly understand their relevance to the Lotus study. Please deliver your final written comments to SRA International no later than Wednesday, December 14. All materials provided to you as well as your review comments should be treated as confidential, and should neither be released nor discussed with others outside of the review panel. Once Lotus has made its report public, EPA will notify you that you may release or discuss the peer review materials and your review comments with others. Should you have questions about what is required in order to complete this review or need additional background material, please contact Brian Menard at SRA ([email protected] or 434-979-3700 x136). Should you have any questions about the EPA peer review process itself, please contact Cheryl Caffrey in EPA’s Quality Office, National Vehicle and Fuel Emissions Laboratory, ([email protected] or 734-214-4849).

95
PEER REVIEW OF THE LOTUS REPORT DEMONSTRATING THE SAFETY AND CRASHWORTHINESS OF A 2020 MODEL YEAR, MASS REDUCED CROSSOVER VEHICLE
Conference Call
Friday, December 2, 2011
Participating in the call:
Will Joost, DOE
Doug Richman, Kaiser Aluminum
Srdjan Simunovic, ORNL
David Emerling and C.G. Cantemir, OSU
Gregg Peterson, Lotus Engineering
Cheryl Caffrey, EPA
Brian Menard and Doran Stegura, SRA
NOTE: Reviewers should send follow-up questions to Brian Menard by COB Monday, December 5, for prompt response by Lotus so that reviewers are able to submit their final comments by December 14.
Issue 1:
The Labor Rate appears lower than industry standard and why is renewable energy included in the cost? Acknowledging that this is a small contributor to the cost, but question just the same.
This question is related to the piece cost issue. Did these 2 factors influence costs very much?
Lotus Engineering (Lotus) Response: [1] The report will include a cost for the BIW using a typical industry rate as well as the known labor rate stipulated for the plant site. [2] The energy cost is $69/vehicle; the assumption is that the plant uses conventional electrical power to build the body structure and closures. There is a discussion in the manufacturing report relative to using sustainable energy and the advantages and disadvantages. EBZ, the firm that designed the plant, is a European company and typically equips their current customer manufacturing facilities with solar roofs and includes potential wind turbines sites. In other words, on site sustainable energy systems are already common in European automotive plants. We see that trend being mainstream in the US in the timeframe of this vehicle. Because we expect conventional steel BIW plants to do the same, there is no cost savings assigned to the use of sustainable energy vs. conventional sources (coal, hydro, nuclear).

96
To the reviewer’s knowledge the Toyota plant has the lowest costs in the US, but these rates are lower than these
Ok for other plants but may not be applicable for automobile plants (est. $55/hr)
Piece Cost and Labor Content - labor rates are different for 1) and 2) below
1) **Manufacturing study (assembly, stamping – Toyota in-house parts) 2) Part component cost – no – labor rates realistic
Issue 2:
Body Build - Are Mag parts coated?
o Were sheet metal parts pre-treated? Anodized aluminum o Nobody is anodizing sheets for aluminum in NA (automotive production)
Lotus Response: Lotus uses anodizing.
Most body programs use some sort of a coating so as long as there’s a cost for coating the sheet metal then that’s ok.
Issue 3:
Material property – were these minimal or typical properties? Toyota insists on minimal properties in design.
Lotus Response: The baseline Venza BOM is being revised to clarify that the $0 cost, 0 kg mass parts are already included in sub-assemblies; this shows the individual parts but does not include their cost and mass as that would be double counting the parts. The material specifications were provided by the material supplier; these specifications are the same as those provided to any supplier/OEM using those materials. Issue 4:
Durability is mentioned several times in the report and Lotus has experience in durability. Otherwise, there is no other analysis of durability. How comfortable is Lotus with durability? The paper lacks analysis with NVH and fatigue issues – not addressed and may result in some additional weight.
Lotus Response: Durability is beyond the scope of the project; however, Lotus did due diligence with coupon testing and past experience and other things in joining and materials.
Louts has built aluminum rear bonded vehicles for 16-17 years – the cars are used more at tracks than public roads, has adhesive bonding experience
Lotus Response: Lotus will place a statement to this effect in the final report.
Lotus has been told they’re overdesigned. IIHS – 4x wt for roof crush, FMVSS – 3x wt for roof crush and Lotus uses 6x weight for roof crush –hence no need to add additional weight

97
Issue 5:
The mass damper was removed from the Lotus original design –
Lotus Response: Toyota had hands tied and bandages were evident throughout the BIW. With the Lotus design it is possible to remove these bandages.
Issue 6:
L3 engine – 1 L Engine isn’t in production yet, but well along… Lotus Saber engine – has balance shaft.
Issue 7:
Collision performance says body is quite stiff
Data is coming that says body is “remarkably stiff”
As part of process – 50 mph flat not have any discontinuities
Evident in pulse time for crash events
Tire and wheel don’t hit cross tire – interesting observation
Lotus Response: Engine mount design was worked over to get this result.
Issue 8:
Appendix C-1 – part count – body BOM – quite a large number of 0 cost 0 weight parts removed – 127 parts were 0 wt, 0 cost,
47 nut/weld studs in original – no nuts/studs listed in new vehicle parts list
407 parts seem like a very large number of parts in the original Venza compared to other programs reviewers has experience with
BIW – Venza – Phase 1 welded – not costed and no weight – how is it considered a part then? Numbers missing?
Lotus Response: Lotus will provide additional information to the reviewers.
Issue 9:
Is report for a technical audience or an illustration of possibilities to the general public?
Add more info for technical document – mention CAE done on HD vehicle earlier in report
Material data – isotropic – for modeling all materials
Material 24 in Dyna

98
Issue 10:
For each material, explain why specific material selected for later on – materials are tied together
Give info on grades of aluminum used in various locations in the vehicle
Mag – only one – AM60 – only one property given, but how was this decided?
Explain materials choices – hot stamped boron used in door beams –for don’t want to have large displacement…..
Mag – chose AM rather than AZ for galvanic properties
Lotus Response: Lotus worked with Alcoa and others for stiffness.
Lotus Response: Agreed to include language in the report concerning efforts with suppliers and supplier recommendations and test results.
Which aluminum used where in BOM at end of report – bring up front part of report
Why use 6061 in rails and not 6063 – or other way around?
Issue 11:
Use different FEA technologies for different parts – was the cast mag a solid element or approximated by shells?
Issue 12:
Stiffness – one crash – page 72 have test from NHTSA to compare results – new design consistently higher than original vehicle - explain.
Any other tests NHTSA ran? Bring other comparisons
Lotus Response: The original Venza had higher peak pulse than the new vehicle.
Srdjan Simunovic said that new vehicle has earlier spike and lower difference between simulation and real car crash.
Lotus Response: Lotus changed materials 10% (sensitivity) and changed peak acceleration by 30%. Lotus wanted tuning to ensure not fire airbag early hence control peak acceleration, chose 23g 1st 35ms - beyond scope to do full airbag development.
Simunovic suggested Lotus include explanation – graphs not as valuable as discussion as to decisions.
Lotus Response: Agreed to incorporate the reviewer’s recommendations.

99
Issue 13:
In Sec. 4.5.8 Lotus lists systems (ex: aluminum extrusion) and lists where systems are in production – the places in production include very high end vehicles such as the McLaren and other similar cars. Any higher production such as the Toyota Prius/Chevy Cruze?
Lotus Response: Agreed to take this into consideration.
Says costs estimate is applicable to higher volume
Issue 14:
Design shows lots of 6022 aluminum – not standard in automotive – is it?
Doug Richman: It is used in body sheet.
6013 not used much now, but will likely be used in body sheet in next 10 years
Not revolutionary - there are 2 plants with high volume in North America
Doug mentioned none of the aluminum have aerospace technology – more civilian markets.
Issue 15:
Can you stamp and form this aluminum at room temp?
Richman: Yes, absolutely- from an industry perspective.
Issue 16:
Does moving from friction spot welding to friction spot joining save money?
Lotus Response: Spot joining is used with adhesive and so uses half as many joints as spot welding—this is a Kawasaki process which allows the aluminum to stay in parent properties and not change properties.
Is there any riveting or spot riveting?
Lotus Response: Yes, it includes riveting and spot welds.
Issue 17:
Crash simulation question in the charge letter – “whether lotus can be validated” – what are you looking for? EPA will clarify this.
Issue 18:
Remove discussion to Phase 1 report – is it needed?

100
EPA Response: It should be considered that the report assumes the mass reduction and costs from all of the other parts of the vehicle from the Phase 1 report.
Lotus Response: The report is being reviewed to eliminate any need for the reader to refer to the Phase 1 report. The intent is that the Phase 2 report is complete by itself and does not require the reader to read another large (300 page) document as a requirement for fully understanding the Phase 2 report. In other words, all pertinent Phase 1 information will be included in the Phase 2 report rather than refer the reader to the Phase 1 report.
Issue 19:
It was noted that the model takes away the spare tire and tool kit – this results in a notable mass and cost savings – is this a philosophy difference on whether this is reaching too far? No further discussion at this time. The issue does need to be addressed.
Issue 20:
Test of marketability - Interior radical – departures from expectations – smaller steps may be needed – bad reaction ex: Honda Civic
Honda Civic downgraded interior – major decline in sales and marketability. Will have new model in 2 years to try to recover (sooner than 5 typical)
Parts look cheaper and fit and finish is bad – took out weight and cost out and road tests of vehicle not good.
Lotus Response: The materials were not downgraded; they were either kept on par or were upgraded. Lotus received feedback that the Lotus interior was preferred over the original Venza interior and that the Lotus materials were soft to the touch and high grade.
Issue 21:
It is important to proofread the numbers in the tables and graphs and those referred to in the report text as in some instances they are inconsistent.

101
Appendix D: Reviews
William Joost, Department of Energy
1. ASSUMPTIONS AND DATA SOURCES COMMENTS
Please comment on the validity of any data sources and assumptions embedded in the study’s material choices, vehicle design, crash validation testing, and cost assessment that could affect its findings.
The accuracy of the stress-strain data used for each material during CAE and crash analysis is critically important for determining accurate crash response. The sources cited for the material data are credible; however the Al yield stresses used appear to be on the high side of the expected properties for the alloy-temper systems proposed here. The authors may need to address the use of the slightly higher numbers (for example, 6061-T6 is shown with a yield stress of 308 MPa, where standard reported values are usually closer to 275 MPa).
If you find issues with data sources and assumptions, please provide suggestions for available data that would improve the study.
Materials properties describing failure are not indicated (with the exception of Mg, which shows an in-plane failure strain of 6%). It seems unlikely that the Al and Steel components in the vehicle will remain below the strain localization or failure limits of the material; it’s not clear how failure of these materials was determined in the models. The authors should indicate how failure was accounted for; if it was not, the authors will need to explain why the assumption of uniform plasticity throughout the crash event is valid for these materials. This could be done by showing that the maximum strain conditions predicted in the model are below the typical localization or failure limits of the materials (if that is true, anyway). Empirical determination of the joint properties was a good decision for this study. The author indicates that lap-shear tests demonstrated that failure occurred outside of the bond, and therefore adhesive failure was not included in the model. However, the joints will experience a variety of stress states that differ from lap-shear during a crash event. While not a major deficiency, it would be preferable to provide some discussion of why lap-shear results can be extended to all stress states for joint failure mode. Alternatively, the author could also provide testing data for other joint stress states such as bending, torsion, and cross tension.

102
2. VEHICLE DESIGN METHODOLOGICAL RIGOR COMMENTS
Please comment on the methods used to analyze the materials selected, forming techniques, bonding processes, and parts integration, as well as the resulting final vehicle design.
While appropriate forming methods and materials appear to have been selected, a detailed description of the material selection and trade-off process is not provided. One significant exception is the discussion and tables regarding the replacement of Mg components with Al and steel components in order to meet crash requirements. Similarly, while appropriate joining techniques seem to have been used, the process for selecting the processes and materials is not clear. Additionally, little detail is provided on the joining techniques used here. A major technical hurdle in the implementation of multi-material systems is the quality, durability, and performance of the joints. Additional effort should be expended towards describing the joining techniques used here and characterizing the performance.
Please describe the extent to which state-of-the-art design methods have been employed as well as the extent to which the associated analysis exhibits strong technical rigor.
Design is a challenging process and the most important aspect is having a capable and experienced design team supporting the project; Lotus clearly meets this need and adds credibility to the design results. One area that is omitted from the analysis is durability (fatigue and corrosion) performance of the structure. Significant use of Al, Al joints, and multi-material joints introduces the potential for both fatigue and corrosion failure that are unacceptable in an automotive product. It would be helpful to include narrative describing the good durability performance of conventional (i.e. not Bently, Ferrari, etc.) vehicles that use similar materials and joints in production without significant durability problems. In some cases, (say the weld-bonded Al-Mg joints), production examples do not exist so there should be an explanation of how these could meet durability requirements.
If you are aware of better methods employed and documented elsewhere to help select and analyze advanced vehicle materials and design engineering rigor for 2020-2025 vehicles, please suggest how they might be used to improve this study.

103
ADDITIONAL COMMENTS: This is a very thorough design process, undertaken by a very credible design organization (Lotus). There are a variety of design assumptions and trade-offs that were made during the process (as discussed above), but this would be expected for any study of this type. Having a design team from Lotus adds credibility to the assumptions and design work that was done here. Section 4.5.8.1 uses current “production” vehicles as examples for the feasibility of these techniques. However, many of the examples are for extremely high-end vehicles (Bently, Lotus Evora, McLaren) and the remaining examples are for low-production, high-end vehicles (MB E class, Dodge Viper, etc.). The cost of some technologies can be expected to come down before 2020, but it is not reasonable to assume that (for example) the composites technologies used in Lamborghinis will be cost competitive on any time scale; significant advances in composite technology will need to be made in order to be cost competitive on a Venza, and the resulting material is likely to differ considerably (in both properties and manufacturing technique) from the Lamborghini grade material.

104
3. VEHICLE CRASHWORTHINESS TESTING METHODOLOGICAL RIGOR. COMMENTS
Please comment on the methods used to analyze the vehicle body structure’s structural integrity and safety crashworthiness.
Regarding my comment on joint failure under complex stress states, note that in figure 4.3.12.a the significant plastic strains are all located at the bumper-rail joints. While this particular test was only to indicate the damage (and cost to repair), the localization of plastic strain at the joint is somewhat concerning. The total-vehicle torsional stiffness result is remarkably high. If this is accurate, it may contribute to an odd driving “feel”, particularly by comparison to a conventional Venza; higher torsional stiffness is usually viewed as a good thing, but the authors may need to address whether or not such extreme stiffness values would be appealing to consumers of this type of vehicle. While there doesn’t appear to be a major source of error in the torsional stiffness analysis, the result does call into question the accuracy; this is either an extraordinarily stiff vehicle, or there was an error during the analysis.
Please describe the extent to which state-of-the-art crash simulation testing methods have been employed as well as the extent to which the associated analysis exhibits strong technical rigor.
This is outside of my area of expertise
For reviewers with vehicle crash simulation capabilities to run the LS-DYNA model, can the Lotus design and results be validated?
N/A
If you are aware of better methods and tools employed and documented elsewhere to help validate advanced materials and design engineering rigor for 2020-2025 vehicles, please suggest how they might be used to improve the study.
While it’s not made explicit in the report, it seems that the components are likely modeled with the materials in a zero-strain condition – i.e. the strain hardening and local change in properties that occurs during stamping is not considered in the properties of the components. While not widely used in crash modeling (as far as I am aware), including the effects of strain hardening on local properties from the stamping process is beginning to find use in some design tools. While none of the materials used in this study have extreme strain hardening properties (such as you might find in TRIP steels or 5000 series Al), all of these sheet materials will experience some change in properties during stamping. I do not consider the study deficient for having used zero-strain

105
components, but it may be worth undergoing a simple study to determine the potential effects on some of the components. This is complicated by the further changes that may occur during the paint bake cycle.
ADDITIONAL COMMENTS:
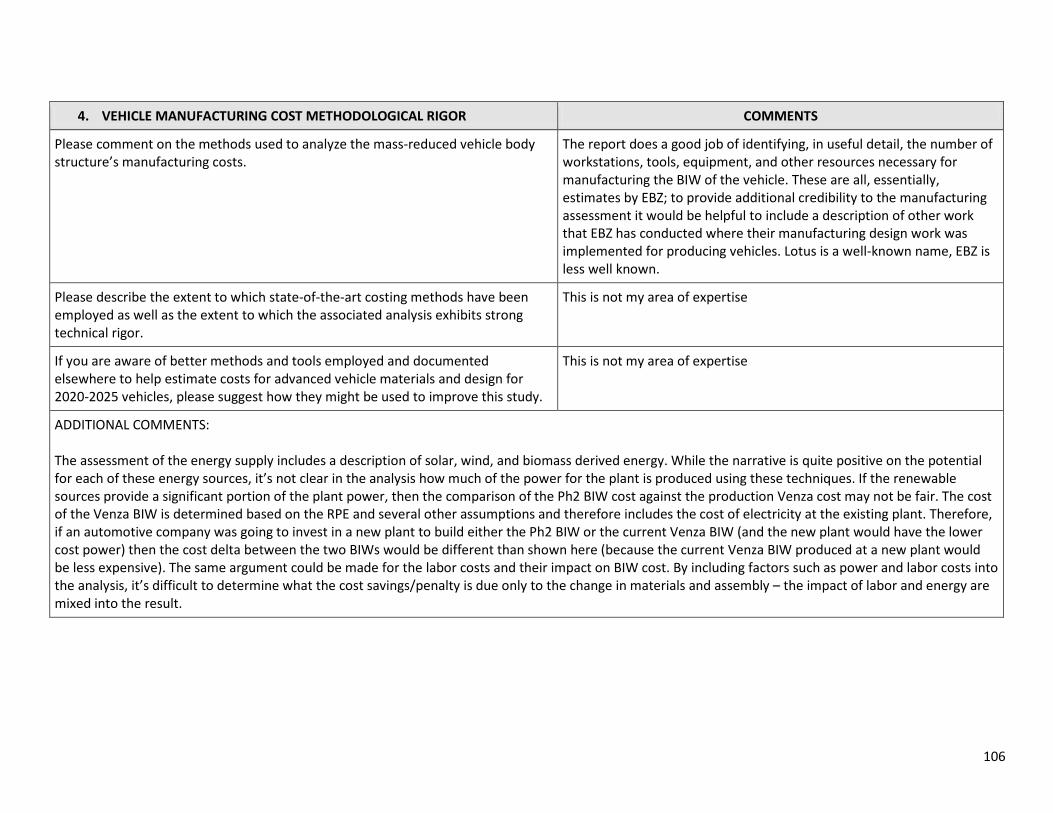
106
4. VEHICLE MANUFACTURING COST METHODOLOGICAL RIGOR COMMENTS
Please comment on the methods used to analyze the mass-reduced vehicle body structure’s manufacturing costs.
The report does a good job of identifying, in useful detail, the number of workstations, tools, equipment, and other resources necessary for manufacturing the BIW of the vehicle. These are all, essentially, estimates by EBZ; to provide additional credibility to the manufacturing assessment it would be helpful to include a description of other work that EBZ has conducted where their manufacturing design work was implemented for producing vehicles. Lotus is a well-known name, EBZ is less well known.
Please describe the extent to which state-of-the-art costing methods have been employed as well as the extent to which the associated analysis exhibits strong technical rigor.
This is not my area of expertise
If you are aware of better methods and tools employed and documented elsewhere to help estimate costs for advanced vehicle materials and design for 2020-2025 vehicles, please suggest how they might be used to improve this study.
This is not my area of expertise
ADDITIONAL COMMENTS: The assessment of the energy supply includes a description of solar, wind, and biomass derived energy. While the narrative is quite positive on the potential for each of these energy sources, it’s not clear in the analysis how much of the power for the plant is produced using these techniques. If the renewable sources provide a significant portion of the plant power, then the comparison of the Ph2 BIW cost against the production Venza cost may not be fair. The cost of the Venza BIW is determined based on the RPE and several other assumptions and therefore includes the cost of electricity at the existing plant. Therefore, if an automotive company was going to invest in a new plant to build either the Ph2 BIW or the current Venza BIW (and the new plant would have the lower cost power) then the cost delta between the two BIWs would be different than shown here (because the current Venza BIW produced at a new plant would be less expensive). The same argument could be made for the labor costs and their impact on BIW cost. By including factors such as power and labor costs into the analysis, it’s difficult to determine what the cost savings/penalty is due only to the change in materials and assembly – the impact of labor and energy are mixed into the result.

107
5. CONCLUSION AND FINDINGS COMMENTS
Are the study’s conclusions adequately backed up by the methods and analytical rigor of the study?
In the summary section there is an analysis that attempts to project the “potential weight savings” for vehicle classes beyond the Venza. The analysis is based on specific density which assumes that the architecture of the vehicles is the same. For example, the front-end crash energy management system in a micro car is likely quite different from the comparable system in a large luxury car (aside from differences in gauge to account for limited crash space, as discussed in the report). While this analysis provides a good starting point, I do not feel that it is reasonable to expect the weight reduction potential to scale with specific density. In other words, I think that the 32.4 value used in the analysis also changes with vehicle size due to changes in architecture. Similarly, the cost analysis projecting cost factor for other vehicle classes is a good start, but it’s unlikely that the numbers scale so simply.
Are the conclusions about the design, development, validation, and cost of the mass-reduced design valid?
Yes. Despite some of the critical commentary provided above, I believe that this study does a good job of validating the technical and cost potential of the mass-reduced design. The study is lacking durability analysis and, on a larger scale, does not include constructing a demonstration vehicle to validate the model assumptions; both items are significant undertakings and, while they would add credibility to the results, the current study provides a useful and sound indication of potential.
Are you aware of other available research that better evaluates and validates the technical potential for mass-reduced vehicles in the 2020-2025 timeframe?
The World Auto Steel Ultra Light Steel Auto Body, the EU SuperLight Car, and the DOE/USAMP Mg Front End Research and Development design all provide addition insight into weight reduction potential. However, none are as thorough as this study in assessing potential in the 2020-2025 timeframe.
ADDITIONAL COMMENTS:

108
6. OTHER POTENTIAL AREAS FOR COMMENT COMMENTS
Has the study made substantial improvements over previous available works in the ability to understand the feasibility of 2020-2025 mass-reduction technology for light-duty vehicles? If so, please describe.
Yes. The best example was the Phase 1 study, which lacked much of the detail and focus included here. The other studies that I mentioned above do not go into this level of detail or are not focused on the same time frame.
Do the study design concepts have critical deficiencies in its applicability for 2020-2025 mass-reduction feasibility for which revisions should be made before the report is finalized? If so, please describe.
There is nothing that I would consider a “critical deficiency” however many of the comments outlined above could be addressed prior to release of the report.
Are there fundamentally different lightweight vehicle design technologies that you expect to be much more common (either in addition to or instead of) than the one Lotus has assessed for the 2020-2025 timeframe?
Some effort was made in the report to discuss joining and corrosion protection techniques, however it is possible that new techniques will be available prior to 2025. For example, there was very little discussion on how a vehicle which combines so many different materials could be pre-treated, e-coated, and painted in an existing shop. There will likely be new technologies in this area.
Are there any other areas outside of the direct scope of the analysis (e.g., vehicle performance, durability, drive ability, noise, vibration, and hardness) for which the mass-reduced vehicle design is likely to exhibit any compromise from the baseline vehicle?
As discussed above, durability is a major factor in vehicle design and it is not addressed here. The use of advanced materials and joints calls into question the durability performance of a vehicle like this. NVH may also be unacceptable given the low density materials and extraordinary vehicle stiffness.
ADDITIONAL COMMENTS: Clallam county, WA is an interesting choice for the plant location (I grew up relatively nearby). Port Angeles is not a “major port” (total population <20,000 people) and access to the area from anywhere else in the state is inconvenient.
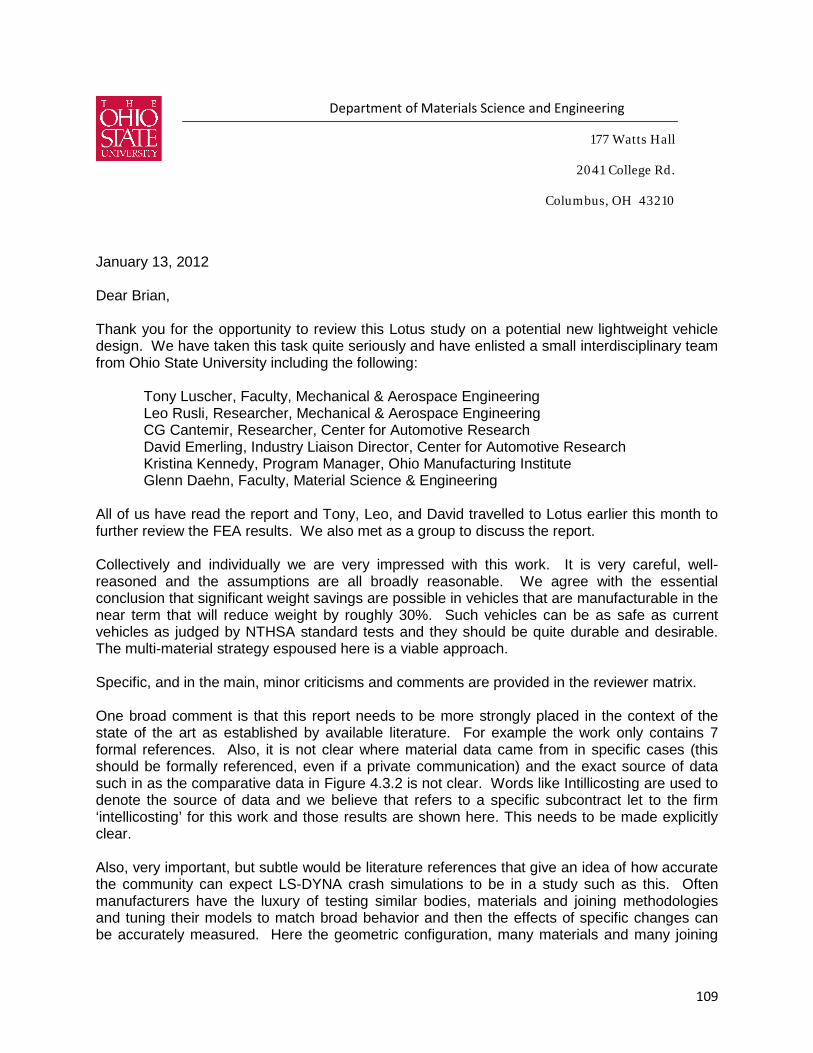
109
January 13, 2012 Dear Brian, Thank you for the opportunity to review this Lotus study on a potential new lightweight vehicle design. We have taken this task quite seriously and have enlisted a small interdisciplinary team from Ohio State University including the following:
Tony Luscher, Faculty, Mechanical & Aerospace Engineering Leo Rusli, Researcher, Mechanical & Aerospace Engineering CG Cantemir, Researcher, Center for Automotive Research David Emerling, Industry Liaison Director, Center for Automotive Research Kristina Kennedy, Program Manager, Ohio Manufacturing Institute Glenn Daehn, Faculty, Material Science & Engineering
All of us have read the report and Tony, Leo, and David travelled to Lotus earlier this month to further review the FEA results. We also met as a group to discuss the report. Collectively and individually we are very impressed with this work. It is very careful, well-reasoned and the assumptions are all broadly reasonable. We agree with the essential conclusion that significant weight savings are possible in vehicles that are manufacturable in the near term that will reduce weight by roughly 30%. Such vehicles can be as safe as current vehicles as judged by NTHSA standard tests and they should be quite durable and desirable. The multi-material strategy espoused here is a viable approach. Specific, and in the main, minor criticisms and comments are provided in the reviewer matrix. One broad comment is that this report needs to be more strongly placed in the context of the state of the art as established by available literature. For example the work only contains 7 formal references. Also, it is not clear where material data came from in specific cases (this should be formally referenced, even if a private communication) and the exact source of data such in as the comparative data in Figure 4.3.2 is not clear. Words like Intillicosting are used to denote the source of data and we believe that refers to a specific subcontract let to the firm ‘intellicosting’ for this work and those results are shown here. This needs to be made explicitly clear. Also, very important, but subtle would be literature references that give an idea of how accurate the community can expect LS-DYNA crash simulations to be in a study such as this. Often manufacturers have the luxury of testing similar bodies, materials and joining methodologies and tuning their models to match broad behavior and then the effects of specific changes can be accurately measured. Here the geometric configuration, many materials and many joining
177 Watts Hall
2041 College Rd.
Columbus, OH 43210
Department of Materials Science and Engineering

110
methods are essentially new. Can Lotus provide examples that show how accurate such ‘blind’ predictions may be? While this work does make a compelling case it downplays some of the very real issues that slow such innovation in auto manufacturing. Examples: multi-material structures can suffer accelerated corrosion if not properly isolated in joining. Fatigue may also limit durability in aluminum, magnesium or novel joints. Neither of these durability concerns are raised. Also, automotive manufacturing is very conservative in using new processes because one small process problem can stop an entire auto manufacturing plant. Manufacturing engineers may be justifiably weary of extensive use of adhesives, until these are proven in mass production in other environments. These very real impediments to change should be mentioned in the background and conclusions. Of course, there are many more details that must be considered for full vehicle production and innovation is hard. But this is an excellent motivation and vision for weight reduction. Overall, this is an outstanding piece of work that will move the automotive industry forward. We feel privileged to have had an advance look. Sincerely yours,
Glenn S. Daehn Mars G. Fontana Professor of Metallurgical Engineering Executive Director, Honda-OSU Partnership Director, Ohio Manufacturing Institute

111
Ohio State University (CG Cantemir, Glenn Daehn, David Emerling, Kristina Kennedy, Tony Luscher, Leo Rusli)
1. ASSUMPTIONS AND DATA SOURCES COMMENTS
Please comment on the validity of any data sources and assumptions embedded in the study’s material choices, vehicle design, crash validation testing, and cost assessment that could affect its findings.
Material data, for the most part, seems reasonably representative of what would be used in this type of automotive construction. Some of the materials are more prevalent in other industries like rail, than in automotive. Material specifications used in this report were nominal; however, reviewers would like to see min/max material specifications taken into consideration.
If you find issues with data sources and assumptions, please provide suggestions for available data that would improve the study.
References for all of the materials and adhesives would be very helpful.
ADDITIONAL COMMENTS: One broad comment is that this report needs to be more strongly placed in the context of the state of the art as established by available literature. For example the work only contains 7 formal references. Also, it is not clear where material data came from in specific cases (this should be formally referenced, even if a private communication) and the exact source of data such in as the comparative data in Figure 4.3.2 is not clear. Words like Intillicosting are used to denote the source of data and we believe that refers to a specific subcontract let to the firm ‘intellicosting’ for this work and those results are shown here. This needs to be made explicitly clear.

112
2. VEHICLE DESIGN METHODOLOGICAL RIGOR COMMENTS
Please comment on the methods used to analyze the materials selected, forming techniques, bonding processes, and parts integration, as well as the resulting final vehicle design.
More details are needed on the various aspects of joining and fastening. Comment on assembly.
Please describe the extent to which state-of-the-art design methods have been employed as well as the extent to which the associated analysis exhibits strong technical rigor.
In order to qualify for mass production, a process must be very repeatable. Figure 4.2.4.a shows the results from 5 test coupons. There are significant differences between all of these in peak strength and energy absorption. Such a spread of results would not be acceptable in terms of production.
If you are aware of better methods employed and documented elsewhere to help select and analyze advanced vehicle materials and design engineering rigor for 2020-2025 vehicles, please suggest how they might be used to improve this study.
No suggestions at this time.
ADDITIONAL COMMENTS:

113
3. VEHICLE CRASHWORTHINESS TESTING METHODOLOGICAL RIGOR. COMMENTS
Please comment on the methods used to analyze the vehicle body structure’s structural integrity and safety crashworthiness.
The crash simulations that were completed seem to be well created models of the vehicle that they represent. The geometry was formed from mid-surface models of the sheet metal. Seat belt and child restraint points are logically modeled.
Please describe the extent to which state-of-the-art crash simulation testing methods have been employed as well as the extent to which the associated analysis exhibits strong technical rigor.
Animations of all of the crash tests were reviewed. These models were checks for structural consistence and it was found that all parts were well attached. The deformation seen in the structure during crash seems representative of these types of collisions. Progressive deformation flows in a logical manner from the point of impact throughout the vehicle.
For reviewers with vehicle crash simulation capabilities to run the LS-DYNA model, can the Lotus design and results be validated?*
The actual LS-DYNA model crash simulations were not rerun. Without any changes to the inputs there would be no changes in the output. Discussion of the input properties occurs in Section 2.
If you are aware of better methods and tools employed and documented elsewhere to help validate advanced materials and design engineering rigor for 2020-2025 vehicles, please suggest how they might be used to improve the study.
LS-DYNA is the state of the art for this type of analysis. As time allows for the 2020-2025 model year, additional more detailed material modeling should occur. As an example the floor structure properties can be further investigated to answer structural creep and strength concerns.
ADDITIONAL COMMENTS: This reviewer sat down with the person who created and ran the LS-DYNA FEA models. Additional insight into how the model performs and specific questions were answered on specific load cases. All questions were answered. Another reviewer which did not visit Lotus commented on the following: 1. The powertrain has more than 15% of the vehicle mass and therefore the right powertrains should be used in simulation. 2. The powertrain is always mounted on the body by elastic mounts. The crash behavior of the elastic mounts might easy introduce a 10% error in determination of the peak deceleration (failure vs not failure might be much more than 10%). So modeling a close-to-reality powertrain and bushing looks like a must (at least for me).

114
3. Although not intuitive, the battery pack might have a worst crash behavior than the fuel tank. Therefore the shoulder to shoulder position might be inferior to a tandem configuration (with the battery towards the center of the vehicle). 4. The battery pack crash behavior is of high importance of its own. It is very possible that after a crash an internal collapse of the cells and/or a penetration might produce a short-circuit. It should be noted that by the time of writing there are not developed any reasonable solutions to mitigate an internal short-circuit. Although not directly life treating, this kind of event will produce a vehicle loss. Also, very important, but subtle would be literature references that give an idea of how accurate the community can expect LS-DYNA crash simulations to be in a study such as this. Often manufacturers have the luxury of testing similar bodies, materials and joining methodologies and tuning their models to match broad behavior and then the effects of specific changes can be accurately measured. Here the geometric configuration, many materials and many joining methods are essentially new. Can Lotus provide examples that show how accurate such ‘blind’ predictions may be?
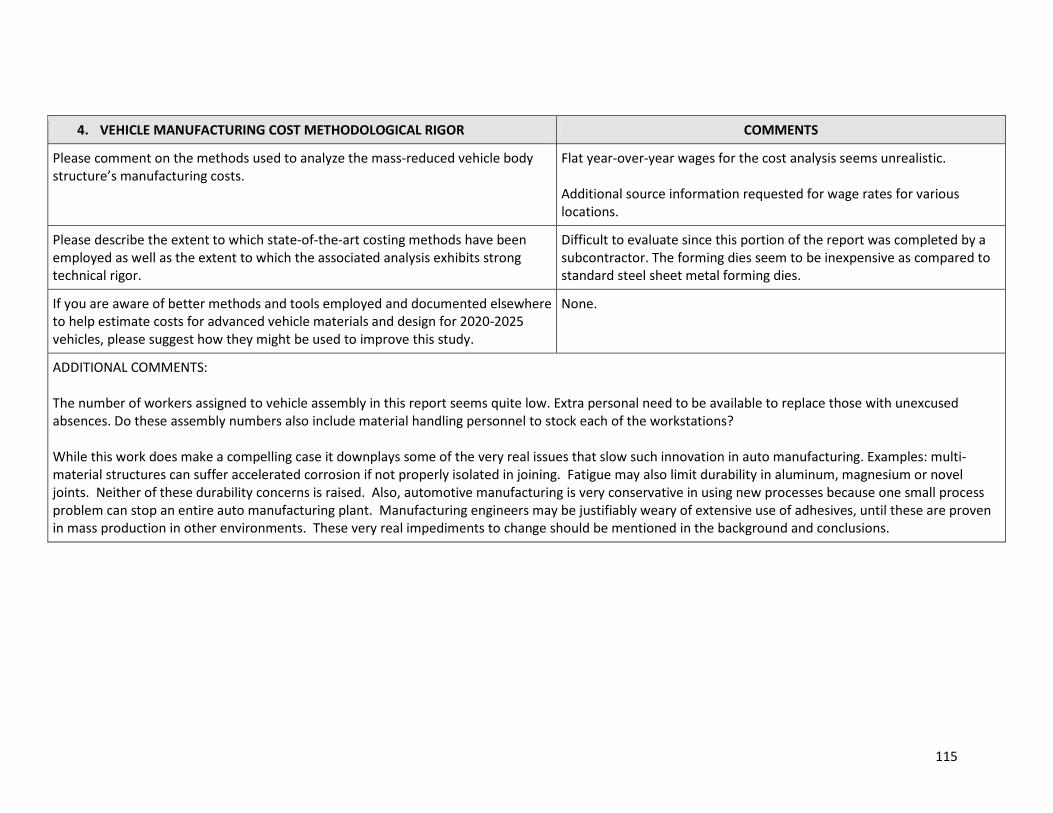
115
4. VEHICLE MANUFACTURING COST METHODOLOGICAL RIGOR COMMENTS
Please comment on the methods used to analyze the mass-reduced vehicle body structure’s manufacturing costs.
Flat year-over-year wages for the cost analysis seems unrealistic. Additional source information requested for wage rates for various locations.
Please describe the extent to which state-of-the-art costing methods have been employed as well as the extent to which the associated analysis exhibits strong technical rigor.
Difficult to evaluate since this portion of the report was completed by a subcontractor. The forming dies seem to be inexpensive as compared to standard steel sheet metal forming dies.
If you are aware of better methods and tools employed and documented elsewhere to help estimate costs for advanced vehicle materials and design for 2020-2025 vehicles, please suggest how they might be used to improve this study.
None.
ADDITIONAL COMMENTS: The number of workers assigned to vehicle assembly in this report seems quite low. Extra personal need to be available to replace those with unexcused absences. Do these assembly numbers also include material handling personnel to stock each of the workstations? While this work does make a compelling case it downplays some of the very real issues that slow such innovation in auto manufacturing. Examples: multi-material structures can suffer accelerated corrosion if not properly isolated in joining. Fatigue may also limit durability in aluminum, magnesium or novel joints. Neither of these durability concerns is raised. Also, automotive manufacturing is very conservative in using new processes because one small process problem can stop an entire auto manufacturing plant. Manufacturing engineers may be justifiably weary of extensive use of adhesives, until these are proven in mass production in other environments. These very real impediments to change should be mentioned in the background and conclusions.
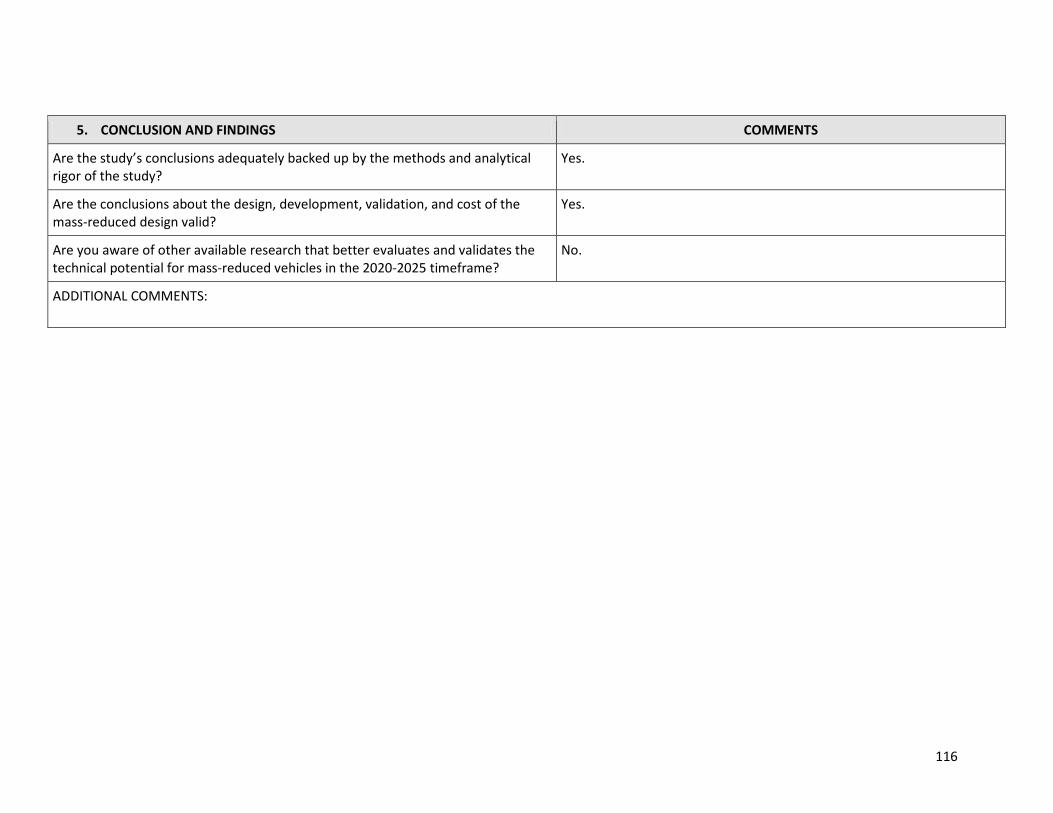
116
5. CONCLUSION AND FINDINGS COMMENTS
Are the study’s conclusions adequately backed up by the methods and analytical rigor of the study?
Yes.
Are the conclusions about the design, development, validation, and cost of the mass-reduced design valid?
Yes.
Are you aware of other available research that better evaluates and validates the technical potential for mass-reduced vehicles in the 2020-2025 timeframe?
No.
ADDITIONAL COMMENTS:

117
6. OTHER POTENTIAL AREAS FOR COMMENT COMMENTS
Has the study made substantial improvements over previous available works in the ability to understand the feasibility of 2020-2025 mass-reduction technology for light-duty vehicles? If so, please describe.
Yes.
Do the study design concepts have critical deficiencies in its applicability for 2020-2025 mass-reduction feasibility for which revisions should be made before the report is finalized? If so, please describe.
No.
Are there fundamentally different lightweight vehicle design technologies that you expect to be much more common (either in addition to or instead of) than the one Lotus has assessed for the 2020-2025 timeframe?
No.
Are there any other areas outside of the direct scope of the analysis (e.g., vehicle performance, durability, drive ability, noise, vibration, and hardness) for which the mass-reduced vehicle design is likely to exhibit any compromise from the baseline vehicle?
The proposed engine size is based on the assumption that decreasing the mass of the vehicle and holding the same power–to-weight ratio will keep the vehicle performances alike. This assumption is true only if the coefficient of drag (Cda) will also decrease (practically a perfect match in all the dynamic regards is not possible because the quadratic behavior of the air vs speed). The influence of the airdrag is typically higher than the general perception. In this particular case is very possible that more than half of the engine power will be used to overcome the airdrag at 65 mph. Therefore aerodynamic simulations are mandatory in order to validate the size of the engine.
ADDITIONAL COMMENTS: The Lotus design is very innovative and pushes the design envelope much further than other advanced car programs. The phase 1 report shows a great deal of topological innovation for the different components that are designed.

118
Douglas Richman, Kaiser Aluminum
1. ASSUMPTIONS AND DATA SOURCES COMMENTS
Please comment on the validity of any data sources and assumptions embedded in the study’s material choices, vehicle design, crash validation testing, and cost assessment that could affect its findings.
Aluminum alloys and tempers selected and appropriate and proven for the intended applications. Engineering data used for those materials and product forms accurately represent minimum expected minimum expected properties normally used for automotive design purposes. Simulation results indicate a vehicle utilizing the PH 2 structure is potentially capable of meeting FMVSS requirements. Physical test results have not been presented to confirm model validity, some simulation results indicate unusual structural performance and the models do not address occupant loading conditions which are the FMVSS validation criteria. Simulation results alone would not be considered “validation” of PH 2 structure safety performance. Cost estimates for the PH 2 vehicle are questionable. Cost modeling methodology relies on engineering estimates and supplier cost projections. The level of analytical rigor in this approach raises uncertainties about resulting cost estimates. Inconsistencies in reported piece count differences between baseline and PH 2 structures challenge a major reported source of cost savings. Impact of blanking recovery on aluminum sheet product net cost was explicitly not considered. Labor rates assumed for BIW manufacturing were $20/Hr below prevailing Toyota labor rate implicit in baseline Venza cost analysis. Cost estimates for individual stamping tool are substantially below typical tooling cost experienced for similar products. Impact of blanking recovery and labor rates alone would increase BIW cost by over $200.
If you find issues with data sources and assumptions, please provide suggestions for available data that would improve the study.
ADDITIONAL COMMENTS: Study includes an impressive amount of design, crash, and cost analysis information. The radical part count reduction needs to be more fully explained or de-emphasized. Report also should address the greatly reduced tooling and assembly costs relative to the experience of today's automakers. Some conservatism would be appropriate regarding potential shortcomings in interior design and aesthetics influencing customer expectations and acceptance.

119
2. VEHICLE DESIGN METHODOLOGICAL RIGOR COMMENTS
Please comment on the methods used to analyze the materials selected, forming techniques, bonding processes, and parts integration, as well as the resulting final vehicle design.
Adhesive bonding and FSW processes used in PH 2 have been proven in volume production and would be expected to perform well in this application. Some discussion of joining system for magnesium closure inner panels to aluminum external skin and AHSS “B” pillar to aluminum body would improve understanding and confidence in those elements of the design. Parts integration information is vague and appears inconsistent. Parts integration. Major mass and cost savings are attributed to parts integration. Data presented does not appear to results. Final design appears capable of meeting functional, durability and FMVSS requirements. Some increase in mass and cost are likely to resolve structure and NVH issues encountered in component and vehicle level physical testing.
Please describe the extent to which state-of-the-art design methods have been employed as well as the extent to which the associated analysis exhibits strong technical rigor.
Vehicle design methodology utilizing Opti-Struct, NASTRAN and LS-Dyna is represents a comprehensive and rigorous approach to BIW structural design and materials optimization.
If you are aware of better methods employed and documented elsewhere to help select and analyze advanced vehicle materials and design engineering rigor for 2020-2025 vehicles, please suggest how they might be used to improve this study.
ADDITIONAL COMMENTS:

120
3. VEHICLE CRASHWORTHINESS TESTING METHODOLOGICAL RIGOR. COMMENTS
Please comment on the methods used to analyze the vehicle body structure’s structural integrity and safety crashworthiness.
LS-Dyna and MSC-Nastran are current and accepted tools for this kind of analysis. FEM analysis is part art as well as science, the assumption had to be made that Lotus has sufficient skills and experience to generate a valid simulation model.
Please describe the extent to which state-of-the-art crash simulation testing methods have been employed as well as the extent to which the associated analysis exhibits strong technical rigor.
Model indicates the PH 2 structure could sustain a peak load of 108 kN under FMVSS 216 testing. This is unusually high for an SUV roof, and stronger than any roof on any vehicle produced to date. Result questions stiffness and strength results of the simulations. Intrusion velocities and deformation are used as performance criteria in the side impact simulations. Performance acceptability judgments made using those results, but no data was given for comparison to any other vehicle. Occupant protection performance cannot be judged based entirely on deformations and intrusion velocities. Report states that “the mass-reduced vehicle was validated for meeting the listed FMVSS requirements.” This is an overstatement of what the analysis accomplished. FMVSS test performance is judged based on crash dummy accelerations and loads. The FEM analysis looked only at BIW acceleration and intrusion levels. While these can provide a good basis for engineering judgment, no comparison to physical crash test levels is provided. “Acceptable” levels were defined by Lotus without explanation. Results may be good, but would not be sufficient to “validate” the design for meeting FMVSS requirements. Model has not been validated against any physical property. In normal BIW design development, an FEM is developed and calibrated against a physical test. The calibrated model is considered validated for moderate A:B comparisons.
For reviewers with vehicle crash simulation capabilities to run the LS-DYNA model, Some validation can be done by reviewing modeling technique and

121
can the Lotus design and results be validated?* assumptions, but without any form of physical test comparison, the amount of error is unknown and can be significant. FEM validation was presented in the form of an energy balance for each load case. Energy balance is useful in confirming certain internal aspects of the model are working correctly. Energy balance does not validate how accurately the model simulates the physical structure. Presenting energy balance for each load case and suggesting balance implies FEM accuracy is misleading.
If you are aware of better methods and tools employed and documented elsewhere to help validate advanced materials and design engineering rigor for 2020-2025 vehicles, please suggest how they might be used to improve the study.
Cannot truly be validated without building a physical prototype for comparison.
ADDITIONAL COMMENTS: Study is very thorough in their crash loadcase selections and generated a lot of data for evaluation. Might have included IIHS Offset ODB and IIHS Side Impact test conditions which most OEM's consider. Study is less thorough in analyzing normal loads that influence BIW and chassis design (i.e. pot holes, shipping, road load fatigue, curb bump, jacking, twist ditch, 2g bump, etc.). Report indicates “Phase 2 vehicle model was validated for conforming to the existing external data for the Toyota Vensa, meeting best-in-class torsional and bending stiffness, and managing customary running loads.” Only torsional stiffness is reported.
Modal frequency analysis data Is not reported. Conclusions for many of the crash load cases (primarily dynamic) did not use simulation results to draw quantitative comparisons to the Toyota Vensa or other peer vehicles. For instance, intrusion velocities for side impacts are reported. But, no analytical comparison is made to similar vehicles that currently meet the requirements. Comparable crash tests is often available from NHTSA or IIHS. Remarkable strength exhibited by the FEM roof under an FMVSS test load raises questions validity of the model. Model assumes no failures of adhesive bonding in materials during collisions. Previous crash testing experience suggest some level of bonding separation and resulting structure strength reduction is likely to occur.

122
4. VEHICLE MANUFACTURING COST METHODOLOGICAL RIGOR COMMENTS
Please comment on the methods used to analyze the mass-reduced vehicle body structure’s manufacturing costs.
Notable strengths of this analysis, besides the main focus on crash analysis, are the detail of assembly facility design, labor content, and BIW component tooling identification. Main weakness of the cost analysis is the fragmented approach of comparing costs derived in different approaches and different sources, and trying to infer relevant information from these differences.
Please describe the extent to which state-of-the-art costing methods have been employed as well as the extent to which the associated analysis exhibits strong technical rigor.
Vulnerability in this cost study appears to be validity and functional equivalence of BIW design with 169 pieces vs. 407 for the baseline Venz. Total tooling investment of $28MM for the BIW not consistent with typical OEM production experience. BIW tooling of $150-200MM would not be uncommon for conventional BIW manufacturing. If significant parts reduction could be achieved, it would mean less tools, but usually larger and more complex ones, requiring larger presses and slower cycle times.
If you are aware of better methods and tools employed and documented elsewhere to help estimate costs for advanced vehicle materials and design for 2020-2025 vehicles, please suggest how they might be used to improve this study.
Applying a consistent costing approach to each vehicle and vehicle system using a manufacturing cost model approach. This approach would establish a more consistent and understandable assessment of cost impacts of vehicle mass reduction design and technologies.
ADDITIONAL COMMENTS:

123
5. CONCLUSION AND FINDINGS COMMENTS
Are the study’s conclusions adequately backed up by the methods and analytical rigor of the study?
FMVSS test performance conclusions are based on simulated results using an un-validated FE model. Accuracy of the model is unknown. Some simulation results are not typical of similar structures suggesting the model may not accurately represent the actual structure under all loading conditions.
Are the conclusions about the design, development, validation, and cost of the mass-reduced design valid?
Safety performance and cost conclusions are not clearly support by data provided.
Are you aware of other available research that better evaluates and validates the technical potential for mass-reduced vehicles in the 2020-2025 timeframe?
Most studies employing a finite element model validate a base model against physical testing, then do variational studies to look at effect. Going directly from an unvalidated FEM to quantitative results is risky, and the level of accuracy is questionable
ADDITIONAL COMMENTS:

124
6. OTHER POTENTIAL AREAS FOR COMMENT COMMENTS
Has the study made substantial improvements over previous available works in the ability to understand the feasibility of 2020-2025 mass-reduction technology for light-duty vehicles? If so, please describe.
Fundamental engineering work is very good and has the potential to make a substantial and important contribution to industry understanding of mass reduction opportunities. The study will receive intense and detailed critical review by industry specialists. To achieve potential positive impact on industry thinking, study content and conclusions must be recognized as credible. Unusual safety simulation results and questionable cost estimates (piece cost, tooling) need to be explained or revised. As currently presented, potential contributions of the study are likely to be obscured by unexplained simulation results and cost estimates that are not consistent with actual program experience.
Do the study design concepts have critical deficiencies in its applicability for 2020-2025 mass-reduction feasibility for which revisions should be made before the report is finalized? If so, please describe.
Absolutely. Recommended adjustments summarized in Safety analysis, and cost estimates (recommendations summarized in attached review report). Credibility of study would be significantly enhanced with detail explanations or revisions in areas where unusual and potentially dis-crediting results are reported. Conservatism in assessing CAE based safety simulations and cost estimates (component and tooling) would improve acceptance of main report conclusions. Impact of BIW plant site selection discussion and resulting labor rates confuse important assessment of design driven cost impact. Suggest removing site selection discussion. Using labor and energy cost factors representative of the Toyota Venza production more clearly identifies the true cost impact of PH 2 design content.
Are there fundamentally different lightweight vehicle design technologies that you expect to be much more common (either in addition to or instead of) than the one Lotus has assessed for the 2020-2025 timeframe?
Technologies included in the PH 2 design are the leading candidates to achieve safe cost effective vehicle mass reduction in the 2020-25 timeframe. Most technologies included in PH 2 are in current volume production or will be fully production ready by 2015.
Are there any other areas outside of the direct scope of the analysis (e.g., vehicle performance, durability, drive ability, noise, vibration, and hardness) for which the mass-reduced vehicle design is likely to exhibit any compromise from the baseline vehicle?
Most areas of vehicle performance other than crash performance were not addressed at all. Even basic bending stiffness and service loads (jacking, towing, 2-g bump, etc) were not addressed. The report claims to address bending stiffness and bending/torsional modal frequencies, but that analysis is not included in the report.

125
Please provide any comments not characterized in the tables above. State-of-the art in vehicle dynamic crash simulation can provide A/B comparisons and ranking of alternative designs, but cannot reliably produce accurate absolute results without careful correlation to crash results. CAE is effective in significantly reducing the need for hardware tests, making designs more robust, and giving guidance to select the most efficient and best performing design alternatives. OEM experience to date indicates CAE can reduce hardware and physical test requirements, but cannot eliminate the need for some level of crash load physical testing. Quasi-static test simulations show potential for eliminating most if not all hardware (FMVSS 216 etc.), simulations of FMVSS 208, 214, IIHS ODB and others still required several stages of hardware evaluation. Given the challenges of simulating the complex crash physics of a vehicle composed of advanced materials and fastening techniques, hardware testing would generally be considered necessarily to “validate” BIW structures for the foreseeable future.

126
Review of Lotus Engineering Study:
“Demonstrating the Safety and Crashworthiness of a 2020 Model-Year, Mass-Reduced Crossover Vehicle”
By: Douglas Richman (Kaiser Aluminum and The Aluminum Association)
This report is a review the 2011 Lotus report on design optimization of a mass reduced mass-reduced crossover sport utility vehicle based on the 2009 Toyota Venza. Objective of the study is to demonstrate the mass reduction potential of a practical vehicle engineered to meet or exceed FMVSS and IIHS safety performance criteria. Design effort included mass optimization of all vehicle systems. Study included extensive BIW and closures design optimization to exploit the maximum mass reduction potential from proven lite weight automotive materials and advanced manufacturing processes. Vehicle redesign included interior and chassis systems. All materials, manufacturing processes and purchased components included in the PH 2 vehicle design were judged by Lotus to be proven, cost effective and available for use on 2020 production vehicles. The PH 2 vehicle achieves a 31% (527 Kg) mass reduction compared to the baseline Venza. The 2011 Lotus study (PH 2) is a continuation of a 2010 Lotus study (PH 1) “An Assessment of Mass Reduction Opportunities for a 2017–2020 Model Year Vehicle Program”. BIW from PH 1 study was extensively redesigned to address safety performance and manufacturing issues. Mass reduced interior, chassis and suspension designs developed in PH 1 were carried-over to the PH 2 vehicle. A detailed BIW manufacturing plan with BIW manufacturing plant layout and capital plan was developed address multi-material BIW manufacturing requirements. PH 2 project includes cost projections for all design changes and a projection of complete vehicle production cost. Per direction from EPA, this report is a review of technologies utilized, methodologies employed, and validity of findings in the Lotus PH 2 study. Review comments were requested in six general areas:
(1) assumptions and data sources (2) vehicle design methodological rigor (3) vehicle crashworthiness testing methodological rigor (4) vehicle manufacturing cost methodological rigor (5) conclusions and findings (6) other comments

127
1.0 Summary of Review Comments 1.1 Summary – General
Engineering analysis is very thorough and reflects the vehicle engineering experience and know-how of the Lotus organization. Study presents a realistic perspective of achievable vehicle total vehicle mass reduction using available design optimization tools, practical light weight engineering materials an available manufacturing processes. Results of the study provide important insight into potential vehicle mass reduction generally achievable by 2020.
1.2 Summary – Conclusions
Report Conclusions overstate the level of design “validation” achievable utilizing state-of-the- art modeling techniques with no physical test of a representative structure. From the work in this study it is reasonable to conclude the PH 2 structure has the potential to pass FMVSS and IIHS safety criteria.
1.3 Summary – Mass Reduction
Majority of mass reduction concepts utilized are consistent with general industry trends. Mass reduction potential attributed to individual components appear reasonable and consistent with industry experience with similar components. As an advanced design concept study, the PH 2 project is a valuable and important piece of work. The PH 2 study did not include physical evaluation of a prototype vehicle or major vehicle sub system. Majority of the chassis and suspension content was derived from similar components for which there is extensive volume production experience. Some of the technologies included in the design are “speculative” and may not mature to production readiness or achieve projected mass reduction estimates by 2020. For those reasons, the PH 2 study is a “high side” estimate of practical overall vehicle mass reduction potential.
1.4 Summary – Safety
Major objective of this study is to “validate” safety performance of the PH 2 vehicle concept. Critical issue is the term “validate”. Simulation modeling and simulation tools used by Lotus are widely recognized as state-of-the-art. Lotus modeling skills are likely to among the best available in the global industry. Project scope did not include physical test of the structure to confirm model accuracy. Safety performance data presented indicates the current structure has the potential to meet all FMVSS criteria, but would not be generally considered sufficient to “validated” safety performance of the vehicle. Physical test
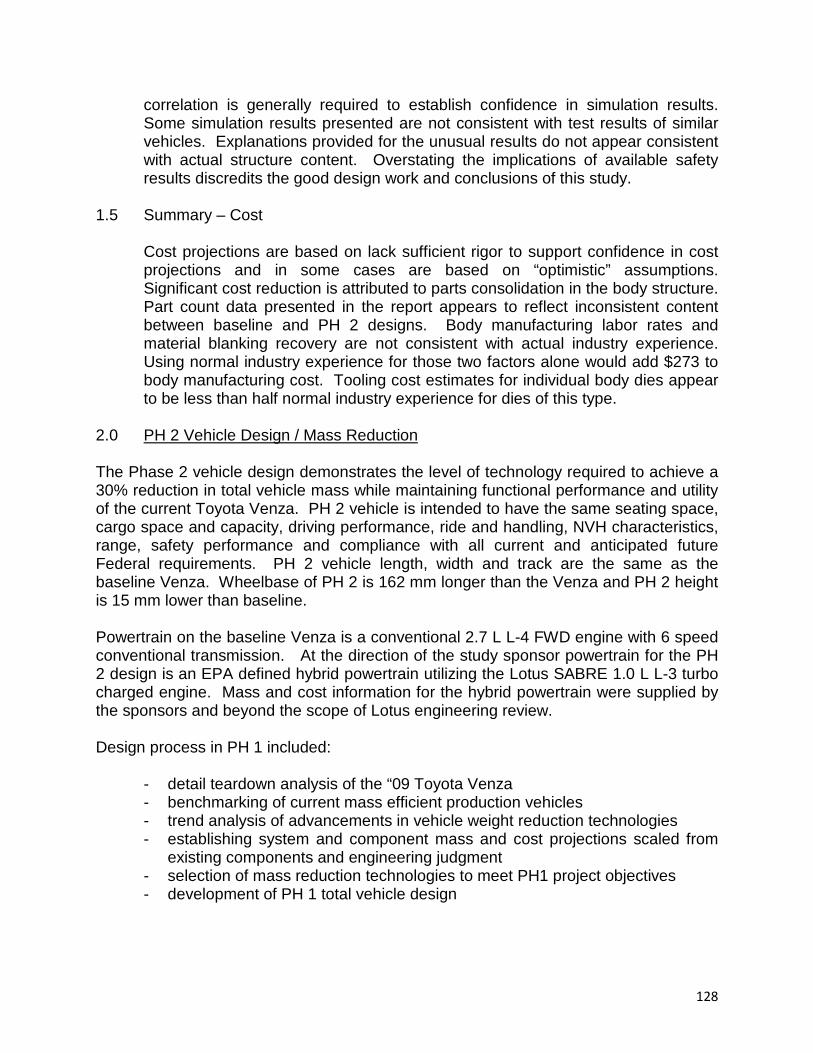
128
correlation is generally required to establish confidence in simulation results. Some simulation results presented are not consistent with test results of similar vehicles. Explanations provided for the unusual results do not appear consistent with actual structure content. Overstating the implications of available safety results discredits the good design work and conclusions of this study.
1.5 Summary – Cost
Cost projections are based on lack sufficient rigor to support confidence in cost projections and in some cases are based on “optimistic” assumptions. Significant cost reduction is attributed to parts consolidation in the body structure. Part count data presented in the report appears to reflect inconsistent content between baseline and PH 2 designs. Body manufacturing labor rates and material blanking recovery are not consistent with actual industry experience. Using normal industry experience for those two factors alone would add $273 to body manufacturing cost. Tooling cost estimates for individual body dies appear to be less than half normal industry experience for dies of this type.
2.0 PH 2 Vehicle Design / Mass Reduction The Phase 2 vehicle design demonstrates the level of technology required to achieve a 30% reduction in total vehicle mass while maintaining functional performance and utility of the current Toyota Venza. PH 2 vehicle is intended to have the same seating space, cargo space and capacity, driving performance, ride and handling, NVH characteristics, range, safety performance and compliance with all current and anticipated future Federal requirements. PH 2 vehicle length, width and track are the same as the baseline Venza. Wheelbase of PH 2 is 162 mm longer than the Venza and PH 2 height is 15 mm lower than baseline. Powertrain on the baseline Venza is a conventional 2.7 L L-4 FWD engine with 6 speed conventional transmission. At the direction of the study sponsor powertrain for the PH 2 design is an EPA defined hybrid powertrain utilizing the Lotus SABRE 1.0 L L-3 turbo charged engine. Mass and cost information for the hybrid powertrain were supplied by the sponsors and beyond the scope of Lotus engineering review. Design process in PH 1 included:
- detail teardown analysis of the “09 Toyota Venza - benchmarking of current mass efficient production vehicles - trend analysis of advancements in vehicle weight reduction technologies - establishing system and component mass and cost projections scaled from
existing components and engineering judgment - selection of mass reduction technologies to meet PH1 project objectives - development of PH 1 total vehicle design

129
Design process and tools (Opti-Struct, Nastran, LS-Dyna) are widely deployed within the automotive industry and represent a state-of-the-art approach to comprehensive vehicle design. Lotus Engineering recognized as experienced and eminently qualified for vehicle design engineering. For analysis purposes, Lotus decomposed the total vehicle into 10 major vehicle systems:
- Body structure (BIW) - Closures / fenders - Suspension / chassis - Bumpers - Interior - Electrical - Lighting - Glazing - Powertrain - Misc.
3.0 Mass Reduction Lotus examined each vehicle systems for weight reduction opportunities. PH 2 mass reduction by major vehicle system is summarized in Figure 1. Total mass reduction of 527 Kg, 31% of Venza mass was achieved. Systems with significant mass reduction are: BIW, Closures, Suspension/Chassis and Interior. Major sources of mass reduction are Chassis/Suspension (162 Kg), BIW (140 Kg), Interior (97 Kg), Closures (59 Kg).
Figure 1. Lotus PH 2 Venza
Mass Reduction by Vehicle System

130
3.1 Body-in-White (BIW) Current Toyota Venza body (BIW, closures) is predominantly a mix of mild steel (48%) and high strength steels (49%) with a resulting mass of 383 Kg (Figure 2). Extensive use of HSS in this structure is consistent with efficient use of current automotive materials to meet current vehicle mass objectives. BIW design has a dominant influence on vehicle safety performance and received the majority of Lotus engineering effort. For the PH 2 analysis, Lotus optimized the new BIW design for safety performance at minimum mass. The design optimization process resulted in a multi-material structure utilizing aluminum, steel, high strength steel, advanced high strength steel, magnesium and plastic composite. PH 2 BIW structure is predominantly aluminum (69%) with AHSS where appropriate to achieve strength requirements where available structure space is limited. A multi-material BIW solution for mass reduction is consistent with most recent vehicle optimization studies. Several current production vehicles utilize many of the design concepts included in the PH 2 BIW design. PH 2 BIW structure is 141 Kg (37%) lighter than the baseline Venza.
Figure 2. Figure 3. Baseline Venza BIW Lotus PH 2 Venza BIW Materials Materials Achieving a 37% BIW mass reduction with a multi material design optimized for safety performance is consistent with recent research and production vehicle experience. BIW mass reductions resulting from conversion of conventional BIW structures to aluminum based multi-material BIW have ranged from 35%-39% (Jaguar XJ, Audi A8) to 47% (OEM study). BIW related mass reductions above 40% were achieved where the baseline structure was predominantly mild steel. A recent University of Aachen (Germany) concluded BIW structures optimized for safety performance utilizing low mass engineering materials can achieve 35-40% mass reduction compared to a BIW optimized using conventional body materials. A recent BIW weight reduction study conducted at the University of Aachen (Germany)“.

131
http://www.eaa.net/en/applications/automotive/studies/
Most of the BIW content (materials, manufacturing processes) selected for the PH 2 vehicle have been in successful volume auto industry production for several years. 3.2 Closures/Fenders Mass reduction in the closure and fender group is 59 Kg, 41% of baseline Venza. This level of mass reduction is consistent with results of the Aachen and IBIS studies and industry experience on current production vehicles. Hood and fenders on the PH 2 vehicle are aluminum. Recent Ducker Worldwide Survey of 2012 North American Vehicles found over 30% of all North American vehicles have aluminum hoods and over 15% of vehicle have aluminum fenders. PH 2 use of aluminum for closure panels is consistent with recognized industry trends for these components. PH 2 doors utilize aluminum outer skins over cast magnesium inner panels. 3.3 Material properties Aluminum alloy and temper selection for BIW and Closures are appropriate for those components. Those materials have been used in automotive applications for several years and are growing in popularity in future vehicle programs. 3.3.1 Typical vs. Minimum properties - Automobile structural designs are typically based on minimum mechanical properties. Report does not identify the data used (minimum or typical). Aluminum property data used in for the PH 2 design represents expected minimum values for the alloys and tempers. This reviewer is not able to comment on property values used for the other materials used in the BIW. 3.3.2 Aluminum pre-treatment PH 2 vehicle structure utilizes adhesive bonding of major structural elements. Production vehicle experience confirms pre-treatment of sheet and extruded aluminum bonding surfaces is required to achieve maximum joint integrity and durability. PH 2 vehicle description indicates sheet material is anodized as a pre-treatment. From the report it is not clear that pretreatment is also applied to extruded elements. The majority of high volume aluminum programs in North America have moved away from electrochemical anodizing as a pre-treatment. Current practice is use of a more effective, lower cost and environmentally compatible chemical conversion process. These processes are similar to Alodine treatment. Predominant aluminum pre-treatments today are provided by Novelis (formerly Alcan Rolled Products) and Alcoa (Alcoa 951). Both processes achieve similar results and need to be applied to the sheet and extruded elements that will be bonded in assembly

132
3.4 Suspension and Chassis Suspension / chassis PH 2 mass reduction is 162 Kg (43% of baseline). This level of mass reduction is higher than has been seen in similar studies. Lotus PH 2 includes conversion of steering knuckles, suspension arms and the engine cradle to aluminum castings. Mass reductions estimated for conversion of those components are estimated at approximately 50%. Recent Ducker study found aluminum knuckles are currently used on over 50% of North American vehicles and aluminum control arms are used on over 30% of North American vehicles. Achieving 50% mass reduction through conversion of these components to aluminum is consistent with industry experience. 3.5 Wheel / Tire Total wheel and tire mass reduction of 64 Kg (46%) is projected for the wheel and tire group. Project mass reduction is achieved through a reduction in wheel and tire masses and elimination of the spare tire and tool kit. Tire mass reduction is made possible by a 30% reduction in vehicle mass. Projected tire mass reduction is 6 Kg for 4 tires combined. This mass reduction is consistent with appropriate tire selection for PH 2 vehicle final mass. Road wheel mass reduction is 5.6 Kg (54%) per wheel. It is not clear from the report how this magnitude of reduction is achieved. The report attributes wheel mass reduction to possibilities with the Ablation casting process. PH 1 report discussion of Ablation casting states: “The process would be expected to save approximately 1 Kg per wheel.” Considering the magnitude of this mass reduction a more detailed description of wheel mass reduction would be appropriate. Elimination of the spare tire and jack reduces vehicle mass by 23 Kg. This is feasible but has customer perceptions of vehicle utility implications. Past OEM initiatives to eliminate a spare tire have encountered consumer resistance leading to reinstatement of the spare system in some vehicles. 3.6 Engine and Driveline Engine and driveline for the PH 2 vehicle were defined by the study sponsors and not evaluated for additional mass reduction in the Lotus study. Baseline Venza is equipped with a technically comprehensive conventional 2.7 L4 with aluminum engine block and heads and conventional 6 speed transmission. PH 2 vehicle is equipped with a dual mode hybrid drive system powered by a turbocharged 1.0 L L-4 balance shaft engine. Engine was designed by Lotus and sized to meet the PH 2 vehicle performance and charging requirements. Mass reduction achieved with the PH 2 powertrain is 54 Kg. This level of mass reduction appears achievable based on results of secondary mass reductions resulting from vehicle level mass reductions in excess of 20%.

133
3.7 Interior Lotus PH 2 design includes major redesign of the baseline Venza interior. Interior design changes achieve 97 Kg (40%) weight reduction from the baseline interior. Majority of interior weight reduction is achieved in the seating (43 Kg) and trim (28 Kg). Interior weight reduction strategies in the PH 2 design represent significant departures from baseline Venza interior. New seating designs and interior concepts (i.e.: replacing carpeting with bare floors and floor mats) may not be consistent with consumer wants and expectations in those areas. Interior trim and seating designs used in the PH 2 vehicle have been explored generically by OEM design studios for many years. There may be customer acceptance issues that have 4.0 Safety Safety analysis of the PH2 structure is based on collision simulation results using LS-Dyna and Nastran software simulations. Both software packages are widely used throughout the automotive industry to perform the type of analysis in this report. Accuracy of simulated mechanical system performance is highly dependent on how well the FEM model represents the characteristics of the physical structure being studied. Accurately modeling a complete vehicle body structure for evaluation under non-linear loading conditions experienced in collisions is a challenging task. Small changes in assumed performance of nodes and joints can have a significant impact on predicted structure performance. Integration of empirical joint test data into the modeling process has significantly improved the correlation between simulated and actual structure performance. 4.1 Unusual simulation results Models appear reasonable and indicate the structure has the potential to meet collision safety requirements. Some unusual simulation results raise questions about detail accuracy of the models.
FMVSS 216 quasi-static roof strength Model indicates peak roof strength of 108 KN. This is unusually high strength for an SUV type vehicle. The report attributes this high strength to the major load being resisted by the B-pillar. Several current vehicles employ this construction but have not demonstrated roof strength at this level. The report indicates the requirement of 3X curb weight is reached within 20 mm which is typically prior to the test platen applying significant load directly into the b-pillar.
35 MPH frontal rigid barrier simulation
Report indicates the front tires do not contact the sill in a 35 MPH impact. This is highly unusual structural performance. Implications are the model or the structure is overly stiff.

134
Body torsional stiffness Torsional stiffness is indicated to be 32.9 kN/deg. Higher than any comparable vehicles listed in the report. PH 2 structure torsional stiffness is comparable to significantly more compact body structures like the Porsche Carrera, BMW 5 series, Audi A8. It is not clear what elements of the PH 2 structure contribute to achieving the predicted stiffness. Door beam modeling Door beams appear to stay tightly joined to the body structure with no tilting, twisting or separation at the lock attachments in the various side impact load modes. This is highly unusual structural behavior. No door opening deformation is observed in any frontal crash simulations. This suggests the door structure is modeled as an integral load path. FMVSS requires that doors are operable after crash testing. Door operability is nt addressed in the report.
4.2 Energy balance - is presented as validation of the FEM analysis. For each load case an energy balance is presented. Evaluating energy balance is a good engineering practice when modeling complex structures. Energy balance gives confidence in the mathematical fidelity of the model and that there are no significant mathematical instabilities in the calculations. Energy balance does not confirm model accuracy in simulating a given physical structure. 4.3 Model calibration Analytical models have the potential to closely represent complex non-liner structure performance under dynamic loading. With the current state of modeling technology, achieving accurate modeling normally requires calibration to physical test results of an actual structure. Models developed in this study have not been compared or calibrated to a physical test. While these simulations may be good representations of actual structure performance, the models cannot be regarded as validated without some correlation to physical test results. Project task list includes dynamic body structure modal analysis. Report Summary of Safety Testing Results” indicates the mass reduced body exhibits “best in class” torsional and bending stiffness. The report discusses torsional stiffness but there is no information on predicted bending stiffness. No data on modal performance data or analysis is presented. 4.4 Safety Conclusion A major objective of the PH 2 study is to “validate” the light weight vehicle structure for compliance with FMVSS requirements. State of the art FEM and dynamic simulations models were developed. Those models indicate the body structure has the potential to satisfy FMVSS requirements. FMVSS requirements for dynamic crash test performance is defined with respect to occupant loads and accelerations as measured using calibrated test dummies. The FEM simulations did not include interior, seats,

135
restraint systems or occupants. Analytical models in this project evaluate displacements, velocities, and accelerations of the body structure. Predicting occupant response based on body structural displacements velocities and accelerations is speculative. Simulation results presented are a good indicator of potential performance. These simulations alone would not be considered adequate validation the structure for FMVSS required safety performance. 5.0 Cost modeling Assessing cost implications of the PH 2 design a critically important element of the project. Total vehicle cost was derived form vehicle list price using estimated Toyota mark-up for overhead and profit. This process assumes average Toyota mark-up applies to Venza pricing. List price for specific vehicles is regularly influenced by business and competitive marketing factors. (Chevrolet Volt is believed to be priced significantly below GM corporate average margin on sales, while the Corvette is believed to be above target margin on sales.) System cost assumptions based on average sales margin and detailed engineering judgments can be a reasonable first order estimate. These estimates can be useful in allocation of relative to costs to individual vehicle systems, but lack sufficient rigor to support definitive cost conclusions Baseline Venza system costs were estimated by factoring estimated total vehicle cost and allocating relative cost factors for each major sub-system (BIW, closures, chassis, bumpers, suspension, …) based on engineering judgment. Cost of PH 2 purchased components were developed using a combination of estimated baseline vehicle system estimated costs, engineering judgment and supplier estimates. Cost estimates for individual purchased components appear realistic. Body costs for PH 2 design were estimated by combining scaled material content from baseline vehicle (Venza) and projected manufacturing cost from a new production processes and facility developed for this project. This approach is logical and practical, but lacks the rigor to support reliable estimates of new design cost implications when the design changes represent significant departures from the baseline design content. Body piece cost and tooling investment estimates were developed by Intgellicosting. No information was provided on Intellicosting methodology. Purchased component piece cost estimates (excluding BIW) are in line with findings in similar studies. Tooling costs supplied by Intellicosting are significantly lower than actual production experience would suggest. Assembly costs were based on detailed assembly plant design, work flow analysis and labor content estimates. Assembly plant labor content (minutes) is consistent with actual BIW experienced in other OEM production projects.

136
The PH 2 study indicates and aluminum based multi material body (BIW, closures) can be produced for at a cost reduction of $199 relative to a conventional steel body. That conclusion is not consistent with general industry experience. This inconsistency may result from PH 2 assumptions of material recovery, labor rates and pars consolidation. A recent study conducted by IBIS Associates “Aluminum Vehicle Structure: Manufacturing and Life Cycle Cost Analysis” estimated a cost increase $560 for an aluminum vehicle BIW and closures. http://aluminumintransportation.org/members/files/active/0/IBIS%20Powertrain%20Study%20w%20cover.pdf That study was conducted with a major high volume OEM vehicle producer and included part cost estimates using detailed individual part cost estimates. Majority of cost increases for the low mass body are offset by weight related cost reductions in powertrain, chassis and suspension components. Conclusions from the IBIS study are consistent with similar studies and production experience at other OEM producers. 5.1 BIW Design Integration Report identifies BIW piece count reduction from a baseline of 419 pieces to 169 for PH 2. Significant piece cost and labor cost savings are attributed to the reduction in piece count. Venza BOM lists 407 pieces in the baseline BIW. A total of 120 pieces are identified as having “0” weight and “0” cost. Another 47 pieces are listed as nuts or bolts. PH 2 Venza BOM lists no nuts or bolts and has no “0” mass/cost components. With the importance attributed to parts integration, these differences need to be addressed. Closure BOM for PH 2 appears to not include a number of detail components that are typically necessary in a production ready design. An example of this is the PH 2 hood. PH 2 Hood BOM lists 4 parts, an inner and outer panel and 2 hinges. Virtually all practical aluminum hood designs include 2 hinge bracket reinforcements, a latch support and a palm reinforcement. Absence of these practical elements of a production hood raise questions about the functional equivalency (mounting and reinforcement points, NVH, aesthetics,…) of the two vehicle designs. Contents of the Venza BOM should be reviewed for accuracy and content in the PH 2 BOM should be reviewed for practical completeness. 5.2 Tooling Investment Tooling estimates from Intellicosting are significantly lower than have been seen in other similar studies or production programs and will be challenged by most knowledgeable automotive industry readers. Intellicosting estimates total BIW tooling at $28MM in the tooling summary and $70 MM in the report summary. On similar production OEM programs complete BIW tooling has been in the range of $150MM to $200MM. The report attributes low tooling cost to parts consolidation. This does not appear to

137
completely explain the significant cost differences between PH 2 tooling and actual production experience. Parts consolidation typically results in fewer tools while increasing size, complexity and cost of tools used. The impact of parts consolidation on PH 2 weight and cost appears to be major. The report does not provide specific examples of where parts consolidation was achieved and the specific impact of consolidation. Considering the significant impact attributed to parts consolidation, it would be helpful provide specific examples of where this was achieved and the specific impact on mass, cost and tooling. Based on actual production experience, PH 2 estimates for plant capital investment, tooling cost and labor rates would be viewed as extremely optimistic 5.3 Material Recovery Report states estimates of material recovery in processing were not included in the cost analysis. Omitting this cost factor can have a significant impact on cost of sheet based aluminum products used in this study. Typical auto body panel blanking process recovery is 60%. This recovery rate is typical for steel and aluminum sheet. When evaluation material cost of an aluminum product the impact of recovery losses should be included in the analysis. Potential impact of material recovery for body panels: Approximate aluminum content (BIW, Closures) 240 Kg Input material required at 60% recovery 400 Kg Blanking off-all 160 Kg Devaluation of blanking off-all (rough estimate) Difference between raw material and Blanking off-all $1.30/Kg $ 211
Blanking devaluation increases cost of aluminum sheet products by over $ 0.90/Kg.
Appropriate estimates of blanking recoveries and material devaluation should be included in cost estimates for stamped aluminum sheet components. Recovery rates for steel sheet products are similar to aluminum, but the economic impact of steel sheet devaluation is a significantly lower factor in finished part cost per pound. Report indicates total cost of resistance spot welding (RSW) is 5X the cost of friction spot welding (FSW). Typical total body shop cost (energy, labor, maintenance, consumable tips) of a RSW is $0.05 - $0.10. For the stated ratio to be accurate, FSW total cost would be $0.01-$0.02 which appears unlikely. It is possible the 5X cost differential apply to energy consumption and not total cost.

138
5.4 Labor rates Average body plant labor rates used in BIW costing average $35 fully loaded. Current North American average labor rates for auto manufacturing (typically stamping, body production and vehicle assembly)
Toyota $55 GM $56 (including two tier) Ford $58 Honda $50 Nissan $47 Hyundai $44 VW $38
Labor rate of $35 may be achievable (VW) in some regions and circumstances. The issue of labor rate is peripheral to the central costing issue of this study which is assessing the cost impact of light weight engineering design. Method used to establish baseline BIW component costs inherently used current Toyota labor rates. Objective assessment of design impact on vehicle cost would use same labor rates for both configurations. Labor cost or BIW production is reported to be $108 using an average rate of $35. Typical actual BIW labor content from other cost studies with North American OEM’s found actual BIW labor content approaching $200. Applying the current Toyota labor rate of $55 to the PH 2 BIW production plan increases labor content to $170 (+$62) per vehicle. 6.0 General Editorial:
Report makes frequent reference to PH 1 vehicle LD and HD configurations. These references seem unnecessary and at times confusing. PH 1 study references do not enhance the findings or conclusions of the PH 2 study. Suggest eliminating reference to the PH 1 study. Report would be clearer if content detail from PH 1 project that is part of PH 2 project (interior, closure, chassis content) is fully reported in PH 2 report. Weight and Cost reduction references Baseline shifts between Total Vehicle and Total Vehicle Less Powertrain A consistent baseline may avoid confusion Suggest using total vehicle as reference Cost increases statements:
Report makes a number of cost references similar to:
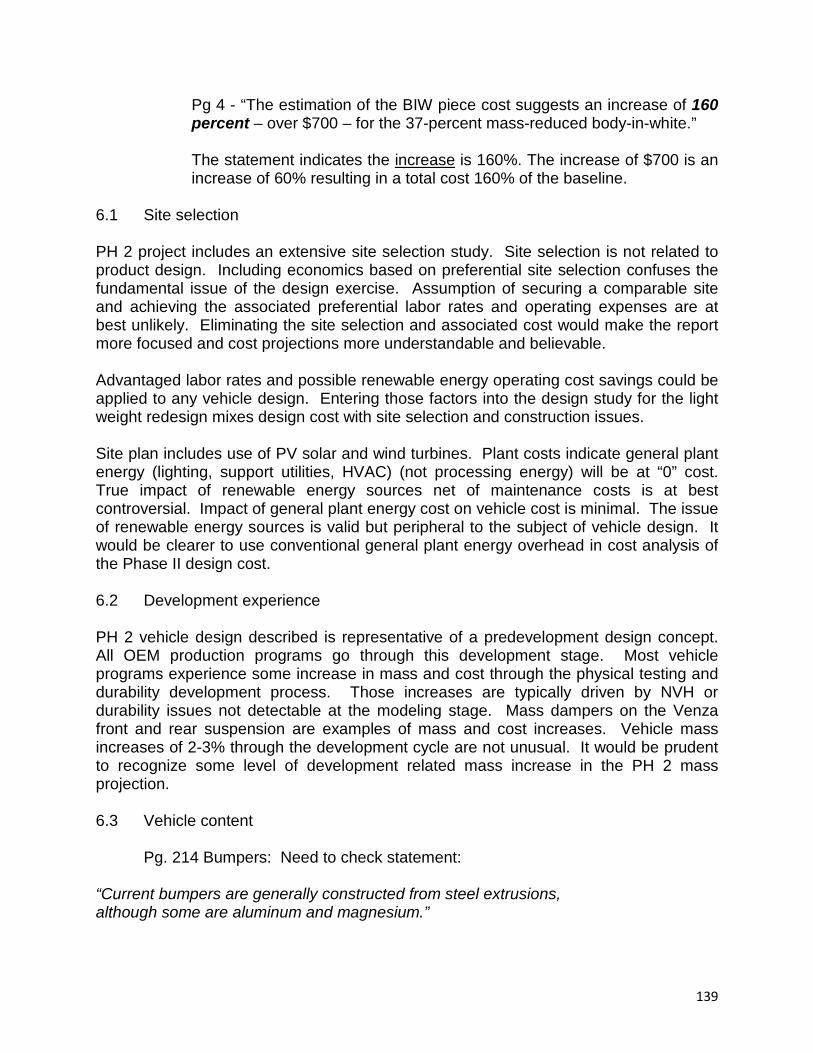
139
Pg 4 - “The estimation of the BIW piece cost suggests an increase of 160 percent – over $700 – for the 37-percent mass-reduced body-in-white.”
The statement indicates the increase is 160%. The increase of $700 is an increase of 60% resulting in a total cost 160% of the baseline.
6.1 Site selection PH 2 project includes an extensive site selection study. Site selection is not related to product design. Including economics based on preferential site selection confuses the fundamental issue of the design exercise. Assumption of securing a comparable site and achieving the associated preferential labor rates and operating expenses are at best unlikely. Eliminating the site selection and associated cost would make the report more focused and cost projections more understandable and believable. Advantaged labor rates and possible renewable energy operating cost savings could be applied to any vehicle design. Entering those factors into the design study for the light weight redesign mixes design cost with site selection and construction issues. Site plan includes use of PV solar and wind turbines. Plant costs indicate general plant energy (lighting, support utilities, HVAC) (not processing energy) will be at “0” cost. True impact of renewable energy sources net of maintenance costs is at best controversial. Impact of general plant energy cost on vehicle cost is minimal. The issue of renewable energy sources is valid but peripheral to the subject of vehicle design. It would be clearer to use conventional general plant energy overhead in cost analysis of the Phase II design cost. 6.2 Development experience PH 2 vehicle design described is representative of a predevelopment design concept. All OEM production programs go through this development stage. Most vehicle programs experience some increase in mass and cost through the physical testing and durability development process. Those increases are typically driven by NVH or durability issues not detectable at the modeling stage. Mass dampers on the Venza front and rear suspension are examples of mass and cost increases. Vehicle mass increases of 2-3% through the development cycle are not unusual. It would be prudent to recognize some level of development related mass increase in the PH 2 mass projection. 6.3 Vehicle content Pg. 214 Bumpers: Need to check statement: “Current bumpers are generally constructed from steel extrusions, although some are aluminum and magnesium.”
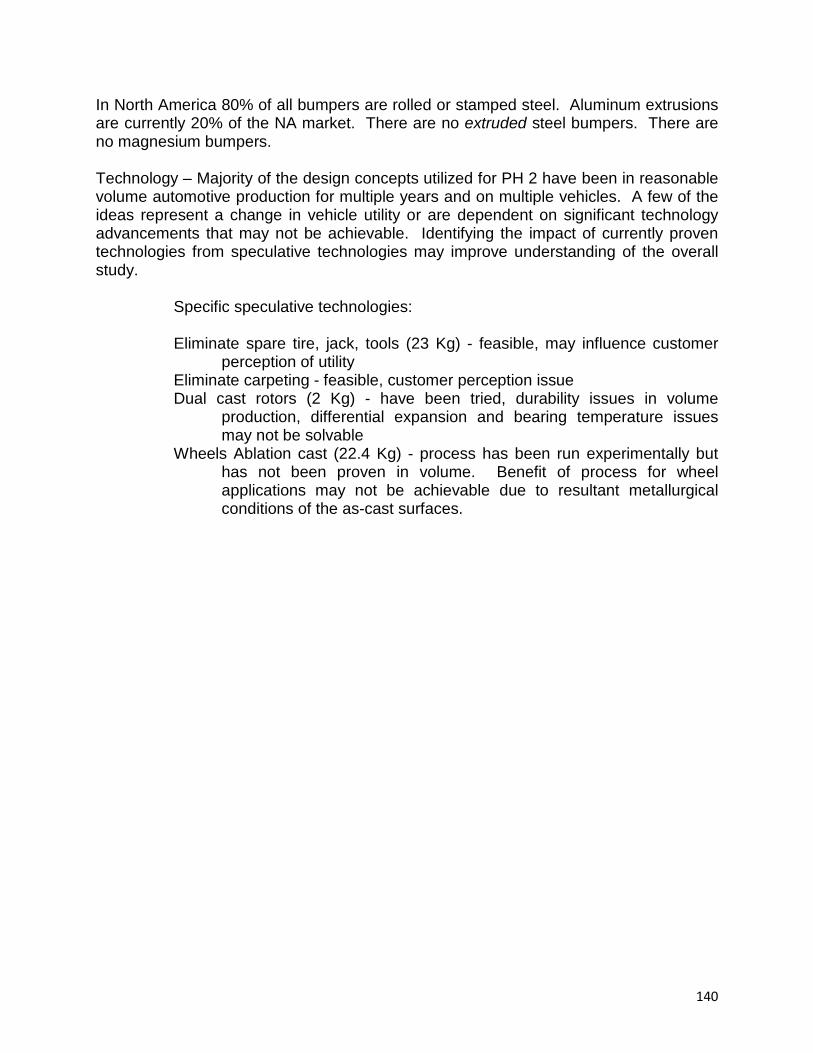
140
In North America 80% of all bumpers are rolled or stamped steel. Aluminum extrusions are currently 20% of the NA market. There are no extruded steel bumpers. There are no magnesium bumpers.
Technology – Majority of the design concepts utilized for PH 2 have been in reasonable volume automotive production for multiple years and on multiple vehicles. A few of the ideas represent a change in vehicle utility or are dependent on significant technology advancements that may not be achievable. Identifying the impact of currently proven technologies from speculative technologies may improve understanding of the overall study.
Specific speculative technologies:
Eliminate spare tire, jack, tools (23 Kg) - feasible, may influence customer
perception of utility Eliminate carpeting - feasible, customer perception issue Dual cast rotors (2 Kg) - have been tried, durability issues in volume
production, differential expansion and bearing temperature issues may not be solvable
Wheels Ablation cast (22.4 Kg) - process has been run experimentally but has not been proven in volume. Benefit of process for wheel applications may not be achievable due to resultant metallurgical conditions of the as-cast surfaces.

141
[Please Note: These comments are located immediately following the tables in Section. 3: Summary of Comments.]
Review of Lotus Engineering Study “Demonstrating the Safety and Crashworthiness of a 2020 Model-Year, Mass-Reduced Crossover Vehicle”
Srdjan Simunovic Oak Ridge National Laboratory [email protected]

142
[insert date] MEMORANDUM
SUBJECT: EPA Response to Comments on the peer review of Demonstrating the Safety and Crashworthiness of a 2020 Model-Year, Mass-Reduced Crossover Vehicle (Lotus Phase 2 Report)
FROM: Cheryl Caffrey, Assessment and Standards Division Office of Transportation and Air Quality, U.S. Environmental Protection Agency The Lotus Phase 2 Report was reviewed by William Joost (U.S. Department of Energy), CG Cantemir, Glenn Daehn, David Emerling, Kristina Kennedy, Tony Luscher, and Leo Rusli (The Ohio State University (OSU)), Douglas Richman (Kaiser Aluminum), and Srdjan Simunovic (Oak Ridge National Laboratory). In addition, Srdjan Simunovic and members of the OSU Team reviewed various elements of the associated LS-DYNA modeling. This memo includes a compilation of comments prepared by SRA International and responses and actions in response to those comments from EPA.

143
1. ASSUMPTIONS AND DATA SOURCES
COMMENTS
Please comment on the validity of any data sources and assumptions embedded in the study’s material choices, vehicle design, crash validation testing, and cost assessment that could affect its findings.
[Joost] The accuracy of the stress-strain data used for each material during CAE and crash analysis is critically important for determining accurate crash response. The sources cited for the material data are credible; however the Al yield stresses used appear to be on the high side of the expected properties for the alloy-temper systems proposed here. The authors may need to address the use of the slightly higher numbers (for example, 6061-T6 is shown with a yield stress of 308 MPa, where standard reported values are usually closer to 275 MPa). [Richman] Aluminum alloys and tempers selected and appropriate and proven for the intended applications. Engineering data used for those materials and product forms accurately represent minimum expected minimum expected properties normally used for automotive design purposes. Simulation results indicate a vehicle utilizing the PH 2 structure is potentially capable of meeting FMVSS requirements. Physical test results have not been presented to confirm model validity, some simulation results indicate unusual structural performance and the models do not address occupant loading conditions which are the FMVSS validation criteria. Simulation results alone would not be considered “validation” of PH 2 structure safety performance. Cost estimates for the PH 2 vehicle are questionable. Cost modeling methodology relies on engineering estimates and supplier cost projections. The level of analytical rigor in this approach raises uncertainties about resulting cost estimates. Inconsistencies in reported piece count differences between baseline and PH 2 structures challenge a major reported source of cost savings. Impact of blanking recovery on aluminum sheet product net cost was explicitly not considered. Labor rates assumed for BIW manufacturing were $20/Hr below prevailing Toyota labor rate implicit in baseline Venza cost analysis. Cost estimates for individual stamping tool are substantially below typical tooling cost experienced for similar products. Impact of blanking recovery and labor rates alone would increase BIW cost by over $200. [OSU] Material data, for the most part, seems reasonably representative of what would be used in this type of automotive construction. Some of the materials are more prevalent in other industries like rail, than in automotive. Material specifications used in this report were nominal; however, reviewers would like to see min/max material specifications taken into consideration.

144
If you find issues with data sources and assumptions, please provide suggestions for available data that would improve the study.
[Joost] Materials properties describing failure are not indicated (with the exception of Mg, which shows an in-plane failure strain of 6%). It seems unlikely that the Al and Steel components in the vehicle will remain below the strain localization or failure limits of the material; it’s not clear how failure of these materials was determined in the models. The authors should indicate how failure was accounted for; if it was not, the authors will need to explain why the assumption of uniform plasticity throughout the crash event is valid for these materials. This could be done by showing that the maximum strain conditions predicted in the model are below the typical localization or failure limits of the materials (if that is true, anyway). Empirical determination of the joint properties was a good decision for this study. The author indicates that lap-shear tests demonstrated that failure occurred outside of the bond, and therefore adhesive failure was not included in the model. However, the joints will experience a variety of stress states that differ from lap-shear during a crash event. While not a major deficiency, it would be preferable to provide some discussion of why lap-shear results can be extended to all stress states for joint failure mode. Alternatively, the author could also provide testing data for other joint stress states such as bending, torsion, and cross tension. [Richman] No comment. [OSU] References for all of the materials and adhesives would be very helpful. [Simunovic] The overall methodology used by the authors of the Phase 2 study is fundamentally solid and follows standard practices from the crashworthiness engineering. Several suggestions are offered that may enhance the outcome of the study. Material Properties and Models Reduction of vehicle weight is commonly pursued by use of lightweight materials and advanced designs. Direct substitution of materials on a component level is possible only conceptually because of the other constraints stemming from the material properties, function of the component, its dimensions, packaging, etc. Therefore, one cannot decide on material substitutions solely on potential weight savings. In general, an overall re-design is required, as was demonstrated in the study under review. An overview of the recent lightweight material concept vehicle initiatives is given in Lutsey, Nicholas P., "Review of Technical Literature and Trends Related to Automobile Mass-Reduction Technology." Institute of Transportation Studies, University of California, Davis, Research Report UCD-ITS-RR-10-10 (2010). The primary body material for the baseline vehicle, 2009 Toyota Venza, is mild steel. Except for about 8% of Dual Phase steel with 590 MPa designation, everything else is the material which has been used in automobiles for almost a century and for which extensive design experience and manufacturing technologies exist. On the other hand, the High Development vehicle concept employs novel lightweight materials, many of which are still under development, such as Mg

145
alloys and fiber reinforced polymer matrix composites. These materials are yet to be used in large quantities in mass production automobiles. Their lack of market penetration is due not only to a higher manufacturing cost , but also due to an insufficient understanding, experience and characterization of their mechanical behavior. To compensate for these uncertainties, designers must use higher safety factors, which then often eliminate any potential weight savings. In computational modeling, these uncertainties are manifested by the lack of material performance data, inadequate constitutive models and a lack of validated models for the phenomena that was not of a concern when designing with the conventional materials. For example, mild steel components dissipate crash energy through formation of deep folds in which material can undergo strains over 100%. Both analytical [Jones, Norman, "Structural Impact", Cambridge University Press (1997).] and computational methods [Ted Belytschko, T., Liu, W.-K., Moran, B., "Nonlinear Finite Elements for Continua and Structures", Wiley (2000).] of the continuum mechanics are sufficiently developed to be able to deal with such configurations. On the other hand, Mg alloys, cannot sustain such large deformations and strain gradients and, therefore, require development of computational methods to model material degradation, fracturing, and failure in general. The material data for the vehicle model is provided in section 4.4.2. of the Phase 2 report. The stress-strain curves in the figures are most likely curves of effective plastic strain and flow stress for isotropic plasticity material constitutive models that use that form of data, such as the LS-DYNA ["LS-DYNA Keyword User's Manual", Livermore Software Technology Corporation (LSTC), version 971, (2010).] constitutive model number 24, named MAT_PIECEWISE_LINEAR_PLASTICITY. A list detailing the constitutive model formulation for each of the materials of structural significance in the study would help to clarify this issue. Also the design rationale for dimensioning and selection of materials for the main structural parts would help in understanding the design decisions made by the authors of the study. The included material data does not include strain rate sensitivity, so it is assumed that the strain rate effect was not considered. Strain rate sensitivity can be an important strengthening mechanism in metals. For hcp (hexagonal close-packed) materials, such as AM60, high strain rate may also lead to change in the underlying mechanism of deformation, damage evolution, failure criterion, etc. Data for strain rate tests can be found in the open source [http://thyme.ornl.gov/Mg_new], although the properties can vary considerably with material processing and microstructure. The source of material data in the study was often attributed to private communications. Those should be included in the report, if possible, or in cases when the data is available from documented source, such as reference ["Atlas of Stress-Strain Curves", 2nd Ed., ASM International (2002).], referencing can be changed. Properties for aluminum and steel were taken from publicly available sources and private communications and are within accepted ranges. Material Parameters and Model for Magnesium Alloy AM60 The mechanical response of Mg alloys involves anisotropy, anisotropic hardening, yield asymmetry, relatively low ductility, strain rate sensitivity, and significant degradation of effective properties due to the formation and growth of micro-defects under loading [Nyberg EA, AA Luo, K Sadayappan, and W Shi, "Magnesium for Future Autos." Advanced Materials & Processes 166(10):35-37 (2008).]. It has been shown, for example, that ductility of die-cast AM60 depends strongly on its

146
microstructure [Chadha, G; Allison, JE; Jones, JW, "The role of microstructure and porosity in ductility of die cast AM50 and AM60 magnesium alloys," Magnesium Technology 2004, pp. 181-186 (2004).], and, by extension, on the section thickness of the samples. In case when a vehicle component does not play a strong role in crash, its material model and parameters can be described with simple models, such as isotropic plasticity, with piecewise linear hardening curve. However, magnesium is extensively used across the High Development vehicle design [An Assessment of Mass Reduction Opportunities for a 2017-2020 Model Year Vehicle Program, Lotus Engineering Inc., Rev 006A, (2010).]. In Phase 1 report, magnesium is found in many components that are in the direct path of the frontal crash (e.g. NCAP test). Pages 40-42 of Phase 1 report show magnesium as material for front-end module (FEM), shock towers, wheel housing, dash panel, toe board and front transition member. The front transition member seems to be the component that provides rear support for the front chassis rail. However, in Phase 2 report, pages 35-37, shock towers and this component were marked as made out of aluminum. A zoomed section of the Figure 4.2.3.d from the Phase 2 report is shown in Figure 1. [See Simunovic Comments, p. 4.] The presumed part identified as the front transition member is marked with an arrow. These assignments were not possible to confirm from the crash model since the input files were encrypted. In any case, since Mg AM60 alloy is used in such important role for the frontal crash, a more detailed material model than the one implied by the graph on page 32 of Phase 2 report [1] would be warranted. More accurate failure model is needed, as well. The failure criteria in LS-DYNA [6] are mostly limited to threshold values of equivalent strains and/or stresses. However, combination of damage model with plasticity and damage-initiated failure would probably yield a better accuracy for AM60. Material Models for Composites Understanding of mechanical properties for material denoted as Nylon_45_2a (reference [1] page 33) would be much more improved if the constituents and fiber arrangement were described in more detail. Numbers 45 and 2 may be indicating +/- 450 fiber arrangement, however, a short addition of material configuration would eliminate unnecessary speculation. An ideal plasticity model of 60% limit strain for this material seems to be overly optimistic. Other composite models available in LS-DYNA may be a much better option. Joint Models Welded joints are modeled by variation of properties in the Heat Affected Zone (HAZ) and threshold force for cutoff strength. HAZs are relatively easy to identify in the model because their IDs are in 1,000,000 range as specified on page 21 of the report [1]. An example of the approach is shown in Figure 2 [See Simunovic Comments, p. 5.], where the arrows mark HAZs. This particular connection contains welds (for joining aluminum parts) and bolts (for joining aluminum and magnesium). HAZ properties were not given in the report and they could not be checked in the model due to encryption. The bolt model properties were described that it fails at 130 MPa (page 38 of the report [1]), which corresponds to the yield stress of

147
AM60. The importance of these joints cannot be overstated. They enforce stability of the axial deformation mode in the rails that in turn enables dissipation of the impact energy. The crash sequence of the connection between the front end module and the front rail is shown in Figure 3. [See Simunovic Comments, p. 6.] The cracks in the front end module (Figure 3.2) and the separation between the front end module and the front rail (Figure 3.3) are clearly visible. This zone experiences very large permanent deformations, as shown in Figure 4. [See Simunovic Comments, p. 6.] It is not clear from the simulations which failure criterion dominates the process. Is it the failure of the HAZ or is it the spot weld limit force or stress. Given the importance of this joint on the overall crash response, additional information about the joint sub-models would be very beneficial to a reader.
ADDITIONAL COMMENTS: [Richman] Study includes an impressive amount of design, crash, and cost analysis information. The radical part count reduction needs to be more fully explained or de-emphasized. Report also should address the greatly reduced tooling and assembly costs relative to the experience of today's automakers. Some conservatism would be appropriate regarding potential shortcomings in interior design and aesthetics influencing customer expectations and acceptance. [OSU] One broad comment is that this report needs to be more strongly placed in the context of the state of the art as established by available literature. For example the work only contains 7 formal references. Also, it is not clear where material data came from in specific cases (this should be formally referenced, even if a private communication) and the exact source of data such in as the comparative data in Figure 4.3.2 is not clear. Words like Intillicosting are used to denote the source of data and we believe that refers to a specific subcontract let to the firm ‘intellicosting’ for this work and those results are shown here. This needs to be made explicitly clear.

148
2. VEHICLE DESIGN METHODOLOGICAL RIGOR
COMMENTS
Please comment on the methods used to analyze the materials selected, forming techniques, bonding processes, and parts integration, as well as the resulting final vehicle design.
[Joost] While appropriate forming methods and materials appear to have been selected, a detailed description of the material selection and trade-off process is not provided. One significant exception is the discussion and tables regarding the replacement of Mg components with Al and steel components in order to meet crash requirements. Similarly, while appropriate joining techniques seem to have been used, the process for selecting the processes and materials is not clear. Additionally, little detail is provided on the joining techniques used here. A major technical hurdle in the implementation of multi-material systems is the quality, durability, and performance of the joints. Additional effort should be expended towards describing the joining techniques used here and characterizing the performance. [Richman] Adhesive bonding and FSW processes used in PH 2 have been proven in volume production and would be expected to perform well in this application. Some discussion of joining system for magnesium closure inner panels to aluminum external skin and AHSS “B” pillar to aluminum body would improve understanding and confidence in those elements of the design. Parts integration information is vague and appears inconsistent. Parts integration. Major mass and cost savings are attributed to parts integration. Data presented does not appear to results. Final design appears capable of meeting functional, durability and FMVSS requirements. Some increase in mass and cost are likely to resolve structure and NVH issues encountered in component and vehicle level physical testing. [OSU] More details are needed on the various aspects of joining and fastening. Comment on assembly.
Please describe the extent to which state-of-the-art design methods have been employed as well as the extent to which the associated analysis exhibits strong technical rigor.
[Joost] Design is a challenging process and the most important aspect is having a capable and experienced design team supporting the project; Lotus clearly meets this need and adds credibility to the design results. One area that is omitted from the analysis is durability (fatigue and corrosion) performance of the structure. Significant use of Al, Al joints, and multi-material joints introduces the potential for both fatigue and corrosion failure that are unacceptable in an automotive product. It would be helpful to include narrative describing the good durability performance of conventional (i.e. not Bentley, Ferrari, etc.) vehicles that use similar materials and joints in production without significant durability problems. In some cases, (say the weld-bonded Al-Mg joints), production examples do not exist so there should be an explanation of how these could meet durability requirements. [Richman] Vehicle design methodology utilizing Opti-Struct, NASTRAN and LS-Dyna is represents a comprehensive and

149
rigorous approach to BIW structural design and materials optimization. [OSU] In order to qualify for mass production, a process must be very repeatable. Figure 4.2.4.a shows the results from 5 test coupons. There are significant differences between all of these in peak strength and energy absorption. Such a spread of results would not be acceptable in terms of production. [Simunovic] The Phase 2 design study of the High Development vehicle considered large number of crash scenarios from the FMVSS and IIHS tests. The simulations show reasonable results and deformations. Energy measures show that models are stable and have no sudden spikes that would lead to instabilities. The discretization of the sheet material is primarily done by proportionate quadrilateral shell elements, with relatively few triangular elements. The mesh density is relatively uniform without large variations in element sizes and aspect ratios. However, in my opinion, there are two issues that need to be addressed. One is the modeling of material failure/fracture and the other is the design of the crush zone with respect to the overall stopping distance. While the former may be a part of proprietary technology, the latter issue should be added to the description in order to better understand the design at hand. Material Failure Models and Criteria One of the modeling aspects that is usually not considered in conventional designs is modeling of material fracture/failure. In the Phase 2 report [1] material failure is indicated only in AM60 although it may be reasonably expected in other materials in the model. Modeling of material failure in continuum mechanics is a fairly complex undertaking. In the current Lotus High Development model, material failure and fracture are apparently modeled by element deletion. In this approach, when a finite element reaches some failure criteria, the element is removed from simulations, which then allows for creation of free surfaces and volumes in the structure. This approach is notoriously mesh-dependent. It implies that the characteristic dimension for the material strain localization is of the size of the finite element where localization and failure happen to occur. Addition of the strain rate sensitivity to a material model can both improve fidelity of the material model, and as an added benefit, it can also help to regularize the response during strain localization. Depending on the amount of stored internal energy and stiffness in the deleted elements, the entire simulation can be polluted by the element deletion errors and become unstable. Assuming that only AM60 parts in the Lotus model have failure criterion, it would not be too difficult for the authors to describe it in more depth. Since AM60 is such a critical material in the design, perturbation of its properties, mesh geometry perturbations and different discretization densities, should be considered and investigate how do they affect the convergence of the critical measures, such as crash distances. A good illustration of the importance of the failure criteria is the response of the AM60 front end module during crash. This component is always in the top group of components ranked by the dissipated energy. Figure 5 [See Simunovic Comments, p. 7.] shows deformation of the front end module during the full frontal crash. Notice large cracks open in the mid span, on the sides, and punched out holes at the locations of the connection with the front rail and the shotgun. Mesh refinement study of this component would be interesting and could also indicate the

150
robustness of the design. Decision to design such a structurally important part out of Mg would be interesting to a reader. There are other components that also include failure model even though they are clearly not made out of magnesium nor are their failure criteria defined in the Phase 2 report. Figure 6 [See Simunovic Comments, p. 8.] shows the sequence of deformation of the front left rail as viewed from the right side of the vehicle. The axial crash of the front rails is ensured by their connection to the front end, rear S-shaped support and to the connections to the sub-frame. Figure 7 [See Simunovic Comments, p. 8.] shows the detail of the connectors between the left crush rail to the subframe. Tearing of the top of the support (blue) can be clearly observed in Figure 7. The importance of this connection for the overall response may warrant parametric studies for failure parameters and mesh discretization. Crash Performance of the High Development Vehicle Design From the safety perspective, the most challenging crash scenario is the full profile frontal crash into a flat rigid barrier. The output files for the NCAP 35 mph test were provided by Lotus Engineering and used for evaluation of the vehicle design methodological rigor. The two accelerometer traces from the simulation at the lower B-pillar locations are shown in Figure 8. [See Simunovic Comments, p. 9.] When compared with NHTSA test 6601, the simulation accelerometer and displacement traces indicate much shorter crush length than the baseline vehicle. When compared vehicle deformations before and after the crush, it becomes obvious where the deformation occurs. Figure 9 [See Simunovic Comments, p. 10.] shows the deformation of the front rail members. It can be seen that almost all deformation occurs in the space spanned by the front frame rails. As marked in Figure 1, the front transition member (or a differently named component in case my material assignment assumption was not correct), supports the front rail so that it axially crushed and dissipated as much energy, as possible. For that purpose, this front rail rear support was made extremely stiff and it does not appreciably deform during the crash (Figure 10). [See Simunovic Comments, p. 10.] It has internal reinforcing structure that has not been described in the report. These reinforcements enables it to reduce bending and axial deformations in order to provide steady support for the axial crush of the aluminum rail tube. This design decision reduces the possible crush zone and stopping distance to the distance between the front of the bumper and the front of the rail support (Figure 9). The effective crash length can be clearly seen in Figure 11. [See Simunovic Comments, p. 11.]
151
We can see from the above figure that the front rail supports undergo minimal displacements and that all the impact energy must be dissipated in a very short span. Figure 12 [See Simunovic Comments, p. 12.] shows the points of interest to determine the boundary of the crush zone, and an assumption that crash energy dissipation occurs ahead of the front support for the lower rail. Figure 13 [See Simunovic Comments, p. 12.] gives the history of the axial displacements for the two points above. At their maximum points, the relative reduction of their distance from the starting condition is 0.7 inches. Since the distance between the front of the rail support and the rocker remains practically unchanged during the test, we can reasonably assume that majority of the crash energy is dissipated in less than 22 inches. To quickly evaluate the feasibility of the proposed design, we can use the concept of the Equivalent Square Wave (ESW) ["Vehicle crashworthiness and occupant protection", American Iron and Steel Institute, Priya, Prasad and Belwafa, Jamel E., Eds. (2004).]. ESW assumes constant, rectangular, impact pulse for the entire length of the stopping distance (in our case equal to 22 in) from initial velocity (35 mph). ESW represents an equivalent constant rectangular shaped pulse to an arbitrary input pulse. In our case ESW is about 22 g. Sled tests and occupant model simulations indicate that crash pulses exceeding ESW of 20 g will have difficulties to satisfy FMVSS 208 crash dummy performance criteria [11]. For a flat front barrier crash of 35 mph and an ESW of 20 g, the minimum stopping distance is 24 in. Advanced restraint systems and early trigger airbags may need to be used in order to satisfy the injury criteria and provide sufficient ride down time for the vehicle occupants. The authors of the study do not elaborate on the safety indicators. I firmly believe that such a discussion would be very informative and valuable to a wide audience. On several places, the authors state values for average accelerations up to 30 ms from the impact, and average accelerations after 30 ms. When stated without a context, these numbers do not help the readers who are not versed in the concepts of crashworthiness. The authors most likely refer to the effectiveness time of the restraint systems. An overview of the concepts followed by a discussion of the occupant safety calculations for this particular design would be very valuable.
If you are aware of better methods employed and documented elsewhere to help select and analyze advanced vehicle materials and design engineering rigor for 2020-2025 vehicles, please suggest how they might be used to improve this study.
[Joost] No comment. [Richman] No comment. [OSU] No suggestions at this time.

152
ADDITIONAL COMMENTS: [Joost] This is a very thorough design process, undertaken by a very credible design organization (Lotus). There are a variety of design assumptions and trade-offs that were made during the process (as discussed above), but this would be expected for any study of this type. Having a design team from Lotus adds credibility to the assumptions and design work that was done here. Section 4.5.8.1 uses current “production” vehicles as examples for the feasibility of these techniques. However, many of the examples are for extremely high-end vehicles (Bentley, Lotus Evora, McLaren) and the remaining examples are for low-production, high-end vehicles (MB E class, Dodge Viper, etc.). The cost of some technologies can be expected to come down before 2020, but it is not reasonable to assume that (for example) the composites technologies used in Lamborghinis will be cost competitive on any time scale; significant advances in composite technology will need to be made in order to be cost competitive on a Venza, and the resulting material is likely to differ considerably (in both properties and manufacturing technique) from the Lamborghini grade material. [Richman] [1] Achieving a 37% BIW mass reduction with a multi material design optimized for safety performance is consistent with recent research and production vehicle experience. BIW mass reductions resulting from conversion of conventional BIW structures to aluminum based multi-material BIW have ranged from 35%-39% (Jaguar XJ, Audi A8) to 47% (OEM study). BIW related mass reductions above 40% were achieved where the baseline structure was predominantly mild steel. A recent University of Aachen (Germany) concluded BIW structures optimized for safety performance utilizing low mass engineering materials can achieve 35-40% mass reduction compared to a BIW optimized using conventional body materials. A recent BIW weight reduction study conducted at the University of Aachen (Germany)”. http://www.eaa.net/en/applications/automotive/studies/
Most of the BIW content (materials, manufacturing processes) selected for the PH 2 vehicle have been in successful volume auto industry production for several years. [2] Closures/Fenders: Mass reduction in the closure and fender group is 59 Kg, 41% of baseline Venza. This level of mass reduction is consistent with results of the Aachen and IBIS studies and industry experience on current production vehicles. Hood and fenders on the PH 2 vehicle are aluminum. Recent Ducker Worldwide Survey of 2012 North American Vehicles found over 30% of all North American vehicles have aluminum hoods and over 15% of vehicle have aluminum fenders. PH 2 use of aluminum for closure panels is consistent with recognized industry trends for these components. PH 2 doors utilize aluminum outer skins over cast magnesium inner panels. [3] Material properties: Aluminum alloy and temper selection for BIW and Closures are appropriate for those components. Those materials have been used in automotive applications for several years and are growing in popularity in future vehicle programs. [4] Typical vs. Minimum properties: Automobile structural designs are typically based on minimum mechanical properties. Report does not identify the data used (minimum or typical). Aluminum property data used in for the PH 2 design represents expected minimum values for the alloys and tempers. This reviewer is not able to comment on property values used for the other materials used in the BIW. [5] Aluminum pre-treatment: PH 2 vehicle structure utilizes adhesive bonding of major structural elements. Production vehicle experience confirms pre-

153
treatment of sheet and extruded aluminum bonding surfaces is required to achieve maximum joint integrity and durability. PH 2 vehicle description indicates sheet material is anodized as a pre-treatment. From the report it is not clear that pretreatment is also applied to extruded elements. The majority of high volume aluminum programs in North America have moved away from electrochemical anodizing as a pre-treatment. Current practice is use of a more effective, lower cost and environmentally compatible chemical conversion process. These processes are similar to Alodine treatment. Predominant aluminum pre-treatments today are provided by Novelis (formerly Alcan Rolled Products) and Alcoa (Alcoa 951). Both processes achieve similar results and need to be applied to the sheet and extruded elements that will be bonded in assembly [6] Suspension and Chassis: Suspension/chassis PH 2 mass reduction is 162 Kg (43% of baseline). This level of mass reduction is higher than has been seen in similar studies. Lotus PH 2 includes conversion of steering knuckles, suspension arms and the engine cradle to aluminum castings. Mass reductions estimated for conversion of those components are estimated at approximately 50%. Recent Ducker study found aluminum knuckles are currently used on over 50% of North American vehicles and aluminum control arms are used on over 30% of North American vehicles. Achieving 50% mass reduction through conversion of these components to aluminum is consistent with industry experience. [7] Wheel/Tire: Total wheel and tire mass reduction of 64 Kg (46%) is projected for the wheel and tire group. Project mass reduction is achieved through a reduction in wheel and tire masses and elimination of the spare tire and tool kit. Tire mass reduction is made possible by a 30% reduction in vehicle mass. Projected tire mass reduction is 6 Kg for 4 tires combined. This mass reduction is consistent with appropriate tire selection for PH 2 vehicle final mass. Road wheel mass reduction is 5.6 Kg (54%) per wheel. It is not clear from the report how this magnitude of reduction is achieved. The report attributes wheel mass reduction to possibilities with the Ablation casting process. PH 1 report discussion of Ablation casting states: “The process would be expected to save approximately 1 Kg per wheel.” Considering the magnitude of this mass reduction a more detailed description of wheel mass reduction would be appropriate. Elimination of the spare tire and jack reduces vehicle mass by 23 Kg. This is feasible but has customer perceptions of vehicle utility implications. Past OEM initiatives to eliminate a spare tire have encountered consumer resistance leading to reinstatement of the spare system in some vehicles. [8] Engine and Driveline: Engine and driveline for the PH 2 vehicle were defined by the study sponsors and not evaluated for additional mass reduction in the Lotus study. Baseline Venza is equipped with a technically comprehensive conventional 2.7 L4 with aluminum engine block and heads and conventional 6 speed transmission. PH 2 vehicle is equipped with a dual mode hybrid drive system powered by a turbocharged 1.0 L L-4 balance shaft engine. Engine was designed by Lotus and sized to meet the PH 2 vehicle performance and charging requirements. Mass reduction achieved with the PH 2 powertrain is 54 Kg. This level of mass reduction appears achievable based on results of secondary mass reductions resulting from vehicle level mass reductions in excess of 20%. [9] Interior: Lotus PH 2 design includes major redesign of the baseline Venza interior. Interior design changes achieve 97 Kg (40%) weight reduction from the baseline interior. Majority of interior weight reduction is achieved in the seating (43 Kg) and trim (28 Kg). Interior weight reduction strategies in the PH 2 design represent significant departures from baseline Venza interior. New seating designs and interior concepts (i.e.: replacing carpeting with bare floors and floor mats) may not be consistent with consumer wants and expectations in those areas. Interior trim and seating designs used in the PH 2 vehicle have been

154
explored generically by OEM design studios for many years. [10] Energy balance: Is presented as validation of the FEM analysis. For each load case an energy balance is presented. Evaluating energy balance is a good engineering practice when modeling complex structures. Energy balance gives confidence in the mathematical fidelity of the model and that there are no significant mathematical instabilities in the calculations. Energy balance does not confirm model accuracy in simulating a given physical structure.

155
3. VEHICLE CRASHWORTHINESS TESTING METHODOLOGICAL RIGOR.
COMMENTS
Please comment on the methods used to analyze the vehicle body structure’s structural integrity and safety crashworthiness.
[Joost] Regarding my comment on joint failure under complex stress states, note that in figure 4.3.12.a the significant plastic strains are all located at the bumper-rail joints. While this particular test was only to indicate the damage (and cost to repair), the localization of plastic strain at the joint is somewhat concerning. The total-vehicle torsional stiffness result is remarkably high. If this is accurate, it may contribute to an odd driving “feel”, particularly by comparison to a conventional Venza; higher torsional stiffness is usually viewed as a good thing, but the authors may need to address whether or not such extreme stiffness values would be appealing to consumers of this type of vehicle. While there doesn’t appear to be a major source of error in the torsional stiffness analysis, the result does call into question the accuracy; this is either an extraordinarily stiff vehicle, or there was an error during the analysis. [Richman] LS-Dyna and MSC-Nastran are current and accepted tools for this kind of analysis. FEM analysis is part art as well as science, the assumption had to be made that Lotus has sufficient skills and experience to generate a valid simulation model. [OSU] The crash simulations that were completed seem to be well created models of the vehicle that they represent. The geometry was formed from mid-surface models of the sheet metal. Seat belt and child restraint points are logically modeled.
Please describe the extent to which state-of-the-art crash simulation testing methods have been employed as well as the extent to which the associated analysis exhibits strong technical rigor.
[Joost] This is outside of my area of expertise [Richman] Model indicates the PH 2 structure could sustain a peak load of 108 kN under FMVSS 216 testing. This is unusually high for an SUV roof, and stronger than any roof on any vehicle produced to date. Result questions stiffness and strength results of the simulations. Intrusion velocities and deformation are used as performance criteria in the side impact simulations. Performance acceptability judgments made using those results, but no data was given for comparison to any other vehicle. Occupant protection performance cannot be judged based entirely on deformations and intrusion velocities. Report states that “the mass-reduced vehicle was validated for meeting the listed FMVSS requirements.” This is an

156
overstatement of what the analysis accomplished. FMVSS test performance is judged based on crash dummy accelerations and loads. The FEM analysis looked only at BIW acceleration and intrusion levels. While these can provide a good basis for engineering judgment, no comparison to physical crash test levels is provided. “Acceptable” levels were defined by Lotus without explanation. Results may be good, but would not be sufficient to “validate” the design for meeting FMVSS requirements. Model has not been validated against any physical property. In normal BIW design development, an FEM is developed and calibrated against a physical test. The calibrated model is considered validated for moderate A:B comparisons. [OSU] Animations of all of the crash tests were reviewed. These models were checks for structural consistence and it was found that all parts were well attached. The deformation seen in the structure during crash seems representative of these types of collisions. Progressive deformation flows in a logical manner from the point of impact throughout the vehicle. [Simunovic] The documented results in the study show that authors have employed current state-of-the-art for crashworthiness modeling and followed systematic technical procedures. This methodology led them through a sequence of model versions and continuous improvement of the fidelity of the models. I would suggest that a short summary be added describing the major changes of the Phase 2 design with respect to the original High Development vehicle body design.
For reviewers with vehicle crash simulation capabilities to run the LS-DYNA model, can the Lotus design and results be validated?*
[Joost] N/A [Richman] Some validation can be done by reviewing modeling technique and assumptions, but without any form of physical test comparison, the amount of error is unknown and can be significant. FEM validation was presented in the form of an energy balance for each load case. Energy balance is useful in confirming certain internal aspects of the model are working correctly. Energy balance does not validate how accurately the model simulates the physical structure. Presenting energy balance for each load case and suggesting balance implies FEM accuracy is misleading. [OSU] The actual LS-DYNA model crash simulations were not rerun. Without any changes to the inputs there would be no changes in the output. Discussion of the input properties occurs in Section 2. [Simunovic] The authors had several crash tests of the baseline vehicle, 2009 Toyota Venza, to use for comparison and trends. Tests 6601 and 6602 were conducted in 2009 so that they could be readily used for the development. The data from test 6601 was used in the Phase 2 report for comparison. Test 6602 was not used for comparison in the report. While the report abounds with crash simulations and graphs documenting tremendous amount of work that authors have done, it would have been very valuable to add comparison with the 6602 test even at the expense of some graphs. Page

157
72 of the Phase 2 report starts with comparison of the simulations with the tests and that is one of the most engaging parts of the document. I suggest that it warrants a section in itself. It is currently located out of place, in between the simulation results and it needs to be emphasized more. This new section would also be a good place for discussion on occupant safety modeling and general formulas for the subject. One of the intriguing differences between the simulations and baseline vehicle crash test is the amount and the type of deformation in the frontal crash. As noted previously, computational model is very stiff with very limited crush zone. Viewed from the left side (Figure 14) [See Simunovic Comments, p. 14.], and from below (Figure 15) [See Simunovic Comments, p. 15.], we can see that the majority of the deformation is in the frame rail, and that the subframe’s rear supports do not fail. The strong rear support to the frame rail, does not appreciably deform, and thereby establishes the limit to the crash deformation. The overall side kinematics of the crash is shown in Figure 16. [See Simunovic Comments, p. 15.] The front tires barely touch the wheel well indicating a high stiffness of the design. Note that the vehicle does not dive down at the barrier. The numbers 1-4 below the images denote times after impact of 0ms , 35ms, 40 ms, and 75ms, respectively. The times were selected based on characteristic event times observed in crash simulations. The following images are from the NHTSA NCAP crash test 7179 for 2011 Toyota Venza. The response is essentially the same as for the 2009 version, but the images are of much higher quality so that they have been selected for comparison. These times corresponding to the times in Figures 15 and 16 are shown in Figure 17. [See Simunovic Comments, p. 16.] The subframe starts to rapidly break off of the vehicle floor around 40 ms, and therefore allows for additional deformation. In Lotus vehicle this connection remains intact so that it cannot contribute to additional crash length. The left side view of the test vehicle during crash at the same times is shown in Figure 18. [See Simunovic Comments, p. 17.] There is an obvious difference between the simulations and the tests. The developed lightweight model and the baseline vehicle do represent two different types of that share general dimensions, so that the differences in the responses can be large. However, diving down during impact is so common across the passenger vehicles so that different kinematics automatically raises questions about the accuracy of the suspension system and the mass distribution. If such kinematic outcome was a design objective, than it can be stated in the tests.
If you are aware of better methods and tools employed and documented elsewhere to help validate advanced materials and design engineering rigor for 2020-
[Joost] While it’s not made explicit in the report, it seems that the components are likely modeled with the materials in a zero-strain condition – i.e. the strain hardening and local change in properties that occurs during stamping is not considered in the properties of the components. While not widely used in crash modeling (as far as I am aware), including the effects of strain hardening on local properties from the stamping process is beginning to find use in some design tools. While none of the materials used in this study have extreme strain hardening properties (such as you might find in TRIP

158
2025 vehicles, please suggest how they might be used to improve the study.
steels or 5000 series Al), all of these sheet materials will experience some change in properties during stamping. I do not consider the study deficient for having used zero-strain components, but it may be worth undergoing a simple study to determine the potential effects on some of the components. This is complicated by the further changes that may occur during the paint bake cycle. [Richman] Cannot truly be validated without building a physical prototype for comparison. [OSU] LS-DYNA is the state of the art for this type of analysis. As time allows for the 2020-2025 model year, additional more detailed material modeling should occur. As an example the floor structure properties can be further investigated to answer structural creep and strength concerns.
ADDITIONAL COMMENTS: [Richman] Study is very thorough in their crash loadcase selections and generated a lot of data for evaluation. Might have included IIHS Offset ODB and IIHS Side Impact test conditions which most OEM's consider. Study is less thorough in analyzing normal loads that influence BIW and chassis design (i.e. pot holes, shipping, road load fatigue, curb bump, jacking, twist ditch, 2g bump, etc.). Report indicates “Phase 2 vehicle model was validated for conforming to the existing external data for the Toyota Venza, meeting best-in-class torsional and bending stiffness, and managing customary running loads.” Only torsional stiffness is reported.
Modal frequency analysis data Is not reported. Conclusions for many of the crash load cases (primarily dynamic) did not use simulation results to draw quantitative comparisons to the Toyota Venza or other peer vehicles. For instance, intrusion velocities for side impacts are reported. But, no analytical comparison is made to similar vehicles that currently meet the requirements. Comparable crash tests are often available from NHTSA or IIHS. Remarkable strength exhibited by the FEM roof under an FMVSS test load raises questions validity of the model. Model assumes no failures of adhesive bonding in materials during collisions. Previous crash testing experience suggest[s] some level of bonding separation and resulting structure strength reduction is likely to occur. [Richman cont.] Unusual simulation results – [1] Models appear reasonable and indicate the structure has the potential to meet collision safety requirements. Some unusual simulation results raise questions about detail accuracy of the models.

159
[2] FMVSS 216 quasi-static roof strength: Model indicates peak roof strength of 108 KN. This is unusually high strength for an SUV type vehicle. The report attributes this high strength to the major load being resisted by the B-pillar. Several current vehicles employ this construction but have not demonstrated roof strength at this level. The report indicates the requirement of 3X curb weight is reached within 20 mm which is typically prior to the test platen applying significant load directly into the b-pillar. [3] 35 MPH frontal rigid barrier simulation: Report indicates the front tires do not contact the sill in a 35 MPH impact. This is highly unusual structural performance. Implications are the model or the structure is overly stiff. [4] Body torsional stiffness: Torsional stiffness is indicated to be 32.9 kN/deg. Higher than any comparable vehicles listed in the report. PH 2 structure torsional stiffness is comparable to significantly more compact body structures like the Porsche Carrera, BMW 5 series, Audi A8. It is not clear what elements of the PH 2 structure contribute to achieving the predicted stiffness. [5] Door beam modeling: Door beams appear to stay tightly joined to the body structure with no tilting, twisting or separation at the lock attachments in the various side impact load modes. This is highly unusual structural behavior. No door opening deformation is observed in any frontal crash simulations. This suggests the door structure is modeled as an integral load path. FMVSS requires that doors are operable after crash testing. Door operability is not addressed in the report. [6] Safety analysis of the PH2 structure is based on collision simulation results using LS-Dyna and Nastran software simulations. Both software packages are widely used throughout the automotive industry to perform the type of analysis in this report. Accuracy of simulated mechanical system performance is highly dependent on how well the FEM model represents the characteristics of the physical structure being studied. Accurately modeling a complete vehicle body structure for evaluation under non-linear loading conditions experienced in collisions is a challenging task. Small changes in assumed performance of nodes and joints can have a significant impact on predicted structure performance. Integration of empirical joint test data into the modeling process has significantly improved the correlation between simulated and actual structure performance. [OSU] This reviewer sat down with the person who created and ran the LS-DYNA FEA models. Additional insight into how the model performs and specific questions were answered on specific load cases. All questions were answered. Another reviewer which did not visit Lotus commented on the following: 1. The powertrain has more than 15% of the vehicle mass and therefore the right powertrains should be used in simulation. 2. The powertrain is always mounted on the body by elastic mounts. The crash behavior of the elastic mounts might easy introduce a 10% error in determination of the peak deceleration (failure vs not failure might be much more than 10%). So modeling a close-to-reality powertrain and bushing looks like a must (at least for me). 3. Although not intuitive, the battery pack might have a worst crash behavior than the fuel tank. Therefore the shoulder to shoulder position might be inferior to a tandem configuration (with the battery towards the center of the vehicle).

160
4. The battery pack crash behavior is of high importance of its own. It is very possible that after a crash an internal collapse of the cells and/or a penetration might produce a short-circuit. It should be noted that by the time of writing there are not developed any reasonable solutions to mitigate an internal short-circuit. Although not directly life treating, this kind of event will produce a vehicle loss. Also, very important, but subtle would be literature references that give an idea of how accurate the community can expect LS-DYNA crash simulations to be in a study such as this. Often manufacturers have the luxury of testing similar bodies, materials and joining methodologies and tuning their models to match broad behavior and then the effects of specific changes can be accurately measured. Here the geometric configuration, many materials and many joining methods are essentially new. Can Lotus provide examples that show how accurate such ‘blind’ predictions may be? Model calibration – Analytical models have the potential to closely represent complex non-liner structure performance under dynamic loading. With the current state of modeling technology, achieving accurate modeling normally requires calibration to physical test results of an actual structure. Models developed in this study have not been compared or calibrated to a physical test. While these simulations may be good representations of actual structure performance, the models cannot be regarded as validated without some correlation to physical test results. Project task list includes dynamic body structure modal analysis. Report Summary of Safety Testing Results” indicates the mass reduced body exhibits “best in class” torsional and bending stiffness. The report discusses torsional stiffness but there is no information on predicted bending stiffness. No data on modal performance data or analysis is presented.

161
4. VEHICLE MANUFACTURING COST METHODOLOGICAL RIGOR
COMMENTS
Please comment on the methods used to analyze the mass-reduced vehicle body structure’s manufacturing costs.
[Joost] The report does a good job of identifying, in useful detail, the number of workstations, tools, equipment, and other resources necessary for manufacturing the BIW of the vehicle. These are all, essentially, estimates by EBZ; to provide additional credibility to the manufacturing assessment it would be helpful to include a description of other work that EBZ has conducted where their manufacturing design work was implemented for producing vehicles. Lotus is a well-known name, EBZ is less well known. [Richman] Notable strengths of this analysis, besides the main focus on crash analysis, are the detail of assembly facility design, labor content, and BIW component tooling identification. Main weakness of the cost analysis is the fragmented approach of comparing costs derived in different approaches and different sources, and trying to infer relevant information from these differences. [OSU] Flat year-over-year wages for the cost analysis seems unrealistic. Additional source information requested for wage rates for various locations.
Please describe the extent to which state-of-the-art costing methods have been employed as well as the extent to which the associated analysis exhibits strong technical rigor.
[Joost] This is not my area of expertise [Richman] Vulnerability in this cost study appears to be validity and functional equivalence of BIW design with 169 pieces vs. 407 for the baseline Venza. Total tooling investment of $28MM for the BIW not consistent with typical OEM production experience. BIW tooling of $150-200MM would not be uncommon for conventional BIW manufacturing. If significant parts reduction could be achieved, it would mean less tools, but usually larger and more complex ones, requiring larger presses and slower cycle times. [OSU] Difficult to evaluate since this portion of the report was completed by a subcontractor. The forming dies seem to be inexpensive as compared to standard steel sheet metal forming dies.
If you are aware of better methods and tools employed and documented elsewhere to help
[Joost] This is not my area of expertise [Richman] Applying a consistent costing approach to each vehicle and vehicle system using a manufacturing cost model

162
estimate costs for advanced vehicle materials and design for 2020-2025 vehicles, please suggest how they might be used to improve this study.
approach. This approach would establish a more consistent and understandable assessment of cost impacts of vehicle mass reduction design and technologies. [OSU] None.
ADDITIONAL COMMENTS: [Joost] The assessment of the energy supply includes a description of solar, wind, and biomass derived energy. While the narrative is quite positive on the potential for each of these energy sources, it’s not clear in the analysis how much of the power for the plant is produced using these techniques. If the renewable sources provide a significant portion of the plant power, then the comparison of the Ph2 BIW cost against the production Venza cost may not be fair. The cost of the Venza BIW is determined based on the RPE and several other assumptions and therefore includes the cost of electricity at the existing plant. Therefore, if an automotive company was going to invest in a new plant to build either the Ph2 BIW or the current Venza BIW (and the new plant would have the lower cost power) then the cost delta between the two BIWs would be different than shown here (because the current Venza BIW produced at a new plant would be less expensive). The same argument could be made for the labor costs and their impact on BIW cost. By including factors such as power and labor costs into the analysis, it’s difficult to determine what the cost savings/penalty is due only to the change in materials and assembly – the impact of labor and energy are mixed into the result. [OSU] The number of workers assigned to vehicle assembly in this report seems quite low. Extra personal need to be available to replace those with unexcused absences. Do these assembly numbers also include material handling personnel to stock each of the workstations? While this work does make a compelling case it downplays some of the very real issues that slow such innovation in auto manufacturing. Examples: multi-material structures can suffer accelerated corrosion if not properly isolated in joining. Fatigue may also limit durability in aluminum, magnesium or novel joints. Neither of these durability concerns is raised. Also, automotive manufacturing is very conservative in using new processes because one small process problem can stop an entire auto manufacturing plant. Manufacturing engineers may be justifiably weary of extensive use of adhesives, until these are proven in mass production in other environments. These very real impediments to change should be mentioned in the background and conclusions. [Richman] Summary – Cost projections . . . lack sufficient rigor to support confidence in cost projections and in some cases are based on “optimistic” assumptions. Significant cost reduction is attributed to parts consolidation in the body structure. Part count data presented in the report appears to reflect inconsistent content between baseline and PH 2 designs. Body manufacturing labor rates and material blanking recovery are not consistent with actual industry experience. Using normal industry experience for those two factors alone would add $273 to body manufacturing cost. Tooling cost estimates for individual body dies appear to be less than half normal industry experience for dies of this type. Cost modeling -- Assessing cost implications of the PH 2 design [is] a critically important element of the project. Total vehicle cost was derived from vehicle list price using estimated Toyota mark-up for overhead and profit. This process assumes average Toyota mark-up applies to Venza pricing. List price for specific vehicles is regularly influenced by business and competitive marketing factors. (Chevrolet Volt is believed to be

163
priced significantly below GM corporate average margin on sales, while the Corvette is believed to be above target margin on sales.) System cost assumptions based on average sales margin and detailed engineering judgments can be a reasonable first order estimate. These estimates can be useful in allocation of relative to costs to individual vehicle systems, but lack sufficient rigor to support definitive cost conclusions Baseline Venza system costs were estimated by factoring estimated total vehicle cost and allocating relative cost factors for each major sub-system (BIW, closures, chassis, bumpers, suspension, …) based on engineering judgment. Cost of PH 2 purchased components were developed using a combination of estimated baseline vehicle system estimated costs, engineering judgment and supplier estimates. Cost estimates for individual purchased components appear realistic. Body costs for PH 2 design were estimated by combining scaled material content from baseline vehicle (Venza) and projected manufacturing cost from a new production processes and facility developed for this project. This approach is logical and practical, but lacks the rigor to support reliable estimates of new design cost implications when the design changes represent significant departures from the baseline design content. Body piece cost and tooling investment estimates were developed by Intgellicosting. No information was provided on Intellicosting methodology. Purchased component piece cost estimates (excluding BIW) are in line with findings in similar studies. Tooling costs supplied by Intellicosting are significantly lower than actual production experience would suggest. Assembly costs were based on detailed assembly plant design, work flow analysis and labor content estimates. Assembly plant labor content (minutes) is consistent with actual BIW experienced in other OEM production projects. The PH 2 study indicates and aluminum based multi material body (BIW, closures) can be produced for at a cost reduction of $199 relative to a conventional steel body. That conclusion is not consistent with general industry experience. This inconsistency may result from PH 2 assumptions of material recovery, labor rates and pars consolidation. A recent study conducted by IBIS Associates “Aluminum Vehicle Structure: Manufacturing and Life Cycle Cost Analysis” estimated a cost increase $560 for an aluminum vehicle BIW and closures. http://aluminumintransportation.org/members/files/active/0/IBIS%20Powertrain%20Study%20w%20cover.pdf That study was conducted with a major high volume OEM vehicle producer and included part cost estimates using detailed individual part cost estimates. Majority of cost increases for the low mass body are offset by weight related cost reductions in powertrain, chassis and suspension components. Conclusions from the IBIS study are consistent with similar studies and production experience at other OEM producers. [Richman cont.] BIW Design Integration -- Report identifies BIW piece count reduction from a baseline of 419 pieces to 169 for PH 2. Significant piece cost and labor cost savings

164
are attributed to the reduction in piece count. Venza BOM lists 407 pieces in the baseline BIW. A total of 120 pieces are identified as having “0” weight and “0” cost. Another 47 pieces are listed as nuts or bolts. PH 2 Venza BOM lists no nuts or bolts and has no “0” mass/cost components. With the importance attributed to parts integration, these differences need to be addressed. Closure BOM for PH 2 appears to not include a number of detail components that are typically necessary in a production ready design. An example of this is the PH 2 hood. PH 2 Hood BOM lists 4 parts, an inner and outer panel and 2 hinges. Virtually all practical aluminum hood designs include 2 hinge bracket reinforcements, a latch support and a palm reinforcement. Absence of these practical elements of a production hood raise questions about the functional equivalency (mounting and reinforcement points, NVH, aesthetics,…) of the two vehicle designs. Contents of the Venza BOM should be reviewed for accuracy and content in the PH 2 BOM should be reviewed for practical completeness. Tooling Investment -- Tooling estimates from Intellicosting are significantly lower than have been seen in other similar studies or production programs and will be challenged by most knowledgeable automotive industry readers. Intellicosting estimates total BIW tooling at $28MM in the tooling summary and $70 MM in the report summary. On similar production OEM programs complete BIW tooling has been in the range of $150MM to $200MM. The report attributes low tooling cost to parts consolidation. This does not appear to completely explain the significant cost differences between PH 2 tooling and actual production experience. Parts consolidation typically results in fewer tools while increasing size, complexity and cost of tools used. The impact of parts consolidation on PH 2 weight and cost appears to be major. The report does not provide specific examples of where parts consolidation was achieved and the specific impact of consolidation. Considering the significant impact attributed to parts consolidation, it would be helpful provide specific examples of where this was achieved and the specific impact on mass, cost and tooling. Based on actual production experience, PH 2 estimates for plant capital investment, tooling cost and labor rates would be viewed as extremely optimistic Material Recovery -- Report states estimates of material recovery in processing were not included in the cost analysis. Omitting this cost factor can have a significant impact on cost of sheet based aluminum products used in this study. Typical auto body panel blanking process recovery is 60%. This recovery rate is typical for steel and aluminum sheet. When evaluation material cost of an aluminum product the impact of recovery losses should be included in the analysis. Potential impact of material recovery for body panels: Approximate aluminum content (BIW, Closures) 240 Kg Input material required at 60% recovery 400 Kg Blanking off-all 160 Kg Devaluation of blanking off-all (rough estimate) Difference between raw material and Blanking off-all $1.30/Kg $ 211
Blanking devaluation increases cost of aluminum sheet products by over $ 0.90/Kg. Appropriate estimates of blanking recoveries and material devaluation should be included in cost estimates for stamped aluminum sheet components. Recovery rates for steel sheet products are similar to aluminum, but the economic impact of steel sheet devaluation is a significantly lower factor in finished part cost per pound.

165
Report indicates total cost of resistance spot welding (RSW) is 5X the cost of friction spot welding (FSW). Typical total body shop cost (energy, labor, maintenance, consumable tips) of a RSW is $0.05 - $0.10. For the stated ratio to be accurate, FSW total cost would be $0.01-$0.02 which appears unlikely. It is possible the 5X cost differential apply to energy consumption and not total cost. Labor rates -- Average body plant labor rates used in BIW costing average $35 fully loaded. Current North American average labor rates for auto manufacturing (typically stamping, body production and vehicle assembly)
Toyota $55 GM $56 (including two tier) Ford $58 Honda $50 Nissan $47 Hyundai $44 VW $38
Labor rate of $35 may be achievable (VW) in some regions and circumstances. The issue of labor rate is peripheral to the central costing issue of this study which is assessing the cost impact of light weight engineering design. Method used to establish baseline BIW component costs inherently used current Toyota labor rates. Objective assessment of design impact on vehicle cost would use same labor rates for both configurations. Labor cost or BIW production is reported to be $108 using an average rate of $35. Typical actual BIW labor content from other cost studies with North American OEM’s found actual BIW labor content approaching $200. Applying the current Toyota labor rate of $55 to the PH 2 BIW production plan increases labor content to $170 (+$62) per vehicle.

166
5. CONCLUSION AND FINDINGS
COMMENTS
Are the study’s conclusions adequately backed up by the methods and analytical rigor of the study?
[Joost] In the summary section there is an analysis that attempts to project the “potential weight savings” for vehicle classes beyond the Venza. The analysis is based on specific density which assumes that the architecture of the vehicles is the same. For example, the front-end crash energy management system in a micro car is likely quite different from the comparable system in a large luxury car (aside from differences in gauge to account for limited crash space, as discussed in the report). While this analysis provides a good starting point, I do not feel that it is reasonable to expect the weight reduction potential to scale with specific density. In other words, I think that the 32.4 value used in the analysis also changes with vehicle size due to changes in architecture. Similarly, the cost analysis projecting cost factor for other vehicle classes is a good start, but it’s unlikely that the numbers scale so simply. [Richman] Summary – General: Engineering analysis is very thorough and reflects the vehicle engineering experience and know-how of the Lotus organization. Study presents a realistic perspective of achievable vehicle total vehicle mass reduction using available design optimization tools, practical light weight engineering materials an available manufacturing processes. Results of the study provide important insight into potential vehicle mass reduction generally achievable by 2020. Summary – Conclusions: Report Conclusions overstate the level of design “validation” achievable utilizing state-of-the- art modeling techniques with no physical test of a representative structure. From the work in this study it is reasonable to conclude the PH 2 structure has the potential to pass FMVSS and IIHS safety criteria. Summary – Mass Reduction: Majority of mass reduction concepts utilized are consistent with general industry trends. Mass reduction potential attributed to individual components appear reasonable and consistent with industry experience with similar components. As an advanced design concept study, the PH 2 project is a valuable and important piece of work.
The PH 2 study did not include physical evaluation of a prototype vehicle or major vehicle sub system. Majority of the chassis and suspension content was derived from similar components for which there is extensive volume production experience. Some of the technologies included in the design are “speculative” and may not mature to production readiness or achieve projected mass reduction estimates by 2020. For those reasons, the PH 2 study is a “high side” estimate of practical overall vehicle mass reduction potential.
Summary – Safety: Major objective of this study is to “validate” safety performance of the PH 2 vehicle concept. Critical issue is the term “validate”. Simulation modeling and simulation tools used by Lotus are widely recognized as state-of-the-
167
art. Lotus modeling skills are likely to among the best available in the global industry. Project scope did not include physical test of the structure to confirm model accuracy. Safety performance data presented indicates the current structure has the potential to meet all FMVSS criteria, but would not be generally considered sufficient to “validated” safety performance of the vehicle. Physical test correlation is generally required to establish confidence in simulation results. Some simulation results presented are not consistent with test results of similar vehicles. Explanations provided for the unusual results do not appear consistent with actual structure content. Overstating the implications of available safety results discredits the good design work and conclusions of this study. FMVSS test performance conclusions are based on simulated results using an un-validated FE model. Accuracy of the model is unknown. Some simulation results are not typical of similar structures suggesting the model may not accurately represent the actual structure under all loading conditions. [OSU] Yes.
Are the conclusions about the design, development, validation, and cost of the mass-reduced design valid?
[Joost] Yes. Despite some of the critical commentary provided above, I believe that this study does a good job of validating the technical and cost potential of the mass-reduced design. The study is lacking durability analysis and, on a larger scale, does not include constructing a demonstration vehicle to validate the model assumptions; both items are significant undertakings and, while they would add credibility to the results, the current study provides a useful and sound indication of potential. [Richman] Safety performance and cost conclusions are not clearly support by data provided. Safety Conclusion – A major objective of the PH 2 study is to “validate” the light weight vehicle structure for compliance with FMVSS requirements. State of the art FEM and dynamic simulations models were developed. Those models indicate the body structure has the potential to satisfy FMVSS requirements. FMVSS requirements for dynamic crash test performance is defined with respect to occupant loads and accelerations as measured using calibrated test dummies. The FEM simulations did not include interior, seats, restraint systems or occupants. Analytical models in this project evaluate displacements, velocities, and accelerations of the body structure. Predicting occupant response based on body structural displacements velocities and accelerations is speculative. Simulation results presented are a good indicator of potential performance. These simulations alone would not be considered adequate validation the structure for FMVSS required safety performance. [OSU] Yes.
Are you aware of other available [Joost] The World Auto Steel Ultra Light Steel Auto Body, the EU SuperLight Car, and the DOE/USAMP Mg Front End

168
research that better evaluates and validates the technical potential for mass-reduced vehicles in the 2020-2025 timeframe?
Research and Development design all provide addition insight into weight reduction potential. However, none are as thorough as this study in assessing potential in the 2020-2025 timeframe. [Richman] Most studies employing a finite element model validate a base model against physical testing, then do variational studies to look at effect. Going directly from an unvalidated FEM to quantitative results is risky, and the level of accuracy is questionable [OSU] No.
ADDITIONAL COMMENTS:

169
6. OTHER POTENTIAL AREAS FOR COMMENT
COMMENTS
Has the study made substantial improvements over previous available works in the ability to understand the feasibility of 2020-2025 mass-reduction technology for light-duty vehicles? If so, please describe.
[Joost] Yes. The best example was the Phase 1 study, which lacked much of the detail and focus included here. The other studies that I mentioned above do not go into this level of detail or are not focused on the same time frame. [Richman] Fundamental engineering work is very good and has the potential to make a substantial and important contribution to industry understanding of mass reduction opportunities. The study will receive intense and detailed critical review by industry specialists. To achieve potential positive impact on industry thinking, study content and conclusions must be recognized as credible. Unusual safety simulation results and questionable cost estimates (piece cost, tooling) need to be explained or revised. As currently presented, potential contributions of the study are likely to be obscured by unexplained simulation results and cost estimates that are not consistent with actual program experience. [OSU] Yes.
Do the study design concepts have critical deficiencies in its applicability for 2020-2025 mass-reduction feasibility for which revisions should be made before the report is finalized? If so, please describe.
[Joost] There is nothing that I would consider a “critical deficiency” however many of the comments outlined above could be addressed prior to release of the report. [Richman] Absolutely. Recommended adjustments summarized in Safety analysis, and cost estimates (recommendations summarized in attached review report). Credibility of study would be significantly enhanced with detail explanations or revisions in areas where unusual and potentially dis-crediting results are reported. Conservatism in assessing CAE based safety simulations and cost estimates (component and tooling) would improve acceptance of main report conclusions. Impact of BIW plant site selection discussion and resulting labor rates confuse important assessment of design driven cost impact. Suggest removing site selection discussion. Using labor and energy cost factors representative of the Toyota Venza production more clearly identifies the true cost impact of PH 2 design content. [OSU] No.
Are there fundamentally different lightweight vehicle design technologies that you expect to be much more common (either in addition to or instead of) than the one Lotus has assessed for the 2020-2025 timeframe?
[Joost] Some effort was made in the report to discuss joining and corrosion protection techniques, however it is possible that new techniques will be available prior to 2025. For example, there was very little discussion on how a vehicle which combines so many different materials could be pre-treated, e-coated, and painted in an existing shop. There will likely be new technologies in this area. [Richman] Technologies included in the PH 2 design are the leading candidates to achieve safe cost effective vehicle mass reduction in the 2020-25 timeframe. Most technologies included in PH 2 are in current volume production or will be fully
170
production ready by 2015. [OSU] No.
Are there any other areas outside of the direct scope of the analysis (e.g., vehicle performance, durability, drive ability, noise, vibration, and hardness) for which the mass-reduced vehicle design is likely to exhibit any compromise from the baseline vehicle?
[Joost] As discussed above, durability is a major factor in vehicle design and it is not addressed here. The use of advanced materials and joints calls into question the durability performance of a vehicle like this. NVH may also be unacceptable given the low density materials and extraordinary vehicle stiffness. [Richman] Most areas of vehicle performance other than crash performance were not addressed at all. Even basic bending stiffness and service loads (jacking, towing, 2-g bump, etc) were not addressed. The report claims to address bending stiffness and bending/torsional modal frequencies, but that analysis is not included in the report. [OSU] The proposed engine size is based on the assumption that decreasing the mass of the vehicle and holding the same power–to-weight ratio will keep the vehicle performances alike. This assumption is true only if the coefficient of drag (Cda) will also decrease (practically a perfect match in all the dynamic regards is not possible because the quadratic behavior of the air vs speed). The influence of the airdrag is typically higher than the general perception. In this particular case is very possible that more than half of the engine power will be used to overcome the airdrag at 65 mph. Therefore aerodynamic simulations are mandatory in order to validate the size of the engine.
ADDITIONAL COMMENTS: [Joost] Clallam county, WA is an interesting choice for the plant location (I grew up relatively nearby). Port Angeles is not a “major port” (total population <20,000 people) and access to the area from anywhere else in the state is inconvenient. [OSU] The Lotus design is very innovative and pushes the design envelope much further than other advanced car programs. The phase 1 report shows a great deal of topological innovation for the different components that are designed.

171
Please provide any comments not characterized in the tables above. [Joost] No comment. [Richman] State-of-the art in vehicle dynamic crash simulation can provide A/B comparisons and ranking of alternative designs, but cannot reliably produce accurate absolute results without careful correlation to crash results. CAE is effective in significantly reducing the need for hardware tests, making designs more robust, and giving guidance to select the most efficient and best performing design alternatives. OEM experience to date indicates CAE can reduce hardware and physical test requirements, but cannot eliminate the need for some level of crash load physical testing. Quasi-static test simulations show potential for eliminating most if not all hardware (FMVSS 216 etc.), simulations of FMVSS 208, 214, IIHS ODB and others still required several stages of hardware evaluation. Given the challenges of simulating the complex crash physics of a vehicle composed of advanced materials and fastening techniques, hardware testing would generally be considered necessarily to “validate” BIW structures for the foreseeable future. Editorial – [1] Report makes frequent reference to PH 1 vehicle LD and HD configurations. These references seem unnecessary and at times confusing. PH 1 study references do not enhance the findings or conclusions of the PH 2 study. Suggest eliminating reference to the PH 1 study. [2] Report would be clearer if content detail from PH 1 project that is part of PH 2 project (interior, closure, chassis content) is fully reported in PH 2 report. [3] Weight and Cost reduction references: Baseline shifts between Total Vehicle and Total Vehicle Less Powertrain. A consistent baseline may avoid confusion. Suggest using total vehicle as reference. [4] Cost increases statements: Report makes a number of cost references similar to:
Pg 4 - “The estimation of the BIW piece cost suggests an increase of 160 percent – over $700 – for the 37-percent mass-reduced body-in-white.”
The statement indicates the increase is 160%. The increase of $700 is an increase of 60% resulting in a total cost 160% of the baseline.
Site selection – [1] PH 2 project includes an extensive site selection study. Site selection is not related to product design. Including economics based on preferential site selection confuses the fundamental issue of the design exercise. Assumption of securing a comparable site and achieving the associated preferential labor rates and operating expenses are at best unlikely. Eliminating the site selection and associated cost would make the report more focused and cost projections more understandable and believable.
[2] Advantaged labor rates and possible renewable energy operating cost savings could be applied to any vehicle design. Entering those factors into the design study for the light weight redesign mixes design cost with site selection and construction issues.
[3] Site plan includes use of PV solar and wind turbines. Plant costs indicate general plant energy (lighting, support utilities, HVAC) (not processing energy) will be at “0” cost. True impact of renewable energy sources net of maintenance costs is at best controversial. Impact of general plant energy cost on
172
vehicle cost is minimal. The issue of renewable energy sources is valid but peripheral to the subject of vehicle design. It would be clearer to use conventional general plant energy overhead in cost analysis of the Phase II design cost.
Development experience – PH 2 vehicle design described is representative of a predevelopment design concept. All OEM production programs go through this development stage. Most vehicle programs experience some increase in mass and cost through the physical testing and durability development process. Those increases are typically driven by NVH or durability issues not detectable at the modeling stage. Mass dampers on the Venza front and rear suspension are examples of mass and cost increases. Vehicle mass increases of 2-3% through the development cycle are not unusual. It would be prudent to recognize some level of development related mass increase in the PH 2 mass projection. Vehicle content – Pg. 214 Bumpers: Need to check statement: “Current bumpers are generally constructed from steel extrusions, although some are aluminum and magnesium.” In North America 80% of all bumpers are rolled or stamped steel. Aluminum extrusions are currently 20% of the NA market. There are no extruded steel bumpers. There are no magnesium bumpers.
Technology – Majority of the design concepts utilized for PH 2 have been in reasonable volume automotive production for multiple years and on multiple vehicles. A few of the ideas represent a change in vehicle utility or are dependent on significant technology advancements that may not be achievable. Identifying the impact of currently proven technologies from speculative technologies may improve understanding of the overall study.
Specific speculative technologies:
[1] Eliminate spare tire, jack, tools (23 Kg) - feasible, may influence customer perception of utility [2] Eliminate carpeting - feasible, customer perception issue [3] Dual cast rotors (2 Kg) - have been tried, durability issues in volume production, differential expansion and bearing temperature issues may not be solvable [4] Wheels Ablation cast (22.4 Kg) - process has been run experimentally but has not been proven in volume. Benefit of process for wheel applications may not be achievable due to resultant metallurgical conditions of the as-cast surfaces. [OSU] No comment. [Simunovic] I would suggest that the organization of the document be reconsidered to add some information from the Phase 1 and more discussion about the design process. Especially interesting would be the guiding practical implementation of Lotus design steps as outlined at the beginning of the Phase 2 report.

LOTUS ENGINEERING RESPONSES TO PEER REVIEW COMMENTS
Grouping of Like Comments in Lotus Peer Review Report (Lotus HD Phase 2)
TOPIC COMMENT WHO in
Peer Rev
COMMENT FROM LOTUS ENGINEERING
Material
Properties
Stress/strain
The sources cited for the material data are credible; however the Al
yield stresses used appear to be on the high side of the expected
properties for the alloy-temper systems proposed here. The
authors may need to address the use of the slightly higher numbers
(for example, 6061-T6 is shown with a yield stress of 308 MPa,
where standard reported values are usually closer to 275 MPa).
Reviewers would like to see min/max material specifications taken
into consideration.
Ques 1.
Joost
The material suppliers, including Alcoa, Meridian,
Henkel and Allied Composites provided the material
properties. These companies were chosen because they
are experts in their respective fields and could provide
accurate information for the materials used in the
modeling.
The input data supplied by the material manufactures
was sufficient to create a model with an estimated
fidelity of +/- 10%. This is an acceptable range for this
stage of the design.
Based on our modeling experience, the global
performance of the vehicle (overall pulse,
intrusions, time to zero velocity, etc.) is typically within
±5% using finalized and more detailed input data
generated for a production program.
A list detailing the constitutive model formulation for each of the
materials of structural significance in the study would help to clarify
this issue. Also the design rationale for dimensioning and selection
of materials for the main structural parts would help in
understanding the design decisions made by the authors of the
study. The included material data does not include strain rate
sensitivity, so it is assumed that the strain rate effect was not
considered. Strain rate sensitivity can be an important
strengthening mechanism in metals. For hcp (hexagonal close-
Ques 1
OSU
Strain rate was not considered for any of the
constitutive material models. Tensile testing on a
material sample under static and then dynamic
conditions would show that the dynamic results give a
higher stress/strain response. Because of this, the
modeling could be considered conservative. . The
AM60 material model was provided to Lotus by
Meridian in LS-Dyna format and was based on
production experience with similar parts.

packed) materials, such as AM60, high strain rate may also lead to
change in the underlying mechanism of deformation, damage
evolution, failure criterion, etc.
These assignments were not possible to confirm from the crash
model since the input files were encrypted. In any case, since Mg
AM60 alloy is used in such important role for the frontal crash, a
more detailed material model than the one implied by the graph on
page 32 of Phase 2 report [1] would be warranted. More accurate
failure model is needed, as well. The failure criteria in LS-DYNA [6]
are mostly limited to threshold values of equivalent strains and/or
stresses. However, combination of damage model with plasticity
and damage-initiated failure would probably yield a better accuracy
for AM60.
Ques 1
OSU
The constitutive material models contain the material
data that was provided by the respective supplier and
where no data was supplied values were found on
www.matweb.com. The material stress vs. strain
information is shown in section 4.2.2 of the report. The
LS-Dyna material model used was #24 (piecewise linear
plasticity) with the exception of the AM60 which was
#123 (modified piecewise linear plasticity)
Understanding of mechanical properties for material denoted as
Nylon_45_2a (reference [1] page 33) would be much more
improved if the constituents and fiber arrangement were described
in more detail. Numbers 45 and 2 may be indicating +/- 450 fiber
arrangement, however, a short addition of material configuration
would eliminate unnecessary speculation. An ideal plasticity model
of 60% limit strain for this material seems to be overly optimistic.
Other composite models available in LS-DYNA may be a much
better option.
Ques 1
Simunovic
Henkel provided an LS-Dyna material model with all of
the fields completed. Portions of this material
information were considered proprietary and were
disclosed.
If additional information would have been provided it
would have been possible to use one of the other
material models in LS-Dyna that would allow for the
modeling of the fibers and ‘resin’ as separate
components. The results would be substantially the
same as the Henkel data is based on the performance
of production parts.
While appropriate forming methods and materials appear to have
been selected, a detailed description of the material selection and
trade-off process is not provided. One significant exception is the
discussion and tables regarding the replacement of Mg components
with Al and steel components in order to meet crash requirements.
Ques 2
Joost
The material selection for the various ‘crash’
components’ was based on initial analyses that were
carried out during Phase I and at the start of phase II. It
became clear that the use of the Mg would have to be
limited to the areas of the vehicle which would be
considered non-critical load-paths and thus the design
of the structure evolved following numerous analyses
that improved the crash performance. The material
selection was driven primarily by the structural
requirements to ensure that the vehicle would have
adequate crash performance. Magnesium, while
lightweight, has a lower elastic modulus, yield strength
and elongation to failure than both steel and aluminum
so it was not considered a viable material for these
areas of large deformation and energy absorption.
Addition of the strain rate sensitivity to a material model can both
improve fidelity of the material model, and as an added benefit, it
can also help to regularize the response during strain localization.
Depending on the amount of stored internal energy and stiffness in
the deleted elements, the entire simulation can be polluted by the
element deletion errors and become unstable. Assuming that only
AM60 parts in the Lotus model have failure criterion, it would not
be too difficult for the authors to describe it in more depth. Since
AM60 is such a critical material in the design, perturbation of its
properties, mesh geometry perturbations and different
discretization densities, should be considered and investigate how
do they affect the convergence of the critical measures, such as
crash distances.
Ques 2
Simunovic
Material failure, in LS-Dyna can be represented in two
ways: - firstly, the material model being used can
represent the yielding of the material and the
subsequent post yield characteristics. This method on
its own will leave the physical elements in place and
thus they will continue to absorb energy beyond the
limit at which material fracturing would have occurred
under a tensile load. Secondly the material model can
be defined to allow for the elements to be deleted from
the analyses to represent the fracturing of the material
that would be seen in tensile loading (as was the case
with the material data that was supplied by Meridian).
The CAE crash models were created using typical
modeling parameters (mesh size, element quality, time-
step, etc.) as used in the automotive industry. It was
not an academic study aimed at evaluating the details
of different mesh size/element formulations/etc.
The fidelity of the model is estimated to be +/- 10%
which is an acceptable range for this stage of body
development. Lotus assumed a -10% error (worst case)
for all models; as a result the model exceeded the
requirements in some areas, e.g., roof crush, and may
be heavier than necessary to meet the structural and
impact targets.
The next step in a production process is to build a body
structure based on an acceptable FEA model and use

that as the basis for the final tuning.
Regarding my comment on joint failure under complex stress
states, note that in figure 4.3.12.a the significant plastic strains are
all located at the bumper-rail joints. While this particular test was
only to indicate the damage (and cost to repair), the localization of
plastic strain at the joint is somewhat concerning.
Ques 3
Joost
The figure shows that the potential damage was
predicted to be in the replaceable bumper structure
only. It would be impractical to design for a case where
under this loading the plastic strain would be limited to
the armature only. There is a welded joint between the
armature and crush can which due to the effects of
welding on aluminum causes a heat affected zone that
both reduces the material yield strength and increases
the elongation at failure (‘localized annealing’). Under
this type of low speed impact the complete front ‘low-
speed’ structure is intended to be replaced.
Welds and
Joints
This particular connection contains welds (for joining aluminum
parts) and bolts (for joining aluminum and magnesium). HAZ
properties were not given in the report and they could not be
checked in the model due to encryption. The bolt model properties
were described that it fails at 130 MPa (page 38 of the report [1]),
which corresponds to the yield stress of AM60. The importance of
these joints cannot be overstated. They enforce stability of the axial
deformation mode in the rails that in turn enables dissipation of the
impact energy. The crash sequence of the connection between the
front end module and the front rail is shown in Figure 3.
Ques 1
Simunovic
Figure 4.2.4.a. added to show typical joint sections and
an explanation of the overall boding and attachment
methodology.
Joining methodologies are specified in section 4.2.4 for
the MIG welds, friction spot welds, rivets and adhesive.
HAZ material information used in the models were
stated as follows: - Heat affected zones with ‘seam’
welding were modeled with reduced material
properties. Based on experience, a 40-percent
reduction in the base material was used (i.e. for 6061-
T6 a yield stress of 184.8MPa was used) – page #47.
This is a conservative estimation as the amount of
reduction in material strength depends upon the
amount of heat applied during the welding process.
The specification of the mechanical fastener shear
strength properties should be 500MPa and not 130MPa
as originally specified (corrected in the report). The
‘failure’ (element deletion) was modeled using a force
limit criterion of 10-12kN.

It is not clear from the simulations which failure criterion dominates
the process. Is it the failure of the HAZ or is it the spot weld limit
force or stress. Given the importance of this joint on the overall
crash response, additional information about the joint sub-models
would be very beneficial to a reader.
Ques 1
Simunovic
To go through each crash event and say what is the
sequence of the failure (i.e. weld/material/etc.) would
be a substantial task under any situation and was
beyond the scope of this investigation. The next step
for a production program would be to fully document
this failure criterion.
The ‘failure criterion’ in the model would not be
dominated by failure in the HAZ as this is only found in
the front end of the vehicle in the low-speed crush can
and end of the high speed rail.
Similarly, while appropriate joining techniques seem to have been
used, the process for selecting the processes and materials is not
clear. Additionally, little detail is provided on the joining techniques
used here. A major technical hurdle in the implementation of multi-
material systems is the quality, durability, and performance of the
joints. Additional effort should be expended towards describing the
joining techniques used here and characterizing the performance.
Ques 2
Joost
A detailed explanation of friction spot joining and
several illustrations of the process were added to the
typical section in Figure 4.2.4.a.
Some discussion of joining system for magnesium closure inner
panels to aluminum external skin and AHSS “B” pillar to aluminum
body would improve understanding and confidence in those
elements of the design.
Ques 2
Richman
Mechanical fastener discussion added in section 4.2.4.
noting that this discussion applies to the closures as
well as the BIW.
The magnesium components were utilized in areas that
would not be subject to significant levels of crash loads.
It was determined that in these areas the material
would have to be either high strength steel or
aluminum. The magnesium front end is in production
on several Ford models including the Ford Flex.
The B-Pillar construction consists of hot stamped boron
steel inner and outer components spot-welded at the
flanges with a nylon structural insert that is bonded to
the B-Pillar outer using Terocore 1811 (no mechanical
fasteners used). This was chosen after consultation

with Henkel and based upon their experience in
structural inserts which they have successfully used in
production vehicles.
Parts integration information is vague and appears inconsistent.
Parts integration. Major mass and cost savings are attributed to
parts integration. Data presented does not appear to results.
Ques 2
Richman
The parts count for the baseline vehicle is 269 parts;
the Phase 2 BIW has 169 parts.
More details are needed on the various aspects of joining and
fastening. Comment on assembly.
Ques 2
OSU
The joining and fastening section revised to include
more details. The assembly is addressed in the 100
page assembly plant section.
Durability One area that is omitted from the analysis is durability (fatigue and
corrosion) performance of the structure. Significant use of Al, Al
joints, and multi-material joints introduces the potential for both
fatigue and corrosion failure that are unacceptable in an
automotive product. It would be helpful to include narrative
describing the good durability performance of conventional (i.e. not
Bentley, Ferrari, etc.) vehicles that use similar materials and joints
in production without significant durability problems. In some
cases, (say the weld-bonded Al-Mg joints), production examples do
not exist so there should be an explanation of how these could
meet durability requirements.
Ques 2
Joost
Fatigue and corrosion modeling was beyond the scope
of the study.
Although not specifically addressed, Lotus has built cars
using steel and aluminum joints for 18 years without
fatigue/corrosion issues and this experience was
applied to the model as well as that of the production
aluminum (Alcoa) and magnesium (Meridian) suppliers.
Ford uses magnesium-steel joints in on their production
vehicles that have been validated for corrosion and
fatigue.
Jaguar and Audi use aluminum bodies on a number of
current production vehicles which must meet the same
corrosion and fatigue requirements as their steel
bodies. Ford is also reportedly introducing an
aluminum body for their 2014 F150 body
(http://online.wsj.com/article/SB100014240527023036
12804577531282227138686.html) which must meet
Ford’s internal truck standards for durability (more
abusive duty cycle than a passenger car).
There are no welded Al-Mg joints on the Phase 2 BIW;
there was no process that could demonstrate this

capability in the time frame of this study. Al-Mg and Al-
Fe joints are joined with structural adhesive and
mechanical fasteners on the Phase 2 BIW.
As discussed above, durability is a major factor in vehicle design
and it is not addressed here. The use of advanced materials and
joints calls into question the durability performance of a vehicle like
this. NVH may also be unacceptable given the low density materials
and extraordinary vehicle stiffness.
Ques 6
Joost
As discussed above, a detailed durability analysis was
outside the project scope. However, similar materials
and joints are used on production vehicles; Lotus has
had riv-bonded aluminum bodies with bolt –on steel
structures in production for eighteen years.
The baseline Venza NVH materials were used. The body
has high stiffness (>32,000 Nm/degree torsional
stiffness, 6x curb weight roof crush capability)
indicating that it has the ability to be tuned for NVH
and still have adequate rigidity. The BMW X5 (the
target for BIW stiffness) has a higher torsional stiffness
than many world class sports cars but has commercial
NVH isolation. High end passenger cars with aluminum
bodies like the Audi A8 and Jaguar XJ have
demonstrated acceptable NVH characteristics.
Additionally, active noise cancellation is expected to
play a major role in improving vehicle NVH in the near
future. The Lotus Phase 1 paper discussed ANC.
Wheel Mass
Reduction
Road wheel mass reduction is 5.6 Kg (54%) per wheel. It is not clear
from the report how this magnitude of reduction is achieved. The
report attributes wheel mass reduction to possibilities with the
Ablation casting process. PH 1 report discussion of Ablation casting
states: “The process would be expected to save approximately 1 Kg
per wheel.” Considering the magnitude of this mass reduction a
more detailed description of wheel mass reduction would be
appropriate.
Elimination of the spare tire and jack reduces vehicle mass by 23 Kg.
Ques 2
Richman
The Phase 1 wheel was based on a production Prius
wheel and normalized to the Venza. Ablation casting
was applied to save additional weight. This is detailed
in the Phase 1 report. A very significant portion of the
savings, 3 kg., came from reducing the tire section
width from 245 to 225. Because of the greatly reduced
vehicle mass the tire section could be safely reduced
even more. Appearance considerations precluded the
use of a smaller width tire. The 19” tire size is very large
for this class of vehicle; using a 17” or 18” tire would

This is feasible but has customer perceptions of vehicle utility
implications. Past OEM initiatives to eliminate a spare tire have
encountered consumer resistance leading to reinstatement of the
spare system in some vehicles.
allow a further reduction in tire/wheel mass.
A spare tire is an option or not available on a number of
cars including the Dodge Challenger and the Chevrolet
Cruze Eco (manual).
Interior [9] Interior: Lotus PH 2 design includes major redesign of the
baseline Venza interior. Interior design changes achieve 97 Kg
(40%) weight reduction from the baseline interior. Majority of
interior weight reduction is achieved in the seating (43 Kg) and trim
(28 Kg). Interior weight reduction strategies in the PH 2 design
represent significant departures from baseline Venza interior. New
seating designs and interior concepts (i.e.: replacing carpeting with
bare floors and floor mats) may not be consistent with consumer
wants and expectations in those areas.
Ques 2
Richman
Ph 2 report utilizes all Ph 1 HD masses and designs
including the interior (except for BIW). Interior design is
trending towards the Lotus/Faurecia interior concept.
The 2012 Hyundai Elantra rear seat system weighs 20%
less than the lightweight 2020 MY projection for the
CUV rear seat and incorporates concepts published in
the Phase 1 report.
The carpeting modules are larger than floor mats, are
3d in shape and use more luxurious deep pile material
than traditional one piece carpets. They help to reduce
mass and cost while providing an upscale look and feel.
Energy
Balance
Energy balance does not confirm model accuracy in simulating a
given physical structure.
Ques 2
Richman
Revised section 4.4 to specifically state that an energy
balance does not confirm the model accuracy.
FEM validation was presented in the form of an energy balance for
each load case. Energy balance is useful in confirming certain
internal aspects of the model are working correctly. Energy balance
does not validate how accurately the model simulates the physical
structure. Presenting energy balance for each load case and
suggesting balance implies FEM accuracy is misleading.
Ques 3
Joost
The plotting of the energy balance only serves as one
indication to the CAE engineer that the analysis being
performed correctly (from a mathematical code
perspective) and is not undergoing any anomalies due
to the complex nature of definitions utilized. This would
not typically be included in a report to customers but
was only included as during the various meetings that
were held between Lotus, NHTSA and CARB, NHTSA
indicated that they had problems running the models
and this was used to show that these ‘problems’ did
not exist in the models run by Lotus.
Modeling
observations
The cracks in the front end module (Figure 3.2) and the separation
between the front end module and the front rail (Figure 3.3) are
clearly visible. This zone experiences very large permanent
deformations, as shown in Figure 4.
Ques 1
Simunovic
Cracks are typical in a magnesium front end structure in
following a high speed front impact; the Ford Flex uses
a magnesium front structure.

However, in my opinion, there are two issues that need to be
addressed. One is the modeling of material failure/fracture and the
other is the design of the crush zone with respect to the overall
stopping distance. While the former may be a part of proprietary
technology, the latter issue should be added to the description in
order to better understand the design at hand.
Ques 2
Simunovic
The dynamic crush zone was 555mm; a graph is
included in the report in Figure 4.3.1.f..
Material failure/fracture is modeled only where data
was provided by the material supplier. The data for the
aluminum was provided by Alcoa and no ‘failure of
material’ (represented by element deletion is utilized).
Element deletion was assumed for the areas of HAZ in
the lows speed crush cans and ends of the high speed
rails. The failure strain used for the 6061 & 6063-T6
material was 11%. Based on Lotus experience, this is a
conservative value.
The full crush zone of the vehicle is not fully utilized
under the flat frontal impact loadcase as there is not
enough mass in the vehicle to enable this to occur. One
of the governing factors for the design was that it was
based upon a vehicle with proportions such that it
would use up all of the available space under the front
impact loading. The process for producing extruded
aluminum as used in the front rails dictated a minimum
gage that could be used whilst assuring no issues due to
material warping during the manufacturing phase.
The above paragraph was added to the report.
Notice large cracks open in the mid span, on the sides, and punched
out holes at the locations of the connection with the front rail and
the shotgun. Mesh refinement study of this component would be
interesting and could also indicate the robustness of the design.
Decision to design such a structurally important part out of Mg
would be interesting to a reader. There are other components that
also include failure model even though they are clearly not made
out of magnesium nor are their failure criteria defined in the Phase
The “shotgun” causes the magnesium front end
module to completely separate at the attachment. This,
although not ideal, does not have a significant effect on
the results due to the ‘S-shape’ of the shotguns. The
shotgun bends under the front impact load rather than
crushing axially. The majority of the front crash load is
taken by the main rail.

2 report. Figure 6 [See Simunovic Comments, p. 8.] shows the
sequence of deformation of the front left rail as viewed from the
right side of the vehicle.
Tearing of the top of the support (blue) can be clearly observed in
Figure 7. The importance of this connection for the overall
response may warrant parametric studies for failure parameters
and mesh discretization.
Ques 2
Simunovic
The role of this support is relatively minor. See above.
There are 995,000 mesh elements. Mesh quality checks
were made to ensure the elements met the criteria set
for the following:
Element mesh size
Number of triangles per panel
Tria. Interior angle
Quad Interior angle
Warping
Jacobian
Aspect Ratio
Total %age of failed elements <1% (from all element
quality criteria’s)
It can be seen that almost all deformation occurs in the space
spanned by the front frame rails. As marked in Figure 1, the front
transition member (or a differently named component in case my
material assignment assumption was not correct), supports the
front rail so that it axially crushed and dissipated as much energy,
as possible. For that purpose, this front rail rear support was made
extremely stiff and it does not appreciably deform during the crash
(Figure 10). [See Simunovic Comments, p. 10.] It has internal
reinforcing structure that has not been described in the report.
These reinforcements enables it to reduce bending and axial
deformations in order to provide steady support for the axial crush
of the aluminum rail tube.
Ques 2
Simunovic
The design/analysis process went through numerous
iterations to improve the performance of the rail
transition so that the predominant deformation would
be seen in the front rails and not in the transition. The
transition pieces are 3mm thick permanent mold
castings with extensive ribbing which helps prevent
significant deformation. Contrary to the reviewers
comment, the rail (6061-T6) and the side wall gauges
are 2.25mm and the top surfaces are 2.75mm to allow
axial crushing to take place. A central rib was evaluated
as part of the structure but was eliminated as it made
the rail was too stiff and did not provide a reliable crush
mode.
A sensitivity analysis was carried out to reduce the
gauges further; this improved the overall vehicle pulse

and increased the overall time to zero velocity.
However, the thinner gauge materials were not used
because of potentially affecting durability and fatigue
(beyond the scope of this study but a consideration
throughout the design process). The thicker gauge
materials provided a pulse compatible with current
airbag technology (per TRW) and maintained the target
“G” level of 10% below the baseline peak.
To quickly evaluate the feasibility of the proposed design, we can
use the concept of the Equivalent Square Wave (ESW) ["Vehicle
crashworthiness and occupant protection", American Iron and Steel
Institute, Priya, Prasad and Belwafa, Jamel E., Eds. (2004).]. ESW
assumes constant, rectangular, impact pulse for the entire length of
the stopping distance (in our case equal to 22 in) from initial
velocity (35 mph). ESW represents an equivalent constant
rectangular shaped pulse to an arbitrary input pulse. In our case
ESW is about 22 g. Sled tests and occupant model simulations
indicate that crash pulses exceeding ESW of 20 g will have
difficulties to satisfy FMVSS 208 crash dummy performance criteria
[11]. For a flat front barrier crash of 35 mph and an ESW of 20 g, the
minimum stopping distance is 24 in. Advanced restraint systems
and early trigger airbags may need to be used in order to satisfy the
injury criteria and provide sufficient ride down time for the vehicle
occupants.
Ques 2
Simunovic
Front NCAP test results for the 2009 Toyota Venza (see
http://www-
nrd.nhtsa.dot.gov/database/aspx/searchmedia2.aspx?d
atabase=v&tstno=6601&mediatype=r&r_tstno=6601)
the following is observed: time to zero velocity - 75ms,
max dynamic crush - 680mm, average acceleration 21G,
peak acceleration 49G.
The Venza crush distance is 26.77 inches or about 12%
greater than a pulse that yields an ESW of 20G; the
Venza pulse would be 20/1.12 or about 18G using an
ESW analysis. The NHTSA measured average
acceleration was 21G or roughly 17% higher than the
ESW predicted value. This actual value also exceeds the
ESW threshold value of 20G.
It may be difficult to meet the requirements of the
FMVSS208 requirements with the pulse/TTZ that is
predicted but there are small vehicles currently being
sold that are able to do this (i.e. Smart ForTwo and Fiat
500); the 2008 Smart ForTwo has a TTZ of 47ms, a
dynamic crush of ~400mm (15.75” or 28% less than the
Phase 2 model), and a peak acceleration of ~60G
(average acceleration ~34G ) ref NHTSA test v6332.
Report does not identify the data used (minimum or typical).
Aluminum property data used in for the PH 2 design represents
Ques 2
Richman
Values from the suppliers were considered typical as

expected minimum values for the alloys and tempers. This
reviewer is not able to comment on property values used for the
other materials used in the BIW.
were those used for the other material data which was
found on www.matweb.com.
LS-Dyna and MSC-Nastran are current and accepted tools for this
kind of analysis. FEM analysis is part art as well as science, the
assumption had to be made that Lotus has sufficient skills and
experience to generate a valid simulation model.
Ques 3
richman
This is a correct assumption.
Model indicates the PH 2 structure could sustain a peak load of 108
kN under FMVSS 216 testing. This is unusually high for an SUV roof,
and stronger than any roof on any vehicle produced to date. Result
questions stiffness and strength results of the simulations.
Ques 3
Richman
IIHS results for the 2009-2012 Toyota Venza indicate a
good rating (which is 4* vehicle curb weight). The test
resulted in a maximum force of 84.4kN. The strength of
the roof structure is comparable to midsize SUV’s, e.g.,
the 2011-2012 Dodge Durango IIHS test results in a
maximum force of 105kN (ref: www.iihs.org).
The analysis result may be slightly higher than the
actual test as the physical test is carried out statically
and the analysis is considered quasi-static so there will
be some dynamic effects which will increase the
apparent load capacity. The analysis method used has
been used successfully on previous production vehicle
program to be considered acceptable for the studies
carried out here.
There is a sufficient safety margin in the results to allow
for ’dynamic’ discrepancies.
While the report abounds with crash simulations and graphs
documenting tremendous amount of work that authors have done,
it would have been very valuable to add comparison with the 6602
test even at the expense of some graphs. Page 72 of the Phase 2
report starts with comparison of the simulations with the tests and
that is one of the most engaging parts of the document. I suggest
that it warrants a section in itself. It is currently located out of
place, in between the simulation results and it needs to be
emphasized more. This new section would also be a good place for
Ques 3
Simunovic
The simulation sections are broken out into three
separate sections: 4.3., CAE Analysis, 4.4., Discussion,
and 4.5. Closures.
Occupant safety modeling was beyond the project
scope.

discussion on occupant safety modeling and general formulas for
the subject.
One of the intriguing differences between the simulations and
baseline vehicle crash test is the amount and the type of
deformation in the frontal crash. As noted previously,
computational model is very stiff with very limited crush zone.
Viewed from the left side (Figure 14) [See Simunovic Comments, p.
14.], and from below (Figure 15) [See Simunovic Comments, p. 15.],
we can see that the majority of the deformation is in the frame rail,
and that the subframe’s rear supports do not fail. The strong rear
support to the frame rail, does not appreciably deform, and thereby
establishes the limit to the crash deformation.
Ques 3
Simunovic
The difference between the chosen baseline vehicle
and the simulation lies in the mass of the overall
vehicle. The baseline vehicle curb mass is ~1815kg
while the simulation curb mass is only 1150kg. this
reduction in mass has significant effects on frontal
crash performance, (1) the vehicle appears to be
‘stiffer’ as shown by the higher average acceleration
and shorter time to zero velocity and (2) the total
dynamic crush is less.
Additional analyses were carried out to study the
results predicted by the analysis for the roof crush.
These analyses involved removing the entire adhesive
bond on the vehicle structure and also removing the
windshield. This was a “worst case” test condition; the
roof crush test is performed with the windshield in
place.
The restrictions applied to the vehicle design for
packaging, manufacturing/assembly/durability have
affected the part size/gauge/etc. As a result, some
components are similar to their counterparts on the
57% heavier baseline vehicle, e.g., the steel “B” pillar.
There is an obvious difference between the simulations and the
tests. The developed lightweight model and the baseline vehicle do
represent two different types of that share general dimensions, so
that the differences in the responses can be large. However, diving
down during impact is so common across the passenger vehicles so
that different kinematics automatically raises questions about the
accuracy of the suspension system and the mass distribution. If
such kinematic outcome was a design objective, than it can be
stated in the tests.
Ques 3
Richman
The motion of the vehicle under crash is substantially
dictated by the CoG for the vehicle. The simulation
model was ‘mass adjusted’ to give the correct weight
distribution between to front and rear axles (55/45).
There was no information available for the height of
the baseline vehicle CG and so this was not adjusted for
the simulation model. The CG height in the simulation
model was 560mm above the ground plane. In the flat
frontal load case there is a minimal amount of vehicle

pitching. This is because the location of the front rails
spans the vehicle CG location. If the CG was higher up
then there could be significantly more pitching during
impact. The potential for a higher vehicle CG location
was not studied; the light weight roof helped to reduce
the CG height.
Another reviewer which did not visit Lotus commented on the
following: 1. The powertrain has more than 15% of the vehicle
mass and therefore the right powertrains should be used in
simulation.
2. The powertrain is always mounted on the body by elastic
mounts. The crash behavior of the elastic mounts might easy
introduce a 10% error in determination of the peak deceleration
(failure vs not failure might be much more than 10%). So modeling
a close-to-reality powertrain and bushing looks like a must (at least
for me).
3. Although not intuitive, the battery pack might have a worst crash
behavior than the fuel tank. Therefore the shoulder to shoulder
position might be inferior to a tandem configuration (with the
battery towards the center of the vehicle).
Ques 3
OSU
The EPA provided a parallel hybrid powertrain using a
Lotus Sable engine was used. While further powertrain
mass optimization was possible, it was beyond the
scope of this study to develop a new powertrain for the
Phase 2 BIW study.
Lotus spent a substantial amount of time developing
the powertrain mounts to optimize the engine motion
during front impacts.
A 2 kWh battery pack was engineered along with a 20%
smaller fuel tank to provide an equivalent driving
range. The total energy system weight was equivalent
to original fuel system weight. Each storage system
(fuel, battery) is constrained independently so the
restraints have less mass to retain than the baseline
system.
Here the geometric configuration, many materials and many joining
methods are essentially new. Can Lotus provide examples that
show how accurate such ‘blind’ predictions may be?
Ques 3
OSU
All materials and joining processes described in the
report are in production today although not on a single
vehicle. The materials were joined and tested and the
results used in the modeling.
There are no examples that can be provided to indicate
how accurate the model will be compared to a physical
test. A prototype build was beyond the scope of this

project.
The current state of the model is such that if this were
an OEM vehicle program, it would only provide
confidence in the ideology that a lightweight vehicle
structure is capable of meeting the required vehicle
requirement (concept validation). As the vehicle
program developed and the designs of the other
components were finalized (i.e. interior
structure/doors/etc.) the confidence in the predicted
results would improve.
The methods that were used to build the finite element
crash models have been used successfully on previous
vehicle programs to predict crash performance. It
would therefore be expected that the results predicted
here would be within 10% of the actual tested results if
a prototype were built.
Compare
models to
tests
For instance, intrusion velocities for side impacts are reported. But,
no analytical comparison is made to similar vehicles that currently
meet the requirements. Comparable crash tests are often available
from NHTSA or IIHS.
Ques 3
Richman
NHTSA has carried out crash tests on the baseline
production vehicle. These test results can be found on
the NHSTA website (http://www-
nrd.nhtsa.dot.gov/database/veh/veh.htm). The front
impact test report (35mph flat frontal) used to compare
the simulation results can be accessed from the
following link (http://www-
nrd.nhtsa.dot.gov/database/aspx/searchmedia2.aspx?d
atabase=v&tstno=6601&mediatype=r&r_tstno=6601).
Results from IIHS testing can be found on the following
website (www.iihs.org).
While a direct comparison cannot be made between
the Lotus model and the production Venza NHTSA and

IIHS test results, the reader can use the results
presented in this report to determine relative levels of
performance, e.g., comparing the front of dash
intrusion levels from the Venza 208 test to the Lotus
model 208 results.
Treatment
of aluminum
and other
metals
From the report it is not clear that pretreatment is also applied to
extruded elements. The majority of high volume aluminum
programs in North America have moved away from electrochemical
anodizing as a pre-treatment. Current practice is use of a more
effective, lower cost and environmentally compatible chemical
conversion process. These processes are similar to Alodine
treatment. Predominant aluminum pre-treatments today are
provided by Novelis (formerly Alcan Rolled Products) and Alcoa
(Alcoa 951). Both processes achieve similar results and need to be
applied to the sheet and extruded elements that will be bonded in
assembly.
Ques 2
Richman
Alodine, a Henkel product, was used as the aluminum
pre-treatment including the extrusions. The Alcoa
products were not evaluated.
Study is very thorough in their crash loadcase selections and
generated a lot of data for evaluation. Might have included IIHS
Offset ODB and IIHS Side Impact test conditions which most OEM's
consider.
Ques 3
Richman
The customer specified the required load cases. FMVSS
214 side impact included barrier & pole tests. FMVSS
208 included offset barrier.
Some effort was made in the report to discuss joining and corrosion
protection techniques, however it is possible that new techniques
will be available prior to 2025. For example, there was very little
discussion on how a vehicle which combines so many different
materials could be pre-treated, e-coated, and painted in an existing
shop. There will likely be new technologies in this area.
Ques 6
Joost
The steel B pillar would be pre-treated, e-coated and
primed prior to delivery to BIW assembly plant. The
aluminum panels would use pre-treatments similar to
the current aluminum bodied Lotus production sports
cars. Non-metallic washers provide galvanic isolation.
The assembly methodology is detailed in the body in
white plant section.
Stiffness
but the authors may need to address whether or not such extreme
stiffness values would be appealing to consumers of this type of
vehicle. While there doesn’t appear to be a major source of error in
the torsional stiffness analysis, the result does call into question the
accuracy; this is either an extraordinarily stiff vehicle, or there was
Ques 3
Joost
Allowing for a 10% error in the modeling capability, the
predicted stiffness is about 10% higher than the BMW
X5. The current X5 body stiffness was increased by 15%
vs. the previous generation. The expectation is that the
Phase 2 BIW torsional stiffness will be achieved by the

an error during the analysis. next generation X5. Increased body stiffness allows the
suspension to be better optimized for both ride and
handling.
Remarkable strength exhibited by the FEM roof under an FMVSS
test load raises questions validity of the model.
Ques 3
Richman
The roof structure is comparable to midsize SUV’s, e.g.,
the 2011-2012 Dodge Durango IIHS test results in a
maximum force of 105kN (ref: www.iihs.org). The high
strength steel B pillars, similar to those used on most
production steel vehicles, are key contributors to this
Unusual simulation results – [1] Models appear reasonable and
indicate the structure has the potential to meet collision safety
requirements. Some unusual simulation results raise questions
about detail accuracy of the models.
[2] FMVSS 216 quasi-static roof strength: Model indicates peak roof
strength of 108 KN. This is unusually high strength for an SUV type
vehicle. The report attributes this high strength to the major load
being resisted by the B-pillar. Several current vehicles employ this
construction but have not demonstrated roof strength at this level.
The report indicates the requirement of 3X curb weight is reached
within 20 mm which is typically prior to the test platen applying
significant load directly into the b-pillar.
[3] 35 MPH frontal rigid barrier simulation: Report indicates the
front tires do not contact the sill in a 35 MPH impact. This is highly
unusual structural performance. Implications are the model or the
structure is overly stiff.
4] Body torsional stiffness: Torsional stiffness is indicated to be 32.9
kN/deg. Higher than any comparable vehicles listed in the report.
PH 2 structure torsional stiffness is comparable to significantly
more compact body structures like the Porsche Carrera, BMW 5
series, Audi A8. It is not clear what elements of the PH 2 structure
contribute to achieving the predicted stiffness.
5] Door beam modeling: Door beams appear to stay tightly joined
to the body structure with no tilting, twisting or separation at the
lock attachments in the various side impact load modes. This is
highly unusual structural behavior. No door opening deformation
Ques 3
Richman
performance. The model was evaluated for FMVSS 216
performance (3x curb weight) using the Venza weight
and met the standard; this implies that the roof
strength is similar to the Venza. Because of the much
lower curb weight, the projected roof crush
performance is improved vs. the baseline vehicle.
FMVSS 208 rigid barrier performance addressed
previously.
4. Body stiffness addressed previously. The Lotus model
is 4” shorter than the referenced BMW 5 and 13”
shorter than the Audi A8 . The high torsional stiffness
was the result of a substantial amount of fine tuning
the model. The key was triangulating and boxing
sections and minimizing the affect of open sections.
5. The door beam system was bolted to the “A” and “B”
pillars using conventional iron mounting brackets; there
is a minimal amount of deflection. The result is that the
doors are predicted to open following the impact.

is observed in any frontal crash simulations. This suggests the door
structure is modeled as an integral load path. FMVSS requires that
doors are operable after crash testing. Door operability is not
addressed in the report.
Bending
Stiffness and
modal
frequency
analysis -
not reported
Report indicates “Phase 2 vehicle model was validated for
conforming to the existing external data for the Toyota Venza,
meeting best-in-class torsional and bending stiffness, and managing
customary running loads.” Only torsional stiffness is reported.
Modal frequency analysis data Is not reported.
Ques 3
Richman
All references to “validation” are being changed to
“model analysis results” or “FEA” results or their
equivalent; the reference to customary running loads
has been deleted. The BMW X5 torsional stiffness and
the test methodology has been published by BMW. The
Lotus model was evaluated using identical constraints.
BMW did not publish bending data so no comparison
was possible.
The modal frequency reference was deleted from the
report.
Report Summary of Safety Testing Results” indicates the mass
reduced body exhibits “best in class” torsional and bending
stiffness. The report discusses torsional stiffness but there is no
information on predicted bending stiffness. No data on modal
performance data or analysis is presented.
Ques 3
OSU
The baseline X5 was chosen because benchmarking
indicated it was the stiffest production SUV/CUV body
structure and significantly stiffer than the Venza which
Lotus tested. BMW published the torsional stiffness
but did not disclose the X5 bending stiffness so a
comparison was not possible.
Most areas of vehicle performance other than crash performance
were not addressed at all. Even basic bending stiffness and service
loads (jacking, towing, 2-g bump, etc) were not addressed. The
report claims to address bending stiffness and bending/torsional
modal frequencies, but that analysis is not included in the report.
Ques 6
Richman
Service loads were not part of the project scope.
Simulation
alone not
validation
Simulation results alone would not be considered “validation” of PH
2 structure safety performance.
Ques 1.
Joost
“Validation” comments deleted from the report.
Report states that “the mass-reduced vehicle was validated for
meeting the listed FMVSS requirements.” This is an overstatement
of what the analysis accomplished….. “Acceptable” levels were
Ques 3
Richman
Acceptable is based on Lotus experience internally and
externally and indicates that the performance level is
consistent with the test requirements for the specific

defined by Lotus without explanation. Results may be good, but
would not be sufficient to “validate” the design for meeting FMVSS
requirements.
stage of development.
Cannot truly be validated without building a physical prototype for
comparison.
Ques 3
Richman
All validation references have been deleted.
the models cannot be regarded as validated without some
correlation to physical test results.
Ques 3
OSU
Context changed to reflect that the modeling indicates
a level of performance that, if an actual vehicle were
built, there is a reasonable potential to meet the test
requirements.
Report Conclusions overstate the level of design “validation”
achievable utilizing state-of-the- art modeling techniques with no
physical test of a representative structure. From the work in this
study it is reasonable to conclude the PH 2 structure has the
potential to pass FMVSS and IIHS safety criteria.
Ques 5
Richman
Validation references eliminated.
The PH 2 study did not include physical evaluation of a prototype
vehicle or major vehicle sub system. Majority of the chassis and
suspension content was derived from similar components for which
there is extensive volume production experience. Some of the
technologies included in the design are “speculative” and may not
mature to production readiness or achieve projected mass
reduction estimates by 2020. For those reasons, the PH 2 study is a
“high side” estimate of practical overall vehicle mass reduction
potential.
Ques 5
Richman
It could turn out that some Phase 1 estimates were
aggressive. Most Phase 1 mass reducing opportunities
were at a late prototype or production level; not all
applications were automotive based. There could be
attrition in the technologies as well as the inability to
cost effectively transfer into the automotive sector. The
report doesn’t include technologies created after 2009
so there is the potential for new materials and
processes to be developed that reduce mass.
Some 2020 MY goals have already been achieved less
than three years after the study was initially written.
For example, the 2012 Hyundai Elantra rear seat system
weighs 20 kg or about 20% less than the 25 kg target
set for the Phase 1 2020 MY vehicle. The baseline 2009
Venza rear seat weight was 48 kg. Adding 15% mass to
the Elantra seat to normalize and add structure still
results in less mass than the Phase 1 2020 MY rear
seat.

A key unknown to reducing mass is the ability of OEM’s
to adopt a holistic, total vehicle approach. Setting
system mass and cost goals frequently creates conflicts
between groups that result in increased vehicle mass
and cost even though some systems achieve their
individual goals. Additionally, isolated single system
mass reductions, such as those achieved by light weight
closure systems, although helpful, will not drive mass
decompounding that leads to a lighter weight
suspension re-design and replacing a V6 engine with a
DI turbocharged, cylinder de-activated three cylinder
engine. A synergistic, total vehicle approach is required
to reach a “tipping” point that enables mass
decompounding.
Overstating the implications of available safety results discredits
the good design work and conclusions of this study.
Ques 5
Richman
The report has been revised to be conservative in what
the implications are as a result of the theoretical
modeling.
FMVSS test performance conclusions are based on simulated
results using an un-validated FE model. Accuracy of the model is
unknown. Some simulation results are not typical of similar
structures suggesting the model may not accurately represent the
actual structure under all loading conditions.
Ques 5
Richman
The model uses the same analysis techniques used for
current production vehicles. The fidelity is estimated at
10% of a finished production vehicle based on OEM
experience. The model can only be validated by
building an actual test vehicle.
Safety performance and cost conclusions are not clearly support by
data provided.
A major objective of the PH 2 study is to “validate” the light weight
vehicle structure for compliance with FMVSS requirements. State
of the art FEM and dynamic simulations models were developed.
Those models indicate the body structure has the potential to
satisfy FMVSS requirements. FMVSS requirements for dynamic
crash test performance is defined with respect to occupant loads
and accelerations as measured using calibrated test dummies. The
FEM simulations did not include interior, seats, restraint systems or
Ques 5
Richman
Model indicates feasibility for meeting performance
requirements as a result of the accelerations and
displacements of the model. References to occupant
responses have been deleted. Validation occurs with
the testing of an actual vehicle.

occupants. Analytical models in this project evaluate
displacements, velocities, and accelerations of the body structure.
Predicting occupant response based on body structural
displacements velocities and accelerations is speculative.
Simulation results presented are a good indicator of potential
performance. These simulations alone would not be considered
adequate validation the structure for FMVSS required safety
performance.
Most studies employing a finite element model validate a base
model against physical testing, then do variational studies to look at
effect. Going directly from an unvalidated FEM to quantitative
results is risky, and the level of accuracy is questionable
Ques 5
Richman
A physical model is required to validate the theoretical
modeling results.
Costing
Cost estimates for the PH 2 vehicle are questionable. Cost
modeling methodology relies on engineering estimates and supplier
cost projections. The level of analytical rigor in this approach raises
uncertainties about resulting cost estimates. Inconsistencies in
reported piece count differences between baseline and PH 2
structures challenge a major reported source of cost savings.
Impact of blanking recovery on aluminum sheet product net cost
was explicitly not considered. Labor rates assumed for BIW
manufacturing were $20/Hr below prevailing Toyota labor rate
implicit in baseline Venza cost analysis. Cost estimates for
individual stamping tool are substantially below typical tooling cost
experienced for similar products. Impact of blanking recovery and
labor rates alone would increase BIW cost by over $200.
Ques 1.
Joost
Intellicosting completed a forensic level cost analysis.
Intellicosting does not obtain supplier quotes. All costs
and prices are based on research and experience.
Intellicosting quoted a U.S. labor rate of $20.72 per
hour base. Fully fringed is $20.72 + 50% = $31.08 per
hour.
Intellicosting uses a standard die / tooling cost
estimating worksheet
Intellicosting reviewed and updated the part count
including only parts where cost was applied. Part count
= 259
Section 4.5.8.1 uses current “production” vehicles as examples for
the feasibility of these techniques. However, many of the examples
are for extremely high-end vehicles (Bentley, Lotus Evora, McLaren)
and the remaining examples are for low-production, high-end
vehicles (MB E class, Dodge Viper, etc.). The cost of some
technologies can be expected to come down before 2020, but it is
not reasonable to assume that (for example) the composites
Ques 2
Joost
Carbon fiber did not meet the cost criteria set for the
BIW and was not used on the Phase 2 BIW. The
composite material used for the floor was recycled PET
(the plastic used in water bottles). The “sandwich”
panels used directional glass reinforced PET outer plies
with a PET foam inner. The cost of this material is
substantially lower than carbon fiber.

technologies used in Lamborghinis will be cost competitive on any
time scale; significant advances in composite technology will need
to be made in order to be cost competitive on a Venza, and the
resulting material is likely to differ considerably (in both properties
and manufacturing technique) from the Lamborghini grade
material.
Carbon fiber, currently used on high end sports cars,
will be used for the upcoming BMW i3 EV body
structure. Per BMW, the pricing will be “very
competitive”; preliminary cost estimates from
Automobilwoche, a German magazine, put the cost at
between $44,000 and $50,000 depending on options.
The Nissan Leaf EV 2012 MSRP is $36,050. The i3 plus
cost is about 22%. This is much less than the typical
cost differential between a Nissan and a BMW and an
indicator that BMW has greatly reduced the
manufacturing cost for a carbon fiber body structure.
Another example that the automotive industry is
making substantial progress on utilizing light weight
materials and new construction processes into higher
volume, more mainstream vehicles is the Ford F-150.
The 2014 Ford F-150 (about 400,000 sales annually per
Edmunds.com) will reportedly have a riv-bonded
aluminum body
(http://online.wsj.com/article/SB100014240527023036
12804577531282227138686.html). This is the same
type of construction used for Lotus production sports
cars and the Phase 2 model.
Main weakness of the cost analysis is the fragmented approach of
comparing costs derived in different approaches and different
sources, and trying to infer relevant information from these
differences.
Ques 4
joost
This was a customer driven requirement.
Flat year-over-year wages for the cost analysis seems unrealistic. Ques 4
OSU
The trend is towards lower wages such as those
currently paid by Volkswagen at its US plant. See GM-
VW cost discussion below.
Vulnerability in this cost study appears to be validity and functional
equivalence of BIW design with 169 pieces vs. 407 for the baseline
Ques 4
Richman
Parts count revised from 407 to 269 to reflect only
costed parts.

Venza.
Total tooling investment of $28MM for the BIW not consistent with
typical OEM production experience. BIW tooling of $150-200MM
would not be uncommon for conventional BIW manufacturing. If
significant parts reduction could be achieved, it would mean less
tools, but usually larger and more complex ones, requiring larger
presses and slower cycle times.
Ques 4
richman
Intellicosting quotes tooling based on volume. The
$28MM is based on the low volume of vehicles
required. Tooling life is 250,000 parts.
Tooling estimates from Intellicosting are significantly lower than
have been seen in other similar studies or production programs and
will be challenged by most knowledgeable automotive industry
readers. Intellicosting estimates total BIW tooling at $28MM in the
tooling summary and $70 MM in the report summary. On similar
production OEM programs complete BIW tooling has been in the
range of $150MM to $200MM. The report attributes low tooling
cost to parts consolidation. This does not appear to completely
explain the significant cost differences between PH 2 tooling and
actual production experience. Parts consolidation typically results
in fewer tools while increasing size, complexity and cost of tools
used. The impact of parts consolidation on PH 2 weight and cost
appears to be major. The report does not provide specific
examples of where parts consolidation was achieved and the
specific impact of consolidation. Considering the significant impact
attributed to parts consolidation, it would be helpful provide
specific examples of where this was achieved and the specific
impact on mass, cost and tooling. Based on actual production
experience, PH 2 estimates for plant capital investment, tooling
cost and labor rates would be viewed as extremely optimistic
Ques 4
Richman
Intellicosting quoted low volume tooling verses high
volume.
Examples of part consolidation have been added to the
report.
Difficult to evaluate since this portion of the report was completed
by a subcontractor. The forming dies seem to be inexpensive as
compared to standard steel sheet metal forming dies.
Ques 4
osu
Intellicosting quoted low volume tooling verses high
volume.
Applying a consistent costing approach to each vehicle and vehicle
system using a manufacturing cost model approach. This approach
would establish a more consistent and understandable assessment
of cost impacts of vehicle mass reduction design and technologies.
Ques 4
richman
Intellicosting applies a consistent methodology using
our company developed application. An example of
Intellicosting methodology has been added to the
report.

The assessment of the energy supply includes a description of solar,
wind, and biomass derived energy. While the narrative is quite
positive on the potential for each of these energy sources, it’s not
clear in the analysis how much of the power for the plant is
produced using these techniques. If the renewable sources provide
a significant portion of the plant power, then the comparison of the
Ph2 BIW cost against the production Venza cost may not be fair.
The cost of the Venza BIW is determined based on the RPE and
several other assumptions and therefore includes the cost of
electricity at the existing plant. Therefore, if an automotive
company was going to invest in a new plant to build either the Ph2
BIW or the current Venza BIW (and the new plant would have the
lower cost power) then the cost delta between the two BIWs would
be different than shown here (because the current Venza BIW
produced at a new plant would be less expensive). The same
argument could be made for the labor costs and their impact on
BIW cost. By including factors such as power and labor costs into
the analysis, it’s difficult to determine what the cost
savings/penalty is due only to the change in materials and assembly
– the impact of labor and energy are mixed into the result.
Ques 4
Joost
This is a 2020 model vs. a current production plant. The
study was done by an experienced manufacturing
team, EBZ, who builds plants for major European OEMs
including BMW, Audi and VW. Lotus believes that OEMs
will incorporate what Europe is doing today in terms of
low environmental impact and sustainable energy into
their US assembly plants.
This trend is already starting in the US. The Subaru of
Indiana assembly plant has “zero landfill” meaning that
all plant waste is either recycled or turned into
electricity. A single-family home produces more waste
in a day than the Subaru Indiana plant does in a year.
Source: Subaru.com
No attempt was made to predict how Toyota would
build a CUV eight years from now.
The number of workers assigned to vehicle assembly in this report
seems quite low. Extra personal need to be available to replace
those with unexcused absences. Do these assembly numbers also
include material handling personnel to stock each of the
workstations?
While this work does make a compelling case it downplays some of
the very real issues that slow such innovation in auto
manufacturing. Examples: multi-material structures can suffer
accelerated corrosion if not properly isolated in joining. Fatigue
may also limit durability in aluminum, magnesium or novel joints.
Neither of these durability concerns is raised. Also, automotive
manufacturing is very conservative in using new processes because
one small process problem can stop an entire auto manufacturing
Ques 4
OSU Labor figures include material handling personnel.
They do not include paying for extra plant
personnel with no assignments.
See previous discussion.
The 2014 Ford F-150 (400,000 sales) will reportedly
use a riv-bonded all aluminum body structure.

plant. Manufacturing engineers may be justifiably weary of
extensive use of adhesives, until these are proven in mass
production in other environments. These very real impediments to
change should be mentioned in the background and conclusions.
IC Summary – Cost projections . . . lack sufficient rigor to support
confidence in cost projections and in some cases are based on
“optimistic” assumptions. Significant cost reduction is attributed to
parts consolidation in the body structure. Part count data
presented in the report appears to reflect inconsistent content
between baseline and PH 2 designs. Body manufacturing labor
rates and material blanking recovery are not consistent with actual
industry experience. Using normal industry experience for those
two factors alone would add $273 to body manufacturing cost.
Tooling cost estimates for individual body dies appear to be less
than half normal industry experience for dies of this type.
Ques 4
richman
Intellicosting applies a consistent methodology using
our company developed application. See example of
Intellicosting methodology. Intellicosting uses their
methodology to support many international OEMs.
System cost assumptions based on average sales margin and
detailed engineering judgments can be a reasonable first order
estimate. These estimates can be useful in allocation of relative to
costs to individual vehicle systems, but lack sufficient rigor to
support definitive cost conclusions
Ques 4
Richman
Intellicosting does not apply recovery for scrap material
in our calculation / methodology.
This information was also added to the report as
clarification.
Body costs for PH 2 design were estimated by combining scaled
material content from baseline vehicle (Venza) and projected
manufacturing cost from a new production processes and facility
developed for this project. This approach is logical and practical,
but lacks the rigor to support reliable estimates of new design cost
implications when the design changes represent significant
departures from the baseline design content.
Ques 4
Richman
Intellicosting applies a consistent methodology using
our company developed application. See example of
Intellicosting methodology. Intellicosting uses their
methodology to support many international OEMs.
Body piece cost and tooling investment estimates were developed
by Intellicosting. No information was provided on Intellicosting
methodology. Purchased component piece cost estimates
(excluding BIW) are in line with findings in similar studies. Tooling
costs supplied by Intellicosting are significantly lower than actual
production experience would suggest.
Ques 4
Richman
Intellicosting applies a consistent methodology using
our company developed application. See example of
Intellicosting methodology. Intellicosting uses their
methodology to support many international OEMs.
Intellicosting quotes tooling based on volume. The
$28MM is based on the low volume of vehicles

required. Tooling life is 250,000 parts.
The PH 2 study indicates and aluminum based multi material body
(BIW, closures) can be produced for at a cost reduction of $199
relative to a conventional steel body. That conclusion is not
consistent with general industry experience. This inconsistency
may result from PH 2 assumptions of material recovery, labor rates
and pars consolidation.
A recent study conducted by IBIS Associates “Aluminum Vehicle
Structure: Manufacturing and Life Cycle Cost Analysis” estimated a
cost increase $560 for an aluminum vehicle BIW and closures.
http://aluminumintransportation.org/members/files/
active/0/IBIS%20Powertrain%20Study%20w%20cover.pdf
That study was conducted with a major high volume OEM vehicle
producer and included part cost estimates using detailed individual
part cost estimates. Majority of cost increases for the low mass
body are offset by weight related cost reductions in powertrain,
chassis and suspension components. Conclusions from the IBIS
study are consistent with similar studies and production experience
at other OEM producers.
Ques 4
Richman
The estimated Phase 2 BIW piece cost increase was
over $700 more than the baseline all steel vehicle. The
use of less expensive tools, such as extrusions, the
reduced number of tools due to fewer parts required,
lower assembly costs due to the use of less expensive
joining methods and fewer parts to be handled partially
offset the more expensive body.
The synergistic cost savings from other areas of the
vehicle (from the Phase 1 report) were also included
and further offset the Phase 2 body cost. The peer
reviewed Phase 1 2020 model achieved an estimated
mass reduction of near 40% for all non-BIW systems
(less powertrain) while using primarily similar materials.
The savings associated with the elimination of 40% of
the materials from the baseline vehicle systems helps
to further offset the BIW cost. This resulted in an
estimated average savings of about 4% for the non-BIW
systems. Because this was approximately 80% of the
manufacturing cost, the total weighted cost with the
BIW included was at near parity with the baseline
vehicle.
Material Recovery -- Report states estimates of material recovery in
processing were not included in the cost analysis. Omitting this
cost factor can have a significant impact on cost of sheet based
aluminum products used in this study. Typical auto body panel
blanking process recovery is 60%. This recovery rate is typical for
steel and aluminum sheet. When evaluation material cost of an
aluminum product the impact of recovery losses should be included
in the analysis. Potential impact of material recovery for body
panels:
Approximate aluminum content (BIW, Closures) 240 Kg
Ques 4
Richman
Sheet utilization varied from part to part. The full sheet
cost was used with no allowance for the unused
material, i.e., Intellicosting did not apply scrap material
recovery in their calculation / methodology. There was
no allowance for the lost material from blanking
operations to be recovered as an offset to material
costs.

Input material required at 60% recovery 400 Kg
Blanking off-all 160 Kg
Devaluation of blanking off-all (rough estimate)
Difference between raw material and
Blanking off-all $1.30/Kg $211
Blanking devaluation increases cost of aluminum
sheet products by over $ 0.90/Kg.
Appropriate estimates of blanking recoveries and material
devaluation should be included in cost estimates for stamped
aluminum sheet components. Recovery rates for steel sheet
products are similar to aluminum, but the economic impact of steel
sheet devaluation is a significantly lower factor in finished part cost
per pound.
Report indicates total cost of resistance spot welding (RSW) is 5X
the cost of friction spot welding (FSW). Typical total body shop cost
(energy, labor, maintenance, consumable tips) of a RSW is $0.05 -
$0.10. For the stated ratio to be accurate, FSW total cost would be
$0.01-$0.02 which appears unlikely. It is possible the 5X cost
differential apply to energy consumption and not total cost.
FSW (friction stir welding) was not used. Friction Spot
Joining (FSJ), a process developed by Kawasaki Heavy
Industries, was utilized. The FSJ process uses a small
servo-motor to spin a unique drill bit that engages two
sheets of aluminum and flows the parts together. The
material remains in the plastic (not molten) region so
the parent material properties are maintained. Per
Kawasaki
(www.khi.co.jp/english/robot/product/fsj.html)
“ the FSJ system uses less than 1/20th the power
consumed by resistance spot welding equipment. In
addition, there is no need for large-capacity power
supply equipment resulting in a reduction in overall
equipment costs.”
Labor rates -- Average body plant labor rates used in BIW costing
average $35 fully loaded. Current North American average labor
rates for auto manufacturing (typically stamping, body production
and vehicle assembly)
Toyota $55
Ques 4
Richman
The industry trend is towards lower labor costs. GM is
targeting a 40% reduction in labor costs at the Lake
Orion, Michigan plant that builds the Chevrolet Sonic
and will use that as a model for other US plants
(http://www.gminsidenews.com/forums/f12/how-

GM $56 (including two tier)
Ford $58
Honda $50
Nissan $47
Hyundai $44
VW $38
Labor rate of $35 may be achievable (VW) in some regions and
circumstances. The issue of labor rate is peripheral to the central
costing issue of this study which is assessing the cost impact of light
weight engineering design. Method used to establish baseline BIW
component costs inherently used current Toyota labor rates.
Objective assessment of design impact on vehicle cost would use
same labor rates for both configurations.
Labor cost or BIW production is reported to be $108 using an
average rate of $35. Typical actual BIW labor content from other
cost studies with North American OEM’s found actual BIW labor
content approaching $200. Applying the current Toyota labor rate
of $55 to the PH 2 BIW production plan increases labor content to
$170 (+$62) per vehicle.
small-car-helping-rewrite-labor-costs-u-s-plant-104321/
). Improved efficiency, using contract non-union labor
(about $20/hr with benefits) as well as continued
replacement of retiring workers with Tier 2 workers (
about 60% of the existing hourly rate) are expected to
continue to reduce GM labor rates. This trend was
projected to the 2020 timeframe but VW is already very
close to this rate today.
The Volkswagen Tennessee assembly plant pays
$14.50/hr and utilizes $12/hr contract employees.
http://www.wsws.org/articles/2011/sep2011/chat-
s23.shtml
Identical labor rates were used for both the Venza body
costs and the Phase 2 body costs.
Two keys to lower assembly costs are: 1. reducing
assembly time by substantially reducing the parts count
and 2. utilizing less costly joining processes. The Phase
2 BIW uses structural adhesives which allow greater
spacing between the joints (needed for peel) which
reduces the number of joints significantly. A typical
CUV/SUV requires 5,000 welds at about $0.05/weld.
That is approximately $250 in joining costs; reducing
the number of joints by about 50% and substantially
decreasing the joint costs more than offsets the added
cost of using structural adhesive bonding. This cost
savings was applied to offset the more expensive Phase
2 BIW piece costs.
Clallam county, WA is an interesting choice for the plant location (I
grew up relatively nearby). Port Angeles is not a “major port” (total
population <20,000 people) and access to the area from anywhere
Ques 6
Joost
Section eliminated.

else in the state is inconvenient.
Piece count
reduction
concerning
BIW Design Integration -- Report identifies BIW piece count
reduction from a baseline of 419 pieces to 169 for PH 2. Significant
piece cost and labor cost savings are attributed to the reduction in
piece count. Venza BOM lists 407 pieces in the baseline BIW. A
total of 120 pieces are identified as having “0” weight and “0” cost.
Another 47 pieces are listed as nuts or bolts. PH 2 Venza BOM lists
no nuts or bolts and has no “0” mass/cost components. With the
importance attributed to parts integration, these differences need
to be addressed.
Closure BOM for PH 2 appears to not include a number of detail
components that are typically necessary in a production ready
design. An example of this is the PH 2 hood. PH 2 Hood BOM lists 4
parts, an inner and outer panel and 2 hinges. Virtually all practical
aluminum hood designs include 2 hinge bracket reinforcements, a
latch support and a palm reinforcement. Absence of these practical
elements of a production hood raise questions about the functional
equivalency (mounting and reinforcement points, NVH,
aesthetics,…) of the two vehicle designs. Contents of the Venza
BOM should be reviewed for accuracy and content in the PH 2 BOM
should be reviewed for practical completeness.
Ques 4
Richman
Intellicosting reviewed and updated the part count
including only parts where cost was applied. Part count
= 259.
There were two scenarios used for the hood: 1. a
typical hinged hood system; and 2. a fixed (bolt on)
hood. For the fixed hood, a lightweight hinged panel for
fluid checking and fluid filling is incorporated into the
front fascia . The bolt-on hood mass was used for the
BOM. The crash models were evaluated using a “worst
case” hinged hood system. There is no need for local
hood hinge reinforcements on this model nor is there a
need for a “palm” reinforcement since there are no
hinges and the hood doesn’t open.
This approach saves a significant amount of weight by
eliminating the hinge system and is an example of
mass decompounding.
Failure
specification
s for
materials
Materials properties describing failure are not indicated (with the
exception of Mg, which shows an in-plane failure strain of 6%). It
seems unlikely that the Al and Steel components in the vehicle will
remain below the strain localization or failure limits of the material;
it’s not clear how failure of these materials was determined in the
models. The authors should indicate how failure was accounted for;
if it was not, the authors will need to explain why the assumption of
uniform plasticity throughout the crash event is valid for these
materials. This could be done by showing that the maximum strain
Ques 1
Joost
Addressed previously.

conditions predicted in the model are below the typical localization
or failure limits of the materials (if that is true, anyway).
Model assumes no failures of adhesive bonding in materials during
collisions. Previous crash testing experience suggest[s] some level
of bonding separation and resulting structure strength reduction is
likely to occur.
Ques 3
Richman
There could be some degradation in the areas that are
adhesively bonded; however, the local degradation in
the bonded regions would have a minimal impact on
the global results. These types of bonding related issues
are typically dealt with by doubling up on the adhesive
application (2 strips vs. one) or adding a weld or
mechanical fastener during development (crash) testing
with actual vehicles.
Part Count The radical part count reduction needs to be more fully explained
or de-emphasized. Report also should address the greatly reduced
tooling and assembly costs relative to the experience of today's
automakers. Some conservatism would be appropriate regarding
potential shortcomings in interior design and aesthetics influencing
customer expectations and acceptance.
Ques 1
Richman
Parts count revised to eliminate 0 mass parts.
references References for all of the materials and adhesives would be very
helpful.
Ques 1
OSU
References and suppliers included in the report for all
materials.
One broad comment is that this report needs to be more strongly
placed in the context of the state of the art as established by
available literature. For example the work only contains 7 formal
references. Also, it is not clear where material data came from in
specific cases (this should be formally referenced, even if a private
communication) and the exact source of data such in as the
comparative data in Figure 4.3.2 is not clear. Words like
Intillicosting are used to denote the source of data and we believe
that refers to a specific subcontract let to the firm ‘intellicosting’ for
this work and those results are shown here. This needs to be made
explicitly clear.
OSU Ques
1
More detailed references to the suppliers and their
background and their role was added. The suppliers
included Alcoa (aluminum support), Meridian
(magnesium support), Henkel (coating, lab testing and
structural composite insert support), Allied Composites
(composite support), EBZ (assembly plant design), and
Intellicosting (costing support).
Misc I would suggest that a short summary be added describing the
major changes of the Phase 2 design with respect to the original
High Development vehicle body design.
Added.
This reviewer sat down with the person who created and ran the
LS-DYNA FEA models. Additional insight into how the model
Ques 3
OSU
The Ohio State University peer reviewers met with
Lotus to review confidential portions of the software

performs and specific questions were answered on specific load
cases. All questions were answered.
analysis that could not be publicly released. The OSU
team reviewed the background information, how it was
set up and how the dropdowns fed into the primary
analysis that formed the basis of the final FEA models.
The below information is a summary of the analysis
methodology.
The model was created from CAD data that was
provided for all of the various components that made
up the ARB vehicle structure. A set of guidelines was
used to create the model; these are general guidelines
for creating an appropriate finite element model.
Discretion was used during any meshing to determine
the level of detail and quality required. Models were
created with the following typical conditions:
All holes less than 10mm in diameter ignored
Holes >ø10mm should be modeled with a least a single
concentric ring of elements
At least two rows of elements weld flanges
Spot-welds (i.e. friction spot connections) were
modeled with single solid elements (type #1)
BIW and Closure shell definitions have 5 integration
points
Tied contact’s were defined as
*CONTACT_TIED_NODE_TO_SURFACE_OFFSET or
*CONTACT_TIED_SHELL_EDGE_TO_SURFACE_OFFSET
(*CONTACT_SPOTWELD definition will be used for
‘weld’ beam definitions)
Mesh quality checks were made to ensure the elements
met the criteria set for the following:

Element mesh size
Number of triangles per panel
Tria. Interior angle
Quad Interior angle
Warping
Jacobian
Aspect Ratio
Total %age of failed elements <1% (from all element
quality criteria’s)
Components were also checked for:
Free edges, duplicate elements, consistent shell
element normal, LS-DYNA part names (for
easier identification) and that tied contacts attach at all
nodes
The flat frontal model had ~995,000 elements (1-D, 2-D
and 3-D)
to provide additional credibility to the manufacturing assessment it
would be helpful to include a description of other work that EBZ has
conducted where their manufacturing design work was
implemented for producing vehicles. Lotus is a well-known name,
EBZ is less well known.
Ques 4
Joost
EBZ, the firm Lotus contracted to engineer the Phase 2
BIW assembly plant, has designed assembly plants for
Audi, BMW, VW, Porsche, Jaguar-Land Rover, Ford
(Europe) as well as other international OEM’s. This
information was added to the report. The analysis is based on specific density which assumes that the
architecture of the vehicles is the same. For example, the front-end
crash energy management system in a micro car is likely quite
different from the comparable system in a large luxury car (aside
from differences in gauge to account for limited crash space, as
discussed in the report). While this analysis provides a good starting
point, I do not feel that it is reasonable to expect the weight
reduction potential to scale with specific density. In other words, I
think that the 32.4 value used in the analysis also changes with
Ques 5
Joost
The objective was to create a predictive model based
on current vehicles. The model will change as the size
and mass of future vehicles evolve.

vehicle size due to changes in architecture. Similarly, the cost
analysis projecting cost factor for other vehicle classes is a good
start, but it’s unlikely that the numbers scale so simply.
Fundamental engineering work is very good and has the potential
to make a substantial and important contribution to industry
understanding of mass reduction opportunities. The study will
receive intense and detailed critical review by industry specialists.
To achieve potential positive impact on industry thinking, study
content and conclusions must be recognized as credible. Unusual
safety simulation results and questionable cost estimates (piece
cost, tooling) need to be explained or revised. As currently
presented, potential contributions of the study are likely to be
obscured by unexplained simulation results and cost estimates that
are not consistent with actual program experience.
Absolutely. Recommended adjustments summarized in Safety
analysis, and cost estimates (recommendations summarized in
attached review report). Credibility of study would be significantly
enhanced with detail explanations or revisions in areas where
unusual and potentially dis-crediting results are reported.
Conservatism in assessing CAE based safety simulations and cost
estimates (component and tooling) would improve acceptance of
main report conclusions.
Impact of BIW plant site selection discussion and resulting labor
rates confuse important assessment of design driven cost impact.
Suggest removing site selection discussion. Using labor and energy
cost factors representative of the Toyota Venza production more
clearly identifies the true cost impact of PH 2 design content.
Ques 6
Richman
The overall tone of paper was reviewed and revised as
required to insure that it is conservative relative to the
meaning of the results and their potential
implementation. The study indicates potential but does
not represent that the model will result in a vehicle that
will meet the FMVSS and IIHS requirements. That will
require building a vehicle and verifying the
performance.
The “unusual simulation results”, e.g., roof crush, are
consistent with the production 2011-2012 Dodge
Durango. The 2011-2012 Dodge Durango IIHS test
results in a maximum force of 105kN (ref:
www.iihs.org). Additionally, a 10% modeling error vs.
actual would reduce the maximum force to 97 kN (from
108 kN).
The high strength steel B pillars on the Phase 2 BIW are
similar to those used on production steel bodied
vehicles and are key contributors to the roof strength.
Using a key structural part similar to those designed for
much heavier vehicles on the light weight Phase 2 BIW
body structure provided a substantial performance
margin for roof crush and aided in side impact
performance.
The “questionable cost results” were addressed earlier
including revising the cost analysis and the parts count.
The Phase 2 BIW piece cost was $730 higher than the
baseline which is consistent with the estimated $560

provided by the reviewer. The tooling and assembly
related savings detailed previously helped to offset the
increased cost BIW. The Phase 1 peer reviewed paper
was used as the basis for additional, non-BIW related,
cost offsets that impacted the total vehicle cost.
The site selection discussion was deleted.
The reader can substitute internal labor rates and
calculate the impact on the BIW assembly costs. As
previously discussed, the future trend is towards lower
labor rates; GM is targeting VW’s labor rates. VW
(Tennessee assembly plant) is currently paying
$14.50/hr to direct employees and $12.00/hr to
contract employees (as cited previously).
The proposed engine size is based on the assumption that
decreasing the mass of the vehicle and holding the same power–to-
weight ratio will keep the vehicle performances alike. This
assumption is true only if the coefficient of drag (Cda) will also
decrease (practically a perfect match in all the dynamic regards is
not possible because the quadratic behavior of the air vs speed).
The influence of the airdrag is typically higher than the general
perception. In this particular case is very possible that more than
half of the engine power will be used to overcome the airdrag at 65
mph. Therefore aerodynamic simulations are mandatory in order to
validate the size of the engine.
Ques 6
OSU
The baseline body in white incorporated a variety of
aero aids including a flat underbody, 10mm lower roof
height, integrated rear vision system and a fixed hood
(no fender gaps).
The low mass Phase 2 vehicle requires 123 HP to
maintain the Venza’s wt/HP ratio. Using a 32 ft2 frontal
area, a 0.28 Cd and an 1173 kg weight yields an
estimated 12.2 HP required to drive the Phase 2 vehicle
at 70 MPH.


PEER REVIEW OF THE LOTUS REPORT DEMONSTRATING THE SAFETY AND CRASHWORTHINESS OF A 2020 MODEL YEAR, MASS REDUCED
CROSSOVER VEHICLE
Conference Call
Friday, December 2, 2011
Participating in the call:
Will Joost, DOE
Doug Richman, Kaiser Aluminum
Srdjan Simunovic, ORNL
David Emerling and C.G. Cantemir, OSU
Gregg Peterson, Lotus Engineering
Cheryl Caffrey, EPA
Brian Menard and Doran Stegura, SRA
NOTE: Reviewers should send follow-up questions to Brian Menard by COB Monday, December 5, for prompt response by Lotus so that
reviewers are able to submit their final comments by December 14.

Issue 1:
The Labor Rate appears lower than industry standard and why is renewable energy included in the cost? Acknowledging that this is a small
contributor to the cost, but question just the same.
This question is related to the piece cost issue. Did these 2 factors influence costs very much?
Lotus Engineering (Lotus) Response:
[1] The report will include a cost for the BIW using a typical industry rate as well as the known labor rate stipulated for the plant site. [2] The energy cost is $69/vehicle; the assumption is that the plant uses conventional electrical power to build the body structure and closures. There is a discussion in the manufacturing report relative to using sustainable energy and the advantages and disadvantages. EBZ, the firm that designed the plant, is a European company and typically equips their current customer manufacturing facilities with solar roofs and includes potential wind turbines sites. In other words, on site sustainable energy systems are already common in European automotive plants. We see that trend being mainstream in the US in the timeframe of this vehicle. Because we expect conventional steel BIW plants to do the same, there is no cost savings assigned to the use of sustainable energy vs. conventional sources (coal, hydro, nuclear).
To the reviewer’s knowledge the Toyota plant has the lowest costs in the US, but these rates are lower than these
Ok for other plants but may not be applicable for automobile plants (est. $55/hr)
Piece Cost and Labor Content - labor rates are different for 1) and 2) below
1) **Manufacturing study (assembly, stamping – Toyota in-house parts)
2) Part component cost – no – labor rates realistic
Issue 2:
Body Build - Are Mag parts coated?
o Were sheet metal parts pre-treated? Anodized aluminum
o Nobody is anodizing sheets for aluminum in NA (automotive production)
Lotus Response: Lotus uses anodizing.

Most body programs use some sort of a coating so as long as there’s a cost for coating the sheet metal then that’s ok.
Issue 3:
Material property – were these minimal or typical properties? Toyota insists on minimal properties in design.
Lotus Response: The baseline Venza BOM is being revised to clarify that the $0 cost, 0 kg mass parts are already included in sub-
assemblies; this shows the individual parts but does not include their cost and mass as that would be double counting the parts. The material specifications were provided by the material supplier; these specifications are the same as those provided to any supplier/OEM using those materials.
Issue 4:
Durability is mentioned several times in the report and Lotus has experience in durability. Otherwise, there is no other analysis of durability.
How comfortable is Lotus with durability? The paper lacks analysis with NVH and fatigue issues – not addressed and may result in some
additional weight.
Lotus Response: Durability is beyond the scope of the project; however, Lotus did due diligence with coupon testing and past experience and
other things in joining and materials.
Louts has built aluminum rear bonded vehicles for 16-17 years – the cars are used more at tracks than public roads, has adhesive bonding
experience
Lotus Response: Lotus will place a statement to this effect in the final report.
Lotus has been told they’re overdesigned. IIHS – 4x wt for roof crush, FMVSS – 3x wt for roof crush and Lotus uses 6x weight for roof crush –
hence no need to add additional weight
Issue 5:
The mass damper was removed from the Lotus original design –
Lotus Response: Toyota had hands tied and bandages were evident throughout the BIW. With the Lotus design it is possible to remove these
bandages.

Issue 6:
L3 engine – 1 L Engine isn’t in production yet, but well along… Lotus Saber engine – has balance shaft.
Issue 7:
Collision performance says body is quite stiff
Data is coming that says body is “remarkably stiff”
As part of process – 50 mph flat not have any discontinuities
Evident in pulse time for crash events
Tire and wheel don’t hit cross tire – interesting observation
Lotus Response: Engine mount design was worked over to get this result.
Issue 8:
Appendix C-1 – part count – body BOM – quite a large number of 0 cost 0 weight parts removed – 127 parts were 0 wt, 0 cost,
47 nut/weld studs in original – no nuts/studs listed in new vehicle parts list
407 parts seem like a very large number of parts in the original Venza compared to other programs reviewers has experience with
BIW – Venza – Phase 1 welded – not costed and no weight – how is it considered a part then? Numbers missing?
Lotus Response: Lotus will provide additional information to the reviewers.
Issue 9:
Is report for a technical audience or an illustration of possibilities to the general public?
Add more info for technical document – mention CAE done on HD vehicle earlier in report

Material data – isotropic – for modeling all materials
Material 24 in Dyna
Issue 10:
For each material, explain why specific material selected for later on – materials are tied together
Give info on grades of aluminum used in various locations in the vehicle
Mag – only one – AM60 – only one property given, but how was this decided?
Explain materials choices – hot stamped boron used in door beams –for don’t want to have large displacement…..
Mag – chose AM rather than AZ for galvanic properties
Lotus Response: Lotus worked with Alcoa and others for stiffness.
Lotus Response: Agreed to include language in the report concerning efforts with suppliers and supplier recommendations and test results.
Which aluminum used where in BOM at end of report – bring up front part of report
Why use 6061 in rails and not 6063 – or other way around?
Issue 11:
Use different FEA technologies for different parts – was the cast mag a solid element or approximated by shells?
Issue 12:
Stiffness – one crash – page 72 have test from NHTSA to compare results – new design consistently higher than original vehicle - explain.
Any other tests NHTSA ran? Bring other comparisons
Lotus Response: The original Venza had higher peak pulse than the new vehicle.

Srdjan Simunovic said that new vehicle has earlier spike and lower difference between simulation and real car crash.
Lotus Response: Lotus changed materials 10% (sensitivity) and changed peak acceleration by 30%. Lotus wanted tuning to ensure not fire
airbag early hence control peak acceleration, chose 23g 1st
35ms - beyond scope to do full airbag development.
Simunovic suggested Lotus include explanation – graphs not as valuable as discussion as to decisions. Done.
Lotus Response: Agreed to incorporate the reviewer’s recommendations.
Issue 13:
In Sec. 4.5.8 Lotus lists systems (ex: aluminum extrusion) and lists where systems are in production – the places in production include very high
end vehicles such as the McLaren and other similar cars. Any higher production such as the Toyota Prius/Chevy Cruze?
Lotus Response: Agreed to take this into consideration.
Says costs estimate is applicable to higher volume
Issue 14:
Design shows lots of 6022 aluminum – not standard in automotive – is it?
Doug Richman: It is used in body sheet.
6013 not used much now, but will likely be used in body sheet in next 10 years
Not revolutionary - there are 2 plants with high volume in North America
Doug mentioned none of the aluminum have aerospace technology – more civilian markets.
Issue 15:
Can you stamp and form this aluminum at room temp?
Richman: Yes, absolutely- from an industry perspective.

Issue 16:
Does moving from friction spot welding to friction spot joining save money?
Lotus Response: Spot joining is used with adhesive and so uses half as many joints as spot welding—this is a Kawasaki process which allows
the aluminum to stay in parent properties and not change properties.
Is there any riveting or spot riveting?
Lotus Response: Yes, it includes riveting and spot welds.
Issue 17:
Crash simulation question in the charge letter – “whether lotus can be validated” – what are you looking for? EPA will clarify this.
Issue 18:
Remove discussion to Phase 1 report – is it needed?
EPA Response: It should be considered that the report assumes the mass reduction and costs from all of the other parts of the vehicle from
the Phase 1 report.
Lotus Response: The report is being reviewed to eliminate any need for the reader to refer to the Phase 1 report. The intent is that the
Phase 2 report is complete by itself and does not require the reader to read another large (300 page) document as a requirement for fully
understanding the Phase 2 report. In other words, all pertinent Phase 1 information will be included in the Phase 2 report rather than
refer the reader to the Phase 1 report.
Issue 19:
It was noted that the model takes away the spare tire and tool kit – this results in a notable mass and cost savings – is this a philosophy
difference on whether this is reaching too far? No further discussion at this time. The issue does need to be addressed.
Issue 20:

Test of marketability - Interior radical – departures from expectations – smaller steps may be needed – bad reaction ex: Honda Civic
Honda Civic downgraded interior – major decline in sales and marketability. Will have new model in 2 years to try to recover (sooner than 5
typical)
Parts look cheaper and fit and finish is bad – took out weight and cost out and road tests of vehicle not good.
Lotus Response: The materials were not downgraded; they were either kept on par or were upgraded. Lotus received feedback that the Lotus
interior was preferred over the original Venza interior and that the Lotus materials were soft to the touch and high grade.
Issue 21:
It is important to proofread the numbers in the tables and graphs and those referred to in the report text as in some instances they are
inconsistent.
Intellicosting Process Steps:
Component Cost Analysis:
• Photograph and weigh total component or assembly
• Disassemble component and create Bill of Material structure
• Weigh and photograph individual parts
• Allocated components to cost analysts:
o Mechanical: Plastic/Die Castings
o Electronics: PCB/Sensors/Cameras
• Cost analysts will enter physical dimension and manufacturing location data into Intellicosting Cost modeling application
• Cost modeling (high level) description:
o Plastic example:
� Cost analyst will determine material type
� Part dimensions (wall thickness/overall projected area) will be entered cost model
� Production volume and manufacturing region will be entered into Cost Model

� Cost analyst will select correct tonnage of machine to effieciently product component
• Machine level data resident in cost model (portion):
o Machine cost
o Machine installation costs
o Cycle times
o Efficiencies
o # or % of operator required to man machine
o Amount of regrind material
o Manual or automate part handling
� Cost analyst will determine based on entire manufacturing process, the size of facility required to produce part
� The cost model will analyze all the inputs and create a final report that will include:
• Operational step, such as Op 10 Melting
• Machine description: Name / Tonnage
• Geographic region: State or Country
• Cycle times
• Fixed/Variable costs
• Total costs for each Operational step and entire assembly
� Cost analyst will determine tooling requirement for component
o Electronics:
� Cost Analyst will photograph and weigh printed circuit board
� Cost Analyst will determine board population methodology
� Cost Analyst will review type and functions of components
� Cost Analyst will research costs for components based on volume and purchasing power
� Cost Analyst will de-laminate integrated circuits to review silicone die, to determine die manufacturing yield rate.
� Cost analyst will create virtual production line equipment:
• Chip placement (shooters)
• Component feeders
• Soldering process
• In-Line testing

• End of line testing
� Cost Analyst will determine Engineering Design and Development cost associate with each functional group required to
develop Print Circuit Board over a determined period of time (ex: 4 years)
� Facility size and manpower requirements are entered into cost model
� Cost analyst will review preliminary final report with Quality Peer Review team
� Upon approval Cost Analyst will submit Final Report to Client