Embed Size (px)
Citation preview
PEER-REVIEWED ARTICLE bioresources.com
Ahmad Yahaya et al. (2017). “Phenolics in EFBs,” BioResources 12(3), 4594-4605. 4594
Analysis of Phenolic Compounds in Empty Fruit Bunches in Oyster Mushroom Cultivation and in Vermicomposting
Ahmad Naim Ahmad Yahaya,a,* Md. Sohrab Hossain,a and Robert Edyvean b
Analyses of total phenolic compounds were carried out for oil palm empty fruit bunches (EFBs) vermicomposting in oyster mushrooms cultivation. The oyster mushrooms (Pleurotus sajor-caju) were cultivated according to the large-scale vermicomposting trial (LSVT) methods. Both oyster mushrooms cultivation and vermicomposting of EFB with earthworms enhanced the lignin degradation of EFB. Analysis of total phenolic compounds EFB vermicomposting treated with earthworms showed a decrease in total phenolics concentration from 31.1 GAE/100g extract (raw EFB) to 5.66 g GAE/100g extract (after oyster mushroom cultivation) and to less than 1.5 g GAE/100g extract at the end of vermicomposting. Gas chromatography–mass spectrometry (GC-MS) analysis of the mushroom fruiting body, spent mushrooms, and vermicompost showed no trace of phenolphenol, pyrocatechol, 4-hydrobenzoic acid, or antioxidant and flavonoid phenolics, e.g., phenol, 3,4-dimethoxy-, vanillic acid, and cinnamic acid. This indicates that the mushroom fruiting body is fit for human consumption and the final vermicompost is a useful agricultural product without the detrimental effects of spreading phenolics-loaded
EFBs on the land.
Keywords: Phenolic compounds; Empty fruit bunch; Vermicomposting; Oyster Mushroom
Contact information: a: Universiti Kuala Lumpur, Malaysian Institute of Chemical &Bioengineering
Technology, Lot 1988, Taboh Naning, 78000 Alor Gajah Melaka, Malaysia; b: The University of Sheffield
Department of Chemical and Biological Engineering, Sheffield, UK;
* Corresponding author: [email protected]
INTRODUCTION
Malaysia is one of the largest palm oil producers in the world, accounting for
approximately 37% of the total world palm oil production in 2011 (Sharma et al. 2012).
Although the production of palm oil by Malaysian palm oil industries has boosted the
national economy, it also generates a vast amount of oil palm biomass, including oil palm
empty fruit bunches (EFBs), during processing of fresh fruit bunches for palm oil
production (Tye et al. 2016). Oil palm EFBs are produced in large quantities in localized
areas. The traditional practice has been to use it as fuel for small-scale generation of steam
at the palm mills. However, this method has been prohibited since Malaysia strengthened
air quality regulations, so a new method of disposal for EFBs is needed. Thus, there is an
opportunity to develop a low-cost method to produce vermicompost using unsterile/
untreated EFB.
Several phenolic acids can be found in EFBs, such as p-hydroxybenzoic acid,
vanillic acid, p-coumaric acid, ferulic acid, and vanillin (Mohamad Ibrahim et al. 2008;
Multari et al. 2016). Phenolic compounds in other lignocellulosic materials, like wheat and
PEER-REVIEWED ARTICLE bioresources.com
Ahmad Yahaya et al. (2017). “Phenolics in EFBs,” BioResources 12(3), 4594-4605. 4595
flax straws, include ferulic acid, coumaric acid, vanillin, and vanillin acid (Buranov and
Mazza 2008; Oliva-Taravilla et al. 2016).
The edible mushroom Pleurotus sajor-caju has a known capability to degrade
lignin compounds in lignocellulosic waste (Corrêa et al. 2016). Laccase, phenolic oxidase,
and manganese oxidase are enzymes released by P. sajor-caju to oxidize phenolic
compounds to free radicals (Jeon et al. 2012). Pleurotus sajor-caju has been used in solid-
state fermentation of pasteurized EFBs to produce a feed supplement for ruminants such
as cows and goats (Awang et al. 1993; Jeon et al. 2012). However, no studies have been
undertaken to determine the concentration of phenolic compounds in the vermicomposted
EFBs.
Sabrina et al. (2012) studied the effect of direct composting of EFBs and palm
fronds by earthworms in an oil palm plantation and found that Pontoscolex corethrurus
and Amynthas rodoricensis died immediately when added to EFBs. It is believed that the
death of both species was due to phenolic compounds, as phenols are the most toxic
chemicals to earthworms (Bi et al. 2016). Phenolic compounds in EFBs are expected to be
tannin, chlorogenic and benzoic acid derivatives, and procyanidin oligomers, which are all
phenolic compounds found in lignocellulosic residues (Sabrina et al. 2012; Arshadi et al.
2016). These authors also suggested that intensive insecticide spraying in oil palm fields
might leave EFBs with chlorinated phenols as well as phenolic compounds from the lignin.
The degradation products of lignin may leach from the litter into the ecosystem and have a
high potential for environmental pollution (Wang et al. 2002).
The aim of the present work was to determine phenolic compounds in EFB
vermicomposting cultivated with oyster mushroom using the Folin-Ciocalteu method, and
characterize phenolics in EFBs by GC-MS analysis before and after P. sajor-caju
cultivation and vermicomposting by Eisenia fetida and Dendrobaena veneta.
EXPERIMENTAL
Sample Collection All EFBs were originally collected in the form of short and long fibers from
Sabutek Sdn. Bhd (Kuala Lumpur, Malaysia). Plant health movement documents and plant
passports (phytosanitary certificates) were produced by the Malaysian government before
shipment to the UK, as required by EU Legislation and the Food and Agriculture
Organization (FAO) International Plant Protection Conventions. The EFBs were ground to
sizes of 5 to 10 mm using a Glen Creston Beater mill (Retsch GmbH, Germany) soaked
for 2 weeks, and drained well before use.
Cultivation of Oyster Mushroom Pleurotus sajor-caju mycelium was cultivated according to the large scale trial
methods (LST) on potato dextrose agar in Petri dishes for stock, and wheat grain was used
to prepare the spawn of the fungus. Ten percent fresh spawn was added to 5 kg of EFBs in
breathable polyethylene bags and placed in a temperature-controlled propagator in
darkness at 25 °C for three weeks. When fungal pinheads started to develop, the bags were
placed in a propagator in a light box. After 12 h, the propagator was ventilated, and the
first flush of fruiting bodies (mushrooms) were harvested after 2 to 3 days. The interval
between flushes was then 5 to 7 days, and the harvest lasted for 25 weeks. Four trials were
PEER-REVIEWED ARTICLE bioresources.com
Ahmad Yahaya et al. (2017). “Phenolics in EFBs,” BioResources 12(3), 4594-4605. 4596
conducted for large scale vermicomposting trials (LSVT), such as LSVT1, LSVT2, LSVT3
and LSVT4.
Vermicomposting by Eisenia fetida and Dendrobaena veneta One kilogram of Eisenia fetida and Dendrobaena veneta was added to 5 kg of
decomposed EFBs after the fungal cultivation, and the mixture was placed in a four-level
vermicompost reactor. Vermicomposting was monitored for 30 weeks. Moisture content
and temperature were maintained at 80% and 19 to 24 °C, respectively.
Total Phenolic Compound Analysis Determination of total phenolic compounds and their characterization were carried
out separately following the method reported by Waterhouse (2002). This procedure was
modified to minimize the amount of sample needed and waste produced in determining
total phenolic compound concentrations. For a high recovery of phenolic compounds in the
extract, high-purity methanol (≥ 99.9%) was used as the extraction solvent (Waterman and
Mole 1994). Air-dried samples (5 ± 0.01 g) were placed in cellulose extraction thimbles in
the extraction chamber of a Buchi-B811 LSV automated extractor (Flawil, Switzerland).
Sample flasks were filled with 100 mL of 99% AR-grade methanol (CH3OH) from Fisher
(Fisher Scientific, Loughborough, UK). The extraction mode was set for a combination of
Soxhlet and hot extraction for 2 h with unlimited cycles. Nitrogen gas was supplied at 0.35
L·min-1 during the extraction. The system purified extracts and reduced the sample to 2 mL
using preprogrammed rinsing and drying by the automated extractor. Extracts were filtered
through 0.45-µm fiberglass Whatman filter paper. Samples were stored at 4 °C for further
analysis. A stock solution of 5000 mg·L-1 gallic acid was prepared by dissolving 5 ± 0.01 g
of anhydrous gallic acid in 100 mL of ethanol and then adding 750 mL of distilled water.
The dissolved solution was transferred to a 1-L volumetric flask, and distilled water was
added until the total volume reached 1 L. From the stock solution, different standard
solutions were prepared, from 50 to 3000 mg·L-1.
A stock solution of 200 g·L-1 Na2SO3 was prepared by dissolving 200 ± 0.1 g
Na2SO3 in 800 mL of distilled water and boiling at 60 °C. After all the Na2SO3 was
dissolved, a few crystals of Na2SO3 were added to the solution and left at room temperature
for 24 h. Whatman no. 1 filter paper was used to filter the solution, and distilled water was
added to make up 1 L. Then, 20-µL standard solutions were pipetted into 2-mL plastic
cuvettes together with 1.58 mL of distilled water. After this, 100 µL of Folin-Ciocalteu
reagent (Fisher Scientific, Loughborough, UK) was added to each cuvette. Within 8 min,
300 µL of sodium carbonate (200 g/1000 mL) was added and the cuvettes were incubated
in the dark at 40 °C for 30 min. Absorbance was measured at 765 nm against a blank using
a DR 2800 HACH Dr. Lange spectrophotometer (Thermofisher; Loughborough, UK).
Absorbance was plotted against a standard solution concentration. Extracts were analyzed
by replacing the standard solution with extracts. The concentration of total phenolic gallic
acid equivalent (GAE) of the extracts was calculated from the graph using the linear
regression equation.
Characterization of Phenolics by GC-MS Analysis Isolation and recovery of phenolics were carried out following the method
developed by Sabrina et al. (2012), with slight modifications, as shown in Table 1, where
total phenolics was extracted using dichloromethane (DCM, 99%). For the procedure, 2
PEER-REVIEWED ARTICLE bioresources.com
Ahmad Yahaya et al. (2017). “Phenolics in EFBs,” BioResources 12(3), 4594-4605. 4597
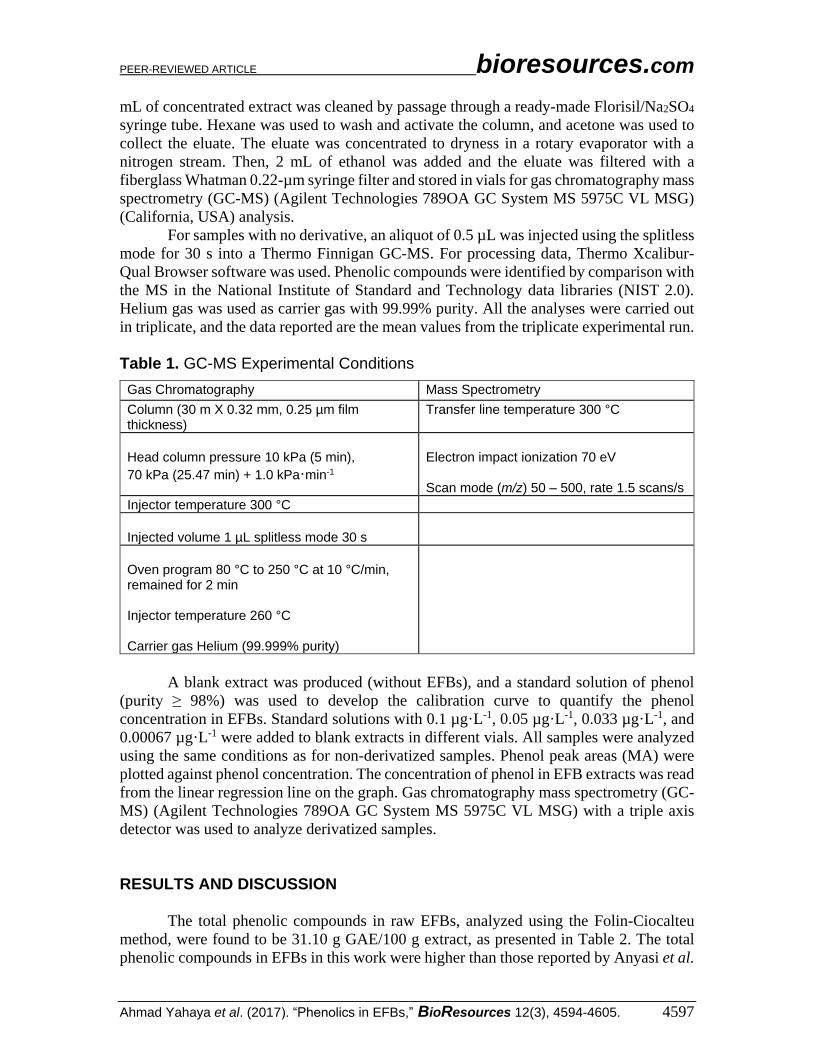
mL of concentrated extract was cleaned by passage through a ready-made Florisil/Na2SO4
syringe tube. Hexane was used to wash and activate the column, and acetone was used to
collect the eluate. The eluate was concentrated to dryness in a rotary evaporator with a
nitrogen stream. Then, 2 mL of ethanol was added and the eluate was filtered with a
fiberglass Whatman 0.22-µm syringe filter and stored in vials for gas chromatography mass
spectrometry (GC-MS) (Agilent Technologies 789OA GC System MS 5975C VL MSG)
(California, USA) analysis.
For samples with no derivative, an aliquot of 0.5 µL was injected using the splitless
mode for 30 s into a Thermo Finnigan GC-MS. For processing data, Thermo Xcalibur-
Qual Browser software was used. Phenolic compounds were identified by comparison with
the MS in the National Institute of Standard and Technology data libraries (NIST 2.0).
Helium gas was used as carrier gas with 99.99% purity. All the analyses were carried out
in triplicate, and the data reported are the mean values from the triplicate experimental run.
Table 1. GC-MS Experimental Conditions
Gas Chromatography Mass Spectrometry
Column (30 m X 0.32 mm, 0.25 µm film thickness)
Transfer line temperature 300 °C
Head column pressure 10 kPa (5 min),
70 kPa (25.47 min) + 1.0 kPa·min-1
Electron impact ionization 70 eV Scan mode (m/z) 50 – 500, rate 1.5 scans/s
Injector temperature 300 °C
Injected volume 1 µL splitless mode 30 s
Oven program 80 °C to 250 °C at 10 °C/min, remained for 2 min Injector temperature 260 °C Carrier gas Helium (99.999% purity)
A blank extract was produced (without EFBs), and a standard solution of phenol
(purity ≥ 98%) was used to develop the calibration curve to quantify the phenol
concentration in EFBs. Standard solutions with 0.1 µg·L-1, 0.05 µg·L-1, 0.033 µg·L-1, and
0.00067 µg·L-1 were added to blank extracts in different vials. All samples were analyzed
using the same conditions as for non-derivatized samples. Phenol peak areas (MA) were
plotted against phenol concentration. The concentration of phenol in EFB extracts was read
from the linear regression line on the graph. Gas chromatography mass spectrometry (GC-
MS) (Agilent Technologies 789OA GC System MS 5975C VL MSG) with a triple axis
detector was used to analyze derivatized samples.
RESULTS AND DISCUSSION
The total phenolic compounds in raw EFBs, analyzed using the Folin-Ciocalteu
method, were found to be 31.10 g GAE/100 g extract, as presented in Table 2. The total
phenolic compounds in EFBs in this work were higher than those reported by Anyasi et al.
PEER-REVIEWED ARTICLE bioresources.com
Ahmad Yahaya et al. (2017). “Phenolics in EFBs,” BioResources 12(3), 4594-4605. 4598
(2015) using the Folin-Denis method (total phenolic compounds concentration of 10 g
GAE/100 g extract). These differences in total phenolic compounds might be due to
application of the different methods. It can be presumed that the total phenolic compounds
found in this work were more accurate, as Folin and Ciocalteu improved upon the Folin-
Denis reagent by making it more sensitive to reduction by phenolics, less prone to
precipitation, and giving 30% more color for spectrophotometric absorption (Waterman
and Mole 1994) .
Table 2. Determination of Phenol and Total Phenolic Compounds in EFBs
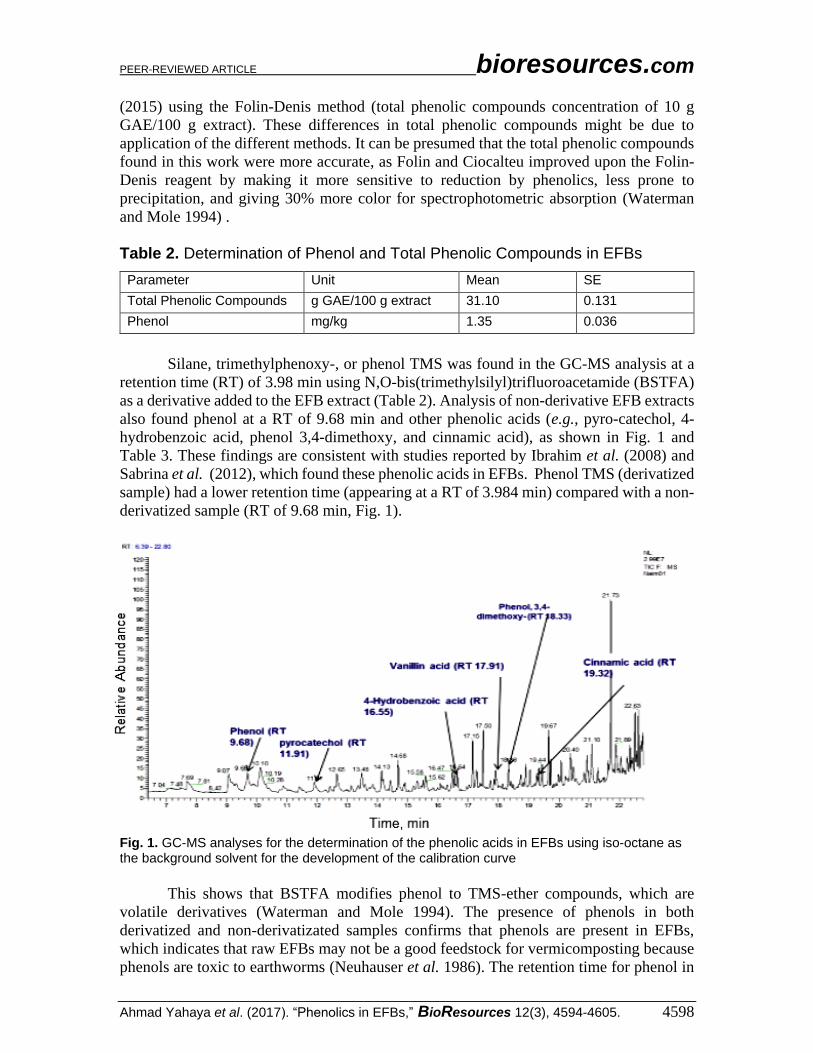
Silane, trimethylphenoxy-, or phenol TMS was found in the GC-MS analysis at a
retention time (RT) of 3.98 min using N,O-bis(trimethylsilyl)trifluoroacetamide (BSTFA)
as a derivative added to the EFB extract (Table 2). Analysis of non-derivative EFB extracts
also found phenol at a RT of 9.68 min and other phenolic acids (e.g., pyro-catechol, 4-
hydrobenzoic acid, phenol 3,4-dimethoxy, and cinnamic acid), as shown in Fig. 1 and
Table 3. These findings are consistent with studies reported by Ibrahim et al. (2008) and
Sabrina et al. (2012), which found these phenolic acids in EFBs. Phenol TMS (derivatized
sample) had a lower retention time (appearing at a RT of 3.984 min) compared with a non-
derivatized sample (RT of 9.68 min, Fig. 1).
Fig. 1. GC-MS analyses for the determination of the phenolic acids in EFBs using iso-octane as the background solvent for the development of the calibration curve
This shows that BSTFA modifies phenol to TMS-ether compounds, which are
volatile derivatives (Waterman and Mole 1994). The presence of phenols in both
derivatized and non-derivatizated samples confirms that phenols are present in EFBs,
which indicates that raw EFBs may not be a good feedstock for vermicomposting because
phenols are toxic to earthworms (Neuhauser et al. 1986). The retention time for phenol in
Parameter Unit Mean SE
Total Phenolic Compounds g GAE/100 g extract 31.10 0.131
Phenol mg/kg 1.35 0.036
PEER-REVIEWED ARTICLE bioresources.com
Ahmad Yahaya et al. (2017). “Phenolics in EFBs,” BioResources 12(3), 4594-4605. 4599
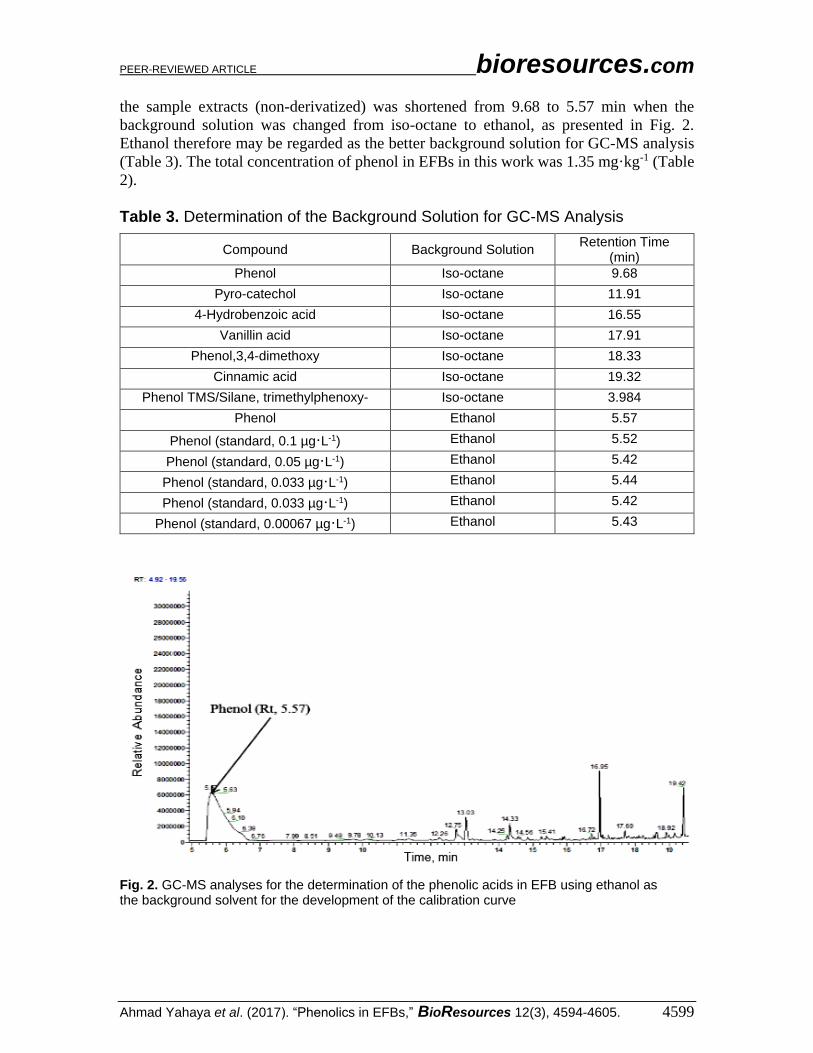
the sample extracts (non-derivatized) was shortened from 9.68 to 5.57 min when the
background solution was changed from iso-octane to ethanol, as presented in Fig. 2.
Ethanol therefore may be regarded as the better background solution for GC-MS analysis
(Table 3). The total concentration of phenol in EFBs in this work was 1.35 mg·kg-1 (Table
2).
Table 3. Determination of the Background Solution for GC-MS Analysis
Compound Background Solution Retention Time
(min)
Phenol Iso-octane 9.68
Pyro-catechol Iso-octane 11.91
4-Hydrobenzoic acid Iso-octane 16.55
Vanillin acid Iso-octane 17.91
Phenol,3,4-dimethoxy Iso-octane 18.33
Cinnamic acid Iso-octane 19.32
Phenol TMS/Silane, trimethylphenoxy- Iso-octane 3.984
Phenol Ethanol 5.57
Phenol (standard, 0.1 µg·L-1) Ethanol 5.52
Phenol (standard, 0.05 µg·L-1) Ethanol 5.42
Phenol (standard, 0.033 µg·L-1) Ethanol 5.44
Phenol (standard, 0.033 µg·L-1) Ethanol 5.42
Phenol (standard, 0.00067 µg·L-1) Ethanol 5.43
Fig. 2. GC-MS analyses for the determination of the phenolic acids in EFB using ethanol as the background solvent for the development of the calibration curve
PEER-REVIEWED ARTICLE bioresources.com
Ahmad Yahaya et al. (2017). “Phenolics in EFBs,” BioResources 12(3), 4594-4605. 4600
RT: 7.62 - 22.22
8 9 10 11 12 13 14 15 16 17 18 19 20 21 22
Time (min)
0
10
20
30
40
50
60
70
80
90
100
110
Rel
ativ
e A
bund
ance
16.48
17.06 17.9713.84
20.8512.5318.93 22.1814.84 16.17
19.3714.15 17.5012.35 20.30 21.3911.77 15.0511.33 12.908.858.05 9.01
NL:8.20E6
TIC F: MS 1
RT: 7.15 - 23.52
8 9 10 11 12 13 14 15 16 17 18 19 20 21 22 23
Time (min)
0
5
10
15
20
25
30
35
40
45
50
55
60
65
70
75
80
85
90
95
100
105
Rela
tive
Abun
danc
e
22.93
22.63
22.5119.66
22.26
17.49
19.7217.15 21.90
20.3619.03 20.92
16.76
9.6820.96
16.63 17.7314.18 15.58 18.9015.4012.6513.4810.13 17.8616.2914.87
10.199.06 10.89 11.917.71
7.95
NL:1.14E7
TIC F: MS Naim02
RT: 6.94 - 22.16
7 8 9 10 11 12 13 14 15 16 17 18 19 20 21 22
Time (min)
0
5
10
15
20
25
30
35
40
45
50
55
60
65
70
75
80
85
90
Rel
ativ
e A
bund
ance
17.06
17.97
16.48
16.19
17.9316.16 18.5319.36
14.15 17.74 19.48 20.8918.9315.988.07 20.778.09 22.107.71 10.84 11.79 14.018.86 20.06 21.2512.91 14.367.05 9.11 15.0511.53 12.8610.45
15.32
NL:4.14E6
TIC F: MS A1_101020113450
(a)
(b)
(c)
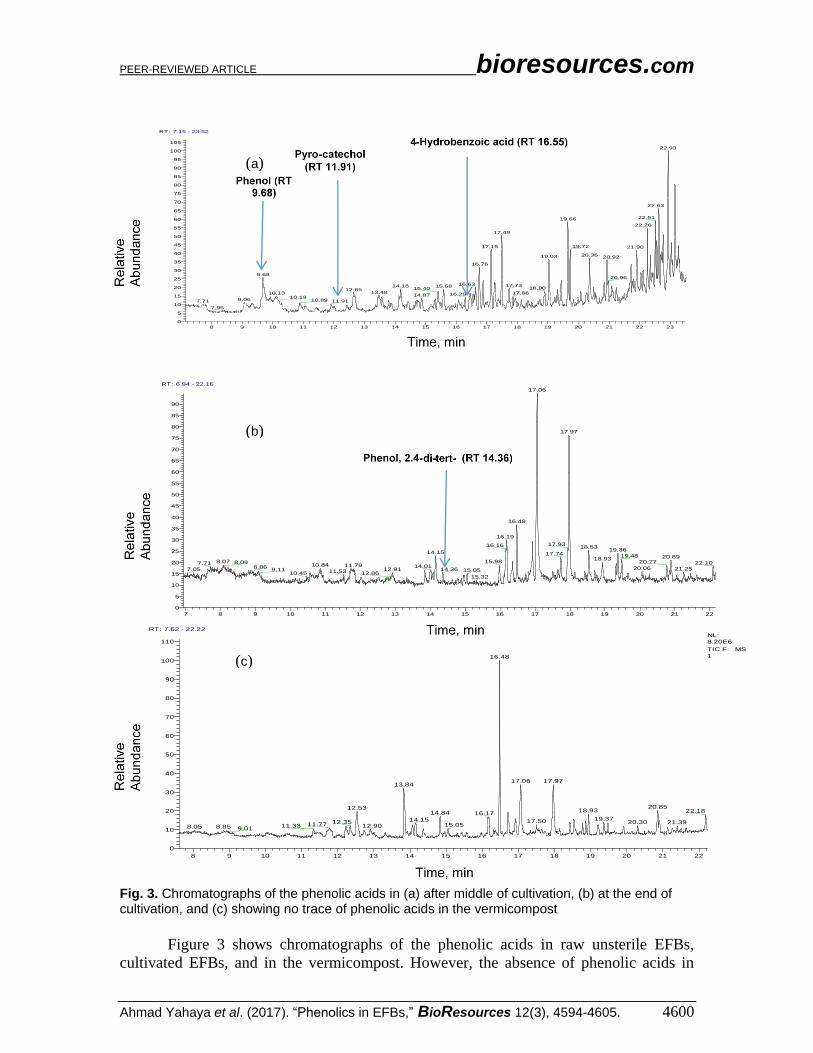
Fig. 3. Chromatographs of the phenolic acids in (a) after middle of cultivation, (b) at the end of cultivation, and (c) showing no trace of phenolic acids in the vermicompost
Figure 3 shows chromatographs of the phenolic acids in raw unsterile EFBs,
cultivated EFBs, and in the vermicompost. However, the absence of phenolic acids in
PEER-REVIEWED ARTICLE bioresources.com
Ahmad Yahaya et al. (2017). “Phenolics in EFBs,” BioResources 12(3), 4594-4605. 4601
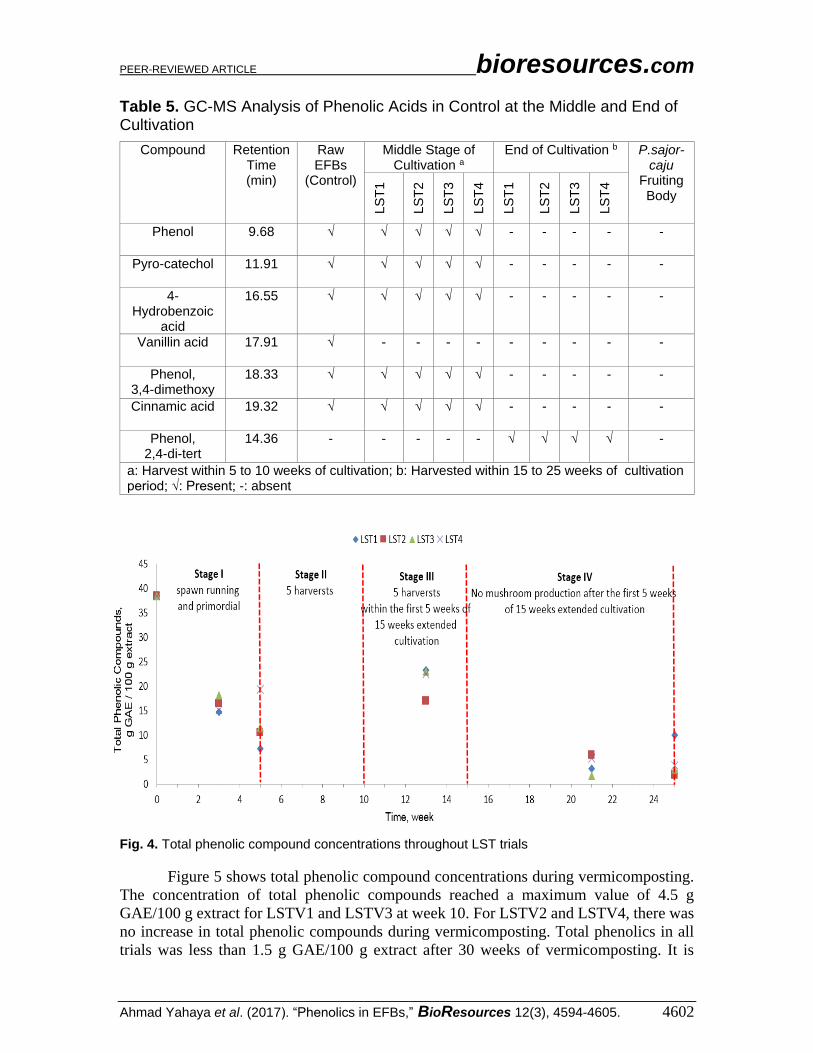
vermicompost was observed. Changes in total phenolic compound (TP) concentration were
monitored over 25 weeks of cultivation of P. sajor-caju. The total reduction in TP was
between 85% and 92%, as shown in Table 4 and Fig. 4. Total phenolics sharply decreased
at the end of primordial initiation, after five weeks of cultivation (Fig. 4). There was a
correlation between spawn running and primordial initiation during weeks 3 to 4. Rani et
al. (2008) showed high cellulase, laccase, and polyphenol oxidase activity during this
period and attributed it to the need for carbohydrates by fungal mycelia for sporophore
and fruiting body formation. The TP bounce back (but not by more than 25 g GAE/100 g)
may have been caused by active mycelial growth, which increases carbon dioxide in the
substrate, suppressing other organisms involved in the degradation of phenolic derivatives.
This might cause temporary accumulation of degraded total soluble phenol in the EFBs
(Rani et al. 2008). Reduction of TP and the absence of phenol in samples at the end of
cultivation, after 25 weeks (end of Stage IV in Fig. 4), suggest that there is a strong lignin
degradation by P. sajor caju.
GC-MS analysis was carried out at three points in the cultivation: before cultivation
(raw EFBs or control) (Table 5), in the middle of cultivation (after five harvests and 10
weeks of cultivation), and at the end of cultivation (after another 15 weeks, at week 25).
GC-MS analysis of the mushrooms was carried out on samples from every harvest. Traces
of phenol (RT of 9.68 min), pyro-catechol (RT of 11.91 min), and 4-hydrobenzoic acid
(RT of 16.55 min) were found in the middle stage (Table 5). Vanillin acid was not found
in these samples, but it was in the control (Table 4). Figures 3a to 3c highlight compounds
found in GC-MS chromatograph plots from the large simple trials (LSTs) after the first 10
weeks (end of stage 2 in Fig. 4) out of a total of 25 weeks cultivation.
There was no trace of phenol, pyro-catechol, or 4-hydrobenzoic acid at the end of
cultivation (Table 5). However, Fig. 3b does show traces of phenol, 2,4-di-tert (RT of 14.36
min) in these samples. This is similar to results reported by Anyasi et al. (2015), who still
found phenol, 2,4-di-tert after four weeks of vermicomposting following one month of pre-
composting EFBs with cow manure. According to Baldrian et al. (2005), Pleurotus spp.
have two extracellular enzymatic systems (hydrolytic and oxidative lignolytic systems),
which degrade hemicellulose and cellulose, and lignin, respectively. These enzymes may
be responsible for the degradation of lignin and subsequent reduction in phenolic
compounds in the EFBs (Table 18). No phenol was present in any of the mushroom fruiting
body throughout the cultivation (Table 5 and Fig. 3c). This is an indication that oyster
mushrooms produced on EFB substrates are safe for human consumption.
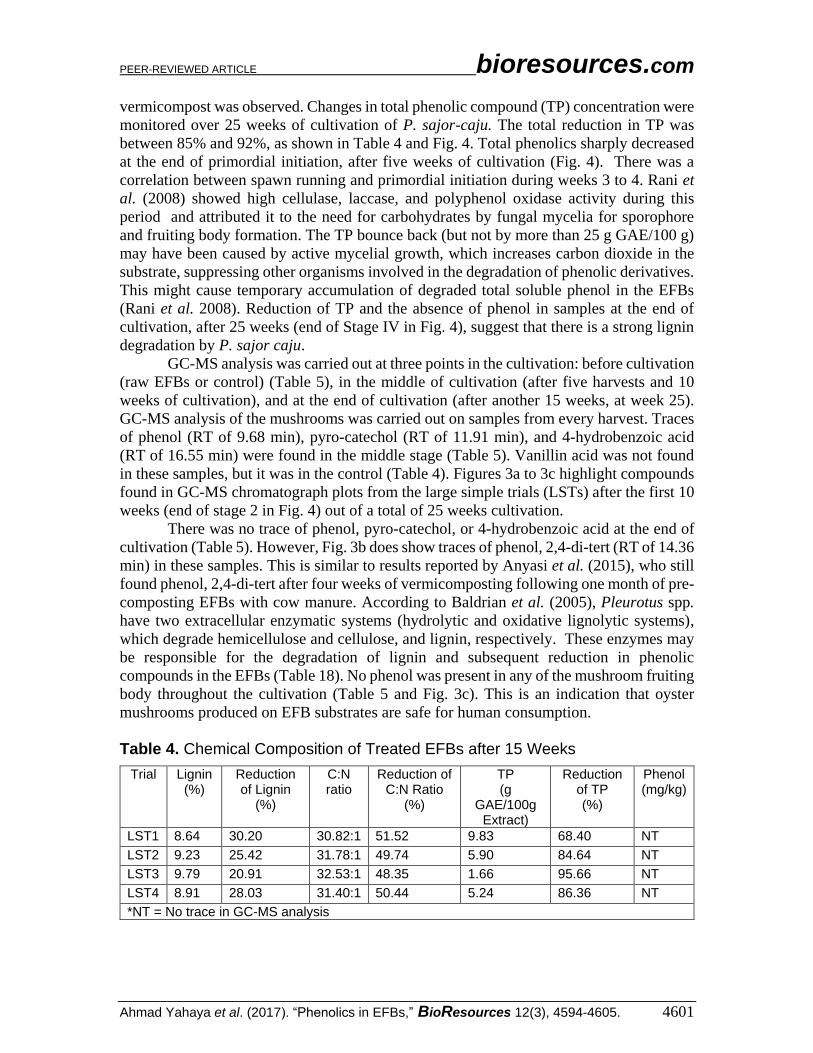
Table 4. Chemical Composition of Treated EFBs after 15 Weeks
Trial Lignin (%)
Reduction of Lignin
(%)
C:N ratio
Reduction of C:N Ratio
(%)
TP (g
GAE/100g Extract)
Reduction of TP (%)
Phenol (mg/kg)
LST1 8.64 30.20 30.82:1 51.52 9.83 68.40 NT
LST2 9.23 25.42 31.78:1 49.74 5.90 84.64 NT
LST3 9.79 20.91 32.53:1 48.35 1.66 95.66 NT
LST4 8.91 28.03 31.40:1 50.44 5.24 86.36 NT
*NT = No trace in GC-MS analysis
PEER-REVIEWED ARTICLE bioresources.com
Ahmad Yahaya et al. (2017). “Phenolics in EFBs,” BioResources 12(3), 4594-4605. 4602
Table 5. GC-MS Analysis of Phenolic Acids in Control at the Middle and End of Cultivation
Compound Retention Time (min)
Raw EFBs
(Control)
Middle Stage of Cultivation a
End of Cultivation b P.sajor-caju
Fruiting Body
LS
T1
LS
T2
LS
T3
LS
T4
LS
T1
LS
T2
LS
T3
LS
T4
Phenol
9.68 √ √ √ √ √ - - - - -
Pyro-catechol 11.91 √ √ √ √ √ - - - - -
4-Hydrobenzoic
acid
16.55 √ √ √ √ √ - - - - -
Vanillin acid
17.91 √ - - - - - - - - -
Phenol, 3,4-dimethoxy
18.33 √ √ √ √ √ - - - - -
Cinnamic acid 19.32 √ √ √ √ √ - - - - -
Phenol, 2,4-di-tert
14.36 - - - - - √ √ √ √ -
a: Harvest within 5 to 10 weeks of cultivation; b: Harvested within 15 to 25 weeks of cultivation period; √: Present; -: absent
Fig. 4. Total phenolic compound concentrations throughout LST trials
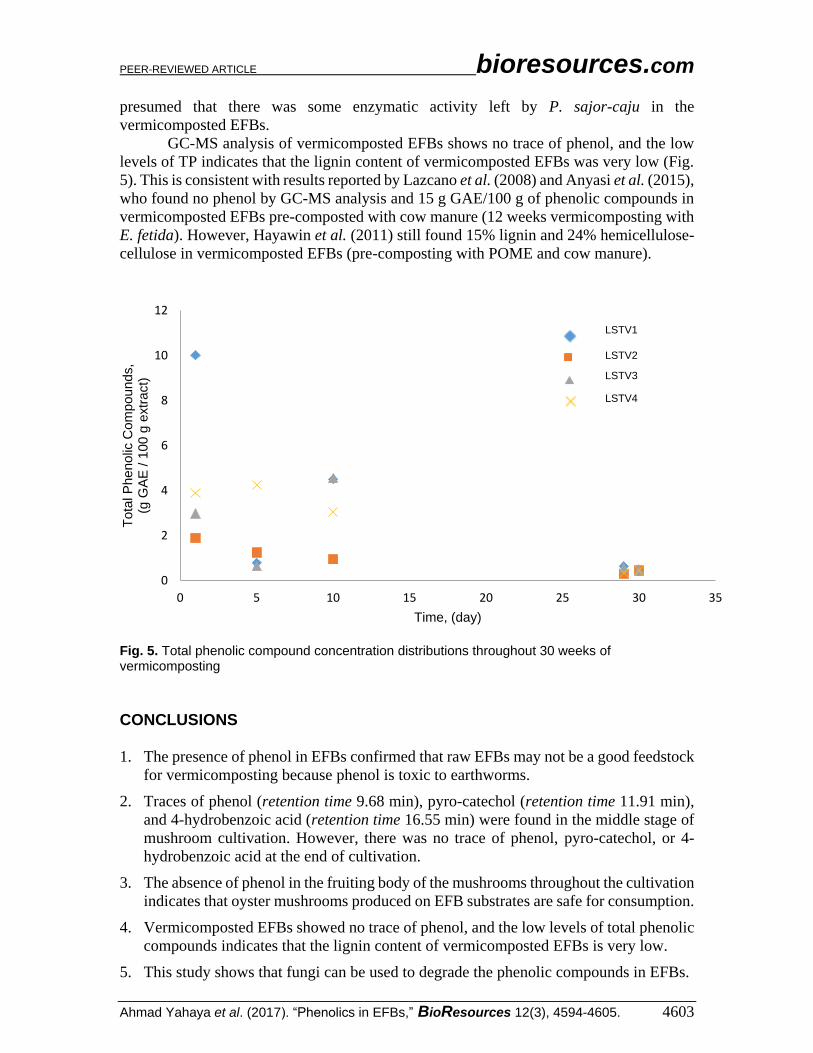
Figure 5 shows total phenolic compound concentrations during vermicomposting.
The concentration of total phenolic compounds reached a maximum value of 4.5 g
GAE/100 g extract for LSTV1 and LSTV3 at week 10. For LSTV2 and LSTV4, there was
no increase in total phenolic compounds during vermicomposting. Total phenolics in all
trials was less than 1.5 g GAE/100 g extract after 30 weeks of vermicomposting. It is
PEER-REVIEWED ARTICLE bioresources.com
Ahmad Yahaya et al. (2017). “Phenolics in EFBs,” BioResources 12(3), 4594-4605. 4603
presumed that there was some enzymatic activity left by P. sajor-caju in the
vermicomposted EFBs.
GC-MS analysis of vermicomposted EFBs shows no trace of phenol, and the low
levels of TP indicates that the lignin content of vermicomposted EFBs was very low (Fig.
5). This is consistent with results reported by Lazcano et al. (2008) and Anyasi et al. (2015),
who found no phenol by GC-MS analysis and 15 g GAE/100 g of phenolic compounds in
vermicomposted EFBs pre-composted with cow manure (12 weeks vermicomposting with
E. fetida). However, Hayawin et al. (2011) still found 15% lignin and 24% hemicellulose-
cellulose in vermicomposted EFBs (pre-composting with POME and cow manure).
Fig. 5. Total phenolic compound concentration distributions throughout 30 weeks of vermicomposting
CONCLUSIONS
1. The presence of phenol in EFBs confirmed that raw EFBs may not be a good feedstock
for vermicomposting because phenol is toxic to earthworms.
2. Traces of phenol (retention time 9.68 min), pyro-catechol (retention time 11.91 min),
and 4-hydrobenzoic acid (retention time 16.55 min) were found in the middle stage of
mushroom cultivation. However, there was no trace of phenol, pyro-catechol, or 4-
hydrobenzoic acid at the end of cultivation.
3. The absence of phenol in the fruiting body of the mushrooms throughout the cultivation
indicates that oyster mushrooms produced on EFB substrates are safe for consumption.
4. Vermicomposted EFBs showed no trace of phenol, and the low levels of total phenolic
compounds indicates that the lignin content of vermicomposted EFBs is very low.
5. This study shows that fungi can be used to degrade the phenolic compounds in EFBs.
0
2
4
6
8
10
12
0 5 10 15 20 25 30 35
To
tal P
he
no
lic C
om
po
un
ds,
(g G
AE
/ 1
00
g e
xtr
act)
Time, (day)
LSTV1
LSTV2
LSTV3
LSTV4
PEER-REVIEWED ARTICLE bioresources.com
Ahmad Yahaya et al. (2017). “Phenolics in EFBs,” BioResources 12(3), 4594-4605. 4604
ACKNOWLEDGMENTS
The authors are grateful to the Centre of Research & Innovation, Universiti Kuala
Lumpur, for the financial support for this study.
REFERENCES CITED
Anyasi, T. A., Jideani, A. I. O., and McHau, G. A. (2015). “Morphological,
physicochemical, and antioxidant profile of noncommercial banana cultivars,” Food
Science and Nutrition 3(3), 221-232. DOI: 10.1002/fsn3.208
Arshadi, M., Attard, T. M., Lukasik, R. M., Brncic, M., da Costa Lopes, A. M., Finell,
M., Geladi, P., Gerschenson, L. N., Gogus, F., Herrero, M., et al. (2016). “Pre-
treatment and extraction techniques for recovery of added value compounds from
wastes throughout the agri-food chain,” Green Chemistry 18(23), 6160-6204. DOI:
10.1039/C6GC01389A
Awang, M. R., Mutaat, H. H., Mahmud, M. S., Wan Husain, W. B., Osman, T., Bakar, K.
A., Kassim, A., Wan Mahmud, Z. U. Y., Manaf, I., Kume, T., et al. (1993).
“Radiation pasteurised oil palm empty fruit bunch fermented with Pleurotus sajor-
caju as feed supplement to ruminants,” Radiation Physics and Chemistry 42(4-6),
611-616. DOI: 10.1016/0969-806X(93)90335-R
Baldrian, P., Valášková, V., Merhautová, V., and Gabriel, J. (2005). “Degradation of
lignocellulose by Pleurotus ostreatus in the presence of copper, manganese, lead and
zinc,” Research in Microbiology 156(5-6), 670-676. DOI:
10.1016/j.resmic.2005.03.007
Bi, Y.-M., Tian, G.-L., Wang, C., Feng, C.-L., Zhang, Y., Zhang, L.-S., and Sun, Z.-J.
(2016). “Application of leaves to induce earthworms to reduce phenolic compounds
released by decomposing plants,” European Journal of Soil Biology 75, 31-37. DOI:
10.1016/j.ejsobi.2016.04.007
Buranov, A. U., and Mazza, G. (2008). “Lignin in straw of herbaceous crops,” Industrial
Crops and Products 28(3), 237-259. DOI: 10.1016/j.indcrop.2008.03.008
Corrêa, R. C. G., Brugnari, T., Bracht, A., Peralta, R. M., and Ferreira, I. C. F. R. (2016).
“Biotechnological, nutritional and therapeutic uses of Pleurotus spp. (oyster
mushroom) related with its chemical composition: A review on the past decade
findings,” Trends in Food Science & Technology, 50, 103-117. DOI:
10.1016/j.tifs.2016.01.012
Hayawin, Z. N., Astimar, A. A., Ibrahim, M. H., Hasamudin, W. W. H. and Abdul Khalil,
H. P. S. (2011). “Vermicomposting of different types of oil palm fibre waste using
Eudrilus eugeniae: A comparative study,” Journal of Oil Palm Research 23(1), 979-
989.
Ibrahim, M. N. M., Ghani, A. M., Zakaria, N., Shuib, S., and Sipaut, C. S. (2008).
“Formulation of an environmentally friendly adhesive for wood,” Macromolecular
Symposia 274, 37-42. DOI: 10.1002/masy.200851406
Jeon, J. R., Baldrian, P., Murugesan, K., and Chang, Y. S. (2012). “Laccase-catalysed
oxidations of naturally occurring phenols: From in vivo biosynthetic pathways to
green synthetic applications,” Microbial Biotechnology 5(3), 318-332. DOI:
10.1111/j.1751-7915.2011.00273.x
PEER-REVIEWED ARTICLE bioresources.com
Ahmad Yahaya et al. (2017). “Phenolics in EFBs,” BioResources 12(3), 4594-4605. 4605
Lazcano, C., Gómez-Brandón, M., and Domínguez, J. (2008). “Comparison of the
effectiveness of composting and vermicomposting for the biological stabilization of
cattle manure,” Chemosphere 72(7), 1013-1019. DOI:
10.1016/j.chemosphere.2008.04.016
Mohamad Ibrahim, M. N., Nadiah, M. Y. N., Norliyana, M. S., Sipaut, C. S., and Shuib,
S. (2008). “Separation of vanillin from oil palm empty fruit bunch lignin,” Clean –
Soil, Air Water 36(3), 287-291. DOI: 10.1002/clen.200700141.x
Multari, S., Neacsu, M., Scobbie, L., Cantlay, L., Duncan, G., Vaughan, N., Stewart, D.,
and Russell, W. R. (2016). “Nutritional and phytochemical content of high-protein
crops,” Journal of Agricultural and Food Chemistry 64(41), 7800-7811. DOI:
10.1021/acs.jafc.6b00926
Neuhauser, E. F., Durkin, P. R., Malecki, M. R., and Anatra, M. (1986). “Comparative
toxicity of ten organic chemicals to four earthworm species,” Comparative
Biochemistry and Physiology Part C: Comparative Pharmacology 83, 197-200.
DOI.10.1016/0742-8413(86)90036-8
Oliva-Taravilla, A., Tomás-Pejó, E., Demuez, M., González-Fernández, C., and
Ballesteros, M. (2016). “Phenols and lignin: Key players in reducing enzymatic
hydrolysis yields of steam-pretreated biomass in presence of laccase,” Journal of
Biotechnology 218, 94-101. DOI: 10.1016/j.jbiotec.2015.11.004
Rani, P., Kalyani, N., and Prathiba, K. (2008). “Evaluation of lignocellulosic wastes for
production of edible mushrooms,” Applied Biochemistry and Biotechnology 151(2-3),
151-159. DOI: 10.1007/s12010-008-8162-y
Sabrina, D. T., Gandahi, A. W., Hanafi, M. M., Mahmud, T. M. M., and Azwady, A. A.
N. (2012). “Oil palm empty-fruit bunch application effects on the earthworm
population and phenol contents under field conditions,” African Journal of
Biotechnology 11, 4396-4406. DOI: 10.5897/AJB11.3582
Sharma, M., Gupta, S. K., and Mondal, A. K. (2012). “Production and trade of major
world oil crops,” in: Technological Innovations in Major World Oil Crops, Volume 1:
Breeding, S. K. Gupta (ed.), Springer, New York, NY, pp. 1-15.
Tye, Y. Y., Lee, K. T., Wan Abdullah, W. N., and Leh, C. P. (2016). “The world
availability of non-wood lignocellulosic biomass for the production of cellulosic
ethanol and potential pretreatments for the enhancement of enzymatic
saccharification,” Renewable and Sustainable Energy Reviews 60, 155-172. DOI:
10.1016/j.rser.2016.01.072
Wang, X., Sun, C., Wang, Y., and Wang, L. (2002). “Quantitative structure-activity
relationships for the inhibition toxicity to root elongation of Cucumis sativus of
selected phenols and interspecies correlation with Tetrahymena pyriformis,”
Chemosphere 46(2), 153-161. DOI: 10.1016/S0045-6535(01)00133-3
Waterhouse, A. L. (2002). “Determination of total phenolics,” Current Protocols in Food
Analytical Chemistry. New York: John Wiley & Sons, Inc.,
Waterman, P. G., and Mole, S. (1994). Analysis of Phenolic Plant Metabolites, Blackwell
Scientific, Oxford, UK.
Article submitted: February 12, 2017; Peer review completed: April 13, 2017; Revised
version received: April 29, 2017; Accepted: May 1, 2017; Published: May 9, 2017.
DOI: 10.15376/biores.12.3.4594-4605